 Milton Torres Ceron
 Masami Fujiwara
 Fernando Martinez-Andrade
- 1Department of Ecology and Conservation Biology, Texas A&M University, College Station, TX, United States
- 2Ecology and Evolutionary Biology Interdisciplinary Program, Texas A&M University, College Station, TX, United States
- 3Coastal Fisheries Division, Texas Parks and Wildlife Department, Corpus Christi, TX, United States
Introduction: Local biodiversity is increasing in many temperate and subtropical waters due to climate change. It is often caused by shifting fish distributions, thus the biodiversity gradient, from lower to higher latitudes. However, these shifts in distributions do not occur uniformly across all species. Consequently, communities are not only shifting their spatial distributions, but species compositions are also changing. We investigated spatiotemporal differences in the compositions of fish species in the bays of the northeastern Gulf of Mexico and identified species that contribute to the temporal changes.
Methods: We used fish count data collected using gillnets in eight major bays, encompassing over 600 km of coastline, during spring and fall seasons from 1982 to 2019. The nonmetric multidimensional scaling (NMDS) on the Bray-Curtis dissimilarity index among species composition vectors was used to detect the differences in species composition, and the similarity percentages (SIMPER) were used to determine the contribution of species to the differences.
Results: The result shows there was a gradual change in species composition in all bays over the years, and the composition was different among bays and seasons. The species contributing to the temporal changes included those that are expanding (e.g., Common snook, Centropomus undecimalis, and Smallscale fat snook, C. parallelus) as well as retracting (e.g., Southern flounder, Paralichthys lethostigma, and Spanish mackerel, Scomberomorus maculatus) their distributions toward the north. The species observed only in recent years in these bays tended to have a preference for warmer water (e.g., Gulf pipefish, Syngnathus scovelli, and Chain pipefish, S. louisiana).
Discussion: The results are consistent with the potential effects of climate change. However, the salinity of the bays in the study area generally exhibits an increasing trend from the northern to southern bays. The spatial salinity gradient has a substantial impact on species compositions, indicating that species distributions are influenced by multiple environmental conditions. This complexity makes our ability to accurately predict future species compositions under changing environmental conditions challenging.
1 Introduction
Climate change is increasing local biodiversity in many temperate and subtropical waters (e.g., Beare et al., 2004; Dornelas et al., 2014; Elahi et al., 2015; Fujiwara et al., 2019; Pinsky et al., 2020; Zarco-Perello et al., 2020; Pawluk et al., 2021; Palacios-Abrantes et al., 2022). This phenomenon results from shifting the species distribution from lower to higher latitudes (Perry et al., 2005; Wernberg et al., 2016) along with a general latitudinal gradient in species diversity (Willig et al., 2003, Hiddink and ter Hofstede, 2008; Rabosky et al., 2018). However, the shifts in species distributions are not happening to all organisms at the same rate (Murawski, 1993; Collie et al., 2008; Pecl et al., 2017; Gotelli et al., 2022). Consequently, species compositions are also changing, and simple comparisons of diversity indices over time and space often do not reveal the full picture of the ecological impacts of climate change and other drivers of changes in species compositions.
Interpreting changes in species diversity can often present challenges. Local species diversity increases when a species that is new to the habitat immigrates; however, an increase in species diversity index such as the Shannon Diversity Index does not necessarily suggest inclusions of such immigrant species. For example, changing the number of individuals in existing species can increase or decrease the diversity index by equalizing the abundance among species or concentrating the abundance to a small number of species, respectively (e.g., Dornelas et al., 2014). Furthermore, increased species richness does not always result from an addition of immigrant species. This is partly because the concept of residents vs. immigrants is ambiguous, especially for marine fish species. Observed ranges of marine fish species are often wide even though they may be rare in many locations and their local abundance can fluctuate widely over time. Consequently, simply observing a species that was not previously observed at a location does not imply the species has immigrated into the habitat. Therefore, conducting investigations into changes in species compositions and identifying the specific species responsible for these changes over a wide range of space are important steps toward understanding the underlying processes.
In the Northwestern Gulf of Mexico (GOM), the Shannon diversity index (Spellerberg and Fedor, 2003) in major bays has increased in the past 30 years (Fujiwara et al., 2019; Pawluk et al., 2021) while functional diversity among fishes has declined (Pawluk et al., 2022). Furthermore, fish species that spawn during late spring and summer were shown to have a greater tendency to increase their abundance than those that spawn in other seasons (Fujiwara et al., 2022). These results are starting to reveal the spatiotemporal dynamics of species compositions in the Northwestern GOM. However, it remains unclear how the species compositions are changing over time.
Leveraging the seasonal (fall and spring) data collected in major bays in the northern Gulf of Mexico over more than 30 years, we investigated the changes in species compositions over space and time and determined the species that contribute to temporal changes in species composition. Then, we discussed different patterns of changes in the abundance of the species that contribute to the temporal changes. The data included more than 100 species of fish observed along the coastline stretching more than 600 km. Therefore, they included species for which southern or northern range limits are close to the sampled area. This gave us a unique opportunity to make direct observations of the effects of climate change on the changes in the distribution of fish. We used the Bray-Curtis dissimilarity index (Bray and Curtis, 1957) to compare species compositions and applied the nonmetric multidimensional scaling (NMDS; Mead, 1992) to cluster the species compositions based on the dissimilarity measure. Then, we calculated the similarity percentages (SIMPER; Clarke, 1993) to determine the contribution of species to the changes in species compositions. Finally, changes in the abundance of species that contribute to changes in species compositions in many bays were examined.
2 Method
2.1 Data
The data used in this study was collected by the Texas Parks and Wildlife Department as a part of the Marine Resource Monitoring program. The data has been collected with gillnet since 1982 in seven major bays (Galveston Bay, Matagorda Bay, Aransas Bay, San Antonio Bay, Corpus Christi Bay, Upper Laguna Madre, and Lower Laguna Madre) and since 1986 in Sabine Lake in the Northwestern Gulf of Mexico (Figure 1). For this study, data collected up to 2019 was used. Sampling was conducted seasonally in spring (April-June) and fall (September-November). Within each season, sampling was conducted 45 times in each bay. Gillnet had a total length of 182.9 m and a height of 1.2 m consisting of four sections with mesh sizes of 152 mm, 127 mm, 102 mm, and 76 mm. It was set perpendicular to the shore with the smallest mesh size nearest the shore and the lowest part of the net attached to the bottom. It was deployed one hour before sunset and retrieved four hours after sunrise the following day. The location to deploy the net was determined using a stratified random sampling scheme so the samples represent the entire shore in each bay within a season. All captured fish were identified to the lowest taxonomic category (often species) and counted. We focus on fish species in this study although other taxa were also caught in gillnet (e.g., crustaceans and mollusks) because the sampling gear is designed to capture fish. At each sampling occasion, water temperature, salinity, and dissolved oxygen were measured with a YSI© meter or equivalent and turbidity was measured with a HACH© turbidimeter or equivalent; both were located at the end of the net farthest from shore. Further information regarding the sampling protocol can be found in Martinez-Andrade (2018).
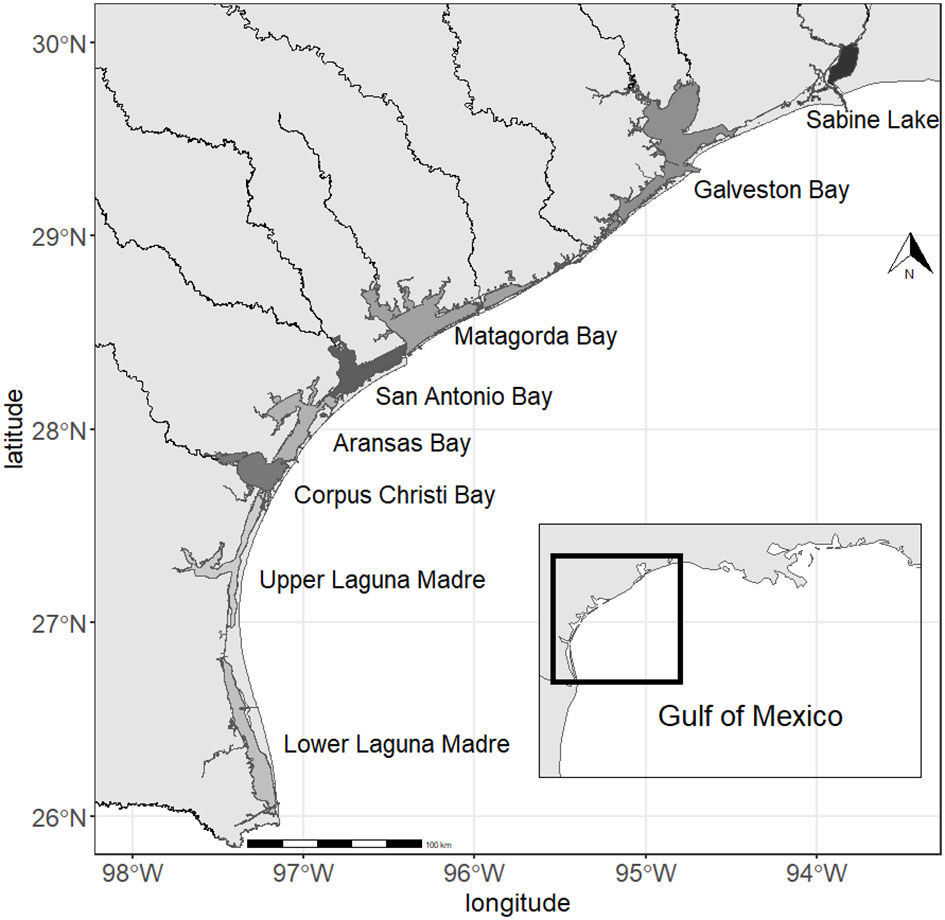
Figure 1 Map showing the locations of the bays.
The data consisted of 106 fish species and four environmental variables measured at 13,500 sampling occasions (Appendix Table A1). For this analysis, one season in each year in each major bay was treated as one sample by calculating the total number of individuals for each species and taking the median of the environmental variables over 45 sampling occasions, and the data used in the analysis consisted of 600 samples. Fish species that were not observed in more than 10 samples were eliminated from the analysis, leaving 93 species. The final community matrix is a 600 by 93 matrix with each element being the total number of individuals of a given species (columns) caught in each sample (rows).
We did not correct for slightly different durations (i.e., difference in the duration from sunset to sunrise) that the gillnet was deployed among sampling occasions by calculating catch per unit effort because their capturability is not uniform from sunset to sunrise. By taking the sum of all sampling occasions within a season, which are distributed uniformly over a sampling season, the effect of the difference in sampling durations among sampling occasions becomes negligible. We also note that the data were not weighted by the mass of individuals. If the data were weighted, it measures the species composition in terms of biomass. It is sometimes considered preferable because we can avoid a large number of small individuals being observed causing a skew in data. However, the data were not weighted in the current analysis for three reasons: our goal was to examine the changes in species composition by number, individual mass was not measured, and the effects of skewness could be minimized by transforming and standardizing the data.
2.2 Statistical analysis
The dissimilarity between species compositions (vectors each consisting of abundances of 93 species) was measured with the Bray-Curtis dissimilarity index. Then, the nonmetric multidimensional scaling (NMDS) was used to cluster similar species compositions among the samples. These are standard methods used for the investigation of similarity/dissimilarity of species compositions, and the readers are referred to Clarke (1993) for more details. We considered axes to be significant if the stress value was below 0.2 and the best result was repeated multiple times. For this analysis, we first applied the method to the entire data set. Then, we applied the method to data from each bay separately because we found significant differences among bays.
The dissimilarity measure was calculated with the “vegdist” function in the “vegan” package (Oksanen et al., 2022) for R (R Core Team, 2023), and the NMDS analysis was performed with the “metaMDS” function in the same package. We allowed the automatic selection of transformation/standardization methods before performing the NMDS. In all of the analyses, the dissimilarity measures were square-root transformed and standardized with the Wisconsin double standardization (Bray and Curtis, 1957). When one of the NMDS axes was significantly and visually clearly associated with one of the numerical explanatory variables, the axis was rotated to align with the explanatory variable using the “MDSrotate” function in the “vegan” package.
The significance of explanatory variables (the four environmental variables, year, major bays, and season) was tested using a permutation test. This test was performed with the “envfit” function in the “vegan” package. Furthermore, the species that significantly contributed to the differences in species composition were also tested by calculating similarity percentages (Clarke, 1993), which measures the contribution of each species to the overall dissimilarity. The significance of the similarity percentage was also tested using a permutation test. The latter analyses were performed using the “simper” function of the “vegan” package.
All of the analysis was performed under R (R Core Team). All of the code used for the analysis is available from (https://github.com/masamifujiwara/GoM_Gillnet_NMDS/).
3 Results
The NMDS analysis with the entire data identified three NMDS axes (referred to as NMDS A1, NMDS A2, and NMDS A3 hereafter; Stress value = 0.147, Number of Convergences = 153). The first axis (NMDS A1) separated major bays (Figure 2A), and the third axis (NMDS A3) separated the two seasons (Figure 2C). The associations of these factors are both statistically significant (p-value < 0.001 for both) and visibly evident. According to the permutation test, the NMDS A2 was significantly associated with year although this association is not clear from the figure (Figure 2B). NMDS A1 was also significantly associated with salinity (p-value < 0.001). Figure 3 shows NMDS A1 and NMDS A3 and how they relate to various environmental and fish characteristics. For example, NMDS A1 is associated with salinity (Figure 3A) as there is a salinity gradient among the bays along the Texas coast from low in the north to high in the south (Bugica et al., 2020). The proportion of freshwater fish (those fish that are considered to tolerate freshwater habitat according to the FishBase (Froese and Pauly, 2019) is high in Sabin Lake and declines towards the south (Figure 3B). The proportion of individuals that are gars, all of which are freshwater/brackish water species, also is the greatest in Sabine Lake and declines towards the south (Figure 3C).
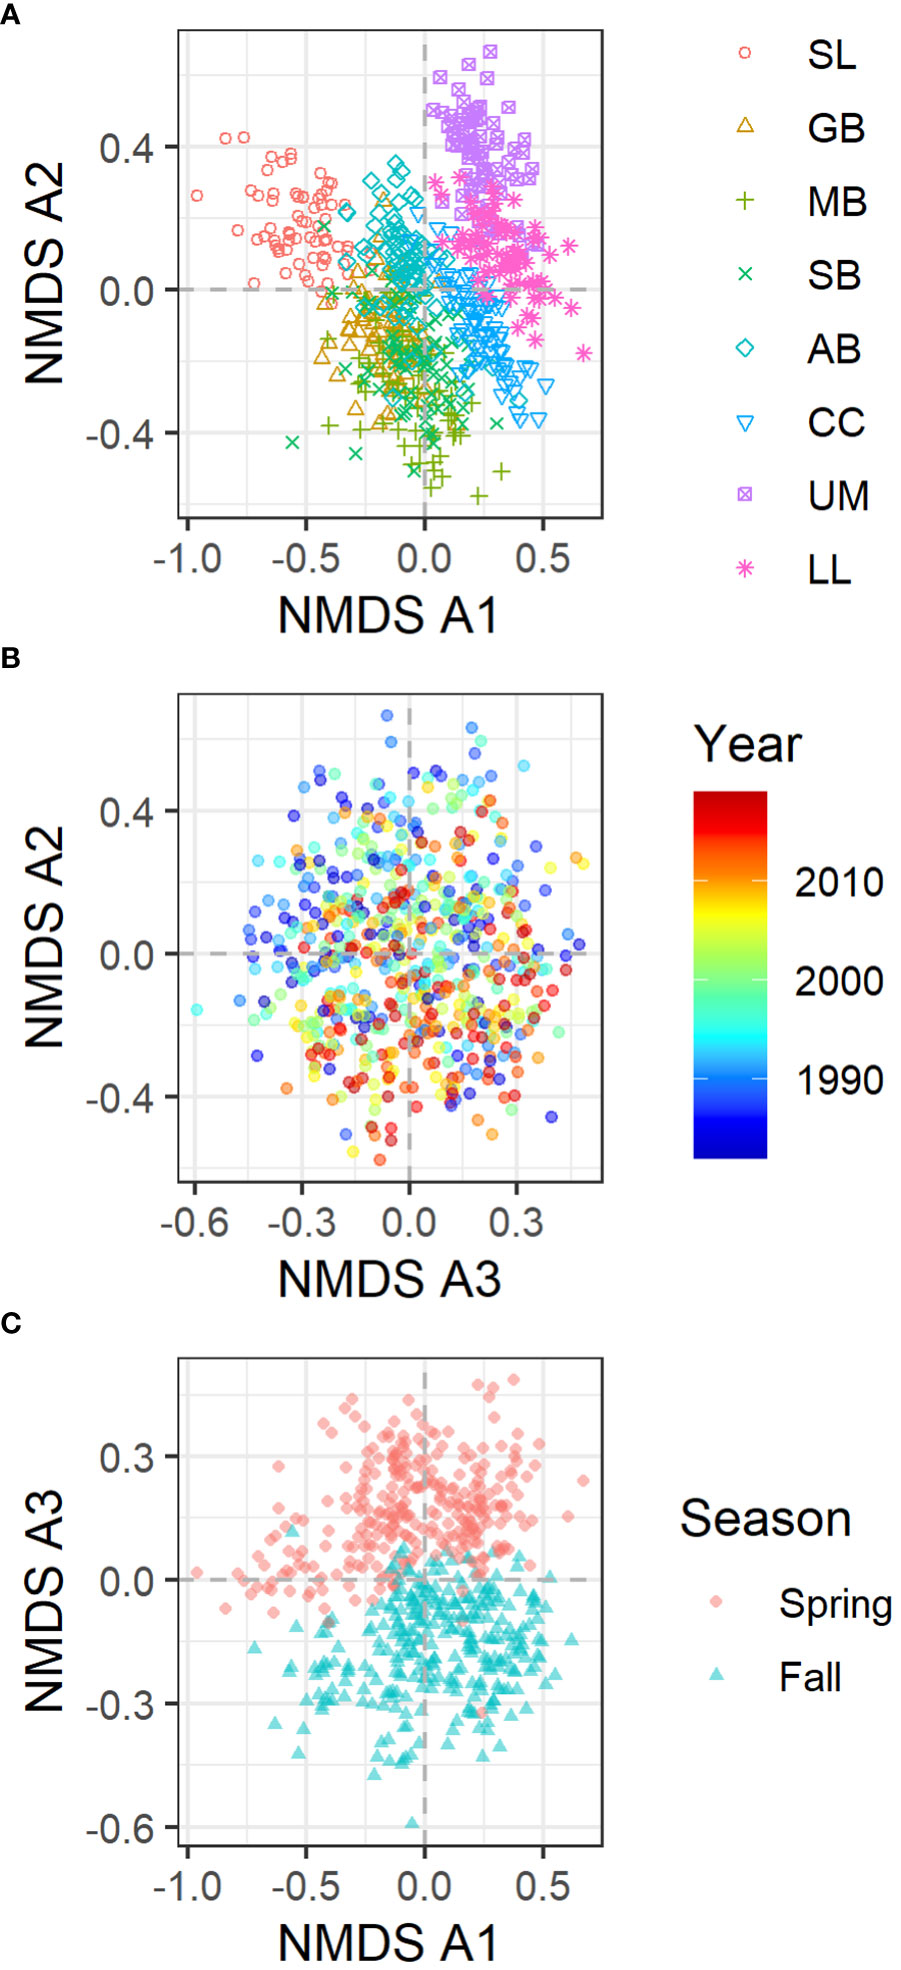
Figure 2 NMDS axes of the fish data from all bays. (A) NMDS A2 vs. NMDS A1 with the color and symbols showing different bays. (B) NMDS A2 vs. NMDS A3 with color showing different years. (C) NMDS A3 vs. NMDS A1 with color and symbols showing different seasons.
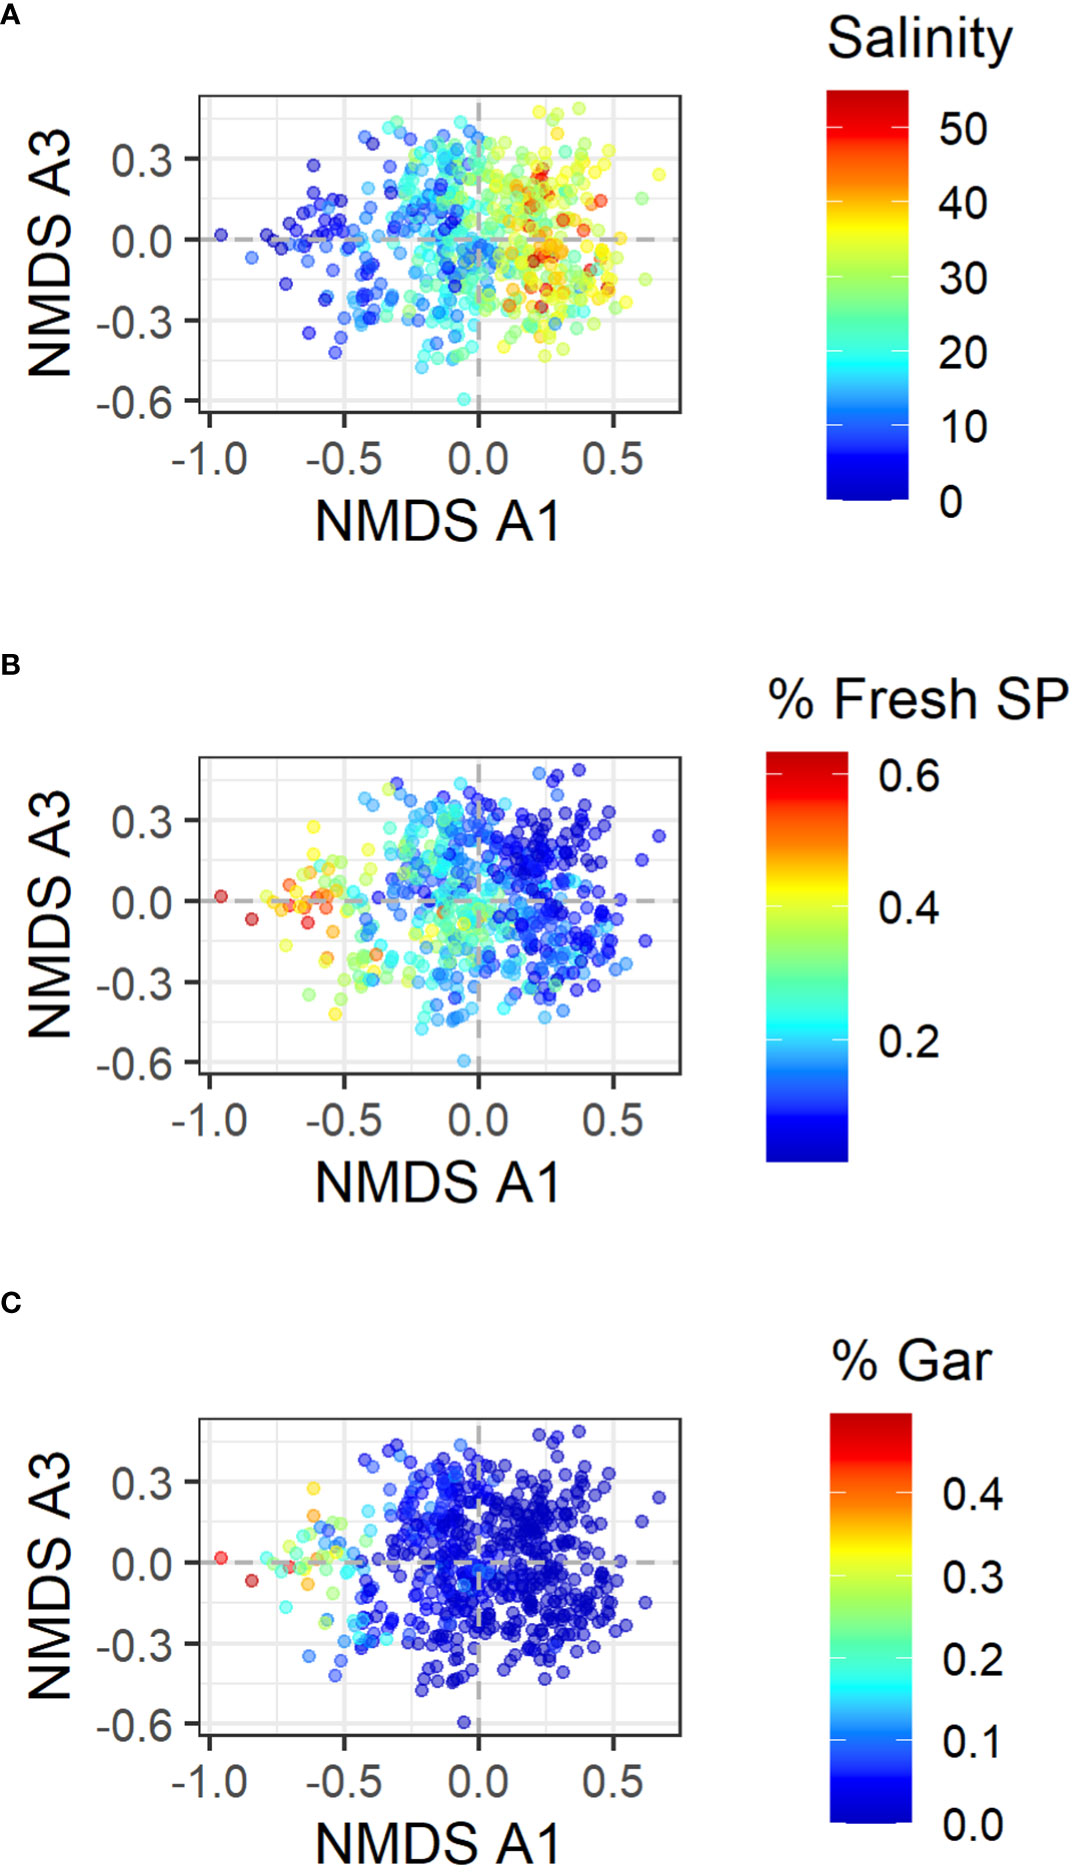
Figure 3 NMDS of data from all bays combined. In all panes, NMDS A1 and NMDS A3 are shown as these are associated with bays and seasons. The color indicates (A) Salinity, (B) the proportion of the number of individuals that can tolerate freshwater, and (C) the proportion of the number of individuals that are gars.
Because the dissimilarity among bays is significant, the NMDS analyses were performed on the data for each bay separately. For all the bays, the analysis also identified at least two NMDS axes (NMDS B1 and NMDS B2; stress value < 0.2, and the best solution was repeated multiple times in NMDS estimations with different initial conditions). With the separated data, the first axis (NMDS B1) was associated with years (Figure 4), and the second axis (NMDS B2) was associated with seasons for all bays (Figure 5).
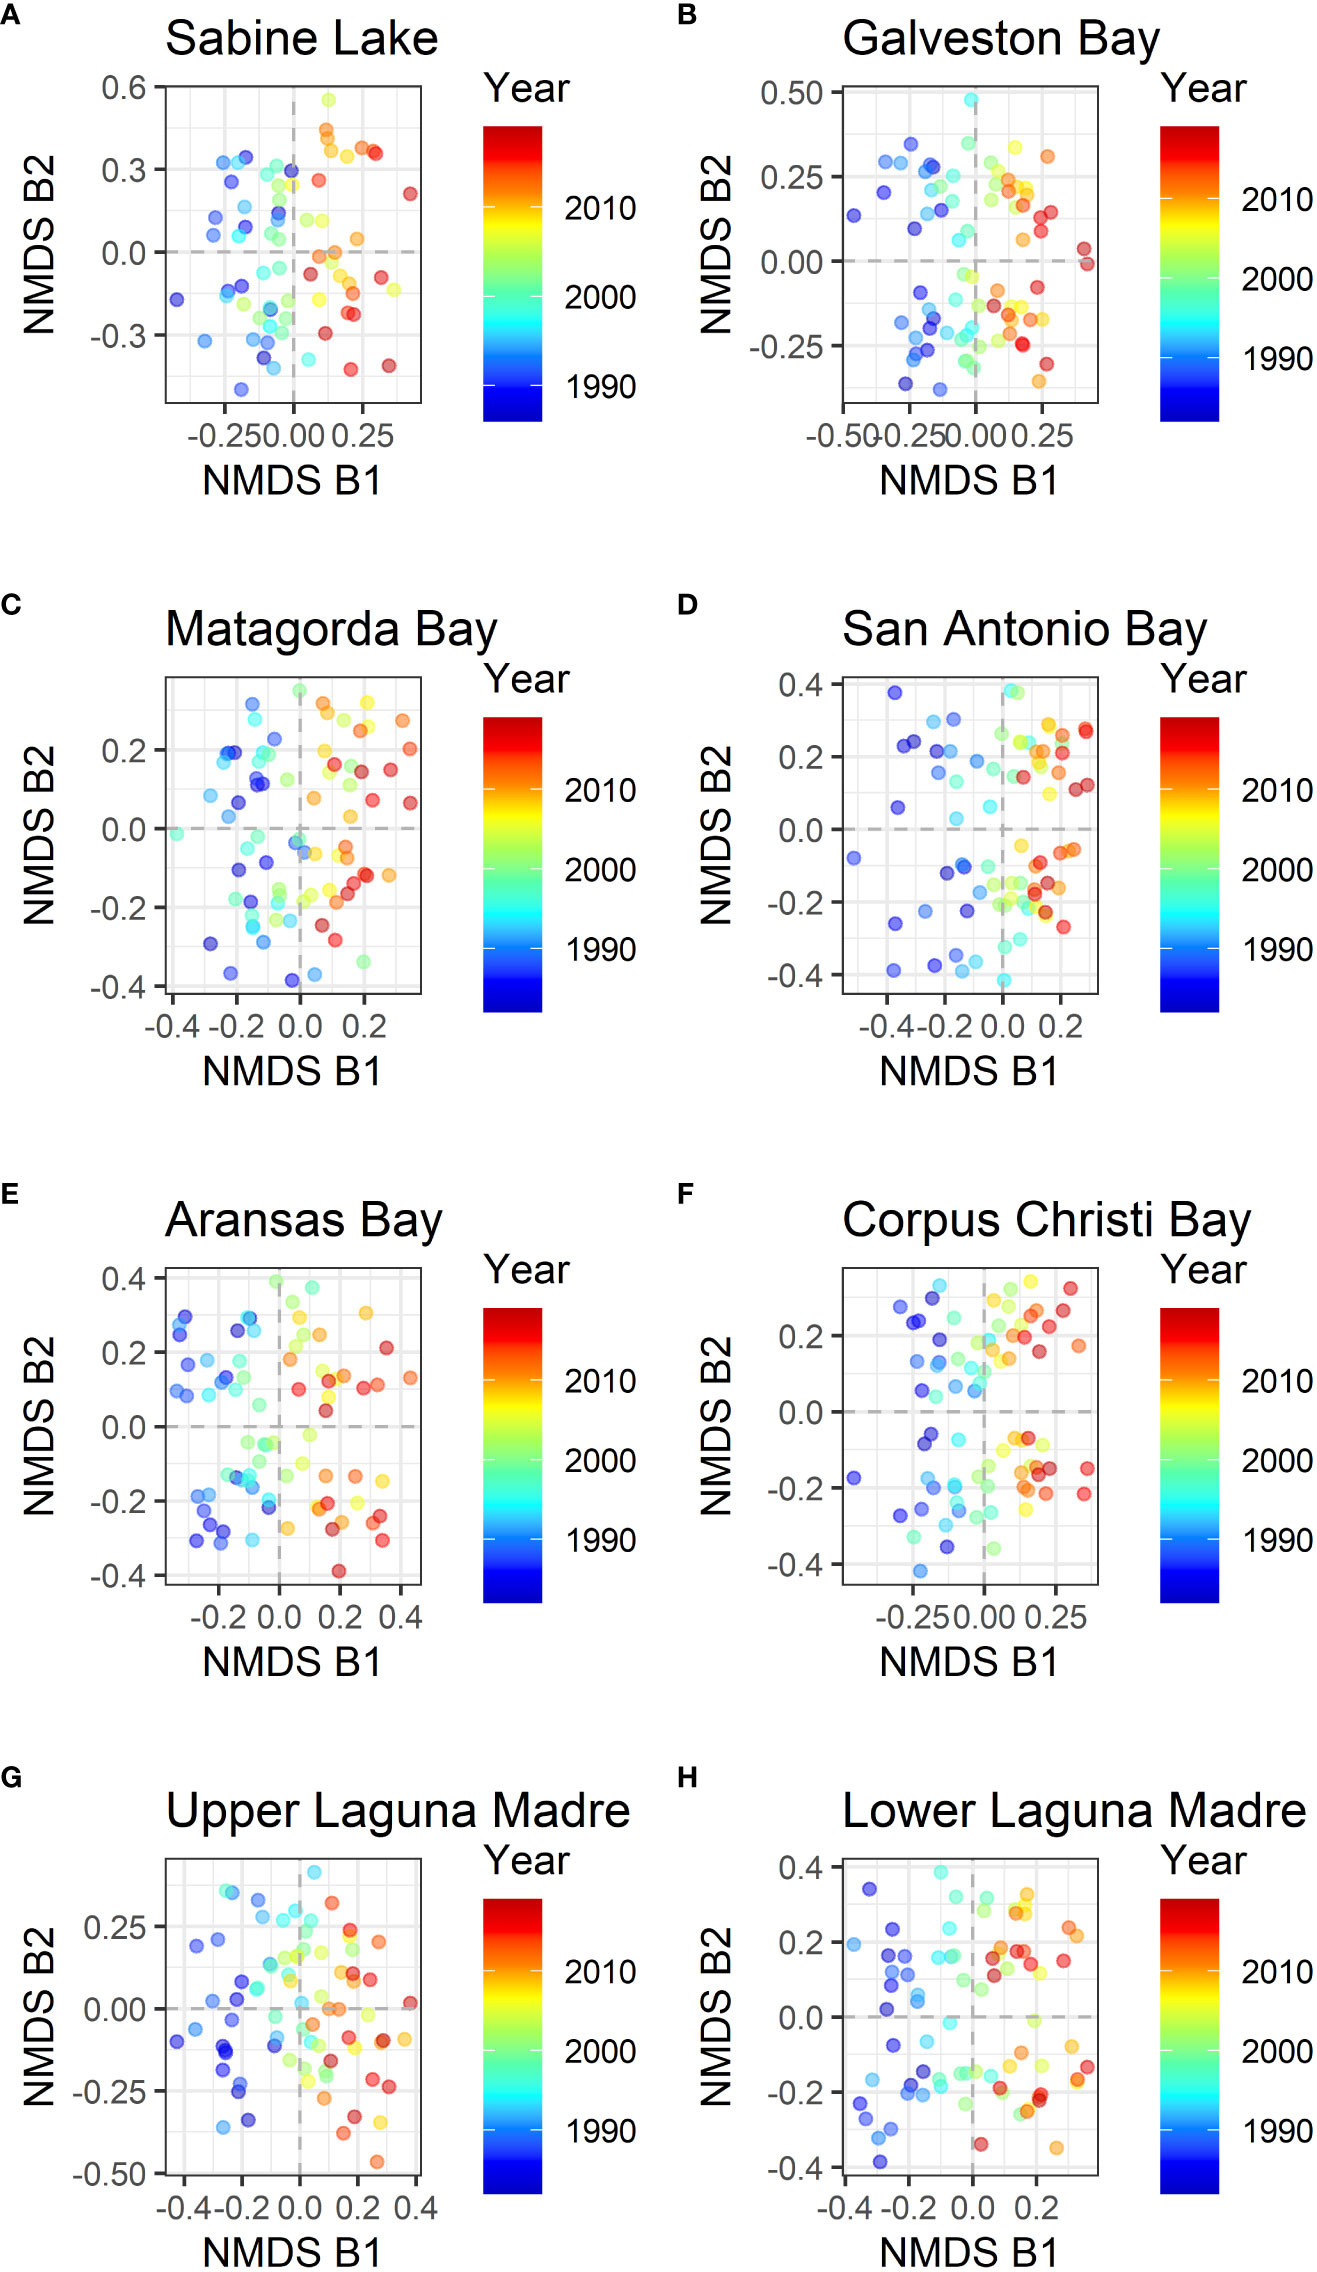
Figure 4 NMDS axes of data by each bay. NMDS B1 and NMDS B2 for eight different bays are shown, and the color shows the year of sampling. The first axis was rotated to match the year before plotting. (A) Sabine Lake, (B) Galveston Bay, (C) Matagorda Bay, (D) San Antonio Bay, (E) Aransas Bay, (F) Corpus Christi Bay, (G) Upper Laguna Madre, and (H) Lower Laguna Madre.
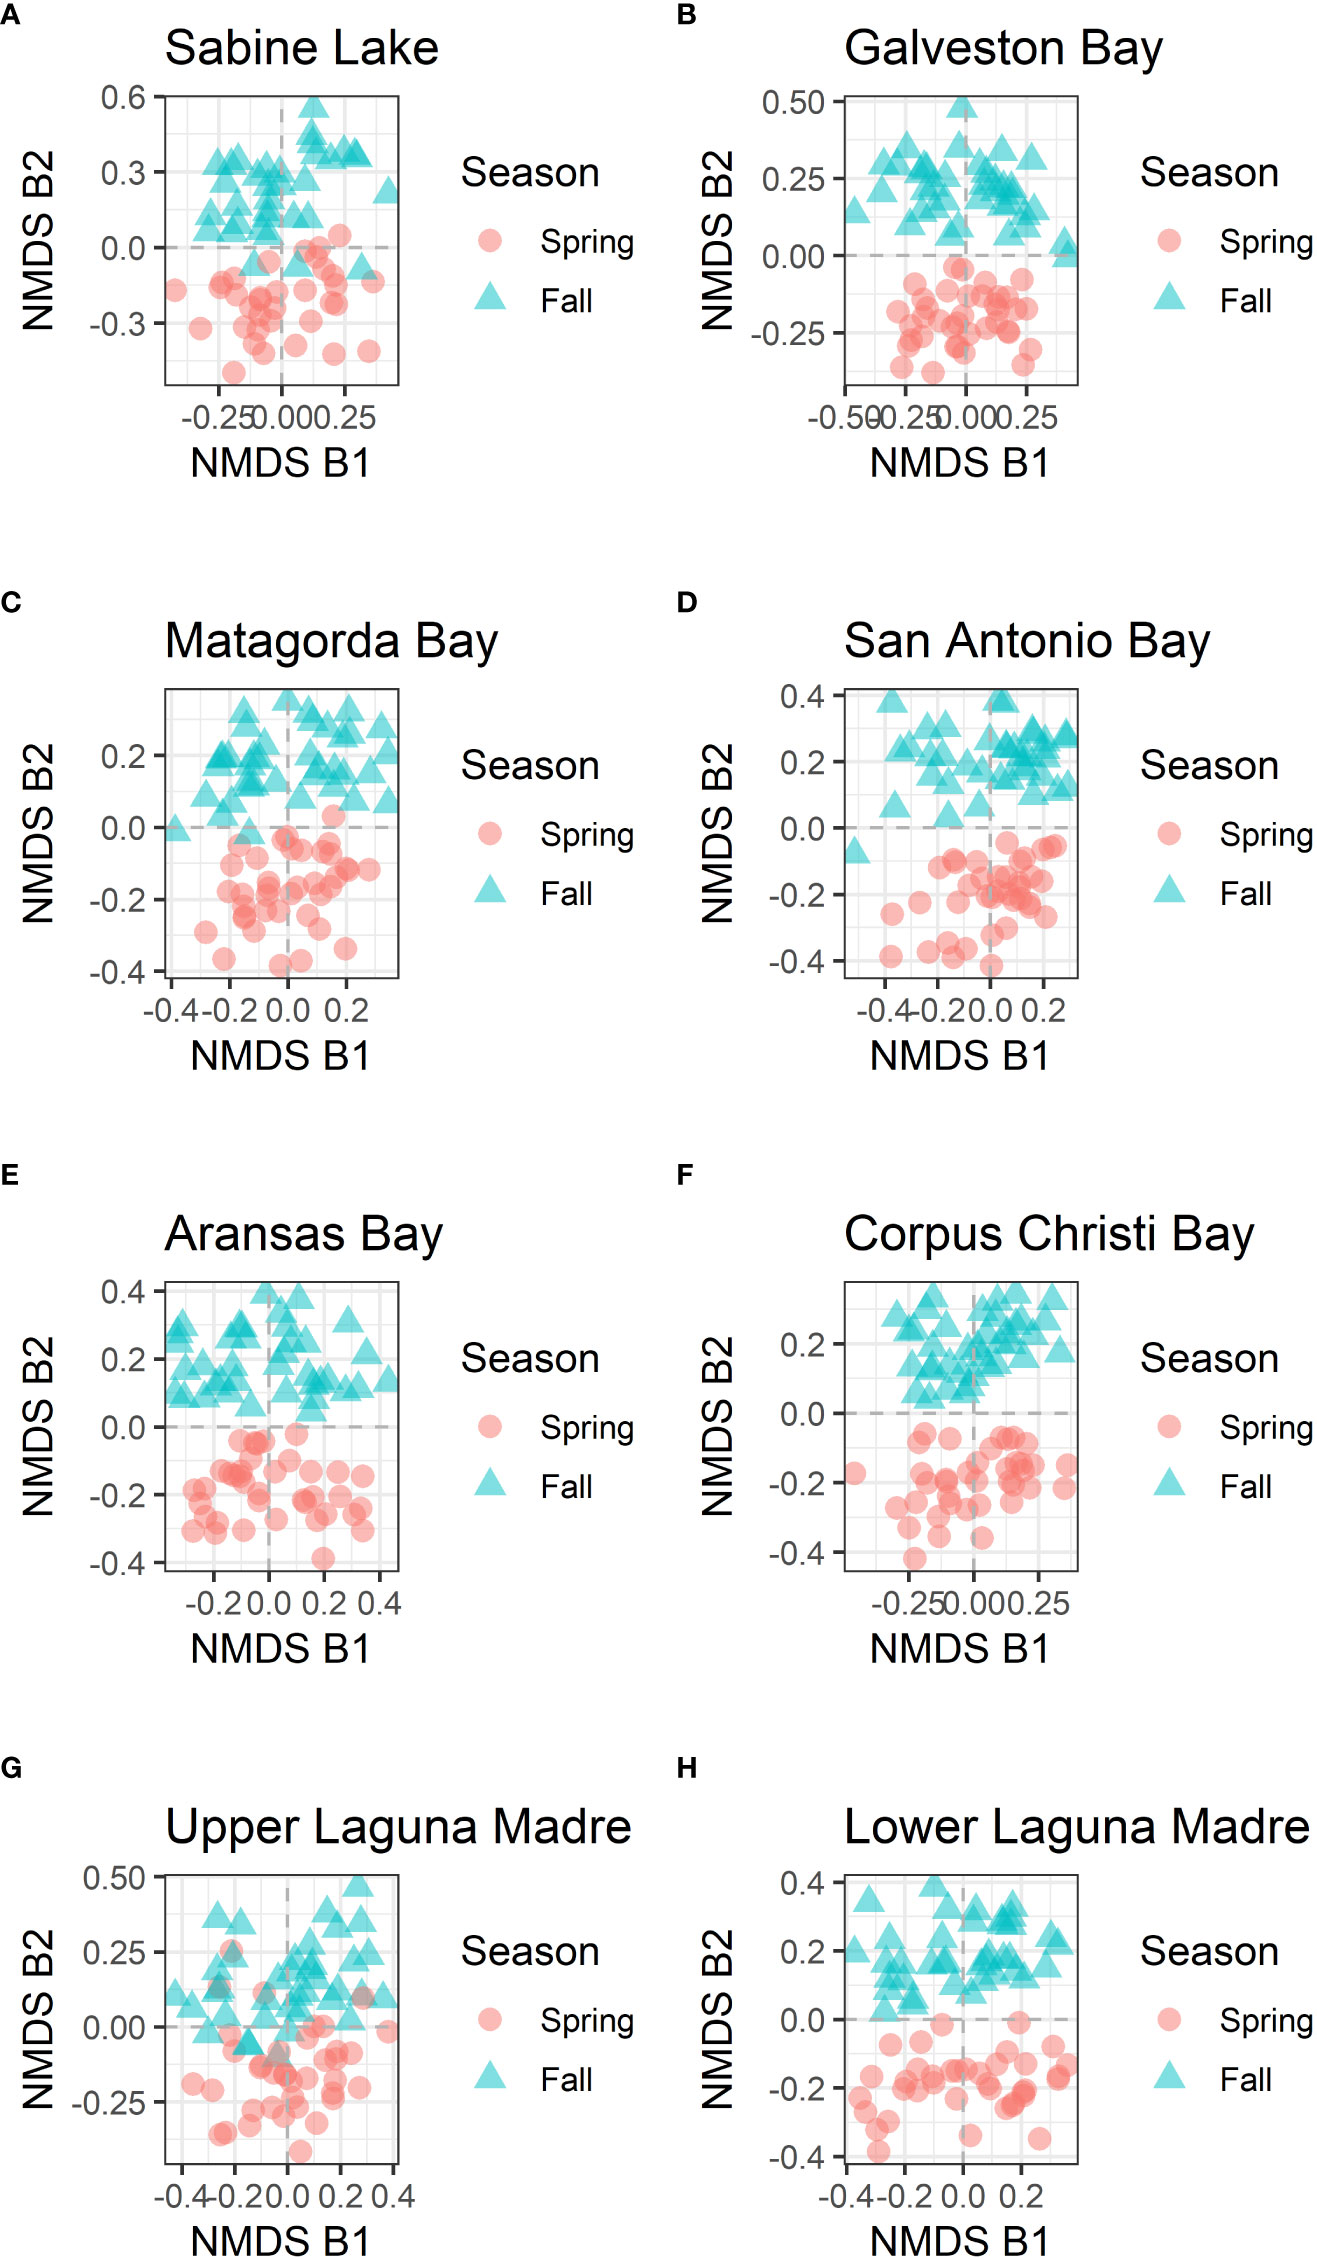
Figure 5 NMDS axes of data by each bay. NMDS 1 and NMDS 2 are shown for all locations, and the color and shape show the season of sampling. (A) Sabine Lake, (B) Galveston Bay, (C) Matagorda Bay, (D) San Antonio Bay, (E) Aransas Bay, (F) Corpus Christi Bay, (G) Upper Laguna Madre, and (H) Lower Laguna Madre.
Using the data that were separated into each bay, the SIMPER analysis was used to identify species that contribute to changes in species composition over the years significantly (p-value < 0.01). Then, we selected the species that contribute to at least four of the eight bays because those are the species that contribute to large-scale changes in species compositions (i.e. affecting at least a half of the bays). There were 20 such species (Table 1). For example, Gafftopsail catfish (Bagre marinus) contributed to changes in species composition at all eight bays whereas Gray snapper (Lutjanus griseus), Ladyfish (Elops saurus), and Southern kingfish (Menticirrhus americanus) contributed to seven of the eight bays (Table 1; Figures 6, 7). Most of the 20 species exhibited increasing abundance (Figures 8, 9), but two species (Southern flounder and Spanish mackerel) exhibited decreasing abundance and their distributions were retracting northward (Figures 9A, C). At least, two species (Common snook and Smallscale fat snook) were not only increasing their abundance but are also expanding their distribution northward (Figure 8).

Table 1 Species significantly contributing to the changes in species composition.
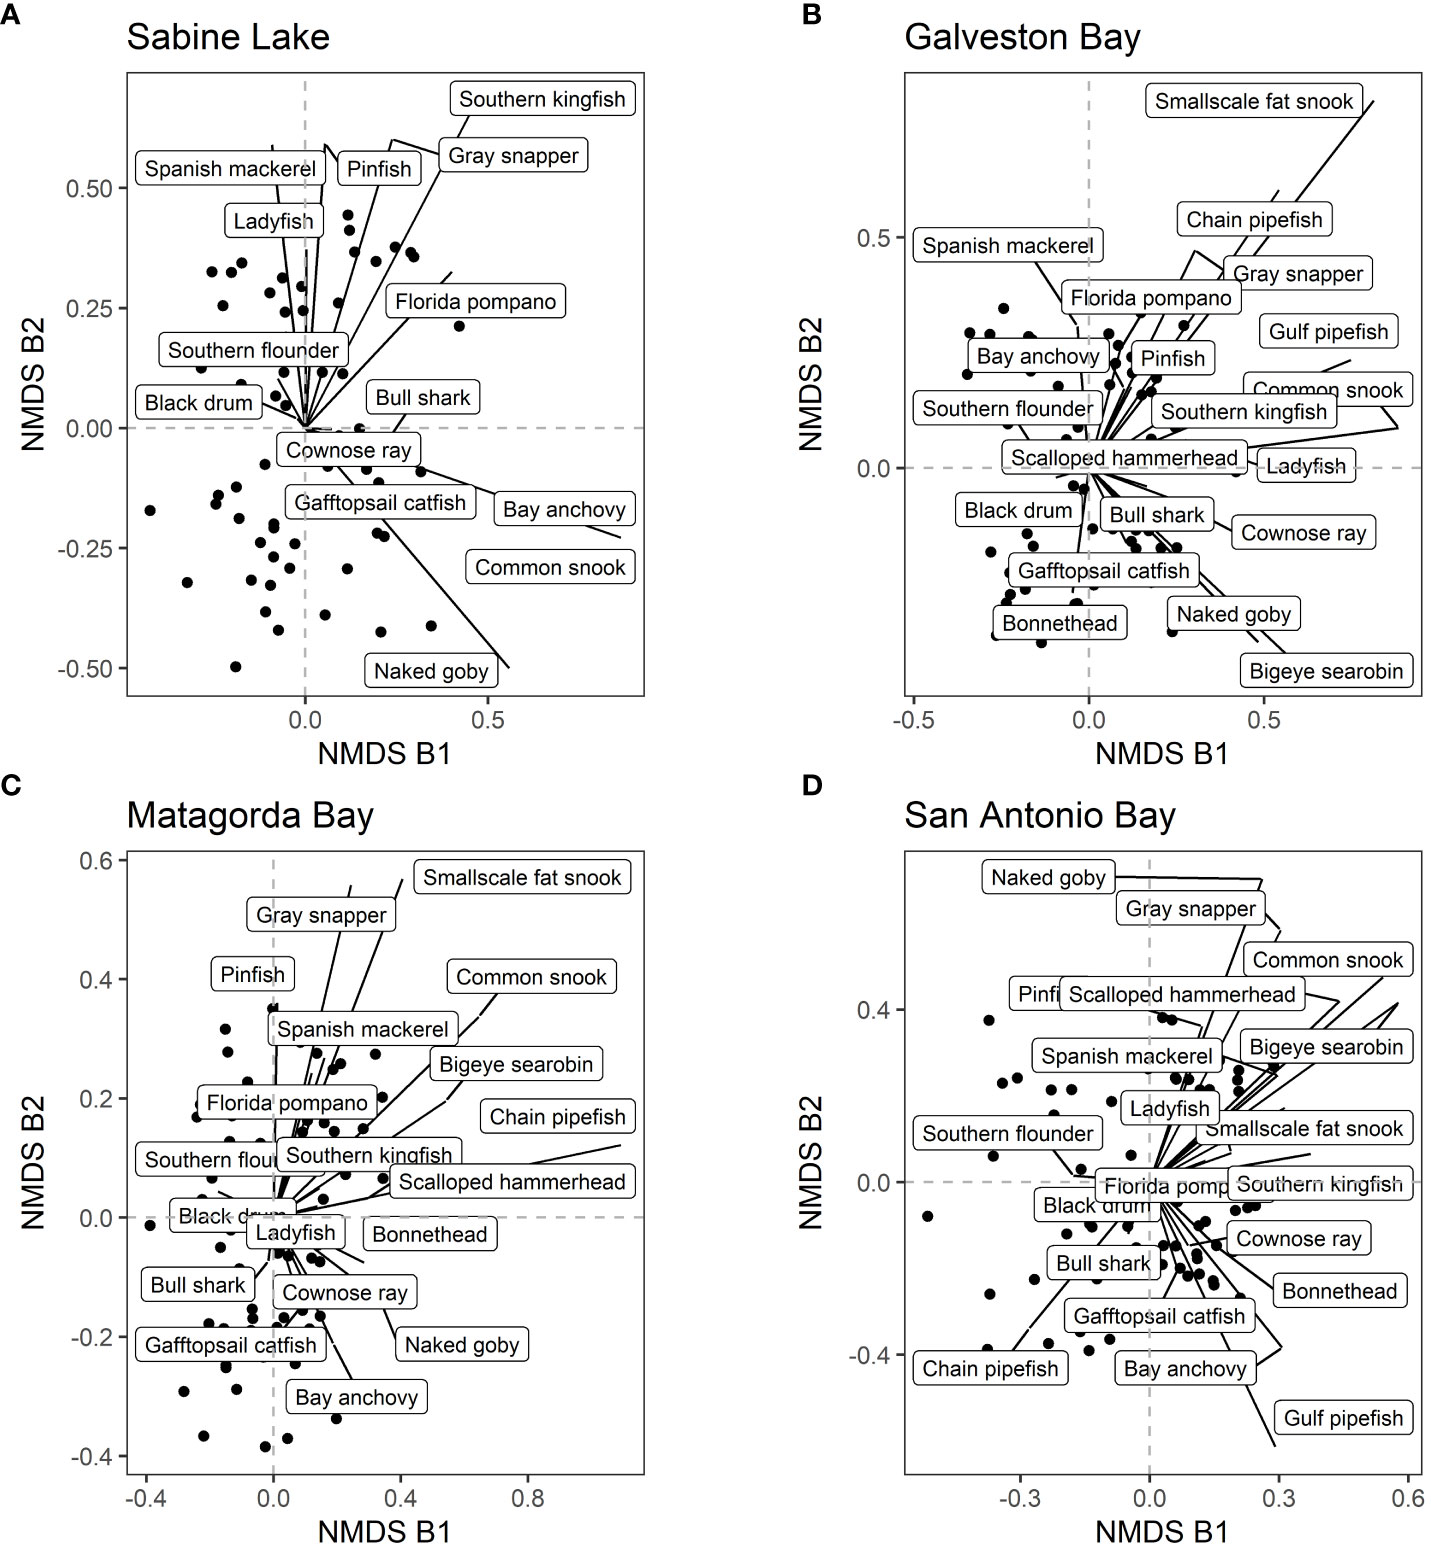
Figure 6 NMDS axes by bays. Each dot represents a sample. The contributions of 20 selected species (see main text for how the species were selected) are shown in each pane. (A) Sabine Lake, (B) Galveston Bay, (C) Matagorda Bay, and (D) San Antonio Bay.
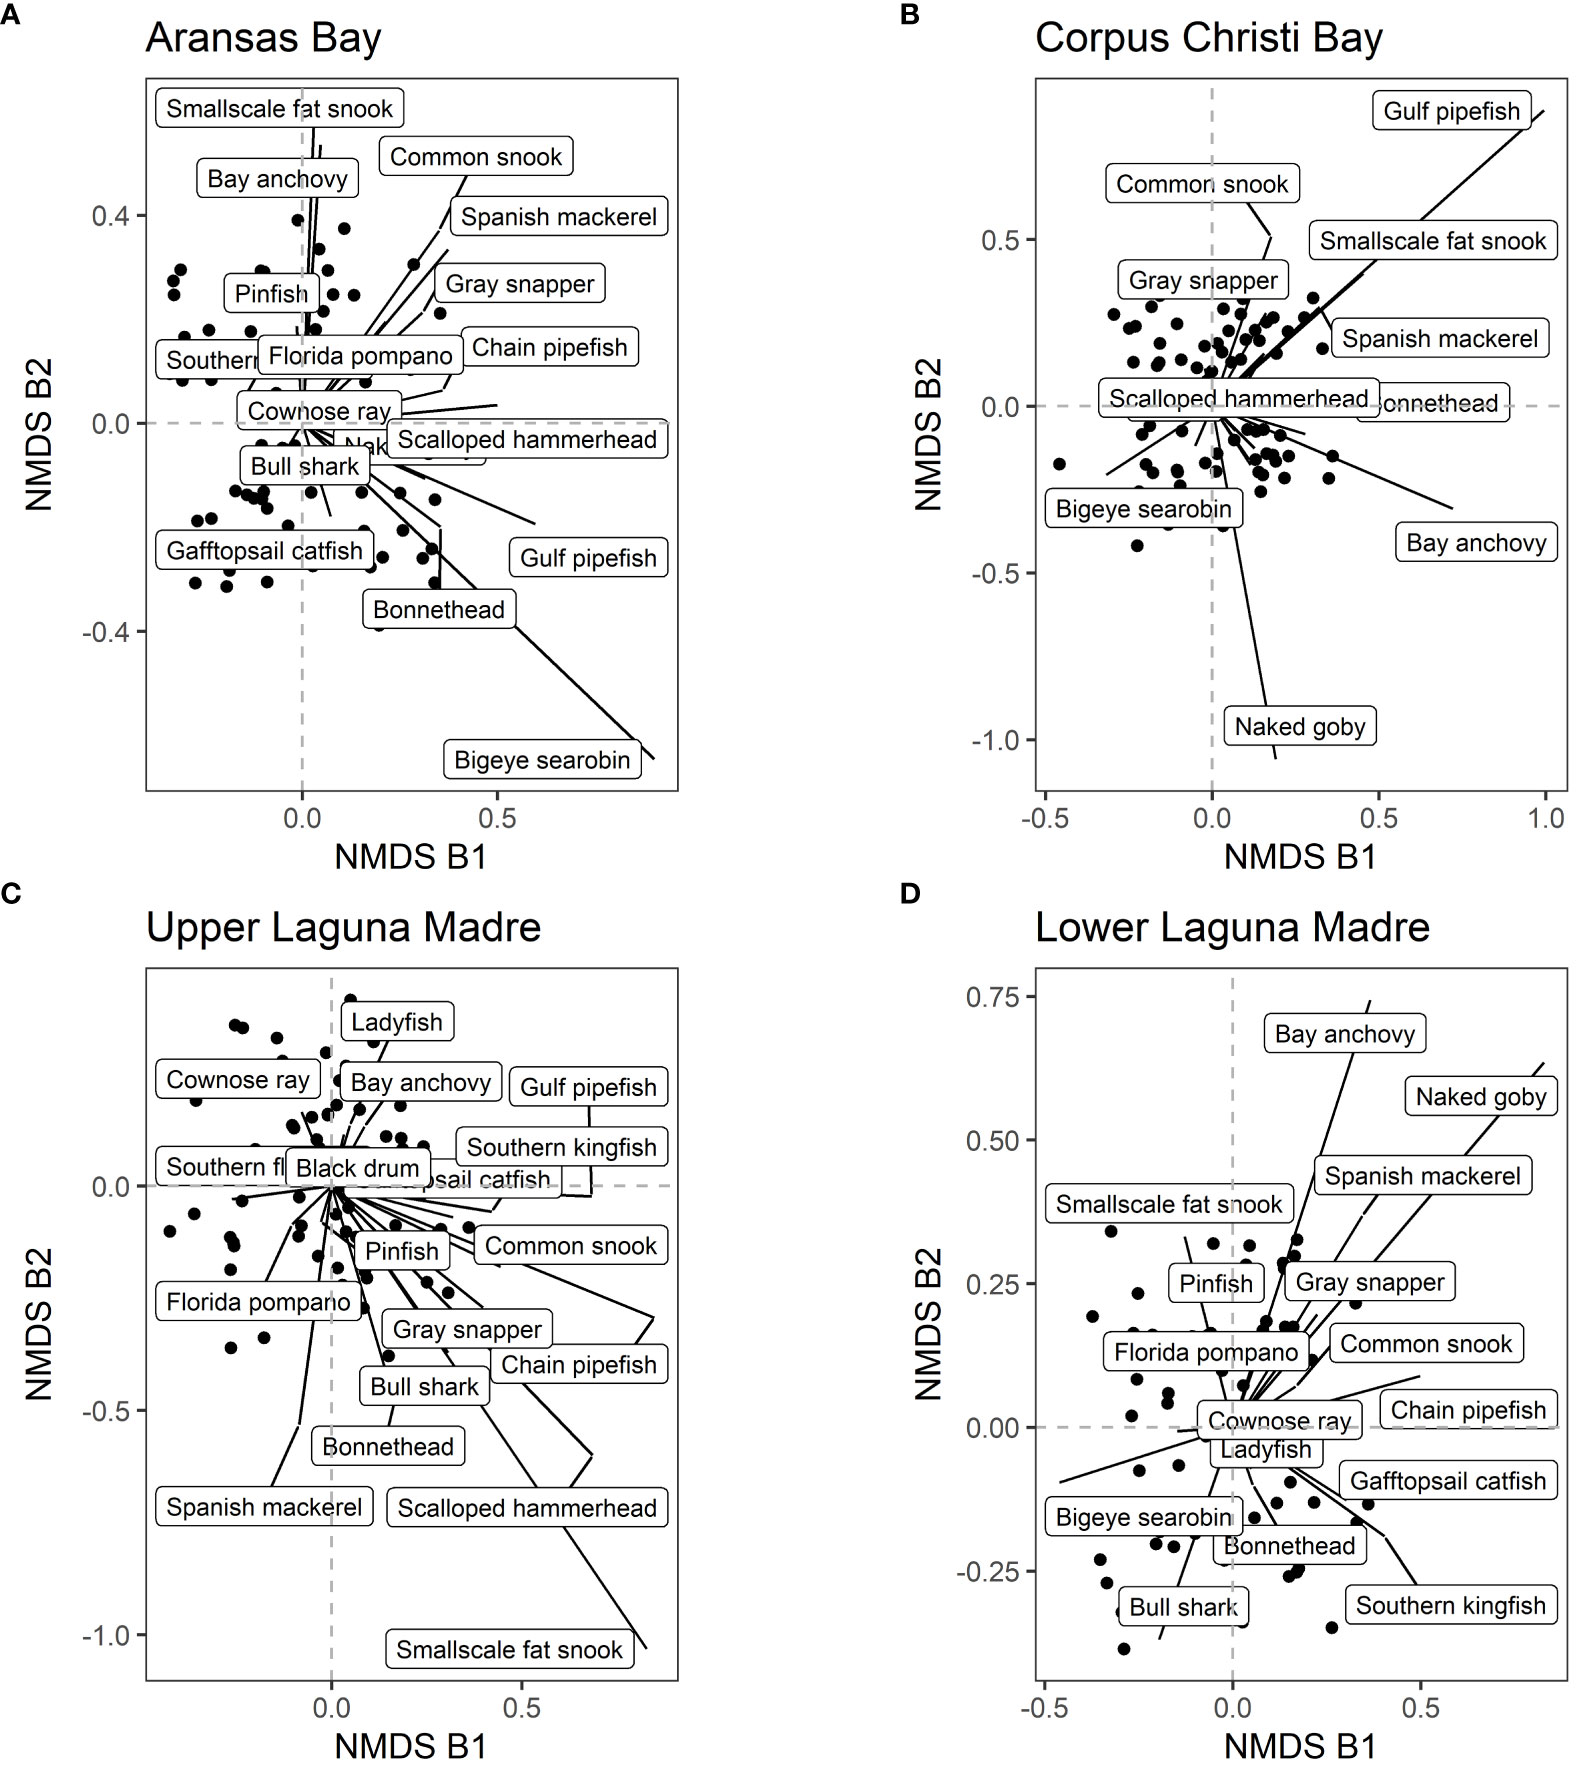
Figure 7 NMDS axes by bays. Each dot represents a sample. The contributions of 20 selected species (see main text for how the species were selected) are shown in each pane. (A) Aransas Bay, (B) Corpus Christi Bay, (C) Upper Laguna Madre, and (D) Lower Laguna Madre.
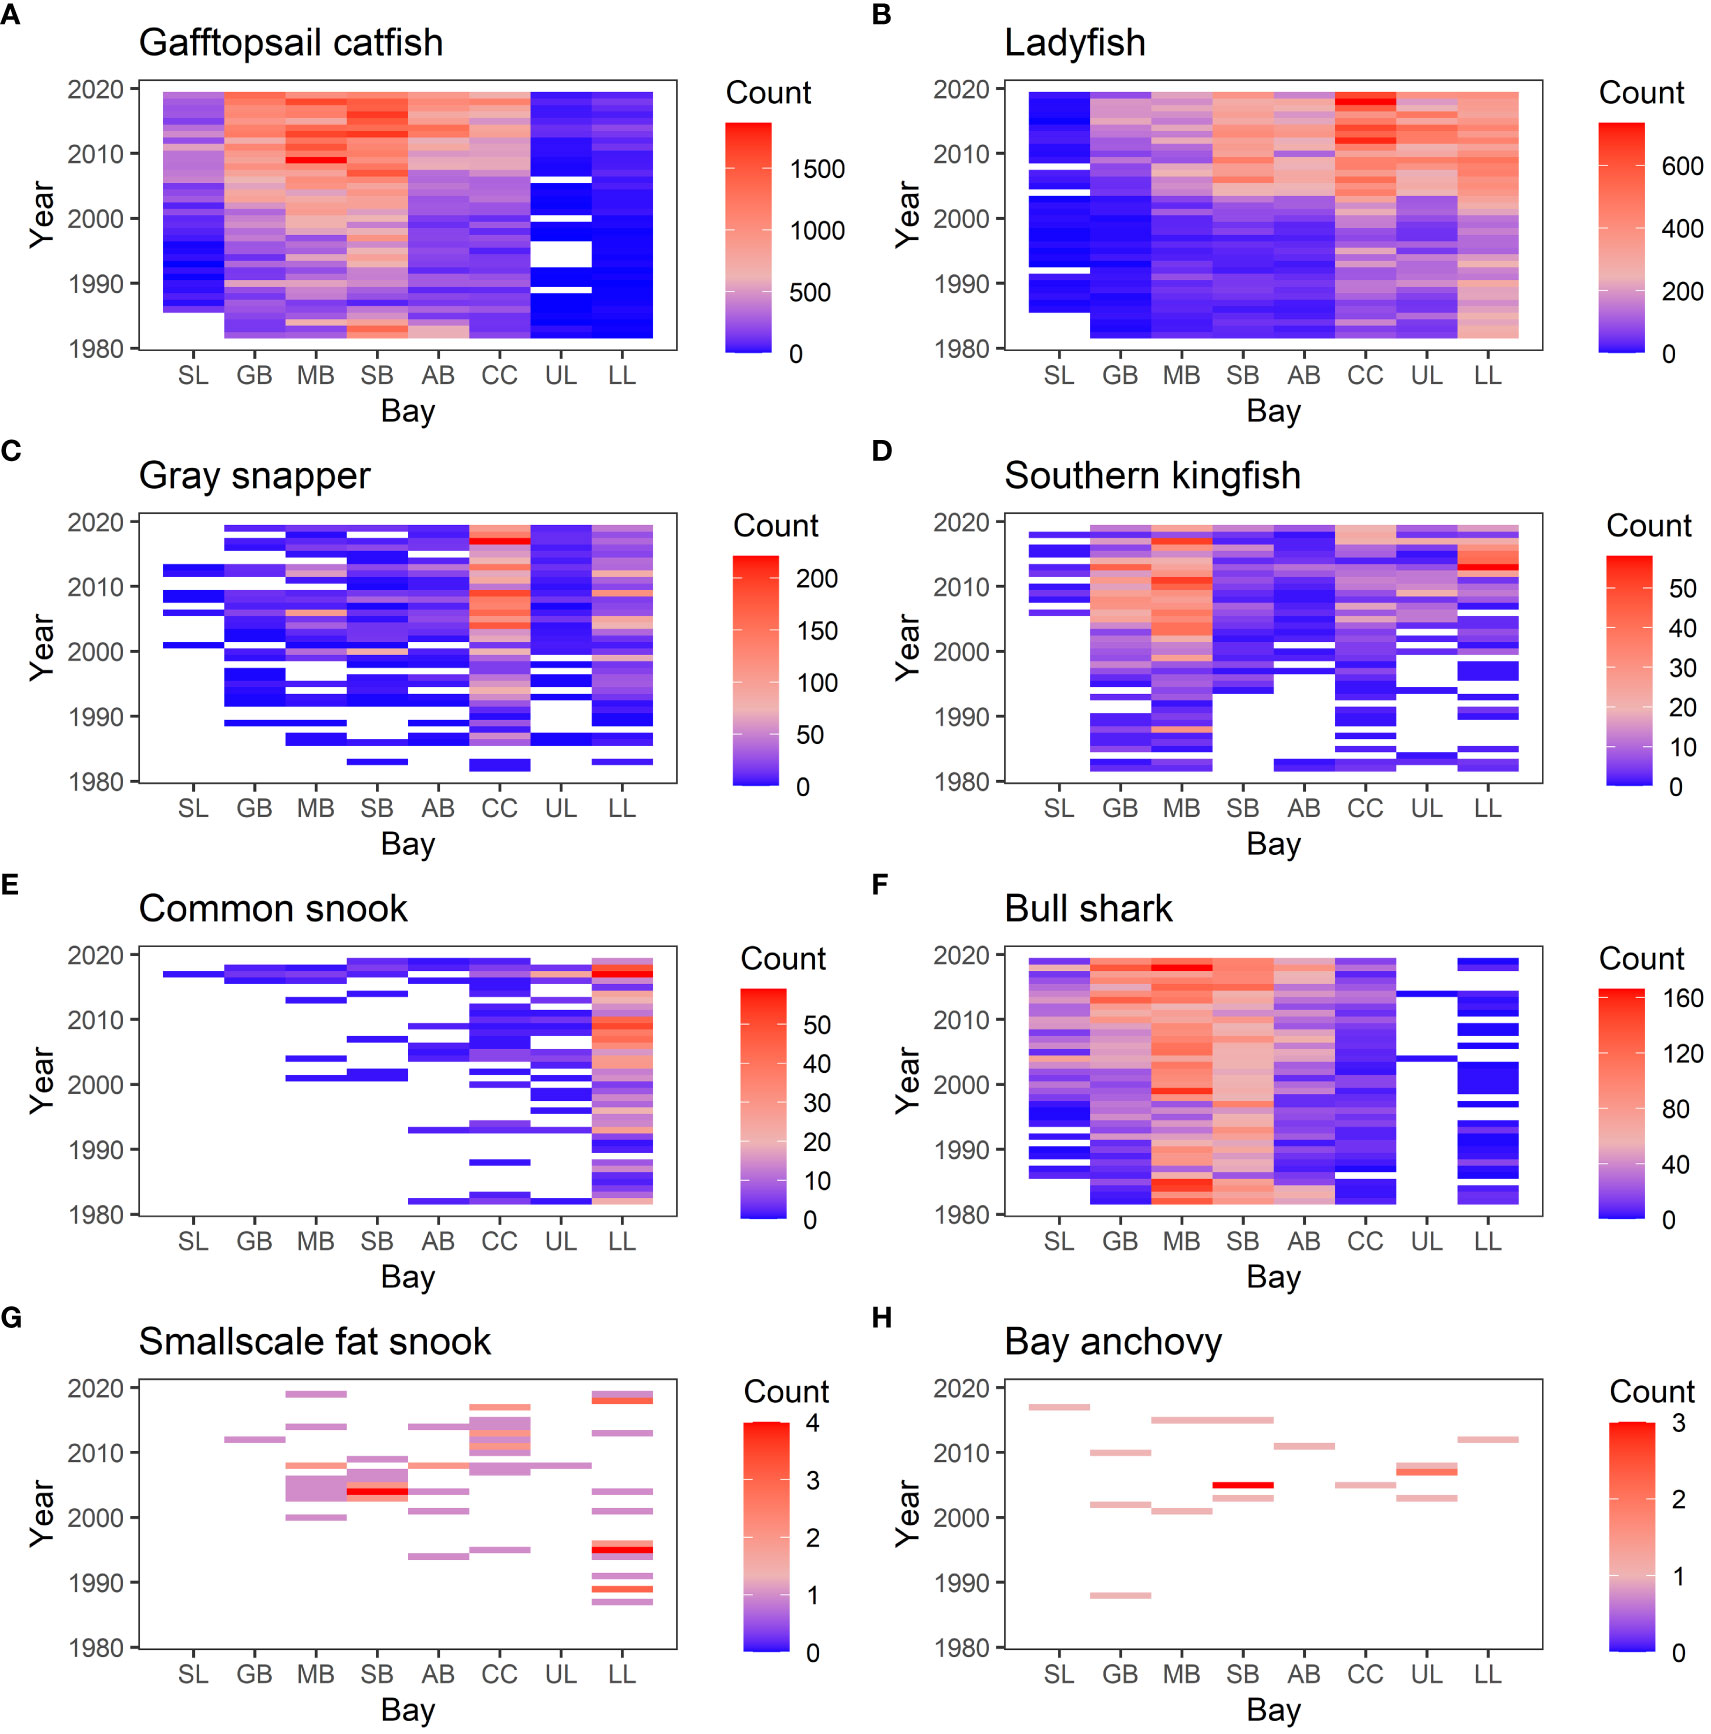
Figure 8 Heat map showing the number of individuals observed in each sample. The vertical axis is year, and the horizontal axis shows bays (SL, Sabina Lake; GB, Galveston Bay; MB, Matagorda Bay; SB, San Antonio Bay; AB, Aransas Bay; CC, Corpus Christi Bay; UL, Upper Laguna Mader; LL, Lower Laguna Madre.). (A) Gafftopsail catfish, (B) Ladyfish, (C) Gray snapper, (D) Southern kingfish, (E) Common snook, (F) Bull shark, (G) Smallscale fat snook, and (H) Bay anchovy.
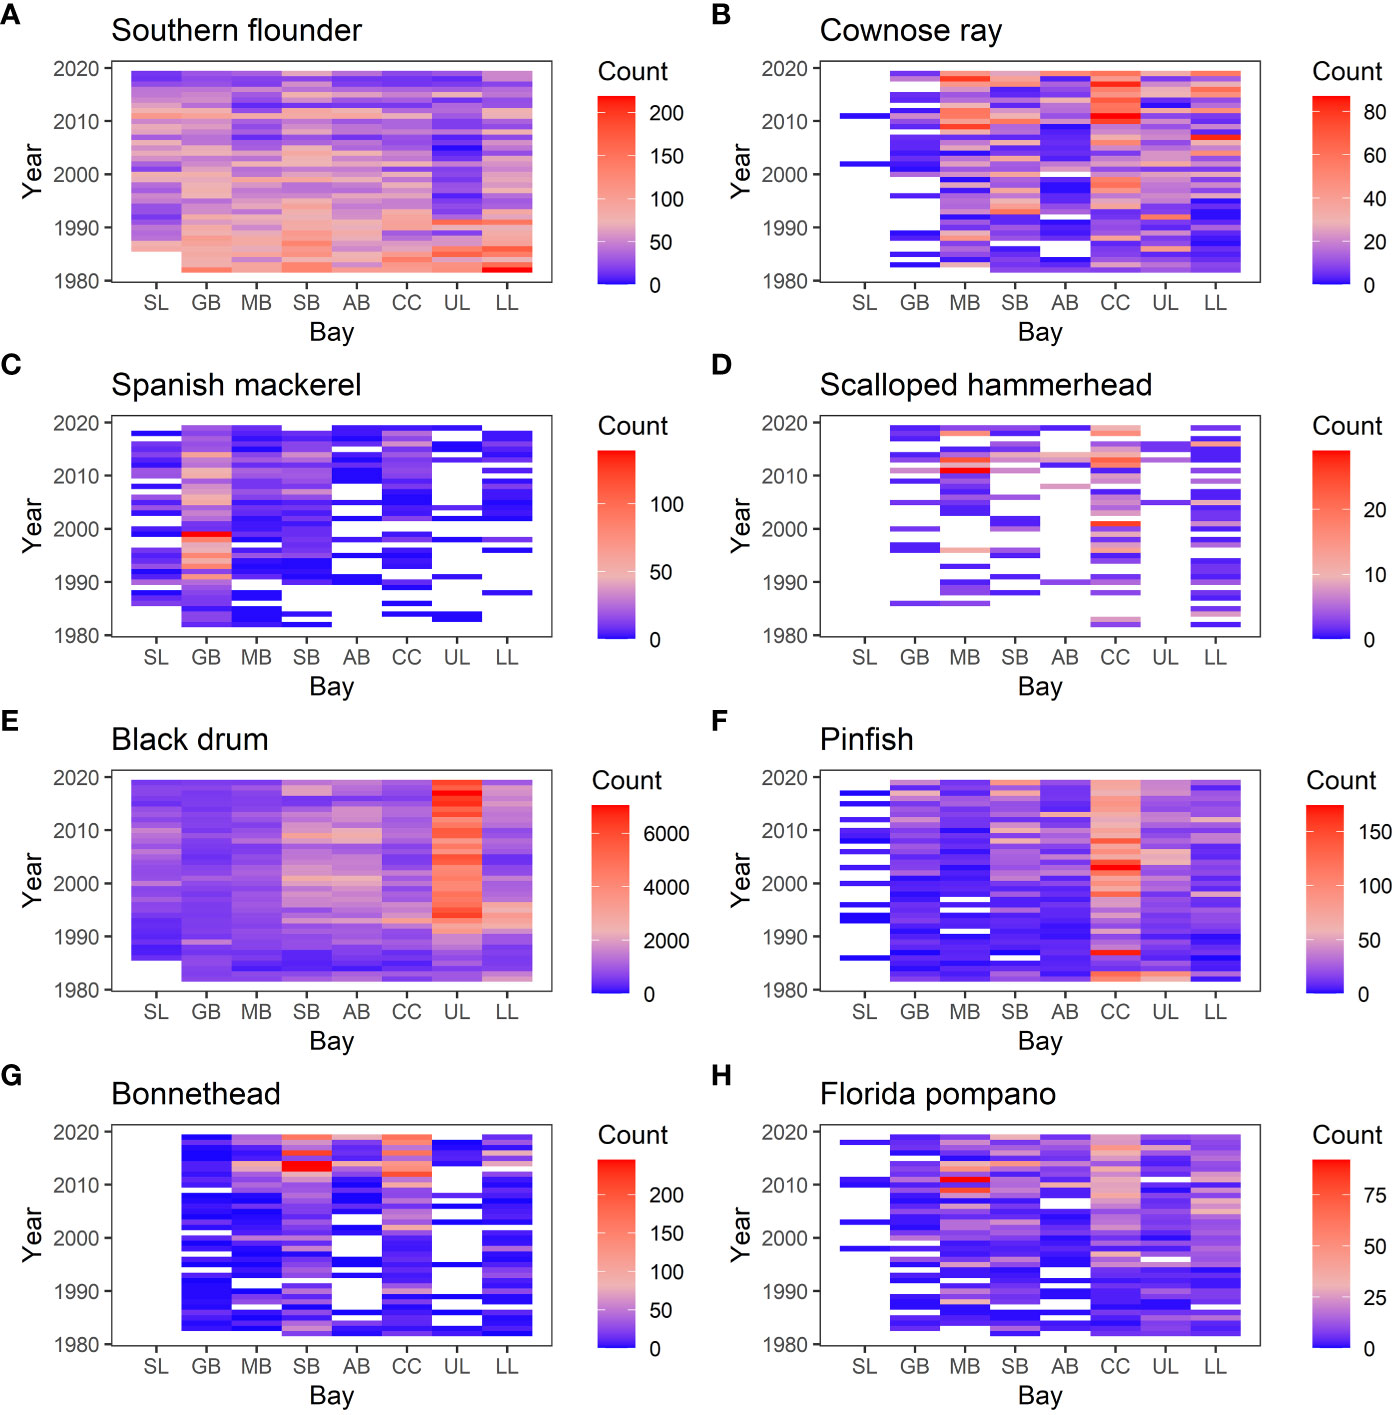
Figure 9 Heat map showing the number of individuals observed in each sample. The vertical axis is year, and the horizontal axis shows bays (SL, Sabina Lake; GB, Galveston Bay; MB, Matagorda Bay; SB, San Antonio Bay; AB, Aransas Bay; CC, Corpus Christi Bay; UL, Upper Laguna Mader; LL, Lower Laguna Madre.). (A) Southern flounder, (B) Cownose ray, (C) Spanish mackerel, (D) Scalloped hammerhead, (E) Black drum, (F) Pinfish, (G) Bonnethead, and (H) Florida pompano.
4 Discussion
The composition of fish species along the coast in the Northwestern Gulf of Mexico is gradually changing over time (Figure 4). Most of the species that contributed to the changes are increasing in their abundance, and some of them (e.g. Common snook and Smallscale fat snook) are expanding their distributions northwards (Figure 8). This is consistent with the previous study showing that the species diversity is increasing in these bays (Fujiwara et al., 2019; Pawluk et al., 2021). However, gillnet captures individuals that are within certain size ranges, and they include a wide variety of life history strategies including migratory species. Therefore, only some portions of the life stages of the 93 species are directly observed. During their remaining life stages, different environmental factors or those outside of the estuaries may affect them. Furthermore, species compositions between the two seasons are significantly different in all bays. Consequently, it is difficult to pinpoint the environmental factor that affects the overall community structure. Nevertheless, by examining the major species contributing to the temporal changes (Table 1), we can elucidate environmental conditions causing the changes in the species composition.
Previous studies attributed the changes in species compositions in these bays to climate change (Fujiwara et al., 2019; Pawluk et al., 2021). In the current study, expanding species such as Common snook and Smallscale fat snook have an affinity to warmer water, and contracting species such as Southern flounder and Spanish mackerel have an affinity to colder water. Many of the species that were only observed in recent years also have a preference for warmer water (e.g. Gulf pipefish, and Chain pipefish: Figure 10). These geographic shifts and increases in warmer-water species are indicative of the effects of climate change. A previous study, which focused on smaller fish (juveniles and small adults) collected with bag seines, found that the latitudes of the southern range limit for those that were decreasing in their incidence were significantly higher than those for increasing species (Fujiwara et al., 2019). The results from the current study provide further evidence suggesting climate change is one of the important causes of changes in species composition.
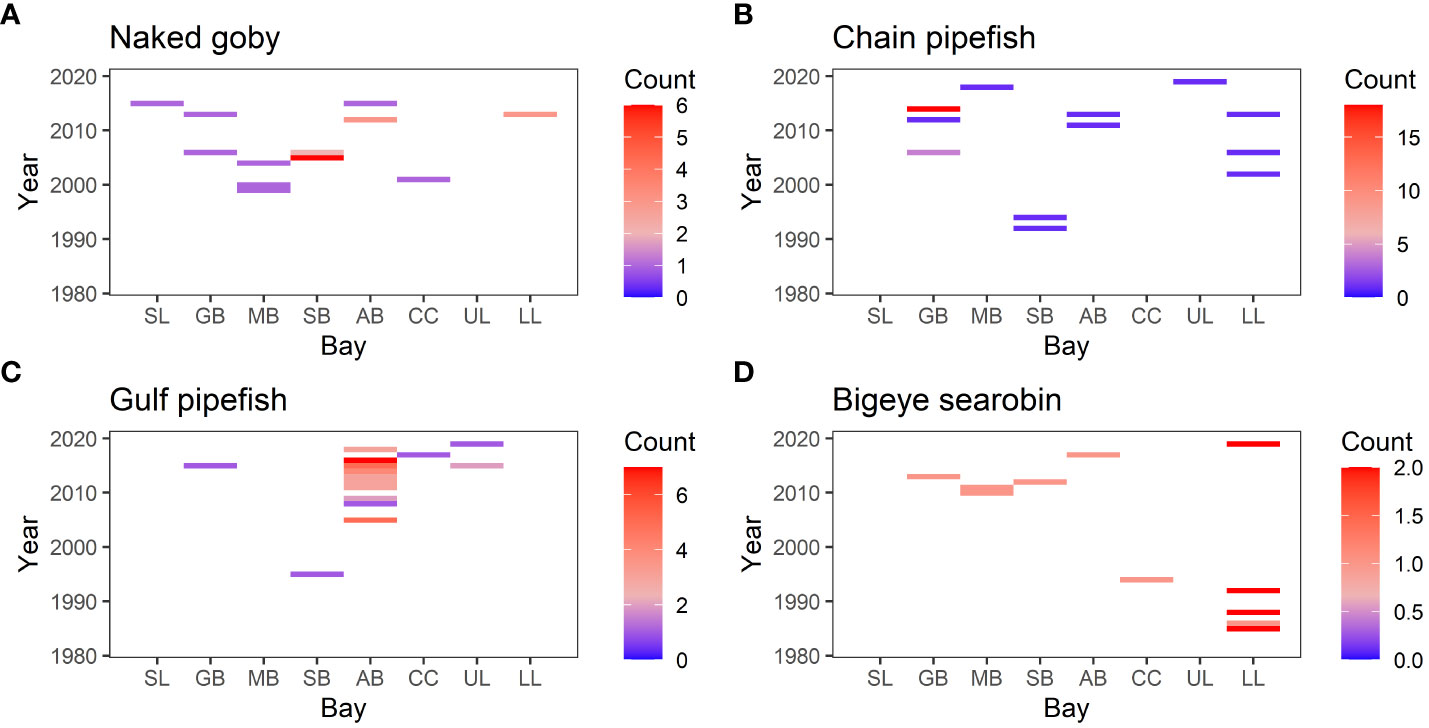
Figure 10 Heat map showing the number of individuals observed in each sample. The vertical axis is year, and the horizontal axis shows bays (SL, Sabina Lake; GB, Galveston Bay; MB, Matagorda Bay; SB, San Antonio Bay; AB, Aransas Bay; CC, Corpus Christi Bay; UL, Upper Laguna Mader; LL, Lower Laguna Madre.). (A) Naked goby, (B) Chain pipefish, (C) Gulf pipefish, (D) Bigeye searobin.
The observed temporal changes in species compositions (Figure 4) may still be explained by temperature although it does not appear as a significant factor in our statistical analysis. This is because water temperature is rising along the coast and the relationship between temperature and abundance of species may be non-linear (Fujiwara et al., 2022). Temperature influences the distribution of fish along a latitudinal gradient (Harley et al., 2006; O'Connor and Booth, 2021) as ectothermic species rely on environmental temperature for their physiological functioning (Little et al., 2020; Liao et al., 2021). If the environmental temperature deviates from a threshold range, it can negatively impact the growth and development of fish species. However, it is important to note that fish species exhibit plasticity (Little et al., 2020) allowing fish to inhabit a range of temperatures without significant adverse effects on their physiology (Pörtner and Peck, 2010). Therefore, in addition to species distribution modeling conducted in our study, bioenergetic modeling may be necessary to reveal the effects of temperature on fish distribution further (Troia and Perkin, 2022).
In addition to temperature, other factors, such as salinity, may influence fish distributions (Harley et al., 2006; O'Connor and Booth, 2021). Moreover, direct human activities such as marine pollution, the presence of artificial structures (e.g., harbors and coastal urban developments), and fishing activities (Todd et al., 2019) can significantly impact fish distributions. In the Gulf of Mexico, fishing activities are often considered as an important variable affecting fish species distribution, given their importance in the region. Although many of the species observed in this study are neither directly targeted by commercial nor recreational fisheries, they may be caught as bycatch in bottom trawl fisheries in the Gulf of Mexico (Scott-Denton et al., 2012). It is plausible that an effort to reduce bycatch, which occurred in the mid 1990’s, may be contributing to an increase in the abundance of some of the species, especially bottom fish, such as Atlantic croaker (Micropogonias undulatus). However, species that are caught in bycatch include those that exhibit different trends. Furthermore, it does not explain the geographic expansions and contractions exhibited by some of the species. Finally, it is unlikely that bycatch is selective based on whether they have an affinity to colder water or warmer water. Therefore, the impacts of fisheries cannot explain all the changes in fish species composition. Nevertheless, future studies comparing bycatch and change in species compositions is a potentially interesting study.
Spatial variation in species composition is affected by salinity. As we go from north to south along the coast, freshwater input is reduced, creating a latitudinal salinity gradient. Southern bays such as Lower Laguna Madre, Upper Laguna Madre, and Corpus Christi Bay frequently experience hyper-saline conditions. Our results suggest that spatial variations in species composition are significantly associated with salinity (Figure 3A). This is reflected in a higher proportion of fish that can tolerate freshwater in the northern bays (Figure 3B). A higher proportion of Gars, many of which are considered freshwater species, is also found in the northern bays but not in the southern bays (Figure 3B). Therefore, the northern expansions of warmer-water species may not be possible for all the species along the coast of the Northwestern Gulf of Mexico unless they also tolerate a wide range of salinities or have the ability to avoid either too low or too high salinities. On the other hand, climate change is also expected to reduce precipitation in the area, and salinity in many of the bays has increased over time (Bugica et al., 2020). A further increase may promote the northern expansion of fish species that do not tolerate lower-salinity conditions in the future.
The species interactions are also important factors, but we cannot evaluate them in the current study. For example, competition may be limiting the distributions of some of the species, as northern species retract their distribution north, some of the southern species might become able to expand their distribution. Furthermore, predator-prey interactions may also affect the shifts in the distributions of some of the species. For example, a previous study showed the abundance of shark species is increasing in the bays. Although it is not clear whether they are increasing in population abundance or being attracted more to these bays, increased prey abundance is a potential cause. Further studies of species interactions along with more detailed investigations of individual species in the future will be important in understanding the mechanisms behind the changes in species composition in these bays.
The data analyzed in this study were sampled with a gillnet, which is a size-selective sampling gear. Each panel of gillnet has different selectivity, and four different panels were used at all sampling occasions to capture a wide variety of fish species that actively swim through the net. Our results reveal changes in species compositions of fish that are available to be captured with a gillnet, which still includes a wide range of fish species, over time and space. However, the gillnet was intended to catch only adults and sub-adults of fish; it was not intended to catch most invertebrates or fish that are very small as adults or young individuals of most species. Furthermore, the sampling was only conducted during the night. Consequently, only the fish that were active during the night were captured. Therefore, sampling was not intended to show a complete list of species along the coast. However, the gear and the protocol have remained without changes over the years and locations of the study and, therefore, the selectivity has remained the same over time and space.
Our study showed many species are expanding or contracting their distributions northward, suggesting the climate change effect. These observations were possible because the sampled area extends over a long coastline (more than 600 km in length) with high spatial resolution. If sampling was only done in a few closer bays, we would have missed many observed patterns. On the other hand, if we sampled a few distant bays, the spatial variations would have overwhelmed the differences in species compositions. This suggests spatial scale and resolution of sampling are very important in understanding the effects of climate change on species composition. Considering the observations herein, we suggest existing data with small spatial scale or low spatial resolution need to be re-evaluated carefully accounting for the sampling aliasing effects.
Species compositions are gradually changing in all bays, but underlying mechanisms are complex. Each species may be responding to different external factors or the same external factors in different ways. Consequently, it is unlikely that the species compositions found in the bays in higher latitudes in the future are simply those found in the lower latitudes now. Although this makes ecological studies interesting, our ability to predict the future state of ecosystems is hindered by the complexity.
Data availability statement
Publicly available datasets were analyzed in this study. This data can be found here: https://doi.org/10.26008/1912/bco-dmo.828794.1 Biological and Chemical Oceanography Data Management Office, BCO-DMO.
Ethics statement
Ethical approval was not required for the study involving animals in accordance with the local legislation and institutional requirements because No data were collected. The study uses existing data.
Author contributions
MTC: Conceptualization, Formal Analysis, Investigation, Methodology, Visualization, Writing – original draft, Writing – review & editing. MF: Conceptualization, Data curation, Formal Analysis, Funding acquisition, Investigation, Methodology, Project administration, Supervision, Validation, Visualization, Writing – original draft, Writing – review & editing. FM-A: Conceptualization, Data curation, Resources, Writing – review & editing.
Funding
The author(s) declare financial support was received for the research, authorship, and/or publication of this article. This project was funded in part by Coastal Fisheries State Wildlife Grant (CA-0000985) to MF.
Acknowledgments
We wish to thank the staff at the Texas Parks and Wildlife Department for collecting data.
Conflict of interest
The authors declare that the research was conducted in the absence of any commercial or financial relationships that could be construed as a potential conflict of interest.
Publisher’s note
All claims expressed in this article are solely those of the authors and do not necessarily represent those of their affiliated organizations, or those of the publisher, the editors and the reviewers. Any product that may be evaluated in this article, or claim that may be made by its manufacturer, is not guaranteed or endorsed by the publisher.
Supplementary material
The Supplementary Material for this article can be found online at: https://www.frontiersin.org/articles/10.3389/fmars.2023.1274771/full#supplementary-material
Supplementary Table 1 | List of species captured.
Supplementary Table 2 | Species significantly contributing to the changes in species composition.
References
Beare D. J., Burns F., Greig A., Jones E. G., Peach K., Kienzle M., et al. (2004). Long-term increases in prevalence of North Sea fishes having southern biogeographic affinities. Mar. Ecol. Prog. Ser. 284, 269–278. doi: 10.3354/meps284269
Bray J. R., Curtis J. T. (1957). An ordination of the upland forest communities of Southern Wisconsin. Ecol. Monogr. 27, 325–349. doi: 10.2307/1942268
Bugica K., Sterba-Boatwright B., Wetz M. S. (2020). Water quality trends in Texas estuaries. Mar. pollut. Bull. 152, 110903. doi: 10.1016/j.marpolbul.2020.110903
Clarke K. R. (1993). Non-parametric multivariate analyses of changes in community structure. Aust. J. Ecol. 18, 117–143. doi: 10.1111/j.1442-9993.1993.tb00438.x
Collie J. S., Wood A. D., Jeffries H. P. (2008). Long-term shifts in the species composition of a coastal fish community. Can. J. Fisheries Aquat. Sci. 65, 1352–1365. doi: 10.1139/f08-048
Dornelas M., Gotelli N. J., McGill B., Shimadzu H., Moyes F., Sievers C., et al. (2014). Assemblage time series reveal biodiversity change but not systematic loss. Science 344, 296–299. doi: 10.1126/science.1248484
Elahi R., O'Connor M. I., Byrnes J. E., Dunic J., Eriksson B. K., Hensel M. J., et al. (2015). Recent trends in local-scale marine biodiversity reflect community structure and human impacts. Curr. Biol. 25, 1938–1943. doi: 10.1016/j.cub.2015.05.030
Froese R., Pauly D. (2019). FishBase (World Wide Web electronic publication). Available at: www.fishbase.org,version.
Fujiwara M., Martinez-Andrade F., Wells R. J. D., Fisher M., Pawluk M., Livernois M. C. (2019). Climate-related factors cause changes in the diversity of fish and invertebrates in subtropical coast of the Gulf of Mexico. Commun. Biol. 2, 403. doi: 10.1038/s42003-019-0650-9
Fujiwara M., Simpson A., Torres-Ceron M., Martinez-Andrade F. (2022). Life-history traits and temporal patterns in the incidence of coastal fishes experiencing tropicalization. Ecosphere 13, 1–12. doi: 10.1002/ecs2.4188
Gotelli N. J., Moyes F., Antao L. H., Blowes S. A., Dornelas M., McGill B. J., et al. (2022). Long-term changes in temperate marine fish assemblages are driven by a small subset of species. Global Change Biol. 28, 46–53. doi: 10.1111/gcb.15947
Harley C. D., Randall Hughes A., Hultgren K. M., Miner B. G., Sorte C. J., Thornber C. S., et al. (2006). The impacts of climate change in coastal marine systems. Ecol. Lett. 9, 228–241. doi: 10.1111/j.1461-0248.2005.00871.x
Hiddink J. G., ter Hofstede R. (2008). Climate induced increases in species richness of marine fishes. Global Change Biol. 14, 453–460. doi: 10.1111/j.1365-2486.2007.01518.x
Liao M. L., Li G. Y., Wang J., Marshall D. J., Hui T. Y., Ma S. Y., et al. (2021). Physiological determinants of biogeography: The importance of metabolic depression to heat tolerance. Global Change Biol. 27, 2561–2579. doi: 10.1111/gcb.15578
Little A. G., Loughland I., Seebacher F. (2020). What do warming waters mean for fish physiology and fisheries? J. Fish Biol. 97, 328–340. doi: 10.1111/jfb.14402
Martinez-Andrade F. (2018). Marine Resource Monitoring Operations Manual (Austin, Texas: Texas Parks & Wildlife Department, Coastal Fisheries Division), 137.
Mead A. (1992). Review of the development of multidimensional scaling methods. Statistician 41, 27–39. doi: 10.2307/2348634
Murawski S. A. (1993). Climate change and marine fish distributions: Forecasting from historical analogy. Trans. Am. Fisheries Soc. 122, 647–658. doi: 10.1577/1548-8659(1993)122<0647:ccamfd>2.3.co;2
O'Connor C., Booth D. J. (2021). Response of estuarine fishes to elevated temperatures within temperate Australia: Implications of climate change on fish growth and foraging performance. J. Exp. Mar. Biol. Ecol. 544, 1–10. doi: 10.1016/j.jembe.2021.151626
Oksanen J., Simpson G., Blanchet F., Kindt R., Legendre P., Minchin P., et al. (2022). vegan: Community Ecology Package (R package). Available at: https://github.com/vegandevs/vegan.
Palacios-Abrantes J., Frolicher T. L., Reygondeau G., Sumaila U. R., Tagliabue A., Wabnitz C. C. C., et al. (2022). Timing and magnitude of climate-driven range shifts in transboundary fish stocks challenge their management. Global Change Biol. 28, 2312–2326. doi: 10.1111/gcb.16058
Pawluk M., Fujiwara M., Martinez-Andrade F. (2021). Climate effects on fish diversity in the subtropical bays of Texas. Estuarine Coast. Shelf Sci. 249, 107121. doi: 10.1016/j.ecss.2020.107121
Pawluk M., Fujiwara M., Martinez-Andrade F. (2022). Climate change linked to functional homogenization of a subtropical estuarine system. Ecol. Evol. 12, e8783. doi: 10.1002/ece3.8783
Pecl G. T., Araujo M. B., Bell J. D., Blanchard J., Bonebrake T. C., Chen I. C., et al. (2017). Biodiversity redistribution under climate change: Impacts on ecosystems and human well-being. Science 355, eaai9214. doi: 10.1126/science.aai9214
Perry A. L., Low P. J., Ellis J. R., Reynolds J. D. (2005). Climate change and distribution shifts in marine fishes. Science 308, 1912–1915. doi: 10.1126/science.1111322
Pinsky M. L., Selden R. L., Kitchel Z. J. (2020). Climate-driven shifts in marine species ranges: Scaling from organisms to communities. Annu. Rev. Mar. Sci. 12, 153–179. doi: 10.1146/annurev-marine-010419-010916
Pörtner H. O., Peck M. A. (2010). Climate change effects on fishes and fisheries: Towards a cause-and-effect understanding. J. Fish Biol. 77, 1745–1779. doi: 10.1111/j.1095-8649.2010.02783.x
Rabosky D. L., Chang J., Title P. O., Cowman P. F., Sallan L., Friedman M., et al. (2018). An inverse latitudinal gradient in speciation rate for marine fishes. Nature 559, 392–395. doi: 10.1038/s41586-018-0273-1
R Core Team (2023). R: A language and Environment for Statistical Computing (Vienna, Austria: R Foundation for Statistical Computing).
Scott-Denton E., Cryer P. F., Duffy M. R., Gocke J. P., Harrelson M. R., Kinsella D. L., et al. (2012). Characterization of the U.S. Gulf of Mexico and South Atlantic penaeid and rock shrimp fisheries based on observer data. Mar. Fisheries Rev. 74, 1–27.
Spellerberg I. F., Fedor P. J. (2003). A tribute to Claude Shannon, (1916-2001) and a plea for more rigorous use of species richness, species diversity and the ‘Shannon-Wiener’ Index. Global Ecol. Biogeography 12, 177–179. doi: 10.1046/j.1466-822X.2003.00015.x
Todd P. A., Heery E. C., Loke L. H. L., Thurstan R. H., Kotze D. J., Swan C., et al. (2019). Towards an urban marine ecology: characterizing the drivers, patterns and processes of marine ecosystems in coastal cities. Oikos 128, 1215–1245. doi: 10.1111/oik.05946
Troia M. J., Perkin J. S. (2022). Can fisheries bioenergetics modelling refine spatially explicit assessments of climate change vulnerability? Conserv. Physiol. 10, coac035. doi: 10.1093/conphys/coac035
Wernberg T., Bennett S., Babcock R. C., de Bettignies T., Cure K., Depczynski M., et al. (2016). Climate-driven regime shift of a temperate marine ecosystem. Science 353, 169–172. doi: 10.1126/science.aad8745
Keywords: climate change, estuary, fish, Gulf of Mexico, nonmetric multidimensional scaling, subtropics
Citation: Torres Ceron M, Fujiwara M and Martinez-Andrade F (2023) Changes in species compositions of fish in the bays of the Northwestern Gulf of Mexico. Front. Mar. Sci. 10:1274771. doi: 10.3389/fmars.2023.1274771
Received: 08 August 2023; Accepted: 09 October 2023;
Published: 25 October 2023.
Edited by:
Cui Liang, Chinese Academy of Sciences (CAS), ChinaReviewed by:
Xiujuan Shan, Chinese Academy of Fishery Sciences (CAFS), ChinaXuehui Wang, Chinese Academy of Fishery Sciences (CAFS), China
Copyright © 2023 Torres Ceron, Fujiwara and Martinez-Andrade. This is an open-access article distributed under the terms of the Creative Commons Attribution License (CC BY). The use, distribution or reproduction in other forums is permitted, provided the original author(s) and the copyright owner(s) are credited and that the original publication in this journal is cited, in accordance with accepted academic practice. No use, distribution or reproduction is permitted which does not comply with these terms.
*Correspondence: Masami Fujiwara, ZnVqaXdhcmFAdGFtdS5lZHU=