 Morgane Le Saout
 Froukje M. van der Zwan
 Cora K. Schiebener1
 Nico Augustin
- 1Research Division 4 (RD4)-Dynamics of the Ocean Floor, GEOMAR Helmholtz Centre for Ocean Research Kiel, Kiel, Germany
- 2Earth Science and Engineering, Physical Science and Engineering, Red Sea Research Centre, King Abdullah University of Science and Technology (KAUST), Thuwal, Saudi Arabia
The mid-ocean rift in the Red Sea is one of the youngest rifting systems on Earth. Only recently, state-of-the-art methods and modern deep-sea instruments have been used to explore this young and unique volcanic system. During the first autonomous underwater vehicle surveys of the Red Sea Rift in Spring 2022, we collected multibeam bathymetry, backscatter, sub-bottom profiler data, and water column data over a 9 km long ridge segment in the Hadarba Deep between 22.49°N and 22.56°N to investigate the volcano-tectonic processes of this ultra-slow spreading segment (12 mm/year spreading rate). The high-resolution hydroacoustic data was used to (1) delineate and quantify the geometry of tectonic structures and individual lava flows, (2) define lava flow morphology and eruption style, (3) estimate relative ages of flows and features, and (4) retrace the evolution of the volcanic activity. In addition, the geochemistry of several young lava flows provides information on the relation between the different magma that supply these eruptions. About 90 eruptive units with variable sedimentary cover have been identified within the 43 km2 mapped region. The oldest lava flows are buried under 3 to 4.2 m of sediment, indicating ages of up to ~30 ka based on average sedimentation rate estimates (~14 cm/ka), while the youngest eruptions are covered by<10 cm of sediment, and are thus younger than 700 years. Three volcanic phases have been identified based on changes in flow morphology and distribution, and tectonic pattern. All three axial phases have an average eruptive frequency of ~100-250 years. The segment displays an overall low tectonic extension (<10% of the total extension) and low vertical offset. Our geomorphological maps, analyses, and statistics reveal a moderately faulted, ultra-slow spreading MOR segment in the Red Sea with a surprisingly large amount of magmatic extension, implying that the segment has been underlined by a large magma supply for at least 15 ka. All these observations provide valuable implications for the formation history of the Red Sea Rift and the formation of ultra-slow spreading crust.
1 Introduction
The mid-ocean ridge (MOR) system is the longest volcanic chain on Earth and the largest producer of new oceanic crust. Along MOR, accretionary processes are extremely variable, related to changes in spreading rate and magma supply (Perfit and Chadwick, 1998; Dick et al., 2003; Colman et al., 2012; Cannat et al., 2019; Chen et al., 2021). Magma production and thickness and volume of accretion of new oceanic crust increase with the spreading rate (Niu and Hékinian, 1997). In addition, at a constant spreading rate, changes in magma supply are known to affect eruption style, volume, frequency, and tectonic deformation directly responsible for the overall ridge morphology (i.e., axial high, axial valley). This is especially true along slow- and ultraslow-spreading systems (20-40 mm/yr and<20 mm/yr, respectively; Dick et al., 2003) where magma supply is strongly variable through time and unevenly distributed along the spreading segment (Schlindwein and Schmid, 2016), resulting in a wide range of axial morphologies. Periods of limited melt supply are associated with minimal volcanic activity and extensive tectonic extension with the development of deep, asymmetric axial valleys where exposed gabbro and exhumed upper mantle rocks are exposed, as seen in oceanic core complexes (Tucholke et al., 1998; Dick et al., 2003; Cannat et al., 2006; Smith et al., 2008; MacLeod et al., 2011; Escartín et al., 2017). In contrast, periods of enhanced magma supply can locally relate to those of faster-spreading segments (Chen et al., 2023). The melt generally focuses at the segment center, resulting in the construction of large axial dome-shape volcanoes or axial highs, with the emplacement of smooth lava flows (e.g., Escartín et al., 2014: Klischies et al., 2019).
Along both slow- and ultraslow-spreading segments, variability of the melt supply is estimated to follow a cycle of 150-500 ka (Cordier et al., 2010; Rioux et al., 2016; Klischies et al., 2019; Chen et al., 2021). However, due to the challenges of accurately mapping and dating eruptive events, little is known about the short-term evolution of MOR segments (hundreds to few thousand years) or the frequency of eruptions. Models, based on the thickness of the extrusive layer, spreading rate, and average flow volumes indicate that the interval of eruptions exceeds 1000 years on slow-spreading systems (Perfit and Chadwick, 1998; Sinton et al., 2002; Rubin et al., 2012), and could exceed 10,000 ka on ultraslow-spreading segments (Stubseid et al., 2023). However, such estimation is based on a steady-state magma supply and does not take into account variability occurring throughout the magmatic cycle. Geological mapping using high-resolution bathymetric surveys and backscatter, as well as the repeat of those surveys, are key in investigating volcanic events over short-time scales (e.g., Colman et al., 2012; Yeo, 2014; Clague et al., 2017).
Here, we present an analysis of high-resolution (<2 m) bathymetry and backscatter mosaics, sub-bottom profiles, and geochemical data collected within the Hadarba Deep in the Red Sea Rift. Mapping of eruptive units and tectonic features are combined with semi-automatic classification of seafloor roughness and backscatter to characterize and quantify tectonic and magmatic features and study their distribution on the axial high of a young ultra-slow spreading rift. Sediment thickness derived from backscatter mosaics and sub-bottom profiles are used to constrain the eruption time frames. This high-resolution study enabled to (1) assess the variation of the accretionary processes within the last 15 ka, by evidencing eruptive cycles associated with changes in effusion rate, and mode of emplacement, leading to different morphologies, and (2) investigate the frequency of the eruptions in an ultra-slow spreading young ocean context, which is, with a 100’s of years recurrence interval, faster than expected for (ultra)slow-spreading ridges.
2 Geological background
The Red Sea Rift (RSR, Figure 1A) is a young, ~2,250 km long, ultra-slow spreading rift with rates ranging from 8.3 to 14.5 mm yr−1 from North to South (Viltres et al., 2022). One particularity of RSR is the widespread Miocene evaporites overlaying most of the rift in the Northern Red Sea and in the shallow “Inter-Trough Zones” of the central region of the RSR (Izzeldin, 1987; Mitchell et al., 2010), making it difficult to investigate the basement. This has led to multiple interpretations of the nature of the underlying crust and the evolution of the rift. Indeed, several studies argue for a continuous spreading and formation of an oceanic crust since 13 to 15 Ma along the entire rift (e.g., Izzeldin, 1987; Sultan et al., 1993; Augustin et al., 2021; Delaunay et al., 2023; Mitchell et al., 2023). Others postulate that the oceanization is of much younger age (5 Ma; Issachar et al., 2023) and that the basement north of 19.5°N consists of a hyperextended continental crust punctuated by volcanic deeps (e.g., Bonatti, 1985; Ligi et al., 2011; Ligi et al., 2018; Le Magoarou et al., 2021; Saleh et al., 2021; Afifi et al., 2023; Sang et al., 2023). However, while the nature of the crust under the Miocene evaporites is up to debate, it is generally agreed that the uncovered crust, consisting of isolated bathymetric troughs and basins, the so-called “Deeps” in the central RSR consists of oceanic crust (e.g., Tramontini and Davies, 1969; Pautot, 1983; Bonatti, 1985; Haase et al., 2000; Augustin et al., 2014; van der Zwan et al., 2015; Ligi et al., 2018; Augustin et al., 2021; Mitchell et al., 2023; Sang et al., 2023).
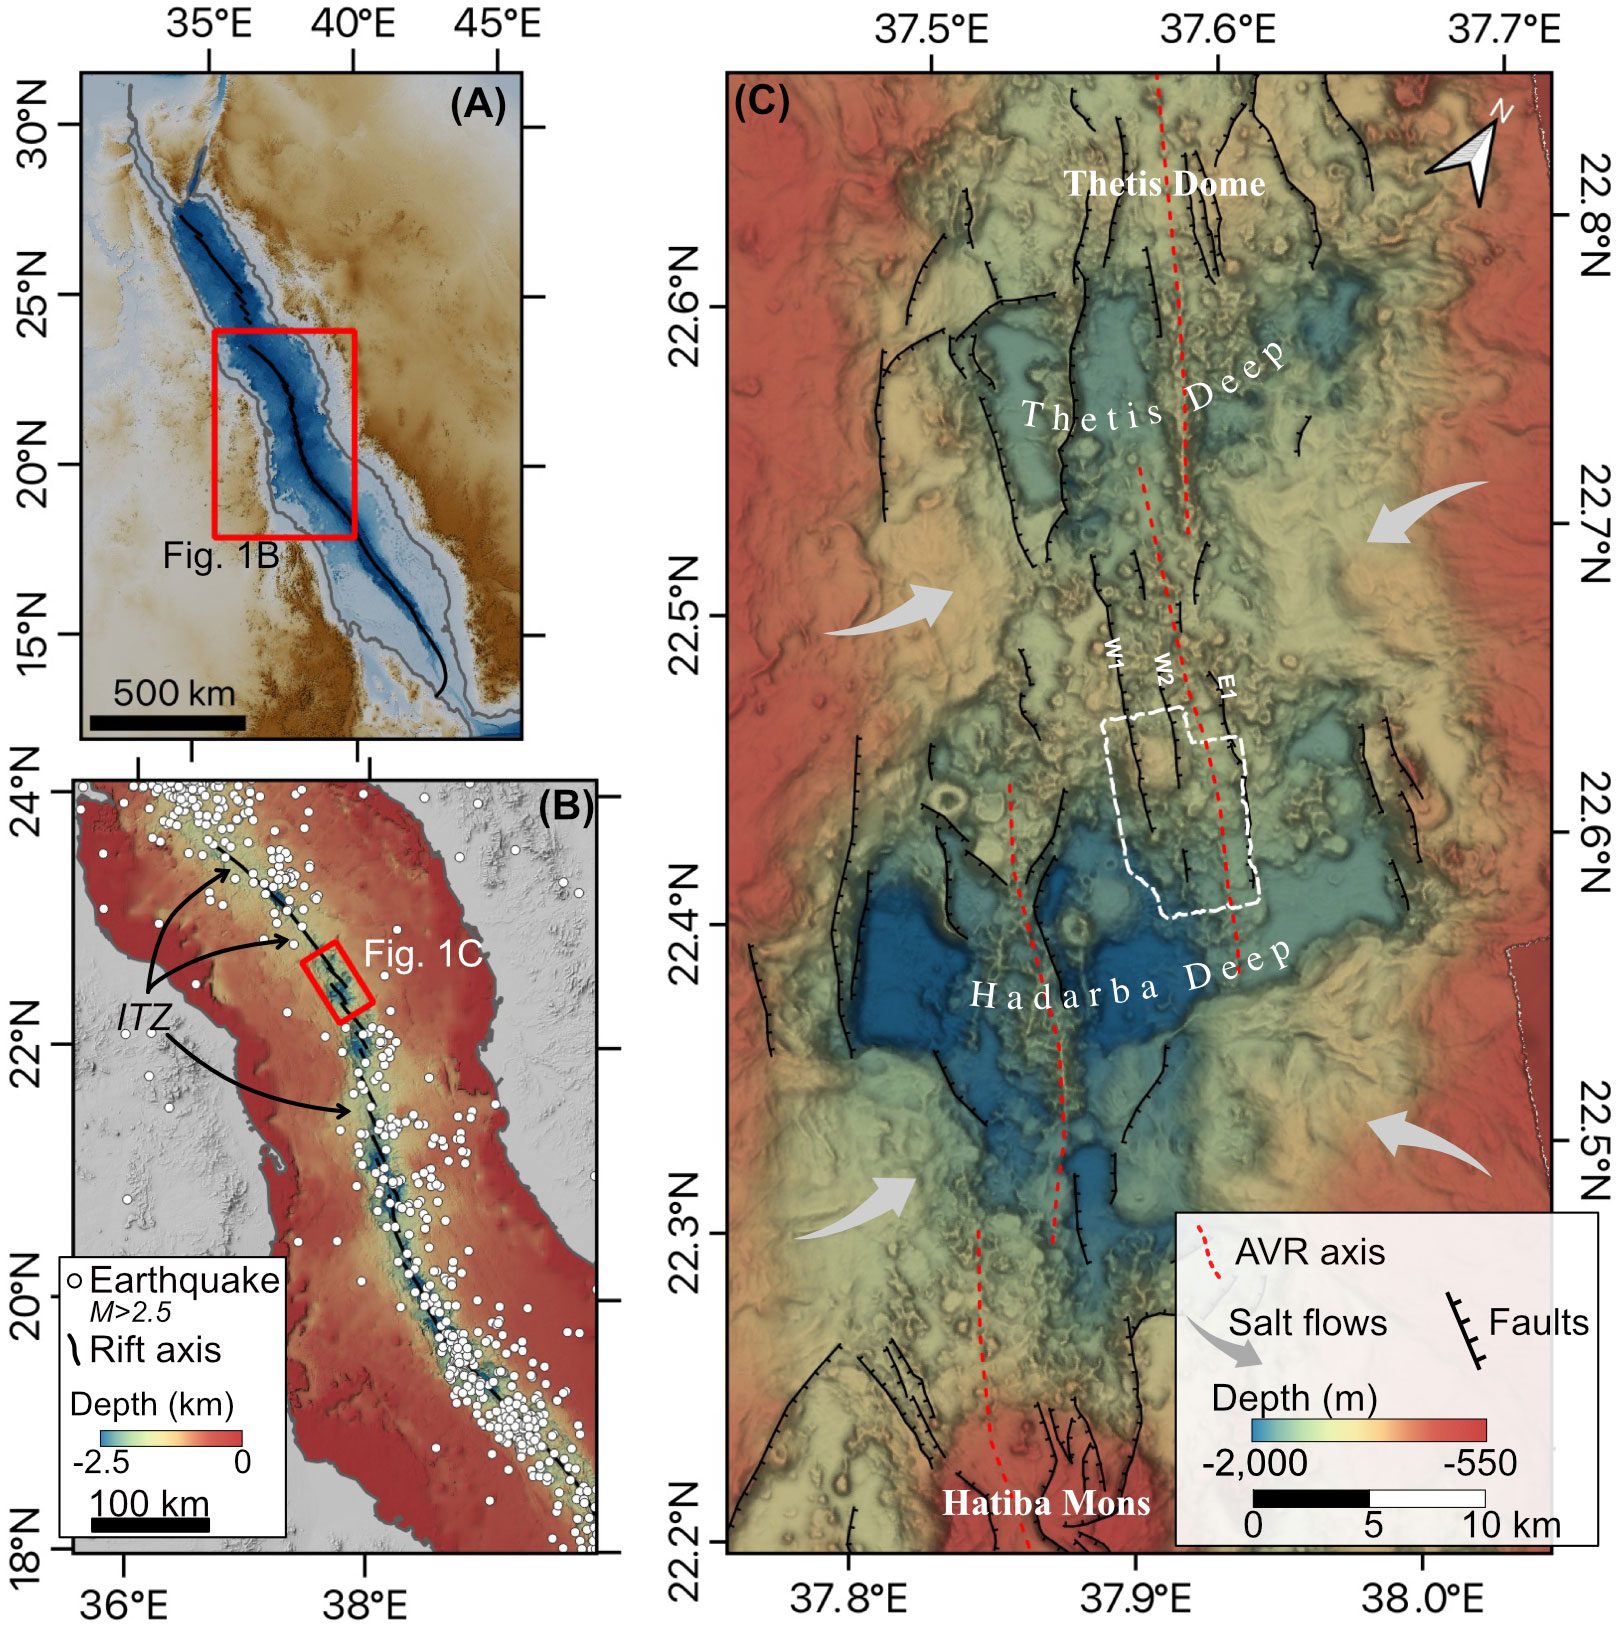
Figure 1 (A) GEBCO map of the Red Sea with locating the Red Sea Rift (black line). The red box locates the Figure 1B. (B) Map of the central Red Sea showing the distribution of the earthquake epicenters (M>2.5) between 1913 to 2023 (white dots). Data extracted from the International Seismological Centre (2023), On-line Bulletin, https://doi.org/10.31905/D808B830 (Adams et al., 1982; Storchak et al., 2017; Storchak et al., 2020). The intertrough zone (ITZ) are shown by arrows. Figure 1C is indicated by the red box. (C) Bathymetric map of the central Red Sea Rift from Thetis Dome to Hatiba Mons. The 60 m resolution data are from Ligi et al., 2015. The white dashed box indicates the position of the 2 m-resolution AUV-bathymetric survey of this study. The faults identifiable from the ship-based bathymetry are marked by black lines. The three main (western and eastern) faults crossing the study area are named W1, W2, and E1. Salt flows are indicated by white arrows.
In these locations, where the ridge axis is exposed and well-defined, the RSR consists of 103-174 km long 2nd-order spreading segments (Figure 1B; Augustin et al., 2016; Augustin et al., 2021). The axis displays numerous morphological features characteristic of slow- and ultraslow-spreading rates (Augustin et al., 2016; cf., Dick et al., 2003; Cannat et al., 2006; Carbotte et al., 2015): deep rift valleys, highly tectonized terrain including steep faults and rifted volcanoes, bent axial volcanic ridges (AVRs) with overlapping spreading centers and other 2nd order non-transform offsets, as well as focused magmatism in dome volcanoes or axial highs. However, ocean core complexes, with exposed peridotites and lower crustal rocks are, to our knowledge, absent from the RSR (Augustin et al., 2021). Only gabbro fragments of unknown tectonic origin were recently sampled in craters from Discovery Deep (central RSR), but are not associated with a core complex (Follmann et al., 2021). Despite being an ultra-slow spreading rift, the Red Sea is associated with a high heat flow (Girdler and Evans, 1977). Studies indicate the presence of bow-shaped, negative S-wave velocity anomaly originating from the Afar anomaly in the southern Red Sea, bending in the direction of the Arabian shield in the central Red Sea and back towards the RSR in the north, which may influence the amount and styles of volcanic activity along the RSR (Chang et al., 2011; Augustin et al., 2016). In addition, the young character of the Red Sea has been suggested to cause higher mantle temperatures (Brandl et al., 2013).
Hadarba Deep (Figure 1C) is located in the central RSR between 22.35°N and 22.55°N. Hadarba Deep lays at a depth of 1400 to 2350 m below sea level (mbsl) and consists of three sub-basins (west, central, and east) separated by two overlapping spreading segments. Volcanic activity along both segments has resulted in the formation of AVRs. The western AVR continues toward the south to the axial high, topped by the Hatiba Mons volcano (11.4 km base diameter, 530 m high), rising to a depth of 735 mbsl (Augustin et al., 2016; van der Zwan et al., in press). The eastern AVR prolongates north into an axial high with a depth of about 1400 mbsl, at the center of the segment between Thetis and Hadarba Deeps, which mark the respective ends of this segment (Figure 1C). High backscatter signals attest to recent volcanic activity along the eastern flank of this AVR (Augustin et al., 2016). This is consistent with the relatively low seismicity (Figure 1B) attributed to recent, high volcanic activity (Metz et al., 2013; Augustin et al., 2016) would attest to an increase in magmatic extension. Crustal thickness at Hadarba Deep is not well constrained: seismic experiments in the central Red Sea (Tramontini and Davies, 1969) indicate a crustal thickness of ~3.3 – 3.7 km along the western AVR of the Hadarba Deep, while crustal thickness estimated from gravimetry data indicates ~5 km in Hadarba Deep with a 1 km crustal thickness increasing to toward the north where the segment (or AVR) reaches its shallowest points (Ligi et al., 2015). Such variations are consistent with melts focusing at a segment center and in agreement with other ultra-slow spreading segments (Snow and Edmonds, 2007). Even so, the crust appears much thinner than some magmatically robust segments (e.g., ~9.5 km at the 50°29’E segment of the Southwest Indian Ridge; Cannat et al., 1999).
3 Data and methods
3.1 High-resolution bathymetry and backscatter
A high-resolution bathymetry and backscatter survey was carried out in February 2022 from the OSS Handin Tide using the 6000 m depth-rated Hugin Superior AUV (autonomous underwater vehicle) provided by FUGRO. The AUV was equipped with a Kongsberg EM2040 Mk2, 200 kHz multibeam echosounder, EdgeTech Subbottom profiler, a CTD (conductivity, temperature, and depth), and a USBL (ultra-short baseline) system for navigation. The AUV flew at a constant altitude of 90 m in bottom-following mode. The area mapped covers 42.7 km2 of the eastern AVR of Hadarba Deep and parts of its sub-circular axial high. The navigation data were post-processed in the software NavLab before being merged with the bathymetry data and post-processed using the software Qimera from QPS. The resulting computed grid has a cell size of 2 m (Figure 2A). Multibeam backscatter was mosaiced in QPS FMGT from the raw data and cleaned in Generic Sensor Format (.GSF) exports (Supplementary Figure 1). The final mosaic has a pixel size of 0.8 m.
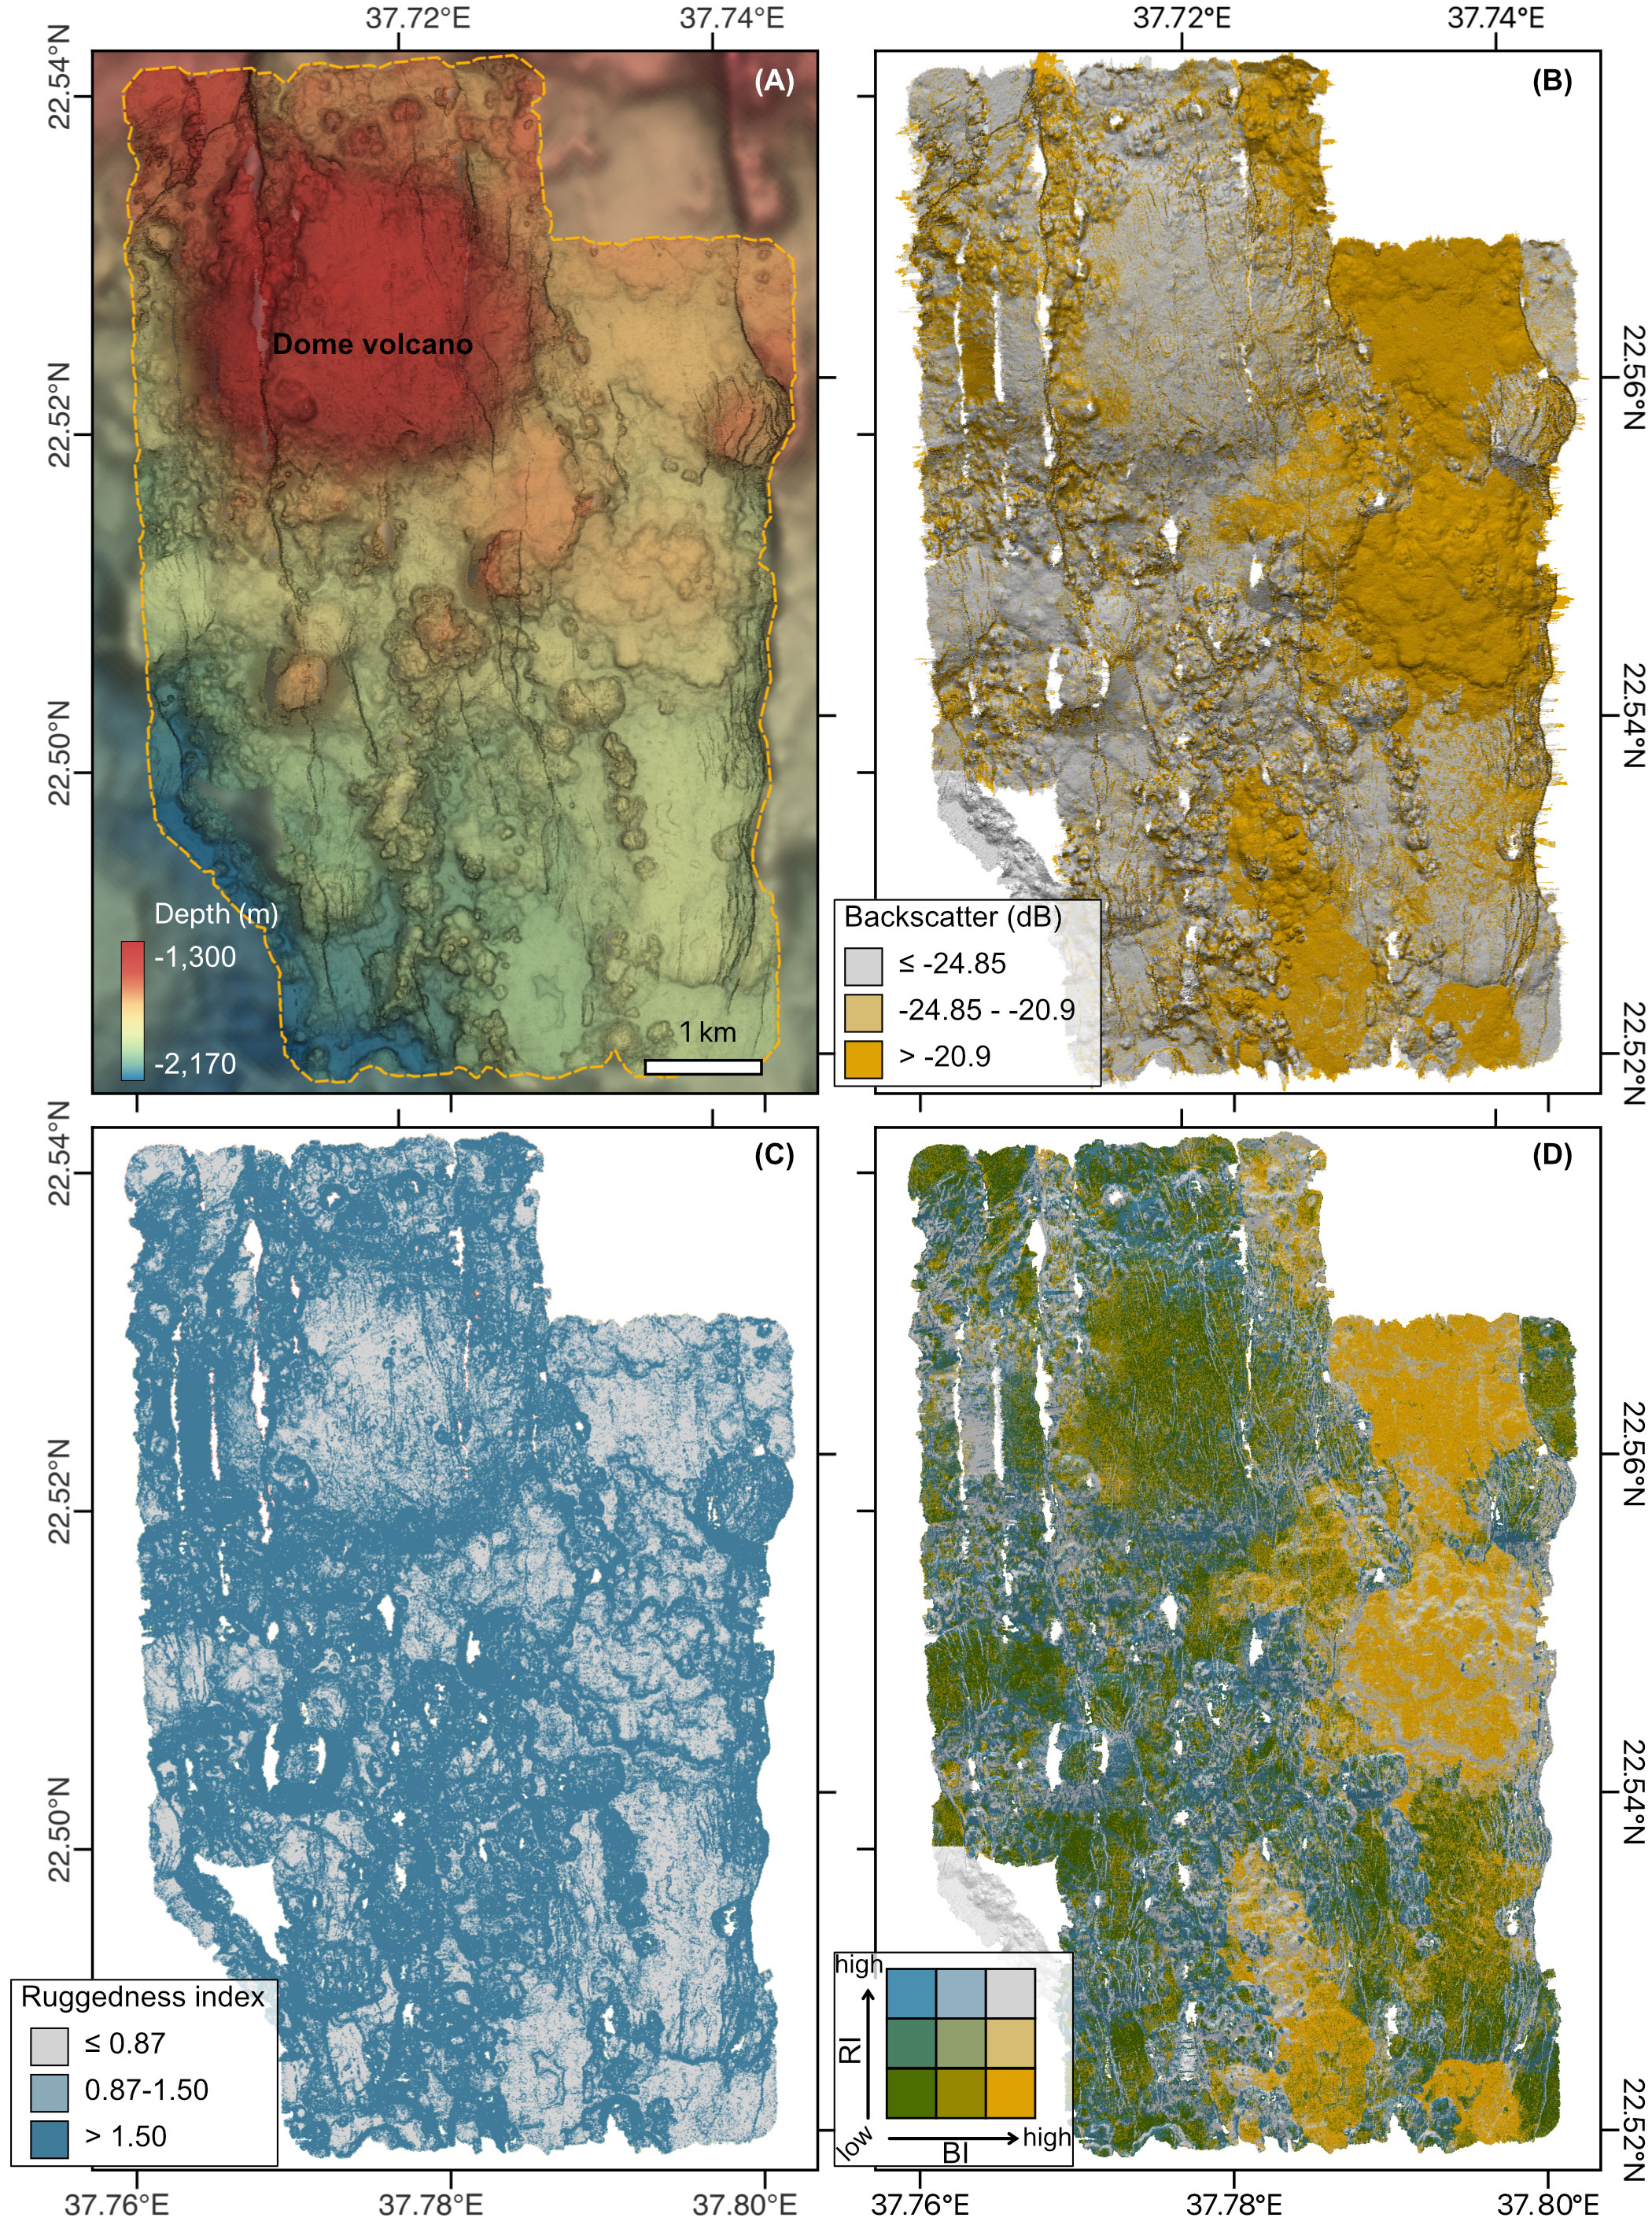
Figure 2 (A) High-resolution bathymetry of the eastern axial volcanic ridge of Hadarba Deep gridded with a 2 m resolution. (B) Map of the backscatter intensity (BI) classified using a quantile method. High BI (yellow) evidences hard terrain, while low BI indicates the presence of soft seafloor (i.e. sediments). (C) Map of the ruggedness index classified using a quantile method. Rough terrains are shown in dark blues, and smooth terrain in grey. (D) Bivariate choropleth map showing the combination of BI and RI.
3.2 Sediment thickness and age estimates
Sub-bottom profiles, with a vertical resolution of 10 cm (given by EdgeTech) were acquired along the AUV track and imported in SonarWiz 7 software from Chesapeake Technology to determine sediment thickness. Sediment thickness extracted from sub-bottom profiles is used to infer the age of the volcanic events. To avoid underestimation on steep slopes, or overestimation linked to sediment pounding, the sediment thickness was extracted from regions with relatively low variations in relief, with no significant change in sediment thickness. Sedimentation rates reported from the central and northern Red Sea are highly variable, as it experiences both pelagic sedimentation, dust input from the continents, and local turbidity currents. In the study area, sedimentation rates are not known, and in the absence of sediment cores, the sediment rate used in this study is estimated from the very limited reference data of the overall Red Sea. Here we apply an average sedimentation rate of 14 ± 3 cm/ka based on data from Stoffers and Ross (1974) and Kuptsov and Palkina (1986). The resolution limit of 10 cm of the sub-bottom profiler is used to infer the maximum age of eruptive units not displaying sediments in the profiles. Where no sediment thickness was determined, relative ages between eruptive units are determined based on the stratigraphic relationships between lava flows, patterns of fracture distribution, and geometry at the flow front as well as backscatter intensity (BI).
3.3 Tectonic features delineation and tectonic strain estimates
Tectonic features are manually digitized based on the bathymetry, derive slope map and backscatter mosaic. Faults are digitized following the fault crest, and fissures are digitized following their centerlines. Tectonic density is calculated using the “Kernel Density estimation” feature of SAGA Next Gen in QGIS using a search radius of 500 m and a pixel size of 10 m.
The tectonic strain was estimated along axis-perpendicular profiles, spaced roughly 500 m apart (Supplementary Figure 2), based on the measurements of fissure width (W), vertical fault throw (D), and dip (α). Fissure width was measured on the backscatter mosaic. Indeed, small fissures (< 4 m wide) are not clearly evidenced in the bathymetric data, and the fissure width is generally overestimated due to the effect of data resolution and interpolation. Fault throw (D) is defined as the depth difference between the top and bottom of the scarp, determined at the slope break with the surrounding seafloor. Fault dip α is defined as the maximum slope value along the scarp to avoid underestimation associated with the presence of mass wasting and/or post-faulting lava flows, along the fault scarp (see method Figure 2 in Le Saout et al., 2022). Horizontal fault heave (H) associated with individual fault is calculated by the equation:
The tectonic strain (Ts) along profiles is then calculated from the equation:
where Htot is the cumulative horizontal heave (H and W) along a profile, and L is the length of profiles.
3.4 Eruptive unit delineation and classification
Here eruptive units are defined as one flow or several lava flows with similar morphology, emplaced at similar times, therefore corresponding to a given eruptive sequence (Chen et al., 2021). Eruptive units are manually digitized based on abrupt changes in seafloor morphology, flow direction, backscatter intensity, and/or tectonic pattern using the bathymetric map, its derived products (e.g., slope, ruggedness index), and the backscatter mosaic.
Each individual eruptive unit is given a dominant morphology determined from the quantile classification of the ruggedness index (RI) calculated using the “Terrain Ruggedness Index” feature of SAGA Next Gen in QGIS with a search radius of 4 (Figure 2C) and a relative sediment cover based on backscatter intensity (BI, Figure 2B). The seafloor is subdivided into three RI categories: smooth (RI< 0.87), moderately rough (RI: 0.87 to 1.5), and rough (RI > 1.5). Based on BI, the seafloor is classified as: not to slightly sedimented (BI > -20.9 dB), moderately sedimented (BI: -20.9 to -24.85 dB), and fully sedimented (BI< -24.85 dB). Using RI and to a lower-level BI, the eruptive units have been classified into 4 categories: Smooth terrains are dominated by low RI and medium to low sediment cover, i.e., high backscatter (Figure 2D, yellow-light green). The often-flat surface displays lava channels, collapses, and tumuli, while their lava front generally consists of rough seafloor. Sedimented terrains are also dominated by low RI but are characterized by low BI (Figure 2D, dark green). Hummocky terrains are dominated by a high RI, and often form elongate ridges (Figure 2D, light to dark blue). Smooth hummocky terrains are used to describe terrains with a moderate RI. Both hummocky and smooth-hummocky terrain are independent of BI. Flat-topped seamounts constitute a fifth class. They are subcircular, monogenetic edifices (Clague et al., 2000), with smooth-flat tops and rough flanks, that have been classified based on these specific characteristics, independent from BI and RI. Bias in the classification method can come from the proportion of faults and fissures that will increase the calculated RI, and thus the proportion of hummocky terrain, but also increase BI and provide lower apparent sediment cover. However, deformation is relatively low and appears to affect mainly rough terrains.
The volume of eruptive units is calculated assuming a pre-existing horizontal base whose depth is determined by the average depth of the lava flow fronts or by the depth of collapses for enclosed lava flows. The volume is calculated between this surface and the mapped seafloor depth. Due to the assumption of the horizontal base, volumes of lava flow burying pre-existing edifices tend to be overestimated, while eruptive units filling pre-existing depressions are likely to be underestimated. This method also does not account for hollow features in the lava flows (lava tunnels). Nevertheless, a simple positive or negative difference of 1 m would result in volume variations of only 0.3 to 2.5x 10⁶ m3, thus <4% of the estimated volume for all except two of the studied lava flows. These two thin lava flows (S3 and S4) have an uncertainty of up to 25% of the estimated volume.
3.5 Geochemical analysis
Lava fragments of 5 locations on different young lava flows were collected by wax corer. Major elements analyses were carried out with a Jeol JXA-8200 ‘‘Superprobe’’ electron microprobe at GEOMAR, Kiel using an acceleration voltage of 15 kV. Major elements of the glasses were measured with a defocused spot of 5 µm and a beam current of 10 nA. Counting times were 20/10 s (peak/background) for Si, Al, Mg, Ca, Na and P, 30/15 s for Ti, Fe, K, S and Cl and 40/20 s for Mn and F. The average was taken of 12 analyses per sample with 3 analyses for 4 glass chips to assure homogeneity. Mineral point analyses of plagioclase (Pl), clinopyroxene (Cpx) and olivine (Ol) were measured with a beam current of 20 nA and a focused beam spot for Pl, and 1 µm spot for Cpx and Ol. For all elements counting times of 20/10 s were used, apart for Ti and K in Pl and Ti and Cr in Cpx and Ol (30/15 s). For calibration and monitoring of data quality, we used natural reference samples from the Smithsonian Institute (Jarosewich et al., 1980). Relative analytical precision is generally <2.5%, but for the glasses up to 20% for MnO, P2O5 and Cl and up to 30% for SO3 and F; for Pl up to 10% for FeO, MgO and K2O and 25% for TiO2 and for Cpx and Ol up to 25% for MnO and Cr2O3 and up to 75% for K2O and NiO.
4 Results
The study area is located in the eastern region of the Hadarba Deep and encompasses the 24.5 km long 2nd order, eastern segment of Hadarba Deep from its segment center to its southern end (Figures 1, 2). In this region, this ridge segment forms the eastern branch of an overlapping offset with the western AVR in Hadarba Deep that propagates southwards toward Hatiba Mons.
4.1 Fault and fissure geometry and pattern
The 2 m AUV bathymetry reveals numerous faults (n=498) and fissures (n=1488) (Figures 3; Table 1) not detectable on the ship-based bathymetry (Figure 1). Faults are 25 to 3033 m long, averaging 231 m, and the fault scarps have vertical throws ranging from 1 to 130 m, averaging of 20.7 m (Figure 3B), with maximum apparent fault dips ranging from 7° to 85° (mean value: 52°, median value: 54° and maximum dip frequency: 70°; Figure 3C). The major vertical offsets are concentrated on three faults (up to 130 m high) that delineate three long, parallel, major bathymetric steps that extend beyond the AUV data coverage (from west to east: W1, W2 (east dipping), and E1 (west dipping; Figure 3A) and can be delineated on the ship-based bathymetry up to 7.5 km north of the mapped area (Figure 1). This distribution of the deformation resulted in the development of a 3.6-4.5 km wide graben between W1 and E1 (here referred as axial valley), with a 1.5-1.8 km wide inner graben between W2 and E1. Most of the remaining faults are located within this axial valley between W1 and E1, and distributed along those bathymetric steps forming elongated fault systems, as shown by the fracture density map (Figure 3A). Fault scarps are dominantly east-facing (304 east-facing vs. 196 west-facing), but west-facing faults have on average larger vertical throw (27.0 vs 18.0 m respectively; Table 1). In contrast, the fissures (10–780 m long, 1.7 to 15 m wide, and up to 7.7 m deep) show no significant pattern and have generally no correlation with these fault systems. Faults and fissures are dominated by a 142.3° ± 27.36°N orientation, almost orthogonal to the spreading direction [42.9 ± 2.9°N at 22.5°N/37.75°E (Argus et al., 2011); Figure 3A]. While some faults and fissures are oblique to the general trend (i.e., at the northwest corner or on the flat-topped seamount SM4; Figure 4A), their low number does not affect the mean azimuth.
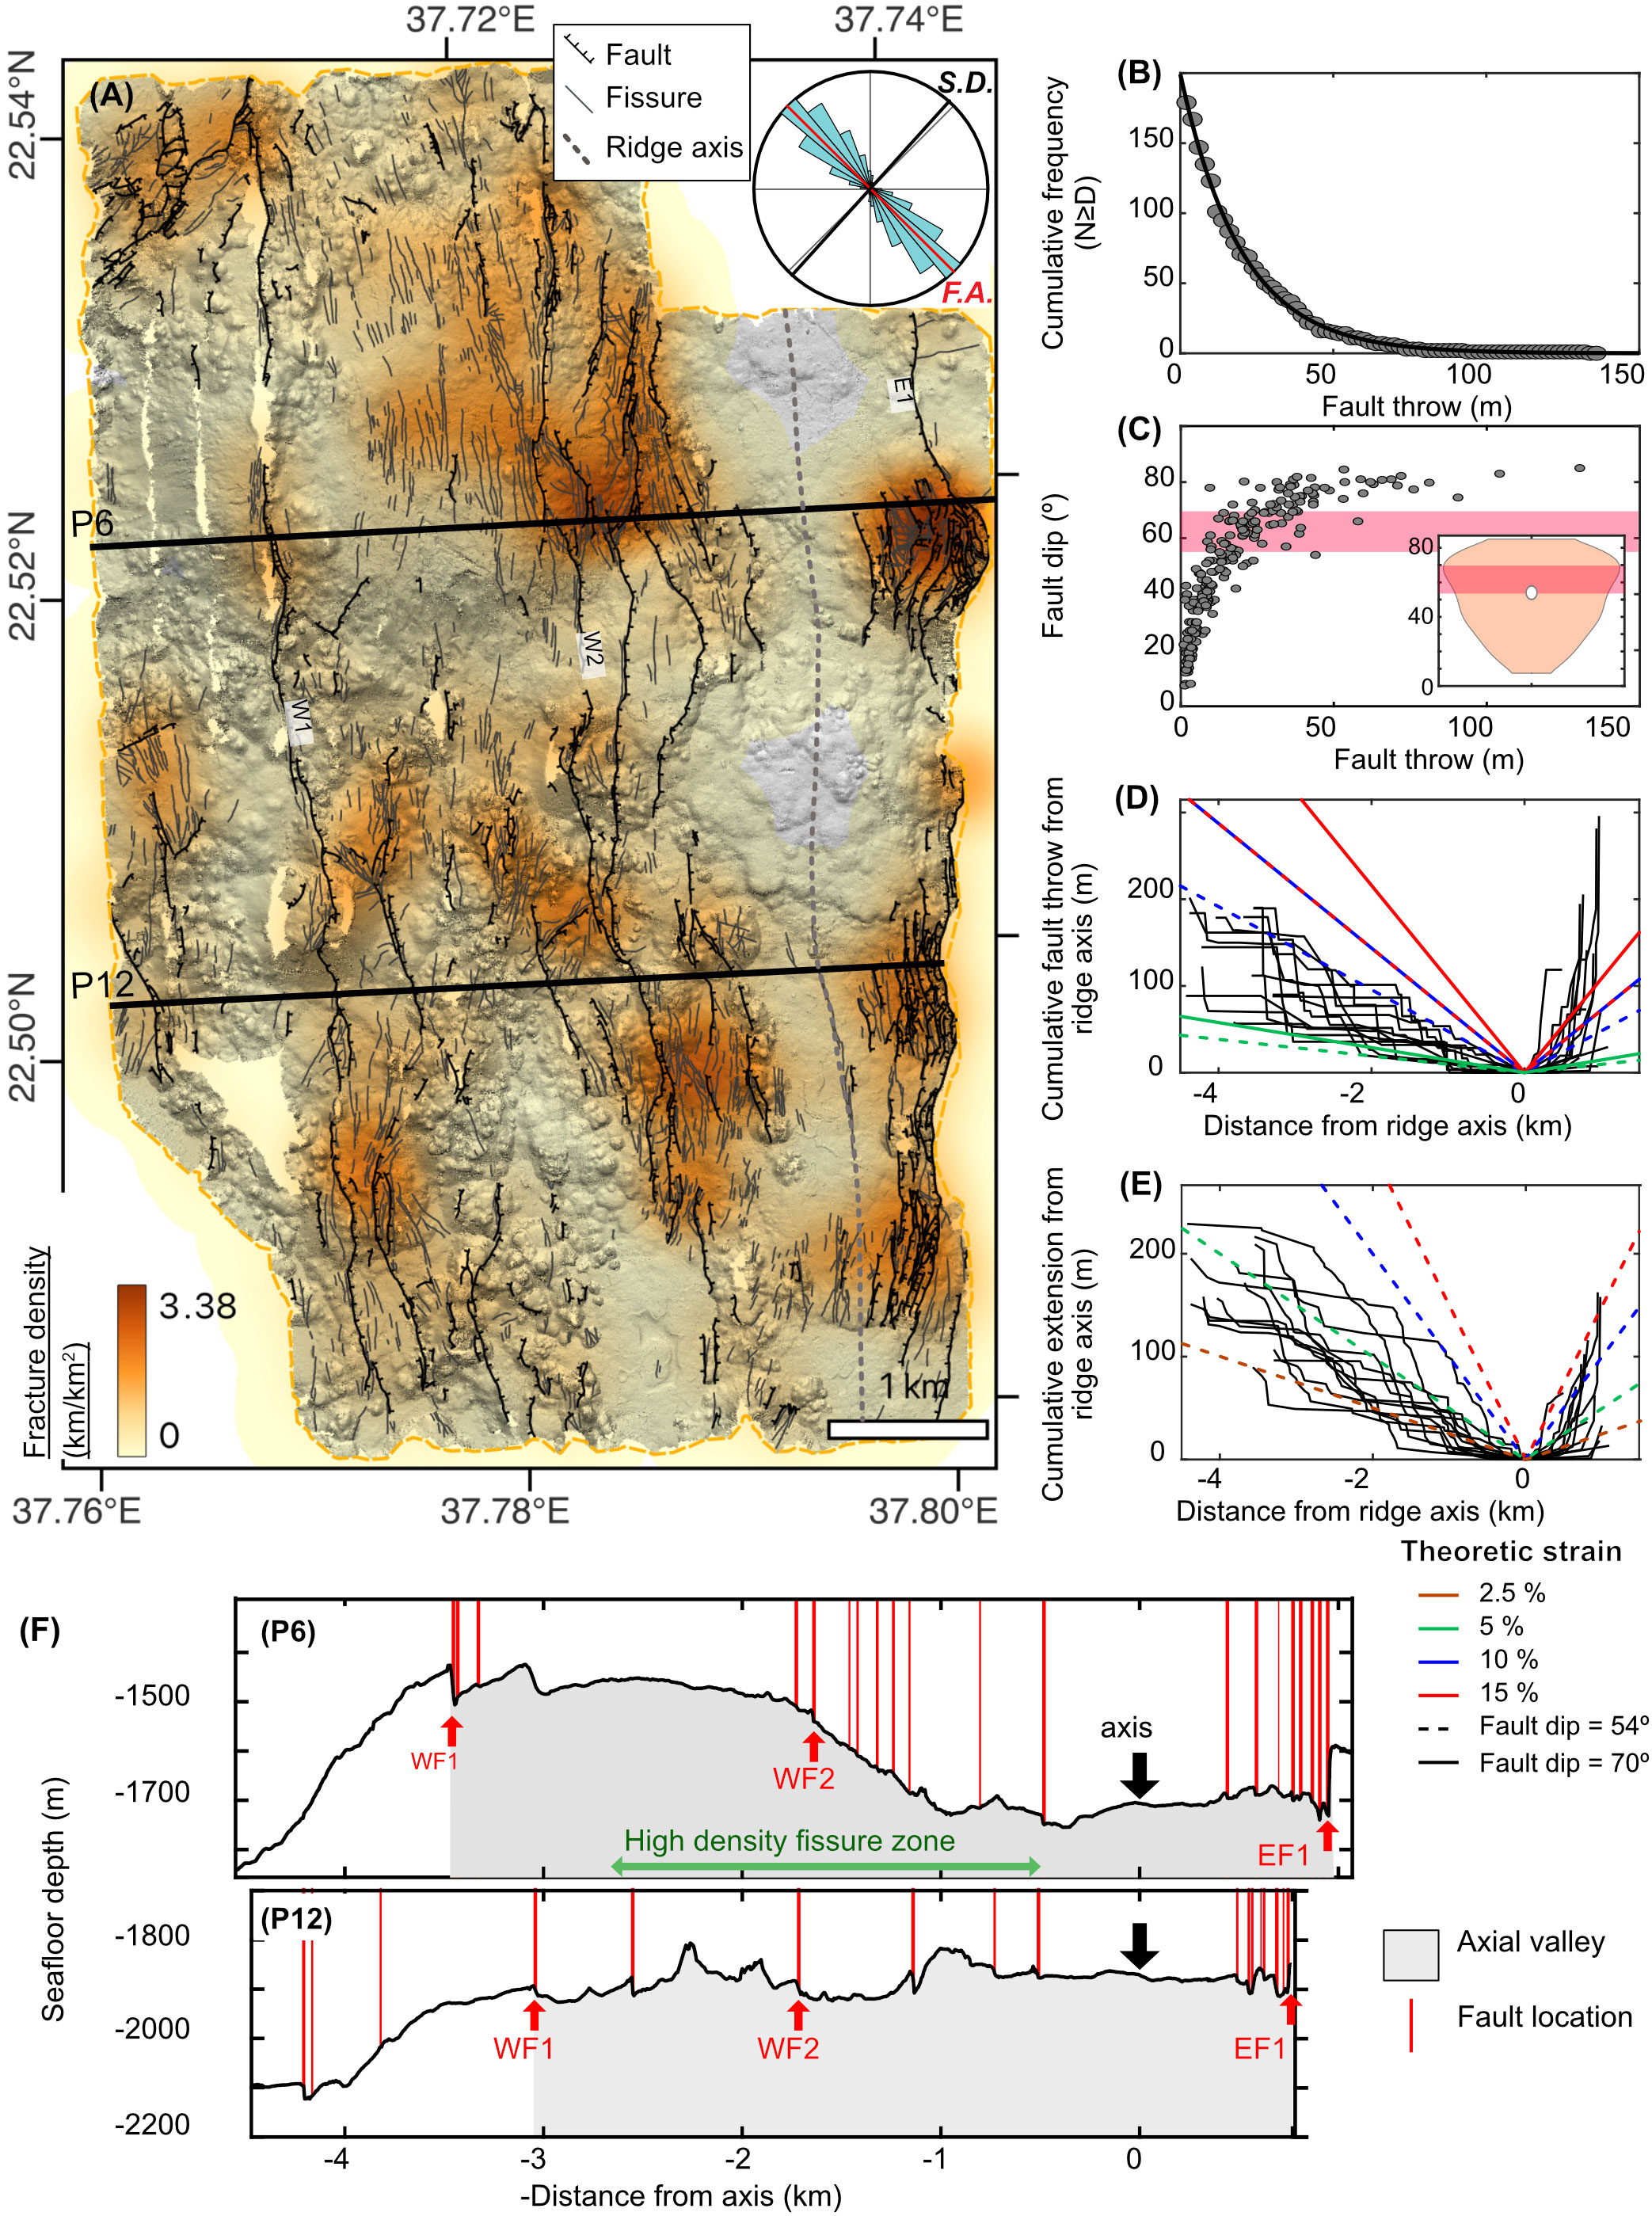
Figure 3 (A) Fracture density map calculated as a kernel density with a grid size of 10 m and a search radius of 500 m. Faults are marked by black lines with the dipping direction. Fissures are shown in grey. The estimated current ridge axis is indicated by a dashed grey line. The rose diagram in the top right corner indicates the azimuth distribution of the fracture. The mean azimuth of the fractures (F.A. = 142.3°N) is indicated by a red line, and the spreading direction (S.D. = 42.9°N; Argus et al., 2011) is indicated by the bold black line. (B) Cumulative frequency of the fault throw (N=180) binned by 2 m along 17 profiles perpendicular to the ridge axis (Figure S2). The exponential fit follows a power law (y= 199.2-0.05024x, with a r2 of 0.9982. (C) Cumulative fault throws measured along P4-P8 and P10-P17 (Profiles Figure S2) from the estimated spreading axis (0 km). The theoretical cumulative fault throw, for tectonic strain of 5%, 10% and 15% is indicated in green blue, and red respectively for a dip of 54° (dash line) and 70° (strait line). (D) Cumulative extension (faults and fissures), calculated with a dip angle of 70°, along P4-P8 and P10-P17 from the estimated spreading axis (0 km). Dash lines represent a 2.5% (brown), 5% (green), 10% (blue), and 15% (red) theoretical tectonic strain estimated with a fault dip of 70°. (E) Bathymetric profiles of P6 and P12. The axial valley is colored in grey with the proposed axis indicated by a downward-facing arrow. Faults are located by red lines and the region of intense fissuring is highlighted in green.

Table 1 Fracture statistics, and tectonic strain.
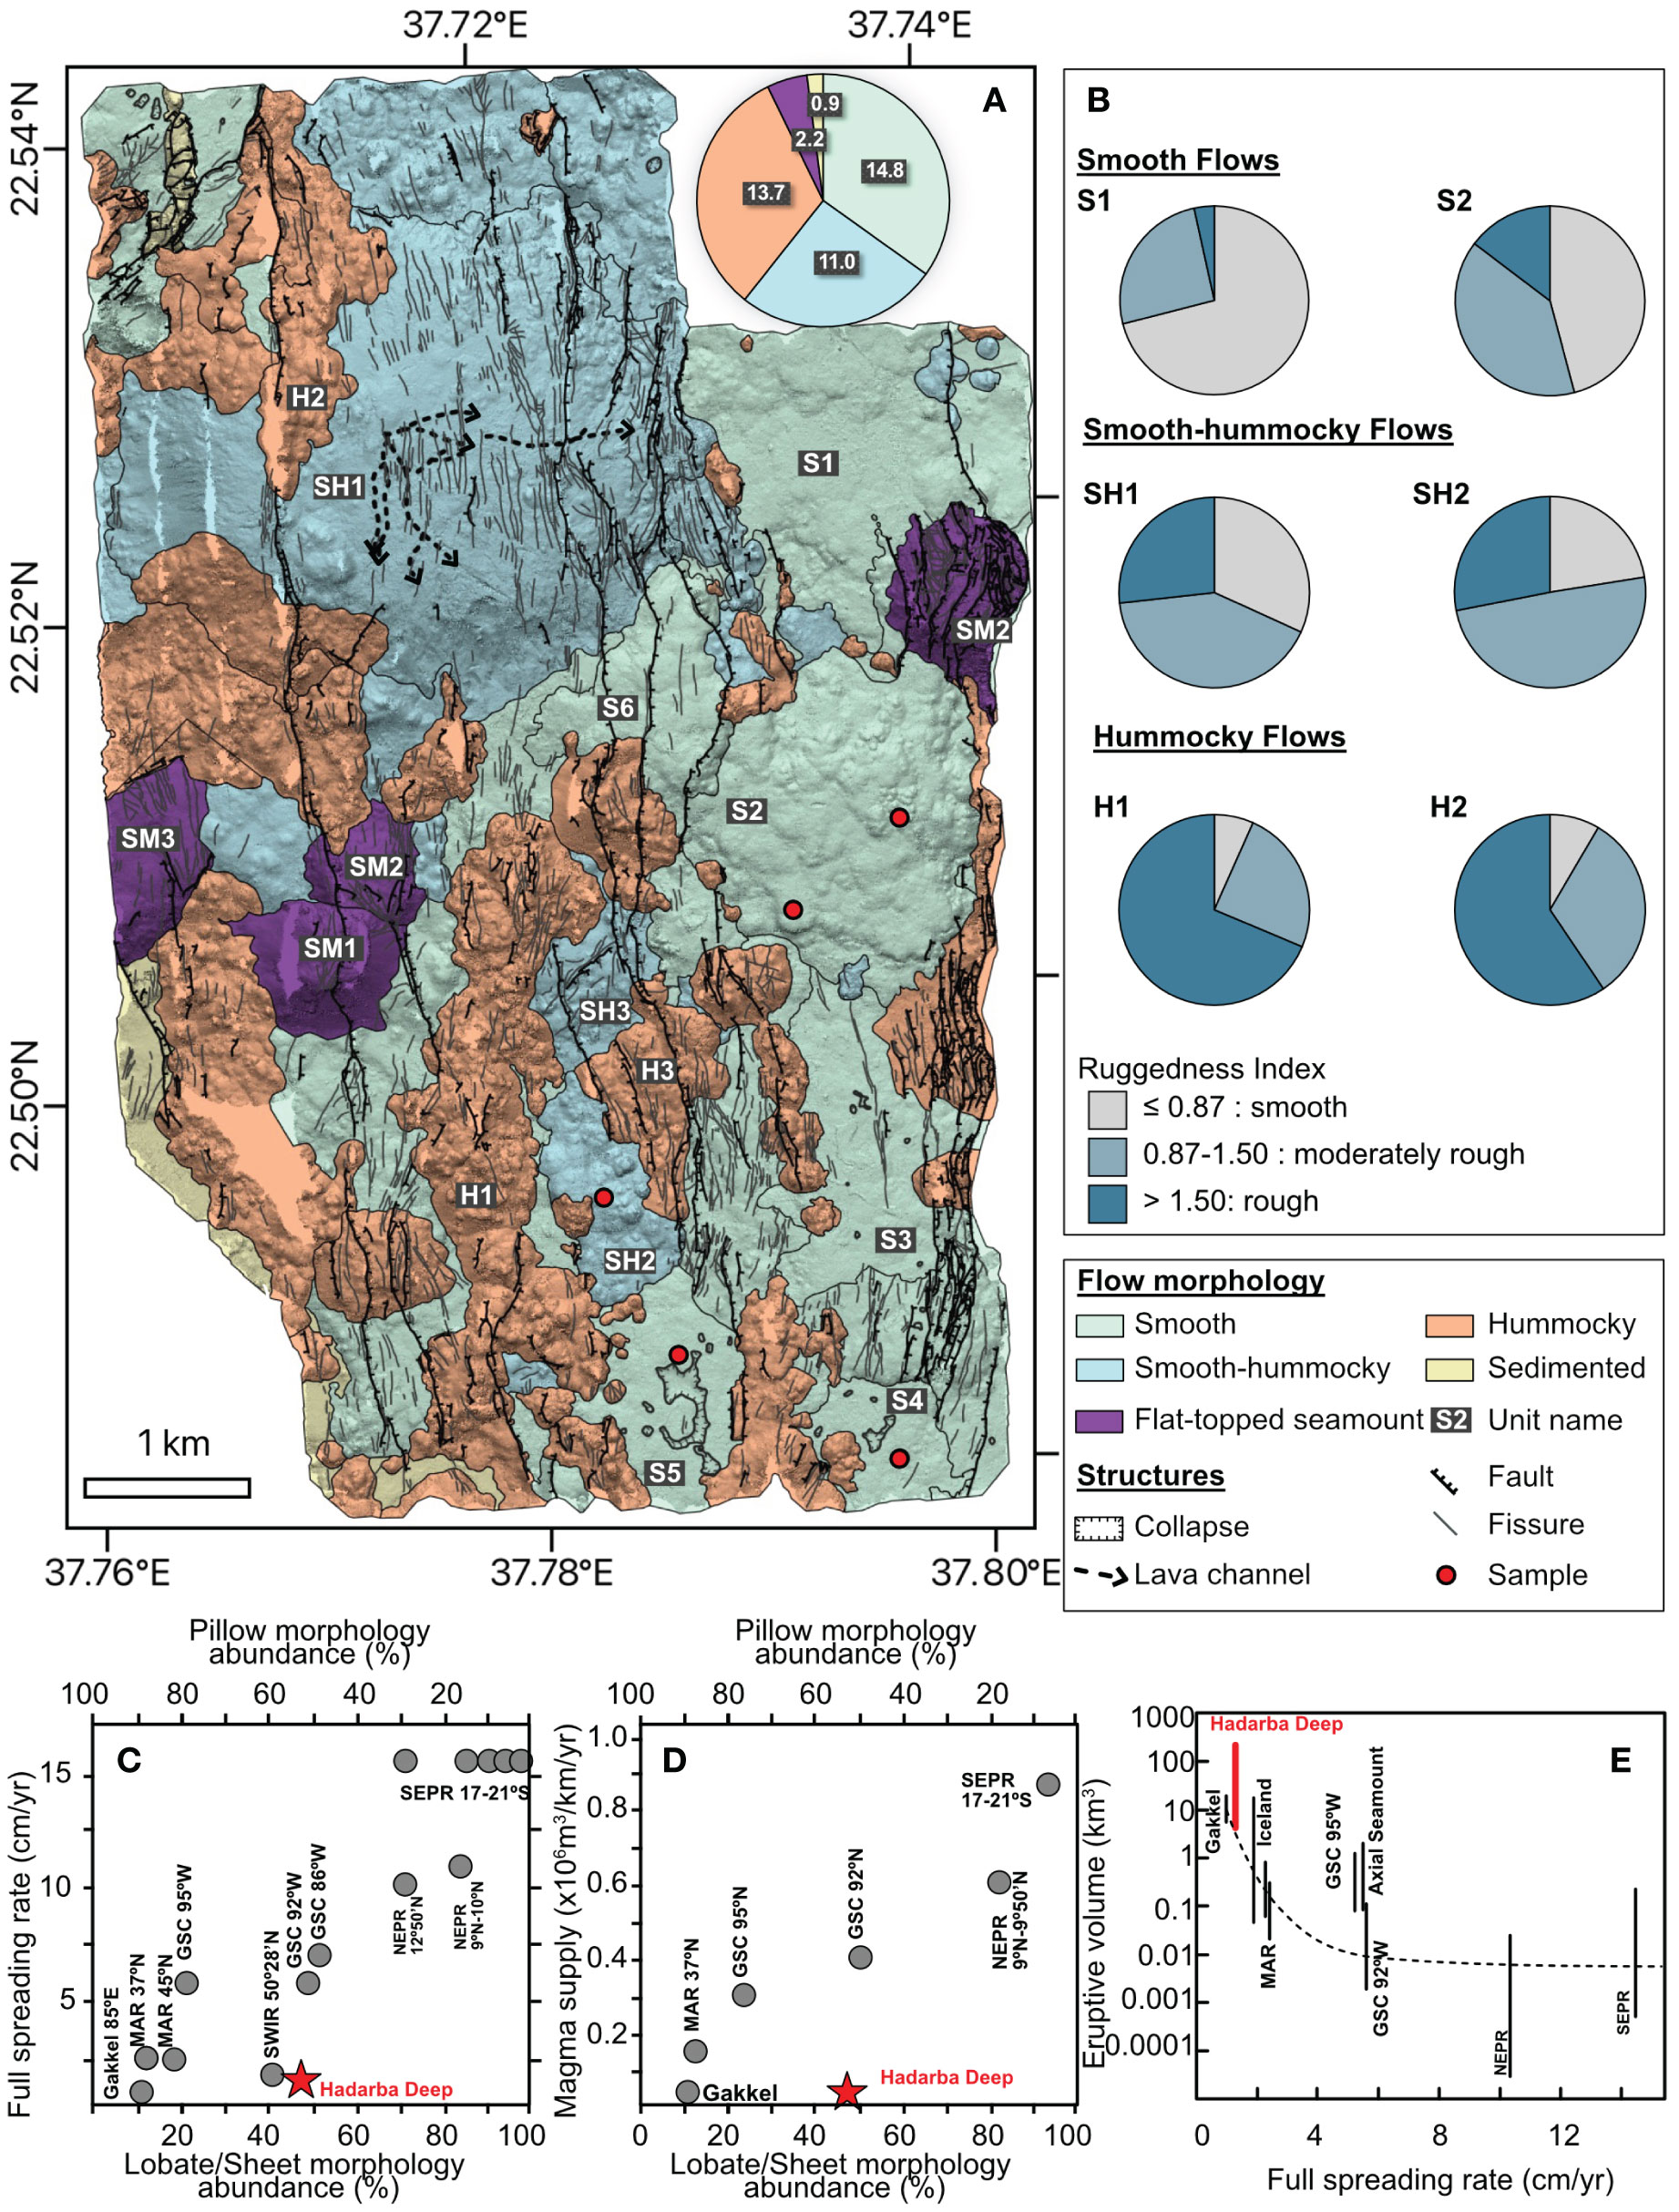
Figure 4 (A) Geomorphological interpretation of the AUV bathymetry showing the dominant morphology of individual eruptive units, the faults and fissures (black and grey line (respectively) as well as lava channels (dashed arrows), and collapses. The red dots indicate the wax corer samples locations. The lava flows with estimated volume are named on the map. The pie diagram indicates the proportion of each morphology. (B) Example of the proportion of the different classes of ruggedness index of six eruptive units. (C) Relative abundances of lava flow morphologies along the global MOR system with respect to the spreading rate (modified from Chen et al., 2021). Data from this study are shown by the red star. (D) Relative abundances of lava flow morphologies with respect to the magma supply [calculated as crustal thickness x spreading rate; after Sinton et al. (2002)]. Figure modified from McClinton et al., 2013. (E) Range of volumes produced during single eruptive episodes as a function of the spreading rate. Data from Colman et al. (2012); Rubin et al. (2012); Tan et al. (2016), and Clague et al. (2017).
4.2 Tectonic strain
The tectonic strain, estimated along thirteen axis-perpendicular profiles (P4-P8 and P10-P17 from north to south in Figure S2) is shown in Table 1. Cumulative fault throws and, thus tectonic extension were measured within the axial valley, between the top of E1 and W1 fault scarps (Figure 3B). No values were determined along profiles P1-P3 and P9, as they do not capture W1 in their profiles. The calculated apparent extension between E1 and W1 ranges between 2.5% and 11.1%, depending on the profile and the value used for the dip (measured, mean (54°) or most common (70°); Table 1 and Figure 3C). In the absence of a well-defined spreading axis, as can be seen on fast- and some intermediate-spreading segments (e.g., Chadwick and Embley, 1998), the ridge axis is estimated at the center of the graben delineated by W2 and E1, corresponding to the axis of the youngest lava flows and fitting to a change in direction of the major faults (see section 4.3 and Figure 4) to evaluate the extension of the western and eastern side. Figures 3D, E show a clear asymmetry in accommodation of the extension between East and West sides of the ridge axis. Indeed, a similar amount of extension is accommodated over a shorter distance on the east side of the axis, e.g., 100 m of horizontal extension is accommodated over a length of 0.7-1 km on the east versus 1-3.2 km on the west side of the axis (Figures 3D, E). This is clearly evidenced by the overall higher tectonic strain side of the ridge (Figure 3E). The asymmetry is also reflected in the style of the deformation with a larger amount of fissure on the west side of the ridge, which is also shown by the difference between cumulative fault throw and cumulative extension.
4.3 Eruptive units
In total, 90 eruptive units have been identified based on their distinct morphology, tectonic pattern, and/or sediment thickness. Individual flow units vary from 4.6x10² to 6.4x10⁶ m2, of which 41 have a surface exceeding 2x10⁵ m2 (Figure 4; Table 2). Eruptive units consisting of smooth terrains are the most common type (27 eruptive units covering a total surface of 14.8 km2 or ~34.7% of the mapped area). Smooth terrains are observed all over the mapped area; however, they are dominant in the east between W2 and E1. 37% of the smooth eruptive units display lava flow collapses (15 to 600 m in diameter) or inflated structures such as tumuli. Hummocky terrains are the second most common morphology, with 41 eruptive units over a surface of 13.7 km2 (32.2%). They are mainly located in the southwest section of the mapped area forming either elongated units up to 4.2 km long or small individual cones. Smooth-hummocky terrains, with a total of 14 units over 11.0 km2 (25.8% of the mapped area), are mostly observed in the northwest. This category includes SH1, which covers most of the surface of a large dome volcano (3.5 km in diameter; Figure 2A). Flat-topped seamounts are rare, only 4 seamounts covering a surface of 2.2 km2 (5.2% of the mapped area) were identified. They occur along W1 and E1 and west of the axial valley. A small portion of the mapped seafloor (< 1 km2 or<2.1%) has both high RI and low BI (< -26 dB outside of tectonic structures) with no evidence of volcanic structures (i.e., collapses and tumuli). They are considered as sedimented terrains and are only observed south and west of W1, thus outside of the axial valley.
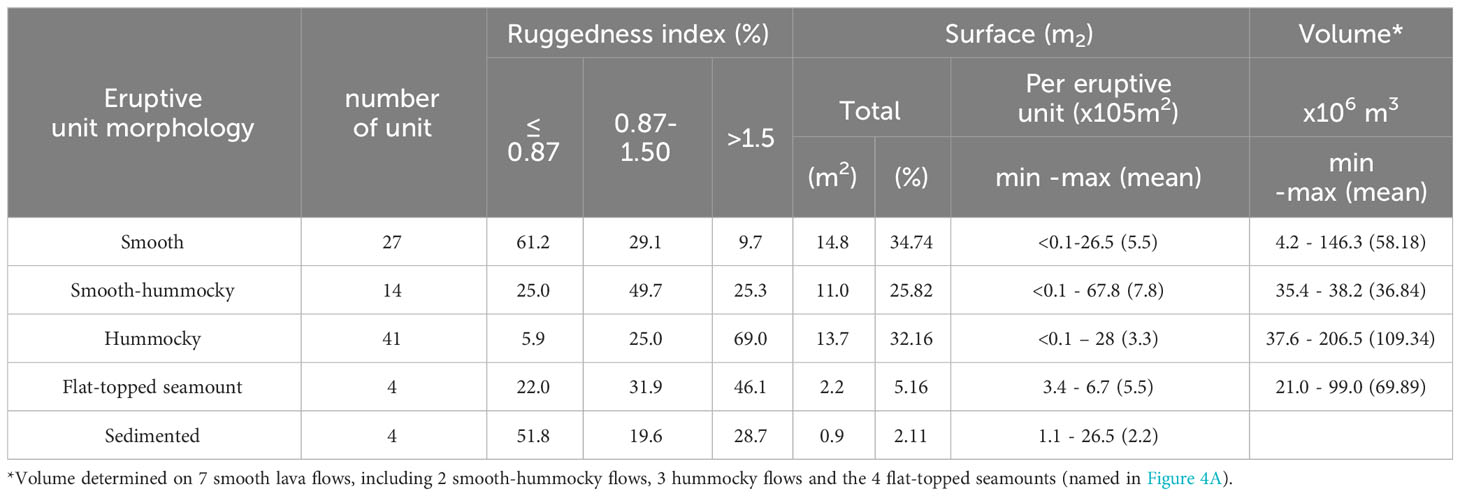
Table 2 Eruptive units’ characterization.
The eruptive volumes have been determined for sixteen eruptive units characterized by either well-defined flow front or deep collapses enabling estimates of flow thickness. These selected eruptive units are labeled in Figure 4A. Eruptive volumes of 4.2x10⁶ to 146.4x10⁶ m3 have been calculated for smooth eruptive units, 35.45x10⁶ to 38.22x10⁶ m3 for smooth-hummocky units, and 37.6x10⁶ to 206.6x10⁶ m3 for hummocky eruptive units. The four flat-topped seamounts have volumes estimated at 21x106 to 99x106 m3 (Table 2). Several of the measured flows are only partially mapped (i.e., S1, S4, S5, and SH3); thus, their calculated volume is most likely underestimated.
4.4 Lava flow composition
Rock fragments were collected from units S2 (2 locations: from the central cone (S2-c) and the rim (S2-r) of the lava field), S4, S5, and SH2. The glass and mineral chemistry is presented in Figure 5 and Supplementary Table 1. Glasses are of typical mid-ocean ridge basaltic composition and span a narrow range, falling within the fields defined by literature samples of surrounding Red Sea Deeps (Thetis, Hadarba, and Hatiba Deep; Ligi et al., 2012; van der Zwan et al., 2015; van der Zwan et al., 2023a); Figure 5 and Supplementary Table 1). While most of the glasses are homogeneous, sample SH1 shows two distinct compositions for 2 glass chips each (SH2a and SH2b), indicating local variations (within the 30 cm of wax core sampling). These variations within one sample location, as well as the variation within unit S2 (S2-c and S2-r), is larger than the variation between the different lava flows (Figure 5). The samples lay on a fractional crystallization trend of decreasing SiO2 (50.44-49.99 wt%), Al2O3 (14.00-13.24 wt%) and CaO (11.51-10.47 wt%), and increasing TiO2 (1.75-2.32 wt%), Na2O (2.67-2.82), K2O (0.14-0.20 wt%), P2O5 (0.13-0.21 wt%) SO3 (0.32-0.38 wt%) and Cl (0.01-0.04 wt%) with decreasing MgO (6.15-6.82 wt%). Proxies for melt degree (Na8), depth of melting (Fe8), mantle source variation (K/Ti) and hydrothermal influence (Cl/K), are all very homogenous between the samples and fall within the Red Sea fields defined by literature samples (Figures 5B, C; Supplementary Table 1).
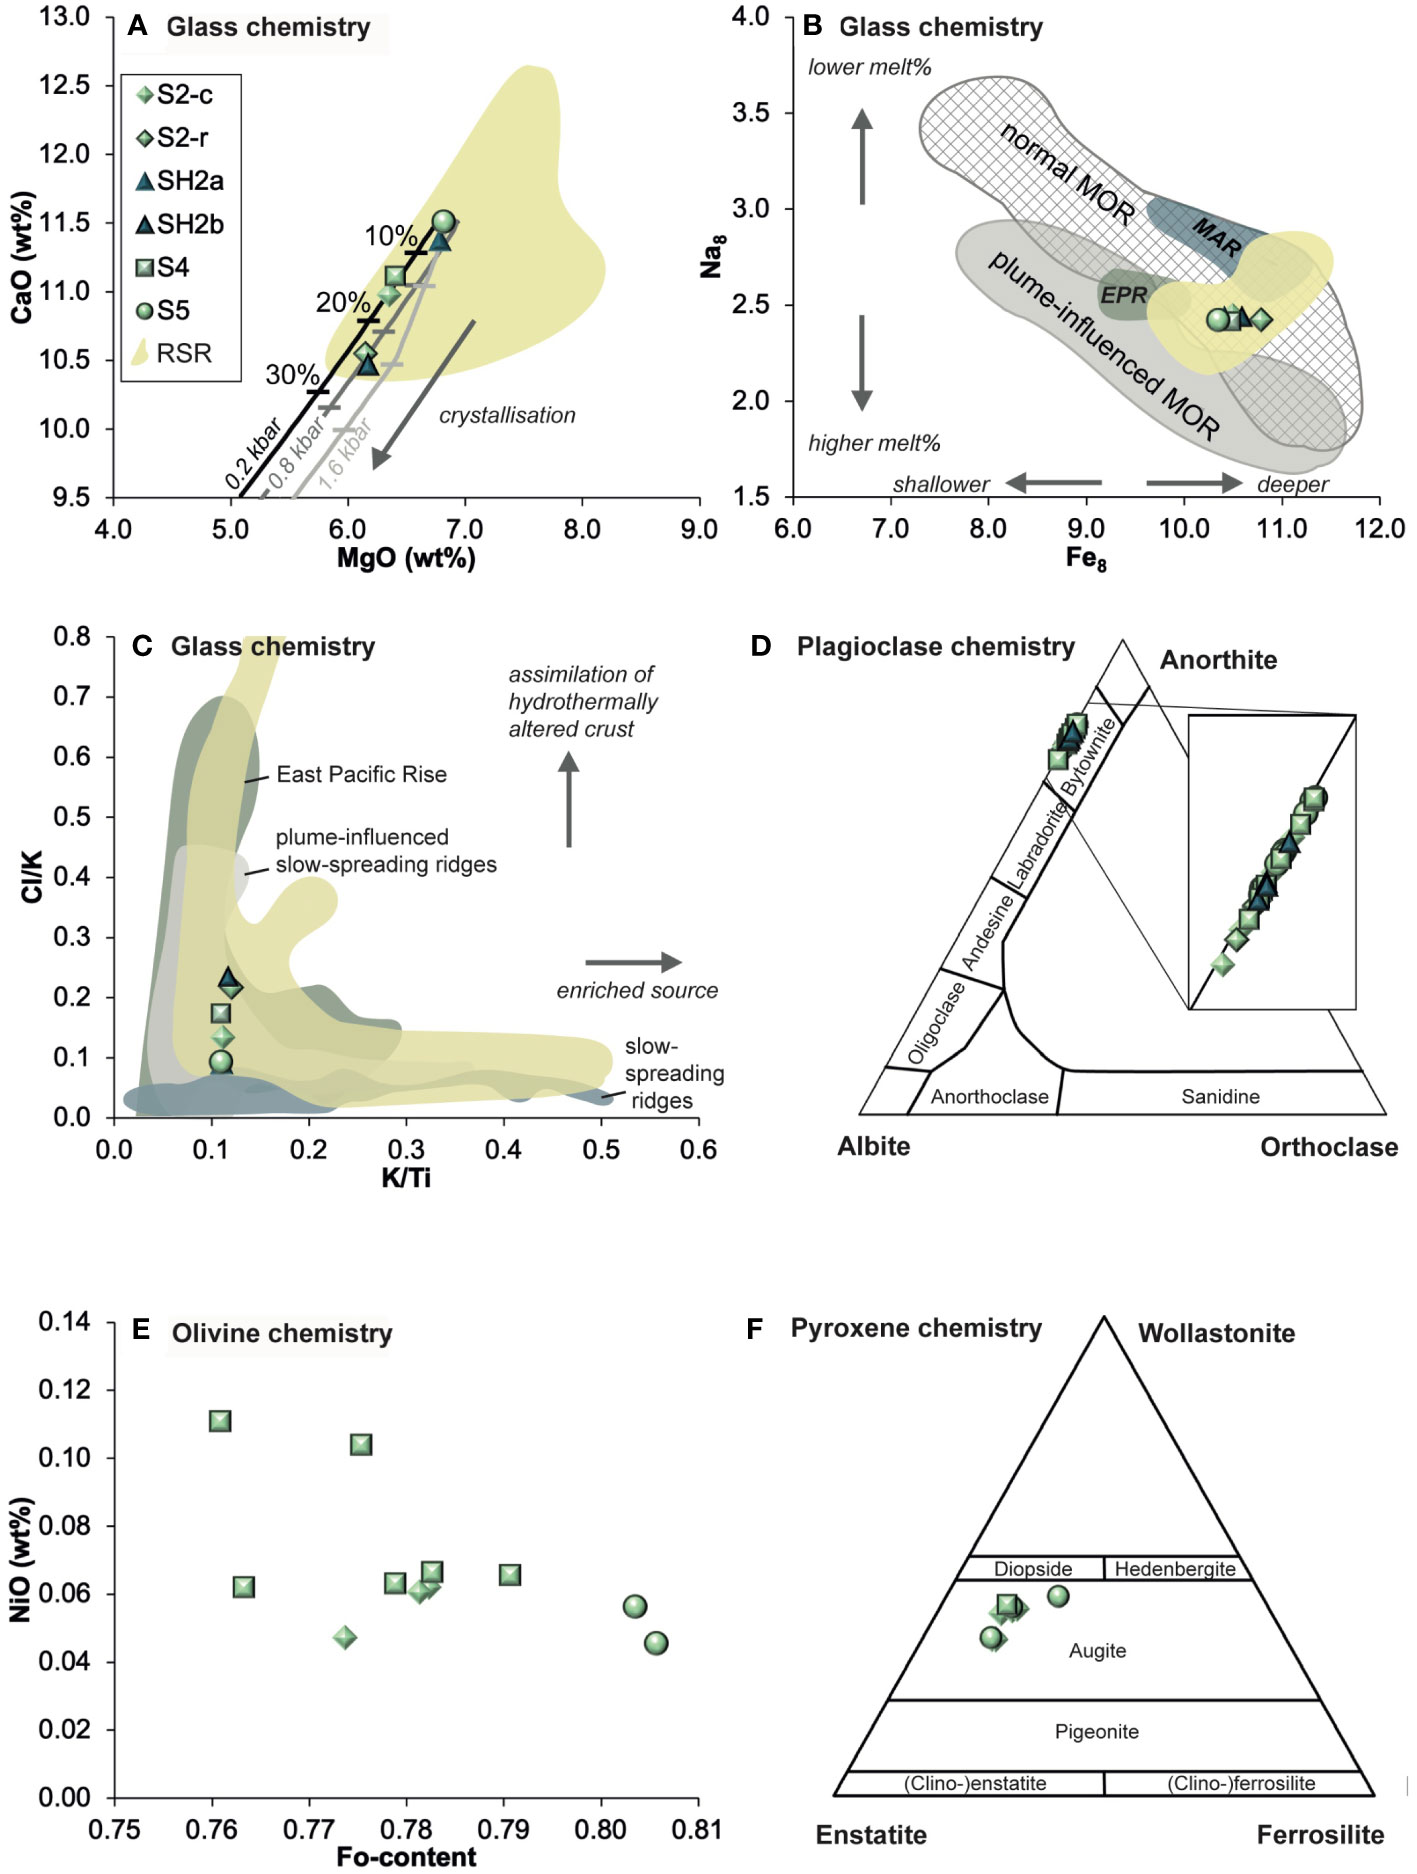
Figure 5 Chemistry of wax corer samples of lava flows S2 center (S2-c), S2 rim (S2-r), SH2 (2 compositions), S4 and S5. (A) Glass CaO composition (wt%) shows a decrease with MgO (wt%) and all samples overlap with literature data from Thetis-Hadarba-Hatiba Trough (RSR field; Ligi et al., 2012; van der Zwan et al., 2015; van der Zwan et al., in press). Petrolog3 crystallisation paths are indicated for pressures of 0.2, 0.8 and 1.6 kbar, calculated with S5 as starting composition, the models of Danyushevsky and Plechov, 2001, for olivine, plagioclase and clinopyroxene, and a QFM buffer. Markings indicate 10% crystallization. (B) Glass composition for Na8 and Fe8 as proxies for melt degree and depth – the Hadarba samples overlap with the RSR field and normal MORB, in between fields defined by samples of the Mid-Atlantic Ridge 23-32°N (MAR) and the East Pacific Rise (EPR) from Langmuir et al., 1992. (C) The Cl/K (proxy for assimilation of hydrothermal crust) and K/Ti (proxy for mantle source fertility) compositions of the Hadarba glasses fall on the lower end of the field defined by Red Sea samples (van der Zwan et al., 2015). (D) Plagioclases have a consistent bytownite composition (E) Olivines samples are all in a narrow range in Fo and NiO content. (F) Pyroxenes have an Augite composition.
Small plagioclase minerals (0.02-1 mm in size) are present in all samples and have a bytownite composition, with limited anorthite (An) content variations between An75-An82. This variation can be observed within a sample, and plagioclase compositions between samples are indistinguishable (Figure 5D). Pyroxenes and olivines are observed in samples S2-c, S4, and S5 as microlites of 0.1-0.2 mm. Olivines have forsterite (Fo) contents of Fo76 – Fo81, while the clinopyroxene have an augite composition (Figures 5E, F). Similar as the plagioclases, the clinopyroxene, and olivine compositions overlap between samples.
4.5 Sediment thickness
Due to the rough terrain, sediment thickness could only be extracted from 40 positions with low relief and constant sediment thickness along the AUV sub-bottom profiles (Supplementary Figure 3), characterizing 21 of the eruptive units. Measured sediment thickness ranges from 0.4 ± 0.1 to 4.2 ± 0.1 m (Figure 6A). Three of the eruptive units have sediment thicknesses below the limit of detection of the sub-bottom profiles, thus< 10 cm. Completely sedimented regions are found to be covered by more than 1.4 ± 0.1 m of sediments. Hummocky terrains have sediment thicknesses ranging from 0.8 ± 0.1 to 2.1 ± 0.1 m but are generally more than 1.6 ± 0.1 m, while smooth terrains cover the full ranges of data from <10 cm (below resolution limit) to 4.2 ± 0.1 m of sediments. The large volcanic dome has measured sediment thickness ranging from 1.2 ± 0.1 to 3.7 ± 0.1 m, with relatively constant sediment thickness on its summit (1.2-1.6 ± 0.1 m) and a general increase observed in its flanks without clear evidence of change in flow units. Sediment thickness estimates are in correlation with variations in backscatter intensity.
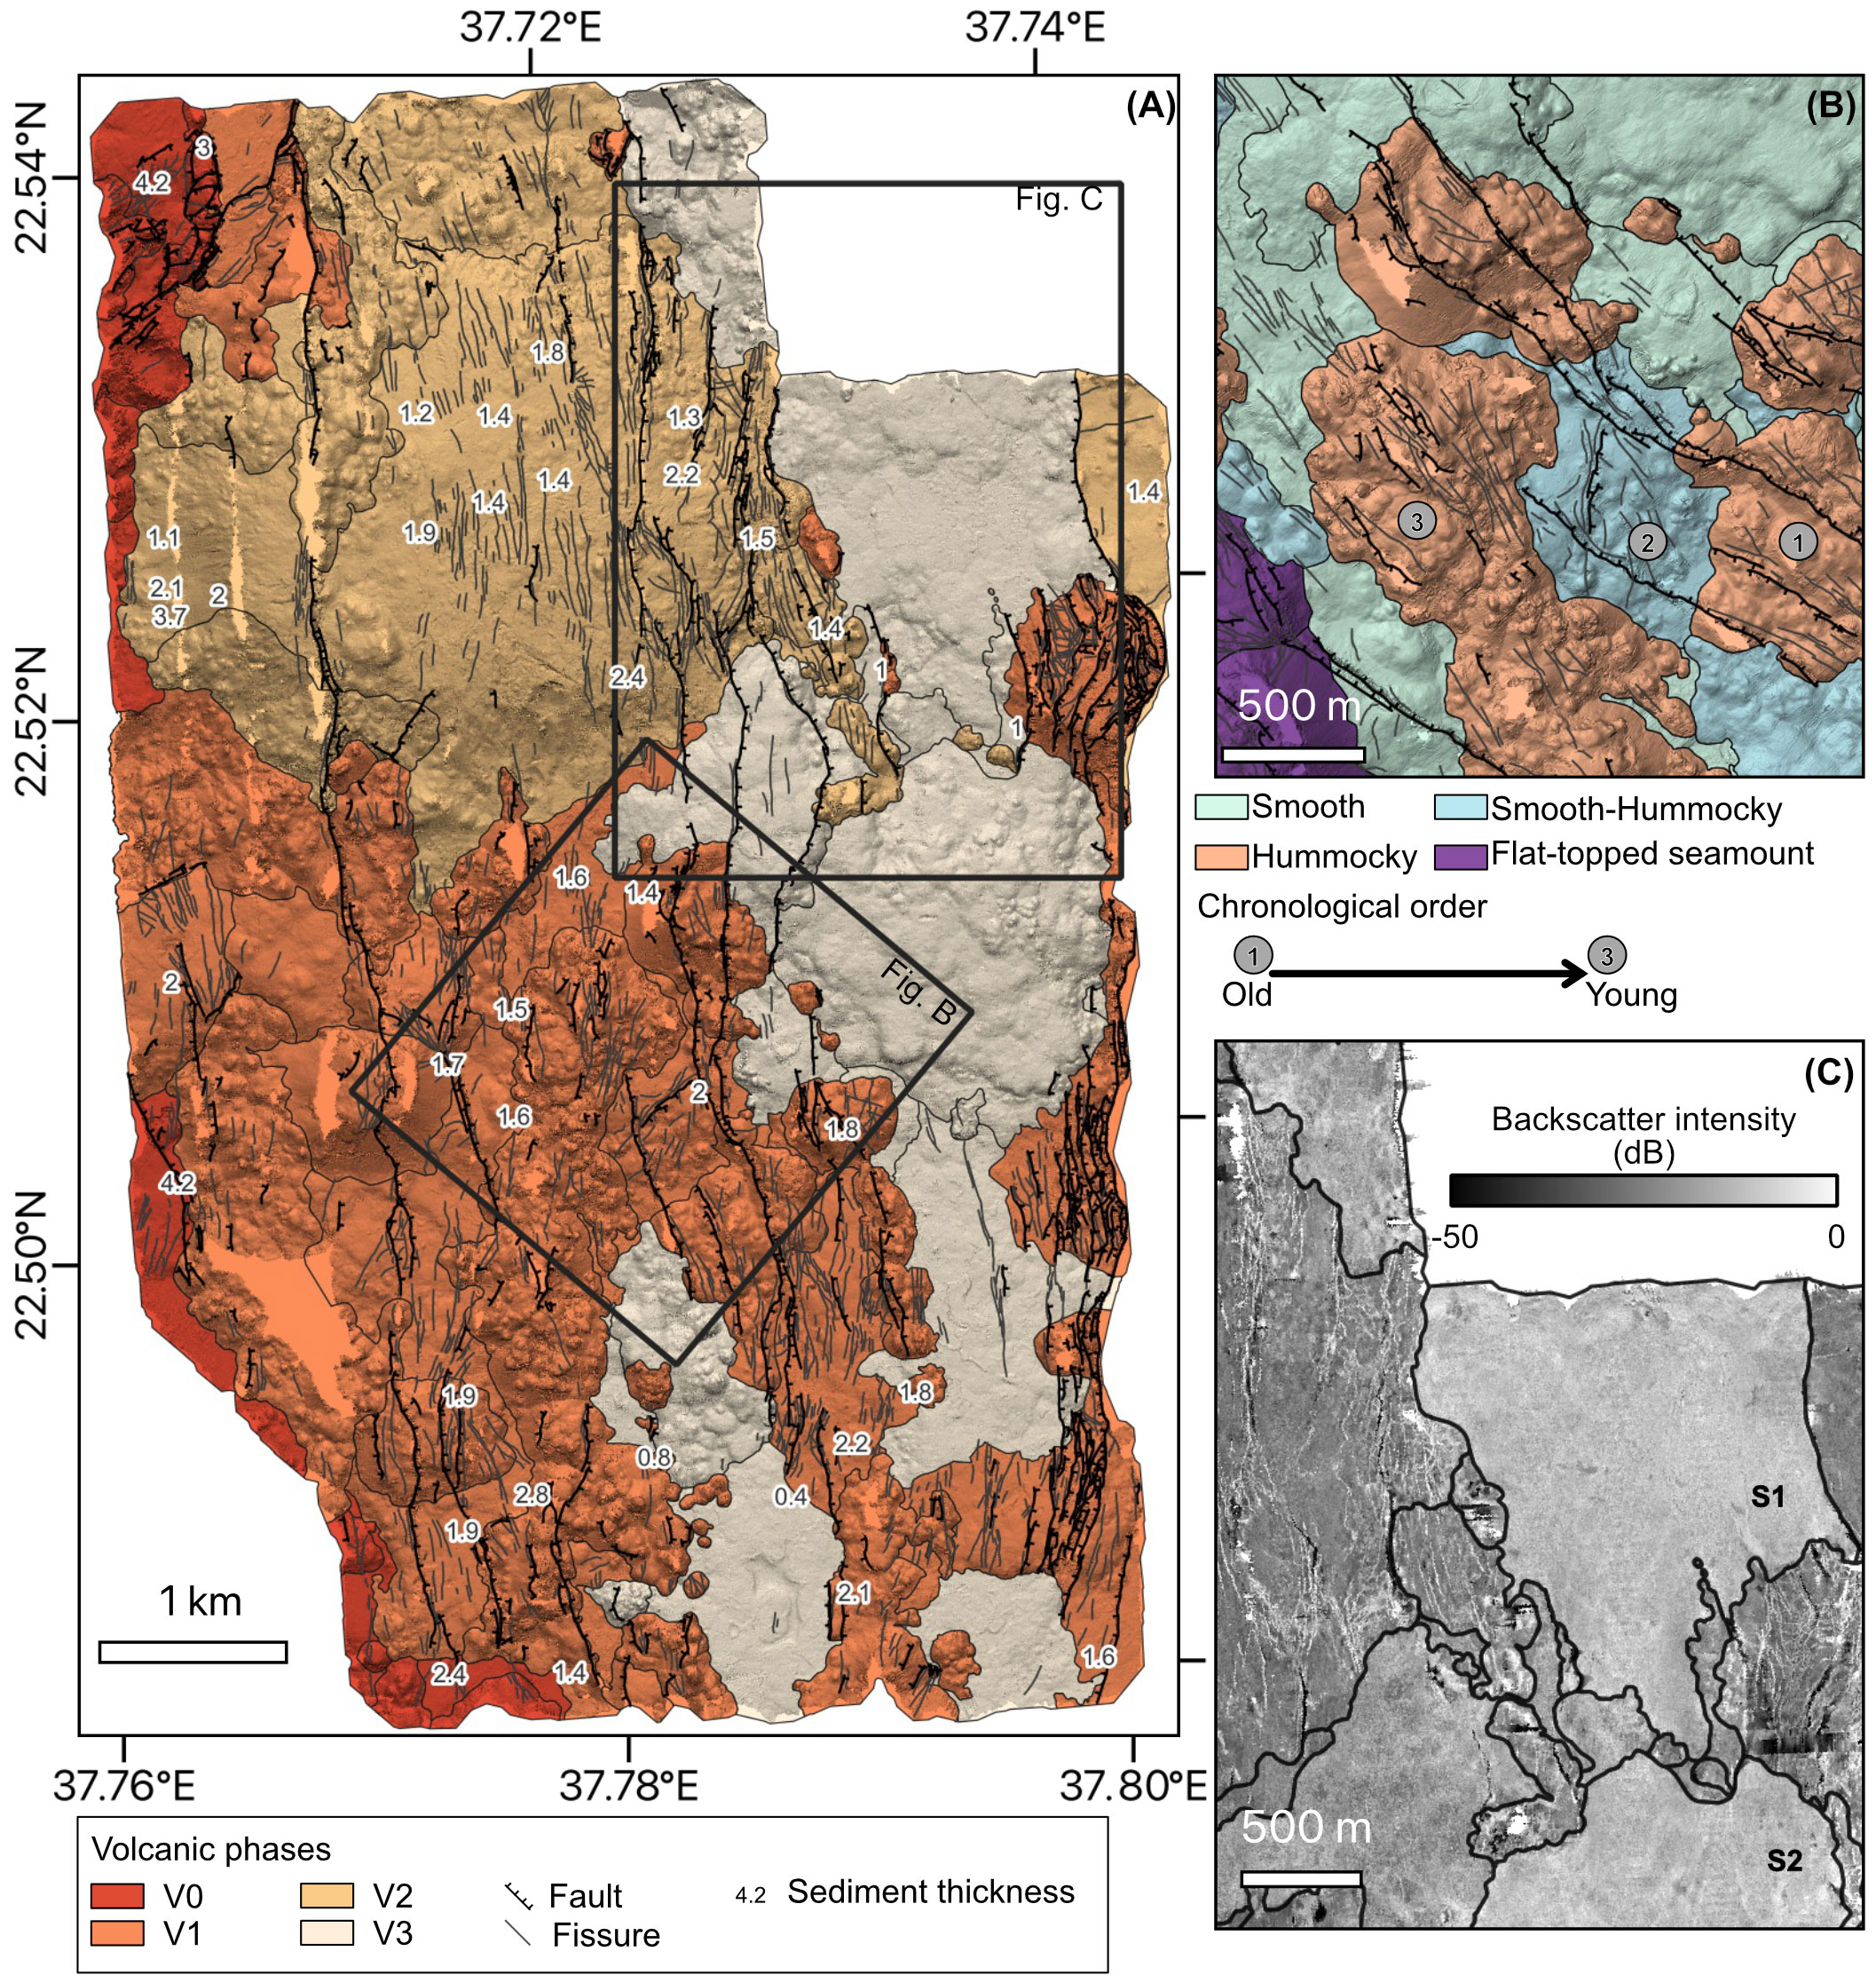
Figure 6 (A) Interpretation of the relative age of the different eruptive units. The eruptive units are regrouped in four volcanic phases (V0-V3), based on backscatter intensity, sediment thickness extracted from sub-bottom profile (indicated by the black numbers), stratigraphic relationships between lava flows, and patterns of fracture distribution. (B) Zoom on the geomorphological interpretation (Figure 4A) showing the chronological order (older to younger, from 1 to 3) of three eruptive units from V1 determined from the fault and fissure pattern. (C) Extract from the backscatter mosaic showing young volcanism in the northeast section of the map.
5 Discussion
5.1 Flow morphology: constraint on eruption dynamics
Flow morphology is commonly used as a proxy to infer the rheological and physical properties of an eruption. Based on the comparison of the determined morphologies with those of similar resolution studies with ground truth data (e.g., McClinton et al., 2013; Chen et al., 2021), smooth terrains seem to be associated with the emplacement of sheet and lobate flows, hummocky terrains with the emplacement of pillow mounds or pillow ridges, while smooth hummocky terrains mark a transition between lobate and pillow flows. Laboratory experiments have shown that the morphology of deep (>1500 m) submarine lava flows is controlled by the lava viscosity, underlying slope, and local flow rates (Bonatti and Harrison, 1988; Gregg and Fink, 1995; Gregg and Smith, 2003). Sheet flows transition toward lobate and pillow flows by increasing viscosity and decreasing extrusion rate and underlying slope. Constraining the underlying slope is challenging as it is locally controlled by volcanic edifices buried by more recent eruptions. Nevertheless, in Hadarba Deep, the regional bathymetry deepens towards the south at an angle of 1.5 to 3.5° (excluding the dome volcano) without clear variations between seafloor morphology, indicating this does not have a major effect. Within our mapped area, only 4 eruptive units were sampled (Figure 4A), and none of them are associated with hummocky terrains. The homogeneous compositions of the basaltic glasses and minerals and the chemistry of the lava flows that fall along fractional crystallization trends point to a role of crystallization to explain the limited spread. Calculation of crystallization pathways at seafloor depth (0.2 kbar), mid-crustal or lower crustal depth (0.8 and 1.6 kbar; assuming a 5 km crust) with Petrolog3 (Danyushevsky and Plechov, 2011) indicate that the limited spread in lava chemistry can be explained by variations in degrees of crystallization of around 20% (depending on the exact depth; Figure 5A). Melting degree and depths (as indicated by Na8 and Fe8, cf. Langmuir et al., 1992) are also consistent between the samples, and similar to other Red Sea samples, overlapping with ‘normal’ mid-ocean ridges not influenced by mantle plumes (Figure 5B). Low K/Ti and little elevated Cl/K, which is on the low end of the Red Sea field, indicate that all magmas have a relatively refractory source, and underwent only little assimilation of hydrothermal crust (Figure 5C; cf. van der Zwan et al., 2015). Therefore, all magmas seem to have had a similar source, underwent similar magmatic processes, and potentially are related to the same event. The overall smooth terrain of these lavas is consistent with their primitive low-viscosity basaltic composition (glass MgO > 6; Pl >An75; Ol >Fo76). In addition, the low crystallinity and lack of phenocrysts (<1 mm crystals) in the samples also imply little crystallization in stagnation levels, in agreement with the high-extrusion rates of low-viscosity lava. However, analyses of the glass samples and their minerals show no significant compositional variations between the lava flows that would explain changes in morphologies between smooth and smooth-hummocky. Similar observations have been made along the Mid-Atlantic Ridge (Cann and Smith, 2005) and Galapagos Spreading Center (McClinton et al., 2013), and on a larger scale for different volcano types in the Red Sea (Augustin et al., 2016), suggesting that extrusion rates influenced flow morphology to a greater extent than the chemistry. Thus, the differences in morphology observed in Hadarba Deep could be used as a proxy for extrusion rates. The transition between smooth to smooth-hummocky and hummocky terrain is likely associated with a decrease in extrusion rates, potentially marking the end of eruptive sequences.
5.2 Eruptive phases and evolution of the eruptive activity over the last ~15 ka
The maximum measured sediment thicknesses (4.2 ± 0.1 m, Figure 6A) and an average sedimentation rate of 14 ± 3 cm/ka (Stoffers and Ross, 1974; Kuptsov and Palkina, 1986), gives a maximum age of 30 ± 9 ka for the mapped area and 15 ± 5 ka within the axial valley (i.e., between W1 and E1). If the volcanic activity was limited at the ridge axis and given the spreading rate in this region (11-12 mm/yr; Argus et al., 2011; Viltres et al., 2022) and the width of the axial valley (~3.5-4.5 km), the maximum age of the crust within the axial trough should reach ~400 ka; or ~800 ka, if we consider that the mapped region corresponds to the eastern tip of an overlapping spreading center and that the total extension could be distributed between the two axes. Such variation between this maximum crustal age and the age of the upper flows is similar to observations made along the Mohns Ridge, where ~50% of the valley floor have ages younger than ~25 ka (Stubseid et al., 2023) and reflect the wide region of crustal generation along slow- and ultraslow spreading ridges (Perfit and Chadwick, 1998; Chen et al., 2021).
Within this timeframe, different eruptive units can be identified based on their morphology (Figures 2, 4), and relative age (Figure 6), as well as the tectonic pattern (Figure 3). They are used to determine eruptive phases and investigate the evolution of the eruptive activity of the study area in Hadarba Deep. Three volcanic phases (V1-V3) have been identified within the axial valley based on recurrent patterns between successive eruptive units and their sediment thickness. Phase V1 is associated with the emplacement of elongated hummocky terrain separated by smooth and smooth-hummocky terrain. It is also associated with the formation of the four flat-topped seamounts. The abrupt variation in fault and fissure distribution between eruptive units (Figure 6B) within this V1 indicates alternation between hummocky eruptions and smooth to smooth-hummocky eruptions, with at least three such cycles evidenced. This would suggest cyclic variations in extrusion rate and possibly magma supply. However, whether the episodes of deformation occur in between individual eruptive events or are limited to a period of lower extrusion rate associated with the waning of magma supply at the end of each phase remains unclear. The sediment thickness varying from 1.5 ± 0.1 to 2.1 ± 0.1 m indicates ages between ~10 ± 4.5 and 15 ± 5 ka. Eruptive units emplaced during this period are primarily at the surface on the southwest section of the study area, but observed all across the axial valley (from E1 to W1), and thus potentially more covered on the eastern side. This, therefore, indicates a period associated with a wide zone of dike injections (exceeding 4.5 km) over the whole axial valley.
Phase V2 appears to mark the last building phase of the dome volcano but can also be found east of E1. The relatively constant sediment thickness at the dome summit (1.2 to 1.4 m) indicates ages between ~8.5± 3 and 10 ± 3.5 ka. While the increase of sediment thickness on its flank (up to 3.7 ± 0.1 m; Figure 6A), could result from the redistribution of sediment down the slope, an initial construction of the edifice anterior to V1 cannot be excluded. V2 is mainly associated with the emplacement of smooth and hummocky smooth terrains with lava channels exceeding 1.5 km but is topped by hummocky terrain, which attests to an overall decrease of volcanic activity toward the end of phase V2. No eruptive units with similar ages have been found south of the volcanic dome, and V2 could mark a regression phase of the volcanic activity with magma focusing towards the segment center (axial high). The eruptive units of V2 have experienced significant deformation, especially along W1, W2, and E1 (Figures 3A, 4A). However, there is no significant variation in the tectonic pattern between the different units of V2, indicating that the deformation of the V2 lava flows is posterior to the last eruption of this volcanic phase.
Finally, phase V3 marks the youngest volcanic phase, indicated by their strongest backscatter signals. Three eruptive units (S1, S2 and S4) have sediment thicknesses of<10 cm, confirmed by limited sediments in the wax cores, and thus are younger than 700 yrs. No ages could be determined for most of the earlier stages of V3, but most eruptive units (70%) appear to be of similar age or younger than S5, which has a thickness of 40 cm, equal to 2.9 ± 1.6 ka. Phase V3 is dominated by the emplacement of smooth terrains (i.e., sheet flows and lobate flows), pointing to elevated extrusion rates. Not dissimilar to V1, V3 seems to have experienced changes in morphology with the occurrence of smooth terrains by high extrusion rates, alternating with periods of slightly decreased extrusion rates forming smooth-hummocky terrains, indicating episodic activity associated with waxing and waning of the magma supply. However, the lower amounts of hummocky terrain point towards overall higher magmatic activity. This is also indicated by the Na8 ( ± 2.4) and Fe8 ( ± 10.5) on the lower end of the mid-ocean ridges spectrum, indicating higher degrees of melt at shallower average depths, more similar to faster-spreading ridges (Figure 5B). High eruption rates are consistent with the absence of extensive magma storage as indicated by their low crystal content and lack of phenocrysts and similar compositions. The narrow distribution of the lava flows across the axial valley, indicates that dikes injections are centered within a much narrower region of the valley (<1.5 km), and lava flow emplacement is mostly constrained by W2 and E1.
Overall, the high proportion of smooth flows (Figure 4), and the low tectonic strain (<10%, Figure 3), are similar to those of intermediate spreading segments (e.g., at 86°W and 92°W along the Galapagos spreading center; McClinton et al., 2013) and those of SWIR 50°28’E (Chen et al., 2021). Together those parameters indicate that the mapped region is part of a magmatically robust segment in concert with it being part of an axial high, and this for at least the last 15 ± 5 ka. However, the above interpretation also shows that the volcanic activity over this period is not steady. The variability between the different volcanic phases indicates periods of (1) lower extrusion rates over the whole axial valley (V1), (2) regression of the volcanic activity toward the axial high, but with local higher extrusion rates (transition V1 to V2), (3) increase of tectonic extension (between V2 and V3), and (3) renewed volcanic activity with higher extrusion rates (V3). This could indicate a decrease of magma supply from V1 to V2, followed by an increase during V3. These variations could also explain changes in the width of the injection zone. Previous studies have shown that periods of robust magma supply dominated by high extrusion rate eruptions develop a narrower well-defined axis, while during periods of lower magma supply, the activity appears unfocused, occurring within the entire width of the axial valley (50°28′E, Chen et al., 2021). In addition to the variations between each volcanic phases, there are also significant changes in flow morphology (i.e., extrusion rates) between eruptive events. Based on the number of observed cycles of morphological changes and the ages of V1 and V2, variations in extrusion rate within the phases show a periodicity of 1-2 ka.
5.3 Eruption frequency
Accurately dating volcanic events along a MOR is challenging, and an eruption history over relevant periods of time is rare. Up to date, only a few repeated eruptions have been directly observed (9°50′N EPR, Axial Seamount (JdFR), and the Coaxial segment of the JdFR), giving intervals of recurrence of 4 to 20 years (Rubin et al., 2012; Clague et al., 2017), while most other information is from indirect methods. Eruption frequency is often estimated by either (1) dating eruptions sequences using radiometry, paleointensity, or estimation of the sediment thickness and sedimentation rate (Bergmanis et al., 2007), (2) calculating the number of meter-wide diking events needed to accommodate the magmatic extension (e.g., Hooft et al., 1996; Curewitz and Karson, 1998; Colman et al., 2012), or (3) based on the time-averaged rate production of the extrusive layer and average flow volume (Perfit and Chadwick, 1998; Sinton et al., 2002; Rubin et al., 2012). This latter method infers that the frequency of eruption decreases with the spreading rate, and recurrence intervals >1000 yr should be expected for a slow- and ultraslow- spreading segment (Rubin et al., 2012).
Assuming a steady state of the magmatic system, the number of distinguishable eruptive units per volcanic phase and sediment ages can be used to calculate an interval of recurrence of ~106 ± 135 yr (in V1), ~115 ± 600 yr (in V2) and ~250 ± 116 yr (last 2.9 ± 1.6 ka of V3). Note that these estimated eruption rates have large errors resulting from the high uncertainty in the sedimentation rate. The three youngest flows (Flow S1, S2, and S4), whose ages are better constrained (<700 ± 200 yr), also indicate an interval of recurrence of<240 ± 50 yr, thus a much higher frequency than expected for ultra-slow spreading segments. Such short intervals could be related to the age uncertainties and the method used to delineate the eruptive units. Indeed, previous studies have shown that disconnected flows could be part of the same eruptive event (e.g., Colman et al., 2012; Yeo, 2014; Yeo et al., 2016; Clague et al., 2017), leading to an underestimation of the frequency. Phase V1 and V2 have a high proportion of disconnected cones or mounds. These smaller edifices might be part of larger eruptive events, and contribute to an overestimation of the eruptive frequency. But in the absence of geochemical information, integrating those smaller edifices into larger events remains challenging. However, in phase V3, while geochemical analyses indicate a possible relation between the lava flows, variations in BI indicate age variations with recurrence interval consistent over 3 ka and 700 yr periods.
The high eruption frequency over the last 15 ka is likely to be related to the long-term magmatic state of the segment. Indeed, the magmatic budget is known to fluctuate not only at the time scale of individual eruptions (Bowles et al., 2014; Clague et al., 2017) but also over a larger time scale. Such variations are known to influence flow morphology and eruption frequency, which become more frequent as the magmatic budget increases (Colman et al., 2012). Faults located ~6.5 km east and west from the current ridge axis may mark the end of the last high-magmatic phase and would indicate a long-term magmatic cycle of ~590 ka, similar to those found along slow- and ultraslow-spreading segments (150-500 ka; Cordier et al., 2010; Rioux et al., 2016; Klischies et al., 2019; Chen et al., 2021). Faults located ~6.5 km east and west from the current ridge axis may mark the end of the last high-magmatic phase and would indicate a long-term magmatic cycle of ~590 ka, similar to those found along slow- and ultraslow-spreading segments (150-500 ka; Cordier et al., 2010; Rioux et al., 2016; Klischies et al., 2019; Chen et al., 2021). Variability in long-term magmatic supply can also be observed off-axis in vertical gravity gradient (VGG) data (Augustin et al., 2021): in contrast to Thetis Dome and Hatiba Mons that form rift-perpendicular ridges indicating long-term magma focusing, the Hadarba segment center shows a patchy VGG pattern pointing to larger variations in magma supply. Nevertheless, considering (1) the consistency of eruption intervals between the phases, (2) the generally very low tectonic strain (<10%, Figure 3E, see 5.4), and (3) the high proportion of smooth terrains even during V1, a relatively large magma supply has been located under this segment, for at least 15 ka, without clear sign of decline. In such magmatically robust segment, a recurrence interval of a few hundred years seems realistic. This would indicate that ultraslow-spreading ridges could sustain robust magmatic activity with high eruption frequency over several kyrs.
5.4 Asymmetry of the tectonic extension at a magmatically robust segment
The eastern axis of Hadarba Deep has a well-defined, ~3.6-4.5 km wide axial valley offset from the rift flanks by 1.5 to 104 m high fault scarps (W1 and E1, Figures 2A and 3A). The shallow axial valley (<105 m deep) and the low tectonic strain between W1 and E1 (<10.9%), require that 90% of the spreading is accommodated by magmatic intrusions, and are thus indicative of a magmatically robust segment (e.g., Sempéré et al., 1993; Hooft et al., 2000; Olive and Dublanchet, 2020), at least in geologically recent time. This is in agreement with the low seismicity (Figure 1B) that has been proposed to indicate an increase in magma extension (Metz et al., 2013; Augustin et al., 2016). The differences in fault patterns and tectonic strain with respect to the current ridge axis (Figure 3), indicate an asymmetry for the accommodation of the extension between W1 and E1. An asymmetry in the extension and fault pattern is not uncommon at a segment end (e.g., Escartín et al., 1999 and references therein). As the study area is the eastern branch of an overlapping spreading center (Figure 1), the asymmetry could indeed be a result of a change in the rheology of the lithosphere, a difference in the spreading rate between the eastern and western flanks, or a difference in the width of the active deformation zone. Potential differences in spreading rate cannot be constrained by the available data, and although there is a lack of large vertical offset outside of the mapped region (Figure 1), it cannot be excluded that the zone of active deformation extends further east and west. Indeed, the active deformation zone on slow- and ultra-slow spreading segments can exceed 15 km (Escartín et al., 1999; Chen et al., 2021), over three times the width of the map region. However, based on the prolongation of W1, W2 and E1, the asymmetry appears to continue north, well outside the overlapping region, into the axial high (Figure 1). Thus, it is unlikely merely related to it being at a segment end. The relationship between the fault pattern and the youngest eruptive unit seems to indicate that at least part of the asymmetry is related to the recent change in volcanic activity. Deformation along E1 and W2 seems to have primarily occurred between the end of V2 and the early phase of V3 when the eruptive activity became more focused on the eastern section of the axial valley. Such relationship, may indicate that the localization of the deformation is controlled by the magmatic activity.
6 Conclusion
The joint analysis of high-resolution AUV bathymetry, backscatter and sub-bottom profile data, and geochemical analysis of lava fragments enables retracing the evolution of Hadarba Deep over the last 15± 5 ka. The geological mapping and interpretation reveal that:
1. Change in the seafloor morphology is mainly influenced by extrusion rates. High effusion rate eruptions, resulting in the emplacement of smooth and smooth-hummocky lava flows (i.e., eruptions dominated by lobate and sheet lava flows), are the most common (~60.5% of the eruptions), while low-effusive events (i.e., hummocky terrain and flat-topped seamounts), account for 37.2% of the mapped area.
2. Combined with the low apparent tectonic strain (<11%), the high proportion of high effusion rate eruptions, similar to those of intermediate- and fast-spreading segments, indicate a magmatically robust segment.
3. Variability between calculated crustal age and maximum sediment thickness indicates that the entire region has been rejuvenated during the last 30 ka.
4. While the entire period is likely to be magmatically active, the last 15 ± 5 ka can be separated into 3 volcanic phases (V1-V3) associated with changes in extrusion rates and eruptive axis that are likely controlled by variations in magma supply.
5. Eruptions over the last 15 ± 5 ka appear more frequent than general estimates for slow-spreading segments in the order of 100-250 years. This could be the result of the high magmatic activity of the segment.
6. Tectonic pattern and geometry indicate an asymmetry in the extension associated with the migration of the magmatic activity toward the east side of the axial valley, suggesting a magmatic control of the extension.
Data availability statement
The original contributions presented in the study are publicly available in the Pangaea database. The AUV bathymetry and Backscatter (van der Zwan et al., 2023b) can be found here : https://doi.org/10.1594/PANGAEA.963456.
Author contributions
MS: Conceptualization, Formal analysis, Investigation, Methodology, Supervision, Visualization, Writing – original draft. FZ: Formal analysis, Funding acquisition, Investigation, Methodology, Visualization, Writing – original draft. CS: Investigation, Visualization, Writing – review & editing. NA: Data curation, Investigation, Supervision, Writing – review & editing.
Funding
The author(s) declare financial support was received for the research, authorship, and/or publication of this article. The ship-time of OSS Handin Tide was funded by Fugro, under a collaborative agreement with KAUST. MS, NA and CS were funded by GEOMAR, FZ was funded by KAUST under grant BAS/1/1408-01-01.
Acknowledgments
We are grateful to the captain, crew, and AUV team of the OSS Handin Tide for their help during the cruise in February 2021. We further thank the captain and crew, and scientific participants, particularly Jörg Follmann and David Atienza, for wax corer sampling during the RV Thuwal expedition TH09/22 in September 2022. We appreciate the assistance of Mario Thöner at the Electron Microprobe Lab at GEOMAR. The authors thank KAUST CMR and Fugro for the organization and granting of ship time and the AUV operations on board OSS Handin Tide. We also thank the reviewers for their comments and recommendations that have helped improve this manuscript.
Conflict of interest
The authors declare that the research was conducted in the absence of any commercial or financial relationships that could be construed as a potential conflict of interest.
Publisher’s note
All claims expressed in this article are solely those of the authors and do not necessarily represent those of their affiliated organizations, or those of the publisher, the editors and the reviewers. Any product that may be evaluated in this article, or claim that may be made by its manufacturer, is not guaranteed or endorsed by the publisher.
Supplementary material
The Supplementary Material for this article can be found online at: https://www.frontiersin.org/articles/10.3389/fmars.2023.1273574/full#supplementary-material
References
Adams R. D., Hughes A. A., McGregor D. M. (1982). Analysis procedures at the International Seismological Centre. Phys. Earth Planet. Inter. 30, 85–93. doi: 10.1016/0031-9201(82)90093-0
Afifi A. S., Moustafa A. R., Helmy H. M. (2023). Rift domains and structural framework of the northwestern Red Sea basin, Egypt. Int. J. Earth Sci. 112, 2049–2064. doi: 10.1007/s00531-023-02340-3
Argus D. F., Gordon R. G., DeMets C. (2011). Geologically current motion of 56 plates relative to the no-net-rotation reference frame. Geochem. Geophys. Geosyst. 12, Q11001. doi: 10.1029/2011gc003751
Augustin N., Devey C. W., Zwan F. M., van der Feldens P., Tominaga M., Bantan R. A., et al. (2014). The rifting to spreading transition in the Red Sea. Earth Planet. Sc. Lett. 395, 217–230. doi: 10.1016/j.epsl.2014.03.047
Augustin N., Zwan F. M., van der Devey C. W., Brandsdóttir B. (2021). 13 million years of seafloor spreading throughout the Red Sea Basin. Nat. Commun. 12, 2427. doi: 10.1038/s41467-021-22586-2
Augustin N., Zwan F. M., van der Devey C. W., Ligi M., Kwasnitschka T., Feldens P., et al. (2016). Geomorphology of the central Red Sea Rift: Determining spreading processes. Geomorphology 274, 162–179. doi: 10.1016/j.geomorph.2016.08.028
Bergmanis E. C., Sinton J., Rubin K. H. (2007). Recent eruptive history and magma reservoir dynamics on the southern East Pacific Rise at 17°30′S. Geochemistry. Geophys. Geosyst. 8, n/a–n/a. doi: 10.1029/2007gc001742
Bonatti E. (1985). Punctiform initiation of seafloor spreading in the Red Sea during transition from a continental to an oceanic rift. Nature 316, 33–37. doi: 10.1038/316033a0
Bonatti E., Harrison C. (1988). Eruption styles of basalt in oceanic spreading ridges and seamounts: Effect of magma temperature and viscosity. J. Geophys. Res.: Solid. Earth (1978–2012) 93, 2967–2980. doi: 10.1029/jb093ib04p02967
Bowles J. A., Colman A., McClinton J. T., Sinton J. M., White S. M., Rubin K. H. (2014). Eruptive timing and 200 year episodicity at 92°W on the hot spot-influenced Galapagos Spreading Center derived from geomagnetic paleointensity. Geochem. Geophys. Geosyst. 15, 2211–2224. doi: 10.1002/2014gc005315
Brandl P. A., Regelous M., Beier C., Haase K. M. (2013). High mantle temperatures following rifting caused by continental insulation. Nat. Geosci. 6, 391–394. doi: 10.1038/ngeo1758
Cann J. R., Smith D. K. (2005). Evolution of volcanism and faulting in a segment of the Mid-Atlantic Ridge at 25°N. Geochemistry. Geophys. Geosyst. 6 (9), n/a–n/a. doi: 10.1029/2005gc000954
Cannat M., Rommevaux-Jestin C., Sauter D., Deplus C., Mendel V. (1999). Formation of the axial relief at the very slow spreading Southwest Indian Ridge (49° to 69°E). J. Geophys. Res.: Solid Earth 104, 22825–22843. doi: 10.1029/1999jb900195
Cannat M., Sauter D., Lavier L., Bickert M., Momoh E., Leroy S. (2019). On spreading modes and magma supply at slow and ultraslow mid-ocean ridges. Earth Planet. Sci. Lett. 519, 223–233. doi: 10.1016/j.epsl.2019.05.012
Cannat M., Sauter D., Mendel V., Ruellan E., Okino K., Escartin J., et al. (2006). Modes of seafloor generation at a melt-poor ultraslow-spreading ridge. Geology 34, 605–608. doi: 10.1130/g22486.1
Carbotte S. M., Smith D. K., Cannat M., Klein E. M. (2015). Tectonic and magmatic segmentation of the Global Ocean Ridge System: a synthesis of observations. Geol. Soc. London. Special. Publ. 420, SP420.5. doi: 10.1144/sp420.5
Chadwick W. W., Embley R. W. (1998). Graben formation associated with recent dike intrusions and volcanic eruptions on the mid-ocean ridge. J. Geophys. Res.: Solid Earth 1978–2012) 103, 9807–9825. doi: 10.1029/97jb02485
Chang S., Merino M., Lee S. V., Stein S., Stein C. A. (2011). Mantle flow beneath Arabia offset from the opening Red Sea. Geophys. Res. Lett. 38, n/a–n/a. doi: 10.1029/2010gl045852
Chen J., Cannat M., Tao C., Sauter D., Munschy M. (2021). 780 thousand years of upper-crustal construction at a melt-rich segment of the ultraslow spreading southwest Indian ridge 50°28′E. J. Geophys. Res.: Solid. Earth 126, e2021JB022152. doi: 10.1029/2021jb022152
Chen J., Zhang T., Li H., Tao C., Cannat M., Sauter D. (2023). Evolution of enhanced magmatism at the ultraslow spreading Southwest Indian Ridge between 46°E and 53.5°E. Tectonophysics 860, 229903. doi: 10.1016/j.tecto.2023.229903
Clague D. A., Moore J. G., Reynolds J. R. (2000). Formation of submarine flat-topped volcanic cones in Hawai’i. Bull. Volcanol. 62, 214–233. doi: 10.1007/s004450000088
Clague D., Paduan J., Caress D., Chadwick W., Saout M. L., Dreyer B., et al. (2017). High-resolution AUV mapping and targeted ROV observations of three historical lava flows at axial seamount. Oceanography 30 (4), 82–99. doi: 10.5670/oceanog.2017.426
Colman A., Sinton J. M., White S. M., McClinton T. J., Bowles J. A., Rubin K. H., et al. (2012). Effects of variable magma supply on mid-ocean ridge eruptions: Constraints from mapped lava flow fields along the Galápagos Spreading Center. Geochemistry. Geophys. Geosyst. 13, n/a–n/a. doi: 10.1029/2012gc004163
Cordier C., Benoit M., Hémond C., Dyment J., Gall B. L., Briais A., et al. (2010). Time scales of melt extraction revealed by distribution of lava composition across a ridge axis. Geochem. Geophys. Geosyst. 11, n/a–n/a. doi: 10.1029/2010gc003074
Curewitz D., Karson J. A. (1998). “Geological consequences of dike intrusion at mid-ocean ridge spreading centers.” In Faulting and Magmatism at Mid-Ocean Ridges. Geophys. Monogr. Ser., Eds. Buck Roger W., Delaney P.T., Karson J.A., Lagabrielle Y. (U. K.: Wiley-Blackwell Publishing Ltd), 106, 117–136. doi: 10.1029/GM106p0117
Danyushevsky L. V., Plechov P. (2011). Petrolog3: Integrated software for modeling crystallization processes. Geochem. Geophys. Geosyst. 12, Q07021. doi: 10.1029/2011GC003516
Delaunay A., Baby G., Fedorik J., Afifi A. M., Tapponnier P., Dyment J. (2023). Structure and morphology of the Red Sea, from the mid-ocean ridge to the ocean-continent boundary. Tectonophysics 849, 229728. doi: 10.1016/j.tecto.2023.229728
Dick H. J., Lin J., Schouten H. (2003). An ultraslow-spreading class of ocean ridge. Nature 426, 405–412. doi: 10.1038/nature02128
Escartín J., Cowie P., Searle R., Allerton S., Mitchell N., MacLeod C., et al. (1999). Quantifying tectonic strain and magmatic accretion at a slow spreading ridge segment, Mid-Atlantic Ridge, 29°N. J. Geophys. Res.: Solid. Earth (1978–2012) 104, 10421–10437. doi: 10.1029/1998jb900097
Escartín J., Mével C., Petersen S., Bonnemains D., Cannat M., Andreani M., et al. (2017). Tectonic structure, evolution, and the nature of oceanic core complexes and their detachment fault zones (13°20′N and 13°30′N, Mid Atlantic Ridge). Geochem. Geophys. Geosyst. 18, 1451–1482. doi: 10.1002/2016gc006775
Escartín J., Soule S. A., Cannat M., Fornari D. J., Düşünür D., Garcia R. (2014). Lucky Strike seamount: Implications for the emplacement and rifting of segment-centered volcanoes at slow spreading mid-ocean ridges. Geochem. Geophys. Geosyst. 15, 4157–4179. doi: 10.1002/2014gc005477
Follmann J., Zwan F. M., van der Preine J., Hübscher C., Bousquet R., Augustin N. (2021). Gabbro discovery in discovery deep: first plutonic rock samples from the red sea rift axis. Front. Earth Sci. 9. doi: 10.3389/feart.2021.742815
Girdler R. W., Evans T. R. (1977). Red Sea heat flow. Geophys. J. R. Astron. Soc 51, 245–251. doi: 10.1111/j.1365-246x.1977.tb04199.x
Gregg T. K., Fink J. H. (1995). Quantification of submarine lava-flow morphology through analog experiments. Geology 23, 73–76. doi: 10.1130/0091-7613(1995)023<0073:qoslfm>2.3.co;2
Gregg T., Smith D. (2003). Volcanic investigations of the Puna Ridge, Hawai′ i: relations of lava flow morphologies and underlying slopes. J. Volcanol. Geotherm. Res. 126, 63–77. doi: 10.1016/s0377-0273(03)00116-1
Haase K. M., Mühe R., Stoffers P. (2000). Magmatism during extension of the lithosphere: geochemical constraints from lavas of the Shaban Deep, northern Red Sea. Chem. Geol. 166, 225–239. doi: 10.1016/S0009-2541(99)00221-1
Hooft E. E. E., Detrick R. S., Toomey D. R., Collins J. A., Lin J. (2000). Crustal thickness and structure along three contrasting spreading segments of the Mid-Atlantic Ridge, 33.5°–35°N. J. Geophys. Res.: Solid. Earth 105, 8205–8226. doi: 10.1029/1999jb900442
Hooft E. E. E., Schouten H., Detrick R. S. (1996). Constraining crustal emplacement processes from the variation in seismic layer 2A thickness at the East Pacific Rise. Earth Planet. Sci. Lett. 142, 289–309. doi: 10.1016/0012-821x(96)00101-x
Issachar R., Gómez-García Á.M., Ebbing J. (2023). Lithospheric structure of the red sea based on 3D density modeling: A contrasting rift architecture. J. Geophys. Res.: Solid. Earth 128, e2022JB025458. doi: 10.1029/2022jb025458
Izzeldin A. Y. (1987). Seismic, gravity and magnetic surveys in the central part of the Red Sea: their interpretation and implications for the structure and evolution of the Red Sea. Tectonophysics 143, 269–306. doi: 10.1016/0040-1951(87)90214-9
Jarosewich E., Nelen J. A., Norberg J. A. (1980). Reference samples for electron microprobe analysis. Geostandards. Newslett. 4 (1), 43–47. doi: 10.1111/j.1751-908X.1980.tb00273.x
Klischies M., Petersen S., Devey C. W. (2019). Geological mapping of the Menez Gwen segment at 37°50′N on the Mid-Atlantic Ridge: Implications for accretion mechanisms and associated hydrothermal activity at slow-spreading mid-ocean ridges. Mar. Geol. 412, 107–122. doi: 10.1016/j.margeo.2019.03.012
Kuptsov V. M., Palkina A. M. (1986). (Table 2) sedimentation rates in the red sea (PANGAEA). doi: 10.1594/PANGAEA.756433 supplement to: Kuptsov V. M., Palkina A. M. (1986). Radiocarbon dating of bottom sediments of the Red Sea. Oceanology 26 (3), 341–345.
Langmuir C. H., Klein E. M., Plank T. (1992). “Petrological systematics of mid-ocean ridge basalts: Constraints on melt generation beneath ocean ridges,” in Mantle flow and melt generation at mid-ocean ridges. Geophys. Monogr. Ser. Eds. Phipps Morgan J., Blackman D. K., Sinton J. M. (U. K.: Wiley-Blackwell Publishing Ltd) 71, 183–280. doi: 10.1029/GM071p0183
Le Magoarou C., Hirsch K., Fleury C., Martin R., Ramirez-Bernal J., Ball P. (2021). Integration of gravity, magnetic, and seismic data for subsalt modeling in the Northern Red Sea. Interpretation 9, T507–T521. doi: 10.1190/int-2019-0232.1
Le Saout M., Clague D. A., Paduan J. B. (2022). Faulting and magmatic accretion across the overlapping spreading center between vance segment and axial south rift, juan de fuca ridge. Geochem. Geophys. Geosyst. 23, e2021GC010082. doi: 10.1029/2021gc010082
Ligi M., Bonatti E., Bortoluzzi G., Cipriani A., Cocchi L., Tontini F. C., et al. (2012). Birth of an ocean in the Red Sea: Initial pangs. Geochem. Geophys. Geosyst. 13, n/a–n/a. doi: 10.1029/2012gc004155
Ligi M., Bonatti E., Bosworth W., Cai Y., Cipriani A., Palmiotto C., et al. (2018). Birth of an ocean in the Red Sea: Oceanic-type basaltic melt intrusions precede continental rupture. Gondwana. Res. 54, 150–160. doi: 10.1016/j.gr.2017.11.002
Ligi M., Bonatti E., Rasul N. M. A. (2015). “Seafloor Spreading Initiation: Geophysical and Geochemical Constraints from the Thetis and Nereus Deeps, Central Red Sea”, in The Red Sea. Springer Earth System Sciences Eds. Rasul N., Stewart I. (New York: Springer, Berlin and Heidelberg), 79–98. doi: 10.1007/978-3-662-45201-1_4
Ligi M., Bonatti E., Tontini F. C., Cipriani A., Cocchi L., Schettino A., et al. (2011). Initial burst of oceanic crust accretion in the Red Sea due to edge-driven mantle convection. Geology 39, 1019–1022. doi: 10.1130/g32243.1
MacLeod C., Carlut J., Escartín J., Horen H., Morris A. (2011). Quantitative constraint on footwall rotations at the 15°45′N oceanic core complex, Mid-Atlantic Ridge: Implications for oceanic detachment fault processes. Geochemistry. Geophys. Geosyst. 12, Q0AG03. doi: 10.1029/2011gc003503
Metz D., Augustin N., van der Zwan F. M., Bantan R., Al-Aidaroos A. M. (2013). Mabahiss Mons, 25.5 °N Red Sea Rift: tectonics and volcanism of a large submarine dome volcano. In EGU General Assembly, Geophysics Research Abstracts 15, EGU2013–10487. Available at: https://meetingorganizer.copernicus.org/EGU2013/EGU2013-10487.pdf.
McClinton T., White S. M., Colman A., Sinton J. M. (2013). Reconstructing lava flow emplacement processes at the hot spot-affected Galápagos Spreading Center, 95°W and 92°W. Geochemistry. Geophys. Geosyst. 14, 2731–2756. doi: 10.1002/ggge.20157
Mitchell N. C., Ligi M., Ferrante V., Bonatti E., Rutter E. (2010). Submarine salt flows in the central Red Sea. GSA. Bull. 122, 701–713. doi: 10.1130/b26518.1
Mitchell N. C., Preine J., Okwokwo O. I., Izzeldin A. Y., Augustin N., Stewart I. C. F. (2023). The ocean-continent transition in the Western Central Red Sea. J. Afr. Earth Sci. 208, 105093. doi: 10.1016/j.jafrearsci.2023.105093
Niu Y., Hékinian R. (1997). Spreading-rate dependence of the extent of mantle melting beneath ocean ridges. Nature 385, 326–329. doi: 10.1038/385326a0
Olive J.-A., Dublanchet P. (2020). Controls on the magmatic fraction of extension at mid-ocean ridges. Earth Planet. Sc. Lett. 549, 116541. doi: 10.1016/j.epsl.2020.116541
Pautot G. (1983). Les fosses de la Mer Rouge: approche géomorphologique d'un stade initial d'ouverture océanique réalisée à l'aide du Seabeam. Oceanol. Acta 6 (6), 235–244.
Perfit M., Chadwick W. (1998). “Magmatism at mid-ocean ridges: Constraints from volcanological and geochemical investigations,” In Faulting and Magmatism at Mid-Ocean Ridges. Geophys. Monogr. Ser. Eds. Roger Buck W., Delaney P.T., Karson J.A., Lagabrielle Y. (U. K.: Wiley-Blackwell Publishing Ltd) 106, 59–115. doi: 10.1029/GM106p0059
Rioux M., Cheadle M. J., John B. E., Bowring S. A. (2016). The temporal and spatial distribution of magmatism during lower crustal accretion at an ultraslow-spreading ridge: High-precision U–Pb zircon dating of ODP Holes 735B and 1105A, Atlantis Bank, Southwest Indian Ridge. Earth Planet. Sci. Lett. 449, 395–406. doi: 10.1016/j.epsl.2016.05.047
Rubin K., Soule A. S., Chadwick W., Fornari D., Clague D., Embley R., et al. (2012). Volcanic eruptions in the deep sea. Oceanography 25, 142–157. doi: 10.5670/oceanog.2012.12
Saleh S., Moustafa A. R., Pohánka V. (2021). Impact of inherited structures on present-day tectonics of the northern Red Sea and its western onshore area in Egypt: evidence from 3D gravity inversion and seismicity. Arab. J. Geosci. 14, 1250. doi: 10.1007/s12517-021-07626-x
Sang Y.-D., Adam B. M. T., Li C.-F., Huang L., Wen Y.-L., Zhang J.-L., et al. (2023). Punctiform breakup and initial oceanization in the central red sea rift. J. Mar. Sci. Eng. 11, 808. doi: 10.3390/jmse11040808
Schlindwein V., Schmid F. (2016). Mid-ocean-ridge seismicity reveals extreme types of ocean lithosphere. Nature 535, 276–279. doi: 10.1038/nature18277
Sempéré J.-C., Lin J., Brown H. S., Schouten H., Purdy G. M. (1993). Segmentation and morphotectonic variations along a slow-spreading center: The Mid-Atlantic Ridge (24°00′ N– 30°40′ N). Mar. Geophys. Res. 15, 153–200. doi: 10.1007/bf01204232
Sinton J., Bergmanis E., Rubin K., Batiza R., Gregg T. K., Grönvold K., et al. (2002). Volcanic eruptions on mid-ocean ridges: New evidence from the superfast spreading East Pacific Rise, 17°–19°S. J. Geophys. Res.: Solid. Earth (1978–2012) 107, ECV 3–1-ECV 3-20. doi: 10.1029/2000jb000090
Smith D. K., Escartín J., Schouten H., Cann J. R. (2008). Fault rotation and core complex formation: Significant processes in seafloor formation at slow-spreading mid-ocean ridges (Mid-Atlantic Ridge, 13°–15°N). Geochem. Geophys. Geosyst. 9, n/a–n/a. doi: 10.1029/2007gc001699
Snow J., Edmonds H. (2007). Ultraslow-spreading ridges: rapid paradigm changes. Oceanography 20, 90–101. doi: 10.5670/oceanog.2007.83
Stoffers P., Ross D. A. (1974). Sedimentary history of the Red Sea. Initial Reports of the Deep Sea Drilling Project. 23, 849–865.
Storchak D. A., Harris J., Brown L., Lieser K., Shumba B., Di Giacomo D. (2020). Rebuild of the bulletin of the international seismological centre (ISC)—part 2: 1980–2010. Geosci. Lett. 7, 18. doi: 10.1186/s40562-020-00164-6
Storchak D. A., Harris J., Brown L., Lieser K., Shumba B., Verney R., et al. (2017). Rebuild of the bulletin of the international seismological centre (ISC), part 1: 1964–1979. Geosci. Lett. 4, 32. doi: 10.1186/s40562-017-0098-z
Stubseid H. H., Bjerga A., Haflidason H., Pedersen L. E. R., Pedersen R. B. (2023). Volcanic evolution of an ultraslow-spreading ridge. Nat. Commun. 14, 4134. doi: 10.1038/s41467-023-39925-0
Sultan M., Becker R., Arvidson R. E., Shore P., Stern R. J., El Alfy Z., et al. (1993). New constraints on Red Sea rifting from correlations of Arabian and Nubian Neoproterozoic outcrops. Tectonics 12, 1303–1319. doi: 10.1029/93TC00819
Tan Y. J., Tolstoy M., Waldhauser F., Wilcock W. S. D. (2016). Dynamics of a seafloor-spreading episode at the East Pacific Rise. Nature 540 (7632), 261–265. doi: 10.1038/nature20116
Tramontini C., Davies D. (1969). A seismic refraction survey in the red sea. Geophys. J. R. Astron. Soc 17, 225–241. doi: 10.1111/j.1365-246x.1969.tb02323.x
Tucholke B. E., Lin J., Kleinrock M. C. (1998). Megamullions and mullion structure defining oceanic metamorphic core complexes on the Mid-Atlantic Ridge. J. Geophys. Res.: Solid. Earth 103, 9857–9866. doi: 10.1029/98jb00167
van der Zwan F. M., Augustin N., Almeev R. R., Bantan R. A., Basaham A. (2015). Hydrothermal activity at the ultraslow- to slow-spreading Red Sea Rift traced by chlorine in basalt. Chem. Geol. 405, 63–81. doi: 10.1016/j.chemgeo.2015.04.001
van der Zwan F. M., Augustin N., Petersen S., Altalhi S. M., Schultz J., Peixoto R. S., et al. (2023a). Low-temperature venting and microbial iron deposit formation in the first observed active hydrothermal vent fields in the Red Sea rift. Goldschmidt 2023 Conference 9.-14.07.2023 (Lyon, France). Available at: https://conf.goldschmidt.info/goldschmidt/2023/meetingapp.cgi/Paper/19267.
van der Zwan F. M., Froukje M., Augustin N., Le Saout M., Schiebener C. K. (2023b). Multibeam bathymetry and backscatter processed data (Kongsberg EM 2040MKII working area dataset) of AUV HUGIN SUPERIOR during cruise with HANDIN TIDE in 2022 (Hadarba Deep, Red Sea. PANGAEA). doi: 10.1594/PANGAEA.963456
van der Zwan F. M., Augustin N., Petersen S., Altahi S. M., Schultz J., Peixoto R. S. (in Press). Widespread diffuse venting and large microbial iron-mounds in the Red Sea. Commun. Earth Environ.
Viltres R., Jónsson S., Alothman A. O., Liu S., Leroy S., Masson F., et al. (2022). Present-day motion of the arabian plate. Tectonics 41. doi: 10.1029/2021tc007013
Yeo I. A. (2014). “Axial volcanic ridges,” in Encyclopedia of marine geosciences. Eds. Harff J., Meschede M., Petersen S., Thiede J. (Dordrecht: Springer), 1–6. doi: 10.1007/978-94-007-6644-0_2-2
Keywords: mid-ocean ridge, geomorphology, submarine volcanism, Red Sea Rift, Hadarba Deep
Citation: Le Saout M, van der Zwan FM, Schiebener CK and Augustin N (2023) Magmatism at an ultra-slow spreading rift: high-resolution geomorphological studies of a Red Sea Rift segment in Hadarba Deep. Front. Mar. Sci. 10:1273574. doi: 10.3389/fmars.2023.1273574
Received: 06 August 2023; Accepted: 23 November 2023;
Published: 18 December 2023.
Edited by:
Monica Giona Bucci, University of Malta, MaltaReviewed by:
Anne Briais, Centre National de la Recherche Scientifique (CNRS), FranceMarco Ligi, Consiglio Nazionale delle Ricerche (Bologna), Italy
Isobel Yeo, University of Southampton, United Kingdom
Copyright © 2023 Le Saout, van der Zwan, Schiebener and Augustin. This is an open-access article distributed under the terms of the Creative Commons Attribution License (CC BY). The use, distribution or reproduction in other forums is permitted, provided the original author(s) and the copyright owner(s) are credited and that the original publication in this journal is cited, in accordance with accepted academic practice. No use, distribution or reproduction is permitted which does not comply with these terms.
*Correspondence: Morgane Le Saout, bWxlc2FvdXRAZ2VvbWFyLmRl