 Gurucharan Sudarshan1Simy Weil1Weronika Jasińska1Rivka Manor1Oron Goldstein2,3Eliahu D. Aflalo1,4Rivka Ofir3,5Sean V. Zimin1Tom Levy6,7†Benyamin Rosental2,3Yariv Brotman1Amir Sagi1,8*†
- 1Department of Life Sciences, Ben-Gurion University of the Negev, Beer Sheva, Israel
- 2The Shraga Segal Department of Microbiology, Immunology, and Genetics, Faculty of Health Sciences, Ben-Gurion University of the Negev, Beer Sheva, Israel
- 3Regenerative Medicine and Stem Cell Research Center, Ben-Gurion University of the Negev, Beer Sheva, Israel
- 4Department of Life Science, Achva Academic College, Arugot, Israel
- 5Dead Sea and Arava Science Center, Central Arava Branch, Yair Farm, Israel
- 6Institute for Stem Cell Biology and Regenerative Medicine, Stanford University School of Medicine, Stanford, CA, United States
- 7Hopkins Marine Station, Stanford University, Pacific Grove, CA, United States
- 8National Institute for Biotechnology in the Negev, Ben-Gurion University of the Negev, Beer Sheva, Israel
Despite extensive research spanning several decades, a commercial cell line for prawns remains elusive, and we have yet to determine the ideal conditions required for successful in vitro cell cultures of crustaceans. This study marks the first application of mass spectrometry to analyze lipid content changes in prawn culture media, allowing us to investigate how specific metabolites in media correlate with cell cycle and proliferation status. To investigate these relationships, short-term cell culture experiments were conducted using three commercial media: Dulbecco's modified eagle medium (DMEM) high glucose, Opti-Minimal essential media (Opti-MEM), and DMEM:F12. We monitored metabolic activity, performed cell-cycle analysis, and used mass spectrometry to analyze lipid metabolic profiles of culture media. This comprehensive approach enables us to examine the interplay between media lipidomic content and cellular behavior. Our results revealed that all three media sustained cellular metabolic activity. DMEM high glucose and Opti-MEM showed peaks in metabolic activity at day 4, while DMEM:F12 exhibited a peak at day 7. Opti-MEM supported the shortest doubling time, making it ideal for short-term culture. Interestingly, DMEM high glucose retained more attached cells on day 1 and had the highest count on day 4, with a noticeable trend towards the G2/M cell-cycle phase. Moreover, our lipidomic analysis of Opti-MEM revealed significantly higher concentrations of 26 annotated lipids compared to the other media. Notably, lipids like phosphatidylcholine and phosphatidylserine were consistently abundant in all three media, and palmitate levels correlated with proliferation phase. These findings have significant implications for establishing sustainable crustacean cell culture lines. Understanding the lipidomic compositions and their associations with cell-cycle dynamics and proliferation allows for precise conditioning of culture media to promote sustainable growth and delay cellular entry into quiescence phases. This knowledge contributes to the long-term goal of maintaining robust prawn cell cultures for various research and biotechnological applications.
Introduction
Despite several decades of research, a prawn cell line is still not available, and the optimal conditions for successful crustacean in vitro cell cultures are yet to be established. In general, crustacean cell cultures are maintained in a nutrient-rich medium that provides essential amino acids, vitamins, minerals, and growth factors required for cell growth and proliferation of primary hematopoietic cells (Claydon and Owens, 2008). A commonly used medium in the past for crustacean cell culture has been Leibovitz’s L-15 medium, originally developed for insect cell culture with little success (Claydon and Owens, 2008; Thansa et al., 2018). Past attempts to culture embryonic cells from Macrobrachium rosenbergii used Grace’s insect medium, Schneider’s insect medium, and MBL-01 medium. However, the cells failed to stick to the flask and reach proliferation (Frerichs, 1996). Because our focus is on primary embryonic cell culture that includes stem cells and highly proliferative ones, here, we adapted commercially available media known to support both human proliferative and cancer cells including embryonic stem cells (Cheng et al., 2017; Ababzadeh et al., 2020). On the basis of this, we analyzed the same media by liquid chromatography/mass spectrometry (LC/MS) and deduced which lipids could be correlated to proliferation of M. rosenbergii embryonic primary cell culture.
Cellular division involves a wide range of metabolic processes and depends on nutrient availability (Kalucka et al., 2015). The micro-environment supplied by different culture media, and additives will determine the fate of the primary cell culture (Shimizu et al., 2001). The identity of the metabolites in the culture and their correlation with the cell cycle status can potentially help facilitate sustainable cultures. In this study, we grew prawn cells in three commercially available media and then measured their metabolic activity, proliferation rate, and cell cycle during short-term (14 days) primary culture. We selected the three following media: Opti-MEM (complete formulation is confidential; MEM-based medium), including trace elements that facilitate the growth of adherent epithelial, smooth muscle, and primary fibroblast cells (Lee et al., 1996); DMEM:F12, a mixture of DMEM and Hams F12 media, which facilitates the growth of neural cells, human endothelial cells, and fibroblast cells (Ababzadeh et al., 2020); and DMEM high glucose, a modification of Basal Eagle Medium, containing glucose (4.5 g/L), which 1.4- and 4.5-fold higher than in DMEM: F12 and Opti-MEM, respectively. These media have been used to support primary cultures of mouse, chicken, and high-proliferating cancerous cells (Ebert et al., 2002). Fetal bovine serum (FBS) was equally added to all media as a source of growth and attachment factors, lipids, hormones, and binding and transfer proteins.
It has been reported that, to maintain proliferation of cells in culture, the synthesis of lipids is crucial because they are an essential component of cell membranes, with increased demand following division (Patti et al., 2012; Zhu and Thompson, 2019). Lipids such as phosphatidylcholine (PC) act as signaling molecules that bind to G protein–coupled receptors, which, in turn, trigger the activation of Rat sarcoma (RAS), Phosphoinositide 3-kinase (PI3K), Ras-related C3 botulinum toxin substrate (RAC), and RHO to promote cell proliferation, migration, and survival (Snaebjornsson et al., 2020).
To the best of our knowledge, there is no published research regarding the metabolomic profile of any crustacean cell culture media. Therefore, the lipid metabolic footprint obtained from the extracellular culture media was analyzed by linking each annotated lipid to the proliferation phase of the culture.
These promising lipid metabolites could be the modulators needed in a combined strategy using commercially adapted growth media for the successful development of crustacean immortal cell lines.
Materials and methods
Animals
M. rosenbergii prawns were grown to maturity in artificial ponds at Ben-Gurion University of the Negev, Beer Sheva, Israel. Thereafter, to ensure a constant supply of embryos for primary embryonic cell isolation, gravid females were obtained by housing four to six mature females with a blue-claw male in 500-L tanks. The tanks were checked daily for the typical male reproductive guarding behavior to identify fertilized females.
Isolation of M. rosenbergii primary embryonic cells for culture
Because the eggs are held on the abdomen of the female attached to the swimming legs, a disinfection procedure was carried out for surface sterilization of female prawns carrying developed eggs prior to cell isolation; the procedure involved submerging the animals in an aqueous solution of methylene blue (3 parts per million (ppm)) overnight. The entire isolation procedure was done at room temperature (21°C–23°C) and a humidity of 50% (Meitav4000, meitav-tec, Israel). Approximately 14 days following fertilization, embryos with visible eyes were removed from the berried females’ swimming legs with forceps, washed with a sterile saline solution (420 mOsm) containing antibiotics, namely, penicillin-streptomycin solution (1 mg/mL; cat. no. 03-031-1B, Biological Industries, Israel), tetracycline (25 µg/mL; cat. no. T-9823, Merck, USA), and antifungal reagent voriconazole (0.5 µg/mL; cat. no. PZ0005, Merck, USA)—referred to here as saline Penicillin, Streptomycin, Tetracycline, voriconazole (PSTV). The separated eggs were further disinfected in saline PSTV with formalin (1%; cat. no. 252549, Sigma-Aldrich, USA) for 1 min and an iodophor (1 ppm; Polydine, Dr. Fisher, Israel) for 3 min and then rinsed again in saline PSTV for 10 min. The eggs were homogenized in saline PSTV containing a protease and phosphatase inhibitor cocktail (Halt™ Protease Inhibitor; cat. no. 87785, Thermo Fisher Scientific, USA) under aseptic conditions. The homogenate, which consisted of dispersed cells, whole- embryo tissue, and yolk protein, was passed through a 70-μm cell strainer to separate the egg envelopes and non-broken eggs from the dispersed cells. The filtrate was then pelleted by centrifugation at 850 g for 6 min at 18°C, suitable condition for isolation of prawn cells. The residue remaining in the cell strainer was transferred to Eppendorf tubes, each containing collagenase type I (1 mg/mL) and collagenase IV (1 mg/mL) (cat. nos. C0130 and C5138, respectively, Sigma-Aldrich, USA) and incubated for 30 min at room temperature with constant rotation. Afterward, it was centrifuged as above, and the pellet was washed with medium containing 10% FBS (cat. no. 04-127-1A, European grade, heat inactivated, South American origin FBS, Biological Industries, Israel) and combined with filtrated cell pellet. The total cell pellet was resuspended in 2 mL of saline PSTV, slowly poured into a percoll (cat. no. 17-0891-01, GE Healthcare Bio-Sciences AB, Sweden) gradient adjusted with crustacean saline for osmolarity (100%, 1.062 g/mL; 50%, 0.565 g/mL; 25%, 0.282 g/mL; and 12.5%, 0.141 g/mL) and centrifuged again at 1,000g for 15 min at 18°C with reduced deceleration. The percoll gradient was used to separate the different embryonic cell types from the bulky yolk proteins (early embryonic nutrition). The yolk proteins appeared at 12.5% percoll, whereas the cells migrated down the gradient and spread between 12.5% and 50% percoll. All cell types were pooled and used for culture, transferred to a new 15- mL tube, centrifuged, and washed from percoll with up to 10 mL of saline PSTV. The cells obtained were reconstituted in 1 mL of Opti-MEM media (cat. no. 31985-047, Gibco, USA) with PSTV, visualized by trypan blue exclusion (cat. no. 03-102-1B, Biological Industries, Israel), and counted with a hemocytometer.
Morphological description and metabolic activity
Freshly isolated cells were seeded at a density of 300,000 cells per well in 96-well plates in triplicates for each time point of days 1, 4, 7, 10, and 14 (Supplementary Figure 1). The cells were cultured in three different commercial media: Opti-MEM, DMEM:F12 (cat. no. 01-170-1A, Biological Industries, Israel), and DMEM high glucose (hereafter termed as high glucose and DMEM HG in the figures; 500 mL; cat. no. D5671, Sigma Life Sciences, UK). All media were supplemented with 10% FBS and PSTV and osmolarity adjusted to 420 mOsm (Frerichs, 1996). Culture plates were incubated at humified (75%), 5% CO2 incubator 28°C with 5% CO2 and 200 µL of the respective media. After overnight incubation at, all- growth medium was gently removed and refreshed with 200 µL of fresh medium, according to the respective well design. Cells were monitored using an inverted microscope (OLYMPUS CK40, Japan) and imaged using DINOCAPTURE 2.0 (DINO EYEPIECE AM4023, Netherlands) at each time point for morphological difference. The metabolic rate of the cultured cells was measured using a CCK-8 proliferation kit (cat. no. 96992, Merck, Israel) according to the manufacturer’s protocol. The CCK-8 kit is based on the bio-reduction of WST-8(2-(2-methoxy-4-nitrophenyl)-3-(4-nitrophenyl)-5-(2,4-disulfophenyl)-2H-tetrazolium, monosodium salt) by cellular dehydrogenases to an orange formazan product that is directly proportional to the number of cells. After 3 h of incubation in an incubator, the absorbance was read at 450 nm using a TECAN spectrophotometer and analyzed using Magellan software. In addition to the experiment described, a standard curve was constructed for each medium to correlate the Optical Density (OD) values to cells number. Cells were seeded at different densities: 50,000, 100,000, 200,000, 300,000, and 1 × 10⁶, and grown in three different media, as mentioned above (Supplementary Figure 2). With the known number of cells, we can calculate the doubling time in specific media using Omni Calculator (https://www.omnicalculator.com/biology/cell-doubling-time). Significance compared between two media at specific time points was determined using generalized additive models (GAMs) (Mundo et al., 2022). In addition, for Florescent- Activated Cell Sorting (FACS) analysis, three million cells were seeded on a six-well plate and incubated at 28°C with 5% CO2 overnight with Opti-MEM. The next day, the cells were harvested from the plate and spun down at 850g for 5 min and eluted in 1 mL of Opti-MEM. The cells were stained with propidium iodide (PI; cat. no. 81845, Merck Germany; 50 µg/mL) to estimate the live/dead cells and immediately sorted through FACS (SONY SH800S cell sorter). Only dead cells incorporate the staining and are referred to as PI positive. The viable cells will not incorporate the staining, therefore referred to as PI negative. The PI negative was calculated as a percentage fraction from the total, resulting in cell survival rate. The cells were analyzed and sorted into different populations in separate tubes containing Opti-MEM. Each different subpopulation sorted was plated separately to visualize the morphology of the cells. The cells were pelleted at 850g for 5 min, eluted in 200 µL of Opti-MEM, and seeded in a separate 96-well plate. Cells were visualized under an inverted microscope.
Cell cycle analysis and metabolomics
In parallel to monitoring the culture by morphology, cells were seeded from the same batch for cell cycle and metabolomic analyses in the same experimental pattern as described above (Supplementary Figure 1). For cell cycle analysis (CCA), cells were washed twice with crustacean saline, pelleted, and fixed in 4% Para Formaldehyde (PFA). After fixation, the cells were washed twice with fresh saline and stored in a cryo-preservative (10% Dimethyl Sulfoxide (DMSO) and 90% FBS). Later, cells were pelleted and permeabilized using permeabilization buffer X1 (cat. no. 00-8333-56, Thermo Fisher Scientific, USA) for 20 min, stained with PI for 20 min, and analyzed using a Beckman Coulter Gallios flow cytometer. The flow cytometry results were displayed using CytExpert v2.5 software. Significance compared among the phases of cell cycle along specific time points was determined using GAM (Mundo et al., 2022). For metabolomics, additional wells in triplicates with 200 µL of each of the media without cells were cultured in the same pattern, serving as controls. For metabolomic extraction, 200 µL from the control and media with cells was transferred to an Eppendorf tube and centrifuged at 850g for 5 min. Identical volumes (150 µL) from the clear supernatants were collected and stored at −20°C for further extraction.
Metabolomic analysis
The samples tubes were kept in ice, extracted with 1 mL of pre-cooled (−15°C) mixture 1 [methyl tert-butyl ether: methanol (3:1, v/v); HPLC grade. J. T. Baker, cat. no. 90422500; HPLC grade, J. T. Baker, cat. no. 983003] followed by vigorous vortexed. Empty tubes (without any medium) served as technical blanks. The samples were incubated for 10 min on an orbital shaker (Unimax 1010, Heidolph, Germany) followed by ultrasonic bath (Elmasonic S 30, Germany) incubation for 10 min. Phase separation of the lipid metabolites was obtained by addition of 0.5 mL of cold (4°C) extraction mixture 2 [methanol: ultrapure water (LC-MS grade; J. T. Baker, cat. no. 983103): (1:3, v/v)] and vortexed. The apparent phases were observed in the tubes, and completely determined after centrifugation for 5 min at 17,000 g, 4°C. The upper phase containing the lipids metabolites was transferred (0.5 mL) to a new 1.5- mL Eppendorf tube and completely evaporated in a speed vacuum concentrator (Savant Refrigerated Vapor Traps, RVT 5105, Thermo Scientific, US) for overnight. The dried extracted lipid metabolites were stored at −80°C till preparation for LC/MS (Pre-guard column, 2.1 mm × 5mm × 1.7 μm; VanGuardTM, Waters, part no. 186003978) running. A volume of 200 μL of resuspension mixture [70% (v/v) acetonitrile, J. T. Baker, cat. no. 982903, 30% (v/v) isopropanol, Bio-Lab, cat. no. 001626410100] was applied to each dried extracted sample, and tubes were vortexed vigorously and incubated at room temperature (RT) for 15 min and in an ultrasonic bath for 10 min. The last step of metabolite’s resuspension involved centrifugation for 5 min at 17,000 g, at room temperature (RT), and 100 μL of clear supernatant was transfered to a 2- mL glass vial with an insert (cat. no. 03-FISV, Thermo scientific, USA) adequate for running in LC-MS using a UPLC system and mass spectrometer (Q-Exactive) (Lapidot-Cohen et al., 2020). Xcalibur Qual Browser (Thermo Fisher Scientific) was used to visualize the peak, retention time, mass-to-charge ratio and extract peak area of the metabolites. MetaboAnalyst 5.0 was further used to compare and analyze the data (https://www.metaboanalyst.ca/home.xhtml). The analyzed metabolomic profiles were represented by metabolite relative abundances and calculated as Hellinger-transformed raw metabolite abundances combined in a Euclidean distance matrix. To study the metabolites relation to proliferation and quiescence (viable non proliferating cells), we incorporated a binary factor of proliferation vs. quiescence, for two alternative thresholds of proliferation period (≤ 4 days; or ≤ 7 days, in view of the longer proliferation period on DMEM:F12 medium indicated by OD smooth plot). After the proliferation factor was defined, similarity percentage analysis (SIMPER) was applied to the metabolite relative abundance data, to determine the individual contributions of different metabolites to proliferation vs. quiescence contrast (pooling over media and cells vs. control condition). Consequently, the insignificant metabolites were removed from the metabolomic profile matrix, and a redundancy analysis (RDA) was performed upon it, with the explanatory variables of medium identity, cells vs. control, and proliferation conditions. The permutation test ANOVA was applied on the RDA scores in relation to the explanatory factors, i.e., medium, control vs. cells, and proliferation conditions.
Results
Cell morphology in M. rosenbergii embryonic primary culture
Primary embryonic cells used for the study attached very well to the plate, whereas debris and dead non-attached cells were removed. Sorting for different cell populations revealed different types and morphologies mostly comprising of single round cells and cells in doublets (Supplementary Figures 3C–J). Primary embryonic cells seeded at day 1 did not show any visible difference between the three different media in terms of size and granularity (Figure 1). From day 4, visible morphologies of cells forming clusters became apparent in the different culture media. M. rosenbergii embryonic primary cells cultured in Opti-MEM tend to form clusters. These were well attached to the plate and formed connections with other cell clusters. The culture also retained a mixed population in terms of cell size until day 14. DMEM:F12 tended to exhibit similar characteristics as Opti-MEM during the course of the experiment. High glucose started with similar morphology as the other two media and displayed completely round single cells with no clusters or connections visible on day 14. Opti-MEM cultures incubated overnight had ~70% viable cells. The cells sorted out in the FACS displayed diverse cell populations, sized between 3 µm and 30 µm, including granular and non-granular cells (Supplementary Figure 3).

Figure 1 M. rosenbergii embryonic primary cell culture grown in three different media. Representative images of the cultures at three time points during the experiment for each medium. Scale bar = 50 µ.
Metabolic activity of M. rosenbergii primary embryonic cell culture
An increment in cellular metabolic activity was observed in all media used from day 1 (Figure 2A), with a peak at day 4 when cultured in high glucose or Opti-MEM and at day 7 when cultured in DMEM:F12. DMEM:F12 also retained the lowest number of cells in the plate compared with high glucose, which retained the highest number of cells. All three medium graph patterns suggest that the cells proliferate in the first 7 days (days 1–7) and become quiescent during the last 5 days (days 10–14). Opti-MEM maintained a plateau until day 10, which declined on day 14 but was still higher compared with that on day 1. High glucose on day 14 ended with a similar value to day 1. All media sustained metabolic activity and total number of cells in culture at day 4, suggesting a sustainable proliferation. Significant changes in OD value trajectories over time were calculated through per-medium derivatives of the smooth functions with their respective confident intervals (CIs). The regions for which the CIs did not include zero, meaning significant difference, were highlighted as colored areas (Figures 2B–E).
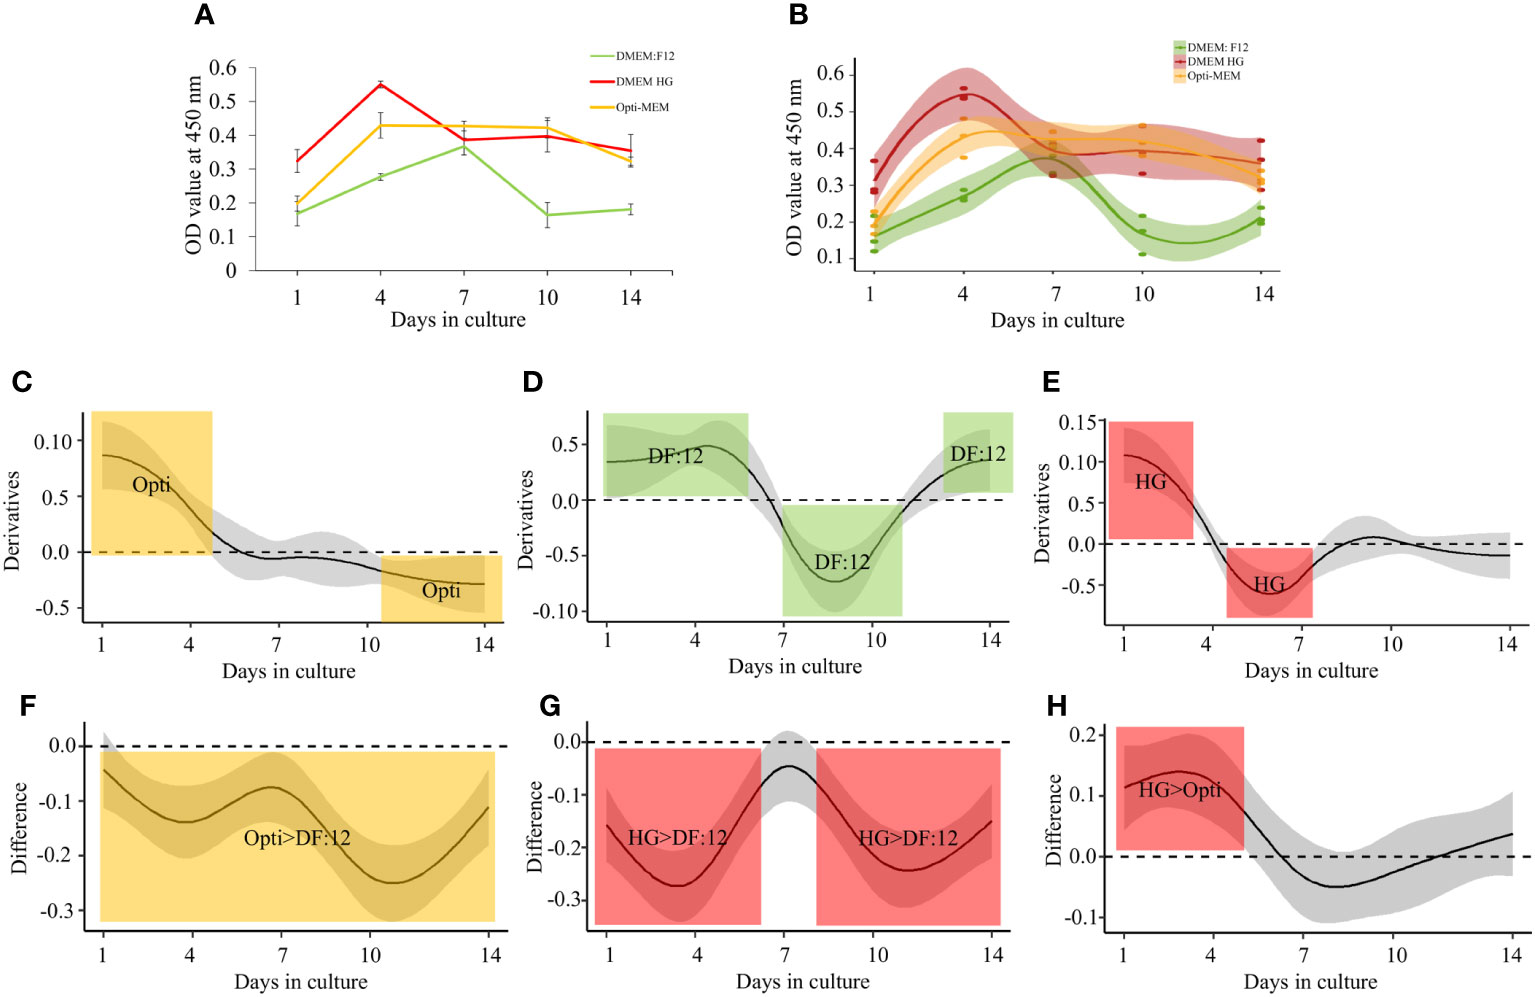
Figure 2 Metabolic activity of M. rosenbergii embryonic primary cell culture and statistical significance differences between media. (A) OD values of CCK-8–treated cultures, growing with three different media at five different time points. (B) Generalized additive model (GAM) analysis showing the confidence interval of smooth of each media at respective time points. (C–E) Significance of individual media in colored region. (F–H) Significance of two media compared, marked with colored regions.
The comparison between the smooth functions of each two media indicates the difference in OD values, showing significantly higher values for Opti-MEM compared with that for DMEM:F12 throughout the experiment (Figure 2F). The metabolic activity of cells growing in high glucose was significantly higher throughout the time course except at day 7 (Figure 2G) compared with these grown in DMEM:F12 and also when compared with these grown in Opti-MEM up to day 4 (Figure 2H). Another advantage of high glucose is the higher attachment of seeded cells on day 1—four times higher than Opti-MEM. A standard curve for all the media was generated on the basis of the cell densities and OD value using a CCK-8 kit (Supplementary Figure 1). Each medium standard curve was used to calculate the number of cells in culture at all time points based on the OD value (Table 1A). The doubling time, calculated on the basis of the number of viable cells in culture, was the shortest in Opti-MEM for the first 4 days (0.92 days), whereas DMEM:F12 and high glucose were almost similar at 1.22 and 1.87 days, respectively (Table 1B).
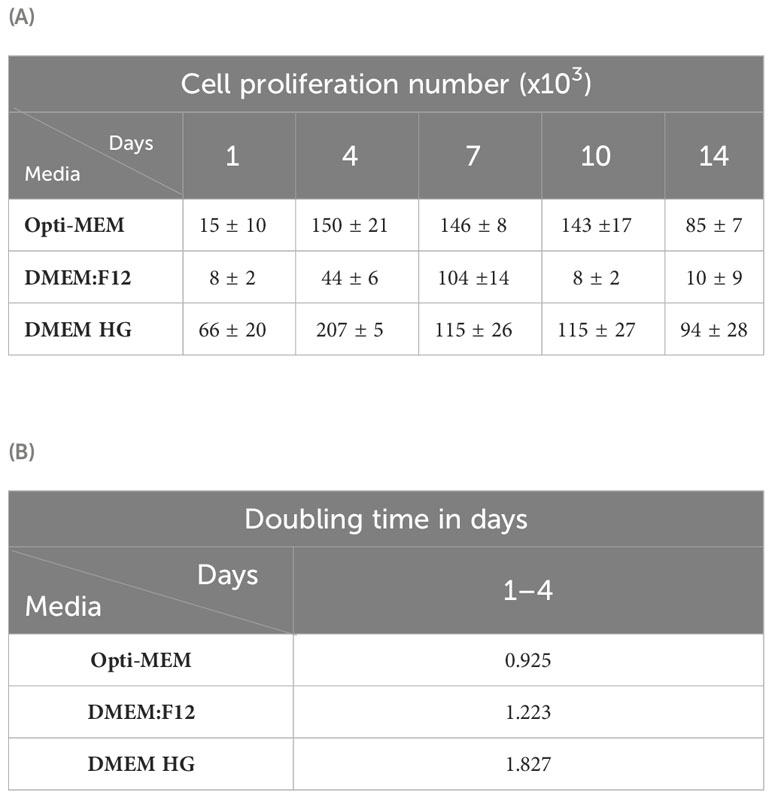
Table 1 Number of cells proliferating and cell doubling times in M. rosenbergii embryonic primary cell culture. (A) Calculated cell number for each medium at specific time points during the experiment. (B) Calculated doubling time of cells in culture for each specific medium up to day 4.
Cell cycle analysis of M. rosenbergii primary embryonic cell culture
CCA of M. rosenbergii primary embryonic cell culture is presented in Figure 3. The debris and unstained cells were removed by initial gating during analysis (Figure 3A). The bar graph shows the percentage of calculated cell distribution in different cycle phases from normalized PI-positive cells in all media. In all media tested, 60%–80% of the cells were in G0/G1, 8%–17% in the S phase, and 11%–19% in G2/M on day 1. In Opti-MEM, 15% proliferation was observed, maintaining the same proliferating potential as in day 1 until the end, whereas S phase at time points 4 and 14 was significantly lower compared with that at other days (Figure 3B). After being cultured for 3 days in Opti-MEM, the number of cells increased an order of magnitude compared with that for day 1, sustained by the faster doubling time of cells in Opti-MEM. Differently, DMEM:F12 sustained cell proliferation potential up to 14 days, only decreasing on day 4—the G2/M phase at day 4 and S phase at days 10 and 14 were significantly lower (Figure 3C). High glucose at day 14 had twice the number of cells in S phase compared with that at day 4, yet the number of cells was stable, suggesting a quiescent phenotype from day 4. At days 10 and 14, G2/M phase cases were significantly lower (Figure 3D).
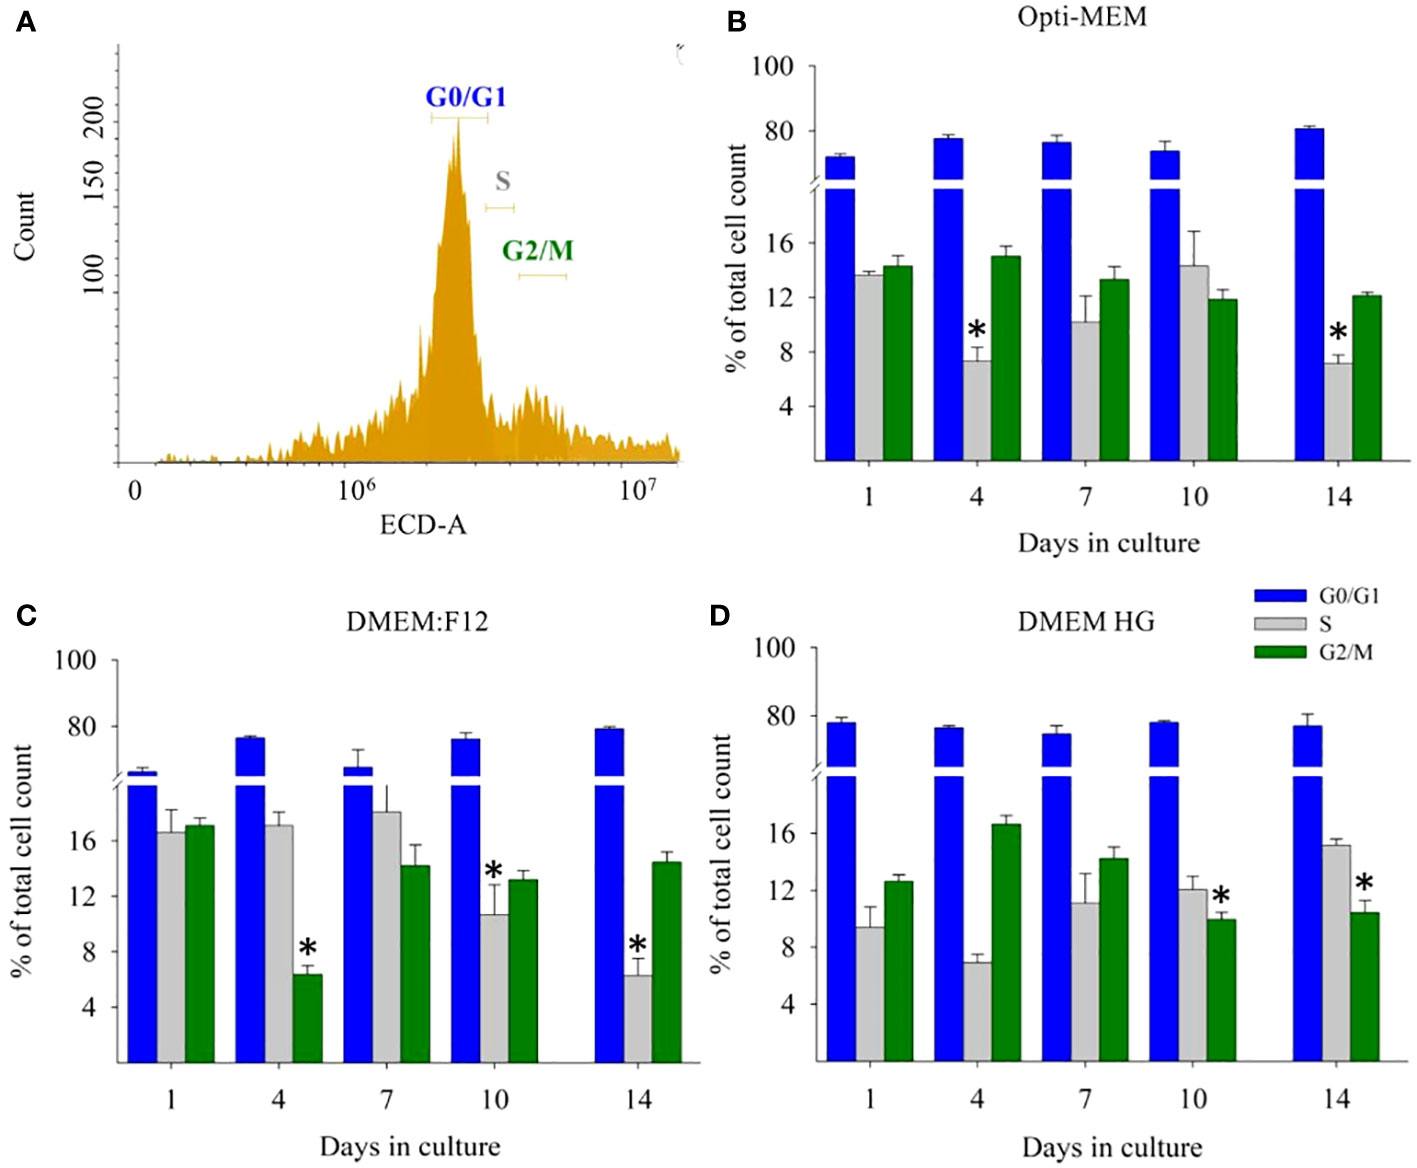
Figure 3 M. rosenbergii embryonic primary culture cell cycle analysis by FACS. (A) Gating of specific PI-stained single- cell populations and DNA content profile. x- axis represents red filter used, and y- axis represents cell count. Calculated G0/G1, S, and G2/M phase mean values and SD of cells grown in (B) Opti-MEM, (C) DMEM:F12, and (D) high glucose at specific time points during the experiment. The blue bar denotes G0/G1, the gray bar denotes S phase, and the olive green denotes G2/M phase. GAM analysis of each phase compared at different time points. *p < 0.001.
Lipid metabolomic footprint of M. rosenbergii primary embryonic cell culture
We conducted LC/MS analysis of all annotated lipids, comparing conditioned media (collected from culture with cells) to control media (without cells). Differences in secreted metabolites were identified in the media. Figures 4A–C show 26 (Opti-MEM), four (DMEM:F12), and five (high glucose) annotated metabolites with significantly different relative abundances. Detailed annotated metabolites are presented in Supplementary Table 1. Two lipids were significantly higher in abundance in all three media: phosphatidylserine (PS) (PS_40_4) and PC (PC_36_5_1). The intensity patterns of both metabolites significantly increased from day 1 in media with cells, up to 14 days, compared with that in control media without cells.
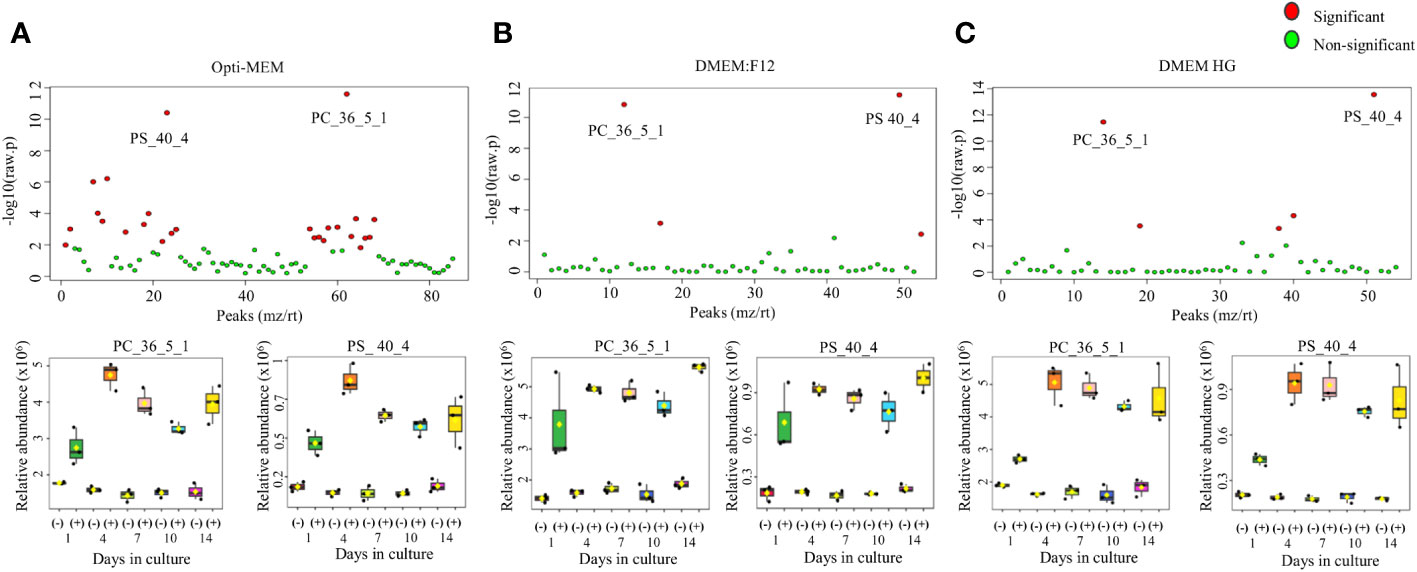
Figure 4 Lipid analysis of relative quantitative profiles of LC/MS metabolites in culture media of M. rosenbergii embryonic primary cell cultures. ANOVA analysis depicting significant metabolites (red dots) and non-significant ones (green dots) for (A) Opti-MEM, (B) DMEM:F12, and (C) DMEM high glucose. p < 0.0001. The intensity pattern during culture of two metabolites common in all media, PC_36_5_1 (phosphatidylcholine) and PS_40_4 (phosphatidylserine), is presented below each medium, showing the time-dependent profile abundance in culture.
Lipid profile analysis in view of metabolites either provided by media or secreted by cells in culture.
The distribution of metabolites that were either provided by media and serum (utilized by the cells based on our deduction) or secreted by the cells into the media is shown in a heat map [Figure 5, showing a comparison between each medium of the lipids in conditioned media (with cells) to those of the control (media without cells)]. PC, PS, and fatty acids were the common metabolites among the three media. Lipid classification is provided for each medium in terms of phospholipids, triacyl lipids, and diacyl lipids. All extracted peak areas of each annotated metabolite analyzed from the chromatograms of LC/MS comparing the two groups (control and media with cells) were determined for the highest and lowest abundant ratio. In Opti-MEM, 30 high-abundance ratio lipids were found, compared with 20 in DMEM:F12 and 14 in high glucose. In contrast, the cells cultured in Opti-MEM secreted the lowest number of fatty acids compared with the others. In addition, cells grown in Opti-MEM secreted only 26 lipids, compared with 35 in DMEM:F12 and 40 in high glucose. On the basis of this, the highest and lowest peak area of metabolites were determined.
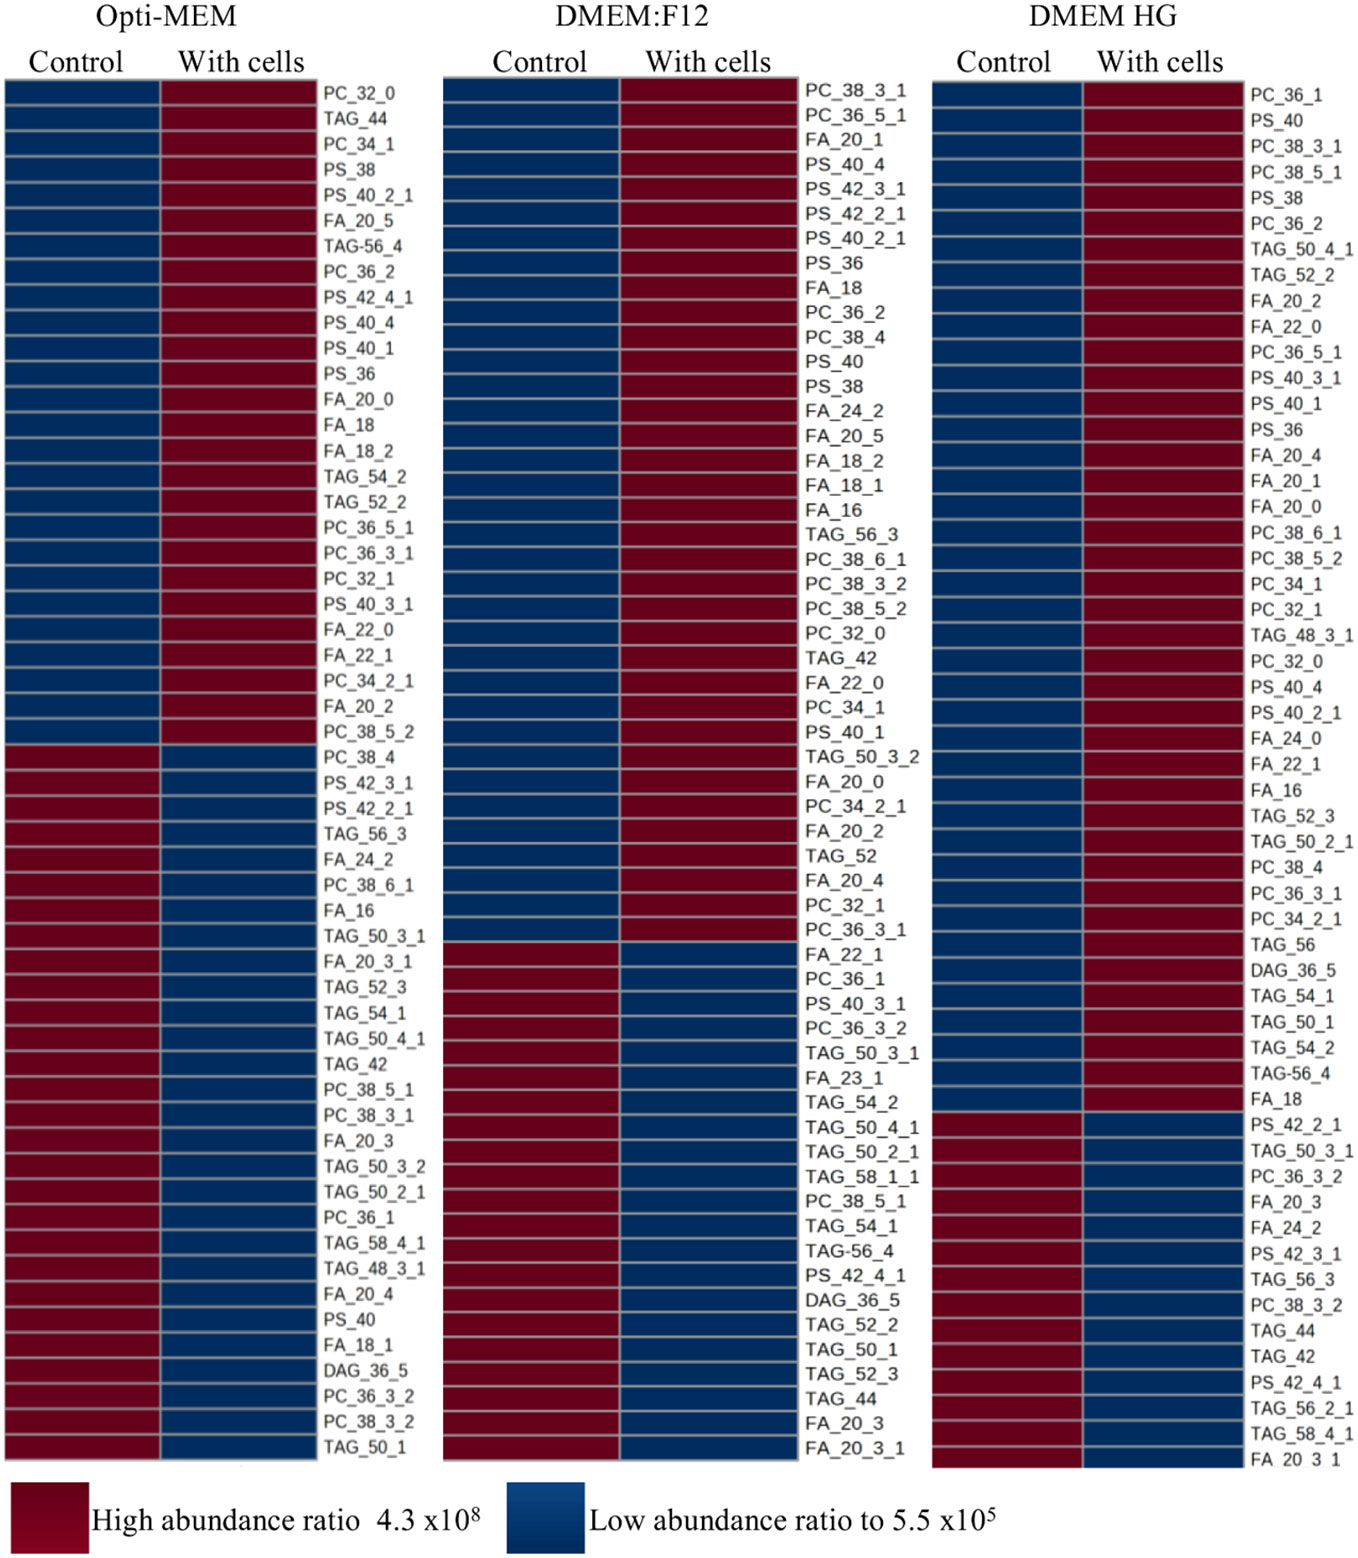
Figure 5 Heat map ANOVA analysis of relative quantitative profiles of LC/MS medium metabolites present in each medium of M. rosenbergii embryonic primary cell cultures compared with control (without cells). High abundance ratio of relative quantitative metabolites is marked in red, and lower in blue. p < 0.0001.
Correlating the metabolomic profile to the proliferative state of the cells
We performed correlation between medium and proliferation to identify metabolites relevant to culture condition. Cell number peaked on day 4 of the culture with the media Opti-MEM and high glucose and on day 7 in the presence of DMEM:F12. Next in Figures 6A, E, we analyzed significant metabolites related to either proliferation or quiescence. The thresholds for proliferation were set by the peak of metabolic activity and its directly proportional cell-count number (i.e., day 4 for Opti-MEM and high glucose and day 7 for DMEM:F12), and the other phases are considered as quiescence (not proliferating). Figure 6B indicates a group of four metabolites at day 4, out of which one correlates with proliferation and three with quiescence. For day 7, seven significant metabolites were indicated, all of which did not correlate with proliferation (Figure 6F). In terms of variance, the day 7 threshold appears more salient (RDA1 > 24% vs. RDA1 > 12%) compared with day 4 (Figures 6C, G). The RDA metabolites comparing the two conditions (with and without cells) depict the effects of the significant metabolites from the SIMPER table in relation to RDA axes presented in Figures 6D, H.
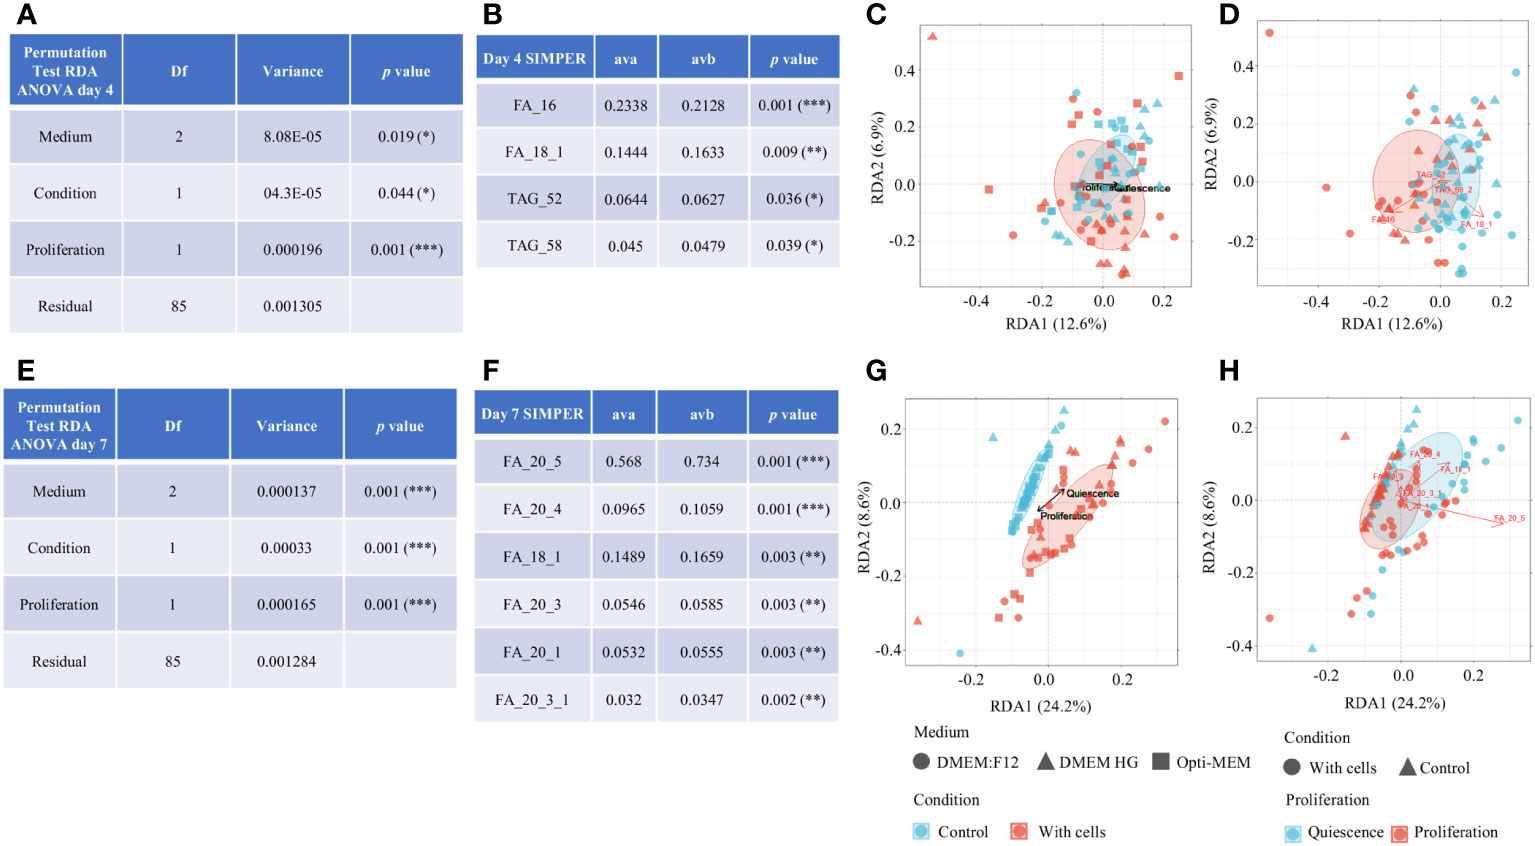
Figure 6 Statistical binary factor incorporation correlating metabolomic profile to the proliferative state of the cells. Permutation test for day 4 (A) and day 7 (E). SIMPER analysis was done to identify metabolites significantly correlated to proliferation state of culture (B) day 4 and (F) day 7; ava, average abundance in group a (proliferation); avb, average abundance in group b (quiescence). RDA media: compares the three media with regard to condition (control and with cells). The ellipses represent the confidence intervals of the group centroids. The black arrow mark denotes the direction of proliferation area and quiescence on the graph. (C) Day 4 and (G) day 7. RDA metabolites: Compares control vs. with cells condition and depicts the effects of the significant metabolites from the SIMPER table in relation to RDA axes. Red arrows mark the metabolites in direction to proliferation or quiescence in relation to RDA media. (D) Day 4 and (H) day 7.
Discussion
Much attention is given in recent years to generating immortalized lines of crustaceans—without much success (Claydon and Owens, 2008). We present here results that may contribute to this area.
Embryos are the prime sources for high-proliferating stem cells that possess the ability to self-renew and differentiate into a variety of cells found in mature organisms. Embryonic cells also tend to adapt to in vitro culture after isolation when the right conditions are supplied (Stadler et al., 2010). It is well established that placing embryonic stem cells in contact with other cells or tissues can also influence their behavior, e.g., co-culture with specific cell types or tissue explants can induce differentiation toward specific lineages (Lee et al., 2008). Therefore, we selected this specific type of cell origin with the aim of using this mixed population of pluripotent stem cells and early-stage differentiating cells to establish M. rosenbergii primary embryonic cell culture. Because we used eggs containing relatively developed embryos (at the stage that the eye already developed), a variety of cells were present in the culture. Many distinct types of cell morphologies were portrayed by this heterogeneous population, including fibroblast-like, semi-granulated, granulated, small round, large round, and cells resembling mesenchymal stem. The various types of cells presented here probably include endothelial cells responsible for the connections formed between clusters. This phenomenon is similar to reports of human endothelial cells from endothelial enlargement of cytoplasm that induce extra cellular matrix to form connections (Davis and Senger, 2005). In human cells, these connections are often referred to as capillary tubes transporting gases, hormones, and other vital factors for the growth and sustainability of neighboring cell clusters (Cheng et al., 2017). The cell clusters themselves might be positive signs of cell viability and sustainability, as such clusters were suggested to contribute to the maintenance of tumorigenicity in cancerous cells (Kapeleris et al., 2020).
Because the composition of the culture medium, the presence of growth factors, and signaling molecules can all influence the proliferation and differentiation of cells, we aimed at screening these factors in a comparative study using different media. We studied metabolites that are consumed or secreted at each point of the cell cycle. The metabolic activity of primary cells in culture can be directly correlated to dividing and proliferating cells (Zhu and Thompson, 2019). Indeed, the metabolic activity of the cultures in all tested media presented two distinguished different phases: the proliferating phase between days 1 and 4/7, and the quiescence phase (not proliferating) between days 10 and 14. At the proliferation phase, Opti-MEM has an extremely high proliferating index and the fastest doubling time. From the CCA, although almost 70% of the cells were at the G0/G1 phase in all media, Opti-MEM retained 12%–13% as a constant proliferating potential cells from the beginning to the end of the experiment, making this medium optimal for short-term studies such as short gene editing research (Molcho et al., 2022). A variety of cell lines such as Huh-7, Human embryonic kidney cells (HEK)293, and Jurkat cells have the doubling time of M. rosenbergii primary embryonic cell in Opti-MEM. The percentage of proliferating cells in our primary cell culture, 13%–18%, does not differ from epithelial cell line HT-29 from colorectal adenocarcinoma, known to have a high proliferation rate, approximately 18%–25% in G2/M as shown by Ho and Chung (Ho et al., 2009; Chung et al., 2017).
In the heat map presented, if the control media have low abundance and media with cells have high abundance, this denotes that the cells secreted the metabolite; and vice versa: If control has high abundance and media with cells has low abundance, it denotes that the cells consumed the metabolite. The differences in performance of the cultures between the media raise the question: Which of the compounds in the media are influencing these patterns. From the heatmap, in the presence of Opti-MEM, the cells have many more lipid metabolites compared with the other two media. We assume that the cells cultured in Opti-MEM are exposed to many metabolites compared with the situation in the other media. This forces them, in the other media, to invest in synthesizing the elements that are not provided that are required for sustainability and survival. Yao et al. (2016) demonstrated that exogenous palmitate is preferred over de novo synthesis in proliferating fibroblasts, HeLa, and H460 cells (Yao et al., 2016). Indeed, in Opti-MEM, this metabolite is found in higher concentrations compared with that in the two other media tested. All the media used provide sustainability to the cells in culture. Considering the metabolic activity, the directly proportional number of cells, and the CCA, we conclude that Opti-MEM is the best medium. High glucose, on the other hand, showed the highest number of cells retained in culture and had the highest number of cells in culture at day 4. We, therefore, suggest a combination of Opti-MEM and high glucose for long-term culturing. Moreover, in our RDA statistical analysis, from all annotated lipid metabolites, palmitate (FA_16) was correlated significantly to the proliferation phase of the primary culture. This is consistent with human fibroblast studies in which researchers have shown that proliferating cells tend to synthesize two- to three-fold more palmitate compared with quiescent cells (Louie et al., 2013). Moreover, less palmitate is being catabolized in these proliferating fibroblasts cells. All this points toward accumulation of intracellular palmitate reservoirs that are required for the replication of cellular membranes (Louie et al., 2013). In HeLa cells, pharmacological inhibition of palmitate synthase led to G2/M arrest, an effect that could not be reversed by exogenous addition of palmitate. Palmitate impairs RhoA activation and, thus, furrow ingression (Zhang et al., 2010). Moreover, the knockdown of fatty acid synthase as well as a choline-deficient diet alters the expression of genes related to G2/M progression in human cells (Scaglia et al., 2014). In proliferating fibroblasts enriched with palmitate, the researchers observed increased labeling of all palmitate-derived complex lipids that were examined relative to quiescent fibroblasts. These included PC, phosphatidylethanolamine, PS, phosphatidylinositol, and sphingosine species (Yao et al., 2016). In our cultures, both PC and PS were in higher abundance in all media in which cells were cultured. These two complex lipids were secreted by the embryonic cells in all media, suggesting that they are essential for sustaining the cells in culture, with a tendency for higher levels in the proliferation phase.
The metabolism of proliferating cells (including cancer cells) is adapted to facilitate the uptake and incorporation of nutrients into the biomass needed to produce a new cell (Vander Heiden et al., 2009). Warburg observed in 1924 that cancer cells metabolize glucose by aerobic glycolysis, differently to normal tissues (Warburg, 1925). Therefore, with the novel methods that we use nowadays, additional screening of polar metabolites in prawn cultured cells media by LC/MS and GC, revealing metabolite abundance like lactate, amino acids, pyruvate, and glucose, will facilitate a better understanding of the mechanistic links between metabolism and proliferation. It may ultimately lead to applicative suggestions for prolonging the proliferating phase and delaying the quiescence phase.
Quiescence is a reversible state of cell cycle arrest in which cells temporarily stop dividing and remain metabolically active. Cells in quiescence are not dead, but they are not actively dividing. This state is also known as the, G0 phase in which cells can exit and re-enter active cell cycles when stimulated by specific signals such as mitogens, nutrients in media, and contact inhibition (Braun-Dullaeus et al., 1998). We concluded that, under the conditions provided during this moderate short-term primary culture, our media should be reinforced with extra mitogenic factors to sustain the high proliferation potential of the culture and postpone/impede the transition to quiescence state as similarly achieved in human cells (Jeon et al., 2021). However, lipid metabolism and the accumulation of lipids, including triacylglycerols, have been implicated in cellular processes that are associated with quiescence and senescence (Hamsanathan and Gurkar, 2022). Accordingly, also in our primary cell culture, in the RDA analysis, in addition to palmitate that correlated to the proliferative phase of the culture, two triacylglycerols were pointed to be correlated to quiescence. In humans, quiescent cells, such as those in G0 phase, often show increased lipid metabolism and the accumulation of lipid droplets, which may serve as an energy reserve to support cell survival during this state of cell cycle arrest. Similarly, senescent cells also exhibit changes in lipid metabolism and accumulate lipid droplets, which may contribute to the altered cellular metabolism and morphology associated with this state of irreversible cell cycle arrest (Hamsanathan and Gurkar, 2022). All the above metabolites and more are involved in signaling pathways to induce proliferation in cells. The present study contributes to our understanding of the importance of the addition of essential metabolites to achieve constant long-term (> 14 days) proliferation with confluency and elaboration of passages. With extensive future research, these lipid metabolites could serve as master keys in the establishment of qualified culture media toward the development of crustacean immortal cell lines.
Data availability statement
The raw data supporting the conclusions of this article will be made available by the authors, without undue reservation.
Ethics statement
The manuscript presents research on animals that do not require ethical approval for their study.
Author contributions
GS: Formal Analysis, Investigation, Validation, Conceptualization, Methodology, Writing – original draft, Writing – review & editing. SW: Conceptualization, Methodology, Project administration, Writing – review & editing. WJ: Software, Writing – review & editing, Formal Analysis. RM: Software, Supervision, Validation, Writing – review & editing. OG: Formal Analysis, Writing – review & editing. EA: Formal Analysis, Methodology, Software, Validation, Visualization, Writing – review & editing. RO: Conceptualization, Supervision, Writing – review & editing. SZ: Formal Analysis, Validation, Writing – review & editing. TL: Formal Analysis, Writing – review & editing. BR: Conceptualization, Resources, Supervision, Writing – review & editing. YB: Conceptualization, Formal Analysis, Resources, Writing – review & editing. AS: Writing – review & editing, Funding acquisition, Methodology, Resources, Supervision, Visualization.
Funding
The author(s) declare financial support was received for the research, authorship, and/or publication of this article. Funding for this study was supported by the Ministry of Science and Technology, Israel-Taiwan collaboration 00019994 and was partially funded by the Gruss Lipper Postdoctoral Fellowship awarded to TL. The authors declare no competing financial interests. The work of BR was supported by the Israel Science Foundation (ISF, Grants Nos. 1416/19 and 2841/19).
Acknowledgments
We would like to thank Enzootic Ltd. and Colors Farm for the supply of embryos for the study. We would like to thank Prof. Ofer Ovadia, Department of Life Sciences, BGU, for the discussion regarding the statistical analysis.
Conflict of interest
The authors declare that the research was conducted in the absence of any commercial or financial relationships that could be construed as a potential conflict of interest.
Publisher’s note
All claims expressed in this article are solely those of the authors and do not necessarily represent those of their affiliated organizations, or those of the publisher, the editors and the reviewers. Any product that may be evaluated in this article, or claim that may be made by its manufacturer, is not guaranteed or endorsed by the publisher.
Supplementary material
The Supplementary Material for this article can be found online at: https://www.frontiersin.org/articles/10.3389/fmars.2023.1270491/full#supplementary-material
References
Ababzadeh S., Farzin A., Goodarzi A., Karimi R., Sagharjoghi Farahani M., Eslami Farsani M., et al. (2020). High porous electrospun poly(ϵ-caprolactone)/gelatin/MgO scaffolds preseeded with endometrial stem cells promote tissue regeneration in full-thickness skin wounds: An in vivo study. J. Biomed. Materials Res. Part B Appl. Biomaterials 108, 2961–2970. doi: 10.1002/jbm.b.34626
Braun-Dullaeus R. C., Mann M. J., Dzau V. J. (1998). Cell cycle progression. Circulation 98, 82–89. doi: 10.1161/01.CIR.98.1.82
Cheng H.-W., Chen Y.-F., Wong J.-M., Weng C.-W., Chen H.-Y., Yu S.-L., et al. (2017). Cancer cells increase endothelial cell tube formation and survival by activating the PI3K/Akt signalling pathway. J. Exp. Clin. Cancer Res. 36, 27. doi: 10.1186/s13046-017-0495-3
Chung S., Kim S. H., Seo Y., Kim S. K., Lee J. Y. (2017). Quantitative analysis of cell proliferation by a dye dilution assay: Application to cell lines and cocultures. Cytometry A 91, 704–712. doi: 10.1002/cyto.a.23105
Claydon K., Owens L. (2008). Attempts at immortalization of crustacean primary cell cultures using human cancer genes. In Vitro Cell. Dev. Biol. Anim. 44, 451–457. doi: 10.1007/s11626-008-9141-x
Davis G. E., Senger D. R. (2005). Endothelial extracellular matrix. Circ. Res. 97, 1093–1107. doi: 10.1161/01.RES.0000191547.64391.e3
Ebert D. H., Deussing J., Peters C., Dermody T. S. (2002). Cathepsin L and cathepsin B mediate reovirus disassembly in murine fibroblast cells. J. Biol. Chem. 277, 24609–24617. doi: 10.1074/jbc.M201107200
Frerichs G. N. (1996). In vitro culture of embryonic cells from the freshwater prawn Macrobrachium rosenbergii. Aquaculture 143, 227–232. doi: 10.1016/0044-8486(96)01281-1
Hamsanathan S., Gurkar A. U. (2022). Lipids as regulators of cellular senescence. Front. Physiol. 13, 796850. doi: 10.3389/fphys.2022.796850
Ho K., Yazan L. S., Ismail N., Ismail M. (2009). Apoptosis and cell cycle arrest of human colorectal cancer cell line HT-29 induced by vanillin. Cancer Epidemiol. 33, 155–160. doi: 10.1016/j.canep.2009.06.003
Jeon R. L., Gilbert C., Cheng J., Putz A. M., Dyck M. K., Plastow G. S., et al. (2021). Proliferation of peripheral blood mononuclear cells from healthy piglets after mitogen stimulation as indicators of disease resilience. J. Anim. Sci. 99, skab084. doi: 10.1093/jas/skab084
Kalucka J., Missiaen R., Georgiadou M., Schoors S., Lange C., De Bock K., et al. (2015). Metabolic control of the cell cycle. Cell Cycle 14, 3379–3388. doi: 10.1080/15384101.2015.1090068
Kapeleris J., Zou H., Qi Y., Gu Y., Li J., Schoning J., et al. (2020). Cancer stemness contributes to cluster formation of colon cancer cells and high metastatic potentials. Clin. Exp. Pharmacol. Physiol. 47, 838–847. doi: 10.1111/1440-1681.13247
Lapidot-Cohen T., Rosental L., Brotman Y. (2020). Liquid chromatography-mass spectrometry (LC-MS)-based analysis for lipophilic compound profiling in plants. Curr. Protoc. Plant Biol. 5, e20109. doi: 10.1002/cppb.20109
Lee H. J., Yu C., Chansakul T., Varghese S., Hwang N. S., Elisseeff J. H. (2008). Enhanced chondrogenic differentiation of embryonic stem cells by coculture with hepatic cells. Stem Cells Dev. 17, 555–563. doi: 10.1089/scd.2007.0177
Lee J. H., Jang S. I., Yang J. M., Markova N. G., Steinert P. M. (1996). The proximal promoter of the human transglutaminase 3 gene. Stratified squamous epithelial-specific expression in cultured cells is mediated by binding of Sp1 and ets transcription factors to a proximal promoter element. J. Biol. Chem. 271, 4561–4568. doi: 10.1074/jbc.271.8.4561
Louie S. M., Roberts L. S., Mulvihill M. M., Luo K., Nomura D. K. (2013). Cancer cells incorporate and remodel exogenous palmitate into structural and oncogenic signaling lipids. Biochim. Biophys. Acta 1831, 1566–1572. doi: 10.1016/j.bbalip.2013.07.008
Molcho J., Manor R., Shamsian M., Sudarshan G., Ofir R., Parker D., et al. (2022). On genome editing in embryos and cells of the freshwater prawn Macrobrachium rosenbergii. Aquaculture 558, 738391. doi: 10.1016/j.aquaculture.2022.738391
Mundo A. I., Tipton J. R., Muldoon T. J. (2022). Generalized additive models to analyze nonlinear trends in biomedical longitudinal data using R: Beyond repeated measures ANOVA and linear mixed models. Stat Med. 41, 4266–4283. doi: 10.1002/sim.9505
Patti G. J., Yanes O., Siuzdak G. (2012). Metabolomics: the apogee of the omics trilogy. Nat. Rev. Mol. Cell Biol. 13, 263–269. doi: 10.1038/nrm3314
Scaglia N., Tyekucheva S., Zadra G., Photopoulos C., Loda M. (2014). De novo fatty acid synthesis at the mitotic exit is required to complete cellular division. Cell Cycle 13, 859–868. doi: 10.4161/cc.27767
Shimizu C., Shike H., Klimpel K. R., Burns J. C. (2001). Hemolymph analysis and evaluation of newly formulated media for culture of shrimp cells (Penaeus stylirostris). In Vitro Cell. Dev. Biol. Anim. 37, 322–329. doi: 10.1290/1071-2690(2001)037<0322:HAAEON>2.0.CO;2
Snaebjornsson M. T., Janaki-Raman S., Schulze A. (2020). Greasing the wheels of the cancer machine: the role of lipid metabolism in cancer. Cell Metab. 31, 62–76. doi: 10.1016/j.cmet.2019.11.010
Stadler B., Ivanovska I., Mehta K., Song S., Nelson A., Tan Y., et al. (2010). Characterization of microRNAs involved in embryonic stem cell states. Stem Cells Dev. 19, 935–950. doi: 10.1089/scd.2009.0426
Thansa K., Rungsiwiwut R., Kitiyanant N., Taengchaiyaphum S. (2018). Optimisation of electroporation and lipofection protocols to derive the black tiger shrimp cell line (Penaeus monodon). Fish Shellfish Immunol. 81, 204–213. doi: 10.1016/j.fsi.2018.07.030
Vander Heiden M. G., Cantley L. C., Thompson C. B. (2009). Understanding the Warburg effect: the metabolic requirements of cell proliferation. Science 324, 1029–1033. doi: 10.1126/science.1160809
Warburg O. (1925). The metabolism of carcinoma cells1. J. Cancer Res. 9, 148–163. doi: 10.1158/jcr.1925.148
Yao C. H., Fowle-Grider R., Mahieu N. G., Liu G. Y., Chen Y. J., Wang R., et al. (2016). Exogenous fatty acids are the preferred source of membrane lipids in proliferating fibroblasts. Cell Chem. Biol. 23, 483–493. doi: 10.1016/j.chembiol.2016.03.007
Zhang J., Yang Y., Wu J. (2010). Palmitate impairs cytokinesis associated with RhoA inhibition. Cell Res. 20, 492–494. doi: 10.1038/cr.2010.33
Keywords: cell cycle analysis, lipidomics, Macrobrachium rosenbergii, metabolic activity, metabolomics, primary embryonic cell culture
Citation: Sudarshan G, Weil S, Jasińska W, Manor R, Goldstein O, Aflalo ED, Ofir R, Zimin SV, Levy T, Rosental B, Brotman Y and Sagi A (2023) Correlation between metabolomic profile and proliferation of Macrobrachium rosenbergii primary embryonic cell culture. Front. Mar. Sci. 10:1270491. doi: 10.3389/fmars.2023.1270491
Received: 31 July 2023; Accepted: 25 September 2023;
Published: 17 October 2023.
Edited by:
Roland Wohlgemuth, Lodz University of Technology, PolandCopyright © 2023 Sudarshan, Weil, Jasińska, Manor, Goldstein, Aflalo, Ofir, Zimin, Levy, Rosental, Brotman and Sagi. This is an open-access article distributed under the terms of the Creative Commons Attribution License (CC BY). The use, distribution or reproduction in other forums is permitted, provided the original author(s) and the copyright owner(s) are credited and that the original publication in this journal is cited, in accordance with accepted academic practice. No use, distribution or reproduction is permitted which does not comply with these terms.
*Correspondence: Amir Sagi, sagia@bgu.ac.il
†ORCID: Amir Sagi, orcid.org/0000-0002-4229-1059
Tom Levy, orcid.org/0000-0003-1484-0310