 Leah Chomiak
 Denis Volkov
 Claudia Schmid
94% of researchers rate our articles as excellent or good
Learn more about the work of our research integrity team to safeguard the quality of each article we publish.
Find out more
ORIGINAL RESEARCH article
Front. Mar. Sci., 31 October 2023
Sec. Physical Oceanography
Volume 10 - 2023 | https://doi.org/10.3389/fmars.2023.1270463
The unique convective anomalies of Labrador Sea Water (LSW) can be used as advective tracers when assessing equatorward spreading pathways and timescales of LSW. In this study, we explore advective pathways of two LSW classes formed in the 1990s and early 2000s, respectively, along constant neutral density planes. Hydrographic observations showcase the prevalence of both LSW classes within the Atlantic interior, supporting a recirculation feature that branches from the Deep Western Boundary Current (DWBC) at 36°N among other pathways. Spreading characteristics of both LSW classes from the Labrador Sea to the subtropics are reinforced through a spatial pattern analysis of salinity anomalies and geostrophic velocities along the characteristic neutral density planes of each respective LSW class. We observe both classes to advect out of the Labrador Sea to (i) the eastern subpolar region and down the eastern boundary towards the Atlantic interior, (ii) directly into the Atlantic interior likely from an injection by recirculations from the subpolar gyre and DWBC leakage, and (iii) equatorward along the western boundary via the DWBC. Findings highlight the abundance of LSW within the Atlantic interior, not just along the western boundary, suggesting that interior pathways play an influential role on the export of these subpolar climate signals.
Labrador Sea Water (LSW) is the dominant water mass comprising upper North Atlantic Deep Water (NADW). It is formed in the Labrador Sea as a direct result of surface heat loss and a deepened mixed layer during the winter, and its properties are highly dependent on the environmental conditions present during the convective season (Yashayaev, 2007). LSW masses are uniquely imprinted with distinctive low temperature, salinity and potential vorticity, and elevated dissolved oxygen and CFC concentrations (Talley and McCartney, 1982; Cunningham and Haine, 1995; Smethie et al., 2000; Fine et al., 2002; Yashayaev, 2007; Koelling et al., 2022). As LSW masses are exported out of the formation region, these properties facilitate their tracking in hydrographic datasets and can be used as proxies to illuminate overturning circulation pathways. Yashayaev (2007) defined these LSW masses as sub-classes based on their formation properties over varying time periods. LSW1987-1994, for example, encompasses the freshest, coldest, densest, deepest, and most voluminous LSW class formed on record between the years 1987-1994 in the Labrador Sea. LSW2000-2003, although not as fresh, cold, or deep as the preceding class, encompasses the next leading LSW mass with further LSW sub-classes following in years thereafter, each with distinctive identifying properties.
Advances in ocean observations, Lagrangian methodologies, and ocean circulation modeling in recent decades have shown irrefutable evidence of interior Atlantic advective pathways in the equatorward spreading of subpolar water masses (Spall, 1996; Bower and Hunt, 2000a; Bower and Hunt, 2000b; Getzlaff et al., 2006; Bower et al., 2009; Bower et al., 2011; Zou and Lozier, 2016; Biló and Johns, 2019; Bower et al., 2019; Chomiak et al., 2022; Fox et al., 2022; Lozier et al., 2022). Interior advective pathways have the potential to delay the communication of subpolar water masses to the subtropics, as these signals likely become entrained or rerouted within the Atlantic interior (Chomiak et al., 2022), making this communication slower than our current understanding. Whether or not the Deep Western Boundary Current (DWBC, Figure 1) dictates a primary role in the volume advection of these water masses compared to the contribution of interior advective pathways is still an open question. Past evidence of LSW spreading through interior pathways, both independent of and branching from the DWBC, have been inferred via advective tracers (van Sebille et al., 2011; Biló and Johns, 2019; Chomiak et al., 2022) and Lagrangian float trajectories (Bower and Hunt, 2000b; Fischer and Schott, 2002; Getzlaff et al., 2006; Bower et al., 2009; Gary et al., 2011; Gary et al., 2012; Zou and Lozier, 2016; Bower et al., 2019). These observations make it apparent that the entire basin must be considered for quantifying deep water transports, rather than just the western boundary (McCarthy et al., 2015; Volkov et al., 2023), since it is likely these interior advective pathways provide a significant contribution to the lower-limb of the Atlantic Meridional Overturning Circulation (AMOC).
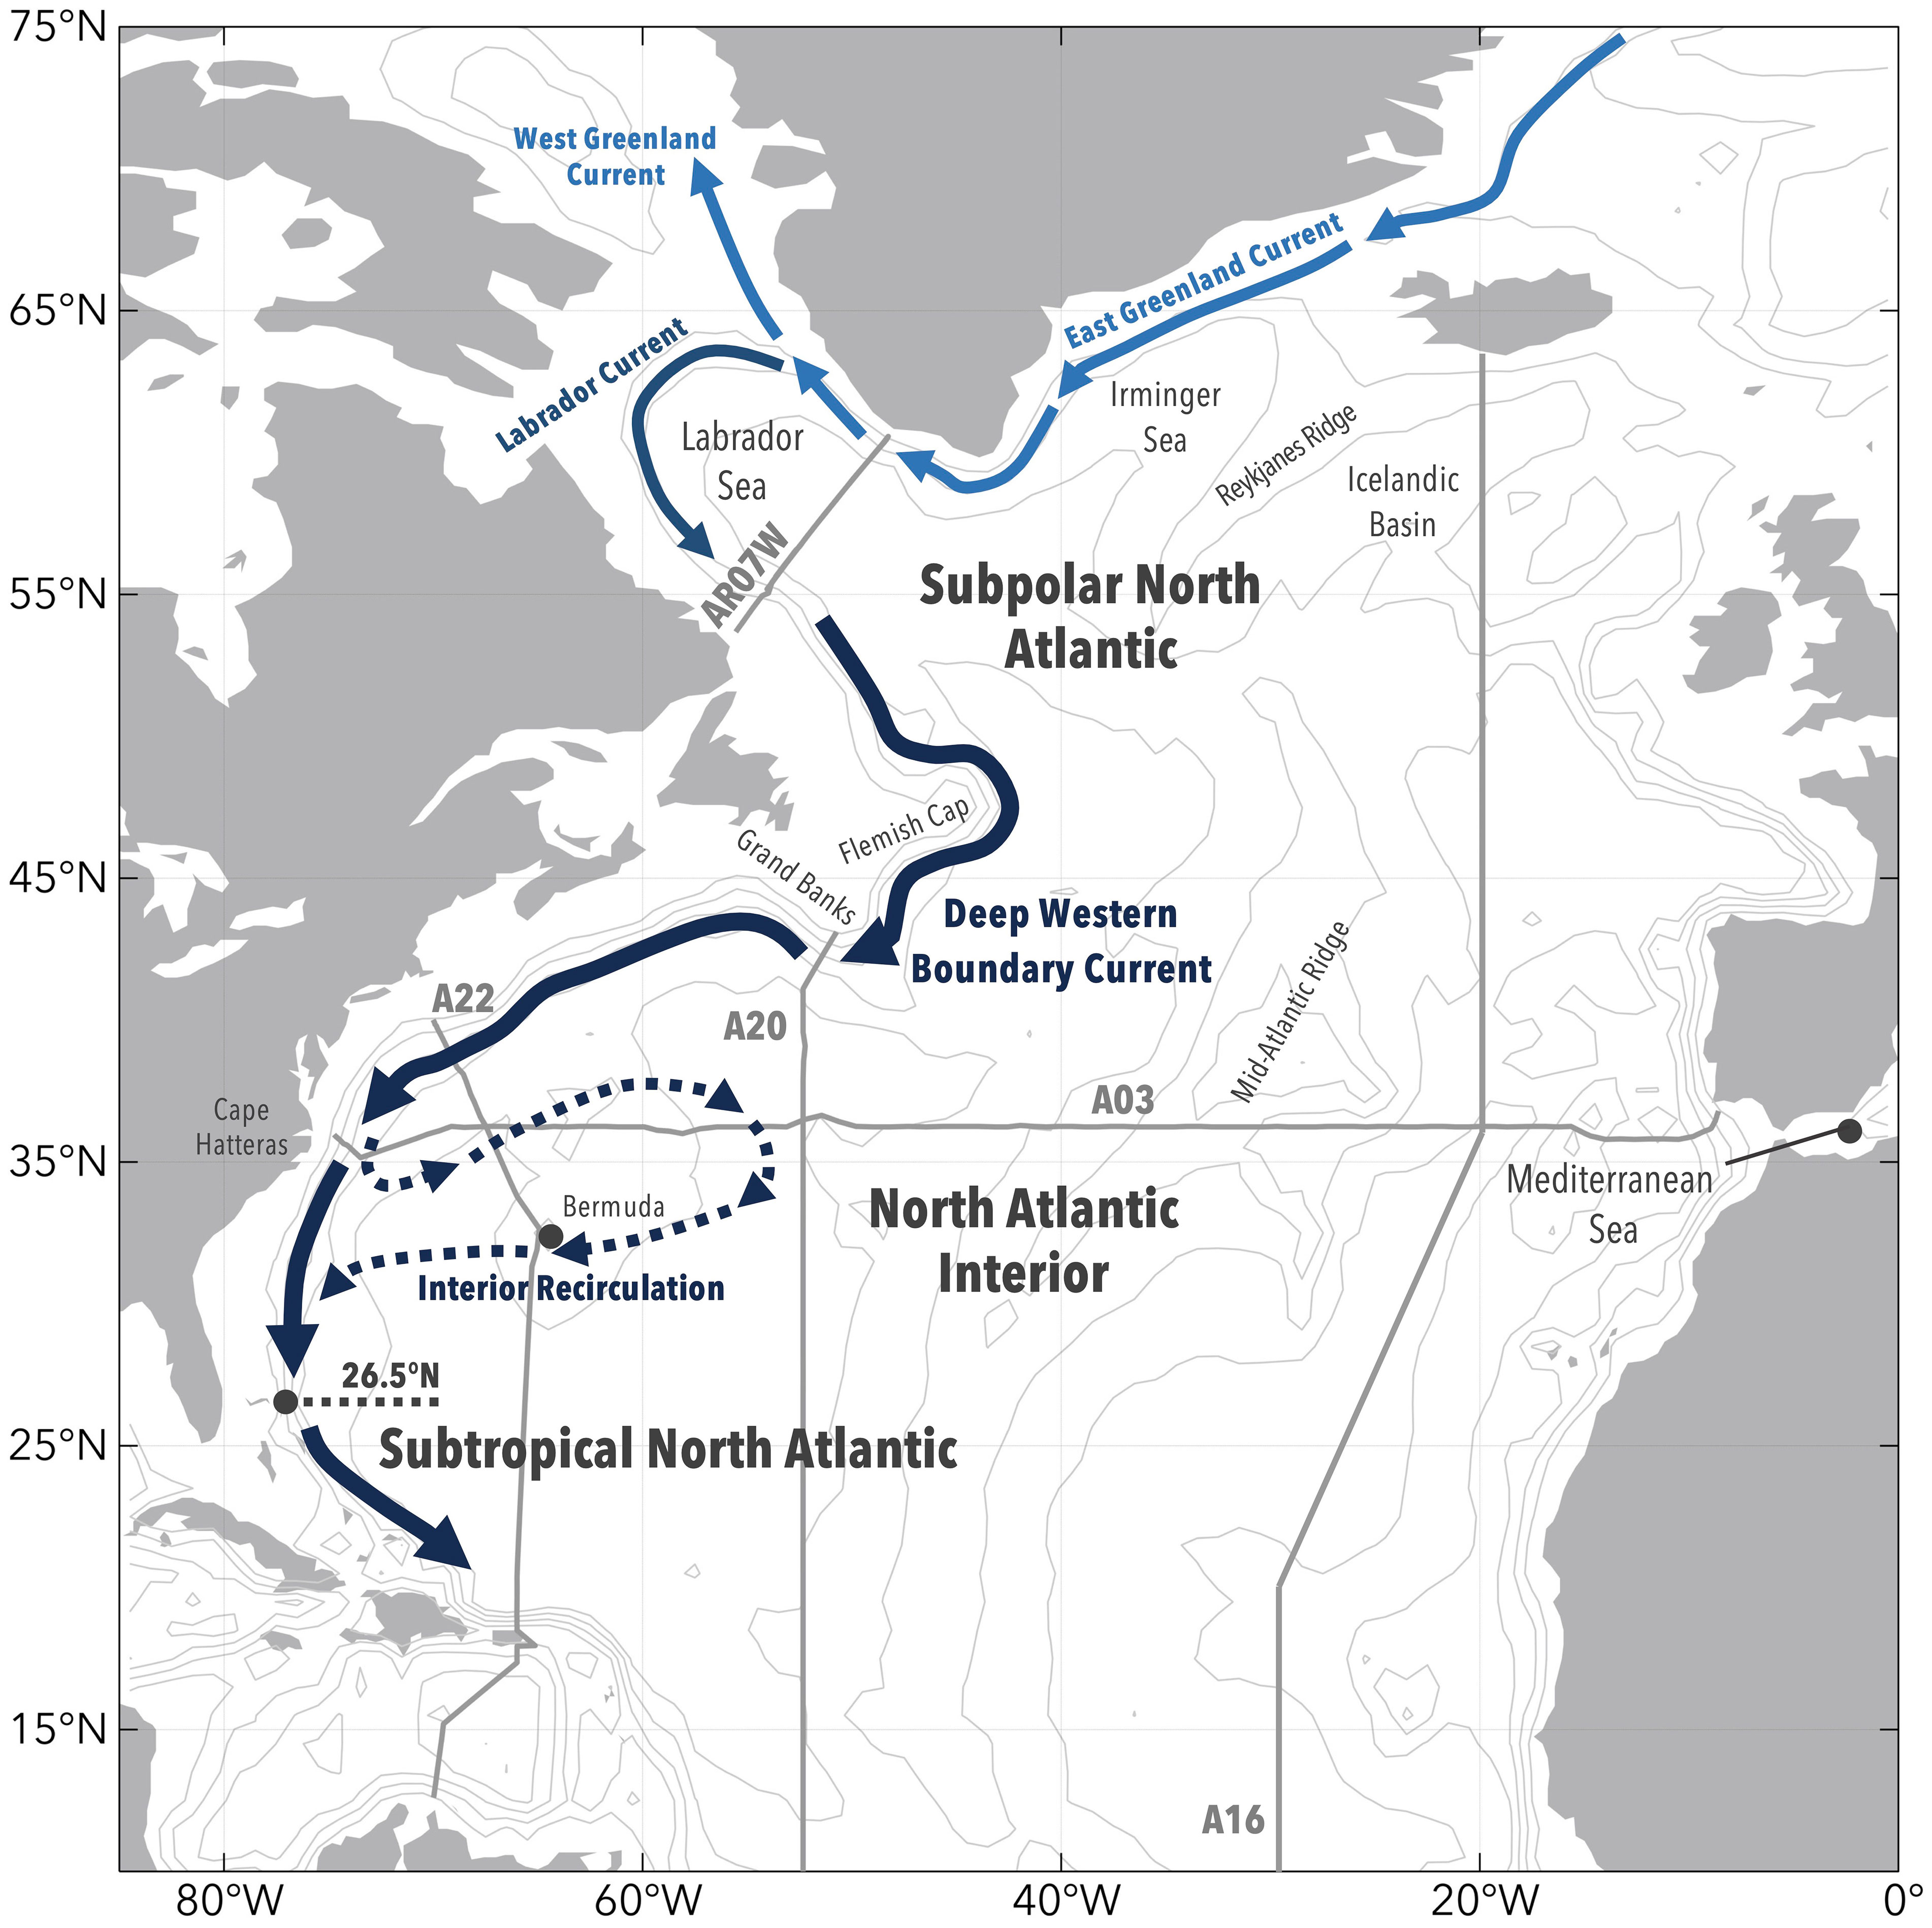
Figure 1 North Atlantic study domain showing relevant deep-water currents and hydrographic transects used in the study. The Deep Western Boundary Current (solid dark blue) and sketched interior circulation (dashed dark blue) are adapted from Chomiak et al., 2022. The GO-SHIP hydrographic transects used in this study are shown as the light gray lines (AR07W, A22, A20, A16, A03). Bathymetric contours are shown in 1000 m intervals.
While prior studies have assessed the spread of LSW in the North Atlantic (e.g. Talley and McCartney, 1982), a discrete, time-varying distribution of the unique sub-classes of LSW (Yashayaev, 2007; Chomiak et al., 2022) across the entire basin has yet to be explored. Chomiak et al. (2022) previously investigated the advection of two unique LSW classes formed during 1987-1994 (LSW1987-1994) and 2000-2003 (LSW2000-2003) along constant neutral density surfaces from the Labrador Sea to the subtropical North Atlantic using hydrographic transects across the DWBC. LSW2000-2003 was found to advect on a longer timescale (order of 10-15 years) compared to LSW1987-1994 (order of 10 years). Each class was observed to arrive both within the North Atlantic interior (near Bermuda) and along the Subtropical western boundary almost simultaneously despite being 1400 km apart. These findings suggested that an interior advective pathway, branching from the western boundary (dashed line in Figure 1), was likely influential. In this follow-up study, following the water mass definitions set in Chomiak et al. (2022), we consider the entire North Atlantic and use hydrographic observations to reveal the time-variable spatial distribution of LSW1987-1994 and LSW2000-2003 along constant isopycnal planes. The observational evidence presented herein confirms the interior presence and time-varying nature of both LSW classes and presents the shape of their equatorward spreading via the DWBC and other pathways.
We investigate the advection of the two LSW masses previously defined by Chomiak et al. (2022), LSW1987-1994 and LSW2000-2003, tracked along the neutral density (γn, kg/m3) isopycnal planes of γn = 27.99 and γn = 27.90, respectively. The scale in the anomaly of the convective imprint along each isopycnal level is nearly identical when looking in both temperature and salinity space (Chomiak et al., 2022) and thus redundant. Therefore, only salinity anomalies are explored here. We use EN.4.2.2 monthly gridded salinity profiles from 1990-2021 for the North Atlantic (Gouretski and Reseghetti, 2010; Good et al., 2013 bias corrections applied). The salinity fields are annually averaged and interpolated along the two characteristic neutral density surfaces. Annual salinity anomaly planes are generated by subtracting the climatological mean values from the annual averages. The climatological mean is calculated over the years 2003-2021, representing the period within the EN4 dataset that has ≥50% observational coverage over the domain. The annual salinity anomalies are then detrended and normalized by the standard deviation.
Mediterranean Overflow Water (MOW) occupies a similar density range as LSW but is slightly warmer and more saline (van Aken, 2000). The interaction of these two water masses is not well understood. Previous studies have estimated MOW contribution to western North Atlantic waters of about 20% (van Sebille et al., 2011), and removal of the discrete water mass signal from datasets resulted in an enhanced LSW convective signal (Chomiak et al., 2022). In this study, since the region occupied by MOW is included within the studied domain, we do not remove the MOW influence from the isopycnal layers of interest to be able to observe the natural modification of these water masses. We anticipate that modification of LSW will be detectable in the salinity anomalies, due in part to the interaction with MOW during its equatorward spread, but we do not quantify these interactions in this study, however.
The EN4-derived salinity anomalies depict the spatial extent of LSW along the defined constant isopycnal surfaces. In addition to the optimally interpolated EN4 data, we also use full-depth GO-SHIP Repeat Hydrographic data for the North Atlantic basin to observe the extent of LSW. Meridional GO-SHIP A16, A20, and A22 sections and the zonal A03 occupations ranging from years 1993-2023 are used (Figure 1). The summertime AR07W occupations in the Labrador Sea from 1994 and 2001 show cross-sectional views of each LSW class development. Normalized salinity anomalies for each occupation and at each pressure level are computed by subtracting the horizontal mean and dividing by the standard deviation.
We perform a Complex Empirical Orthogonal Function (CEOF) analysis on the annual EN4-derived salinity anomalies along both isopycnal planes to reduce the dimensionality of the dataset and extract the most influential modes of variability (Navarra and Simoncini, 2010). The main advantage of CEOF analysis over the conventional EOF analysis is the ability to detect propagating signals and return their spatial and temporal amplitude and phase information (Navarra and Simoncini, 2010). This allows investigation of the spatial and temporal propagation of LSW salinity anomalies spreading out of the Labrador Sea across the 31-year dataset. The CEOF analysis of salinity anomalies was performed at the γn = 27.99 isopycnal plane for the 1990-2021 time interval and γn = 27.90 isopycnal plane for the 2000-2021 time interval. The different time intervals were used to reduce biasing from the LSW1987-1994 convective imprint on the upper isopycnal plane (γn = 27.90). The spatial and temporal patterns are referred to here as CEOFs and complex principal components (CPCs), respectively. Only the leading CEOF1/CPC1 mode explaining about 30% of the salinity variance is used. The time–space progression of the reconstructed CEOF1 mode is obtained by (i) multiplying CPC1(t) by a rotation matrix whose argument varies between 0 and 360° at 45° intervals and (ii) regressing the normalized salinity anomaly planes onto the rotated CPC1. The reconstructed CEOF1 for the two isopycnal surfaces considered reflect the temporal evolution of the annual normalized salinity anomalies over a complete cycle.
The CPC1 time series of the two isopycnal surfaces are compared to the wintertime December-March (DJFM) North Atlantic Oscillation (NAO) index (Hurrell et al., 2003). A cross correlation is computed between the CPC1 and NAO time series, where the maximum correlation is used to determine lag time between each series in years.
We utilize adjusted geostrophic velocities derived from Argo and altimetry measurements (Schmid, 2014) interpolated onto the γn = 27.99 and γn = 27.90 isopycnal planes to assess LSW advective pathways. The original Schmid (2014) dataset is expanded to cover years 1993-2021. These velocities were derived by using Argo dynamic height profiles and sea surface heights from altimetry to calculate synthetic dynamic height profiles, which are then used to derive the horizontal geostrophic velocity, followed by a barotropic adjustment (see Schmid, 2014 for a detailed description of this method). At locations along the isopycnal plane exceeding 2000 m, velocity data is substituted with the deepest velocity for that grid point (2000 m, due to Argo constraint).
The time evolutions of the salinity anomalies for both of the convectively-generated LSW classes are shown in Figure 2. AR07W hydrographic transect occupations in 1994 and 2001 showcase the initial structure of both LSW masses in the Labrador Sea. The annual spatial planes along the corresponding neutral densities illuminate the unique spreading patterns of salinity anomalies characteristic to these two LSW classes as they radiate out of the Labrador Sea. The specific neutral density planes are selected based on LSW formation in the Labrador Sea, where the LSW class of the early 1990s reached a core density of γn= 27.99 and then advected out of the Labrador Sea along that constant plane (Chomiak et al., 2022). Similarly, the LSW class of the early 2000s reached a core density of γn= 27.90 and advected out of the Labrador Sea along that constant plane. While showcasing the entire North Atlantic domain when visualizing the salinity anomalies along both constant neutral density planes it is possible that other water masses, not associated with LSW, are also present in the domain. For example, negative salinity anomalies (freshening) present in the eastern subpolar region, outside of the Mediterranean Sea, and in the South Atlantic in the respective LSW class formation years of 1994 and 2001 (Figure 2) are unlikely to be associated with the observed LSW classes. In this study, we assume that salinity anomalies found elsewhere of the Labrador Sea at the time of LSW formation (ex., 1994 and 2001) are not associated with the specific LSW class. We focus only on tracking the anomalies that propagate out of the Labrador Sea along the defined neutral density planes, which we attribute to the two classes of LSW discussed in the next sections in more detail.
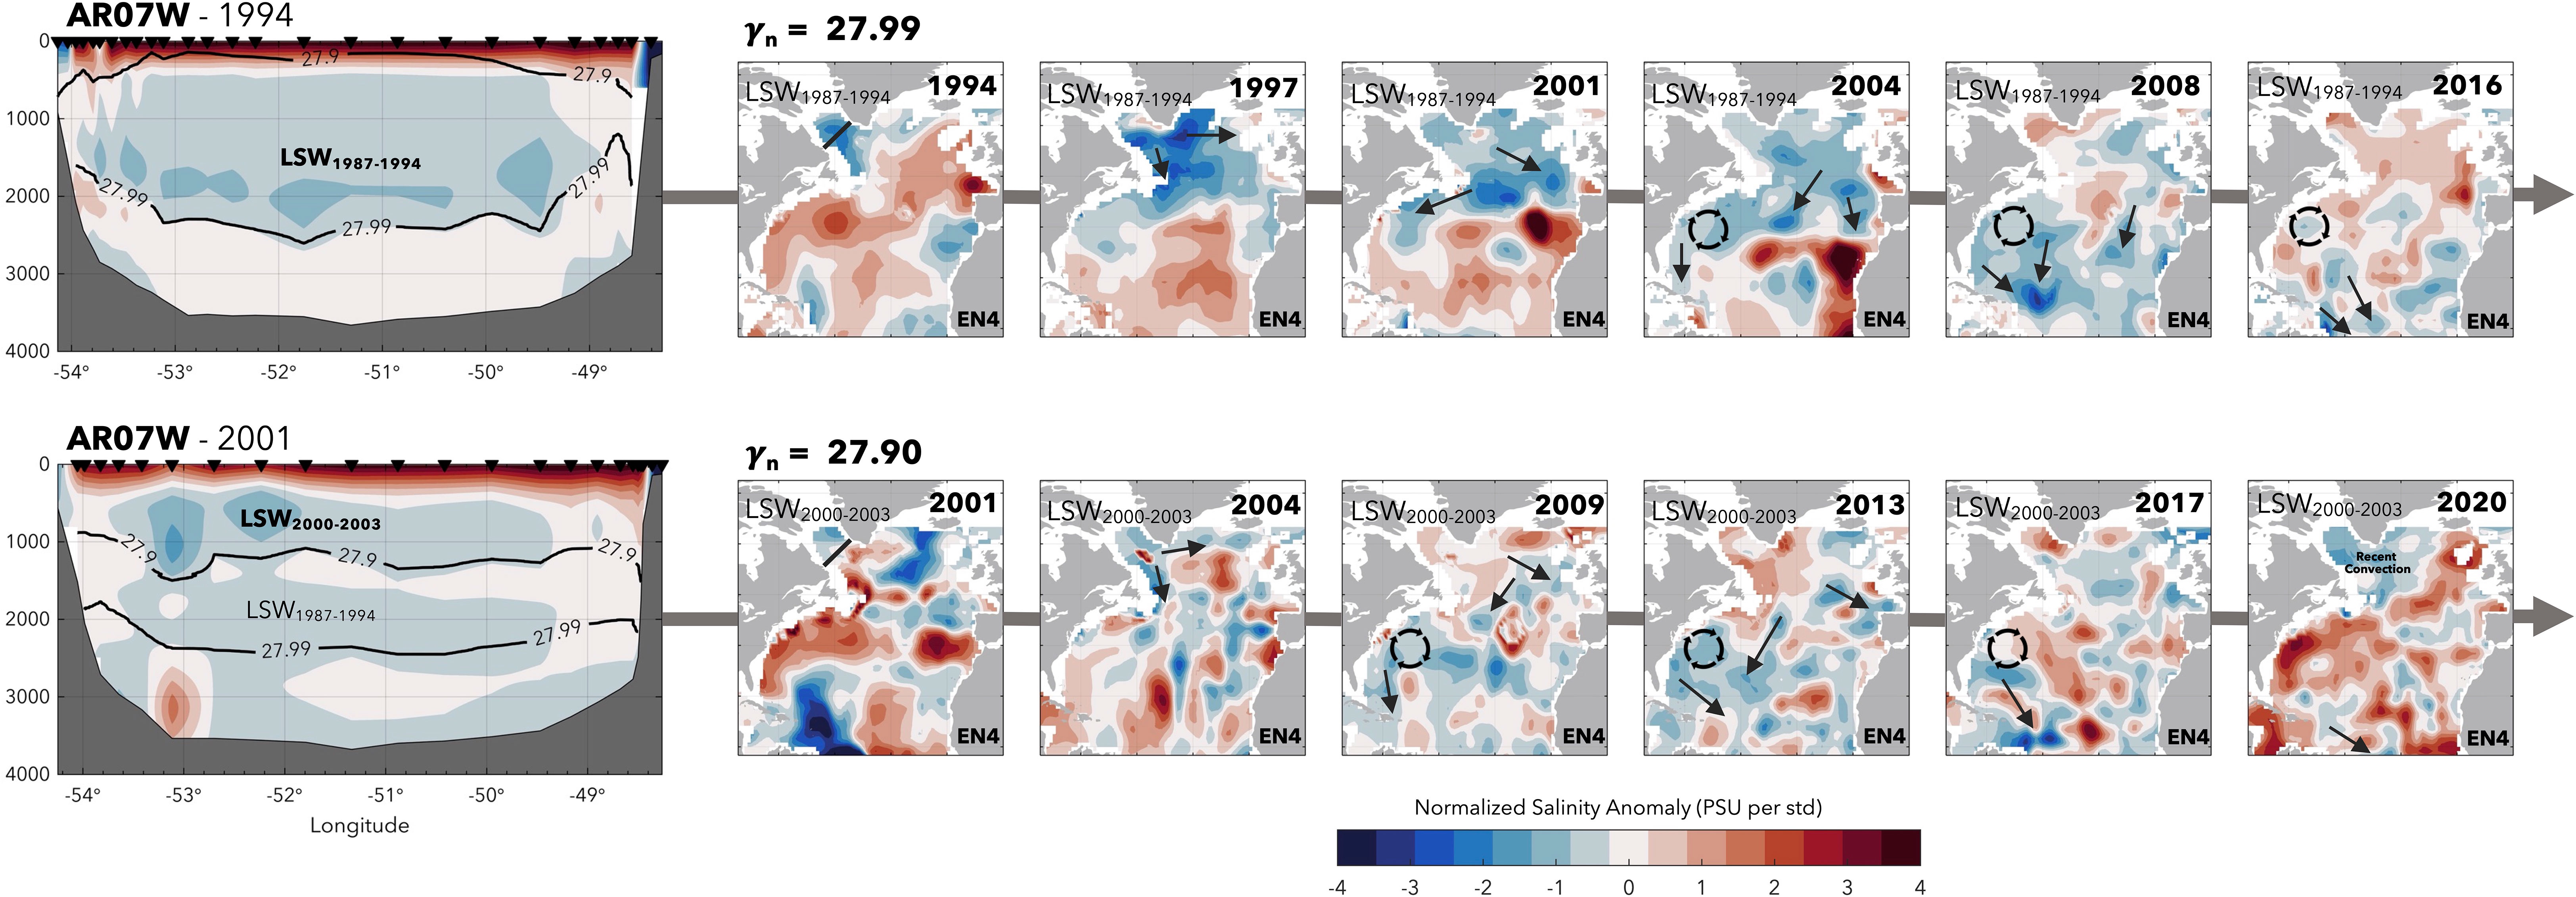
Figure 2 Spreading pathways of LSW1987-1994 (top, γn = 27.99) and LSW2000-2003 (bottom, γn = 27.90) from the Labrador Sea to Subtropics (10°N) as shown through normalized EN4 salinity anomalies along the respective neutral density planes for each class. Cross-sections of normalized salinity anomalies through the Labrador Sea (AR07W hydrographic line) highlight the anomalously-fresh signal of both water masses in depth space, with the γn = 27.90 and γn = 27.99 isopycnals indicated by the contours. The propagation of the anomalously-fresh convective signal for each class is represented by the arrows in the annual isopycnal planes.
The salinity anomaly of LSW1987-1994, reaching a maximum core isopycnal depth of approximately 2300 m in the Labrador Sea in 1994 (Yashayaev, 2007), is observed to spread out of the Labrador Sea both to the eastern Subpolar North Atlantic and equatorward along the western boundary and through the Atlantic interior (Figure 2, top panels, blue shading). As observed after 1994, the salinity anomaly follows the western boundary via the DWBC but is also observed to directly enter the North Atlantic interior likely stemming from recirculations branching into the interior along the subpolar and subtropical gyre boundary near the Mid Atlantic Ridge and/or spin-off from Flemish Cap or Grand Banks (e.g. DWBC leakage in Bower et al., 2009; Solodoch et al., 2020). Propagation towards the eastern subpolar region, along the eastern boundary (west of Europe) and subsequent flow into the interior (as supported in Zhai et al., 2021) is also observed with the spreading of the salinity anomaly through time.
As postulated by Bower et al. (2011); Biló and Johns (2019), and Chomiak et al. (2022) among many others, an interior recirculation pathway that branches from the western boundary near the DWBC/Gulf Stream confluence area (~36°N, Cape Hatteras) is represented by the salinity anomalies extending to 55°W. This observed interior recirculation is also congruent with the advective timescales estimated in Chomiak et al. (2022) for LSW1987-1994, approximately 10 years to concurrently reach Bermuda (32°N) and 26.5°N. By 2016, we observe almost the complete passage of this anomaly from the North Atlantic domain, as the salinity anomaly along this isopycnal plane becomes positive. Further basin salinification continues into 2021 but is not shown in Figure 2. It is unclear whether the observed salinification is due to a basin-wide salinification process, Mediterranean or Subtropical influence, or if it is quite literally the return to ‘normal’ conditions following the passage of this convective class.
The salinity anomaly of LSW2000-2003, reaching maximum core isopycnal depths of approximately 1300 m in the Labrador Sea in 2001 (atop of previously formed LSW1987-1994, Yashayaev, 2007), is observed to spread out of the Labrador Sea in a similar fashion to the LSW1987-1994 class (Figure 2, bottom panels, blue shading). Due to its lighter core isopycnal, and thus shallower depth, this LSW class is subject to a greater mixing influence with warmer and more saline waters of Mediterranean and Subtropical origin, likely resulting in reduced coherence of the original convective signal. Despite the modification and noise, we observe the LSW2000-2003 anomaly to spread out of the Labrador Sea to the eastern subpolar basin, advect along the western boundary via the DWBC, and advect through the Atlantic interior. The prolonged salinity anomaly that persists for more than 5 years off the coast of Cape Hatteras at 36°N extending to approximately 55°W serves as potential evidence of the proposed interior recirculation branching from the western boundary. The passage of the salinity anomalies takes 10-15 years to concurrently reach Bermuda (32°N) and 26.5°N. This is, again, congruent with the delayed advective time scale estimates of LSW2000-2003 from Chomiak et al. (2022), alluding that this class likely spent more time in the subpolar region and/or interior recirculation pathways compared to the deeper and denser LSW1987-1994. This convective signal is again followed by a basin-wide salinification into the present day.
We perform a CEOF analysis to better illustrate the spatial and temporal patterns of the propagating large-scale salinity anomalies associated with LSW along the defined neutral density planes. While the CEOF analysis yields purely statistical modes, the leading CEOF mode appears to be representative for the spread of LSW out of the Labrador Sea along the two specific LSW density planes. The CEOF1 spatial and CPC1 temporal patterns highlight what was observed in Chomiak et al. (2022) using hydrographic transects along the DWBC (assessing the advection and timescales of the salinity anomalies associated with LSW at specific densities from the Labrador Sea to 26.5°N). Furthermore, by expanding the analysis over the entire North Atlantic rather than just along the boundary, other LSW propagation and advective pathways supported in past and current literature (ex. Spall, 1996; Bower and Hunt, 2000a; Bower and Hunt, 2000b; Bower et al., 2009; Bower et al., 2011; Biló and Johns, 2019; Bower et al., 2019; Chomiak et al., 2022; Lozier et al., 2022; Petit et al., 2023) are reinforced with these CEOF analyses. The CEOF1 explains approximately 30% of the salinity variance in both isopycnals, which is a relatively large number considering that it relates to the entire North Atlantic domain; the other modes explain significantly less variance and are not used in the analysis.
Displayed in Figures 3A and 4A are the time evolutions of the spatial patterns of the LSW1987-1994 and LSW2000-2003 salinity anomalies, respectively, reconstructed with CEOF1 for one full cycle (0-360°) at 45° phase intervals to visualize spatial propagation throughout the complete cycle of the first mode. The CPC1 time series (Figures 3B, 4B) illustrate how CEOF1 spatial pattern has changed over time, with the real and imaginary parts being associated with CEOF1 at 0° and 90° phase, respectively. Positive [negative] tendencies in CPC1 mean increasing [decreasing] salinities in the regions of positive CEOF1 anomalies and decreasing [increasing] salinities in the regions of negative CEOF1 anomalies (compare panels a and b in Figures 3, 4).
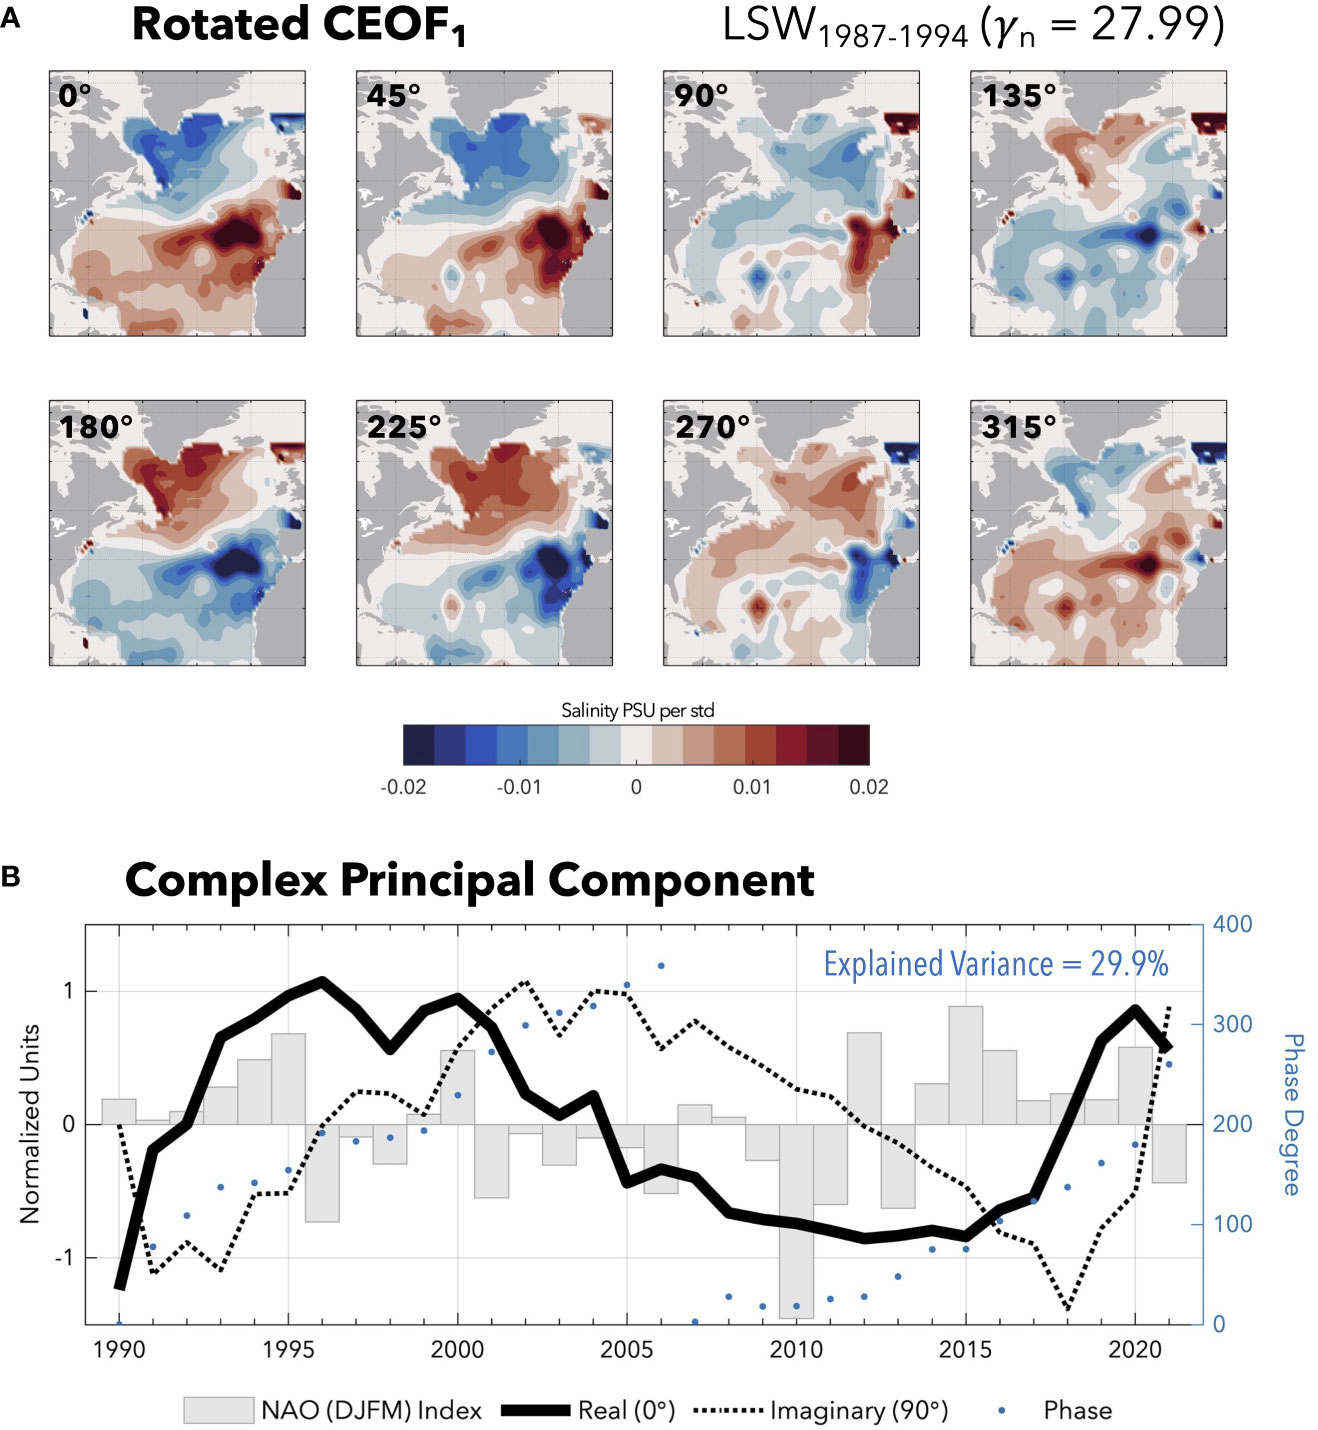
Figure 3 (A) Reconstruction of the first complex EOF (CEOF1) mode of the annual normalized salinity anomalies along the γn = 27.99 isopycnal plane representing LSW1987-1994 at 45° phase intervals with (B) the real and imaginary parts of the first complex principal component (CPC1) showing the time evolution along the plane. The angle of rotation is shown in the top left corner of each panel. Positive CPC1 indicates freshening over the blue-colored areas and salinification over the red-colored areas. The CEOF1 of γn = 27.99 reflects the annual normalized salinity anomalies from 1990-2021. Temporal phase is plotted 0-360° alongside the CPC1 shown as the blue dots. Normalized NAO indices are compared to the CPC1; a cross correlation of the December-March (DJFM) NAO index with the CPC1 shows a lag of 4 years with a significant maximum correlation of 0.7.
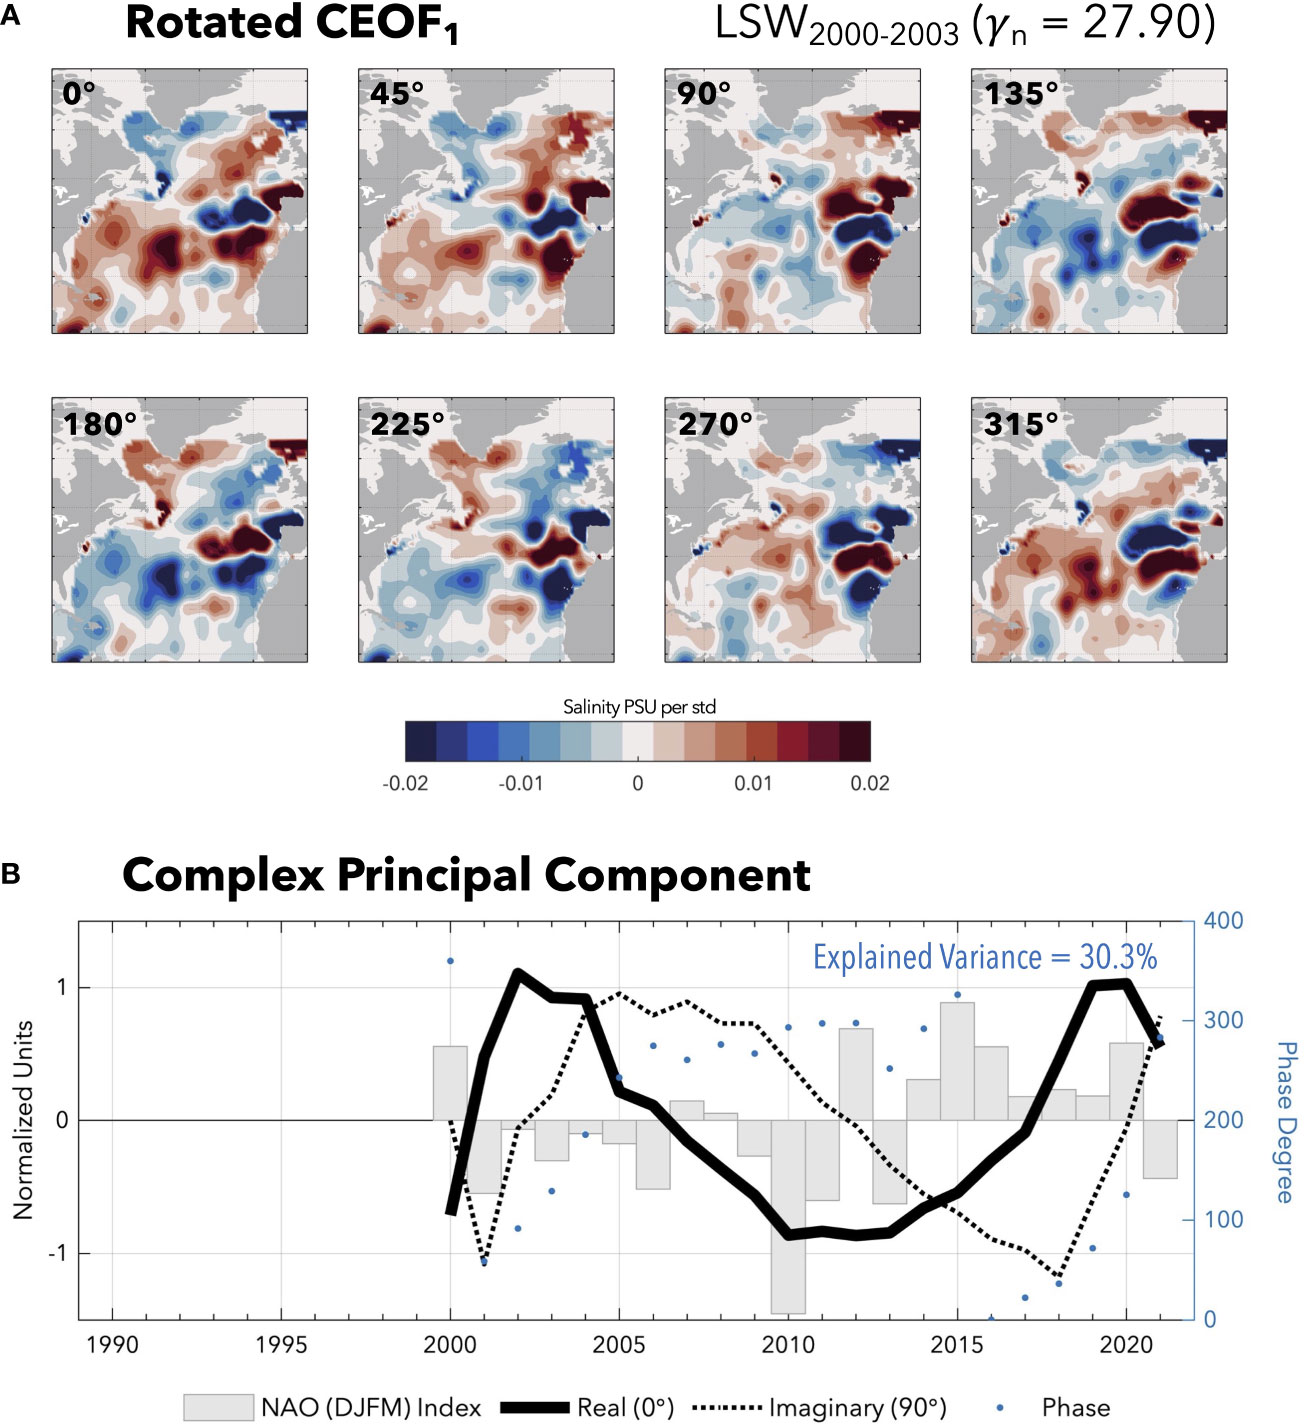
Figure 4 (A) Reconstruction of the first complex EOF (CEOF1) mode of the annual normalized salinity anomalies along the γn = 27.90 isopycnal plane representing LSW2000-2003 at 45° phase intervals with (B) the real and imaginary parts of the first complex principal component (CPC1) showing the time evolution along the plane. The angle of rotation is shown in the top left corner of each panel. Positive CPC1 indicates freshening over the blue-colored areas and salinification over the red-colored areas. The CEOF1 of γn = 27.90 reflects years 2000-2021 to eliminate the biasing of the LSW1987-1994 convective imprint on this isopycnal plane. Temporal phase is plotted 0-360° alongside the CPC1 shown as the blue dots. Normalized NAO indices are compared to the CPC1; a cross correlation of the December-March (DJFM) NAO index with the CPC1 also shows a lag of 4 years with a significant maximum correlation of 0.7.
The reconstructed CEOF1 along the γn = 27.99 isopycnal shows the LSW1987-1994 salinity anomaly (blue shading, Figure 3A) to propagate out from the western subpolar region and down the western boundary while also spreading to the eastern subpolar and Atlantic interior, congruent with the observable anomalies. The temporal evolution of the CEOF1 mode (CPC1, Figure 3B) matches the timescale of signal propagation observed in the annual anomalies of LSW1987-1994. The western subpolar freshening observed at the 0° phase (Figure 3A) peaks in the late 1990s-early 2000s (Figure 3B) following formation and initial propagation of the LSW class. Freshening of the eastern subpolar gyre, western boundary, and Atlantic interior regions (90° phase in Figure 3A) occur in the early to late 2000s shown by the peak in the imaginary component of the CPC1 (dashed line in Figure 3B) as the anomaly associated with LSW1987-1994 propagates out of the Labrador Sea. The spatial and temporal propagation of this anomaly is consistent with the previous 10-year advective time scale estimated for 26.5°N, where the deep LSW1987-1994 convective signal was shown by van Sebille et al. (2011) and Chomiak et al. (2022) to reach this subtropical latitude in the mid 2000s. The temporal phase of CEOF1/CPC1 (blue dots in Figure 3B) highlights the completion of almost two cycles approximately 16 years in duration each along the γn = 27.99 isopycnal plane. A steady positive shift in the phase indicates that this signal is propagating with time.
Due to the lighter and shallower isopycnal that LSW2000-2003 occupies, possible mixing and competing with warmer and saltier Mediterranean and Subtropical water masses results in a reduced coherence of the original convective signal as aforementioned. Therefore, a CEOF analysis along the γn = 27.90 isopycnal results in a relatively noisy spatial pattern when compared to the deeper γn = 27.99 isopycnal. Despite reduced signal coherence, the reconstructed CEOF1 for γn = 27.90 (Figure 4A) highlights the propagation of LSW2000-2003 out of the Labrador Sea to the eastern subpolar region, equatorward along the western boundary, and via the Atlantic interior. The temporal evolution of the CEOF1 mode (Figure 4B) captures the western subpolar freshening in the early 2000s associated with the LSW2000-2003 class (0° phase in Figure 4A and real component of CPC1 in Figure 4B) and the presence of LSW2000-2003 in the western subtropical North Atlantic 5-10 years later (90° phase in Figure 4A and the imaginary component of CPC1 in Figure 4B). The temporal phase of CPC1 (blue dots in Figure 4B) highlights the completion of approximately 1.5 cycles, with one cycle lasting about 15 years in duration. The subtle shift in the phase through the years 2006-2015 indicates that this signal was not effectively propagating with time, compared to the steady positive shift observed along the deeper γn = 27.99 isopycnal plane. This likely suggests that LSW2000-2003 may have lingered within the interior domain during this period rather than propagating through.
To investigate any connection to large-scale climate drivers that may influence these pathways, we compare the temporal evolutions of both CEOF spatial patterns to wintertime North Atlantic Oscillation (NAO) indices (Figures 3B, 4B). The NAO is a dominant mode of climate variability in the North Atlantic (Hurrell et al., 2003), representing the variations of sea-level pressure difference between the Subtropical High and Subpolar Low. Positive wintertime NAO phases have been linked to enhanced convection in the Labrador Sea with subsequent LSW formation (Curry and McCartney, 1996; Yashayaev et al., 2007). It has also been shown that positive [negative] NAO index is associated with easterly [westerly] winds over the Strait of Gibraltar, which probably favors greater [lesser] Mediterranean outflow (e.g. MOW) congruent with a lower [higher] Mediterranean sea level (Volkov and Landerer, 2015; Volkov et al., 2019). The discrete relationship between the spreading of LSW and MOW and the NAO is not well explored, but Lozier and Stewart (2008) observed a NAO influence on the shallow layers of LSW and MOW in the eastern subpolar Atlantic, suggesting there may be a possibility for the wintertime NAO to influence these waters elsewhere in the North Atlantic.
The real components of the CEOF1 and CPC1 of both LSW classes (Figures 3, 4) highlight freshening in the western subpolar North Atlantic associated with LSW formation following the positive phases of the wintertime NAO and salinification following the negative phases of the wintertime NAO. Cross-correlations of the real components of CPC1 against the wintertime December-March (DJFM) NAO index show that salinity anomalies along both isopycnal planes associated with the two LSW classes lag the NAO each by 4 years with a maximum correlation of 0.7. Given the very short time series (i.e. only 1-2 complete cycles) this correlation is insignificant. Nevertheless, the link between the NAO and salinity anomalies in the subpolar North Atlantic associated with the formation of the two LSW classes appears to be robust and congruent with earlier studies (Curry and McCartney, 1996; Yashayaev et al., 2007). The likely modulation of the spread of MOW by the NAO in the subtropical North Atlantic may permit or hinder the eastward spread of LSW along the same isopycnal level (e.g., Lozier and Stewart, 2008; Volkov and Landerer, 2015; Volkov et al., 2019). Continued observation of LSW and MOW across the North Atlantic is required to better understand the spread and interaction of the two water masses and their relationship with the NAO and other modes of climate variability.
Several meridional and zonal GO-SHIP hydrographic transects in the North Atlantic are analyzed to further validate the interior presence of LSW along its spreading pathway at the two characteristic isopycnal levels (Figure 5). Normalized salinity anomalies from the 1993 and 2005 zonal A03 GO-SHIP trans-Atlantic hydrographic transects along 36°N (Figure 5B) illuminate the prominent LSW plume extending from the western boundary to 55°W and 40°W in the interior, countered by the evident Mediterranean Overflow Water (MOW) plume of higher salinity along the same isopycnal extending from the eastern boundary. Meridional GO-SHIP cross-sections along the western North Atlantic (A20 along 52°W and A22 along 66°W; Figures 5C, D) showcase the salinity anomalies characteristic of both LSW classes extending from the North American continental shelf (40°N, DWBC throughflow) to 35°N and in some cases, as far as 32°N. This north/south extent of the LSW plume is suggestive of the injected interior route stemming from the subpolar gyre since the anomalies are observed outside of the western boundary. More interestingly, it could be a hint of the alternative interior recirculation that stems from the western boundary. Looking closely at the meridional A22 sections, a small core of LSW within and extending slightly above and below the defined isopycnal cores is evident at 32°N. This feature likely corresponds to the returning westward-flowing recirculation band that rejoins the western boundary passing Bermuda at 32°N in the process (Figure 1), as was suggested by advective timescales in Chomiak et al. (2022). South of the LSW plume, the strong MOW saline signal is observed, congruent with its east-west propagation across the North Atlantic interior (van Aken, 2000).
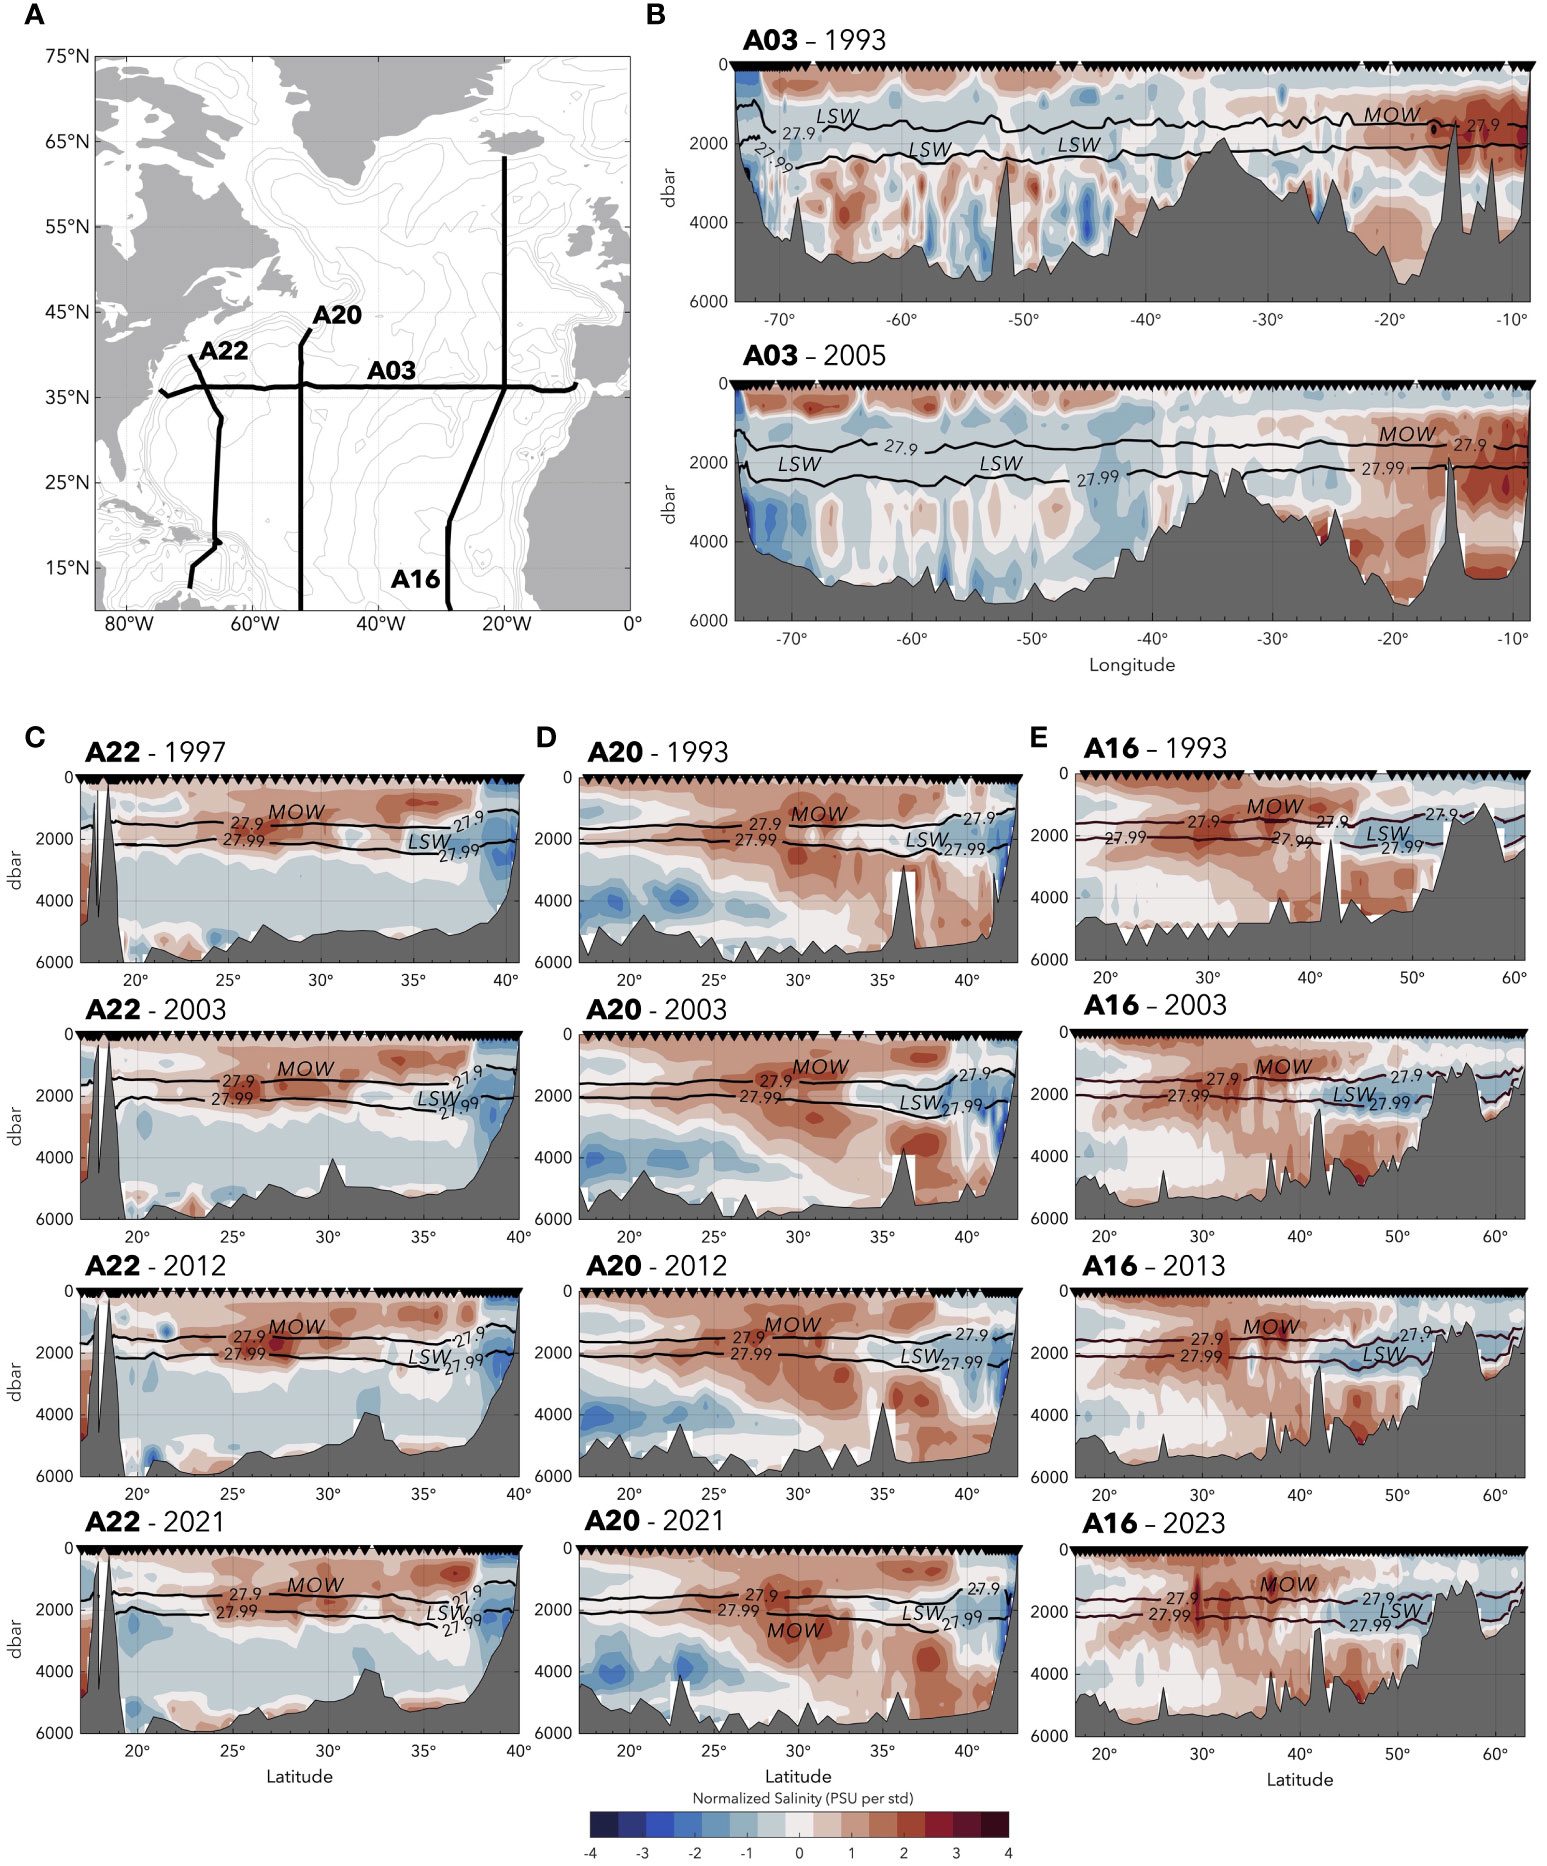
Figure 5 Normalized salinity anomalies of the zonal GO-SHIP (B) A03 and meridional (C) A22, (D) A20, and (E) A16 hydrographic sections in the North Atlantic domain (A). Cross-sections highlight the anomalously-fresh interior plume of LSW in depth space extending zonally from the western boundary to 40°W, and meridionally from the western boundary to 35°N (A20) and in some cases 32°N (A22), covering nearly the entire western half of the Atlantic basin. The southward protrusion of LSW from the eastern subpolar region to the eastern Atlantic extends to 40°N along the A16 transects. The characteristic γn = 27.90 and γn = 27.99 neutral density isopycnals are indicated by the contours. Labrador Sea Water (LSW) and Mediterranean Overflow Water (MOW) masses are labeled for reference.
Salinity anomalies along the eastern North Atlantic (A16 along 29/20°W; Figure 5E) highlight the southward extent of LSW to about 40°N. The intersection of GO-SHIP lines A03 and A16 at 36°N and 20°W show little evidence of LSW, rather a strong presence of MOW. This suggests that LSW i) does not spread further south of this latitude in the eastern North Atlantic, and/or ii) LSW flows westward towards the interior just north of this transect intersection at 40°N, likely hugging the Mid Atlantic Ridge based on the observations along the A03 transect east of the ridge at 25°W. There is likely a strong LSW/MOW interaction in this eastern North Atlantic region due to the isopycnal similarities and pronounced fresh/saline signatures, respectively, and this relationship remains to be investigated. The combination of the zonal A03 and meridional A22/A20/A16 sections visualizes a three-dimensional spatial pattern based solely on the convective salinity anomalies observed with western boundary recirculations extending to 55°W and 40°W zonally and 32°N meridionally, and direct injections of LSW to the interior from the central and eastern subpolar regions.
To further understand LSW advection pathways along the two isopycnal planes analyzed herein, we use adjusted geostrophic velocities derived from Argo and altimetry measurements (Schmid, 2014) interpolated along the γn = 27.99 and γn = 27.90 isopycnal planes. The climatological mean (averaged over years 2003-2021) of the annually-averaged density-interpolated velocity fields are showcased in Figure 6B. The depth of the neutral density planes of both LSW classes examined in this study across the North Atlantic are shown in Figure 6A for reference. Velocity vectors along both isopycnal planes illuminate the three spreading pathways previously discussed. Most importantly, we show that LSW is not only bound to the DWBC, but spreads all over the North Atlantic. Based on the direction and magnitude of the observed fields, export via the DWBC and a direct injection to the Atlantic interior (stemming from DWBC recirculations near Flemish Cap/Grand Banks) seem to be the favorable pathways. Eastward advection opposite of the Greenland Current (Figure 1) is apparent in both velocity fields near the northern limit of the subpolar gyre, with LSW entering both the Irminger and the Iceland basins. In agreement with our findings, Petit et al. (2023) recently showed using Lagrangian floats that upper North Atlantic Deep Water (most closely related in density space to the LSW2000-2003 defined herein) can travel from the Labrador Sea to the Irminger Basin outside of the Greenland Current. Yashayaev et al. (2007) also showed that LSW signatures reach the Irminger Basin, separate from any local Irminger convective influence. Continued investigation of LSW volume transports and Lagrangian-based advective studies are necessary, however, to determine the leading advective pathways. The Eulerian flow patterns from the adjusted geostrophic velocity fields provide further evidence for an interior recirculation pathway that branches from the DWBC off Cape Hatteras at 36°N, with anti-cyclonic flow extending as far east as 50°W and rejoining the continental slope at approximately 30°N, passing Bermuda (32°N) in the process. Absolute velocities along the shallower γn = 27.90 (Figure 6) isopycnal plane are larger than those of the deeper γn = 27.99 plane. Given nearly identical vector (direction) fields between the two planes, this suggests that despite the increased velocities along these pathways, LSW2000-2003 was likely entrained within the interior recirculation or was subject to multiple pathways given the longer advective timescales observed both in this study and previously in Chomiak et al. (2022).
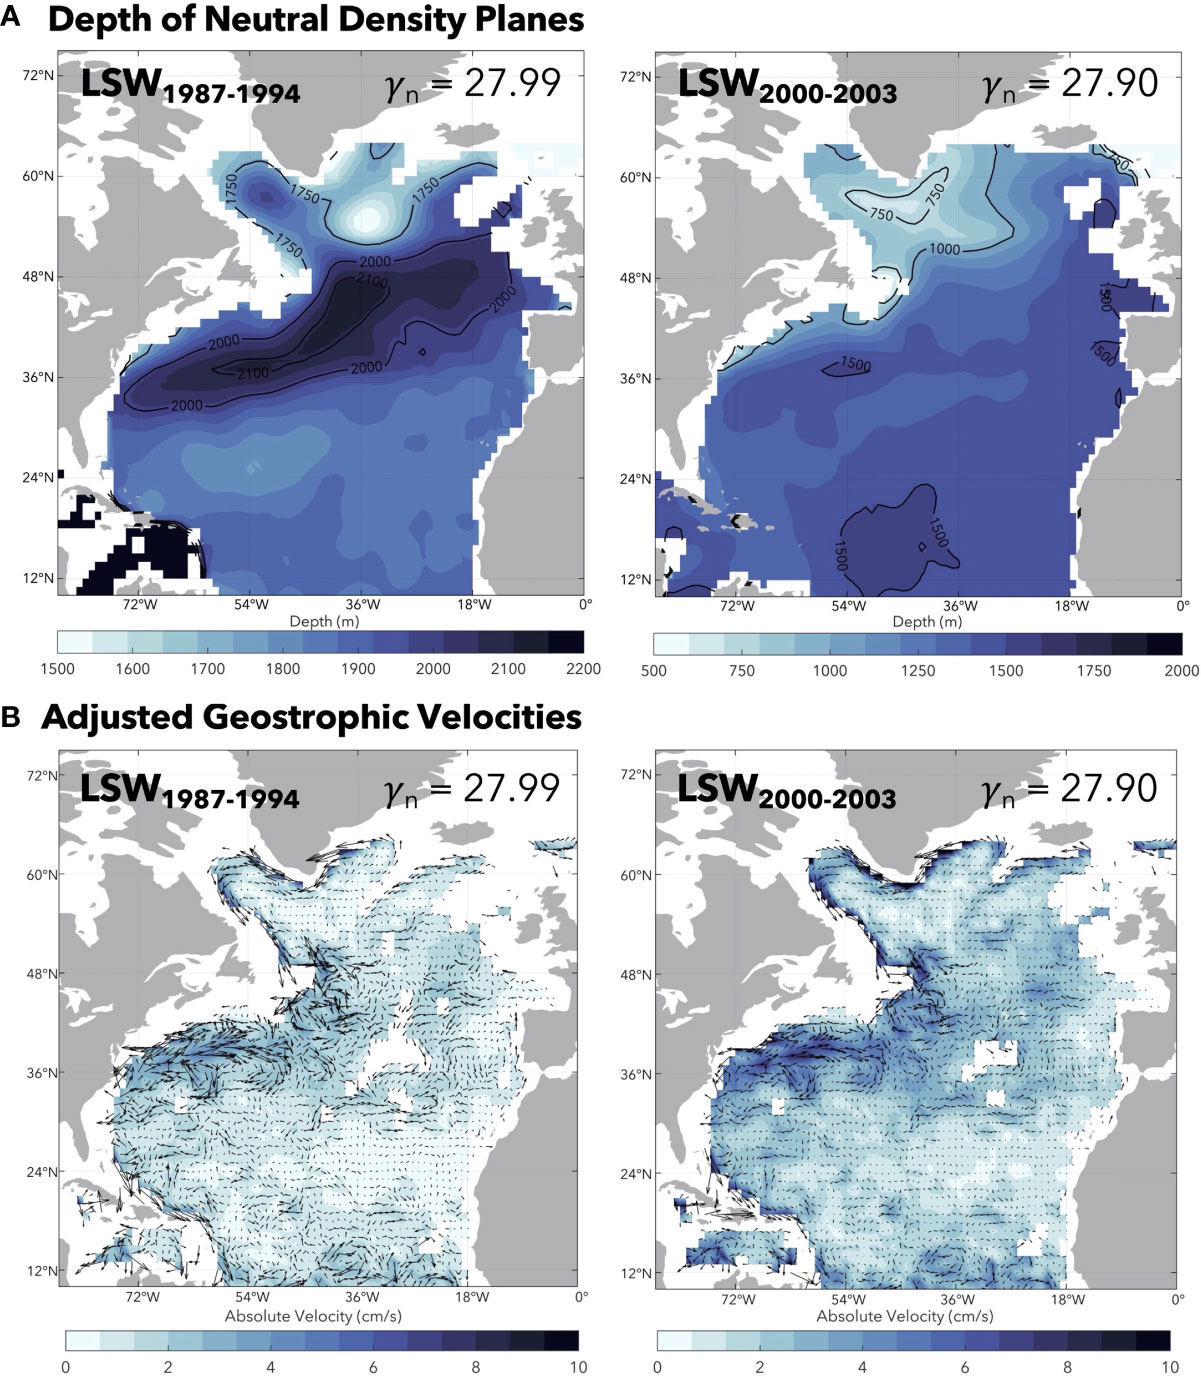
Figure 6 (A) Depth and (B) adjusted geostrophic velocities (Schmid, 2014) along the constant neutral density isopycnal planes of γn = 27.99 kg/m3 (LSW1987-1994) and γn = 27.90 kg/m3 (LSW2000-2003) for the North Atlantic domain. Vectors indicate flow direction, while color shading represents the absolute velocity in cm/s.
While historical studies have investigated the time-mean distribution of LSW within the Atlantic, this novel investigation benefits from enhanced in-situ observations over recent decades and the distinct identifying characteristics of LSW sub-classes to reveal the time-varying distribution of LSW on a basin-wide scale. This study thus improves our understanding of LSW spread from the formation region by observing two individual classes of LSW along their characteristic isopycnal planes over the 31-year dataset. A CEOF analysis (Section 3.2) helps to extract the spatio-temporal characteristics of the planar propagation of LSW along the constant density planes as the anomaly is exported out of the Labrador Sea, while use of hydrographic cross-sections (Section 3.3) permits the interpretation of the vertical extent of the anomalies through the water column at various locations across the North Atlantic at given time periods. Both analyses complement each other and give rise to the propagation patterns discussed herein.
Results continue to justify that equatorward advection of LSW is not solely carried along the western boundary, as interior pathways must also be considered. Using salinity anomalies computed from observational data, we identify three generalized spreading pathways of LSW1987-1994 and LSW2000-2003 from the Labrador Sea to the subtropics (sketched in Figure 7). We find both classes to advect i) towards the eastern subpolar region (Irminger and Icelandic Basins), the eastern boundary, and into the North Atlantic interior, ii) directly into the Atlantic interior likely from an injection by recirculations from the subpolar gyre near the Mid Atlantic Ridge and leakage of the western boundary near Flemish Cap and Grand Banks, and iii) out from the Labrador Sea and equatorward along the western boundary via the DWBC. LSW is observed to spread throughout nearly the entire western half of the North Atlantic interior, extending from the subpolar basin to the subtropics and oftentimes reaching as far east as 40°W likely confined by the Mid Atlantic Ridge. In the eastern Atlantic, LSW is observed to extend as far south as 40°N and propagate southwest into the Atlantic interior following the ridge, likely deterred by the westward spreading of MOW. The relationship between the NAO and the temporal evolution of LSW confirms the known impact of the NAO on LSW formation and suggests that alternating phases of the NAO could modulate the spatial and temporal extent of LSW and competing MOW. Further investigation on the discrete relationship of the NAO on LSW/MOW spreading in the eastern Atlantic is necessary to confidently determine a linkage, if any.
The advective pathways of LSW discussed herein have been previously documented and supported in a multitude of studies using advective tracers, Lagrangian float trajectories, and circulation models (Spall, 1996; Molinari et al., 1998; Bower and Hunt, 2000a; Bower and Hunt, 2000b; Fischer & Schott, 2002; Straneo et al., 2003; Bower et al., 2009; Kieke et al., 2009; Bower et al., 2011; Gary et al., 2011; van Sebille et al., 2011; Gary et al., 2012; Zou and Lozier, 2016; Le Bras et al., 2017; Andres et al., 2018; Biló and Johns, 2019; Bower et al., 2019; Zhai et al., 2021; Chomiak et al., 2022; Fox et al., 2022; Lozier et al., 2022; Petit et al., 2023). In this study, we present the first, to our knowledge, description of the time-varying spread of two discrete LSW masses. The alternative interior advective pathway branching from the western boundary at 36°N is supported by the hydrographic data and velocity fields along the constant neutral density isopycnal planes. Given the advective timescales of the convectively-freshened LSW salinity anomalies to reach the subtropics (observed in this study and previously in Chomiak et al., 2022) - on the order of 10 years for LSW1987-1994 and 10-15 years for LSW2000-2003 - this interior recirculation branching from the western boundary (Figure 7) is likely the main advective pathway for LSW, rather than a direct subpolar-subtropical throughflow pathway via the DWBC. Continued investigation is necessary to determine the volume transport of LSW along these interior pathways and to estimate their relative contribution to the lower-limb of AMOC.
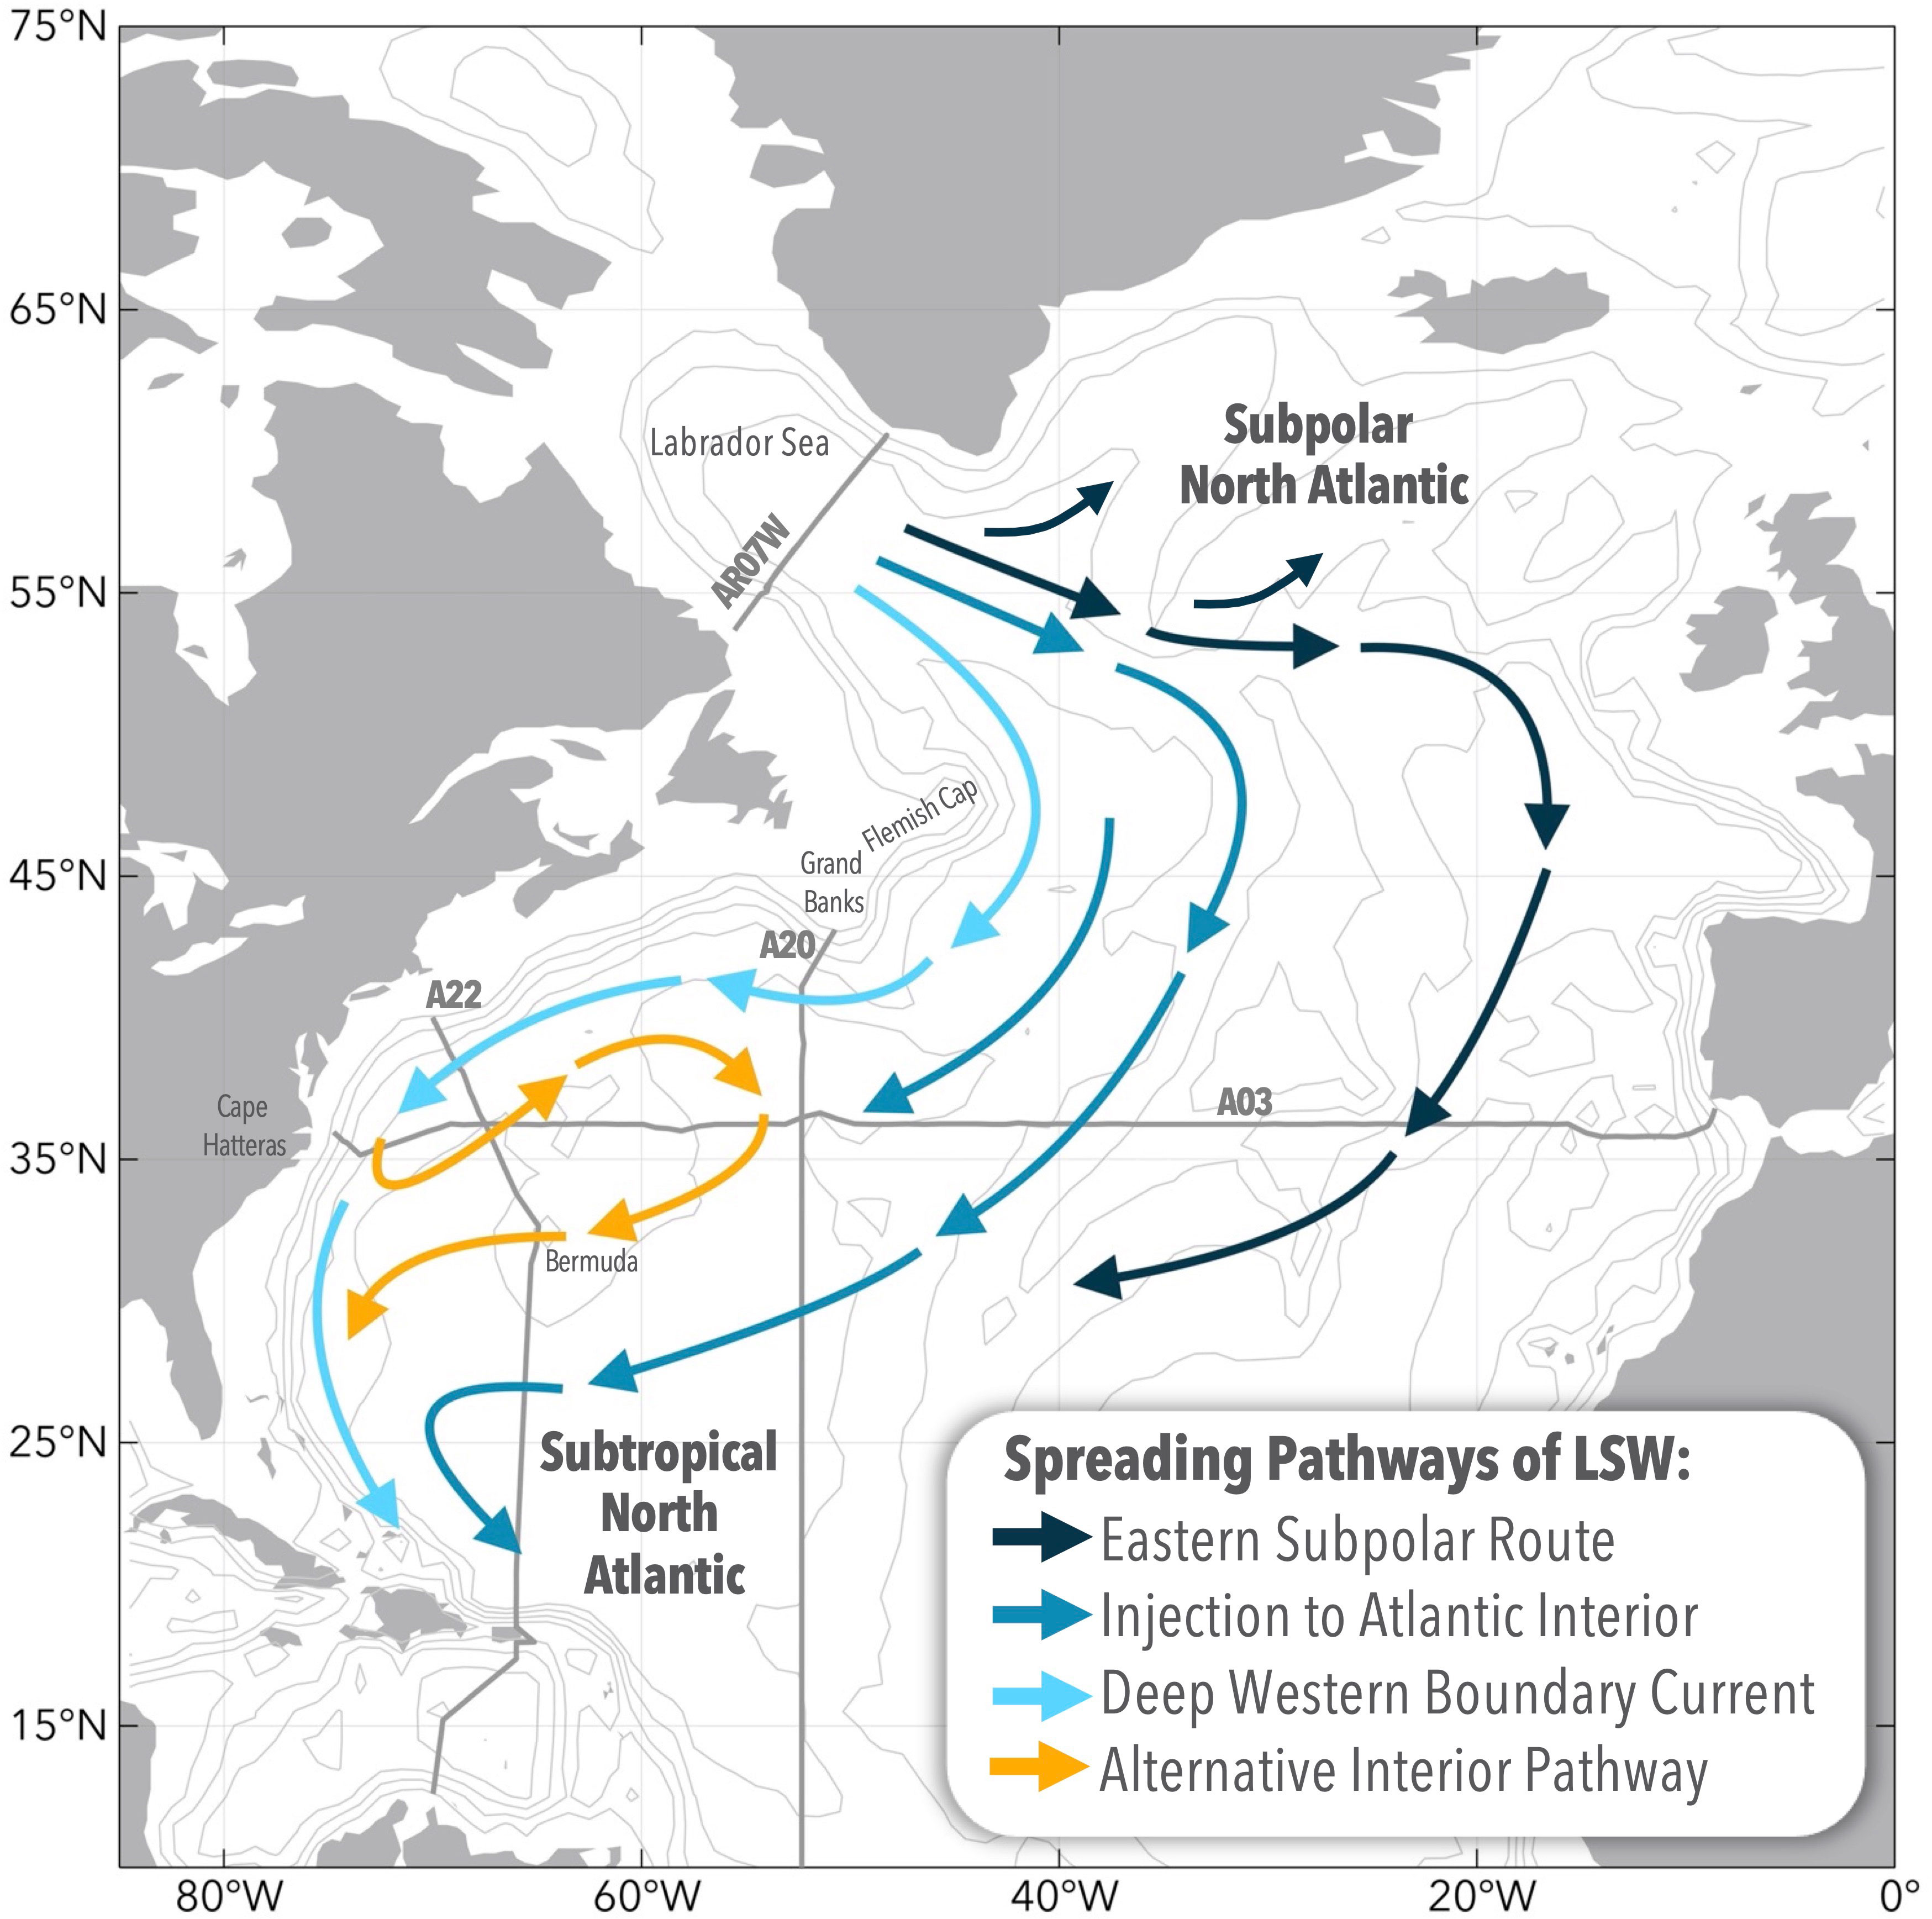
Figure 7 Summary sketch of the inferred and observed LSW advective pathways spatially and discretely observed using the EN4 gridded profiles, the AR07W, A03, A16, A20, and A22 GO-SHIP hydrographic lines shown on the map, CEOF propagation pathways, and the adjusted geostrophic velocity fields. The observations help to confirm evidence of an alternative interior advective pathway of LSW branching off the DWBC at 36°N, as well as showcase both the importance and prominence of interior export pathways. Bathymetric contours are shown in 1000 m intervals.
EN.4.2.2 data were obtained from https://www.metoffice.gov.uk/hadobs/en4/ and are © British Crown Copyright, Met Office, 2022, provided under a Non-Commercial Government License http://www.nationalarchives.gov.uk/doc/non-commercial-government-licence/version/2/, last access Sept. 16, 2022. Monthly NAO indices were obtained from the NOAA Climate Prediction Center (https://www.cpc.ncep.noaa.gov/products/precip/CWlink/pna/nao.shtml). Adjusted geostrophic velocities were derived by C. Schmid using Argo float data from the Global Data Assembly Centre (http://doi.org/10.17882/42182) and altimetry data as described in Schmid (2014); data is available upon request. US GO-SHIP hydrographic data for the repeat sections of AR07W, A03, A16, A22, and A20 were obtained through the CLIVAR and Carbon Hydrographic Data Office (https://cchdo.ucsd.edu/; Barbero and Cimoli, 2023; Bullister and Gruber, 2023; Bullister and Baringer, 2023; Curry, 2022; Erikson and Schockman, 2023; Joyce, 2022; McCartney, 2022; McDonagh, 2022; Menezes and Anderson, 2022; Pickart, 2022; Smethie and Joyce, 2022; Tereschenkov, 2022; Toole and MacDonald, 2022; Wanninkhof and Atwood, 2023; Woosley and Thurnherr, 2022).
LC: Conceptualization, Data curation, Formal Analysis, Investigation, Methodology, Writing – original draft, Writing – review & editing. DV: Investigation, Methodology, Supervision, Writing – review & editing. CS: Data curation, Writing – review & editing.
The author(s) declare financial support was received for the research, authorship, and/or publication of this article. This research was supported by the University of Miami Rosenstiel School of Marine, Atmospheric, and Earth Science and by the National Oceanic and Atmospheric Administration (NOAA) Atlantic Oceanographic and Meteorological Laboratory (AOML), and it was carried out in part under the auspices of the Cooperative Institute for Marine and Atmospheric Studies, a Cooperative Institute of the University of Miami and NOAA, cooperative agreement #NA20OAR4320472. DV was partly supported by the NOAA Climate Variability and Predictability program (grant number NA20OAR4310407), the NOAA Western Boundary Time Series project, and AOML.
The authors would like to warmly thank Marlos Goes and the members at NOAA AOML for the concise internal review, and the two peer-reviewers and journal editor for their feedback and thorough review of this manuscript. The collected US GO-SHIP hydrographic data used in this study was made possible by the NSF/NOAA funded US Repeat Hydrography Program, and we gladly acknowledge and thank all members of the ship, technical, science, and collaborating parties that were involved in the collection and processing of the hydrographic data. As part of the Global Ocean Observing System, Argo data are collected and made freely available by the International Argo Program and the national programs that contribute to it (https://argo.ucsd.edu, https://argo.jcommops.org, https://www.ocean-ops.org).
The authors declare that the research was conducted in the absence of any commercial or financial relationships that could be construed as a potential conflict of interest.
All claims expressed in this article are solely those of the authors and do not necessarily represent those of their affiliated organizations, or those of the publisher, the editors and the reviewers. Any product that may be evaluated in this article, or claim that may be made by its manufacturer, is not guaranteed or endorsed by the publisher.
Andres M., Muglia M., Bahr F., Bane J. (2018). Continuous flow of upper Labrador Sea Water around Cape Hatteras. Sci. Rep. 8 (1), 4494. doi: 10.1038/s41598-018-22758-z
Barbero L., Cimoli L. (2023) CTD data from A16 2023 Cruise 33RO20230413, WHP netCDF version (CCHDO). Available at: https://cchdo.ucsd.edu/cruise/33RO20230413 (Accessed 2023-Sept-28).
Biló T. C., Johns W. E. (2019). Interior pathways of Labrador Sea Water in the North Atlantic from the Argo perspective. Geophys. Res. Lett. 46 (6), 3340–3348. doi: 10.1029/2018GL081439
Bower A. S., Hunt H. D. (2000a). Lagrangian observations of the Deep Western Boundary Current in the North Atlan- tic Ocean, Part I: Large-scale pathways and spreading rates. J. Phys. Oceanogr. 30 (5), 764–783. doi: 10.1175/1520-0485(2000)030<0764:LOOTDW>2.0.CO;2
Bower A. S., Hunt H. D. (2000b). Lagrangian observations of the Deep Western Boundary Current in the North Atlantic Ocean, Part II: The Gulf Stream-Deep Western Boundary Current crossover. J. Phys. Oceanogr. 30 (5), 784–804. doi: 10.1175/1520-0485(2000)030<0784:lootdw>2.0.co;2
Bower A., Lozier S., Biastoch A., Drouin K., Foukal N., Furey H., et al. (2019). Lagrangian views of the pathways of the Atlantic Meridional Overturning Circulation. J. Geophys. Res.: Oceans 124 (8), 5313–5335. doi: 10.1029/2019JC015014
Bower A., Lozier S., Gary S. (2011). Export of Labrador Sea Water from the Subpolar North Atlantic: A Lagrangian perspective. Deep Sea Res. Part II: Topical Stud. Oceanogr. 58 (17–18), 1798–1818. doi: 10.1016/j.dsr2.2010.10.060
Bower A. S., Lozier S. M., Gary S. F., Boning C. W. (2009). Interior pathways of the North Atlantic meridional overturning circulation. Nature 459 (7244), 243. doi: 10.1038/nature07979
Bullister J., Baringer M. (2023) CTD data from A16 2013 Cruise 33RO20130803, WHP netCDF version (CCHDO). Available at: https://cchdo.ucsd.edu/cruise/33RO20130803 (Accessed 2023-May-03).
Bullister J., Gruber N. (2023) CTD data from A16 2003 Cruise 33RO200306_01, WHP netCDF version (CCHDO). Available at: https://cchdo.ucsd.edu/cruise/33RO200306_01 (Accessed 2023-May-03).
Chomiak L. N., Yashayaev I., Volkov D. L., Schmid C., Hooper J. A. (2022). Inferring advective timescales and overturning pathways of the deep western boundary current in the North Atlantic through Labrador Sea Water advection. J. Geophys. Res.: Oceans 127 (12), e2022JC018892. doi: 10.1029/2022JC018892
Cunningham S. A., Haine T. W. N. (1995). Labrador Sea Water in the Eastern North Atlantic. Part I: A synoptic circulation inferred from a minimum in potential vorticity. J. Phys. Oceanogr. 25 (4), 649–665. doi: 10.1175/1520-0485(1995)025<0649:lswite>2.0.co;2
Curry R. (2022) CTD data from A22 2012 Cruise 33AT20120324, WHP netCDF version (CCHDO). Available at: https://cchdo.ucsd.edu/cruise/33AT20120324 (Accessed 2022-Oct-04).
Curry R. G., McCartney M. S. (1996). Labrador Sea Water carries northern climate signal south. Oceanus-Woods Hole Mass 39 (4), 24–28. https://www.whoi.edu/cms/files/dfino/2005/4/v39n2-curry_2167.pdf
Erikson Z., Schockman K. (2023) CTD data from A16 2023 Cruise 33RO20230306, WHP netCDF version (CCHDO). Available at: https://cchdo.ucsd.edu/cruise/33RO20230306 (Accessed 2023-Sept-28).
Fine R. A., Rhein M., Andrié C. (2002). Using a CFC effective age to estimate propagation and storage of climate anomalies in the deep western North Atlantic Ocean. Geophys. Res. Lett. 29 (24), 2227. doi: 10.1029/2002GL015618
Fischer J., Schott F. A. (2002). Labrador Sea Water tracked by profiling floats—From the boundary current into the open North Atlantic. J. Phys. Oceanogr. 32 (2), 573–584. doi: 10.1175/1520-0485(2002)032<0573:LSWTBP>2.0.CO;2
Fox A. D., Handmann P., Schmidt C., Fraser N., Rühs S., Sanchez-Franks A., et al. (2022). Exceptional freshening and cooling in the eastern subpolar North Atlantic caused by reduced Labrador Sea surface heat loss. Ocean Sci. 18 (5), 1507–1533. doi: 10.5194/os-18-1507-2022
Gary S. F., Lozier S. M., Biastoch A., Böning C. W. (2012). Reconciling tracer and float observations of the export pathways of Labrador Sea Water. Geophys. Res. Lett. 39 (24), L24606. doi: 10.1029/2012GL053978
Gary S. F., Lozier S. M., Böning C. W., Biastoch A. (2011). Deciphering the pathways for the deep limb of the meridional overturning circulation. Deep Sea Res. Part II: Topical Stud. Oceanogr. 58 (17–18), 1781–1797. doi: 10.1016/j.dsr2.2010.10.059
Getzlaff K., Böning C. W., Dengg J. (2006). Lagrangian perspectives of deep water export from the subpolar North Atlantic. Geophys. Res. Lett. 33, L21S08. doi: 10.1029/2006GL026470
Good S. A., Martin M. J., Rayner N. A. (2013). EN4: Quality controlled ocean temperature and salinity profiles and monthly objective analyses with uncertainty estimates. J. Geophys. Res.: Oceans 118 (12), 6704–6716. doi: 10.1002/2013JC009067
Gouretski V., Reseghetti F. (2010). On depth and temperature biases in bathythermograph data: Development of a new correction scheme based on analysis of a global ocean database. Deep Sea Res. Part I: Oceanographic Res. Pap. 57 (6), 812–833. doi: 10.1016/j.dsr.2010.03.011
Hurrell J. W., Kushnir Y., Ottersen G., Visbeck M. (2003). An overview of the North Atlantic oscillation. The North Atlantic oscillation: climate significance and environmental impact. Geophys. Monogr. Amer. Geophys. Union 134, 1–35. doi: 10.1029/134GM01
Joyce T. (2022) CTD data from A22 1997 Cruise 316N151_4, WHP netCDF version (CCHDO). Available at: https://cchdo.ucsd.edu/cruise/316N151_4 (Accessed 2022-Oct-04).
Kieke D., Klein B., Stramma L., Rhein M., Koltermann K. P. (2009). Variability and propagation of Labrador Sea Water in the southern subpolar North Atlantic. Deep Sea Res. Part I: Oceanographic Res. Pap. 56 (10), 1656–1674. doi: 10.1016/j.dsr.2009.05.010
Koelling J., Atamanchuk D., Karstensen J., Handmann P., Wallace D. W. R. (2022). Oxygen export to the deep ocean following Labrador Sea Water formation. Biogeosciences 19, 437–454. doi: 10.5194/bg-19-437-2022
Le Bras I. A., Yashayaev I., Toole J. M. (2017). Tracking Labrador Sea Water property signals along the Deep Western Boundary Current. J. Geophys. Res.: Oceans 122 (7), 5348–5366. doi: 10.1002/2017JC012921
Lozier M. S., Bower A. S., Furey H. H., Drouin K. L., Xu X., Zou S. (2022). Overflow water pathways in the North Atlantic. Prog. Oceanogr. 208, 102874. doi: 10.1016/j.pocean.2022.102874
Lozier M. S., Stewart N. M. (2008). On the temporally varying northward penetration of Mediterranean Overflow Water and eastward penetration of Labrador Sea Water. J. Phys. Oceanogr. 38 (9), 2097–2103. doi: 10.1175/2008JPO3908.1
McCarthy G. D., Smeed D. A., Johns W. E., Frajka-Williams E., Moat B. I., Rayner D., et al. (2015). Measuring the Atlantic meridional overturning circulation at 26°N. Prog. Oceanogr. 130, 91–111. doi: 10.1016/j.pocean.2014.10.006
McCartney M. (2022) CTD data from A20 2012 Cruise 33AT20120419, WHP netCDF version (CCHDO). Available at: https://cchdo.ucsd.edu/cruise/33AT20120419 (Accessed 2022-Oct-14).
McDonagh E. (2022) CTD data from A03 2005 Cruise 74AB20050501, WHP netCDF version (CCHDO). Available at: https://cchdo.ucsd.edu/cruise/74AB20050501 (Accessed 2022-Dec-06).
Menezes V., Anderson J. (2022) CTD data from A22 2021 Cruise 325020210420, WHP netCDF version (CCHDO). Available at: https://cchdo.ucsd.edu/cruise/325020210420 (Accessed 2022-Sept-22).
Molinari R. L., Fine R. A., Wilson W. D., Curry R. G., Abell J., McCartney M. S. (1998). The arrival of recently formed Labrador Sea Water in the Deep Western Boundary Current at 26.5°N. Geophys. Res. Lett. 25 (13), 2249–2252. doi: 10.1029/98GL01853
Navarra A., Simoncini V. (2010). “Generalizations: Rotated, complex, extended and combined EOF,” in A Guide to Empirical Orthogonal Functions for Climate Data Analysis (Springer Science and Business Media), 69–96.
Petit T., Lozier M. S., Rühs S., Handmann P., Biastoch A. (2023). Propagation and transformation of upper North Atlantic Deep Water from the subpolar gyre to 26.5°N. J. Geophys. Res.: Oceans 128, e2023JC019726. doi: 10.1029/2023JC019726
Pickart R. (2022) CTD data from A20 1997 Cruise 316N151_3, WHP netCDF version (CCHDO). Available at: https://cchdo.ucsd.edu/cruise/316N151_3 (Accessed 2022-Oct-14).
Schmid C. (2014). Mean vertical and horizontal structure of the subtropical circulation in the South Atlantic from three-dimensional observed velocity fields. Deep Sea Res. 91 (9), 50–71. doi: 10.1016/j.dsr.2014.04.015
Smethie W. M. Jr., Fine R. A., Putzka A., Jones E. P. (2000). Tracing the flow of North Atlantic Deep Water using chlorofluorocarbons. J. Geophys. Res.: Oceans 105 (C6), 14297–14323. doi: 10.1029/1999JC900274
Smethie W., Joyce T. (2022) CTD data from A22 2003 Cruise 316N200310, WHP netCDF version (CCHDO). Available at: https://cchdo.ucsd.edu/cruise/316N200310 (Accessed 2022-Oct-14).
Solodoch A., McWilliams J. C., Stewart A. L., Gula J., Renault L. (2020). Why does the deep western boundary current “Leak” around flemish cap? J. Phys. Oceanogr. 50 (7), 1989–2016. doi: 10.1175/JPO-D-190247.s1
Spall M. A. (1996). Dynamics of the Gulf Stream/Deep Western Boundary Current crossover. Part I: Entrainment and recirculation. J. Phys. Oceanogr. 26 (10), 2152–2168. doi: 10.1175/1520-0485(1996)026<2152:DOTGSW>2.0.CO;2
Straneo F., Pickart R. S., Lavender K. (2003). Spreading of Labrador Sea Water: An advective-diffusive study based on Lagrangian data. Deep Sea Res. Part I: Oceanographic Res. Pap. 50 (6), 701–719. doi: 10.1016/s0967-0637(03)00057-8
Talley L. D., McCartney M. S. (1982). Distribution and circulation of Labrador Sea Water. J. Phys. Oceanogr. 12 (11), 1189–1205. doi: 10.1175/1520-0485(1982)012<1189:DACOLS>2.0.CO;2
Tereschenkov V. (2022) CTD data from A03 1993 Cruise 90CT40_1, WHP netCDF version (CCHDO). Available at: https://cchdo.ucsd.edu/cruise/90CT40_1 (Accessed 2022-Dec-06).
Toole J., MacDonald A. (2022) CTD data from A20 2003 Cruise 316N200309, WHP netCDF version (CCHDO). Available at: https://cchdo.ucsd.edu/cruise/316N200309 (Accessed 2022-Oct-14).
van Aken H. M. (2000). The hydrography of the mid-latitude Northeast Atlantic Ocean: II: The intermediate water masses. Deep Sea Res. Part I: Oceanographic Res. Pap. 47 (5), 789–824. doi: 10.1016/S0967-0637(99)00112-0
van Sebille E., Baringer M. O., Johns W. E., Meinen C. S., Beal L. M., de Jong M. F., et al. (2011). Propagation pathways of classical Labrador Sea Water from its source region to 26°N. J. Geophys. Res. 116 (C12), C12027. doi: 10.1029/2011JC007171
Volkov D. L., Baringer M., Smeed D., Johns W., Landerer F. W. (2019). Teleconnection between the Atlantic meridional overturning circulation and sea level in the Mediterranean Sea. J. Climate 32 (3), 935–955. doi: 10.1175/JCLI-D-18-0474.1
Volkov D. L., Landerer F. W. (2015). Internal and external forcing of sea level variability in the Black Sea. Climate Dyn. 45, 2636–2644. doi: 10.1007/s00382-015-2498-0
Volkov D. L., Smeed D. A., Lankhorst M., Dong S., Moat B. I., Willis J., et al. (2023). The state of the Atlantic meridional overturning circulation. [In “State of the Climate in 2022”]. Bull. Amer. Meteor. Soc. 104 (9), S173–S176. doi: 10.1175/BAMS-D-23-0076.2
Wanninkhof W., Atwood D. K. (2023) CTD data from A16 1993 Cruise 3175MB93, WHP netCDF version (CCHDO). Available at: https://cchdo.ucsd.edu/cruise/3175MB93 (Accessed 2023-May-03).
Woosley R., Thurnherr A. (2022) CTD data from A20 2021 Cruise 325020210316, WHP netCDF version (CCHDO). Available at: https://cchdo.ucsd.edu/cruise/325020210316 (Accessed 2022-Oct-14).
Yashayaev I. (2007). Hydrographic changes in the Labrador sea 1960–2005. Prog. Oceanogr. 73 (3–4), 242–276. doi: 10.1016/j.pocean.2007.04.015
Yashayaev I., Bersch M., van Aken H. M. (2007). Spreading of the Labrador Sea Water to the irminger and Iceland basins. Geophys. Res. Lett. 34 (10), L10602. doi: 10.1029/2006GL028999
Zhai Y., Yang J., Wan X., Zou S. (2021). The eastern Atlantic basin pathway for the export of the North Atlantic deep waters. Geophys. Res. Lett. 48 (24), e2021GL095615. doi: 10.1029/2021GL095615
Keywords: Labrador Sea Water, advective pathways, DWBC, interior pathways, hydrography
Citation: Chomiak L, Volkov D and Schmid C (2023) The interior spreading story of Labrador Sea Water. Front. Mar. Sci. 10:1270463. doi: 10.3389/fmars.2023.1270463
Received: 31 July 2023; Accepted: 17 October 2023;
Published: 31 October 2023.
Edited by:
Toru Miyama, Japan Agency for Marine-Earth Science and Technology, JapanReviewed by:
Mathilde Jutras, McGill University, CanadaCopyright © 2023 Chomiak, Volkov and Schmid. This is an open-access article distributed under the terms of the Creative Commons Attribution License (CC BY). The use, distribution or reproduction in other forums is permitted, provided the original author(s) and the copyright owner(s) are credited and that the original publication in this journal is cited, in accordance with accepted academic practice. No use, distribution or reproduction is permitted which does not comply with these terms.
*Correspondence: Leah Chomiak, bGVhaC5jaG9taWFrQGVhcnRoLm1pYW1pLmVkdQ==
Disclaimer: All claims expressed in this article are solely those of the authors and do not necessarily represent those of their affiliated organizations, or those of the publisher, the editors and the reviewers. Any product that may be evaluated in this article or claim that may be made by its manufacturer is not guaranteed or endorsed by the publisher.
Research integrity at Frontiers
Learn more about the work of our research integrity team to safeguard the quality of each article we publish.