 Gyeongmin Kim
 Hyemin Kim3
 Anh D. Nguyen
 Ui Wook Hwang
- 1Institute for Phylogenomics and Department of Biology Education, Teachers College Evolution, Kyungpook National University, Daegu, Republic of Korea
- 2School of Life Sciences, Graduate School, Kyungpook National University, Daegu, Republic of Korea
- 3Department of Obstetrics and Gynecology, Seoul National University Hospital, Seoul, Republic of Korea
- 4General Administration and Coordination Department, Phylomics Inc., Daegu, Republic of Korea
- 5Institute of Ecology and Biological Resources, Vietnam Academy of Science and Technology, Hanoi, Vietnam
- 6Institute for Korean Herb-Bio Convergence Promotion, Kyungpook National University, Daegu, Republic of Korea
- 7School of Industrial Technology Advances, Kyungpook National University, Daegu, Republic of Korea
Introduction: Sea slater, in the genus Ligia, is widespread in rocky shore habitats, and the taxon is easily isolated due to its limited dispersal capacity. Therefore, most Ligia species exhibit an allopatric distribution, but Ligia exotica and L. cinerascens exhibit an overlapping distribution distribution in East Asia. Previous studies on both species have confirmed the existence of highly divergent lineages based on 16S rRNA.
Methods: In the present study, 282 Ligia individuals were collected at ten, three, and three sites in South Korea, Japan, and Vietnam, respectively, and 41 haplotypes were observed based on 16S rRNA.
Results and discussion: The results of phylogeny, phylogenetic network, and TCS network, Principal Coordinates Analysis, and four Molecular Species Delimitation Analyses revealed that six genetic lineages including L. cinerascens, Lineages N and S of L. exotica, Ligia sp. 1, sp.2 and sp.3 were present. The three genetic lineages, including L. cinerascens, Lineage N of L. exotica, and Lineage S of L. exotica, were also identified in the phylogeny based on a nuclear gene of the sodium–potassium ATPase α-subunit (Nak). Phylogeographic analysis revealed that L. cinerascens and Lineage N of L. exotica were distributed overlappingly in South Korea, Japan, and the northern region of China. Generally, the two lineages of L. exotica were distributed allopatrically, which was more evident along the coastline of mainland China than that of Japan. The results of time-calibrated phylogeny suggested that the speciation events of Ligia species might be associated with Japanese mainland formation from Oligocene to Miocene (approximately 30-5 million years ago, Mya). The results of the present study provide insights that could facilitate the understanding of the evolutionary history of Ligia, tracking of geological processes, and evolutionary effects of palaeogeographical events at the population level.
Introduction
Sea slater, in the genus Ligia (Crustacea: Isopoda) is widespread in rocky intertidal habitats with approximately 40 recorded species (Schmalfuss, 2003). Ecologically, the taxon is involved in decomposition and nutrient recycling processes in marine ecosystems (Zimmer, 2002). The genus is considered a model organism for evolutionary research due to its two main characteristics: successful transition from aquatic to terrestrial environments in its evolutionary history and reportedly limited dispersal ability during its life cycle (Farr, 1978; Carefoot and Taylor, 1995). The latter may be attributed to ecological traits of the genus such as low desiccation tolerance and vagility, and lack of a planktonic larval phase (Tsai et al., 1998; Zhang et al., 2016). The restricted dispersal trait can potentially lead to geographic isolation between populations, with limited gene flow and significant genetic variation among populations, suggesting cryptic species diversity (Hurtado et al., 2010; Markow and Pfeiler, 2010; Santamaria et al., 2013; Greenan et al., 2018; Santamaria, 2019).
Due to their geographical isolation, most Ligia species exhibit an allopatric distribution. However, Ligia exotica Roux, 1828 and Ligia cinerascens Budde-Lund, 1885, found in East Asia exhibit overlapping distribution (Yin et al., 2013; Hurtado et al., 2018; Kang and Jung, 2020). Ligia exotica is predominantly distributed along the coast of South Korea and China, as well as in Kyushu, Shikoku, and Honshu in Japan. L. cinerascens is distributed on the western and southern coasts of South Korea, the northeastern coast of China, and Hokkaido, Honshu, and northern Kyushu in Japan (Nunomura, 1983; Yin et al., 2013). The two species have morphological differences in the lengths of the posterolateral process (PLP) and the inner accessory process (IAP) within the telson, and appendix masculina of the second pleopod, and number of segments in the flagellum (Nunomura, 1983; Yin et al., 2013).
Considering their overlapping distribution, numerous phylogeographic studies of the two species within East Asia have been reported previously (Jung et al., 2008; Yin et al., 2013; Hurtado et al., 2018; Kang and Jung, 2020). According to Jung et al. (2008), Ligia species inhabiting South Korea are largely divided into the eastern and western groups in the phylogenetic analysis based on 16S rRNA. Yin et al. (2013) conducted phylogenetic studies based on morphological and molecular characteristics by collecting additional Ligia species in coastal areas of China; they assigned two Ligia species, L. cinerascens, and L. exotica, and each species formed a monophyletic clade. They also included the 16S rRNA data in Jung et al. (2008) and observed that the eastern and western groups previously mentioned are included in L. exotica and L. cinerascens clades, respectively. In addition, they investigated the existence of two geographical clades within L. exotica and suggested that the distribution ranges of the two lineages were differentiated by latitude. Hurtado et al. (2018) conducted a phylogenetic analysis based on 16S rRNA by collecting Ligia species not only in East Asia, but also in Southeast Asia, Africa, and America. The examination of each clade in L. exotica and L. cinerascens confirmed that L. exotica formed four subclades. The results suggested that East Asia is a source of L. exotica populations introduced from regions such as Hawaii, Americas, and Africa. Kang and Jung (2020) performed phylogenetic studies that included samples from areas not yet surveyed (e.g., Vladivostok in Russia), and they investigated incongruencies between mitochondrial and nuclear DNA markers, which were suggested to be due to distinct evolutionary histories of each marker or genomic islands of speciation.
Although numerous phylogeographic studies have been conducted on the two species in East Asia, their molecular population genetics and phylogenetic studies have yet to be conducted in numerous regions. Investigation of L. exotica and L. cinerascens from other putative localities in East Asia is required to understand the evolutionary history of Ligia species. In the present study, Ligia species were collected from regions that have not been studied previously, Dokdo Island in South Korea, Tottori-ken in Japan, and Catba, Danang, and Phu quoc in Vietnam, and molecular population genetics and phylogenetic studies of the two Ligia species were conducted based on 16S rRNA to examine their phylogeographic distribution patterns and demographic history. In addition, phylogenetic analyses of a subset of the samples were also conducted with the nuclear marker, the sodium–potassium ATPase α-subunit (Nak). Finally, time-calibrated molecular clock analyses, which estimated divergence events among the genetic lineages of Ligia in East Asia, were conducted to explore the evolutionary history of Ligia species.
Materials and methods
Sample collection and 16S rRNA and Nak gene sequencing
In total, 282 Ligia species specimens were collected from 16 sites in three countries, including 10 sites in South Korea, three in Japan, and three in Vietnam (Figure 1, Supplementary Table 1). All collected samples were directly fixed in 95% ethyl alcohol and stored at -20°C before DNA extraction. Genomic DNA was isolated using walking legs of individuals using a DNeasy Blood and Tissue Kit (Qiagen, United States). The concentration of extracted DNA was measured using NanoDrop 2000 (Thermo Fisher Scientific, United States) and the integrity was checked with a 1% agarose gel electrophoresis.
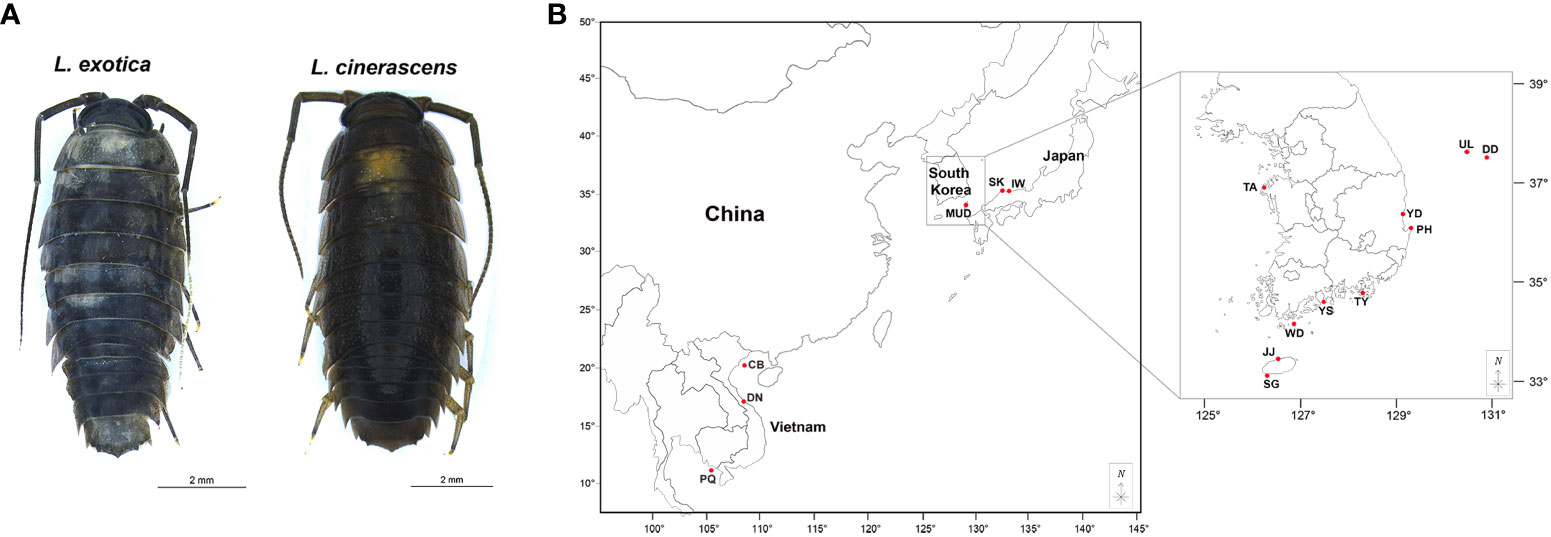
Figure 1 Ligia exotica and Ligia cinerascens, and a map showing sampling localities for 282 Ligia samples. (A, B) The pictures show (A) L. exotica and L. cinerascens and were photographed by Gyeongmin Kim and edited using Adobe Illustrator v.22.2 (https://www.adobe.com). (B) The collection sites of 282 Ligia individuals, including ten populations in South Korea, three in Japan, and three in Vietnam. Detailed information regarding the locality is presented in Supplementary Table 1. The maps are from a free map providing site (https://d-maps.com) and are modified with Adobe Illustrator v.22.2 (https://www.adobe.com).
Species identification was performed done using mitochondrial 16S rRNA genes by DNA Sanger sequencing, with a 16Sa (5′-CGCCTGTTTATCAAAAACAT-3′) and 16Sb (5′-CTCCGGTTTGAACTCAGATCA-3) primer pair (Xiong and Kocher, 1991; Simon et al., 1994). PCR was conducted to amplify the partial fragment of the 16S rRNA gene with a 50 μL total volume of PCR mix comprising 25–100 ng genomic DNA, 10 mM dNTP, and 10 pM of forward and reverse primers with the addition of 0.25 units of Taq DNA polymerase (Solgent, South Korea). The following thermal cycling conditions were adapted as follows: denaturation at 94°C for 2 min, followed by 35 amplification cycles of 94 °C for 20 s, 48°C– 50°C for 40 s, and 72°C for 1 min, and a final extension at 72°C for 5 min. Subsequently, 1 μL of each PCR product was electrophoresed on a 1% agarose gel containing eco-dye and observed under UV light. The confirmed PCR bands were purified using a QIAquick PCR Purification Kit (QIAGEN, Germany) and directly sequenced with an ABI Prism 3730 DNA sequencer (PerkinElmer, United States) using a Big Dye Termination Sequencing Kit (PerkinElmer, United States).
In addition to 16S rRNA, NaK was amplified by PCR and sequenced from 11 Ligia individuals (9 L. exotica and 2 L. cinerascens) representing the 11 localities examined here (Supplementary Table 2). Previously described primers Nak-for-b (5’-ATGACAGTTGCTCATATGTGGTT-3’) and Nak-rev2 (5’-ATAGGGTGATCTCCAGTRACCAT-3’) were used for PCR amplification of Nak (Tsang et al., 2008).
Sequence alignment, genetic diversity, and differentiation analysis
The obtained 16S rRNA and Nak nucleotide sequences of the two Ligia species were aligned using the Clustal X2 program by default setting, and ambiguous regions where homology could not be confidently identified at the 5’ and 3’ ends in sequences were removed by BioEdit 7.2.5 with a final length of 379bp of 16S rRNA and 663bp of Nak (Hall, 1999; Larkin et al., 2007). Haplotypes, singleton sites, and parsimoniously informative sites were identified using DnaSP 6.11 (Rozas et al., 2017). All novel 16S rRNA haplotype and Nak sequences discovered in the present study were deposited in NCBI GenBank with accession numbers OQ916835-OQ916875 of 16S rRNA and OR641242-OR641252 of Nak. Haplotype diversity (h) and nucleotide diversity (π) per population were calculated using DnaSP 6.11. To investigate the genetic differentiation between populations of each species, pairwise fixation index (FST) values were estimated using the Arlequin 3.5 (Excoffier and Lischer, 2010). Mantel test was performed using Alleles in Space 1.0 to investigate the patterns of isolation by distance between pairwise genetic and geographic distances (Miller, 2005).
Delimitation of species hypotheses
For population genetic analyses, 197 previously published 16S rRNA sequences for Ligia species from the National Center for Biotechnology Information (NCBI) GenBank were included in the dataset. These included one sequence described by Wetzer (2001), one by Taiti et al. (2003), 39 by Jung et al. (2008), 24 by Yin et al. (2013), one by Santamaria et al. (2013), 42 by Hurtado et al. (2018), and 13 by Kang and Jung (2020), as well as 76 sequences found in unpublished data (Supplementary Table 3). In the case of Nak, 11 previously reported sequences for 6 L. exotica and 5 L. cinerascens were retrieved from the NCBI GenBank for phylogenetic analyses (Supplementary Table 2). In total, 22 Nak sequences, consisting of 11 obtained in the present study and 11 retrieved from the NCBI GenBank, were included for phylogenetic analyses. To examine phylogenetic relationships among the populations in the two Ligia species, unrooted phylogenetic trees were reconstructed using the maximum likelihood (ML) and Bayesian Inference (BI) methods. The ML tree was constructed using the IQ-tree web server (http://iqtree.cibiv.univie.ac.at/) (Trifinopoulos et al., 2016). The selection of the best evolutionary model was performed in the IQ-tree software package (http://www.iqtree.org). The TIM2 + F + I + G4 model was selected as a best-fit model based on Bayesian Information Criterion (BIC). The number of bootstrap iterations was 1000. For BI tree reconstruction, GTR + F + I + G4 model was selected as a best-fit substitution model using jModeltest 2.2 (Darriba et al., 2012), then used to reconstruct the BI tree in MrBayes 3.2 (Ronquist et al., 2012) with 10,000,000 generations, in which sampling was conducted every 1,000 iterations. The first 15% of the iterations were discarded after Markov Chain Monte Carlo (MCMC) runs reached a stationary level. Three additional phylogenetic analyses were conducted: an unrooted phylogenetic network based on the neighbor net algorithm was reconstructed using Splitstree (Huson and Bryant, 2006), whilst haplotype network based on the TCS approach were obtained using TCS 1.21 and popART aiming to investigate genealogical relationships between haplotypes (Clement et al., 2000; Leigh and Bryant, 2015). Principal Coordinate Analysis (PCoA) was used to visualize differences among sequences in Darwin 6.0.9 program (Perrier and Jacquemoud-Collet, 2006).
To evaluate species boundaries and number of species in the dataset, four different Molecular Species Delimitation Analyses (MSDAs) were performed: Automatic Barcode Gap Discovery (ABGD), Assemble Species by Automatic Partitioning (ASAP), Poisson Tree Process (PTP), and Bayesian implementation of PTP (bPTP) (Puillandre et al., 2012; Zhang et al., 2013; Puillandre et al., 2021). The two former methods are based on genetic distance, and the two latter methods are based on phylogeny. ABGD and ASAP analyses were performed based on Kimura two-parameter distance matrix (Kimura, 1980) using the online servers (ABGD: https://bioinfo.mnhn.fr/abi/public/abgd/; ASAP: https://bioinfo.mnhn.fr/abi/public/asap/). In ABGD, two more parameters were considered including P values (Pmin value 0.001, Pmax value 0.1) and a relative gap width of 1.5. In ASAP, default values of all parameters were selected. The PTP and bPTP analyses were carried out using an online server (https://species.h-its.org/). In the PTP and bPTP analyses, rooted phylogenies were reconstructed using the ML algorithm implemented in the IQ-tree web server (http://iqtree.cibiv.univie.ac.at/). Detailed parameters were as follows: 100,000 MCMC generations, a burn-in of 0.1 and a thinning value of 100. Genetic distance within or among the candidate species inferred from MSDAs patterns were calculated based on Kimura 2-parameter methods using MEGA 11 (Tamura et al., 2021).
Population dynamics and divergence time analysis
To examine the historical demographic trends of L. cinerascens and two L. exotica lineages, we performed three different approaches based on 16S rRNA sequences: 1) three neutrality tests including Tajima’s D, Fu’s Fs, and R2 in DnaSP 6.11 and Arlequin 3.5, to investigate changes in population size in the past (Tajima, 1989; Fu, 1997; Ramos-Onsins and Rozas, 2002), 2) a mismatch distribution analysis (MMD) to estimate the frequency of pairwise differences using DnaSP 6.11 (Rogers and Harpending, 1992), and 3) a Bayesian skyline plot (BSP) to evaluate fluctuation of effective population size since the appearance time of the most recent common ancestor using BEAST 2.6.0 (Drummond and Rambaut, 2007; Bouckaert et al., 2014). In MMD, raggedness index (r) and sum of square deviations (SSD) were calculated to investigate if the dataset was suitable for the population growth-decline model using Arlequin 3.5 (Harpending, 1994). In BSP, mutation rate was directly calculated for each lineage assuming the exponential population growth of coalescence model, based on BEAST 2.6.0.: 1.30 × 10⁻⁸ for Lineage N of L. exotica, 1.07 × 10⁻⁸ for Lineage S of L. exotica, and 1.44 × 10⁻⁸ for L. cinerascens. In addition, 10 million steps were run with sampling of every 1,000 generations in the MCMC method. The investigation of ESS value and BSP was conducted using the TRACER 1.6 program (Heled and Drummond, 2008; Rambaut and Drummond, 2014a). Estimation of divergence time was performed on the Ligia phylogeny inferred from 16S rRNA using the BEAST 2.6.0. program. The time calibration was based on fossil records, as estimated by Neraudeau (2008) (Neraudeau, 2008; Broly et al., 2013). A fossil of the genus Ligia was found in France and the age was estimated to be in the Albian stage of the Cretaceous (113.0-100.5 Ma). Based on the fossil record, we set a calibration point (110.0 Ma) where the genus Ligia and other genera had been diverged. After time calibration, divergence time estimation was carried out using a Yule speciation model with the strict clock method. For phylogeny reconstruction, four outgroup sequences including those of Idotea baltica, Ligia oceanica, L. perkinsi, and L. hawaiensis were selected and retrieved from NCBI GenBank. The GTR + F+ G4 model was selected as a best-fit substitution model, estimated from jmodeltest 2.02 (Darriba et al., 2012). A total of 10,000,000 MCMC generations were performed as a posterior distribution parameter. The first 25% of the phylogenies were removed as a burn-in, and the resultant 8,001 trees were combined into a maximum clade credibility tree using the TreeAnnotator 2.6.0 program (Rambaut and Drummond, 2014b). The consensus tree was visualized in FigTree 1.4.2 (Rambaut, 2012). To analyze the hypothetical distribution of a common ancestor, an S-DIVA analysis based on Bayesian Binary MCMC (BBM) methods was conducted using RASP 3.2 (Nylander et al., 2008; Yu et al., 2015), which was based on an ultrametric tree generated using BEAST 2.6.0. Seven localities were assumed and coded as follows: A) South Korea; B) Japan; C) China; D) Taiwan; E) Southeast Asia; F) Africa; G) Americas.
Results
Genetic diversity and differentiation analysis
Here, 282 Ligia individuals were collected from ten populations from South Korea (DD, UL, YD, TA, PH, TY, YS, WD, JJ, and SG), three from Japan (SK, IW, and MUD), and three from Vietnam (CB, DN, and PQ) (Figure 1, Supplementary Table 1). Partial mitochondrial 16S rRNA gene with a length of 379 bp, were sequenced allowing the identification of 198 individuals as L. exotica and 84 individuals as L. cinerascens. Twelve populations were identified for L. exotica (six in South Korea, three in Japan, and three in Vietnam) and six for L. cinerascens (five in South Korea and one in Japan). In only two populations, including JJ of South Korea and MUD of Japan, samples of both species were collected. In total, 41 haplotypes were detected including 23 haplotypes of L. exotica and 18 of L. cinerascens (Supplementary Table 4). No haplotypes were shared interspecifically. From a sequence alignment of the 23 16S rRNA haplotypes of L. exotica, 49 polymorphic sites were identified, which consisted of seven singleton variable sites, 42 parsimoniously informative sites, and one gap (Supplementary Table 5). In the case of 18 16S rRNA haplotypes in L. cinerascens, 19 polymorphic sites were detected including six singleton variable sites, 13 parsimoniously informative sites, and one gap (Supplementary Table 6).
In Table 1, genetic diversity was examined based on the 16S rRNA sequences for each L. exotica and L. cinerascens population. Among L. exotica populations, the highest diversity was observed in IW, Japan (h = 0.857), and the lowest in YD and SG (h = 0.000), South Korea. When we compared the genetic diversities of the populations between countries, the highest haplotype diversity was observed in Japan (h = 0.896), and the lowest in South Korea (h = 0.251). Nucleotide diversity was the highest in SK (π = 0.019), Japan, and the lowest in YD and SG (π = 0.000), South Korea. Among the examined countries, the highest nucleotide diversity was observed in Vietnam (h = 0.059), and the lowest was observed in South Korea (h = 0.001). In the L. cinerascens populations, the highest haplotype diversity was observed in PH (h = 0.711), South Korea, and the lowest was observed in JJ, South Korea (h = 0.000; only two individuals). Nucleotide diversity was the highest in TA (π = 0.011), South Korea, and the lowest in JJ (π = 0.000; only two individuals), South Korea.
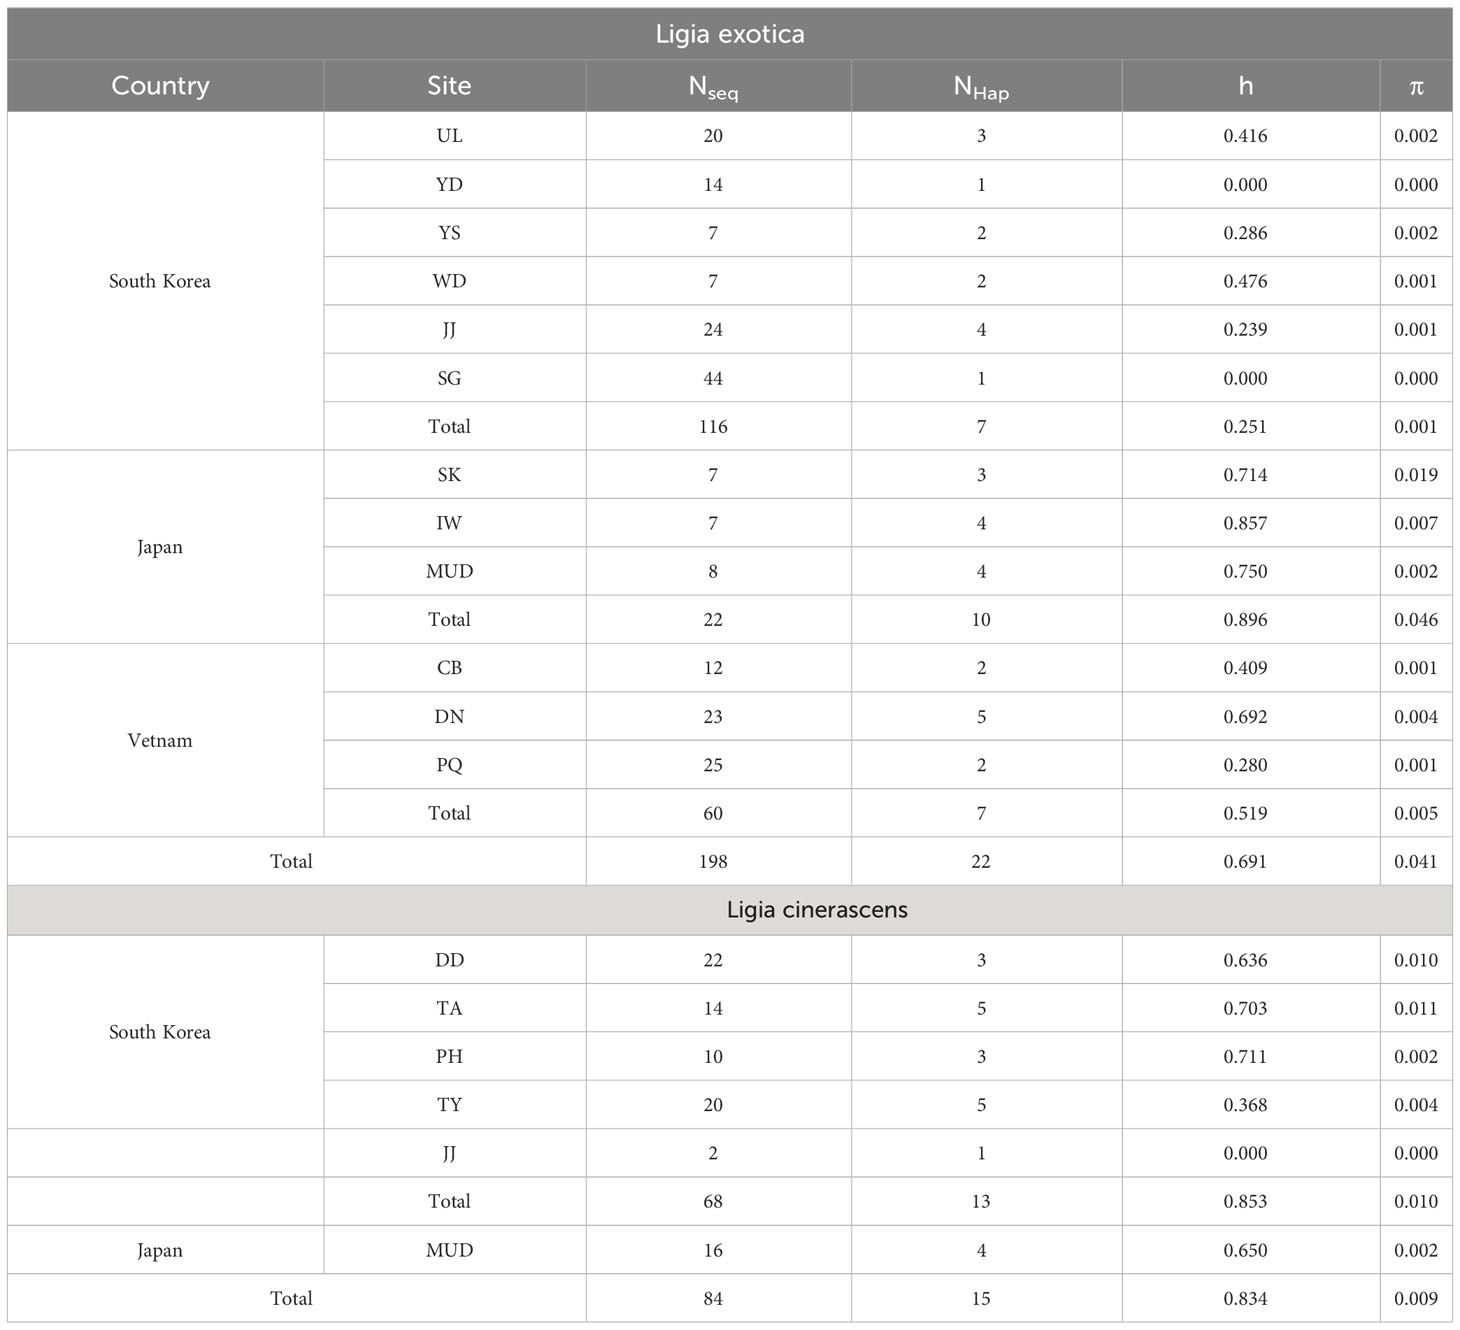
Table 1 Genetic diversity based on partial nucleotide sequences of 16S rRNA for Ligia exotica and Ligia cinerascens from South Korea.
To investigate genetic differentiation among the populations, FST values between the L. exotica and L. cinerascens populations were calculated (Table 2). Most of the FST values between L. exotica the populations were statistically significant excluding the following eight cases: UL vs. YS, YD vs. YS, YD vs. JJ, YD vs. SG, YS vs. JJ, YS vs. SG, YS vs. IW, and WD vs. MUD (Table 2A). The FST values ranged from 0.149 (UL vs. YD) to 0.997 (SG vs. PQ) (Table 2A). Among South Korea, Japan, and Vietnam, all FST values were significant, and they ranged from 0.547 (South Korea vs. Japan) to 0.980 (South Korea vs. Vietnam) (Table 2B). In L. cinerascens, all FST values were also significant, with ranges from 0.095 (MUD vs. TY) to 0.484(PH vs. DD) (Table 2C). The results of the Mantel tests based on the 16S rRNA sequences of the two Ligia species revealed a significant correlation between pairwise genetic and geographical distances (r = 0.548, p < 0.01 for L. exotica; r = 0.393, p < 0.01 for L. cinerascens; Supplementary Figure 1).
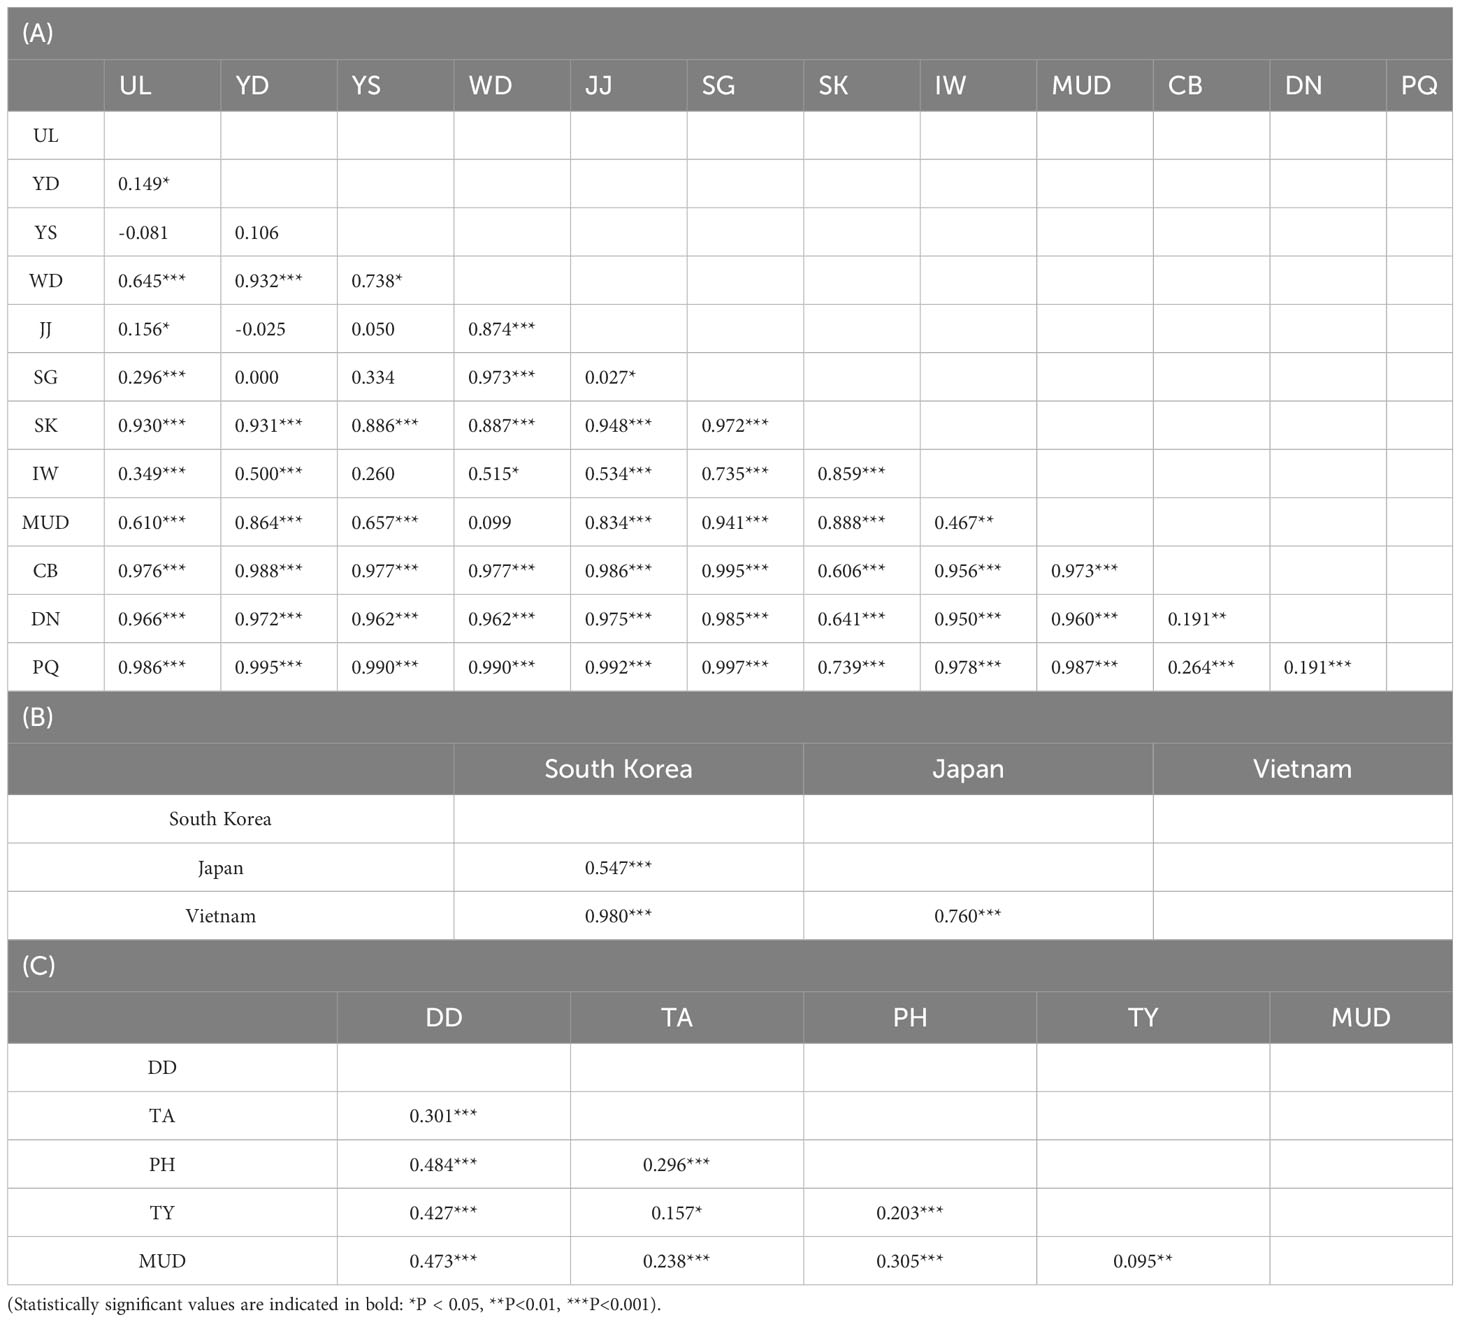
Table 2 Pairwise FST values estimated based on 198 16S rRNA sequences from Ligia exotica among (A) 12 populations and (B) 3 countries, and (C) 84 16S rRNA sequences from Ligia cinerascens among 5 populations.
Species hypotheses of the genus Ligia in East Asia
In addition to the 41 haplotypes of 16S rRNA, 197 16S rRNA sequences of the two Ligia species were retrieved from the NCBI GenBank (Supplementary Table 3). From the retrieved sequences, 92 additional haplotypes were obtained. Based on the resultant 133 haplotypes, ML and BI trees were reconstructed and showed one genetic lineage of L. cinerascens and two genetic lineages of L. exotica with high nodal supports were observed (Figure 2A). The phylogeny based on Nak also showed one L. cinerascens and two L. exotica genetic lineages (Supplementary Figure 2). Moreover, three 16S rRNA haplotypes, LCH80, LCH81, and LCH133 exhibited unexpected placements apart from the three genetic lineages of the two Ligia species. Similar patterns were observed in the different analyses including phylogenetic network, TCS network and PCoA (Figures 2B-D in order) analysis. Especially in the TCS network (Figure 2C), the mutation steps between L. exotica and L. cinerascens were more than 40, indicating their genetically apparent differentiation. The mutation steps between the two genetic lineages within L. exotica were more than 30, and there were star-like topologies with the haplotypes such as LCH01, LCH03, LCH23, LCH05, LCH11, and LCH35 at the center, implying recent rapid expansion of the L. exotica population size. According to phylogenetic and population genetic analyses (Figure 2), six distinct genetic lineages in the two Ligia species were observed, including the three major lineages and independent haplotypes of LCH80, LCH81, and LCH133. Their geographic distribution patterns are as follows (Supplementary Table 7). L. cinerascens were mainly distributed in South Korea, Japan, and northern China along the coast of Bohai Sea and Northern Yellow Sea. In case of L. exotica, the two genetic lineages had different geographical distribution patterns Lineage N (North) for one and Lineage S (South) for the other. Lineage N of L. exotica was distributed in South Korea, Japan, and China (along the coastline of Yellow Sea). Conversely, Lineage S of L. exotica was distributed in Japan, China (along the coastline of East China Sea), Taiwan, and Southeast Asia including Vietnam, Cambodia, and India, Africa including Mozambique, and Republic of South Africa, and America including USA, Mexico, Republic of Trinidad and Tobago, and Brazil. Lineage S was not found in South Korea. In the case of LCH80, LCH81, and LCH133, all haplotypes were collected in Japan. Detailed information on the collection sites are as follows: Kanazawa (LCH80) and Kitadaito (LCH81) by Hurtado et al. (2018), and Okinawa (LCH133) (unpublished data).
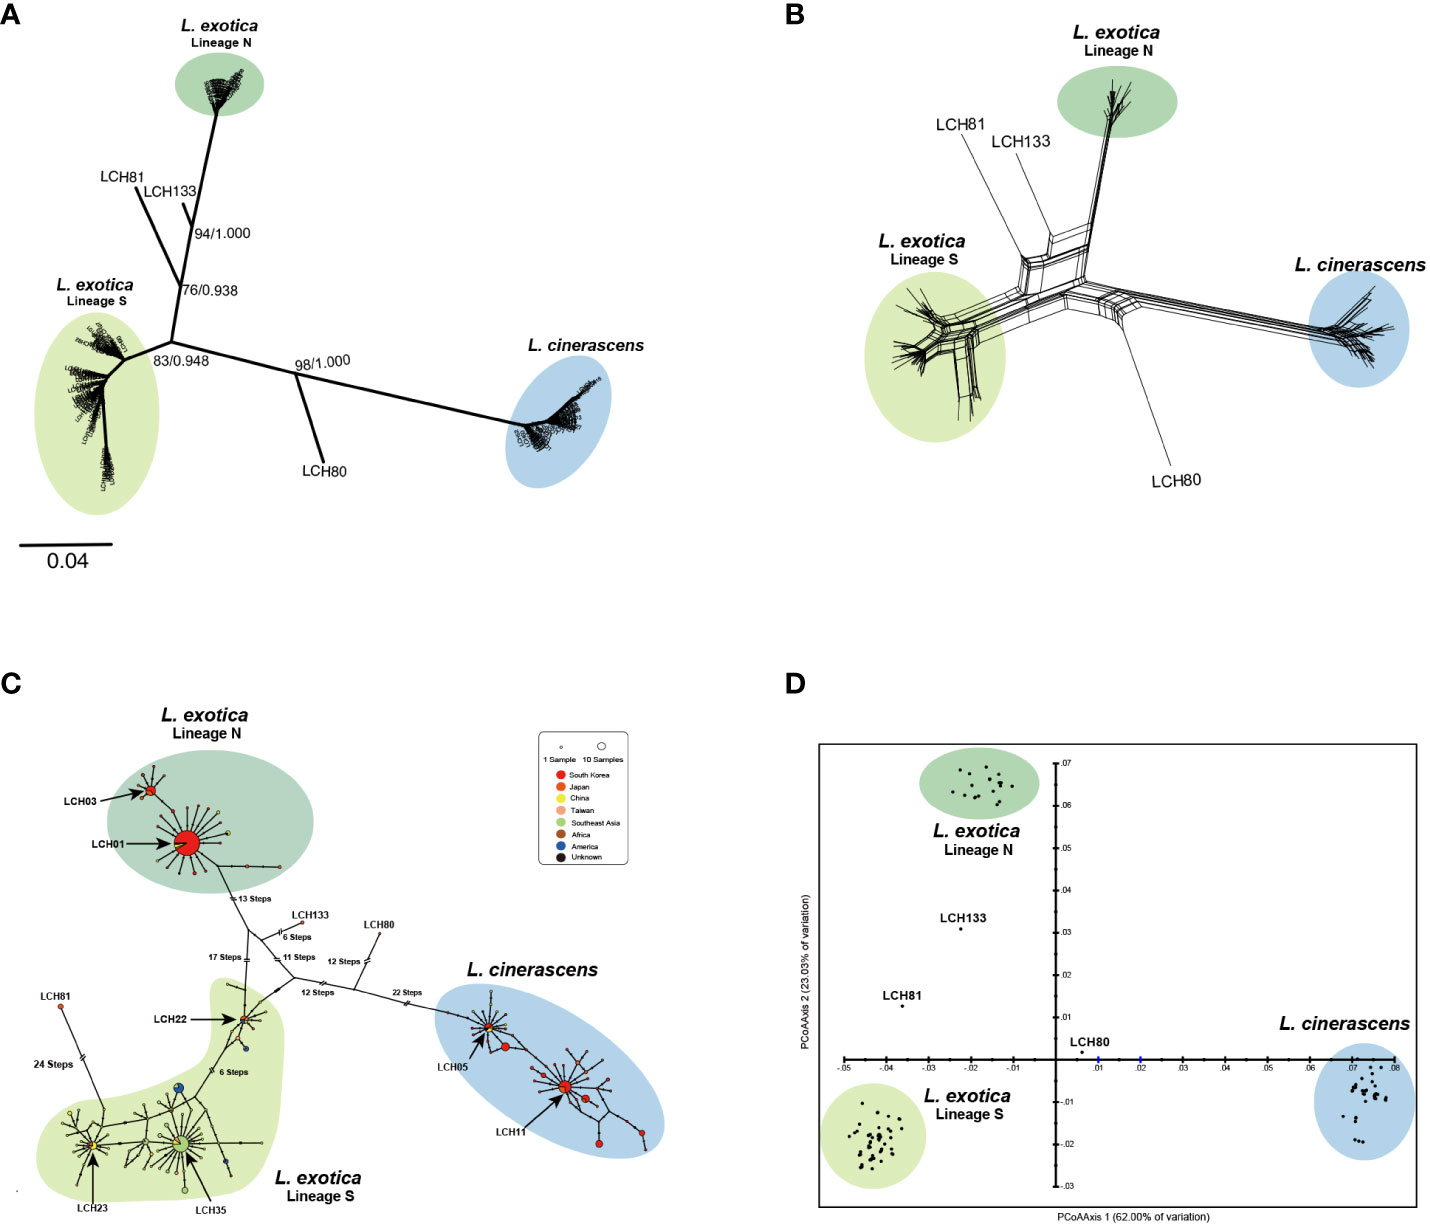
Figure 2 Results of molecular phylogenetic and populational analyses based on 133 16S rRNA haplotypes from 282 Ligia individuals, suggesting the existence of L. cinerascens, Lineages N and S of L. exotica, LCH80, LCH81, and LCH133. (A) An unrooted tree using reconstructed maximum likelihood algorithm. It shows the six different genetic lineages, including L. cinerascens, two lineages of L. exotica, LCH80, LCH81, and LCH133. The numbers of branches indicate node confidence values: bootstrap value in ML, and Bayesian posterior probabilities in BI, in order. (B) A phylogenetic network was reconstructed using the Neighbor Net algorithm without outgroup. (C) A haplotype network was reconstructed using the TCS algorithm. Haplotype frequency is displayed by circle size. (D) A two-dimensional PCoA plot visualize genetic differences. The score on the first two axes (Axis 1 = 62.00%, and Axis 2 = 23.03%) from the matrix of genetic distances.
To investigate whether each of the six genetic lineages in the two Ligia species could be considered independent, four different MSDAs, including ABGD, ASAP, PTP, and bPTP (Figure 3, Supplementary Figure 3) were conducted based on 16S rRNA. The result of all the analyses strongly indicated that possibility two Ligia species could be divided into six independent species namely, L. cinerascens, Lineages N and S of L. exotica, LCH80, LCH81, and LCH133 supporting the results of the phylogenetic and population genetic analyses (Figure 2). Based on the results of the species delimitation analyses, LCH80, LCH81, and LCH133 were renamed as Ligia sp. 1, Ligia sp. 2 and Ligia sp. 3, respectively.
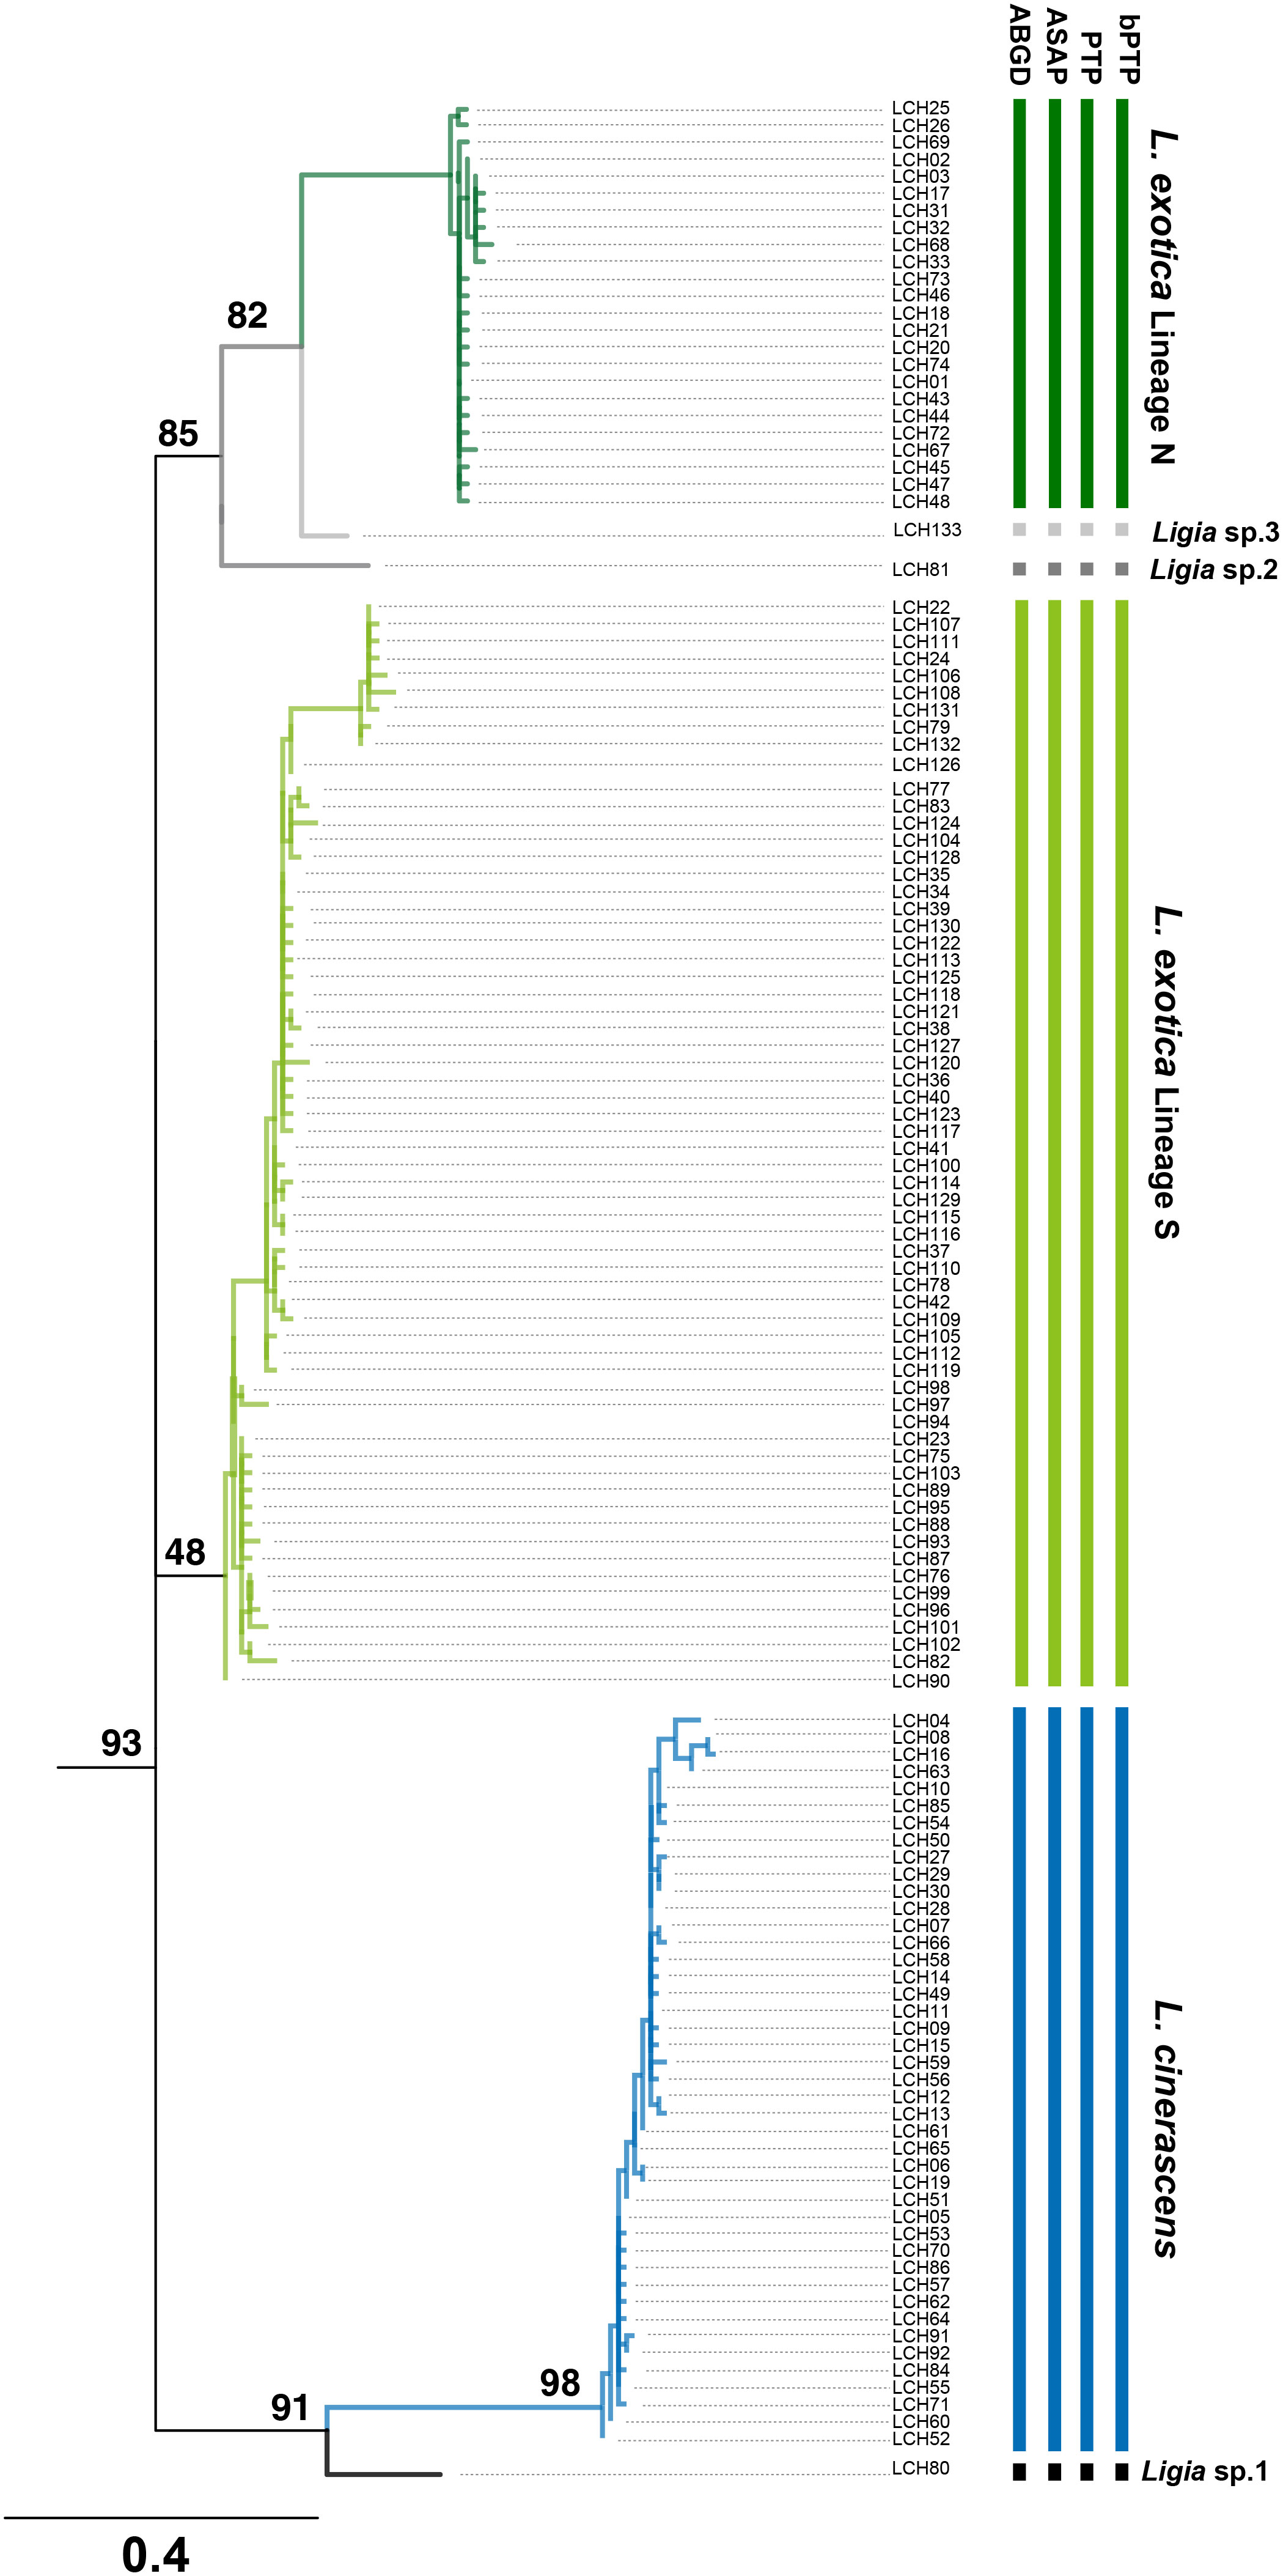
Figure 3 Results of four Molecular Species Delimitation Analyses (MSDAs) based on 16S rRNA haplotypes of Ligia species in East Asia. Results are presented on the rooted-ML phylogeny reconstructed by 133 haplotypes with four outgroups based on 16S rRNA of Ligia species using IQ-tree webserver (http://iqtree.cibiv.univie.ac.at/). Total phylogeny including four outgroups are presented in Supplementary Figure 3. Vertical bars represent assignments to putative species (identified by colors) under four MSDA methods. Bars represent assignments by ABGD, ASAP, PTP, and bPTP in order. Among the methods, ABGD and ASAP are distance-based, and PTP and bPTP are based on the presented phylogenetic tree. All results of four MSDAs revealed six putative species, corresponding to the results of phylogeny, phylogenetic network, TCS Network, and PCoA analyses. Based on the results, LCH80, LCH81, and LCH133 were renamed as Ligia sp. 1, Ligia sp. 2, and Ligia sp.3.
When genetic distances of 16S rRNA within each lineage of L. cinerascens, Lineage N of L. exotica and Lineage S of L. exotica were calculated using the Kimura-two-parameter (K2P) model, average genetic distance was the highest in the Lineage S of L. exotica (Mean: 0.018), and the lowest in the Lineage N of L. exotica (Mean: 0.008) (Table 3). When comparing distance values across the three lineages, average genetic distance was the highest between Ligia sp. 2 and L. cinerascens (Mean: 0.142), and the lowest between Lineage N of L. exotica and Ligia sp. 3 (Mean: 0.062). The maximum genetic distance value within each lineage did not exceed the minimum genetic distance value among the lineages.

Table 3 Mean (range) of genetic distance values among six Ligia lineages and within (bold) each lineage.
Population dynamics on L. cinerascens and Lineages N and S of L. exotica
To investigate the fluctuation history of population size within each lineage, three neutrality tests including Tajima’s D, Fu’s Fs, and R2 test, were conducted for each lineage (Table 4). As a result, all values obtained from the three neutrality tests were statistically significant in each lineage, suggesting that the population size of each lineage had undergone rapid expansion. When mismatch distribution analysis (MMD) was conducted, L. cinerascens and Lineage N of L. exotica exhibited a bi-modal distribution, respectively (Figure 4A), whereas Lineage S of L. exotica exhibited a multimodal distribution. When the raggedness index and sum of square deviation were calculated to examine the mismatch distribution pattern of each lineage, only Lineage N of L. exotica showed as a statistically significant value, implying the rapid expansion of its population size. In BSP analysis for each lineage, increases in effective population size were observed in L. cinerascens and Lineage S of L. exotica and not in Lineage N of L. exotica (Figure 4B). The increases in effective population sizes were estimated to have taken place between ca. 250-50 Ka and 350-150 Ka, respectively.
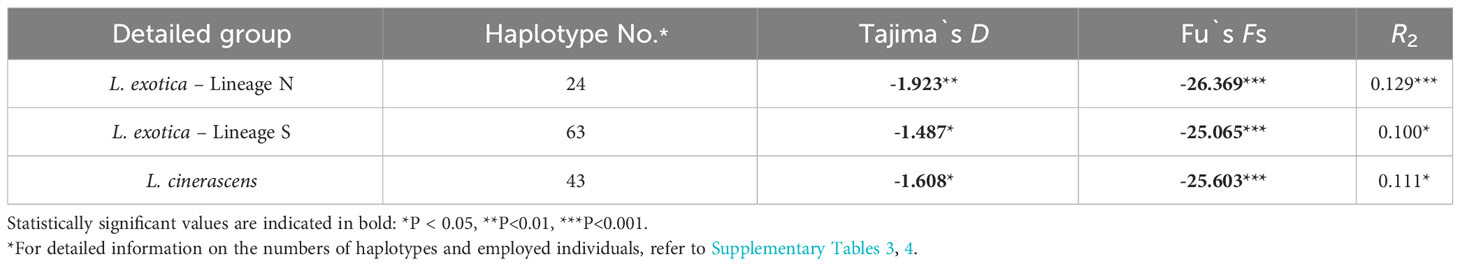
Table 4 The results of the neutrality tests with 16S rRNA for Ligia exotica and Ligia cinerascens.
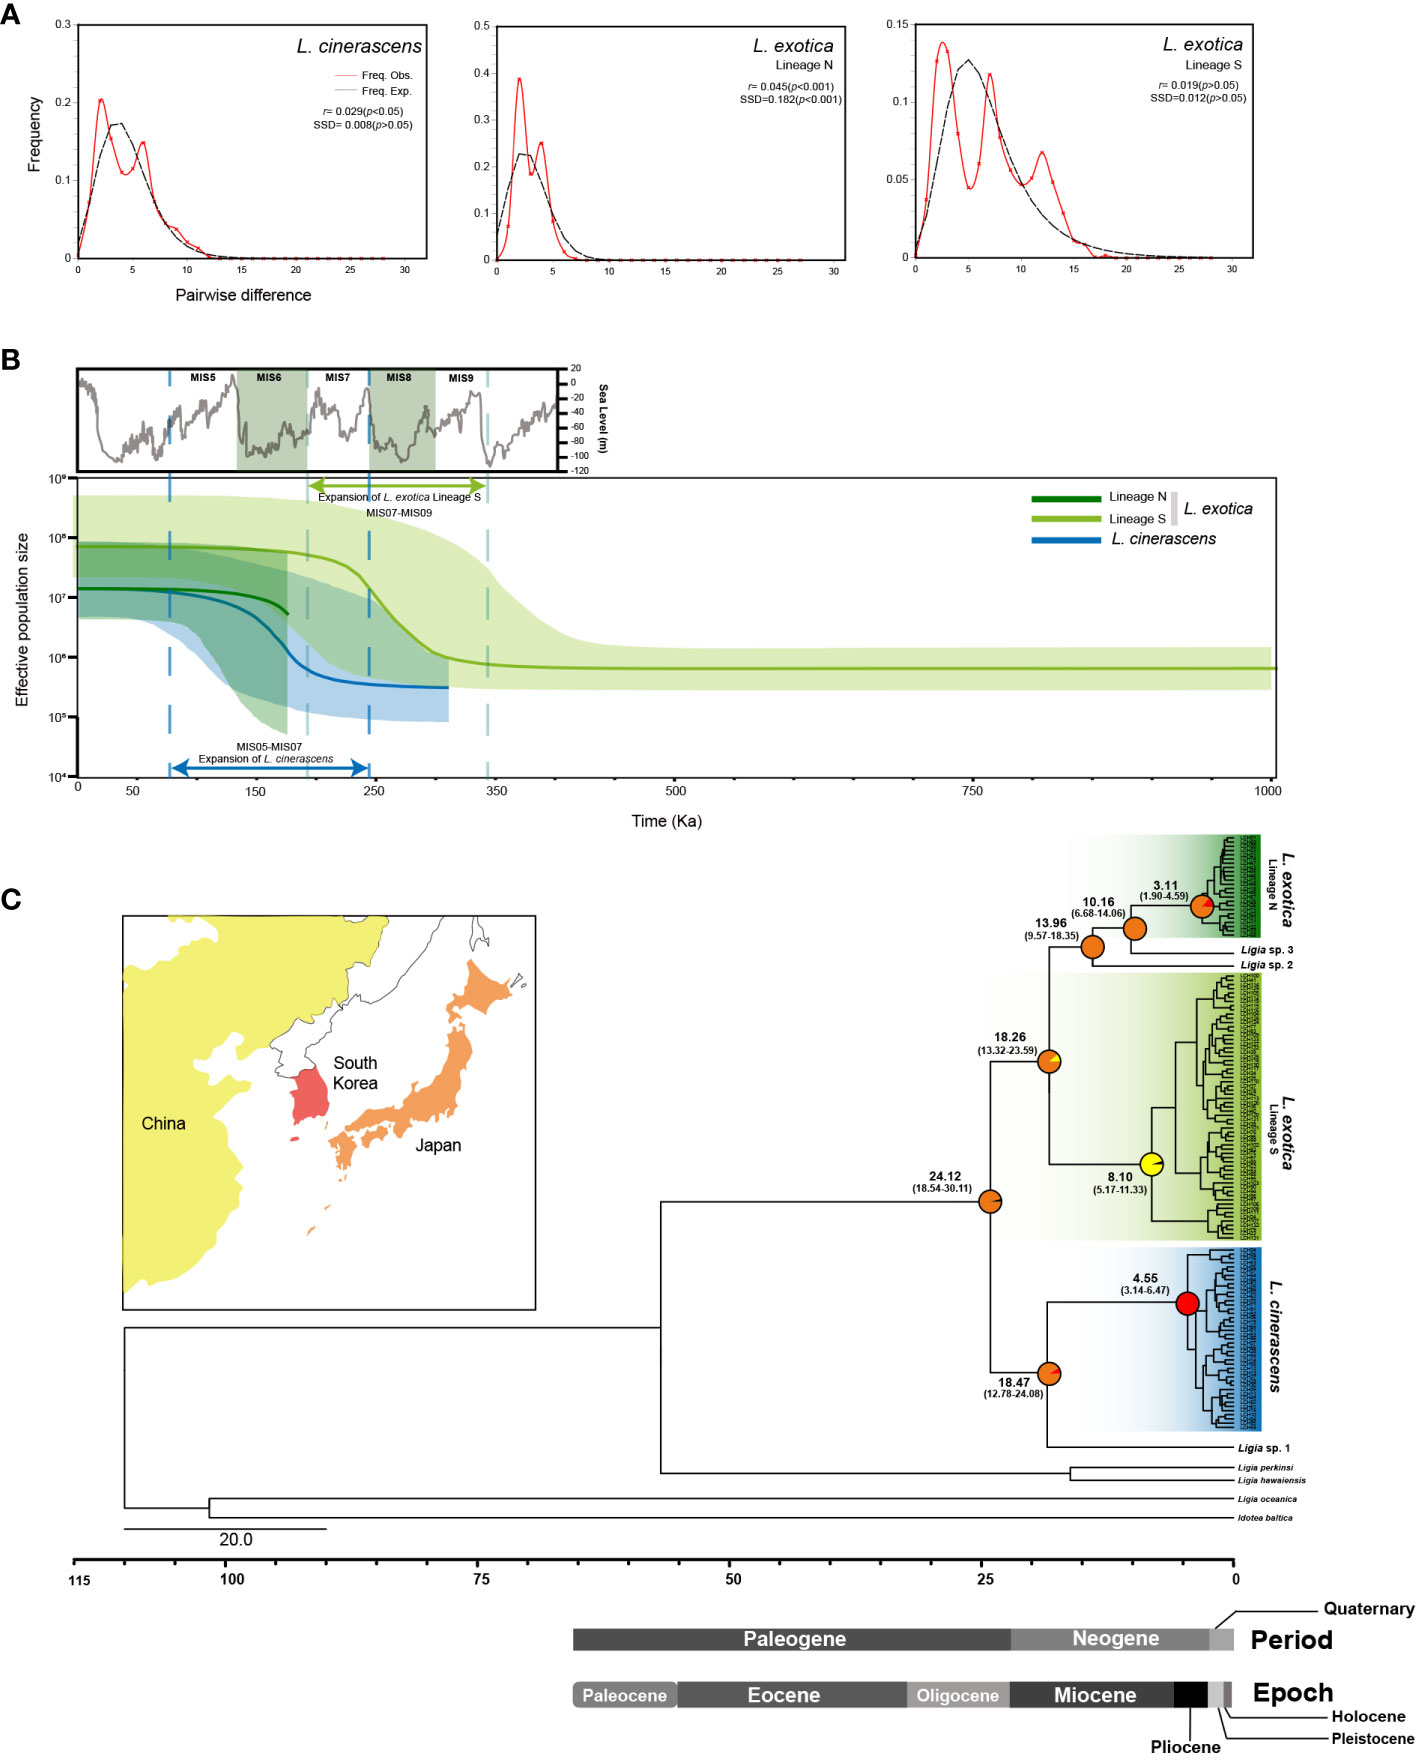
Figure 4 Mismatch Distribution Analyses (MMD), Bayesian Skyline Plots (BSPs), and time-calibrated phylogeny of 16S rRNA haplotypes of Ligia species in East Asia. (A) MMD analysis was performed to infer the patterns of pairwise differences. As a result, a bimodal curve for the Lineage N of L. exotica and L.cinerascens, and a multimodal curve for the Lineage S of L. exotica were indicated. Black and red solid lines indicate the expected distribution and the observed distribution of pairwise differences, respectively, assuming papulation expansion. (B) BSP analyses show the changes in effective population size for three lineages. The results showed population expansion in L. cinerascens and Lineage S of L. exotica. The graph on the top left of the figure in gray depicts concentrations of oxygen isotope from 350 Ka to 0 Ka, referred to Waelbroeck et al., 2002. (C) Time-calibrated phylogeny based on 133 16S rRNA haplotypes of five Ligia species based on the strict clock model using the BEAST 2.6.0. program with the inference of ancestral areas under the Bayesian binary Markov chain Monte-Carlo (BBM) model using RASP 3.2 program. Each lineage was diverged from Oligocene to Miocene, and plausible areas that the common ancestor of Ligia species in East Asia inhabited were estimated to be in Japan. Ancestral areas were postulated based on the distribution ranges of six lineages of Ligia shown in the phylogenetic tree. The pie chart on the nodes indicates the probabilities of the ancestral distribution.
Divergence times for six putative species
To examine divergence times among the six putative species observed from L. cinerascens and L. exotica, a molecular clock analysis was conducted using the BEAST 2.6.0 program. As shown in Figure 4C and Supplementary Figure 4, the results suggested that a monoclade of L. cinerascens and Ligia sp.1 was first diverged from the remaining four species in the Oligocene (24. 12 Ma [95% HPD: 18.54 - 30.11 Ma]). Thereafter, Ligia sp.1 diverged from L. cinerascens in the early Miocene (18. 47 Ma [95% HPD: 12.78 - 24.08 Ma]). Not long after that event, Lineage S of L. exotica was diverged in about 18.26 Ma (95% HPD: 13.32-23.59 Ma). In the mid-late Miocene (13-10 Ma), Ligia sp. 2 (13.96 Ma [95% HPD: 9.57-18.35 Ma]) and Ligia sp. 3 (10.16 Ma [95% HPD: 6.68-14.06 Ma]) diverged from Lineage N of L. exotica. Among the three lineages of L. cinerascens, and Lineages N and S of L. exotica, the diversification of haplotypes could have first occurred in the Lineage S of L. exotica, in the late Miocene (8.10 Ma [95% HPD: 5.17-11.33 Ma]). The haplotype diversity of the other lineages emerged in the Pliocene, about 4.55 Ma (95% HPD: 3.14-6.33 Ma) in L. cinerascens and 3.11 Ma (95% HPD: 1.90-4.59 Ma) in Lineage N of L. exotica. The results of S-DIVA analysis under a Bayesian binary Markov chain Monte-Carlo (BBM) model indicated that a common ancestor of the six Ligia species originated from Japan.
Discussion
Genetic diversity and differentiation of populations of two Ligia species in East Asia
The present study investigated the phylogenetic relationships, phylogeographical patterns, and speciation events of two Ligia species, L. exotica, and L. cinerascens, based on 16S rRNA at the population level. The results of the FST value and Mantel test showed the genetic differentiation by geographical distance among the populations of the two Ligia species, which suggests the existence of genetic structure among the Ligia populations (Table 2, Supplementary Figure 1). This possibility was directly shown in the unrooted phylogeny, TCS network, and PCoA (Figure 2). Through the analyses, we found six different and independent lineages as follows: L. cinerascens, Lineages N and S of L. exotica, Ligia sp.1, Ligia sp.2, and Ligia sp.3. The six genetic lineages were also supported through the four MSDAs, suggesting each of the six as an independent species.
Among the 12 populations of L. exotica investigated in the present study, eight populations (UL, YD, YS, WD, JJ, and SG) in South Korea, and two populations (MUD and IW) in Japan belonged to a Lineage N of L. exotica. The remaining four populations, including one population (SG) in Japan and three populations (CB, DN, and PQ) in Vietnam, were included in a Lineage S of L. exotica. In Japan, there existed both lineages N and S of L. exotica. However, only Lineage N was found in South Korea and only Lineage S was found in Vietnam. These patterns of genetic lineages may help to explain the higher haplotype and nucleotide diversities of the total population of L. exotica in Japan (h = 0.896, π = 0.046), compared to those in South Korea (h = 0.251, π = 0.001) and Vietnam (h = 0.519, π = 0.005).
Moreover, we conducted phylogenetic analyses using Nak, which is one of the nuclear markers that has been studied for Ligia species. The results of Nak-based phylogenetic analyses also showed three distinct genetic lineages: L. cinerascens, Lineage N of L. exotica, and Lineage S of L. exotica. This means that the existence of three genetic lineages was also strongly supported based on analyses of both a nuclear and mitochondrial marker. However, the genetic marker Nak may have limitations in the study of species delimitation; only three polymorphic sites in Nak were detected between L. exotica and L. cinerascens, and only one was identified between the L. exotica two lineages (Supplementary Table 8). Other nuclear genetic markers, such as internal transcribed regions (ITS), should be evaluated in future studies to better understand species delimitation.
Phylogeographical patterns of two Ligia species in East Asia
Yin et al. (2013) discussed the detailed distribution ranges of L. exotica and L. cinerascens based on previous studies in the geographic range of East Asia. The present study reconstructed phylogeographic patterns of L. exotica and L. cinerascens with updated information after Yin et al. (2013) (Figure 5). In Figure 5, we speculate the northern and southern limits of their distribution ranges. The southern limit of distribution for L. cinerascens was observed to be about 33-35°N. In the case of L. exotica, there were apparent challenges in defining the northern limit in South Korea, because there was no or little information in North Korea. Nevertheless, we can propose a plausible northern limit (39−41°N latitude) of the two genetic lineages of L. exotica based on the geographic records of Lineage N of L. exotica. In sum, we found two different patterns of distribution for the two Ligia species in East Asia. First, L. cinerascens and L. exotica showed overlapping distribution in 33−41°N latitude range. Most of the range of overlapping distribution was in Japan (33−41° N) when compared with that in China (35−39° N). Such a pattern has been reported by Yin et al. (2013), and they discussed that the pattern might be due to sea surface temperatures caused by the Kuroshio current and deeper inshore seawaters around Japan (Yin et al., 2013; Hurtado et al., 2018). Regarding the causes of the overlapping distribution of the two Ligia species, human-mediated activities such as shipping and damming have been mainly cited (Yin et al., 2013). Other factors influencing overlapping distribution might be genetic exchanges by rapid population size expansion, oceanic rafting mediated by large algae, or secondary contact in the past (Jung et al., 2008; Yin et al., 2013).
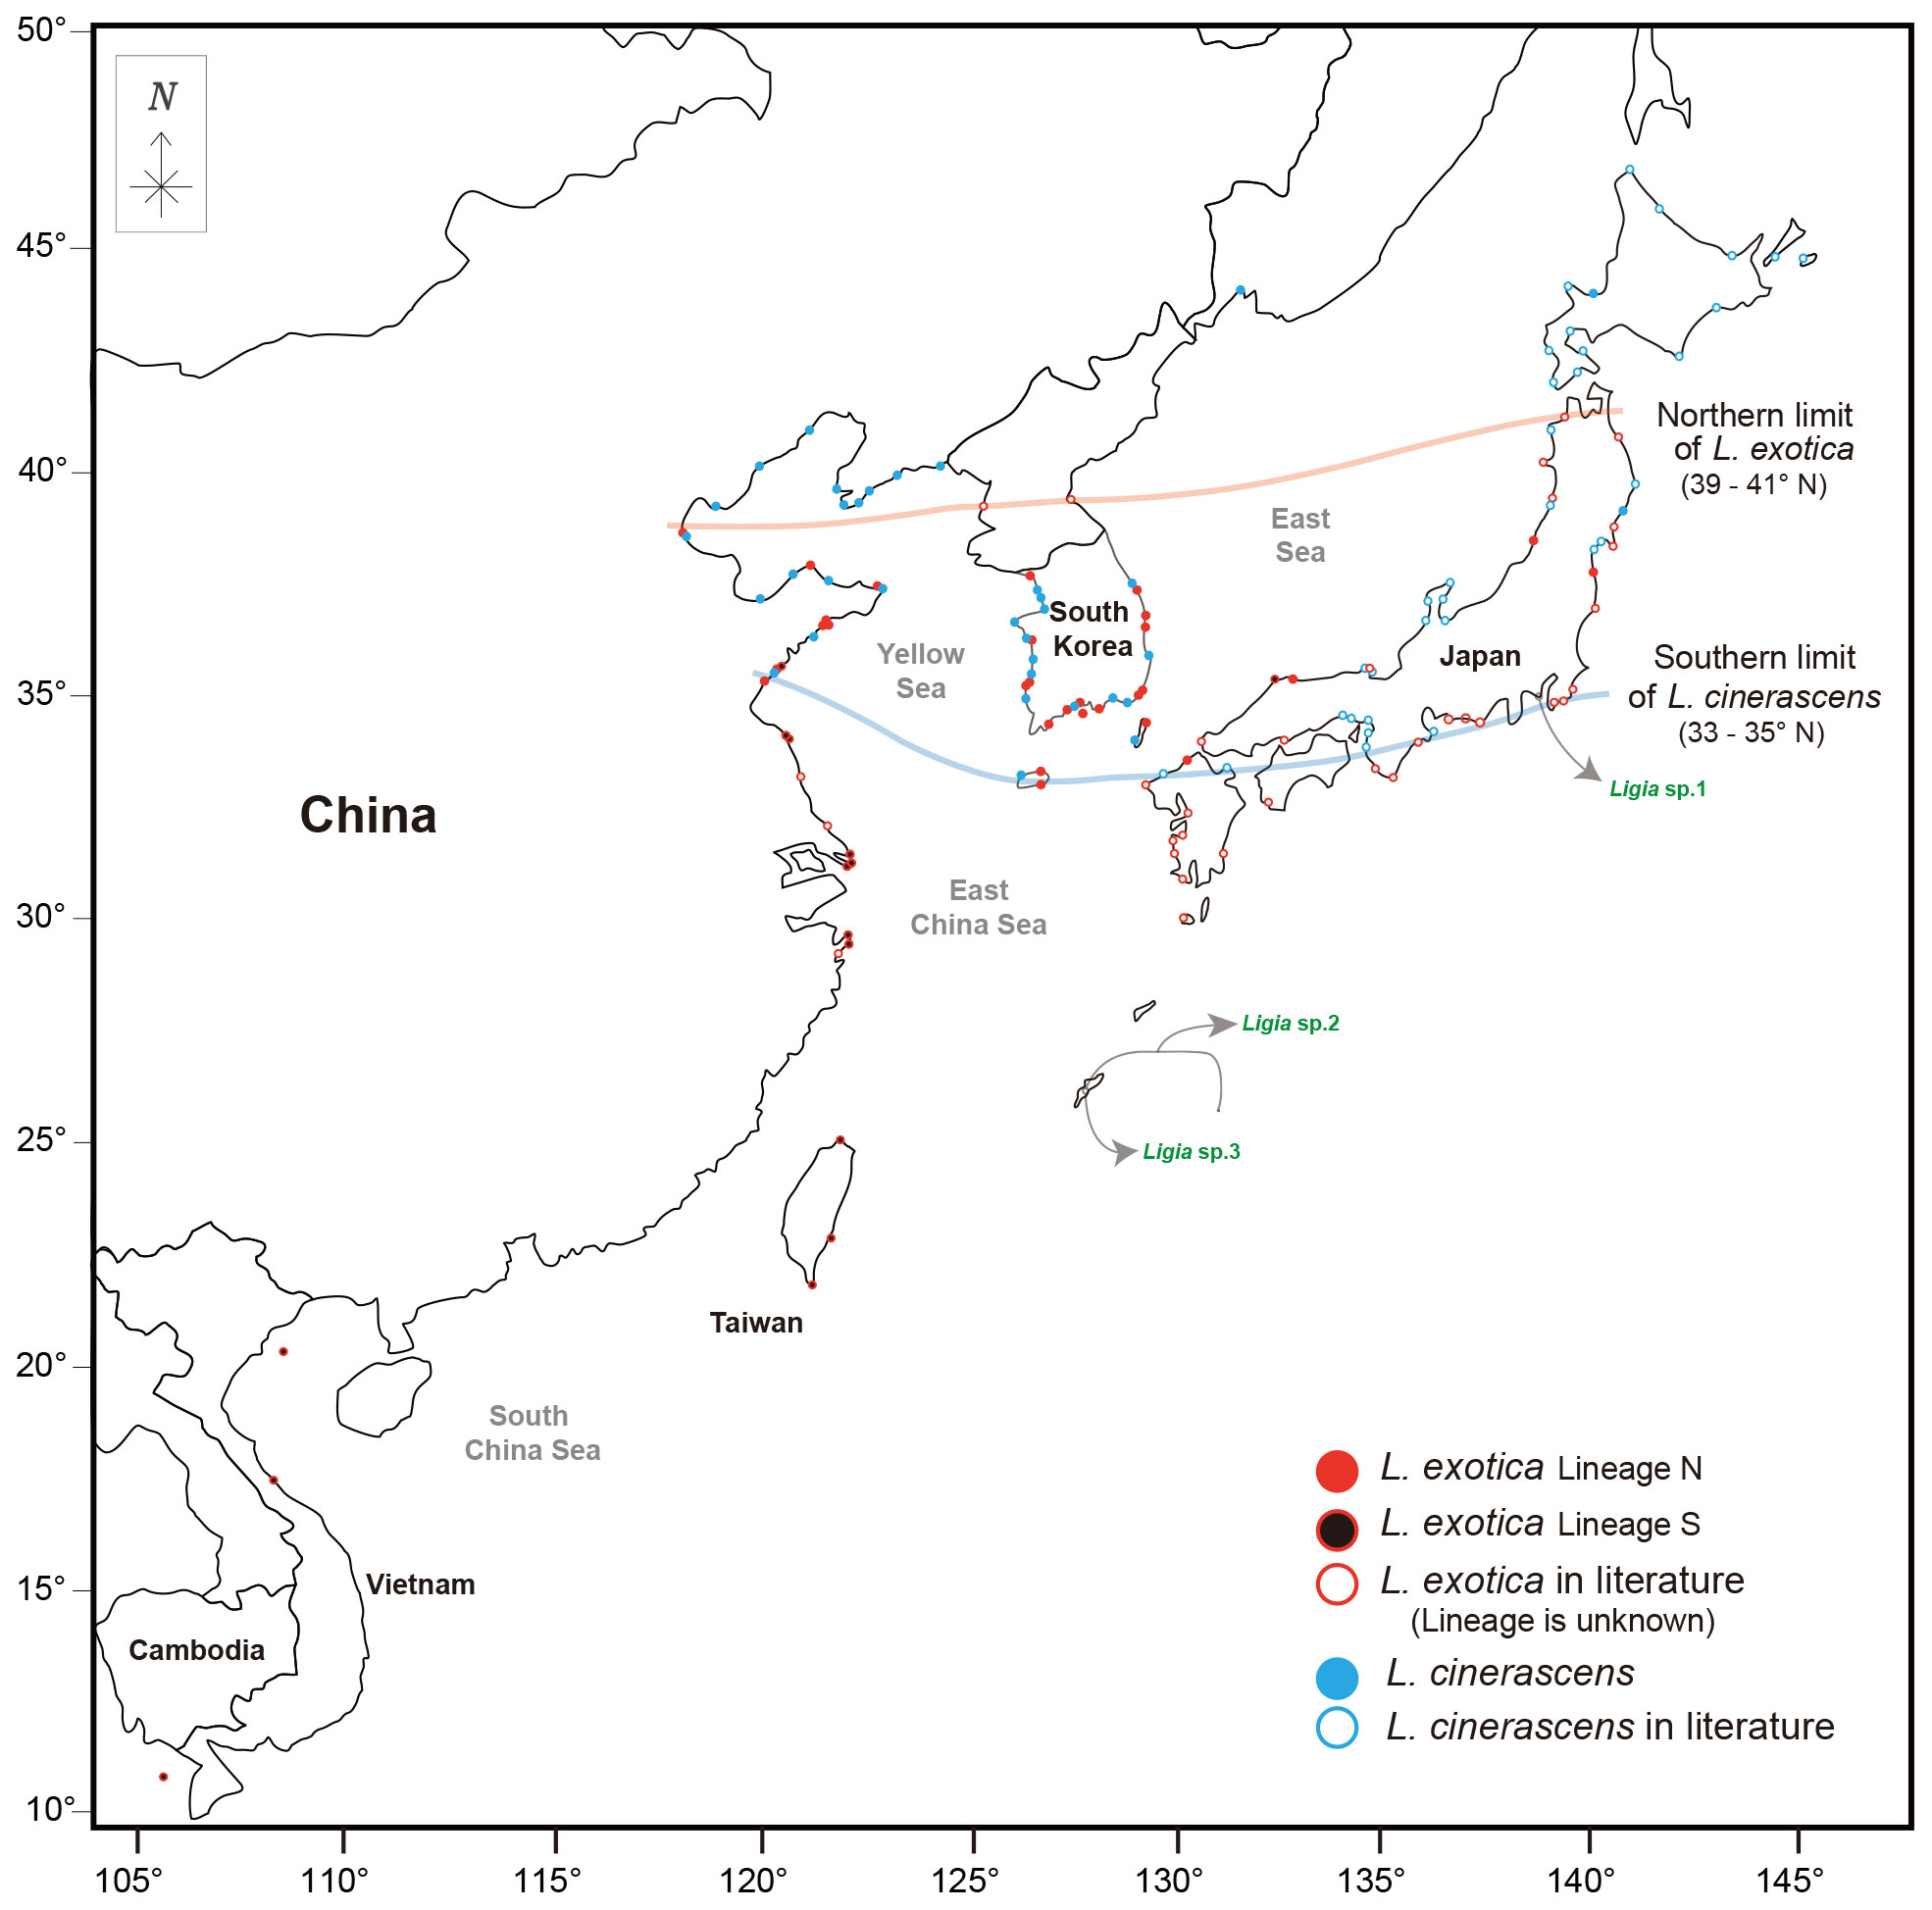
Figure 5 Geographical distribution of Ligia cinerascens and two lineages of Ligia exotica in East Asia. Geographical distribution of L. cinerascens and L. exotica in the East Asia region including South Korea, Japan, China, Taiwan, Vietnam. The circles filled colors (red, black, blue) represent samples used in phylogenetic analyses, including the present study and a previous studies (Jung et al., 2008; Yin et al., 2013; Hurtado et al., 2018; Kang and Jung, 2020). The circles not filled with colors indicate the historically recorded localities (Nunomura, 1983; Yin et al., 2013). Moreover, Ligia sp.1, sp.2, and sp.3 were marked separately with green font color and circle not filled with colors. The maps are from a free map providing site (https://d-maps.com), which is modified with Adobe Illustrator v22.2. Solid lines show the limits of the distribution ranges, which are northern or southern, based on the dataset for each species.
Second, two genetic lineages of L. exotica exhibited general allopatric distribution, which appears to be more evident in China along the coastline than in Japan. Similarly, such allopatric distribution patterns have been reported in many diverse marine taxa such as Collichthys lucidus (Richardson, 1844), Cyclina sinensis (Gmelin, 1791), Eriocheir De Haan, 1835, Monodonta labio (Linnaeus, 1758), Oratosquilla oratoria (De Haan, 1844), and Tubaca arcuate (De Haan, 1835) (Xu et al., 2009; Ni et al., 2012; Cheng and Sha, 2017; Zhao et al., 2017; Zhao et al., 2021; Hwang et al., 2022; Shih et al., 2022). Such studies suggested that the allopatric distribution observed in the coastline of China is caused by sea level fluctuations in the Pleistocene (Xu et al., 2009; Ni et al., 2014). Allopatric distribution of the two genetic lineages of L. exotica presented here could have been affected by sea-level change, causing the geographical isolation between the two genetic lineages.
Population dynamics and species divergence of Ligia species associated with the geological event in East Asia
In addition, an analysis of population dynamics was conducted to check population size stability using neutrality test, MMD, and BSP in L. cinerascens, as well as Lineages N and S of L. exotica. In each of the three genetic lineages, population size expansion had occurred in the course of their evolutionary history. Population expansion may also be recognized through the TCS network results, which show complex star-like topologies within each genetic lineage. In BSP, we could confirm the period of expansion of effective population size, except in Lineage N of L. exotica. When Marine Isotope Stage (MIS) based on oxygen isotope values reflecting the temperature change and sea level fluctuation was considered, the expansion events of effective population sizes of L. cinerascens and Lineage S of L. exotica were estimated to be MIS6 (ca. 191-130 Ka) and MIS8 (ca. 300-243 Ka), respectively. MIS6 and MIS8 were glacial periods where sea level decreased and land bridges were formed in the Yellow Sea and East China Sea (Waelbroeck et al., 2002; Shackleton et al., 2003; Jiménez-Sánchez et al., 2013). The land bridge formed during the glacial period in the Pleistocene period could have facilitated L. exotica and L. cinerascens colonization events through the extension of the coastline (Jung et al., 2008).
Based on the results of the investigations on population expansion for each genetic lineage of the two Ligia species, time divergence phylogeny was reconstructed, and S-DIVA analysis was conducted. According to the results, a common ancestor of the three originated from Japan. Moreover, the estimated species divergence time was confirmed to be consistent with the sequence of geological events in the Japanese islands. The present study strongly supports the viewpoint of Hurtado et al. (2018) in which geological events in the Japanese archipelago might be some of the factors causing genetic lineage divergence in L. exotica. Divergence times of Ligia sp. 1, L. cinerascens, and Lineage S of L. exotica were estimated from late Oligocene to early Miocene (about 30-15 Ma). During the period, proto-Japanese Islands located along the eastern margins of the Eurasian continent began to separate from that continent (Tojo et al., 2017). Through the event, the East Sea was formed, and the northeast and southwest portions of the Japan Arc were separated independently (Otofuji et al., 1991; Otofuji et al., 1994; Tojo et al., 2017). The event could have caused the isolation of the habitats of Ligia species and seemed to induce the speciation of Ligia sp.1, L. cinerascens, and Lineage S of L. exotica from all the Ligia lineages. After the split of the Japanese main island from the Eurasian continent, more submergence and upheaval occurred between continental plate and oceanic plate around to early Pliocene (about 5 Ma; Ota, 1998; Tojo et al., 2017). During the period, the other three lineages (Ligia sp. 2, sp. 3, and Lineage N of L. exotica) might have diverged, and the diversification of haplotypes in Lineage S of L. exotica might have already progressed. Afterward, the archipelago in the current shape of the main island of Japan was formed, which might have led to dramatic haplotype diversifications of other genetic lineages, such as L. cinerascens, and Lineage N of L. exotica, and yielded their current genetic lineages.
Numerous endemic species in the genus Ligia have been reported in Japan, such as L. boninensis Nunomura, 1979, L. daitoensis Nunomura, 2009, L. hachijoensis Nunomura, 1999, L. miyakensis Nunomura, 1999, L. ryukyuensis Nunomura, 1983, L. shinjiensis Tsuge, 2008, and L. yamanishii Nunomura, 1990 (Nunomura, 1979; Nunomura, 1983; Nunomura, 1990; Nunomura, 1999; Tsuge, 2008; Nunomura, 2009). The range of distribution of these species was limited only to islands and brackish lakes in Japan: Ryukyu Island (L. ryukyuensis), Izu Island (L. hachijoensis, L. miyakensis), Bonin Island (L. boninensis, L. yamanishii), Daito Island (L. daitoensis), and Shinji Lake (L. shinjiensis). These species have different morphological characteristics, such as flagellar segments of the second antenna, protuberance on the first pereopod in males and the apical part of the stylus (Nunomura, 1979; Nunomura, 1983; Nunomura, 1990; Nunomura, 1999; Tsuge, 2008; Nunomura, 2009). However, there is no genetic information yet on them. If genetic information on the species and investigations on morphological characteristics that can distinguish the two lineages in L. exotica is added through further studies, it may facilitate the understanding of species delimitation and discovery of cryptic species of Ligia in East Asia (Choi et al., 2020; Choi et al., 2021; Shin et al., 2021; Kim and Hwang, 2023).
Data availability statement
The sequence data have been deposited to the NCBI GenBank database (https://www.ncbi.nlm.nih.gov/genbank/) under the accession numbers OQ916835-OQ916875 for 16S rRNA and OR641242-OR641252 for Nak. The preprocessed dataset can be found in the Supplementary Data as follows: Supplementary Data 1, Nucleotide sequence alignment of 41 16S rRNA haplotypes of Ligia species in the present study.
Ethics statement
Ethical review and approval were not required for the study on animals in accordance with the local legislation and institutional requirements. The species in the present study does not require ethics approval based on standard guideline of IACUC (International Animal Care and Use Committee).
Author contributions
GK: Writing – original draft, Data curation, Formal analysis, Methodology, Resources, Software. HK: Resources, Writing – original draft. SM: Writing – original draft, Methodology. EC: Writing – original draft, Resources. AN: Resources, Writing – original draft. UH: Writing – original draft, Conceptualization, Funding acquisition, Project administration.
Funding
The author(s) declare financial support was received for the research, authorship, and/or publication of this article. This research was supported by Kyungpook National University Research Fund, 2021, National Institute of Biological Resources (NIBR), funded by the Ministry of Environment (MOE) of the Republic of Korea (NIBR202333201) and the National Research Foundation of Korea (NRF) funded by the Ministry of Science and ICT (2021R1C1C2012882).
Acknowledgments
We thank CA Santamaria for their valuable and constructive comments to complete our manuscript.
Conflict of interest
Author UH is a chair of the company Phylomics, and Author EC was employed by the company Phylomics.
The remaining authors declare that research was conducted in the absence of any commercial or financial relationships that could be constructed as a potential conflict of interest.
Publisher’s note
All claims expressed in this article are solely those of the authors and do not necessarily represent those of their affiliated organizations, or those of the publisher, the editors and the reviewers. Any product that may be evaluated in this article, or claim that may be made by its manufacturer, is not guaranteed or endorsed by the publisher.
Supplementary material
The Supplementary Material for this article can be found online at: https://www.frontiersin.org/articles/10.3389/fmars.2023.1260171/full#supplementary-material
References
Bouckaert R., Heled J., Kühnert D., Vaughan T., Wu C. H., Xie D., et al. (2014). BEAST2: a software platform for Bayesian evolutionary analysis. PloS Comput. Biol. 10, e1003537. doi: 10.1371/journal.pcbi.1003537
Broly P., Deville P., Maillet S. (2013). The origin of terrestrial isopods (Crustacea: Isopoda: Oniscidea). Evol. Ecol. 27, 461–476. doi: 10.1007/s10682-012-9625-8
Carefoot T. H., Taylor B. E. (1995). “Ligia: a prototypal terrestrial isopod,” in Terrestrial isopod biology. Ed. Alikhan M. A. (Rotterdam: August Aimé Balkema), 47–60.
Cheng J., Sha Z. L. (2017). Cryptic diversity in the Japanese mantis shrimp Oratosquilla oratoria (Crustacea: Squillidae): Allopatric diversification, secondary contact and hybridization. Sci. Rep. 7, 1972. doi: 10.1038/s41598-017-02059-7
Choi E. H., Kim G., Cha S. H., Lee J. S., Ryu S. H., Suk H. Y., et al. (2020). Molecular phylogenetic, population genetic and demographic studies of Nodularia douglasiae and Nodularia breviconcha based on CO1 and 16S rRNA. Sci. Rep. 10, 16572. doi: 10.1038/s41598-020-72015-5
Choi E. H., Yeo M. Y., Kim G., Park B., Shin C. R., Baek S. Y., et al. (2021). Liolophura species discrimination with geographical distribution patterns and their divergence and expansion history on the northwestern Pacific coast. Sci. Rep. 11, 17602. doi: 10.1038/s41598-021-96823-5
Clement M., Posada D., Crandall K. A. (2000). TCS: a computer program to estimate gene genealogies. Mol. Ecol. 9, 1657–1659. doi: 10.1046/j.1365-294x.2000.01020.x
Darriba D., Taboada G. L., Doallo R., Posada D. (2012). jModelTest 2: more models, new heuristics and parallel computing. Nat. Methods 9, 772. doi: 10.1038/nmeth.2109
De Haan W. (1835). “Crustacea”, in Fauna Japonica, sive Descriptio animalium, quae in itinere per Japoniam, jussu et auspiciis superiorum, qui summum in India Batava imperium tenent, suscepto, annis 1823-1830 collegit, notis, observationibus et adumbrationibus illustravit. Ed. von Siebold P. F.Lugduni-Batavorum Decas II, 25–64.
De Haan W. (1844). “Crustacea”, in Fauna Japonica, sive Descriptio animalium, quae in itinere per Japoniam, jussu et auspiciis superiorum, qui summum in India Batava imperium tenent, suscepto, annis 1823-1830 collegit, notis, observationibus et adumbrationibus illustravit. Ed. von Siebold P. F.Lugduni-Batavorum Decas VII, 224.
Drummond A. J., Rambaut A. (2007). BEAST: Bayesian evolutionary analysis by sampling trees. BMC Evol. Biol. 7, 1–8. doi: 10.1186/1471-2148-7-214
Excoffier L., Lischer H. E. (2010). Arlequin suite ver 3.5: a new series of programs to perform population genetics analyses under Linux and Windows. Mol. Ecol. Resour. 10, 564–567. doi: 10.1111/j.1755-0998.2010.02847.x
Farr J. A. (1978). Orientation and social behavior in the supralittoral isopod Ligia exotica (Crustacea: Oniscidea). B. Mar. Sci. 28, 659–666.
Fu Y. X. (1997). Statistical tests of neutrality of mutations against population growth, hitchhiking and background selection. Genetics 147, 915–925. doi: 10.1093/genetics/147.2.915
Gmelin J. F.. (1971). “Vermes”, in Caroli a Linnaei Systema Naturae per Regna Tria Naturae. Ed. Gmelin J. F. Tome: Lipsaiae (Leipzig): G. E. Beer, 1 (6), 3021–3910.
Greenan T. M., Griffiths C. L., Santamaria C. A. (2018). Molecular approaches uncover cryptic diversity in intertidal Ligia isopods (Crustacea, Isopoda, Ligiidae) across the southern Africa coastline. PeerJ 6, e4658. doi: 10.7717/peerj.4658
Hall T. A. (1999). BioEdit: a user-friendly biological sequence alignment editor and analysis program for Windows 95/98/NT. Nucleic Acids Symp.Ser. 41, 95–98.
Harpending R. C. (1994). Signature of ancient population growth in a low-resolution mitochondrial DNA mismatch distribution. Hum. Biol. 66, 591–600.
Heled J., Drummond A. J. (2008). Bayesian inference of population size history from multiple loci. BMC Evol. Biol. 8, 1–15. doi: 10.1186/1471-2148-8-289
Hurtado L. A., Mateos M., Santamaria C. A. (2010). Phylogeography of supralittoral rocky intertidal Ligia isopods in the Pacific region from Central California to Central Mexico. PloS One 5, e11633. doi: 10.1371/journal.pone.0011633
Hurtado L. A., Mateos M., Wang C., Santamaria C. A., Jung J., Khalaji-Pirbalouty V., et al. (2018). Out of Asia: mitochondrial evolutionary history of the globally introduced supralittoral isopod Ligia exotica. PeerJ 6, e4337. doi: 10.7717/peerj.4337
Huson D. H., Bryant D. (2006). Application of phylogenetic networks in evolutionary studies. Mol. Biol. Evol. 23, 254–267. doi: 10.1093/molbev/msj030
Hwang H. S., Jung J., Cheng J., Sha Z. L., Jung J. (2022). Cryptic diversity and population genetic structure of the mantis shrimp Oratosquilla oratoria in South Korea. Genes Genom. 44, 1343–1352. doi: 10.1007/s13258-022-01303-3
Jiménez-Sánchez M., Rodríguez-Rodríguez L., García-Ruiz J. M., Domínguez-Cuesta M. J., Farias P., Valero-Garcés B., et al. (2013). A review of glacial geomorphology and chronology in northern Spain: timing and regional variability during the last glacial cycle. Geomorphology 196, 50–64. doi: 10.1016/j.geomorph.2012.06.009
Jung J., Eo H.-S., Rho H. S., Kim W. (2008). Two genetic lineages of sea slaters, Ligia (Crustacea: Isopoda) in South Korea: a population genetic approach. Mol. Cells 25, 523–530.
Kang S., Jung J. (2020). Discrepancies between mitochondrial DNA and AFLP genetic variation among lineages of sea slaters ligia in the East Asian region. Anim. syst. Evol. Divers. 36, 347–353. doi: 10.5635/ASED.2020.36.4.061
Kim G., Hwang U. W. (2023). The population genetic structure and phylogeographic dispersal of Nodularia breviconcha in the Korean Peninsula based on COI and 16S rRNA genes. PloS One 18, e0288518. doi: 10.1371/journal.pone.0288518
Kimura M. (1980). A simple method for estimating evolutionary rates of base substitutions through comparative studies of nucleotide sequences. J. Mol. Evol. 16, 111–120. doi: 10.1007/BF01731581
Larkin M. A., Blackshields G., Brown N. P., Chenna R., McGettigan P. A., McWilliam H. (2007). Clustal W and clustal X version 2.0. Bioinformatics 23, 2947–2948. doi: 10.1093/bioinformatics/btm404
Leigh J. W., Bryant D. (2015). popart: full-feature software for haplotype network construction. Methods Ecol. Evol. 6, 1110–1116. doi: 10.5061/dryad.4n4j1
Linnaeus C. (1758). Systema Naturae per regna tria naturae, secundum classes, ordines, genera, species, cum characteribus, differentiis, synonymis, locis. Editio decima, reformata [10th revised edition] 1, 1–824.
Markow T. A., Pfeiler E. (2010). Mitochondrial DNA evidence for deep genetic divergences in allopatric populations of the rocky intertidal isopod Ligia occidentalis from the eastern Pacific. Mol. Phylogenet. Evol. 56, 468–473. doi: 10.1016/j.ympev.2009.12.002
Miller M. P. (2005). Alleles in space (AIS): computer software for the joint analysis of interindividual spatial and genetic information. J. Hered 96, 722–724. doi: 10.1093/jhered/esi119
Neraudeau D. (2008). “Nouveaux regards sur l'évolution et la biodiversité passée,” in Terre, planète mystérieuse. Eds. Grappin C., Cardin P., Goffé B., Jolivet L., Montagner J.-P. (Paris: le Church Midi), 129–138.
Ni G., Li Q. I., Kong L., Yu H. (2014). Comparative phylogeography in marginal seas of the northwestern Pacific. Mol. Ecol. 23, 534–548. doi: 10.1111/mec.12620
Ni G., Li Q., Kong L., Zheng X. (2012). Phylogeography of bivalve Cyclina sinensis: testing the historical glaciations and Changjiang River outflow hypotheses in northwestern Pacific. PloS One 7, e49487. doi: 10.1371/journal.pone.0049487
Nunomura N. (1979). Ligia boninensis, a new isopod crustacean from Haha-jima, Bonin Islands, Japan. Bull. Toyama Sci. Mus. 1, 37–40.
Nunomura N. (1983). Studies on terrestrial isopod crustaceans in Japan, I. Taxonomy of the families ligiidae, trichoniscidae and olibirnidae. Bull. Toyama Sci. Mus. 5, 23–68.
Nunomura N. (1990). Studies on the terrestrial isopod crustaceans in Japan V. Taxonomy of the families Armadillidiidae, Armadillidae and Tylidae, with taxonomic supplements to some other families. Bull. Toyama Sci. Mus. 13, 1–58.
Nunomura N. (1999). Sea shore isopod crustaceans collected from Izu Islands, Middle Japan. Bull. Toyama Sci. Mus. 22, 7–38.
Nunomura N. (2009). Terrestrial isopod crustaceans from Daito Islands, southern Japan. Bull. Toyama Sci. Mus. 32, 75–87.
Nylander J. A. A., Olsson U., Alström P., Sanmartín I. (2008). Accounting for phylogenetic uncertainty in biogeography: a Bayesian approach to dispersal-vicariance analysis of the thrushes (Aves: Turdus). Syst. Biol. 57, 257–268. doi: 10.1080/10635150802044003
Ota H. (1998). Geographic patterns of endemism and speciation in amphibians and reptiles of the Ryukyu Archipelago, Japan, with special reference to their paleogeographical implications. Res. Popul. Ecol. 40, 189–204. doi: 10.1007/BF02763404
Otofuji Y. I., Itaya T., Matsuda T. (1991). Rapid rotation of southwest Japan—palaeomagnetism and K-Ar ages of Miocene volcanic rocks of southwest Japan. Geophys. J. Int. 105, 397–405. doi: 10.1111/j.1365-246X.1991.tb06721.x
Otofuji Y. I., Kambara A., Matsuda T., Nohda S. (1994). Counterclockwise rotation of Northeast Japan: Paleomagnetic evidence for regional extent and timing of rotation. Earth Planet. Sci. Lett. 121, 503–518. doi: 10.1016/0012-821X(94)90087-6
Perrier X., Jacquemoud-Collet J. P. (2006) DARwin software. Available at: http://darwin.cirad.fr/Darwin (Accessed 26, 2019).
Puillandre N., Brouillet S., Achaz G. (2021). ASAP: assemble species by automatic partitioning. Mol. Ecol. Resour. 21, 609–620. doi: 10.1111/1755-0998.13281
Puillandre N., Lambert A., Brouillet S., Achaz G. (2012). ABGD, Automatic Barcode Gap Discovery for primary species delimitation. Mol. Ecol. 21, 1864–1877. doi: 10.1111/j.1365-294X.2011.05239.x
Rambaut A. (2012) FigTree v.1.4. Available at: http://tree.bio.ed.ac.uk/sofware/figtree.
Rambaut A., Drummond A. J. (2014a) Tracer v1.6. Available at: http://beast.bio.ed.ac.uk/tracer.
Rambaut A., Drummond A. J. (2014b) TreeAnnotator v.2.3.0. Available at: http://beast2.org.
Ramos-Onsins R., Rozas R. (2002). Statistical properties of new neutrality tests against population growth. Mol. Biol. Evol. 19, 2092–2100. doi: 10.1093/oxfordjournals.molbev.a004034
Rogers A. R., Harpending H. (1992). Population growth makes waves in the distribution of pairwise genetic differences. Mol. Biol. Evol. 9, 552–569. doi: 10.1093/oxfordjournals.molbev.a040727
Ronquist F., Teslenko M., van der Mark P., Ayres D. L., Darling A., Höhna S., et al. (2012). MrBayes 3.2: Efficient Bayesian phylogenetic inference and model choice across a large model space. Syst. Biol. 61, 539–542. doi: 10.1093/sysbio/sys029
Rozas J., Ferrer-Mata A., Sánchez-DelBarrio J. C., Guirao-Rico S., Librado P., Ramos-Onsins S. E., et al. (2017). DnaSP 6: DNA sequence polymorphism analysis of large data sets. Mol. Biol. Evol. 34 3299–3302. doi: 10.1093/molbev/msx248
Santamaria C. A. (2019). Molecular taxonomy of endemic coastal Ligia isopods from the Hawaiian Islands: re-description of L. hawaiensis and description of seven novel cryptic species. PeerJ 7, e7531. doi: 10.7717/peerj.7531
Santamaria C. A., Mateos M., Taiti S., DeWitt T. J., Hurtado L. A. (2013). A complex evolutionary history in a remote archipelago: phylogeography and morphometrics of the Hawaiian endemic Ligia Isopods. PloS One 8, e85199. doi: 10.1371/journal.pone.0085199
Schmalfuss H. (2003). World catalog of terrestrial isopods (Isopoda: Oniscidea) Stuttg. Beitr. Naturkd. A. 654, 1–341.
Shackleton N. J., Sánchez-Goñi M. F., Pailler D., Lancelot Y. (2003). Marine isotope substage 5e and the Eemian interglacial. Glob. Planet. Change 36, 151–155. doi: 10.1016/S0921-8181(02)00181-9
Shih H. T., Liu M. Y., Aoki M., Suzuki H. (2022). Phylogeography of the fiddler crab Tubuca arcuata (Crustacea: Brachyura: Ocypodidae) in East Asia and northern Vietnam. Zool. Stud. 61, e68. doi: 10.6620/ZS.2022.61-68
Shin C. R., Choi E. H., Kim G., Baek S. Y., Park B., Hwang J., et al. (2021). Characterization of metapopulation of Ellobium chinense through Pleistocene expansions and four covariate COI guanine-hotspots linked to G-quadruplex conformation. Sci. Rep. 11, 12239. doi: 10.1038/s41598-021-91675-5
Simon C., Frati F., Beckenbach A., Crespi B., Liu H., Flook P. (1994). Evolution, weighting, and phylogenetic utility of mitochondrial gene sequences and a compilation of conserved polymerase chain reaction primers. Ann. Entomol. 87, 651–701. doi: 10.1093/aesa/87.6.651
Taiti S., Arnedo M. A., Lew S. E., Roderick G. K. (2003). Evolution of terrestriality in Hawaiian species of the genus Ligia (Crustacea, Oniscidea). Crustac. Monogr. 2, 85–102. doi: 10.1163/9789047412854_010
Tajima F. (1989). Statistical method for testing the neutral mutation hypothesis by DNA polymorphism. Genetics 123, 585–595. doi: 10.1093/genetics/123.3.585
Tamura K., Stecher G., Kumar S. (2021). Molecular evolutionary genetics analysis version 11. Mol. Biol. Evol. 38, 3022–3027. doi: 10.1093/molbev/msab120
Tojo K., Sekiné K., Takenaka M., Isaka Y., Komaki S., Suzuki T., et al. (2017). Species diversity of insects in Japan: their origins and diversification processes. Entomol. Sci. 20, 357–381. doi: 10.1111/ens.12261
Trifinopoulos J., Nguyen L. T., von Haeseler A., Minh B. Q. (2016). W-IQ-TREE: a fast online phylogenetic tool for maximum likelihood analysis. Nucleic Acids Res. 44, W232–W235. doi: 10.1093/nar/gkw256
Tsai M. L., Dai C. F., Chen H. C. (1998). Desiccation resistance of two semiterrestrial isopods, Ligia exotica and Ligia Taiwanensis (Crustacea) in Taiwan. Comp. Biochem. Physiol. Part A Mol. Integr. Physiol. 119, 361–367. doi: 10.1016/S1095-6433(97)00438-8
Tsang L. M., Ma K. Y., Ahyong S. T., Chan T. Y., Chu K. H. (2008). Phylogeny of Decapoda using two nuclear protein-coding genes: origin and evolution of the Reptantia. Mol. Phylogenet. Evol. 48, 359–368. doi: 10.1016/j.ympev.2008.04.009
Tsuge M. (2008). A new species of the genus Ligia (Crustacea: Isopoda: Ligiidae) from the Lake Shinji (Shimane Prefecture), western Japan. Bull. Toyama Sci. Mus. 31, 51.
Waelbroeck C., Labeyrie L., Michel E., Duplessy J. C., Mcmanus J. F., Lambeck K., et al. (2002). Sea-level and deep-water temperature changes derived from benthic foraminifera isotopic records. Quat. Sci. Rev. 21, 295–305. doi: 10.1016/S0277-3791(01)00101-9
Wetzer R. (2001). Hierarchical analysis of mtDNA variation and the use of mtDNA for isopod (Crustacea: Peracarida: Isopoda) systematics. Contrib. Zool. 70, 23–39. doi: 10.1163/18759866-07001002
Xiong B., Kocher T. D. (1991). Comparison of mitochondrial DNA sequences of seven morphospecies of black flies (Diptera: Simuliidae). Genome 34, 306–311. doi: 10.1139/g91-050
Xu J., Chan T. Y., Tsang L. M., Chu K. H. (2009). Phylogeography of the mitten crab Eriocheir sensu stricto in East Asia: Pleistocene isolation, population expansion and secondary contact. Mol. Phylogenet. Evol. 52, 45–56. doi: 10.1016/j.ympev.2009.02.007
Yin J., Pan D., He C., Wang A., Yan J., Sun H. (2013). Morphological and molecular data confirm species assignment and dispersal of the genus Ligia (Crustacea: Isopoda: Ligiidae) along northeastern coastal China and East Asia. Zool. J. Linn. Soc. 169, 362–376. doi: 10.1111/zoj.12068
Yu Y., Harris A. J., Blair C., He X. (2015). RASP (Reconstruct Ancestral State in Phylogenies): a tool for historical biogeography. Mol. Phylogenet. Evol. 87, 46–49. doi: 10.1016/j.ympev.2015.03.008
Zhang J., Kapli P., Pavlidis P., Stamatakis A. (2013). A general species delimitation method with applications to phylogenetic placements. Bioinform 29, 2869–2876. doi: 10.1093/bioinformatics/btt499
Zhang P., Sun J., Wang S., He D., Zhao L. (2016). Influences of desiccation, submergence, and salinity change on survival of Ligia cinerascens (Crustacea, Isopoda): high potential implication for inland migration and colonization. Hydrobiologia 772, 277–285. doi: 10.1007/s10750-016-2673-2
Zhao D., Li Q., Kong L., Yu H. (2017). Cryptic diversity of marine gastropod Monodonta labio (Trochidae): did the early Pleistocene glacial isolation and sea surface temperature gradient jointly drive diversification of sister species and/or subspecies in the Northwestern Pacific? Mar. Ecol. 38, e12443. doi: 10.1111/maec.12443
Zhao L., Qu F., Song N., Han Z., Gao T., Zhang Z. (2021). Population genomics provides insights into the population structure and temperature-driven adaptation of Collichthys lucidus. BMC Genom. 22, 1–10. doi: 10.1186/s12864-021-08045-8
Keywords: Ligia exotica, Ligia cinerascens, population genetic structure, phylogeographic distribution, East Asia
Citation: Kim G, Kim H, Mun S, Choi EH, Nguyen AD and Hwang UW (2023) Molecular population genetics and phylogeographic studies of Ligia exotica and Ligia cinerascens in East Asia. Front. Mar. Sci. 10:1260171. doi: 10.3389/fmars.2023.1260171
Received: 17 July 2023; Accepted: 20 November 2023;
Published: 06 December 2023.
Edited by:
Raquel Xavier, Centro de Investigacao em Biodiversidade e Recursos Geneticos (CIBIO-InBIO), PortugalReviewed by:
Carlos Alberto Santamaria, University of Tampa, United StatesLara Baptista, Centro de Investigacao em Biodiversidade e Recursos Geneticos (CIBIO-InBIO), Portugal
Copyright © 2023 Kim, Kim, Mun, Choi, Nguyen and Hwang. This is an open-access article distributed under the terms of the Creative Commons Attribution License (CC BY). The use, distribution or reproduction in other forums is permitted, provided the original author(s) and the copyright owner(s) are credited and that the original publication in this journal is cited, in accordance with accepted academic practice. No use, distribution or reproduction is permitted which does not comply with these terms.
*Correspondence: Ui Wook Hwang, dXdod2FuZzFAZ21haWwuY29t