
95% of researchers rate our articles as excellent or good
Learn more about the work of our research integrity team to safeguard the quality of each article we publish.
Find out more
ORIGINAL RESEARCH article
Front. Mar. Sci. , 10 January 2024
Sec. Ocean Observation
Volume 10 - 2023 | https://doi.org/10.3389/fmars.2023.1258070
This article is part of the Research Topic Frontiers in Marine Geomorphometry View all 16 articles
 Audrey Recouvreur1*
 Andrew J. Wheeler1,2
 Ruaihri Strachan3Patrick A. Meere1,2Richard P. Unitt1,2
 Aaron Lim4,5
The Irish continental margin (ICM) encompasses many complex sedimentary basins and diverse geomorphological features displaying bedrock outcrops where a large variety of habitats can be observed. This large area of seabed extends over >400,000 km2 and cannot be mapped manually or in a standardized way. Novel bedrock suitability mapping is applied to the entire ICM to determine potential bedrock outcrop from shallow to deep settings and to improve on the regional near-surface geology of the Irish margin. With the use of ROV video transects covering all the ICM and multibeam echosounder dataset, key terrain variables diagnostic of bedrock outcrop have been derived from bathymetry. A reclassification of each terrain variable was created by identifying the suitable ranges for outcrop occurrence in the variables, corresponding to the most common values occurring where the bedrock is located. Suitable bedrock location in non-surveyed areas have been calculated using these variables with map algebra to develop the novel Bedrock Suitability Index. This high-resolution (25 m2) model indicates that the main features where outcrop could be observed are canyon heads, terraces, or failure scarps, especially noticeable on the Whittard Canyon system. The Bedrock Suitability Index model is validated by video observations of bedrock exposures and is established with 58% level of confidence with 25 m2 resolution on the overall margin over >400,000 km2. The BSI mapping suggests a structural control on bedrock outcrop occurrences, with high BSI correlating with deep structural fabrics of the margin as bedrock outcrop can be found in areas where previously mapped faults have been identified. Bedrock and hard substratum mapping are important components to improve habitat identification and mapping. This less-invasive, low-cost method can be applied with open source software in a relatively simple way of determining where bedrock could be found. It can also be used to refine areas where there will be simply too much data for use to manually classify. Potential bedrock outcrop mapping can be included in a species distribution model.
The Irish continental margin (ICM) is at present a passive margin and has a complex geology that is composed of horst blocks, rifted sedimentary basins, and volcanics that are exposed in places by submarine erosion, strong contourite currents, and submarine canyon incision. The location of the continent–ocean transition zones is unclear in places and again complex (Naylor and Shannon, 2005; Shannon et al., 2007; Yang and Welford, 2021). The margin hosts a variety of geomorphological domains supporting a large diversity of habitat from shallow to cryptic fauna. The exposure of bedrock substrate has a strong habitat influence (Wilson M.F.J. et al., 2007; Dunn and Halpin, 2009; Hu et al., 2020) and benthic habitat development (Galparsoro et al., 2015; Dunlop et al., 2020; Keenan et al., 2022).
Bedrock mapping is important for offshore development, as sampling using cost-effective ROV-sidewall drilling is exponentially cheaper than conventional offshore drilling practices. ROV drilling and sampling is also less invasive than common drilling. Moreover, bedrock and rocky outcrop mapping can play an important part in vessel navigation and maritime navigational hazards. Knowing bedrock location in deep settings is also important to increase the knowledge on deep offshore geology and surface geology of challenging accessible areas, to precisely examine regional geology with sampling and dating, and to correlate it with regional seismic profiles, reflectors, and horizons. At present, offshore bedrock mapping has been particularly studied for drilling (Nelson and McBride, 2022), deep-sea mining and hardground [e.g., ferromanganese nodules mapping (Gazis et al., 2018; Peukert et al., 2018a; Peukert et al., 2018b)], habitat mapping (Greene et al., 2007; Zhi et al., 2014; Switzer et al, 2020; Keenan et al., 2022), and species distribution and conservation (Strong et al., 2012; Buhl-Mortensen et al., 2015; Strong et al., 2022; Hao et al., 2023).
To characterize shallow to deep marine habitat, particular substrates or environments, geomorphometry, and the use of terrain attribute in mapping efforts have been increasing in the past few years (Lecours et al., 2015; Lecours et al., 2016). The use of key attributes derived from bathymetry such as rugosity (Gratwicke and Speight, 2005) or Bathymetric Position Index (BPI) (Arosio et al., 2023; Fakiris et al., 2023) indicated/revealed links with habitat/substrate/species distribution and mapping efforts.
Studies based on rugosity modeling over small to medium-size areas showed that mapping hard substratum can help in identifying habitat (Wilson M. F. J. et al., 2007; Dunn and Halpin, 2009; Howell et al., 2016; Keenan et al., 2022). Targeting bedrock outcrop at various depths and general oceanographic settings could indicate different potential favorable habitats and associated fauna development. Recent habitat suitability modeling efforts showed that mid-depth (60–120 m depth) bioconstructors such as Coralligenous Formations in the Mediterranean are favored in outcropping areas, as indicated by benthic morphometric descriptors such as the BPI (Fakiris et al., 2023). Other geomorphologies like cliffs and vertical walls on complex geomorphologic features have also been investigated as host for cold water reef development (Flach, 2003; Miller et al., 2012; Robert et al., 2017; O’Sullivan et al., 2020; Robert et al., 2020; Appah et al., 2021; O’Reilly, 2022), demonstrating that steep, hard substrate can be central for biodiversity hotspots. However, few studies focus on substratum mapping at a regional scale though it is an important component to consider for species mapping (Dunn and Halpin, 2009; Harris and Baker, 2012; Keenan et al., 2022). Past and more recent surveying in the Porcupine Bank Canyon and Whittard Canyon has previously indicated extensive areas of bedrock exposure (Pastouret et al., 1984; de Graciansky et al., 1985; Auffret et al., 1987; Cunningham et al., 2005; Carter et al., 2018; Appah et al., 2021; Strachan, 2021). Ireland has extensive near-vertical outcrop along its continental margin that can be sampled using cost-effective ROV-sidewall drilling (Lim et al., 2018). However, very few studies target direct bedrock observations in very deep settings (Brown et al., 2019; Trotter et al., 2019; Backus et al., 2020; Meredyk et al., 2020) on a regional scale, especially in the deep-sea territory of offshore Ireland. In this way, the near-surface geology of the southern ICM remains poorly known.
As efforts are put in seabed and habitat mapping with national and international programs (Seabed 2030, INFOMAR), it is important to develop methods for mapping inaccessible outcrops and to use techniques that are as less invasive as possible. For deeper and less accessible settings, it seems important to learn to map and deal with large segments of seabed, which has a significant benefit in describing the distribution of habitat as a result. This work presents a semi-automated method, based on terrain attributes, the Bedrock Suitability Index (BSI), to map offshore bedrock exposure confidently at a large scale that can be used for ROV-sampling. The aims here are to allow to characterize offshore basins based on their surface exposure with a new, less-invasive seabed exploration method, and to highlight areas favorable for outcrops on the ICM.
The ICM extends south from the Southwest Approaches and Goban Spur, along the Porcupine Bank and up to the Rockall Trough. The Rockall Trough failed rift basin separates the Rockall Bank margin from the mainland margin. The Rockall Bank margin is also contiguous with the Fangorn and Edoras High, Hatton Trough, which extends to the Hatton Bank (Figure 1; Auffret et al., 1987; Naylor et al., 2002; Naylor and Shannon, 2005; Shannon et al., 2007; Yang and Welford, 2021). The complexity of this region results from multiple rifting phases from the late Paleozoic to the Cenozoic related to the opening of the Atlantic Ocean (de Graciansky et al., 1985; Welford et al., 2012; Whiting et al., 2021; Yang and Welford, 2021).
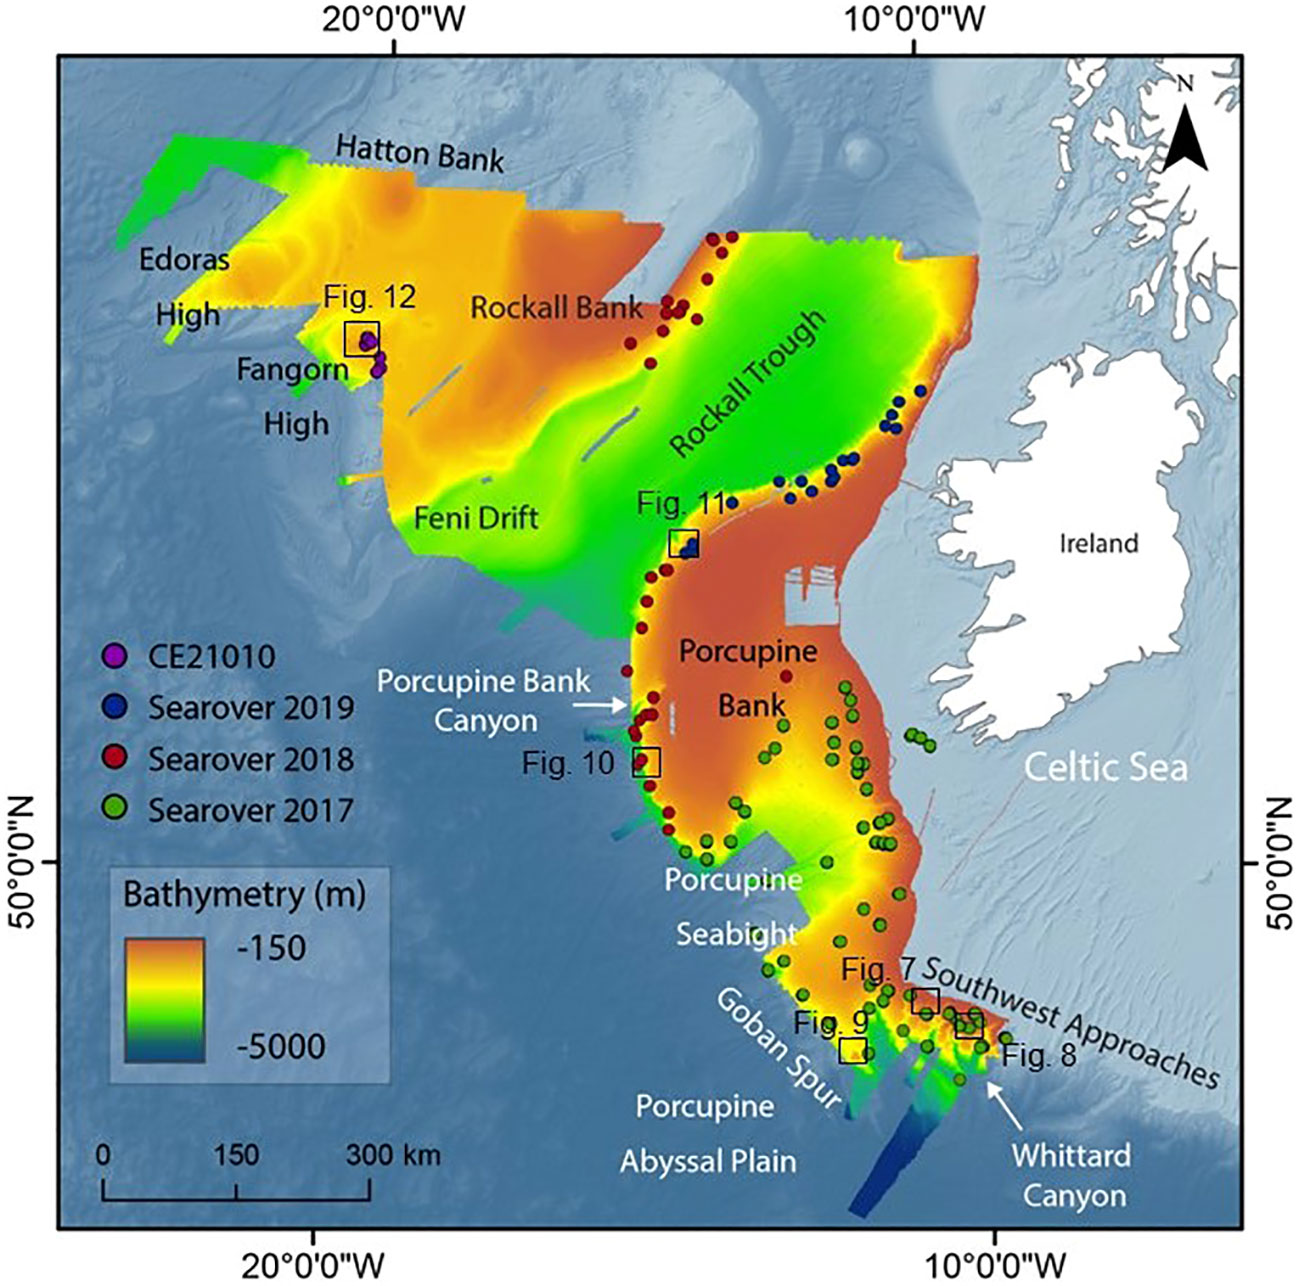
Figure 1 Bathymetry of the study area, the Irish continental margin with the main geomorphological/sedimentary domains. Bathymetry from INFOMAR and background bathymetry from GEBCO Compilation Group (2022). Location of ROV videos from campaigns SeaRover and CE21010.
Southwest Approaches are incised by extensive submarine canyons including the King Arthur Canyon and multi-branched Whittard Canyon, which dominates this part of the margin. Whittard Canyon is a dendritic V-shaped canyon affecting over 150 km of the margin. This canyon displays a semi-circular shaped head with a concave profile (Cunningham et al., 2005). It is composed of four main branches (Western branch, Western middle branch, Eastern middle branch and Eastern branch), and is still active with mainly sediment transport from the head through turbidity currents (Amaro et al., 2016; Carter et al., 2018). Retrogressive erosion widens the canyon branches by wall failures (Amaro et al., 2016), and erosional processes such as slumping or density currents appear to mold the Whittard Canyon’s present-day bathymetry (Robert et al., 2017; Carter et al., 2018). The canyon acts as a preferential pathway for sediment to transit from the margin to the abyssal plain (Zaragosi et al., 2000). The extensive vertical flanks of the canyon form an important habitat for cold water coral, with assemblages different from those of flat sites (Robert et al., 2020). In addition, gullies and terraces of the middle eastern branch, imaged by sonar scan, appear swept clean of sediments and exhibit bedrock outcrops (Bourillet et al., 2006).
The Goban Spur is located south of the Porcupine Seabight and characterized by a steep (up to 40°) escarpment (beginning at −1,800 m) with an N120 direction leading to the Porcupine Abyssal Plain (<−5,000 m) (de Graciansky et al., 1985; Masson et al., 1989; Naylor et al., 2002; Dorschel et al., 2010). The Goban Spur was affected by the Variscan orogeny and subsequent rifting phases that overprinted the peri-Gondwanan basement (Kimbell et al., 2010; Yang et al., 2020). It is defined by complex structures affected by faults that appear geomorphologically as highs, lows, and escarpments.
The Porcupine Bank separates the Porcupine Seabight from the Rockall Trough and forms a continental block with steep lateral slopes (>7–4° north to up to > 20° south) extending for more than 800 km (Naylor and Shannon, 2005; Yang et al., 2020; Whiting et al., 2021). At present-day bathymetry, the Porcupine Bank is incised on its southwestern slope by multiple submarine canyons and gullies including the over >100-km Porcupine Bank Canyon formed by upslope–retrogressive slope (Elliott et al., 2006; Dorschel et al., 2010).
The Rockall Trough, a ~2,500-m deep basin, separates the shallow Rockall Bank and Fangorn High from the Porcupine Bank. The Rockall Bank slope is affected by along-slope and across-slope processes and features like erosional channels, iceberg scours, and slope failures (O’Reilly et al., 2001; Haughton et al., 2005; Shannon et al., 2007; Dorschel et al., 2010; Sacchetti et al., 2011). Cold water coral mounds have been described on the flanks of the eastern Rockall Bank associated with geologic and oceanographic control (Mienis et al., 2006; Shannon et al., 2007).
New seismic studies on the western Porcupine Bank show details of Atlantic rifting and the oceanic to continental crust transition, highlighting that inherited Caledonian and Variscan crustal structures that influence the geometries of the crustal domains (Whiting et al., 2021; Yang and Welford, 2021). It also shows north-westward increasing volcanism supporting the transition from magma-poor to magma-rich rifting along the Porcupine Atlantic margin, with exhumed mantle domains southwest of Porcupine Bank to Goban Spur (Whiting et al., 2021; Yang and Welford, 2021). More recent surveying in the Porcupine Bank (Strachan, 2021) and in Whittard Canyon (Cunningham et al., 2005; Carter et al., 2018) has indicated extensive areas of bedrock exposure. Bedrock outcrops are mainly observed in the head of the Porcupine Bank Canyon, on escarpment creating bedrock cliffs, along the steeply sloping center margin, or along moderate to steeply sloping seafloors (Strachan, 2021). In the Whittard Canyon, a side-scan sonar survey reveals areas of bedrock exposure located in the eastern branch (Cunningham et al., 2005).
Multibeam echosounder (MBES) data used in this study were provided by the Irish National Seabed Mapping Programme INFOMAR/INSS [INFOMAR, Geological Survey Ireland and Marine Institute (GOTECH, 2002)]. This work contains Irish Public Sector Data (Geological Survey Ireland and Marine Institute) licensed under a Creative Commons Attribution 4.0 International (CC BY 4.0) license. The different concatenate bathymetries were obtained using the Kongsberg Simrad EM120, EM1002 multibeam echo sounder on board RSV Bligh, RSV Siren, and S/V Ocean Surveyor (GOTECH, 2002). The multibeam echo sounder data were processed using CARIS HIPS and SIPS multibeam processing software and the xyz files were gridded in Fledermaus and then the DTM was exported to ESRI asc. Export interpolated Surface as ArcGIS raster (GOTECH, 2002). The multibeam bathymetry and backscatter data were projected to UTM Zone 28N and gridded at 25-m resolution in Esri ArcGIS 10.8.1. The grid used as background bathymetry is from GEBCO Compilation Group (2022).
The benthic video assessment for bedrock occurrence was made using videos and datasets collected during SeaRover campaigns (Picton et al., 2021) using the Marine Institute’s Remotely Operated Vehicle (ROV) Holland 1 on board ILV Granuaile during SeaRover 2017 (O’Sullivan et al., 2017) and SeaRover 2018 (O’Sullivan et al., 2018), and onboard the RV Celtic Explorer during SeaRover 2019 (O’Sullivan et al., 2019). Data from videos from Autosub6000 AUV (autonomous underwater vehicle) onboard RRS James Cook during CODEMAP2015 cruise (Huvenne et al., 2016) were also used. Bedrock locations identified from past cruises CYMOR 2 (Pastouret et al., 1984), CYAPORC (Auffret et al., 1987) and GEOMANCHE 76/2 (Pautot, 1976) were also used (Figure 1). These videos allow direct recognition of bedrock exposure in various regions, either morphologically or spatially, on the ICM (Figure 1; Supplementary Figure 1). The videos were watched and the seabed substratum, where observed, was classified into classes: mud, pebbles, bedrock, and hardground (Appendices A–C). We were cautious about the apparent geometry and size to determine if the outcrop was in place and to limit the identification of large dropstones. This classification allowed us to indicate the presence or absence of bedrock/outcrops. The USBL from the ROV was retrieved and compared to time code to extract the location of bedrock outcrop transects.
To reduce potential oversampling due to differences in resolutions between MBES data and ROV observation points, the ROV video data were resampled using the Generate Points Along Lines tool in ESRI ArcMap 10.8.1 with 5-m intervals. Some transects were cleaned if the ROV was running in circles or remaining stationary for a long time in one position, resulting in point clustering and oversampling, to simplify the generation of clear ROV navigation line and points.
The quantitative terrain variables derived from the original ICM bathymetric and backscatter data are outlined in Table 1. These bathymetric variables are used as geomorphology descriptors to spatially analyze the seafloor (Lecours et al., 2016; Misiuk et al., 2018). These variables were chosen to delineate seafloor terrain where outcrop was observed in the video transects. From the MBES data, seven variables were calculated on a 3 × 3 cell analysis window based on the most common terrain attribute used in seafloor geomorphometry (Lecours et al., 2016; Ilich et al., 2021; Ilich et al., 2023): (1) Gradient of slope in degree, which is the maximum rate of change in elevation values (Ilich et al., 2023) and gives information about the stability of sediments and local acceleration of currents (erosion, movement of sediments, and creation of bedforms) (Lecours et al., 2016); (2) Seafloor aspect, giving the orientation of the seafloor at a referenced location (flat, N, S, E, and W); (3) Mean curvature [slope of slope, which indicates with a positive value an upwardly convex surface, and with a negative value an upwardly concave surface, and a value of 0 indicates a flat surface; really high values (>4 or <−4) indicates high relief]); it gives information about flows and channeling of sediments/currents (Dolan et al., 2012; Lecours et al., 2016); (4) BPI—Broad scale; (5) BPI—Fine scale; BPI expresses a seafloor position relative to the surrounding locations. BPI > 0 indicates topographic features higher than the surrounding area like crests. BPI < 0 indicates features lower than the surrounding area like troughs; the broad-scale BPI was defined using an inner radius of 1 and an outer radius of 10 and the fine-scale BPI was defined using an inner radius of 4 and an outer radius of 10 (Walbridge et al., 2018); (6) Roughness, calculated as the difference between maximum and minimum values in a rectangular neighborhood (Wilson M. F. J. et al., 2007; Lecours et al., 2017), can be a parameter to predict reef habitats (Jackson-Bué et al., 2022); (7) Rugosity, here estimated as standard deviation of bathymetry, denotes the terrain heterogeneity and is relevant in identifying rock outcrop while limiting the encapsulation of carbonate mound features (Strachan, 2021). These were calculated using a combination of Spatial Analyst tools and Benthic Terrain Modeller (Walbridge et al., 2018) in ESRI ArcMap 10.8.1.
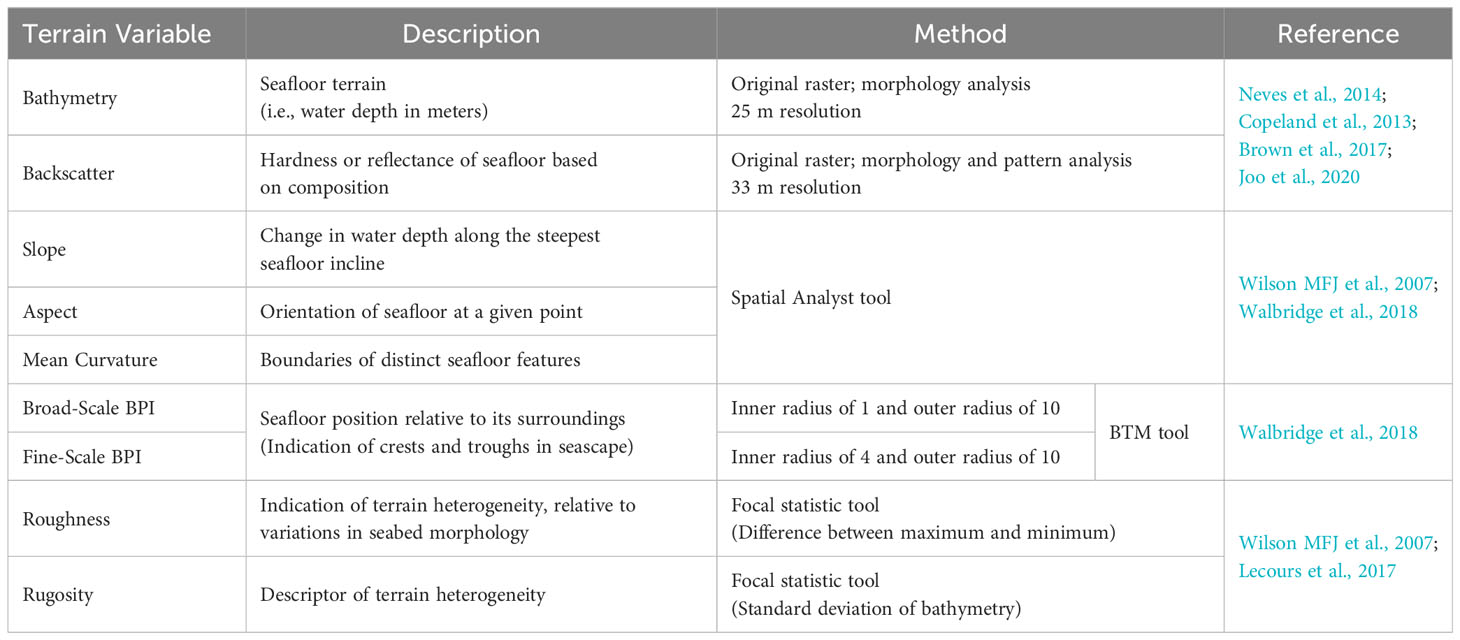
Table 1 Terrain variables used for bedrock suitability mapping.
The backscatter was used separately from the bathymetric derived layer as a quality assessment to compare with the Bedrock Suitability Index as it is indicative of hard substrate. It was used as further descriptive information in a relative way—as acoustically hard backscatter areas is representative of hard/rocky seabed and acoustically soft backscatter areas seabed dominantly comprise soft and muddy sediment (Siwabessy et al., 2018). The backscatter was gridded independently at 33-m resolution (highest resolution available from the original INFOMAR dataset).
By identifying the suitable ranges for outcrop occurrence in the variables with the interquartile range (IQR) method, corresponding to the most observed variable characterizing bedrock from the variables extracted from the position of observed bedrock on ROV videos (Supplementary Figure 2), it was possible to define the Bedrock Suitability Index and apply it to the rest of the study area. This method was adapted from the case study of the Porcupine Bank Canyon (Strachan, 2021) and applied to the entire ICM.
The most suitable class for reclassification of each terrain variable was created close to the recorded median of terrain variables confirming bedrock occurrence evidenced from video observations ( ± 10% of the IQR from the median). The remaining classes were based on the upper and lower quartiles, extreme values, and outliers. Each terrain variable map was reclassified according to the four ranges from (4) very high to (1) low (McGill et al., 1978):
4: ± 10% of the IQR from the median.
3: upper and lower quartiles (25th and 75th percentile).
2: extreme values (−1.58*IQR and +1.58*IQR).
1: outliers (minimum value in the data and outliers and maximum value in the data and outliers).
To generate the Bedrock Suitability Index map, queries were made to select pixels that met the IQR classification rules for the selected terrain variables. The reclassified variables were multiplied together with the Raster calculator tool (Supplementary Figure 3). The resulting raster layer was then normalized to provide a value for unsuitable (0) to suitable (100) bedrock terrain [Bedrock Suitability Index (BSI)]. No further filters were applied for this bedrock outcrop suitability occurrence model as forcing a high confidence may lead to outcrop exclusion, and the IQR method has proven useful in classifying terrain variable for bedrock suitability (Serrano et al., 2017; Strachan, 2021).
When generating the BSI maps for the ICM, issues can be observed, e.g., due to the large data coverage and diversity of sources, that were not apparent in the pilot study (Porcupine Bank Canyon, Strachan, 2021). Deeper bathymetries have noisier data (Clarke, 2018). With the size of the study area (>400,000 km2) reaching very deep domains of the ICM (<−5,000 m for the Porcupine Abyssal Plain), considerations had to be made regarding the application of this method at such depths where high noise leads to a poorly confident BSI.
To answer this issue and to reduce the influence of noise in the dataset, the Focal statistic tool from the ArcGIS Toolbox was used. The standard deviation of the BSI was calculated and standardized to a 0 to 1 index (with 0 for high deviation to 1 for low deviation). This was multiplied with the original BSI map, to give less weight to surfaces with high variability (displaying noisy bathymetry in the dataset) and more weight to low-variability areas.
To facilitate the reading of the index and to highlight the high bedrock probability occurrence clusters, a “readable” map has been created by increasing the pixel size by 20, using the “Aggregate” tool with aggregation type “mean” in the ArcGIS toolbox using Supplementary Figure 4. In this way, the Bedrock Suitability Index maps indicate bedrock locations that share the most common terrain parameters with observed bedrock outcrops.
A principal component analysis (PCA) was performed using the package Factoextra (Lê et al., 2008; Mächler et al., 2012; Galili, 2015; Wickham, 2016) and FactoMineR (Lê et al., 2008) on terrain variables to look at the behavior of each terrain parameter with results shown in Figure 2.
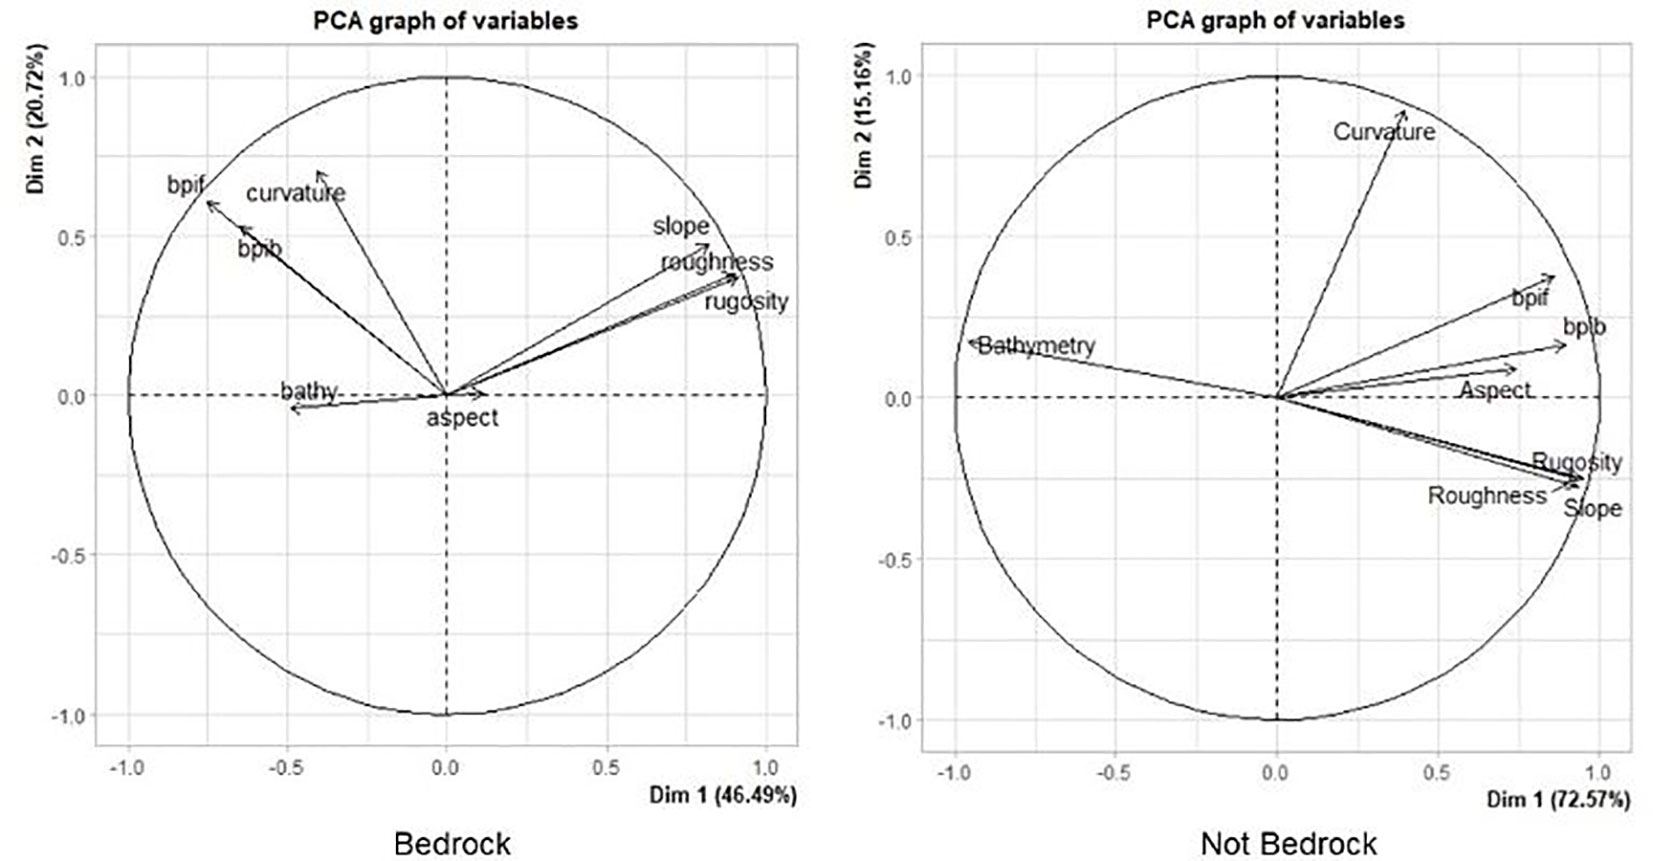
Figure 2 PCA graph of terrain variables.
The general IQR statistics extracted from the ROV video shows that bedrock location on the ICM (Figure 3) would be most suitably found with a moderate slope angle (10° median, Q25 = 6, Q75 = 19); a moderate positive curvature (0.3 median, Q25 = −1.8, Q75 = 1.6); high roughness (14 median, Q25 = 9, Q75 = 25); moderate rugosity (5 median, Q25 = 3, Q75 = 8); high reflectivity (84 dB median, Q25 = 67 dB, Q75 = 99 dB); an east aspect (88 median, Q25 = 37, Q75 = 181); a broad-scale BPI median of 1 (Q25 = −6, Q75 = 5); and a fine-scale BPI median of 0 (Q25 = −4, Q75 = 3).
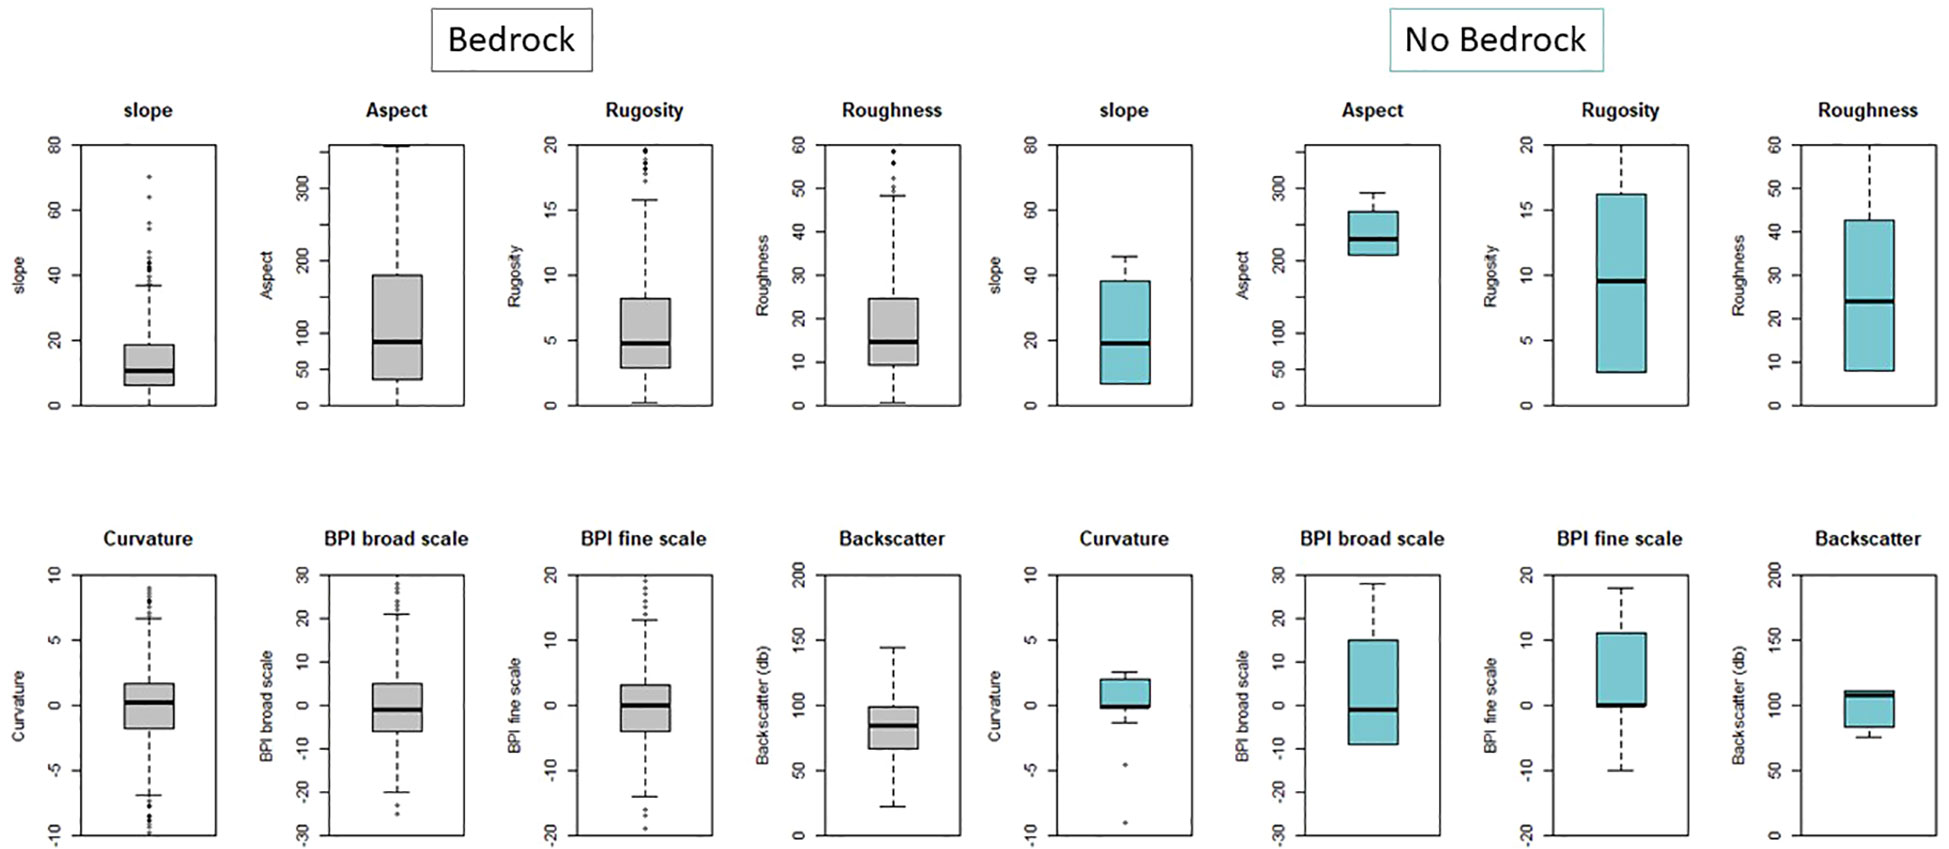
Figure 3 IQR statistics of terrain variable for bedrock and not bedrock; boxplot of Roughness, Backscatter, Aspect, BPI broad scale, BPI fine scale, Rugosity, Slope, and Curvature.
It differs from other “not bedrock” type of substratum with less steep slope angle (19° median for not bedrock), smaller but shorter interval between minimum and maximum rugosity (9 median and 75% of values comprise between 2 and 16 for not bedrock), higher curvature values (−0.09 median for not bedrock), roughness (24 median for not bedrock), smaller reflectivity values (108 median for not bedrock), southwest aspect (231 median for not bedrock), higher broad-scale BPI values (−1 median for not bedrock), and similar fine-scale BPI median values (0 median for both not bedrock and bedrock but fine-scale BPI bedrock 75% values comprise between −4 and 3 and 75% of fine-scale BPI “not bedrock” values comprise between 0 and 11). Both Bedrock and “not bedrock type” display similar values (Figure 3).
A PCA test was performed on the bedrock and “not bedrock” location terrain variable dataset to look at these parameters’ pertinence (Figure 2). The PCA graph of bedrock values tend to indicate that the most representative variables for bedrock suitability occurrence in marine settings are roughness, rugosity, and slope, followed by curvature, fine-scale BPI, and broad-scale BPI (with correlation close to 1). Correspondingly, aspect and bathymetry have less influence on bedrock identification (correlation < 0.5). It can be noted that roughness, rugosity, and slope are variable correlated and are anti-correlated with curvature, fine-scale BPI, and broad-scale BPI. On the other side, the PCA graph of “not bedrock” values tend to indicate that all variables are representative (with correlation close to 1). It can be noted that like bedrock parameters, curvature, roughness, rugosity, and slope are variable correlated and are anti-correlated with fine-scale BPI and broad-scale BPI. In contrast to the bedrock values, bathymetry for “not bedrock” seems anti-correlated with fine-scale BPI and broad-scale BPI.
The ROV videos provided by the SeaRover 2017, 2018, and 2019 campaign cruises (O’Sullivan et al., 2017; O’Sullivan et al., 2018; O’Sullivan et al., 2019) provided direct evidence for bedrock exposure in various regions (Figure 1), either morphologically or spatially, on the ICM. To assess the BSI, the locations of bedrock occurrence were compared with the results of the BSI (Figure 4). A total of 25 bedrock outcrop sites have been observed on ROV video at various places over the Irish margin, corresponding to 13 sites displaying BSI values up to 50 and 75, 6 sites displaying BSI values between 50 and 30, and 6 sites displaying BSI values < 30.
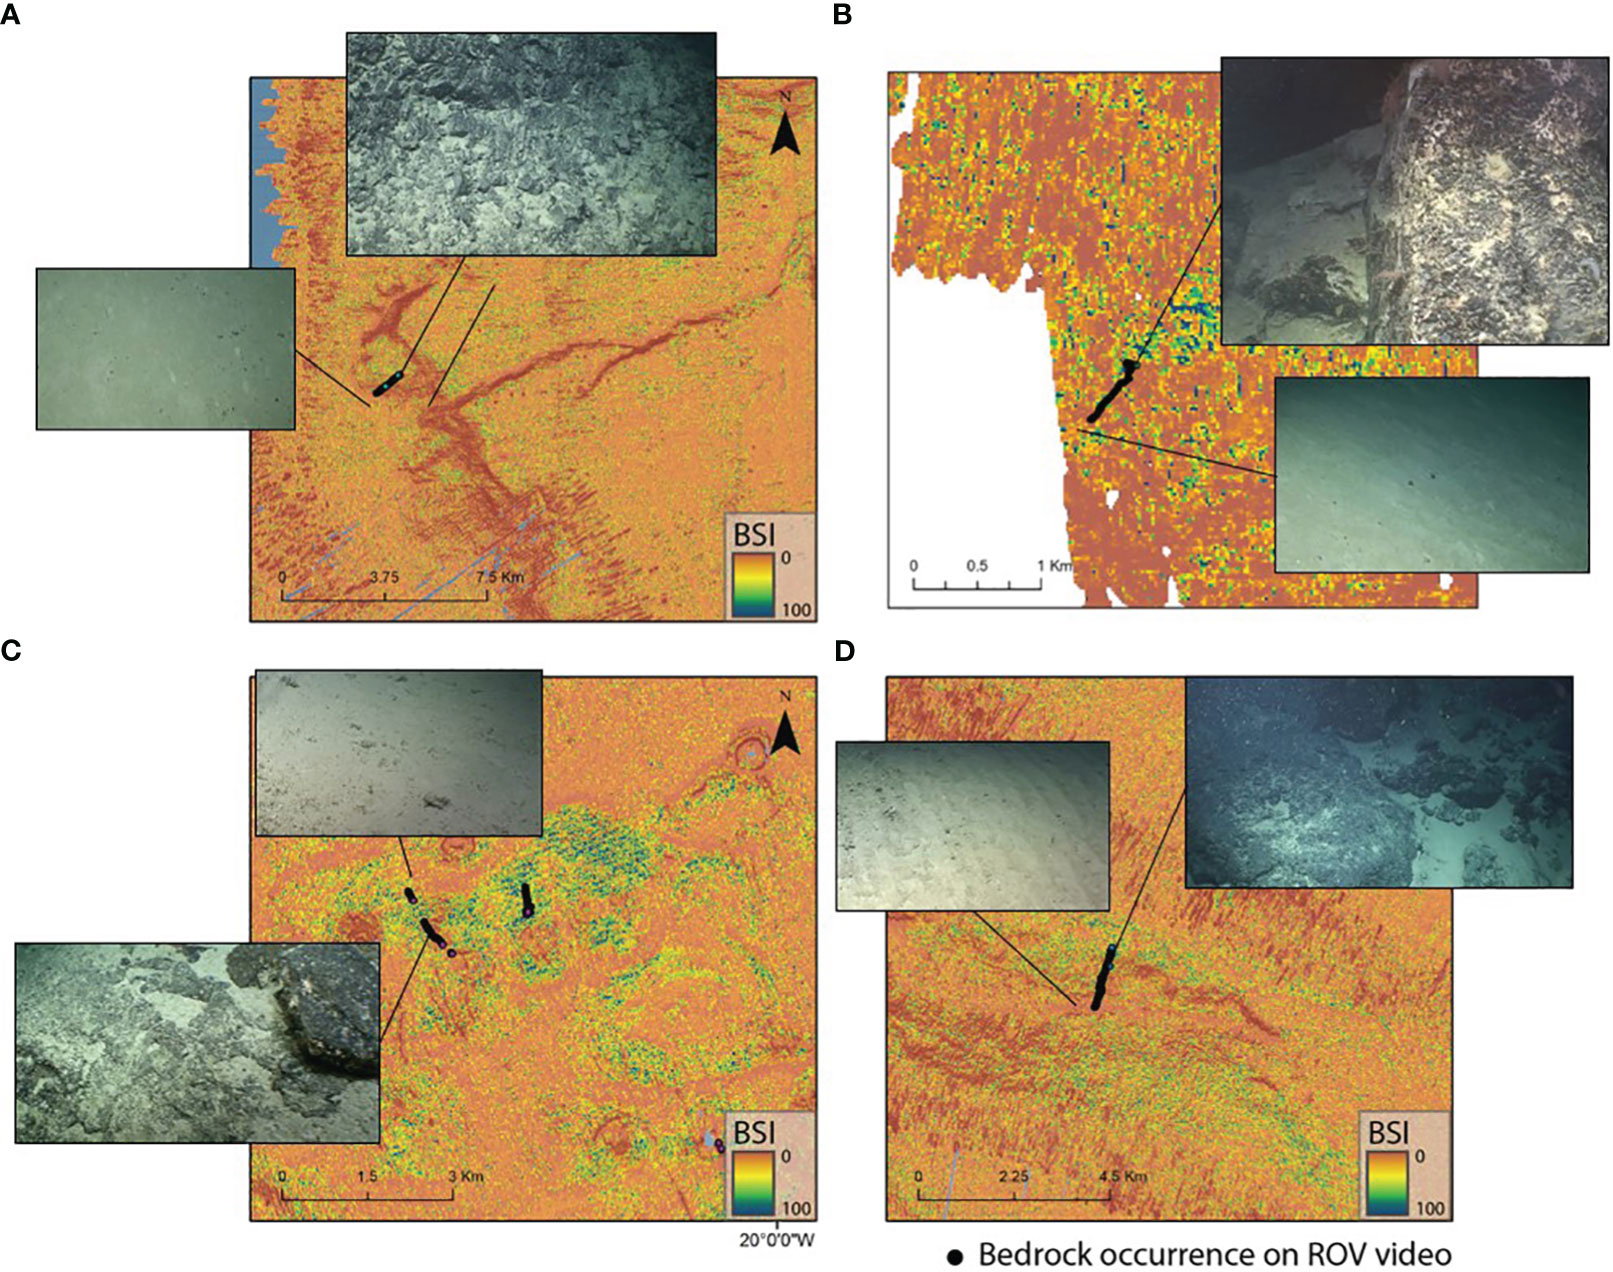
Figure 4 Video assessment of the Bedrock Suitability Index with bedrock and mud ROV video corresponding captures. Bedrock occurrence on the (A) Porcupine Bank, (B) Porcupine Seabight, (C) Fangorn High, and (D) Rockall Bank. Distance between lasers on video captures is 10 cm.
In addition, the location of bedrock recognized on ROV video from the CE21010 cruise and CE22013 cruise (Figure 4) allowed a deeper assessment of the model as these data are independent from the statistical calculations and were used as testing points (Figure 4C). For the CE21010 cruise, on seven dives where bedrock has been observed, four sites display BSI values between 50 and 75, two sites display BSI values of 30, and the last two sites display BSI < 30. For the cruise CE22013 that used the BSI to plan on bedrock outcrop drilling, on 14 dives planned using BSI ≥ 75, bedrock outcrops were found on 10 dives and no bedrock were found on 2 dives, which represents 71% successful use of BSI (Wheeler et al., 2023).
In fine, we obtained 46 total sites where bedrock has been observed on video that coincide with the BSI map with 27 sites displaying ≥75 BSI; thus we obtained (27*100)/46 = 58.7% validation by video observation. This validation by video observations and correlations of predicted bedrock exposures with the BSI provide a confidence level of 58.7%.
The study area has been divided into five zones to look more precisely at the bedrock suitability occurrence. These zones are the Southwest Approaches (including Whittard Canyon and King Arthur Canyon), the Goban Spur, the northern and southern Porcupine Bank, and the Rockall Bank (including Edoras High and Hatton Basin). Each zone depicts a large diversity of locations suitable for bedrock occurrence (Figure 5). It can be noted that the raw BSI displays very high resolution over the overall study area with a precision of the order of decametric sedimentary structure (Figure 6).
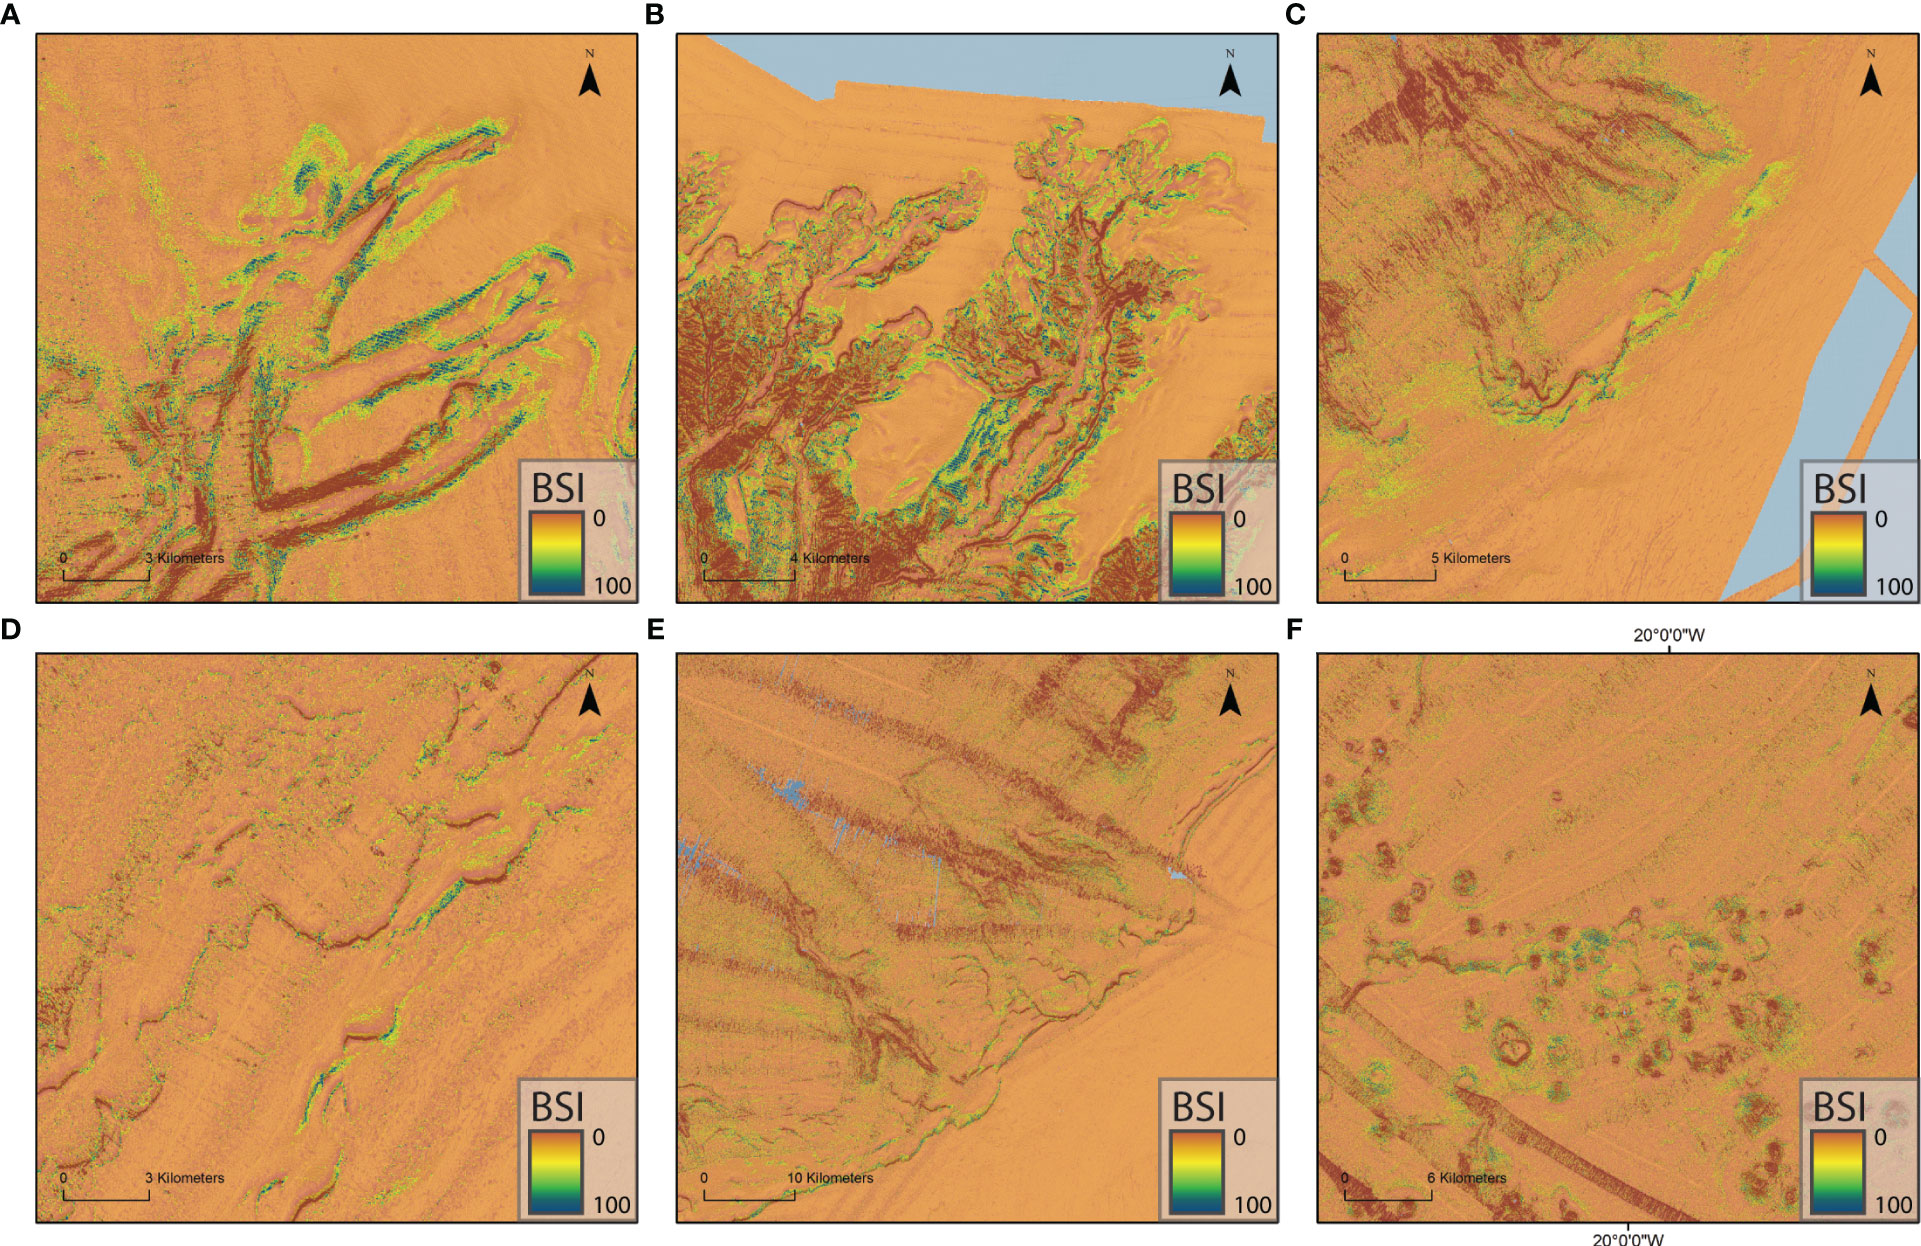
Figure 5 Bedrock Suitability Index zoom on the (A) Eastern branch of Whittard Canyon, (B) Western branch of Whittard Canyon, (C–E) North Porcupine Bank, and (F) Fangorn High. Location on Figure 1.
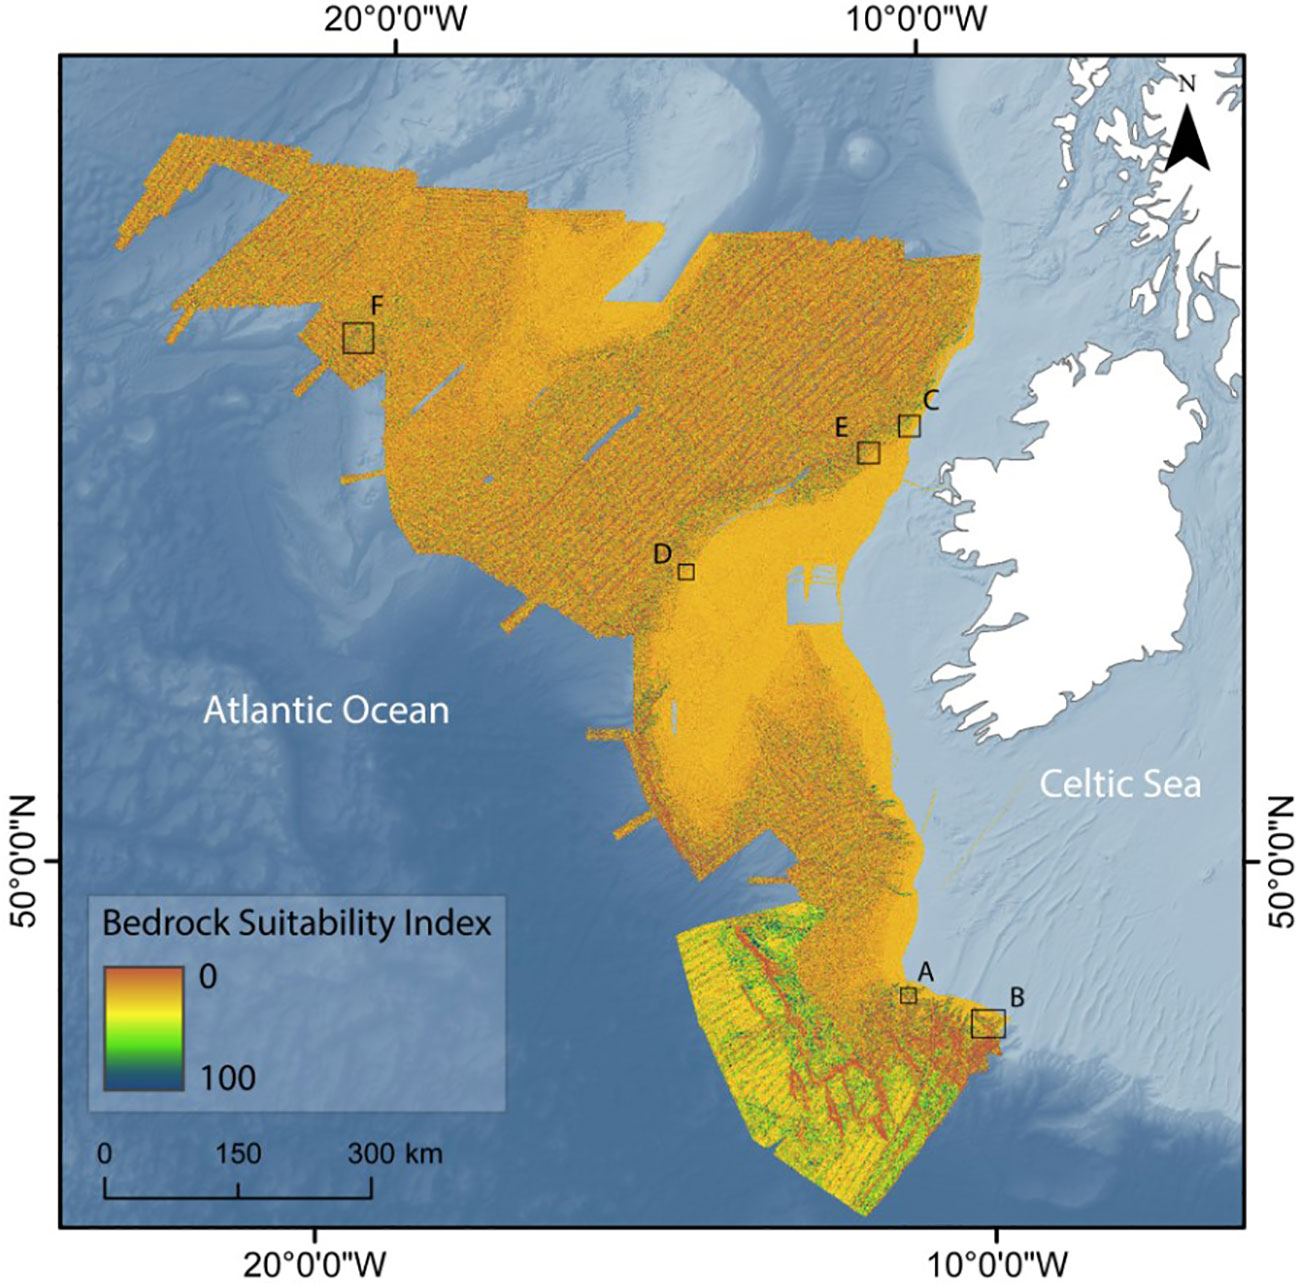
Figure 6 Bedrock Suitability Index. High resolution (25 m). Cold colors represent high suitability and warm colors represent low suitability for bedrock occurrence. BSI ≥ 70 is illustrated by dark blue, BSI = 50 by green and 30 by yellow color. Location of the inset maps of Figure 5.
The Southwest Approaches are marked by many geomorphological features that host a substantial number of high BSI clustered locations. The Whittard Canyon branches and linked gullies, terraces, flanks, talwegs, canyon heads, toes, and edges as well as many retrogressive erosion scars are the features that could display the most bedrock (with high BSI > 70). Here, two morphologies can be observed at a smaller scale: canyon branches (Figure 7) and cross-cutting canyons (Figure 8). The same pattern can be observed on the canyon branches; patches of high reflectivity (Figure 7A) are associated with high roughness (Figure 7C), medium curvature (Figure 7E), and high BPI, either positive or negative (Figure 7B). This characterizes morphologies affected by erosion processes or associated with movements in the canyon like terraces, head, or failure scarps. Accordingly, this parameter association corresponds to patches of high suitability for bedrock occurrence (Figure 7D). On the terrace presented in Figure 8, in three cross-cutting canyons, or relict canyons, as described by Cunningham et al. (2005), high reflectivity can be observed on the talweg and walls of these structures (Figure 8A). As in the eastern canyon branch, talwegs and flanks are associated with high roughness (Figure 8C), with medium positive curvature implying concave surfaces (Figure 8E) and high BPI, positives for talwegs and negative for walls (Figure 8B).
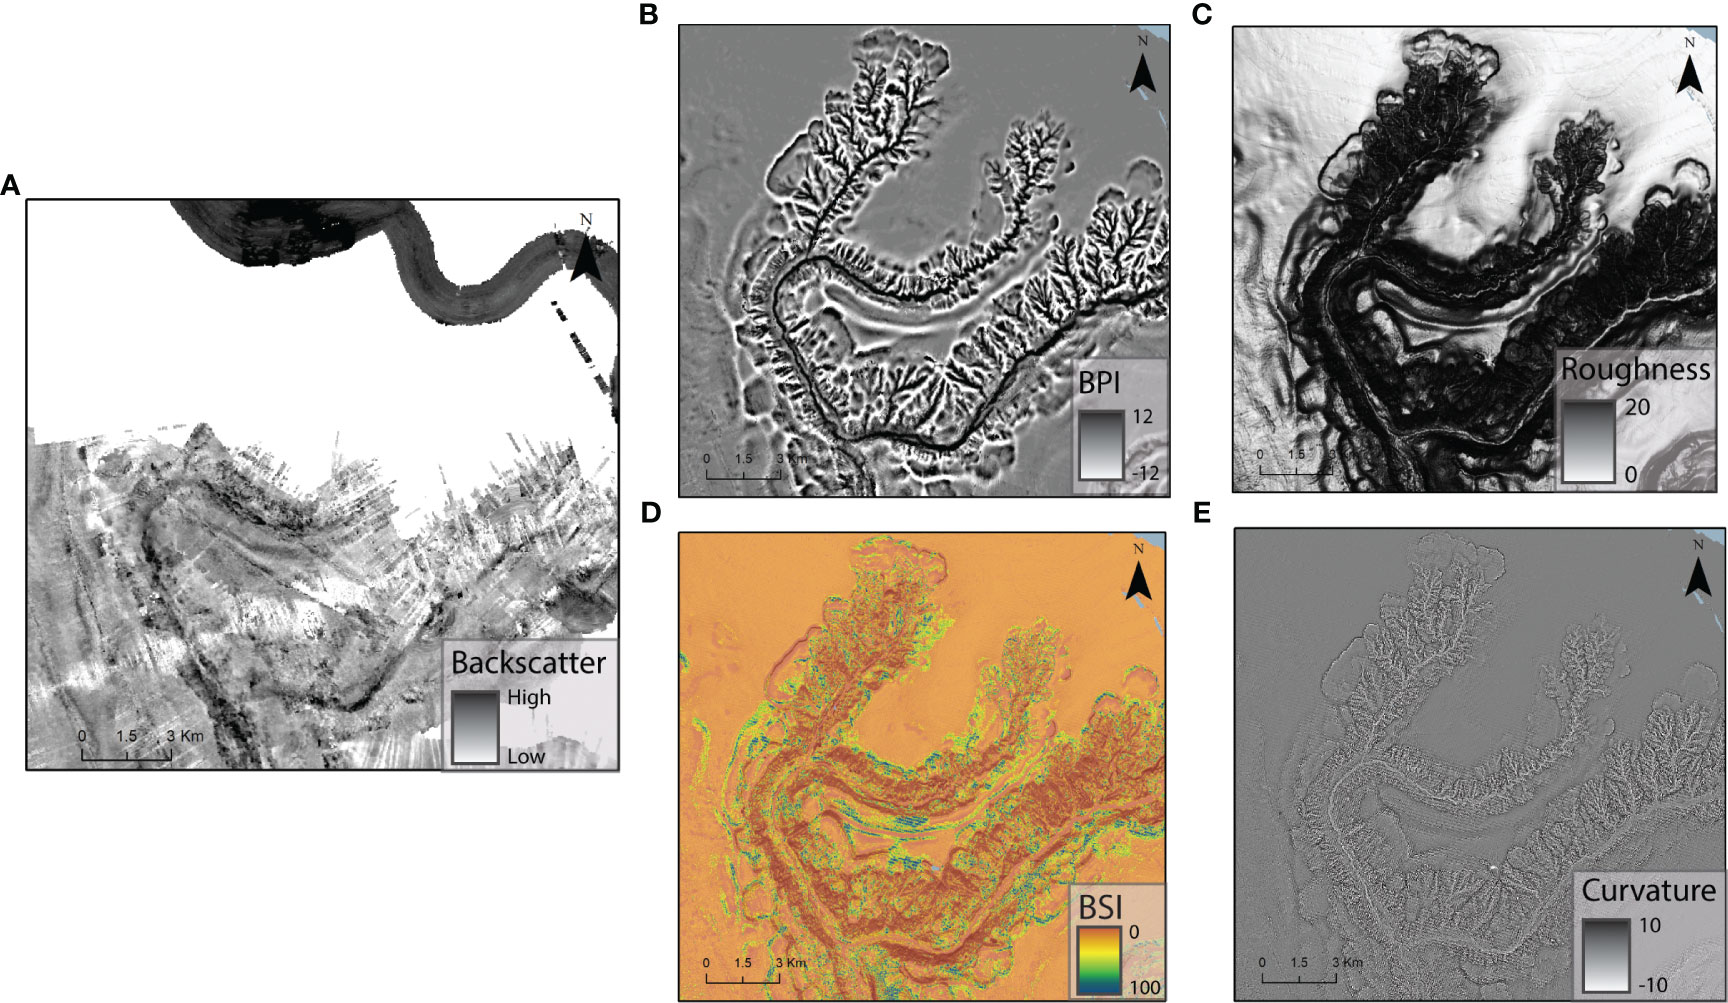
Figure 7 Bathymetry derivative layers of the eastern branch of Whittard Canyon. (A) Backscatter, (B) Bathymetric Position Index with a broad scale, (C) Roughness, (D) Bedrock Suitability Index, BSI ≥ 70 is illustrated by dark blue, BSI = 50 by green and 30 by yellow color, (E) Curvature. Location on Figure 1.
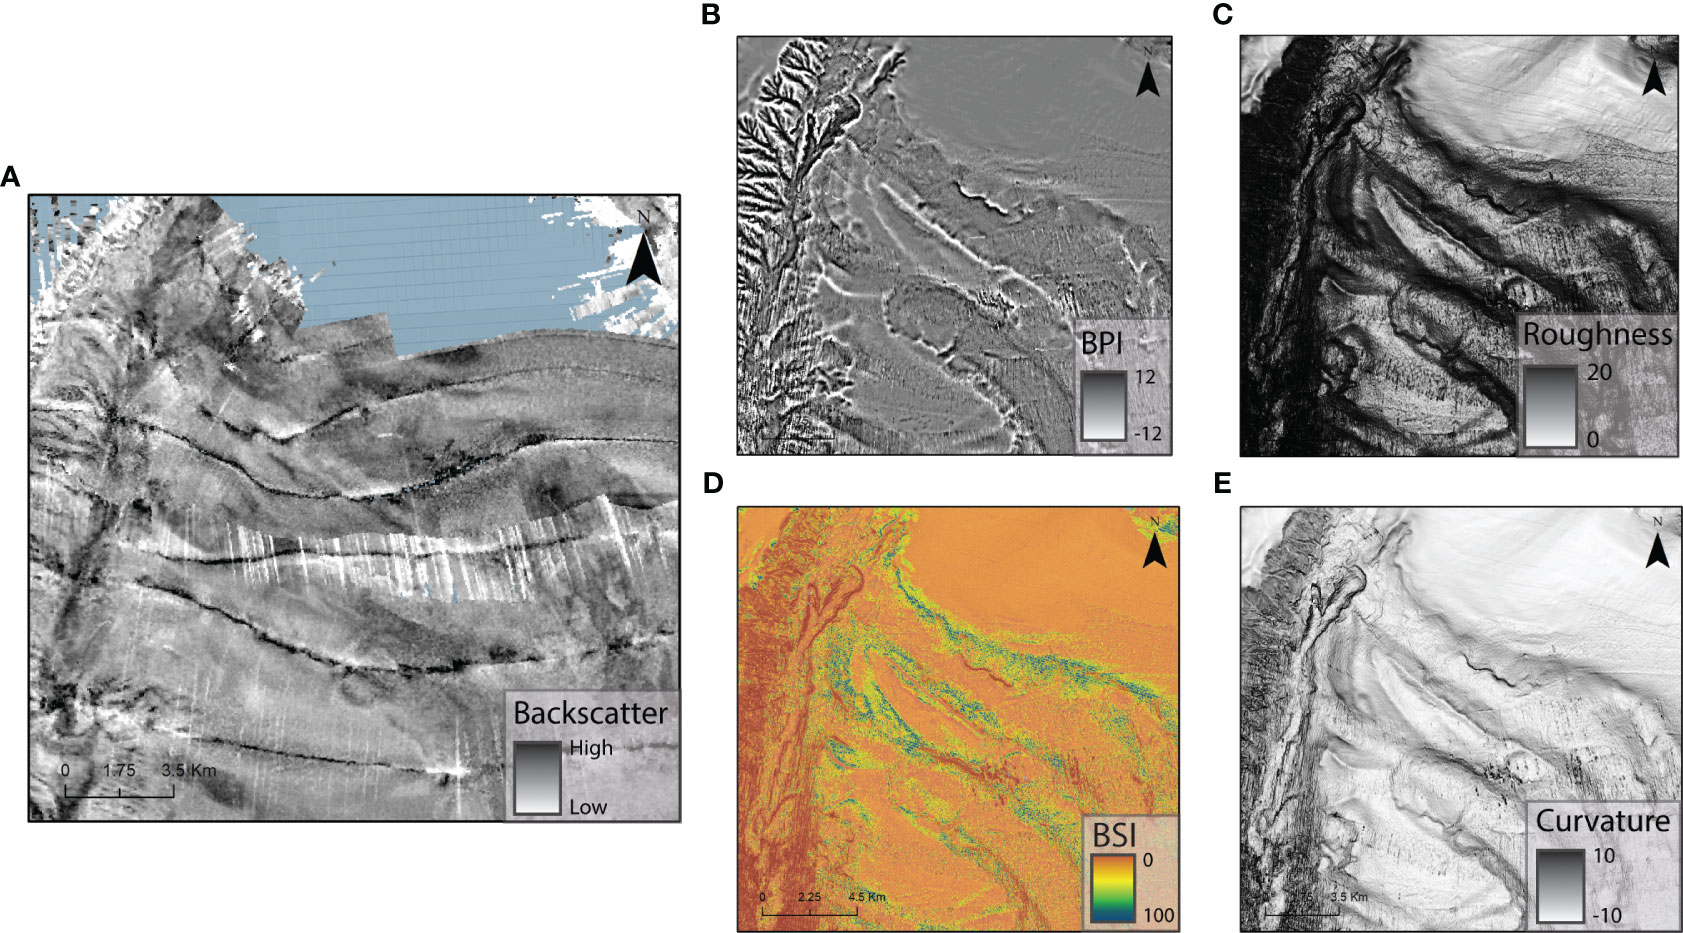
Figure 8 Bathymetry derivative layers in the western part of the Whittard Canyon. (A) Backscatter, (B) Bathymetric Position Index with a broad scale, (C) Roughness, (D) Bedrock Suitability Index, BSI ≥ 70 is illustrated by dark blue, BSI = 50 by green and 30 by yellow color, (E) Curvature. Location on Figure 1.
On the Goban Spur (Figure 9), the toes of escarpments, positive topographic reliefs at the edge of the Spur are the most probable locations for bedrock. These peculiar positive reliefs (Figure 9) present patches of high reflectivity that appear to correspond to clusters of high BSI and highlight areas affected by erosion processes (Figure 9A). These high reflectivity patches also display high BPI (Figure 9B), high roughness (Figure 9C), and positive curvature (Figure 9E), depicting a topographically high and heterogeneous submarine relief. It must be noted that the bathymetric data used for the western part of Goban Spur in this study have a 100-m resolution and the noise has been reduced using the standard deviation method described in the methodology (Figure 6).
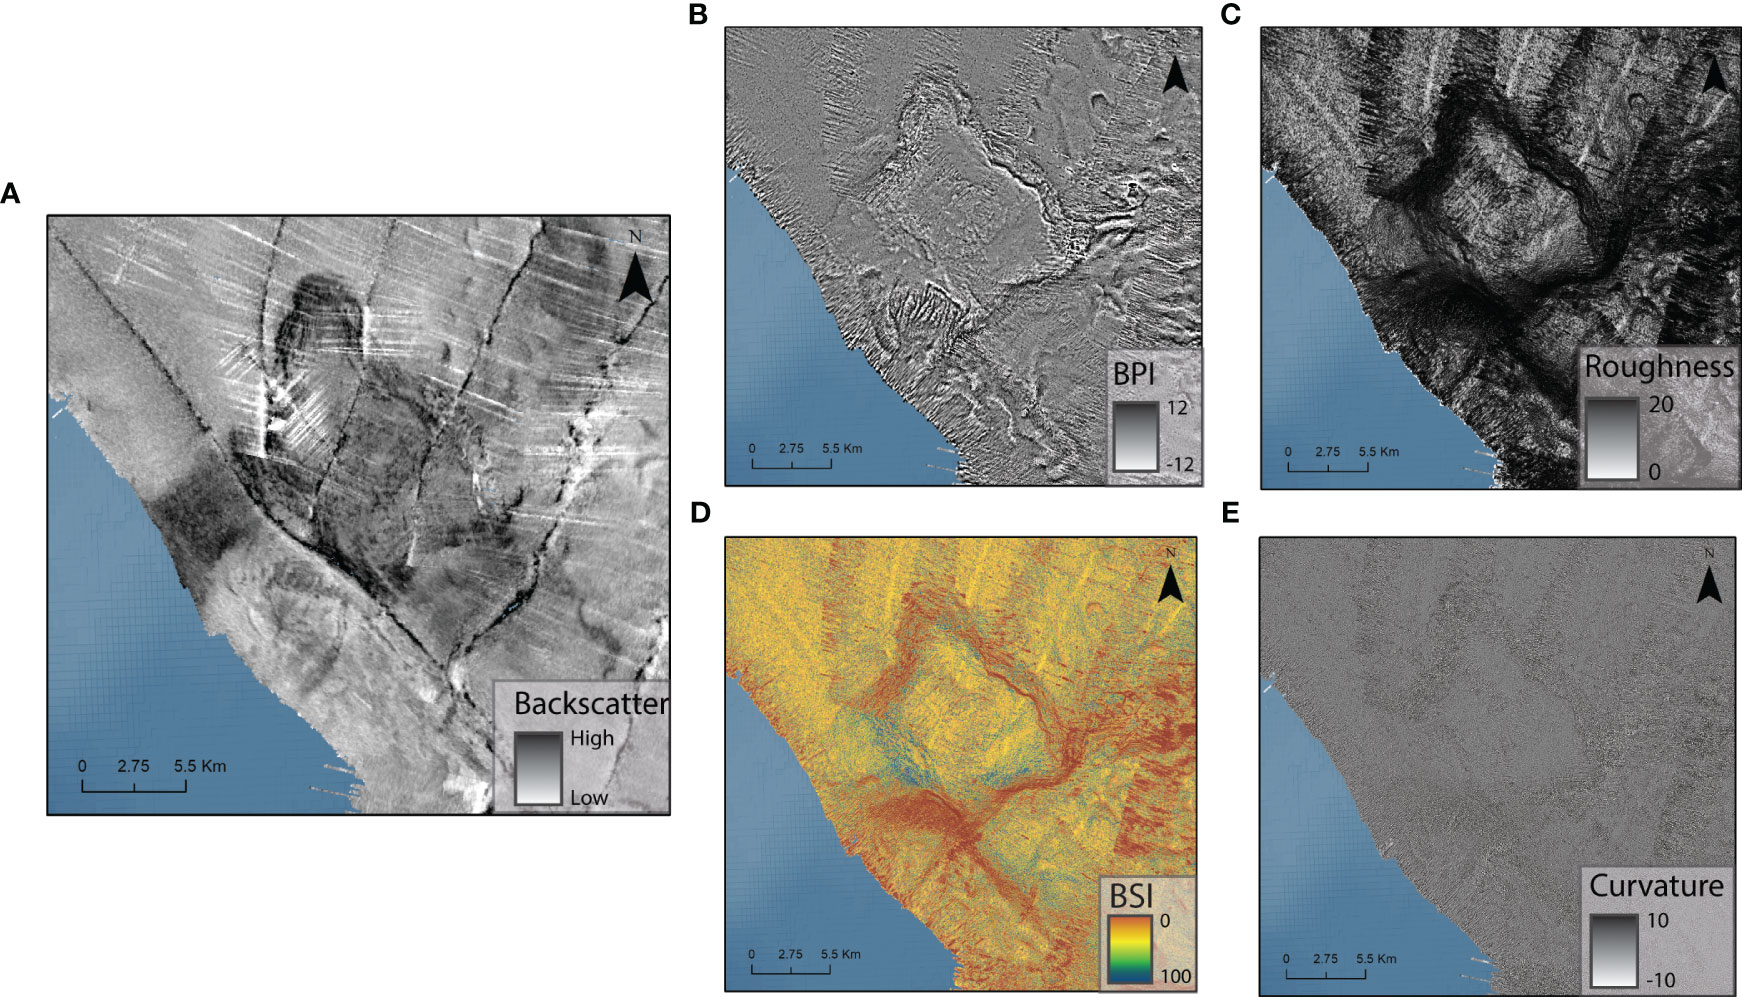
Figure 9 Bathymetry derivative layers of a topographic high on the Goban Spur. (A) Backscatter, (B) Bathymetric Position Index with a broad scale, (C) Roughness, (D) Bedrock Suitability Index, BSI ≥ 70 is illustrated by dark blue, BSI = 50 by green and 30 by yellow color, (E) Curvature. Location on Figure 1.
The Porcupine Bank is separated from the Porcupine Abyssal Plain by a steep escarpment and is incised by gullies, deep canyons, and failure scars. On the southern part of the Porcupine Bank margin (Figure 10), the highest suitable/probable bedrock (Figure 10D) is located at the toe of the Porcupine Bank escarpment and at the edge of the margin (Figures 10A, B), as well as on the positive reliefs related to failure scars and to mass wasting movements and on topographic highs and lows due to seabed heterogeneity originated from slides, flank collapse, edge destabilization, and gully erosion. This heterogeneity can be seen not only in the high roughness and rugosity (here, on the zoomed area roughness ≈ 11 and rugosity ≈ 3) but also with the positive high BPI (fine scale: 1 and broad scale: 2) that emphasizes the bedrock suitable occurrence on topographic highs. A high reflectivity can be observed on these heavily affected by erosion reliefs (Figure 10A), highlighting the potential for bedrock location as it could imply hard substrate. It must be noted that the bathymetric data bordering the Porcupine Bank area suffers from poor resolution and left many holes in the interpolation of the BSI.
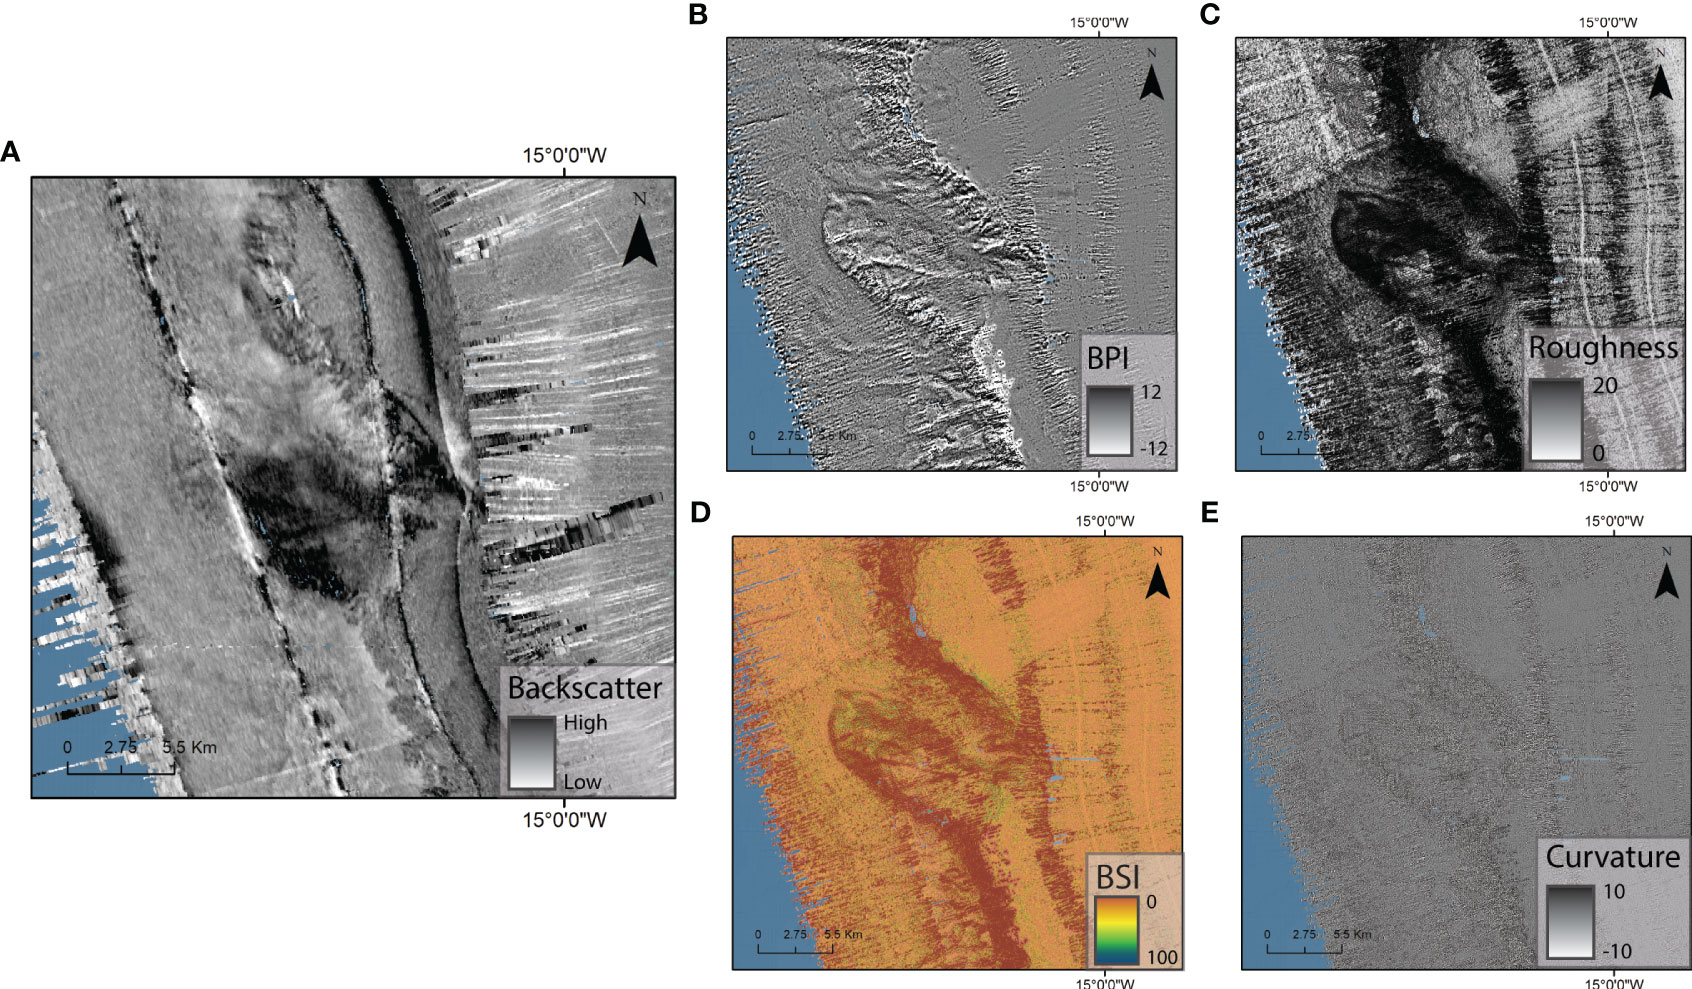
Figure 10 Bathymetry derivative layers of the south part of the Porcupine Bank slope. (A) Backscatter, (B) Bathymetric Position Index with a broad scale, (C) Roughness, (D) Bedrock Suitability Index, BSI ≥ 70 is illustrated by dark blue, BSI = 50 by green and 30 by yellow color, (E) Curvature. Location on Figure 1.
The northern part of the margin is dominated by the northern slope of the Porcupine Bank followed in the north by the eastern Rockall Trough margin connected to the Irish western shelf (Figure 1). It is incised by numerous blind canyons that connect the upper bank with the Rockall Trough in addition to failure scarps and gullies. The same behavior of BSI as observed previously on the South Porcupine Bank can be observed here. The highest BSI is found with geomorphological features like canyons flanks, head, scarp failures, and escarpments (Figure 11). In contrast, the gentle slope of the bank and the talweg of the blind canyons affecting the margin seem to depict lower BSI (Figure 11). By looking closely at the behavior of the terrain parameters of these features (zoom on a canyon Figure 11), the high BSI (>70) corresponds to a moderate curvature (0.5) and gradient (12˚), the moderately high roughness (13 and 4 respectively) indicates terrain heterogeneity (Figure 7C), and the positive broad-scale BPI (2) indicates topographic features higher than the surrounding area, corresponding to either the scarps/flanks and edges of the canyon or mass wasted material originated from these features.
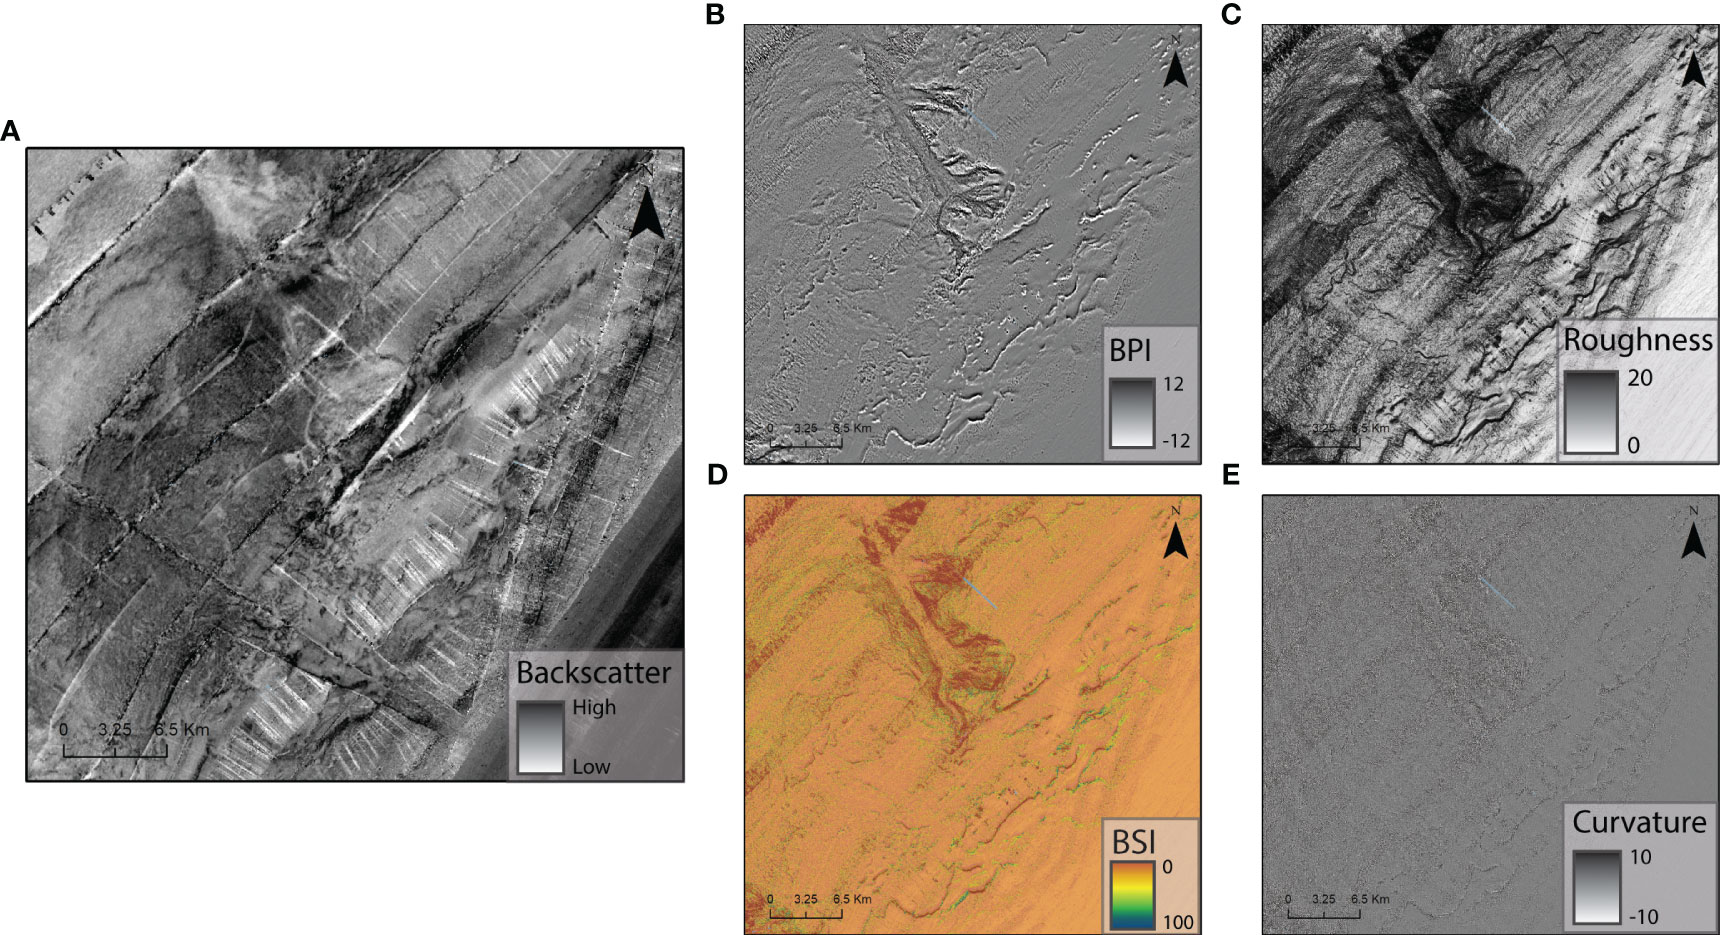
Figure 11 Bathymetry derivative layers of a canyon affecting the north part of the Porcupine Bank slope. (A) Backscatter, (B) broad-scale Bathymetric Position Index, (C) Roughness, (D) Bedrock Suitability Index, BSI ≥ 70 is illustrated by dark blue, BSI = 50 by green and 30 by yellow color, (E) Curvature. Location on Figure 1.
The Rockall Bank, and particularly the Fangorn High, reveals high reliefs’ round features (Figure 12) with a high reflectivity suggestive of hard substratum (Figure 12A). The high reflectivity also coincides with high roughness (Figure 12C), describing the terrain heterogeneity and positive BPI resulting from these features (Figure 12B), which are highlighted by high bedrock suitability index clusters (Figure 12D).
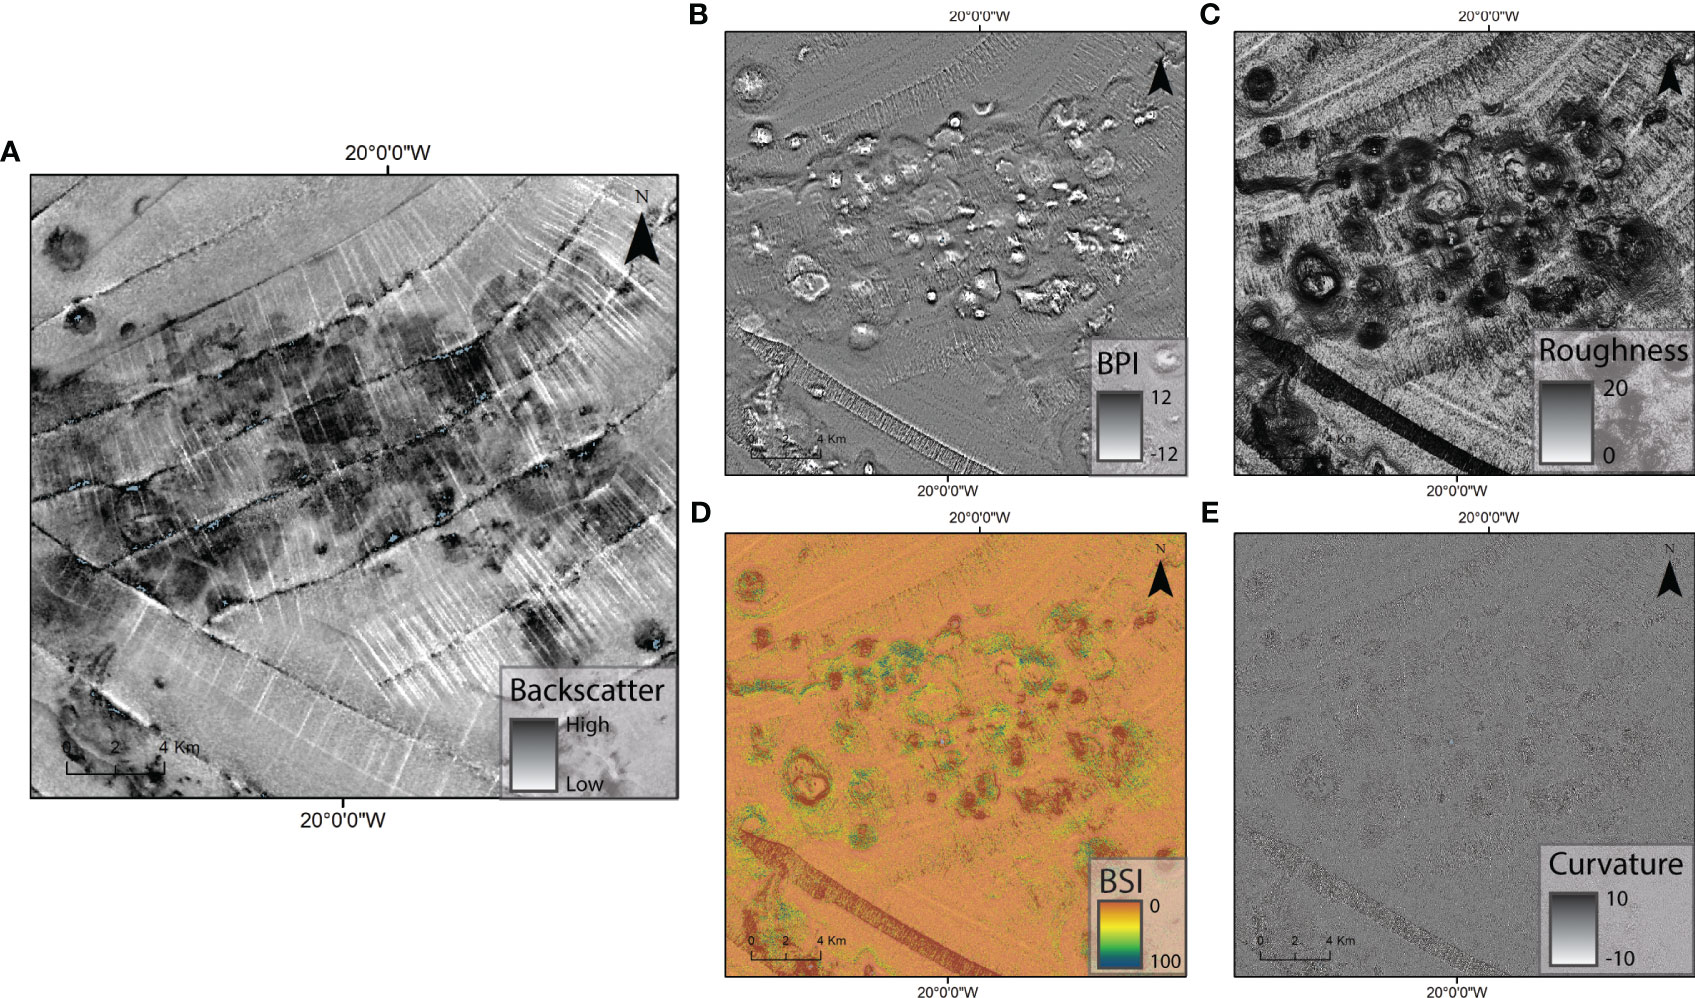
Figure 12 Bathymetry derivative layers of the Fangorn High. (A) Backscatter, (B) Bathymetric Position Index with a broad scale, (C) Roughness, (D) Bedrock Suitability Index, BSI ≥ 70 is illustrated by dark blue, BSI = 50 by green and 30 by yellow color, (E) Curvature. Location on Figure 1.
The Bedrock Suitability Index has improved bedrock mapping considering the scientific literature, by linking and aggregating multiple variables extracted from direct video observations into a single index. Accordingly, the BSI mapping allows, at a regional scale, us to indicate potential hard substratum occurrence along the ICM (Figure 6). Here, according to the PCA test (Figure 2), the parameters that seem to be descriptors of bedrock, for this model, in deep submarine settings are as follows: roughness, rugosity, slope, curvature, and BPI. The general high roughness and rugosity suggests that outcrops can be observed on the heterogeneous terrain. It seems to agree with previous mesoscale studies about hard substrate mapping using these parameters (Gratwicke and Speight, 2005; Wilson M. F. J. et al., 2007; Wilson S. K. et al., 2007; Purkis et al., 2008; Dunn and Halpin, 2009). The high BPI indicates that this terrain heterogeneity is often associated with topographic highs and lows and is also a good indicator for hard rocky terrain, conforming to studies using these parameters in species and habitat distribution modeling (Howell et al., 2016; Hu et al., 2020). Moreover, medium to high slope and curvature describing these outcrops also highlights the terrain heterogeneity favorable for flows and erosional processes that instigate the outcrops. The high reflectivity shown by the backscatter values also illustrates induration characteristics of potential bedrock occurrence.
The bedrock suitability index indicates areas sharing the same geophysical parameters as bedrock outcrops. Here, it also seems to emphasize features affected by erosion processes leading to outcropping. The pilot study site in the upper Porcupine Bank Canyon (Strachan, 2021) has shown good results for the applicability of the Bedrock Suitability index in highlighting bedrock occurrence on mainly cliffs, steep slopes, and rising from gentle slope outcrops. In this wider study, the main morphological features underlining potential bedrock, being classified with high bedrock suitability, are erosion zones associated with (1) downslope and along-slope transport associated with failure scarps, escarpments, canyons heads, talweg, or terraces; or (2) topographic features inherited from deep structural components of the margin such as positive and negative reliefs associated with fault walls.
In the eastern branch of the Whittard Canyon, retrogressive erosion linked to subsequent flows widens the canyons and leads to the instability of the canyon walls (Cunningham et al., 2005; Daly et al., 2018). Canyon development incising the Porcupine Bank has been associated with slope failure (O’Reilly, 2022). Along the Rockall Trough margin, bedrock exposed by multiple slope failure events linked to seismicity have been described (Sacchetti et al., 2011; O’Sullivan et al., 2020; O’Reilly, 2022). These instabilities and erosive processes may lead to an unveiling of the bedrock as the younger sedimentary and more unstable and unconsolidated succession covering is swept away.
In addition, the relict canyon talwegs shown here as potential bedrock location agree with Cunningham et al. (2005)’s observations on the relict canyons implying sub-crop or coarse material with along-slope processes transporting finer sediments to the eastern canyon branches and accumulating coarser material (Figure 10). Moreover, previous studies showed, in the Southwest Approaches canyons, that turbidity currents, mainly in the upper part of the canyons, entail erosion and incisions of the canyon floors (Zaragosi et al., 2000; Cunningham et al., 2005; Bourillet et al., 2006). These active downslope processes infer active erosion within the upper canyons. Here, these erosion processes are highlighted by high suitability for bedrock to occur in the canyon’s head, either in Whittard Canyon or on the northern and southern Porcupine Bank canyons (Figures 7–9).
Large-scale sediment slumps and block failure (Leynaud et al., 2009; Carter et al., 2018) appear to be direct erosion processes affecting the Whittard Canyon walls as well as the Rockall Bank and the northern Porcupine Bank (Faugeres et al., 1981; Elliott et al., 2006; Georgiopoulou et al., 2014). These processes are highlighted here by areas of high BSI overprinting on headwall scar locations and parts of canyon walls (Figures 5A, B, 9).
On the Fangorn High (Figure 12), the round-shaped features underlining potential outcrops might be related to mound constructions or volcanism (Barton and White, 1997; Stoker et al., 2012, CE21010 cruise). The topographic features highlighted by clusters of high suitability for bedrock occurrence in Goban Spur (Figure 11) seem to be related to the deep fault network affecting the southern part of the ICM.
Underlying faults modeling the ICM play a crucial part in the general morphology of this deep offshore territory (Figure 13). The Goban Spur and the Southwest Approaches, which are particularly affected by a deep fault network, display morphological features shaped by the fault scarps like escarpments associated with topographic high and lows. This connection between the deep structure of the margin and its geomorphology can also be observed on the bedrock probability occurrence map (Figures 13A, B).
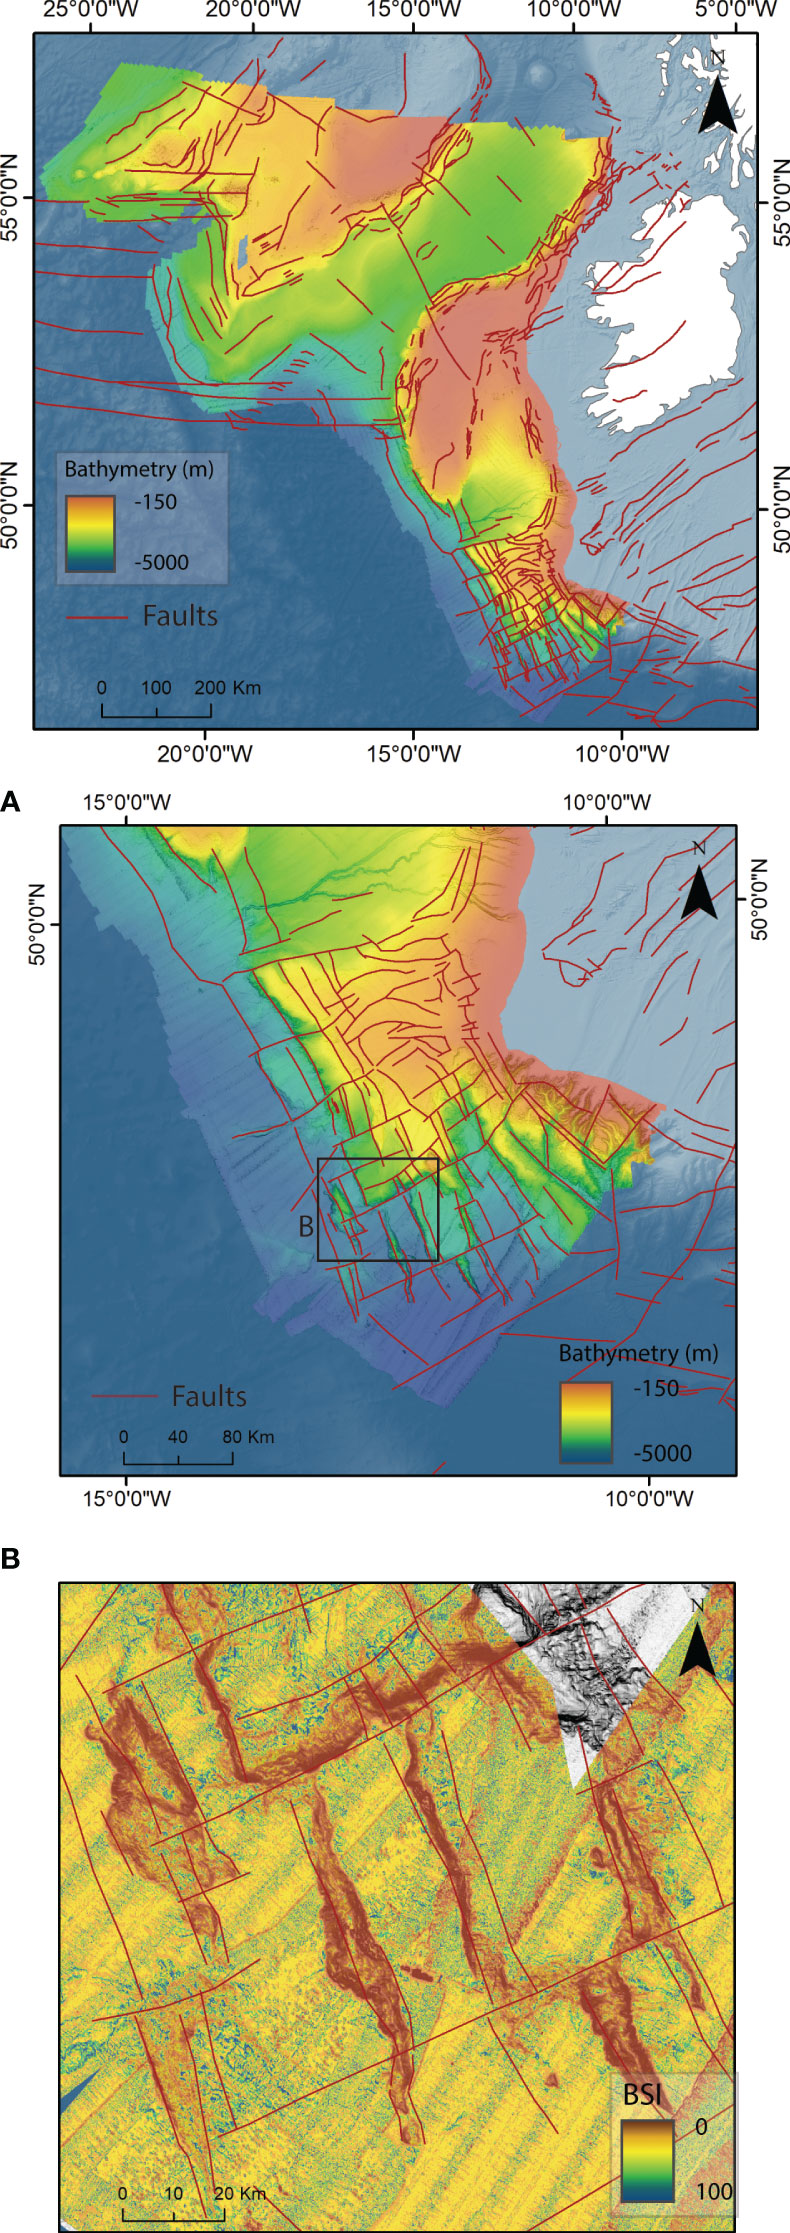
Figure 13 Structural settings of ICM (faults in red, personal communication from University College Dublin Fault Group Analysis). Zoom on (A) Southern Irish continental margin, (B) Goban Spur faults and BSI (BSI ≥ 70 is illustrated by dark blue, BSI = 50 by green and 30 by yellow color).
On the northern part of Goban Spur, two conjugated sets of faults with 140° and 50° trend deeply affect the area (Figure 13A). The faults with 140° trend seem to mark escarpment slope toes. Indeed, the layout of the faults determines a limit between high BSI and very high BSI areas (Figure 13B). This can be observed on most fault scarps on the southern Goban Spur, creating a pattern of semi-horst and graben with preferential erosive and outcropping surfaces. The fault layout seems to correspond to the limit of high BSI clusters (Figure 13B). In Figure 13B, clusters of high suitability are located preferentially at the edge and toe of the slope of steep escarpments, as well as on the topographically disturbed seabed. This reinforces the confidence in BSI areas that overlay fault locations. Moreover, as hard surfaces are preferential substrates for important organisms such as cold-water corals, the erosion features and outcrops created by fault scarps create preferential environments to develop deep sea habitats.
Bedrock or rock boulders can provide excellent habitat for cold-water coral reefs or act as a hard substrate for them to grow over and encompass other species’ important assemblages (Gratwicke and Speight, 2005; Wilson SK et al., 2007; Purkis et al., 2008; Dunn and Halpin, 2009). Indeed, hard substratum seems to be a crucial parameter in species distribution and habitat mapping studies in warm provinces (Caddy, 2007; Casoli et al., 2019; Hu et al., 2020; Keenan et al., 2022), in Arctic to Subarctic regions (e.g., coastal northern Norway: Jonsson et al., 2004; Dunlop et al., 2020), in shallower settings like circa-littoral (e.g., Basque continental shelf: Galparsoro et al., 2015), or in deeper settings like continental slopes (Wilson M. F. J. et al., 2007). In particular, Wilson SK et al. (2007) and Dunn and Halpin (2009) showed with observations that cold-water coral reef habitat and other species assemblages were correlated with rugosity. Cliffs and vertical walls on complex geomorphologic features are favorable to cold-water reef development (Flach, 2003; Robert et al., 2017; Robert et al., 2020; Appah et al., 2021; O’Reilly, 2022).
Here, different areas seem to be favorable for rocky substrate outcropping, especially where along-slope processes are active (presumably bedrock is exposed through erosion at canyon heads, escarpments, etc.) and high BSI occurrence can be observed. Up to 20% of potential occurrences of bedrock can be concentrated in these areas, compared to 5% on the relatively flat seafloor across the margin (Table 2). Eight percent can be found in canyon areas (Table 2). It can be noted that 20% correspond to tectonically induced topographic relief (e.g., in the Goban Spur area, Table 2, Figure 14), located in deep to very deep domains (<−2000 mbsl). It could coincide with deep habitat and rich species diversity, such as benthic communities, crustaceans, echinoderms, polychaetes, as observed on the Goban Spur area at <−2000 mbsl (Flach et al., 1998; Flach and de Bruin, 1999), and particularly sponges, cnidarians, and gorgonian observed on rocky substrates (Tyler and Zibrowius, 1992). Consequently, deep rocky areas located on the Goban Spur region could encompass a large variety of species and, thus, biodiversity hotspots could also be linked to the deep structure of the ICM.
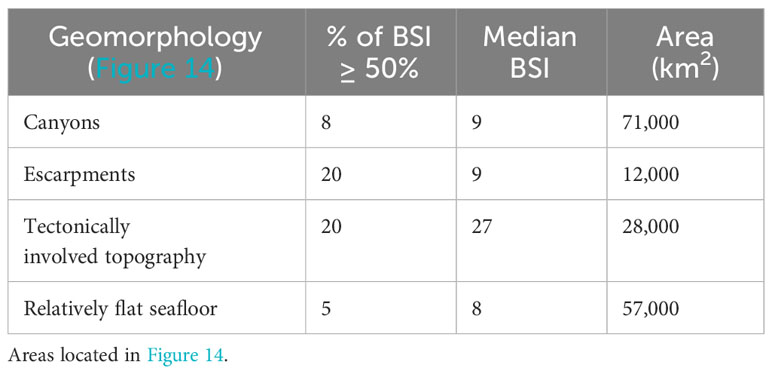
Table 2 % of BSI ≥ 50% and median BSI of areas presenting morphologies.
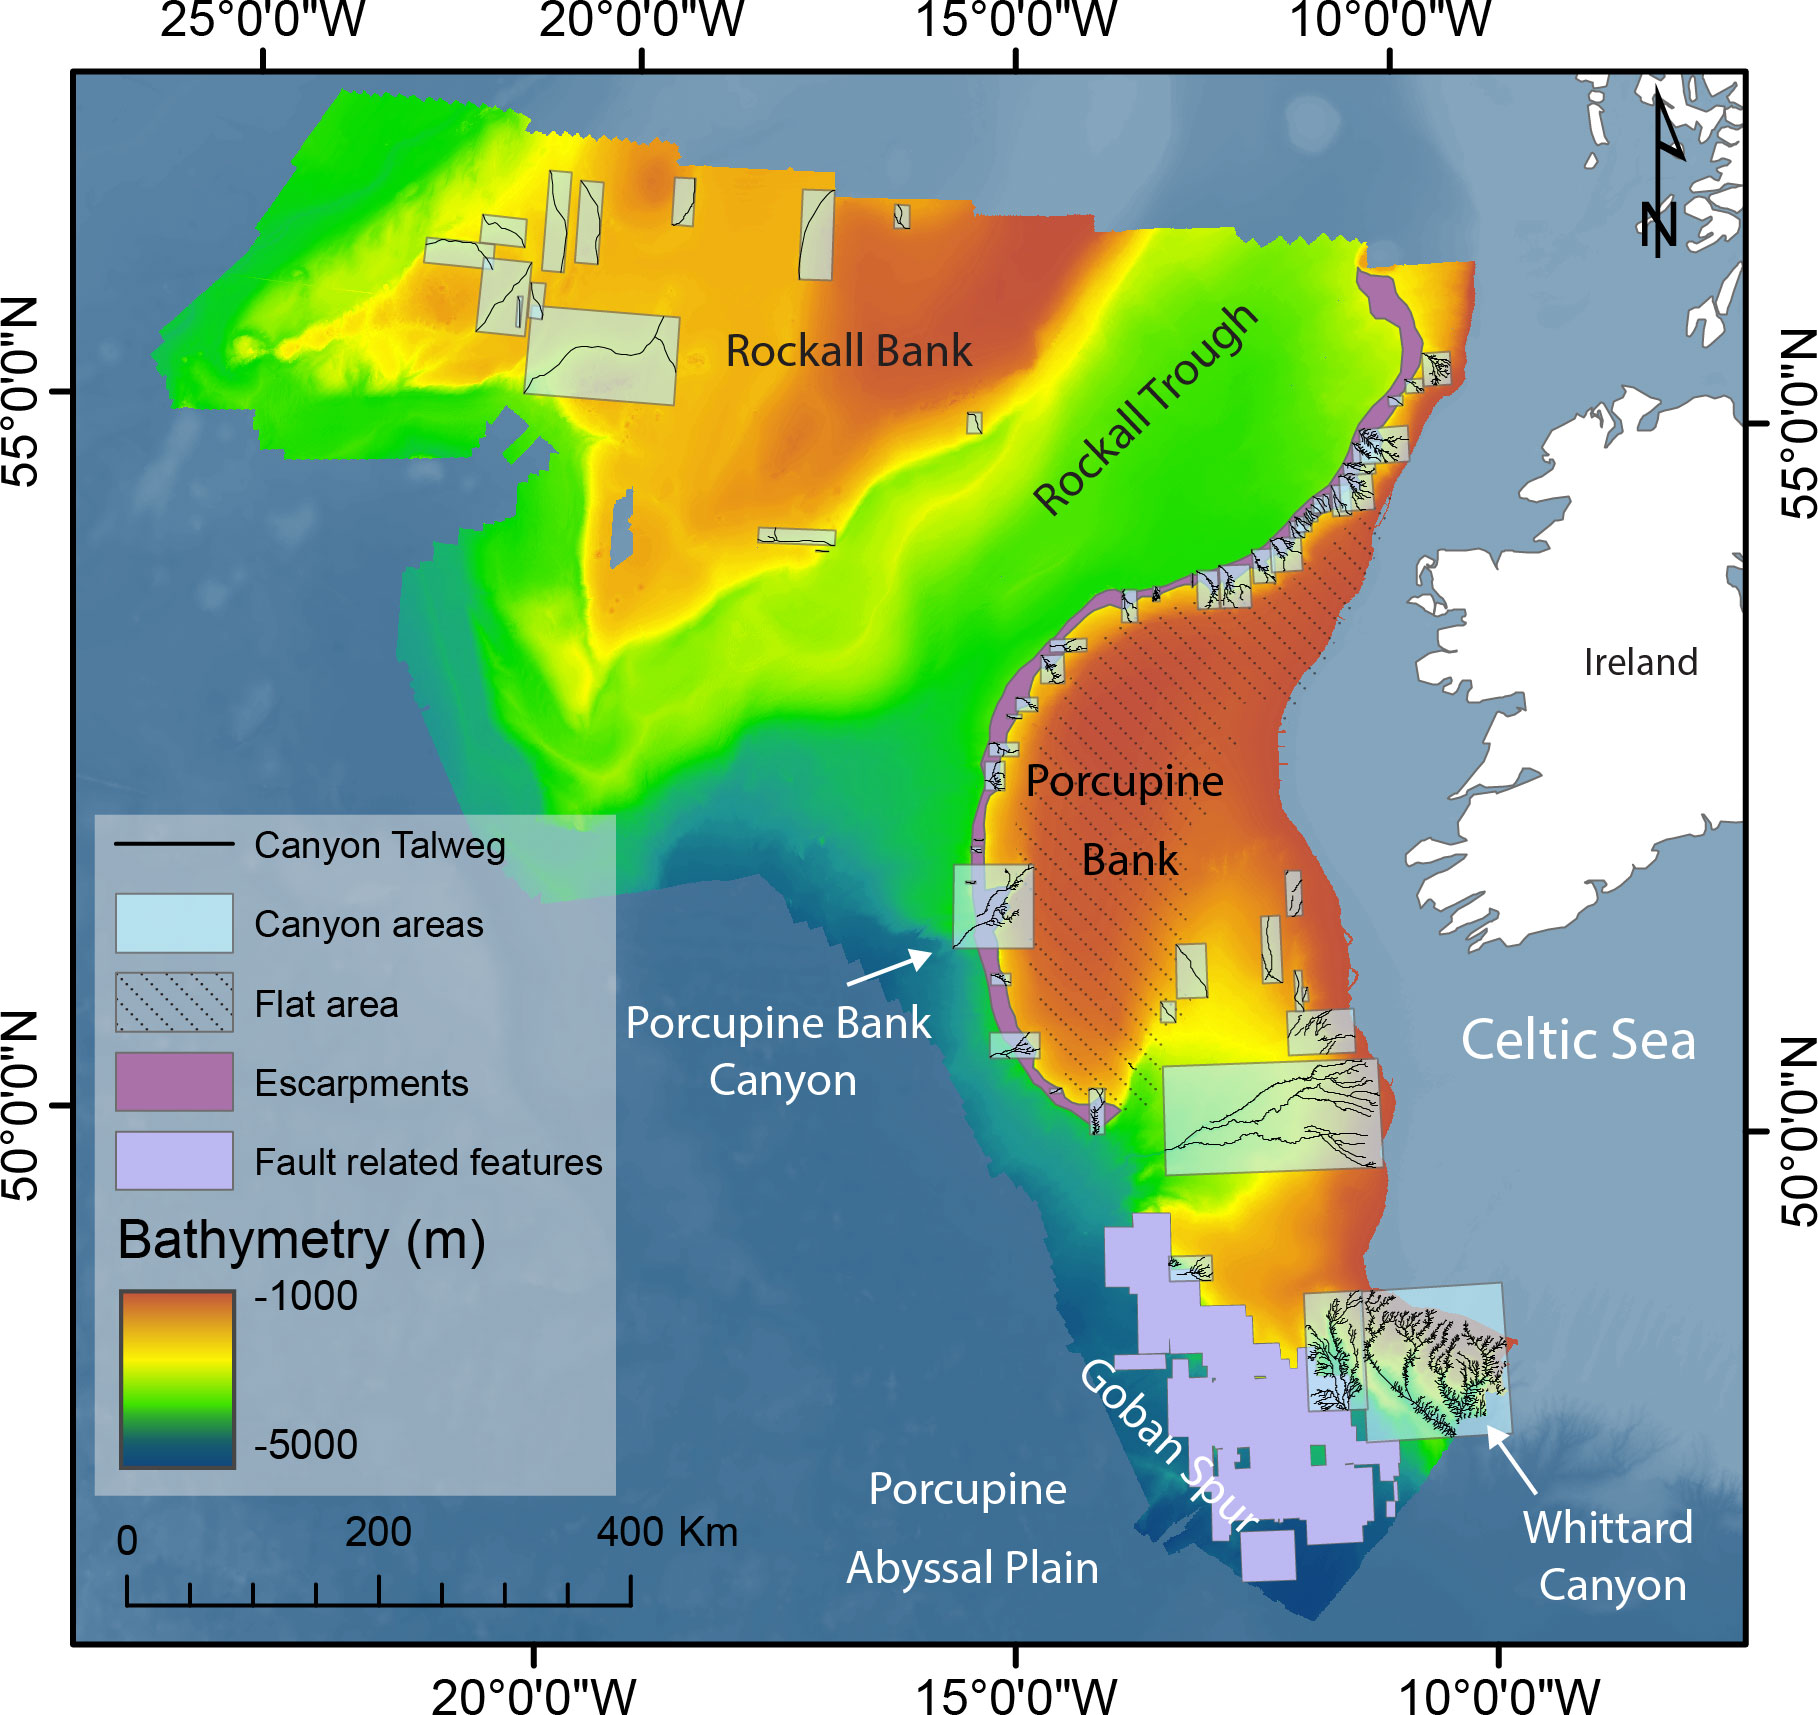
Figure 14 Location of areas described in Table 2. Canyons and fault-related feature areas have been delimited using “feature envelope to polygon” tool in ArcMap based on canyon talweg and fault layout. Canyon talweg layout is from Dorschel et al. (2010).
Accordingly, per Table 2 and BSI mapping, potentially more than 5,000 km2 (e.g., canyon area) could be favorable areas for habitat development and species like cold-water coral reefs on the ICM. As a result, bedrock mapping could identify suitable environments for reefs through morphometric properties and BSI establishment all along the ICM. Spatial distribution of hard substrate appears to be crucial to increase precision in species mapping and could help in habitat protection management.
The high potential for bedrock to occur in canyons, escarpments, or positive topographical features highlights both a preferential substratum for benthic species and locations with enhanced bottom currents. Future research could investigate whether BSI can be applied to map potential areas for benthic and sessile organisms that require both hard substratum and enhanced hydrodynamism.
This model could help identify probable bedrock locations at the regional scale (≥ 400,000 km2) up to 25-m resolution and cover huge areas with less precision but good indication. This model is GIS-based and time-efficient, requiring less computer resource usage despite the huge dataset (25-m-resolution grids on more than 400,000 km2).
Nevertheless, the model has its limitations. The intrinsic restrictions of the ROV limit the acquisition of videos in settings deeper than −3,000 m. In addition, video acquisition data on deep vertical and steep walls are scarce. This is reflected on the BSI as a huge part of vertical walls are illustrated with low BSI and seem underestimated as bedrock outcrop potential locations (Figures 5, 6), and because vertical walls can host a variety of habitats, there is no clear delineation between the bedrock occurrence of the vertical wall and sediment zonation. This could be resolved by a new video dataset or ground-truthing points, dedicated on vertical wall stratigraphy mapping. Likewise, there are constraints due to the quality of bathymetric and backscatter data with depth (more noise and reduced beam accuracy in progressively deeper water) (Figures 5, 6); imperfect integration of either position, orientation, or sound speed information can generate false seafloor roughness elements that overprint true geomorphology as demonstrated in Clarke (2018). In addition, there are some caveats when using uncalibrated backscatter values, especially considering different surveys and sources. These concerns were addressed using the Focal statistic tool to reduce the influence of noise in the dataset; standard deviation was multiplied with the original BSI map to give less weight to surfaces with high variability (displaying noisy bathymetry in the dataset) and more weight to low-variability areas (less noise in the dataset).
Morphologically significant rugosity may appear and disappear within a terrain, reflecting the changing imaging geometry rather than the real spatial distribution of natural morphology (Clarke, 2018). The general influence on the BSI leads to areas with more noise like the Feni drift/abyssal plain area, ≤3000-m-depth areas, and less noise in areas with shallower distinct morphological structures like the Whittard Canyon, Fangorn High, or north Porcupine Bank. Another approach would be to apply this model to other regional areas that were covered by large ROV campaigns or to lessen the bathymetric noise with further cleaning.
With the study of more than 150 video transects along the continental margin, this work allowed the development of a bedrock suitability index mapping of more than 400,000 km2, showing the most suitable location for hard substrate. Through geomorphometric analysis, this study reveals the relevant terrain parameters depicting suitable bedrock outcrop locations on the ICM. These parameters are roughness, rugosity, curvature, slope, and the BPI. These parameters indicate that bedrock usually occurs on a heterogeneous, sloped seabed. Furthermore, geomorphological features like canyons, scarps, gullies, and terraces illustrate erosional processes for bedrock occurrence, particularly in areas like the Whittard Canyon and Porcupine Bank Canyon. These outcrop locations and morphology can also be determined with the complex history and deep structure of the ICM, especially in the Goban Spur region where fault-related reliefs seem to be favorable domains for bedrock outcropping. Highlighting hard substrate locations at the regional scale could help with marine species protection management as hard substratum appears to be a crucial parameter in habitat development. Wide-scale mapping could also allow characterization of offshore basins based on their surface exposure and thereby allow for an enhanced understanding of the geology of the ICM.
The raw data supporting the conclusions of this article will be made available by the authors, without undue reservation.
AR: Conceptualization, Methodology, Software, Writing – original draft. AW: Writing – review & editing, Conceptualization, Funding acquisition. RS: Writing – review & editing. PM: Writing – review & editing. RU: Writing – review & editing. AL: Conceptualization, Funding acquisition, Investigation, Writing – review & editing.
The author(s) declare financial support was received for the research, authorship, and/or publication of this article. AR is funded by a Petroleum Infrastructure Programme (PIPCO) grant.
The MBES data are from INFOMAR that is Ireland’s national seabed mapping programme funded by the Department of Environment, Climate and Communications (DECC). It is jointly managed by Geological Survey Ireland and Marine Institute and is tasked with fully mapping Ireland’s territorial waters for the sustainable development of Ireland’s marine resource. INFOMAR will continue until the end of 2026, enabling effective management and accelerated growth to support Harnessing Our Ocean Wealth. We would like to thank the Marine Institute for the support and the access to SeaRover videos. The SeaRover cruises were commissioned by the Marine Institute in partnership with the Geological Survey of Ireland (GSI), the National Parks and Wildlife Service (NPWS), funded by the European Maritime and Fisheries Fund (EMFF), and coordinated and led by INFOMAR (Integrated Mapping for the Sustainable Development of Ireland’s Marine Resources). We thank GEBCO for the GEBCO Grid 2022 used as background for our maps (www.gebco.net). We express thanks to Prof. Louise Allcock from University of Galway for letting us look at CE21010 cruises ROV video for assessment. Similarly, we would like to thank the University College Dublin Fault Group Analysis for communication of the Irish Continental Margin fault layout. We want to thank the reviewers for their insightful comments.
Author RS was employed by Green Rebel, Ltd.
The remaining authors declare that the research was conducted in the absence of any commercial or financial relationships that could be construed as a potential conflict of interest.
All claims expressed in this article are solely those of the authors and do not necessarily represent those of their affiliated organizations, or those of the publisher, the editors and the reviewers. Any product that may be evaluated in this article, or claim that may be made by its manufacturer, is not guaranteed or endorsed by the publisher.
The Supplementary Material for this article can be found online at: https://www.frontiersin.org/articles/10.3389/fmars.2023.1258070/full#supplementary-material
Amaro T., Huvenne V. A. I., Allcock A. L., Aslam T., Davies J. S., Danovaro R., et al. (2016). The Whittard Canyon – A case study of submarine canyon processes. Prog. Oceanogr. 146, 38–57. doi: 10.1016/j.pocean.2016.06.003
Appah J., Lynch S., Lim A., O’Riordan R., O’Reilly L., Oliveira L., et al. (2021). Health Screening of the Reef Forming Scleractinian Cold-Water Corals Lophelia pertusa and Madrepora oculata in a Remote Submarine Canyon on the European Continental Margin, NE Atlantic. doi: 10.20944/preprints202105.0538.v1
Arosio R., Hobley B., Wheeler A. J., Sacchetti F., Conti L. A., Furey T., et al. (2023). Fully convolutional neural networks applied to large-scale marine morphology mapping. Front. Mar. Sci. 10. doi: 10.3389/fmars.2023.1228867
Auffret G., Auzende J.-M., Cousin M., Coutelle A., Dobson M., Geoghegan M., et al. (1987). Géologie des Escarpements de Porcupine et de Goban (N.E. Atlantique). Résultats de la campagne de plongée CYAPORC. Comptes. Rendus. Acad. Sci. Ser. II 304, 1003–1008.
Backus S. B., Onishi R., Bocklund A., Berg A., Contreras E. D., Parness A. (2020). Design and testing of the JPL-Nautilus Gripper for deep-ocean geological sampling. J. Field Robot. 37, 972–986. doi: 10.1002/rob.21934
Barton A. J., White R. S. (1997). Volcanism on the Rockall continental margin. J. Geol. Soc 154, 531–536. doi: 10.1144/gsjgs.154.3.0531
Bourillet J.-F., Zaragosi S., Mulder T. (2006). The French Atlantic margin and deep-sea submarine systems. Geo-Mar. Lett. 26, 311–315. doi: 10.1007/s00367-006-0042-2
Brown C. J., Beaudoin J., Brissette M., Gazzola V. (2019). Multispectral multibeam echo sounder backscatter as a tool for improved seafloor characterization. Geosciences 9, 126. doi: 10.3390/geosciences9030126
Brown L., Green S., Stewart H., Diesing M., Downie A.-L., Cooper R., et al. (2017). Semi-automated mapping of rock in the Irish Sea, Minches, western Scotland and Scottish continental shelf. doi: 10.13140/RG.2.2.28746.47044
Buhl-Mortensen L., Buhl-Mortensen P., Dolan M. J. F., Gonzalez-Mirelis G. (2015). Habitat mapping as a tool for conservation and sustainable use of marine resources: Some perspectives from the MAREANO Programme, Norway. J. Sea. Res. MeshAtlantic.: Mapp. Atlantic. Area. Seabed. Habitats. Better. Mar. Manage. 100, 46–61. doi: 10.1016/j.seares.2014.10.014
Caddy J. F. (2007). Marine habitat and cover: their importance for productive coastal fishery resources (Paris (France) UNESCO Pub).
Carter G. D. O., Huvenne V. A. I., Gales J. A., Lo Iacono C., Marsh L., Ougier-Simonin A., et al. (2018). Ongoing evolution of submarine canyon rockwalls; examples from the Whittard Canyon, Celtic Margin (NE Atlantic). Prog. Oceanogr. Bridging. Gap Between. Shallow. Deep. Oceans.: Key. Role. Submarine. Canyons. 169, 79–88. doi: 10.1016/j.pocean.2018.02.001
Casoli E., Bonifazi A., Ardizzone G., Gravina M. F., Russo G. F., Sandulli R., et al. (2019). Comparative analysis of mollusc assemblages from different hard bottom habitats in the central tyrrhenian sea. Diversity 11, 74. doi: 10.3390/d11050074
Clarke H. (2018). The impact of acoustic imaging geometry on the fidelity of seabed bathymetric models. Geosciences 8, 109. doi: 10.3390/geosciences8040109
Copeland A., Edinger E., Devillers R., Bell T., LeBlanc P., Wroblewski J. (2013). Marine habitat mapping in support of Marine Protected Area management in a subarctic fjord: Gilbert Bay, Labrador, Canada. J. Coast. Conserv. 17, 225–237. doi: 10.1007/s11852-011-0172-1
Cunningham M. J., Hodgson S., Masson D. G., Parson L. M. (2005). An evaluation of along- and down-slope sediment transport processes between Goban Spur and Brenot Spur on the Celtic Margin of the Bay of Biscay. Sediment. Geol. Sediment. Gravity. Flows.: Recent Adv. Process. Field Anal. 179, 99–116. doi: 10.1016/j.sedgeo.2005.04.014
Daly E., Johnson M. P., Wilson A. M., Gerritsen H. D., Kiriakoulakis K., Allcock A. L., et al. (2018). Bottom trawling at Whittard Canyon: Evidence for seabed modification, trawl plumes and food source heterogeneity. Prog. Oceanogr. Bridging. Gap Between. Shallow. Deep. Oceans.: Key. Role. Submarine. Canyons. 169, 227–240. doi: 10.1016/j.pocean.2017.12.010
de Graciansky P. C., Poag C. W., et al. (1985). IInitial reports of the deep sea drilling project, 80 (U.S. Government Printing Office). doi: 10.2973/dsdp.proc.80.1985
Dolan M. F. J., Thorsnes T., Leth J., Al-Hamdani Z., Guinan J., Van Lancker V. (2012). Terrain characterization from bathymetry data at various resolutions in European waters – experiences and recommendations, NGU Report 2012.045 (Geological Survey of Norway, Trondheim, Norway).
Dorschel B., Wheeler A. J., Monteys X., Verbruggen K. (2010). Atlas of the deep-water seabed. doi: 10.1007/978-90-481-9376-9
Dunlop K., Harendza A., Plassen L., Keeley N. (2020). Southwest Approaches and Goban Spur, in: Atlas of the Deep-Water Seabed: Dorschel, Boris, Wheeler, Andrew J., Monteys, Xavier, Verbruggen, Koen (Eds.). Springer: Netherlands, 127–128. doi: 10.1007/978-90-481-9376-1_12
Dunn D. C., Halpin P. N. (2009). Rugosity-based regional modeling of hard-bottom habitat. Mar. Ecol. Prog. Ser. 377, 1–11. doi: 10.3354/meps07839
Elliott G. M., Shannon P. M., Haughton P. D. W., Praeg D., O’Reilly B. (2006). Mid- to Late Cenozoic canyon development on the eastern margin of the Rockall Trough, offshore Ireland. Mar. Geol. 229, 113–132. doi: 10.1016/j.margeo.2006.03.008
Fakiris E., Dimas X., Giannakopoulos V., Geraga M., Koutsikopoulos C., Ferentinos G., et al. (2023). Improved predictive modelling of Coralligenous formation in the Greek Seas incorporating large-scale, presence-absence, hydroacoustic data and oceanographic variables. Front. Mar. Sci. doi: 10.3389/fmars.2023.1117919
Faugeres J. C., Gonthier E., Grousset F., Poutiers J. (1981). The Feni Drift: The importance and meaning of slump deposits on the eastern slope of the Rockall Bank. Mar. Geol. 40, M49–M57. doi: 10.1016/0025-3227(81)90138-9
Flach E. C. (2003). “Factors controlling soft bottom macrofauna along and across european continental margins,” in Ocean margin systems. Eds. Wefer G., Billett D., Hebbeln D., Jørgensen B. B., Schlüter M., van Weering T. C. E. (Springer, Berlin, Heidelberg), 351–363. doi: 10.1007/978-3-662-05127-6_22
Flach E., de Bruin W. (1999). Diversity patterns in macrobenthos across a continental slope in the NE Atlantic. J. Sea. Res. 42, 303–323. doi: 10.1016/S1385-1101(99)00034-9
Flach E., Lavaleye M., de Stigter H., Thomsen L. (1998). Feeding types of the benthic community and particle transport across the slope of the N.W. Eur. Continental. margin. (Goban. Spur). Prog. Oceanogr. 42, 209–231. doi: 10.1016/S0079-6611(98)00035-4
Galili T. (2015). dendextend: an R package for visualizing, adjusting and comparing trees of hierarchical clustering. Bioinforma. Oxf. Engl. 31, 3718–3720. doi: 10.1093/bioinformatics/btv428
Galparsoro I., Rodríguez J. G., Menchaca I., Quincoces I., Garmendia J. M., Borja Á. (2015). Benthic habitat mapping on the Basque continental shelf (SE Bay of Biscay) and its application to the European Marine Strategy Framework Directive. J. Sea. Res. MeshAtlantic.: Mapp. Atlantic. Area. Seabed. Habitats. Better. Mar. Manage. 100, 70–76. doi: 10.1016/j.seares.2014.09.013
Gazis I.-Z., Schoening T., Alevizos E., Greinert J. (2018). Quantitative mapping and predictive modeling of Mn nodules’ distribution from hydroacoustic and optical AUV data linked by random forests machine learning. Biogeosciences 15, 7347–7377. doi: 10.5194/bg-15-7347-2018
Georgiopoulou A., Benetti S., Shannon P. M., Sacchetti F., Haughton P. D. W., Comas-Bru L., et al. (2014). “Comparison of mass wasting processes on the slopes of the rockall trough, northeast atlantic,” in Submarine mass movements and their consequences: 6th international symposium, advances in natural and technological hazards research. Eds. Krastel S., Behrmann J.-H., Völker D., Stipp M., Berndt C., Urgeles R., Chaytor J., Huhn K., Strasser M., Harbitz C. B. (Springer International Publishing, Cham), 471–480. doi: 10.1007/978-3-319-00972-8_42
GOTECH (2002). Report of the survey in Zone 3 of the Irish National Seabed Survey: Volume 1 describing the results and the methods used (Geological Survey of Ireland, Dublin).
Gratwicke B., Speight M. R. (2005). The relationship between fish species richness, abundance and habitat complexity in a range of shallow tropical marine habitats. J. Fish. Biol. 66, 650–667. doi: 10.1111/j.0022-1112.2005.00629.x
Greene H. G., Bizzarro J. J., O’Connell V. M., Brylinsky C. K. (2007). Construction of Digital Potential Marine Benthic Habitat Maps using a Coded Classification Scheme and its Application.
Hao H., Lei C., Wang L., Li W., Danyun O., Lijun W., et al. (2023). Using habitat classification and large-scale spatial planning model to identify environmental areas: A case study in the area of the Northwest Pacific Ocean. Mar. Policy 147, 105360. doi: 10.1016/j.marpol.2022.105360
Harris P. T., Baker E. K. (2012). “1 - why map benthic habitats?,” in Seafloor geomorphology as benthic habitat. Eds. Harris P. T., Baker E. K. (Elsevier, London), 3–22. doi: 10.1016/B978-0-12-385140-6.00001-3
Haughton P., Praeg D., Shannon P., Harrington G., Higgs K., Amy L., et al. (2005). First results from shallow stratigraphic boreholes on the eastern flank of the Rockall Basin, offshore western Ireland. Geol. Soc Lond. Pet. Geol. Conf. Ser. 6, 1077–1094. doi: 10.1144/0061077
Howell K.-L., Piechaud N., Downie A.-L., Kenny A. (2016). The distribution of deep-sea sponge aggregations in the North Atlantic and implications for their effective spatial management. Deep. Sea. Res. Part Oceanogr. Res. Pap. 115, 309–320. doi: 10.1016/j.dsr.2016.07.005
Hu Z., Hu J., Hu H., Zhou Y. (2020). Predictive habitat suitability modeling of deep-sea framework-forming scleractinian corals in the Gulf of Mexico. Sci. Total. Environ. 742, 140562. doi: 10.1016/j.scitotenv.2020.140562
Huvenne V. A. I., Wynn R. B., Gales J. A., et al. (2016) RRS James Cook Cruise 124-125-126 09 Aug-12 Sep 2016. CODEMAP2015: Habitat mapping and ROV vibrocorer trials around Whittard Canyon and Haig Fras. Available at: http://nora.nerc.ac.uk/id/eprint/512919/.
Ilich A. R., Brizzolara J. L., Grasty S. E., Gray J. W., Hommeyer M., Lembke C., et al. (2021). Integrating towed underwater video and multibeam acoustics for marine benthic habitat mapping and fish population estimation. Geosciences 11, 176. doi: 10.3390/geosciences11040176
Ilich A. R., Misiuk B., Lecours V., Murawski S. A. (2023). MultiscaleDTM: An open-source R package for multiscale geomorphometric analysis. Trans. GIS. 27, 1164–1204. doi: 10.1016/j.ecss.2022.107934
Jackson-Bué T., Williams G.J., Whitton T.A., Roberts M.J., Goward Brown A., Amir H., et al. (2022). Seabed morphology and bed shear stress predict temperate reef habitats in a high energy marine region. Estuar. Coast. Shelf Sci. 274, 107934. doi: 10.1016/j.ecss.2022.107934
Jonsson L. G., Nilsson P. G., Floruta F., Lundälv T. (2004). Distributional patterns of macro- and megafauna associated with a reef of the cold-water coral Lophelia pertusa on the Swedish west coast. Mar. Ecol. Prog. Ser. 284, 163–171. doi: 10.3354/meps284163
Joo J., Kim S.-S., Choi J. W., Pak S.-J., Ko Y., Son S.-K., et al. (2020). Seabed mapping using shipboard multibeam acoustic data for assessing the spatial distribution of ferromanganese crusts on seamounts in the western pacific. Minerals 10, 155. doi: 10.3390/min10020155
Keenan S. F., Switzer T. S., Knapp A., Weather E. J., Davis J. (2022). Spatial dynamics of the quantity and diversity of natural and artificial hard bottom habitats in the eastern Gulf of Mexico. Cont. Shelf. Res. 233, 104633. doi: 10.1016/j.csr.2021.104633
Kimbell G. S., Ritchie J. D., Henderson A. F. (2010). Three-dimensional gravity and magnetic modelling of the Irish sector of the NE Atlantic margin. Tectonophysics 486, 36–54. doi: 10.1016/j.tecto.2010.02.007
Lê S., Josse J., Husson F. (2008). FactoMineR: an R package for multivariate analysis. J. Stat. Software 25, 1–18. doi: 10.18637/jss.v025.i01
Lecours V., Devillers R., Simms A. E., Lucieer V. L., Brown C. J. (2017). Towards a framework for terrain attribute selection in environmental studies. Environ. Model. Software 89, 19–30. doi: 10.1016/j.envsoft.2016.11.027
Lecours V., Dolan M. F. J., Micallef A., Lucieer V. L. (2016). A review of marine geomorphometry, the quantitative study of the seafloor. Hydrol. Earth Syst. Sci. 20, 3207–3244. doi: 10.5194/hess-20-3207-2016
Lecours V., Lucieer V. L., Dolan M. F. J., Micallef A. (2015). An ocean of possibilities: applications and challenges of marine geomorphometry.
Leynaud D., Mienert J., Vanneste M. (2009). Submarine mass movements on glaciated and non-glaciated European continental margins: A review of triggering mechanisms and preconditions to failure. Mar. Pet. Geol. Thematic. Set. New Insights Slope. Instabilities. Recent Stud. within. French. Margin. Program GDR. ≪Marges≫. 26, 618–632. doi: 10.1016/j.marpetgeo.2008.02.008
Lim A., Huvenne V. A. I., Vertino A., Spezzaferri S., Wheeler A. J. (2018). New insights on coral mound development from groundtruthed high-resolution ROV-mounted multibeam imaging. Mar. Geol. 403, 225–237. doi: 10.1016/j.margeo.2018.06.006
Mächler M., Rousseeuw P., Struyf A., Hubert M., Hornik K. (2012). Cluster: cluster analysis basics and extensions, R packages.
Masson D. G., Dobson M. R., Auzende J.-M., Cousin M., Coutelle A., Rolet J., et al. (1989). Geology of Porcupine Bank and Goban Spur, Northeastern Atlantic — Preliminary results of the Cyaporc submersible cruise. Mar. Geol. 87, 105–119. doi: 10.1016/0025-3227(89)90056-X
McGill R., Tukey J. W., Larsen W. A. (1978). Variations of box plots. Am. Statistician. 32, 12–16. doi: 10.2307/2683468
Meredyk S. P., Edinger E., Piper D. J. W., Huvenne V. A. I., Hoy S., Ruffman A. (2020). Enigmatic deep-water mounds on the orphan knoll, labrador sea. Front. Mar. Sci. 6. doi: 10.3389/fmars.2019.00744
Mienis F., van Weering T., de Haas H., de Stigter H., Huvenne V., Wheeler A. (2006). Carbonate mound development at the SW Rockall Trough margin based on high resolution TOBI and seismic recording. Mar. Geol. 233, 1–19. doi: 10.1016/j.margeo.2006.08.003
Miller R. J., Hocevar J., Stone R. P., Fedorov D. V. (2012). Structure-forming corals and sponges and their use as fish habitat in bering sea submarine canyons. PloS One 7, e33885. doi: 10.1371/journal.pone.0033885
Misiuk B., Lecours V., Bell T. (2018). A multiscale approach to mapping seabed sediments. PloS One 13, e0193647. doi: 10.1371/journal.pone.0193647
Naylor D., Shannon P. M. (2005). The structural framework of the Irish Atlantic Margin. Geol. Soc Lond. Pet. Geol. Conf. Ser. 6, 1009–1021. doi: 10.1144/0061009
Naylor D., Shannon P., Murphy N. (2002). Porcupine–goban region–A standard structural nomenclature system (Petroleum Affairs Division).
Nelson S. T., McBride J. H. (2022). Seismic mapping of shallow bedrock shelves in the hanging wall of the Wasatch fault. J. Appl. Geophys., 104923. doi: 10.1016/j.jappgeo.2022.104923
Neves B. M., Du Preez C., Edinger E. (2014). Mapping coral and sponge habitats on a shelf-depth environment using multibeam sonar and ROV video observations: Learmonth Bank, northern British Columbia, Canada. Deep. Sea. Res. Part II Top. Stud. Oceanogr. Biol. Geol. Deep-Sea. Coral. Ecosyst.: Proc. Fifth. Int. Symposium. Deep. Sea. Corals. 99, 169–183. doi: 10.1016/j.dsr2.2013.05.026
O'Reilly B. M., Readman P. W., Shannon P. M. (2001). TOBI rockall irish margins (TRIM): final report (Project 97/14a) (Rockall Studies Group, Petroleum Infrastructure Programme, Dundrum, Dublin), 14.
O’Reilly L. (2022). Understanding key geological processes and controls on cold-water coral habitat development in submarine canyons (Doctoral thesis) (University College Cork).
O’Sullivan D., Healy L., Leahy Y. (2019). EMFF offshore reef survey, sensitive ecosystem assessment and ROV exploration of reef - seaRover 2019 cruise report (Technical report) (Marine Institute).
O’Sullivan D., Leahy Y., Guinan J., Party S. S. (2017). Sensitive ecosystem assessment and ROV exploration of reef survey report 2017 (Technical report) (Marine Institute).
O’Sullivan D., Leahy Y., Guinan J., Ross R., Sacchetti F., Howell K., et al. (2020). “Chapter 47 - The geomorphology and biology of a submarine canyon system incising Ireland’s shelf edge in the Northeast Atlantic Ocean,” in Seafloor geomorphology as benthic habitat, 2nd ed. Eds. Harris P. T., Baker E. (Elsevier), 783–792. doi: 10.1016/B978-0-12-814960-7.00047-6
O’Sullivan D., Leahy Y., Healy L., Party S. S. (2018). EMFF offshore reef survey, sensitive ecosystem assessment and ROV exploration of reef - seaRover 2018 cruise report (Technical report) (Marine Institute).
Pastouret L., Vanney J., Auffret G., Auzende J., Beuzart P., Ferry S., et al. (1984). Modele sous-marin de la marge septentrionale du Golfe de Gascogne; resultats des observations en submersible CYANA. Bull. Société. Géologique. Fr. 7, 81–92. doi: 10.2113/gssgfbull.S7-XXVI.1.81
Peukert A., Petersen S., Greinert J., Charlot F. (2018a). “Seabed mining,” in Submarine geomorphology, springer geology. Eds. Micallef A., Krastel S., Savini A. (Springer International Publishing, Cham), 481–502. doi: 10.1007/978-3-319-57852-1_24
Peukert A., Schoening T., Alevizos E., Köser K., Kwasnitschka T., Greinert J. (2018b). Understanding Mn-nodule distribution and evaluation of related deep-sea mining impacts using AUV-based hydroacoustic and optical data. Biogeosciences 15, 2525–2549. doi: 10.5194/bg-15-2525-2018
Picton B. E., Morrow C. C., Scally L., Pfeiffer N., McGrath F. (2021). Sensitive ecosystem assessment and ROV exploration of reef (SeaRover) synthesis report (EMFF 2014-2020 Marine Institute Report Series. Report prepared by MERC Consultants Ltd. on behalf of the Marine Institute, Galway), 161.
Purkis S. J., Graham N. A. J., Riegl B. M. (2008). Predictability of reef fish diversity and abundance using remote sensing data in Diego Garcia (Chagos Archipelago). Coral. Reefs. 27, 167–178. doi: 10.1007/s00338-007-0306-y
Robert K., Huvenne V. A. I., Georgiopoulou A., Jones D. O. B., Marsh L., Carter D. O., et al. (2017). New approaches to high-resolution mapping of marine vertical structures. Sci. Rep. 7, 9005. doi: 10.1038/s41598-017-09382-z
Robert K., Jones D. O. B., Georgiopoulou A., Huvenne V. A. I. (2020). Cold-water coral assemblages on vertical walls from the Northeast Atlantic. Divers. Distrib. 26, 284–298. doi: 10.1111/ddi.13011
Sacchetti F., Benetti S., Georgiopoulou A., Dunlop P., Quinn R. (2011). Geomorphology of the Irish Rockall Trough, North Atlantic Ocean, mapped from multibeam bathymetric and backscatter Data. J. Maps. 7, 60–81. doi: 10.4113/jom.2011.1157
Serrano A., González-Irusta J. M., Punzón A., García-Alegre A., Lourido A., Ríos P., et al. (2017). Deep-sea benthic habitats modeling and mapping in a NE Atlantic seamount (Galicia Bank). Deep. Sea. Res. Part Oceanogr. Res. Pap. 126, 115–127. doi: 10.1016/j.dsr.2017.06.003
Shannon P. M., McDonnell A., Bailey W. R. (2007). The evolution of the Porcupine and Rockall basins, offshore Ireland: the geological template for carbonate mound development. Int. J. Earth Sci. 96, 21–35. doi: 10.1007/s00531-006-0081-y
Siwabessy P. J. W., Tran M., Picard K., Brooke B. P., Huang Z., Smit N., et al. (2018). Modelling the distribution of hard seabed using calibrated multibeam acoustic backscatter data in a tropical, macrotidal embayment: Darwin Harbour, Australia. Mar. Geophys. Res. 39, 249–269. doi: 10.1007/s11001-017-9314-7
Stoker M. S., Kimbell G. S., McInroy D. B., Morton A. C. (2012). Eocene post-rift tectonostratigraphy of the Rockall Plateau, Atlantic margin of NW Britain: Linking early spreading tectonics and passive margin response. Mar. Pet. Geol. 30, 98–125. doi: 10.1016/j.marpetgeo.2011.09.007
Strachan R. (2021). Bedrock target analysis for ROV rockdrill sampling and existing sample stratigraphic and mineralogical verification (BeTar_drill). MRes Thesis, University College Cork. Available at: https://hdl.handle.net/10468/11891.
Strong J., Service M., Plets R., Clements A., Quinn R., Breen J., et al. (2012). Marine substratum and biotope maps of the Maidens/Klondyke bedrock outcrops, Northern Ireland. J. Maps. 8, 129–135.
Strong J., Wardell C., Haïssoune A., Jones A. L., Coals L., Birchenough S. (2022). Marine habitat mapping to support the use of conservation and anti-trawl structures in Kep Province, Cambodia. ICES. J. Mar. Sci. doi: 10.1093/icesjms/fsac001
Switzer T. S., Tyler-Jedlund A. J., Keenan S. F., Weather E. J. (2020). Benthic habitats, as derived from classification of side-scan-sonar mapping data, are important determinants of reef-fish assemblage structure in the eastern gulf of Mexico. Mar. Coast. Fish. 12, 21–32. doi: 10.1002/mcf2.10106
Trotter J. A., Pattiaratchi C., Montagna P., Taviani M., Falter J., Thresher R., et al. (2019). First ROV exploration of the perth canyon: canyon setting, faunal observations, and anthropogenic impacts. Front. Mar. Sci. 6. doi: 10.3389/fmars.2019.00173
Tyler P., Zibrowius H. (1992). Submersible observations of the invertebrate fauna on the continental-slope southwest of Ireland (ne atlantic-ocean). Oceanol. Acta 15, 211–226.
Walbridge S., Slocum N., Pobuda M., Wright D. J. (2018). Unified geomorphological analysis workflows with benthic terrain modeler. Geosciences 8, 94. doi: 10.3390/geosciences8030094
Welford J. K., Shannon P. M., O’Reilly B. M., Hall J. (2012). Comparison of lithosphere structure across the Orphan Basin–Flemish Cap and Irish Atlantic conjugate continental margins from constrained 3D gravity inversions. J. Geol. Soc 169, 405–420.
Wheeler A. J., Recouvreur A., Butschek F., Pape F. L., Cárdenas A. M., Garcia C. G., et al. (2023). CE22013 – sediment plume sampling, bedrock drilling & Coral surveying (SPeeD).
Whiting L., Haughton P. D. W., Shannon P. M. (2021). From rifting to hyperextension: Upper Jurassic–Lower Cretaceous tectono-stratigraphy of the Porcupine Basin, Irish Atlantic Margin. Basin. Res. 33, 1662–1696. doi: 10.1111/bre.12530
Wickham H. (2016). ggplot2, use R! (Springer International Publishing, Cham). doi: 10.1007/978-3-319-24277-4
Wilson S. K., Graham N. A. J., Polunin N. V. C. (2007). Appraisal of visual assessments of habitat complexity and benthic composition on coral reefs. Mar. Biol. 151, 1069–1076. doi: 10.1007/s00227-006-0538-3
Wilson M. F. J., O’Connell B., Brown C., Guinan J. C., Grehan A. J. (2007). Multiscale terrain analysis of multibeam bathymetry data for habitat mapping on the continental slope. Mar. Geod. 30, 3–35. doi: 10.1080/01490410701295962
Yang P., Welford J. K. (2021). Investigating the Porcupine Atlantic margin, offshore Ireland, through integration of new seismic reflection and gravity data. Tectonophysics 807, 228809. doi: 10.1016/j.tecto.2021.228809
Yang P., Welford J. K., Peace A. L., Hobbs R. (2020). Investigating the Goban Spur rifted continental margin, offshore Ireland, through integration of new seismic reflection and potential field data. Tectonophysics 777, 228364. doi: 10.1016/j.tecto.2020.228364
Zaragosi S., Auffret G. A., Faugères J.-C., Garlan T., Pujol C., Cortijo E. (2000). Physiography and recent sediment distribution of the Celtic Deep-Sea Fan, Bay of Biscay. Mar. Geol. 169, 207–237. doi: 10.1016/S0025-3227(00)00054-2
Keywords: marine bedrock mapping, bathymetry, spatial analysis, morphometry, terrain attribute, bedrock suitability index, deep-sea habitat, Irish continental margin
Citation: Recouvreur A, Wheeler AJ, Strachan R, Meere PA, Unitt RP and Lim A (2024) Large-scale bedrock outcrop mapping on the NE Atlantic Irish continental margin. Front. Mar. Sci. 10:1258070. doi: 10.3389/fmars.2023.1258070
Received: 13 July 2023; Accepted: 06 December 2023;
Published: 10 January 2024.
Edited by:
Vincent Lecours, Université du Québec à Chicoutimi, CanadaReviewed by:
Pedro Menandro, Universidade Federal do Espírito Santo, BrazilCopyright © 2024 Recouvreur, Wheeler, Strachan, Meere, Unitt and Lim. This is an open-access article distributed under the terms of the Creative Commons Attribution License (CC BY). The use, distribution or reproduction in other forums is permitted, provided the original author(s) and the copyright owner(s) are credited and that the original publication in this journal is cited, in accordance with accepted academic practice. No use, distribution or reproduction is permitted which does not comply with these terms.
*Correspondence: Audrey Recouvreur, YXJlY291dnJldXJAdWNjLmll
Disclaimer: All claims expressed in this article are solely those of the authors and do not necessarily represent those of their affiliated organizations, or those of the publisher, the editors and the reviewers. Any product that may be evaluated in this article or claim that may be made by its manufacturer is not guaranteed or endorsed by the publisher.
Research integrity at Frontiers
Learn more about the work of our research integrity team to safeguard the quality of each article we publish.