 Kristen N. Johannes
 Brian R. C. Kennedy
 Katherine L. C. Bell
- 1Department of Graduate Studies, Scripps Institution of Oceanography, University of California San Diego, San Diego, CA, United States
- 2Biology Department, Boston University, Boston, MA, United States
- 3Ocean Discovery League, Saunderstown, RI, United States
Visual observation of the seafloor is invaluable in understanding deep-sea biogeography, uncovering and expanding key global geological, oceanographic, and climate processes. And yet, due to the expense, inefficiency, and inequitable distribution of deep-sea tools, we have barely explored a small, biased fraction of it. Systematic and efficient exploration of the entire deep sea will require a concerted global effort. The current study uses global-coverage geospatial data to develop an interactive online tool for deep seafloor observation planning (i.e., depths below 200 m). The Seafloor Observation Scenario Exploration Tool integrates stakeholder goals and constraints into a dynamic modeling process that combines information about seafloor depth, seafloor geomorphology features, sites of past seafloor observation, Exclusive Economic Zones, and vessel traffic density. With the tool, users can identify maximally suitable areas for seafloor observation, which we envision supporting seafloor expedition planning and marine conservation action.
1 Introduction
The deep ocean – with depths between 200 and almost 11,000 meters below sea level – covers two-thirds of Earth’s surface, encompassing the largest biosphere on the planet (Danovaro et al., 2020). Current and historical observation of deep-ocean ecosystems suggests that this environment supports some of the highest levels of biodiversity on the planet (Stuart et al., 2003; Rabone et al., 2023). And yet, less than 0.01% of the deep seafloor has been sampled, observed, and studied in detail (Ramirez-Llodra et al., 2010; Bell et al., 2022; Tyler et al., 2002).
Direct observation of deep seafloor environments, in particular, is critical for building an understanding of biogeographical and ecological patterns across and within large areas of the seafloor. There is a pressing need to understand these patterns ahead of accelerating resource exploration and extraction efforts, as many ecologically rich and biologically diverse regions are also abundant in mineral resources (IOC-UNESCO, 2017). For example, Amon et al. (2016) surveyed megafauna at multiple candidate mining sites in the abyssal Clarion-Clipperton Zone (CCZ). Regions of the 4.5 million km2 CCZ are under natural resource exploration contracts by multiple countries interested in mining polymetallic nodules on the abyssal seabed (International Seabed Authority, 2023). While we still know little of the biological and ecological characteristics of the CCZ and other areas of the abyssal seabed, baseline surveys of megafauna, conducted to advance scientific knowledge and inform conservation, revealed high levels of species richness, including species and genera that were both new to science and collocated with polymetallic nodules (Amon et al., 2016; Rabone et al., 2023; see also Gooday et al., 2015).
Deep-seabed mining and other resource extraction efforts, such as deep-sea fisheries, cause a wide range of impacts, both proximal and distal, on deep ocean environments (Ramirez-Llodra et al., 2011; Clark et al., 2016; Levin et al., 2016; Levin et al., 2020). While the sum of these anthropogenic impacts is yet unquantified, these activities minimally include the removal of habitat and critical substrate (Vanreusel et al., 2016), changes to the physical and geochemical properties of the deep seafloor (Van Dover, 2014), perturbation and contamination of the surrounding water column, disruptive changes in vibration and light (Levin et al., 2016; Levin et al., 2020), and impacts on ocean mitigation of climate change (Levin et al., 2023). The effects of anthropogenic impacts are especially critical for small island developing states (SIDS), where much less is known about what resources are present in their deep ocean (Amon, Rotjan, et al., 2022). Taken together with our nascent understanding of deep-sea ecosystems and organisms, it is imperative that we accelerate the exploration and research of these areas to stay ahead of the projected harms of potential extraction efforts (Amon et al., 2022).
With so little known and much at stake (Jamieson et al., 2021), why isn’t deep ocean exploration – understood here to be the “initial multidisciplinary view or assessment of unknown or poorly understood areas” (Interagency Working Group on Ocean and Coastal Mapping, 2022 p.4) – and particularly visual deep seafloor observation, a more urgent global priority? One answer lies in disparities in global capacity and inequities in access to expertise and resources. Many countries that are geographically well-positioned to carry out observation activities lack access to the resources required for seafloor exploration (Bell et al., 2022). Visual observation, especially at abyssal and hadal depths, is costly and requires deep submergence vehicles and sensors that can tolerate the high-pressure, low-light environments in the deep sea. This technology necessitates further access to crewed vessels, relevant expertise, and developed systems for processing, interpreting, and sharing observational data. The cost of a properly outfitted expedition is tens of thousands of dollars (USD) per day (Kintisch, 2013; Brandt et al., 2016; IOC-UNESCO, 2017), resulting in exploration, research, and conservation agendas shaped by those from high-resource areas or regions (Bell and Amon, 2022).
A recent Global Deep-Sea Capacity Assessment (Bell et al., 2022) quantified these global disparities in access to the resources, technology, and expertise required to conduct deep-ocean research. The assessment included survey and/or manual research data on 186 geographical areas, documenting the presence of and access to various technical and human capacities for deep-sea exploration and research in every coastal area with deep ocean worldwide. Technical capacities assessed included vessels, deep submergence vehicles (DSVs), deep-sea sensor systems, and data tools. As DSVs and related equipment are typically necessary for deep seafloor exploration, we specifically examined the deep-sea presence of DSVs across geographical areas, noting that the highest presence of this equipment is concentrated in high-income countries, primarily in Northern America, Europe, and Eastern Asia (Figure 1; Bell et al., 2022).
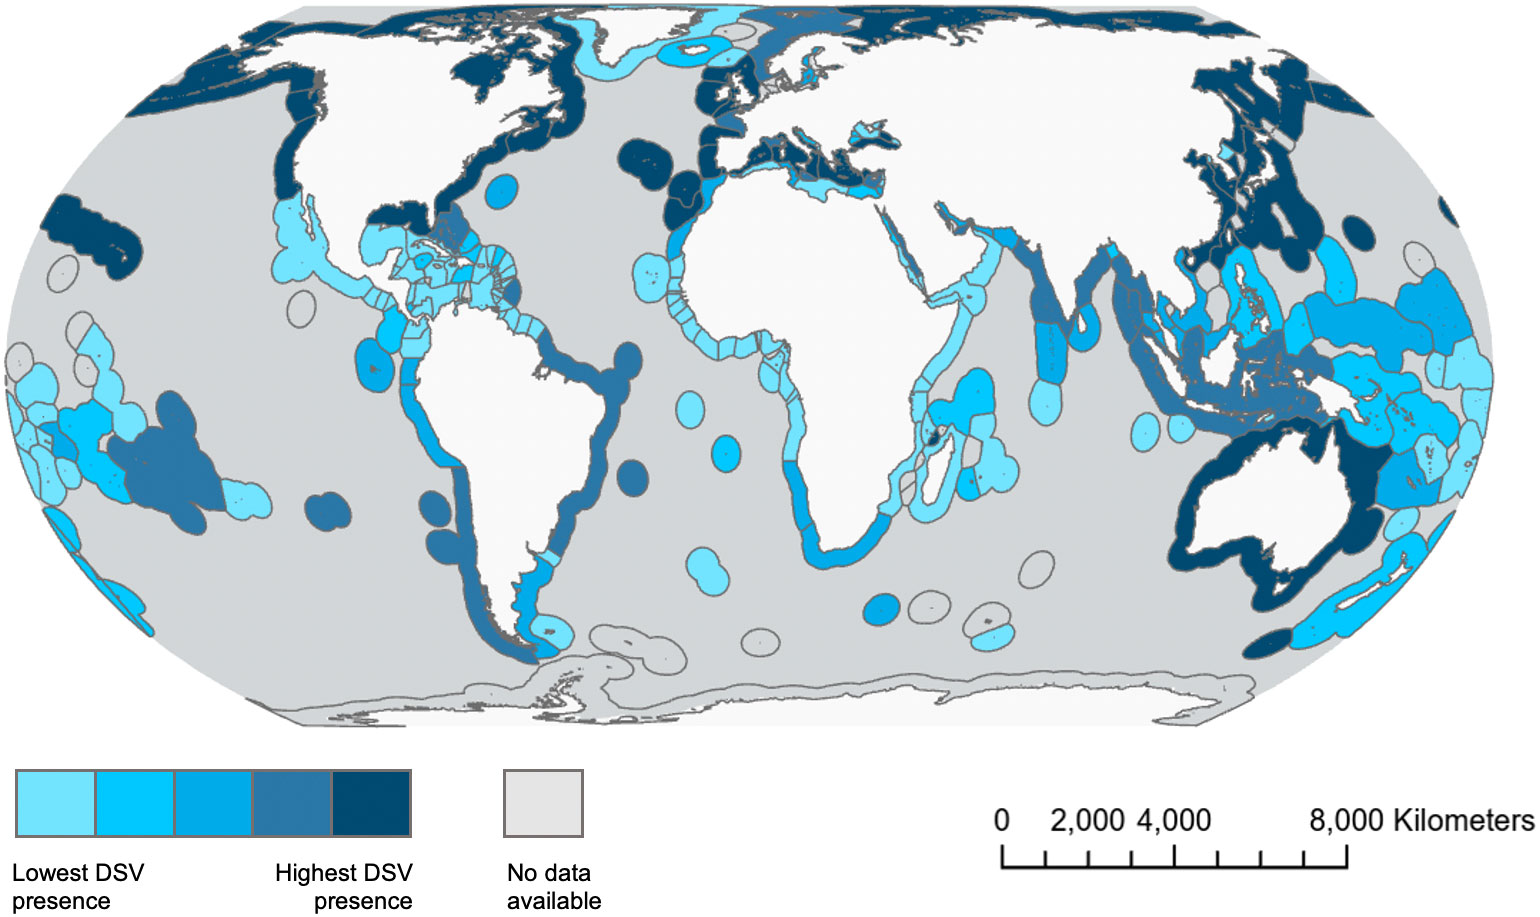
Figure 1 Global Exclusive Economic Zones are colored according to their deep submergence vehicle (DSV) presence index, a relative index based on the presence of types of DSVs in each country and territory; higher values indicate higher diversity of DSV types present in each (Bell et al., 2022). Types of DSVs assessed in the 2022 Global Deep-Sea Capacity Assessment include remotely operated vehicles (ROVs), autonomous underwater vehicles (AUVs), human-occupied vehicles (HOVs), benthic landers, drifters, or tow sleds (Bell et al., 2022).
The Global Deep-Sea Capacity Assessment (Bell et al., 2022) revealed that participation in deep-sea exploration is not representative of the range of global stakeholders and that countries vary widely in the specific combinations of expertise, technology access, conservation goals, and collaborative partnerships needed to support deep-sea exploration. Examining the global metadata for past deep submergence activities also underscores a lack of representation in the distribution of activities across geographical regions, depth ranges, and geomorphological features observed in deep-sea exploration to date. Global participation and coordination are needed to develop representative plans for observing the global seafloor in the future.
Real-time marine spatial planning tools such as SeaSketch (Berger et al., 2023) and OceanReports, (Moore, 2022) have proven instrumental in facilitating collaborative ocean use, management, and conservation planning activities. However, these tools have been used primarily and in service of coastal planning and analysis and, in the case of OceanReports, developed specifically for US waters. Both platforms serve as examples of how planning-relevant data can be made available through accessible online interfaces. We extend this approach to the global deep ocean and seafloor and present a prototype Seafloor Observation Scenario Exploration Tool that allows users to engage multiple global datasets to plan exploration under various scenarios. Specifically, based on user-specified priorities, the Seafloor Observation Scenario Exploration Tool generates global and regional heatmaps of seafloor areas, reflecting areas best aligned with the user’s priorities. The tool integrates critical geospatial planning information, such as vessel traffic routes and Exclusive Economic Zones (EEZs), with past seafloor exploration activity records, global bathymetry, and seafloor geomorphology, facilitating real-time coordination and deep-sea exploration planning via an open-access web tool.
2 Methods
We use a series of global-coverage Geographic Information System data layers, described in detail below, as input to an interactive Seafloor Observation Scenario Exploration Tool. Currently the tool is built with five input data layers, which can be combined and visualized based on user goals. Specifically, users can weight these different layers through an interactive web interface, yielding a heatmap of seafloor areas that reflect their combined priorities. We illustrate this process with an example in our Results.
2.1 Input layers
We selected geospatial data layers to include in the Seafloor Observation Scenario Exploration Tool based on their relevance to deep-seafloor planning, and further refined our selection based on several conditions. Each layer needed to provide global and appropriately high-resolution coverage for the nature of the data being displayed in that layer. For example, seafloor slope data were not included, as this information could not be accurately computed from available global bathymetry at a resolution that would be useful for planning. Layers compiled from geospatial data files (e.g.,.shp files,.csv files with geographical coordinates) were sourced from published datasets. Layers sourced from the ESRI Living Atlas of the World collection (https://livingatlas.arcgis.com) were selected for use based on their status as “Authoritative” layers with the most complete and accurate information. The resulting five layers, reviewed individually below, included: deep submergence metadata for seafloor observations, global Exclusive Economic Zone (EEZ) areas, global ocean bathymetry, global seafloor geomorphology, and global vessel traffic density. Planned data layer additions for future iterations are included in the Discussion.
2.1.1 Deep seafloor observation metadata
We adapted a dataset of deep submergence vehicle metadata collected by Kennedy and Rotjan (in review for this special issue), which included 35,346 records from 13 institutions across 6 countries, and added approximately 13,000 additional deep submergence vehicle deployment records from newly available sources not sampled by Kennedy and Rotjan. Metadata were sourced by country and institution through a combination of public and internal databases, data requests, and published research findings. A complete set of sources are listed in the Supplemental Materials. The dataset represents point-based locations of remotely operated vehicles (ROVs), autonomous underwater vehicles (AUVs), human-occupied vehicles (HOVs), benthic landers, and camera sled tows that generate images of the deep seafloor. Key metadata variables included point-based latitude-longitude coordinates, maximum depth, date of observation, institution and country responsible for data collection, platform name, and type of equipment (Supplemental Materials). Much of the metadata were shared with either single latitude/longitude coordinates, or start-end coordinates for transects and the data were displayed as a point-based layer with 48,053 individual sites (Figure 2A) in ArcGIS Pro and converted to a raster layer for analysis using counts per cell on a global grid of 270 km2 cells.
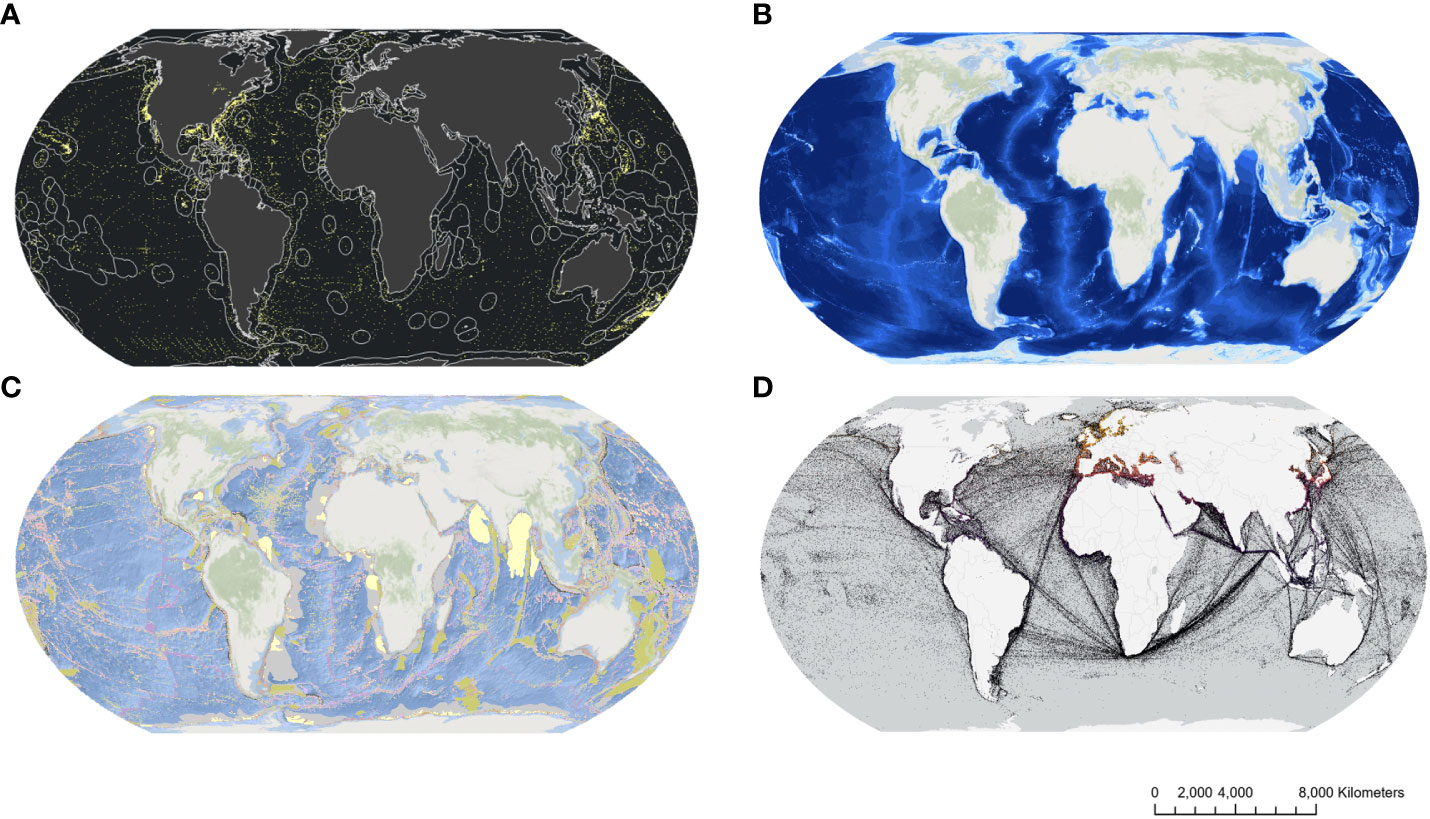
Figure 2 (A) Locations of ROV, AUV, HOV dives, benthic landers, and tows used in seafloor observation metadata set (adapted from Kennedy & Rotjan, in review) overlaid with Global Exclusive Economic Zone boundaries (Flanders Marine Institute, 2019). Individual yellow points represent individual dive sites; white lines represent EEZ boundaries. (B) Global deep ocean bathymetry data is derived from the General Bathymetric Chart of the Oceans (GEBCO, 2021). (C) World Seafloor Geomorphology features (Harris et al., 2014) are displayed as a series of polygon layers. (D) The density of global vessel traffic from 2015-2021 (Cerdeiro et al., 2020). Brighter colors represent a higher density of vessel traffic. Additional map images with detailed color scale legends are included in the Supplemental Materials.
2.1.2 Global exclusive economic zone area
Global EEZ areas and boundaries were accessed through the ESRI Living Atlas (Flanders Marine Institute, 2019). EEZ areas were processed in ArcGIS Pro to remove boundaries between countries and territories to reflect the total global EEZ area (Figure 2A). This global layer was converted to a raster layer for use within the Seafloor Observation Scenario Exploration Tool.
2.1.3 Global ocean bathymetry
Gridded bathymetry data, accessed through the General Bathymetric Chart of the Oceans (GEBCO, 2021; Figure 2B), was used to generate depth estimates across the entire global ocean. Bathymetry estimates were displayed and analyzed as a raster layer, with a resolution of 15 arc seconds.
2.1.4 Global seafloor geomorphology
World Seafloor Geomorphology layers, available through the ESRI Living Atlas of the World, were used to capture the distribution of geomorphological features on the global seafloor. The layers were developed using mapping data from GRID-Arendal (Harris et al., 2014) and characterize physical features on the seafloor and the global ocean zones in which they occur with a 30-arc second resolution. Geomorphic features were displayed as polygon layers (Figure 2C) and converted to a raster layer for analysis and use in the tool. The dataset includes 17 geomorphic features (e.g., seamounts, ridges, guyots, rifts), which are sparsely distributed across the global seafloor. In addition to these geomorphic features of interest, the World Seafloor Geomorphology dataset includes individually identified ocean basins, and seafloor terrain for slope, shelf, hadal and abyssal zones, which were not used in the preliminary version of the web-app tool.
2.1.5 Global vessel traffic density
Global vessel traffic was represented as density patterns across the global ocean, based on hourly AIS positions, for all types of ship traffic, including shipping, leisure, fishing, passenger, and oil and gas (Figure 2D). These datasets were obtained for positions from January 2015 to February 2021 and synthesized by the World Bank through a partnership with the International Monetary Fund (IMF) as part of the IMF World Seaborne Trade Monitoring System (Cerdeiro et al., 2020). This information was used as a grid-based raster layer, with a 500m2 cell size (at the Equator).
2.2 Seafloor Observation Scenario Exploration Tool development
The Seafloor Observation Scenario Exploration Tool was developed using the Suitability Modeler toolkit in Esri ArcGIS Pro (Stauder, 2014) and made available to users through the ArcGIS Experience Builder web-app interface. As input into the web-app interface, we combined the raster layers for each global dataset—bathymetry, seafloor geomorphology, previous deep submergence activity, EEZ areas, and global vessel traffic—into a mosaic raster file using the Create Mosaic tool (Esri, Redlands California). This mosaic created a weighted raster overlay, which encoded the factors, levels, and structure needed for users to dynamically adjust their model priorities when interacting with the scenario exploration tool. The weighted raster overlay was shared to ArcGIS Experience Builder as a server-hosted imagery layer, which allows users to interact with the model layers through the web-app.
3 Results
3.1 Historical observation coverage
Access to resources and human capacity have historically driven exploration areas and priorities (Bell, Chow, et al., 2022). Consistent with capacity assessment findings (Bell et al., 2022), countries with developed deep-ocean observation programs and access to deep submergence technology generated the greatest proportion of visual observation data in our sample. Most observation activities in our sample were undertaken within countries’ EEZs, with approximately 78% of all activities in the sample located within EEZs (Figure 2A). Furthermore, 98% of the total observation activities within global EEZ boundaries, regardless of EEZ sovereign, were conducted by just 5 countries: United States, Japan, New Zealand, France, and Germany.
Globally, only a tiny fraction of the deep seafloor has been observed through image-generating deep submergence technologies, and the geospatial distribution of these observations is not representative of seafloor bathymetry or the distribution of seafloor geomorphological features by area. The distribution of seafloor observations across bathymetric zones is roughly inverse to the distribution of seafloor area across these depth zones (Figure 3A). Half of the global seafloor lies at depths of 4,000 meters or deeper, but only about 6.5% of observations occurred at these depths. Similarly, while 42.7% of deep seafloor observations in our deep submergence records were made between 200 and 1000 meters, this depth range accounts for only 6.2% of the deep seafloor by area.
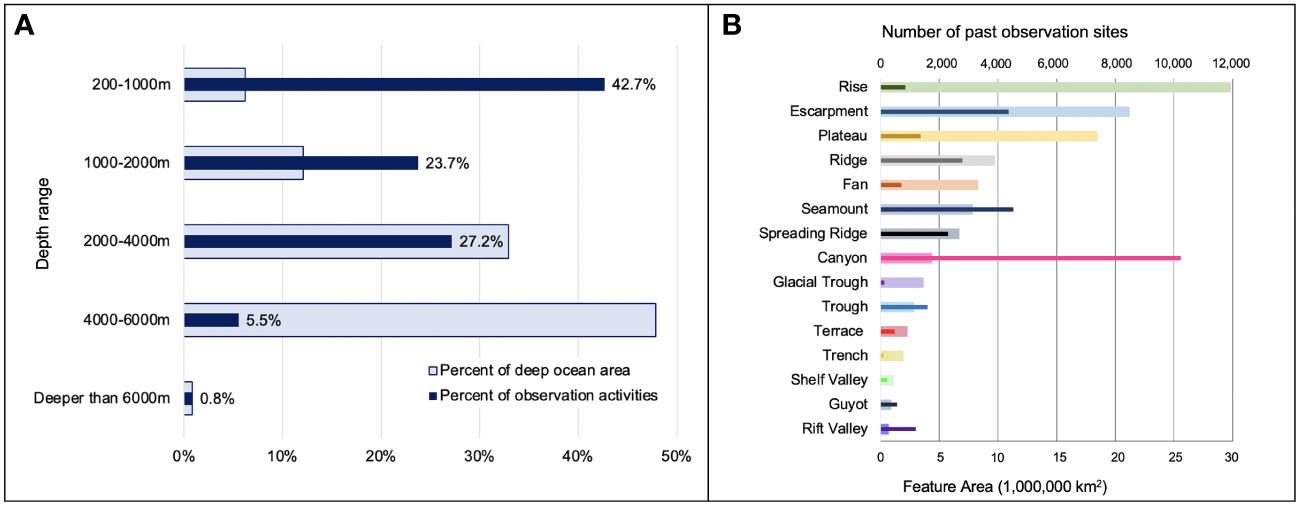
Figure 3 (A) Distribution of past seafloor observation activities by depth (dark narrow bars) superimposed on the global distribution of deep seafloor area by depth (light blue wide bars). (B) Distribution of past observation sites across different seafloor geomorphological features. Dark bars represent the number of historical and proposed sites collocated with different seafloor geomorphological features and are overlaid on light bars representing the total area occupied by each feature (Harris et al., 2014). Bridge and Sill features were both unobserved in our record (i.e., 0 historical observations).
Similarly, the density of deep submergence activity across different geomorphological features of the seafloor is neither uniform nor representative of the global seafloor area characterized by these features (Figure 3B). Rift valleys and canyons, which characterize a relatively small area of the global seafloor, have been observed at roughly 5 and 75 times, respectively, the rate of geomorphological features with much greater global presence.
The geographical distribution, bathymetric coverage, and geomorphological coverage of past seafloor exploration activities provide an essential snapshot of the areas and environments that are over- and under-represented in current seafloor observation. These patterns guide where to prioritize future exploration efforts and highlight existing inequities in global deep-sea presence, especially when considering information about global capacity and distribution of seafloor exploration resources such as deep submergence vehicles (Figure 1).
3.2 Seafloor Observation Scenario Exploration Tool
The Seafloor Observation Scenario Exploration Tool is a dynamic web-based planning tool that allows users to adjust the importance of different considerations based on their seafloor exploration goals, priorities, and access to resources, vessels, and technology. The tool weights these considerations to generate a suitability heat map of regions that best fit the user-specified priorities. Users can engage or ignore each of five global information layers: EEZ areas, seafloor depth, seafloor geomorphology features, sites of past seafloor observation, and vessel traffic density.
Once users have chosen which information layers are relevant to their priorities, they can adjust how important each is by assigning a percent value, balanced so that all assigned values add to 100% (Figure 4A). For example, suppose a stakeholder is limited by depth-specific technology. In this case, they can give greater importance to the “Seafloor Depth” layer by assigning it a higher percent-based weight in the tool.
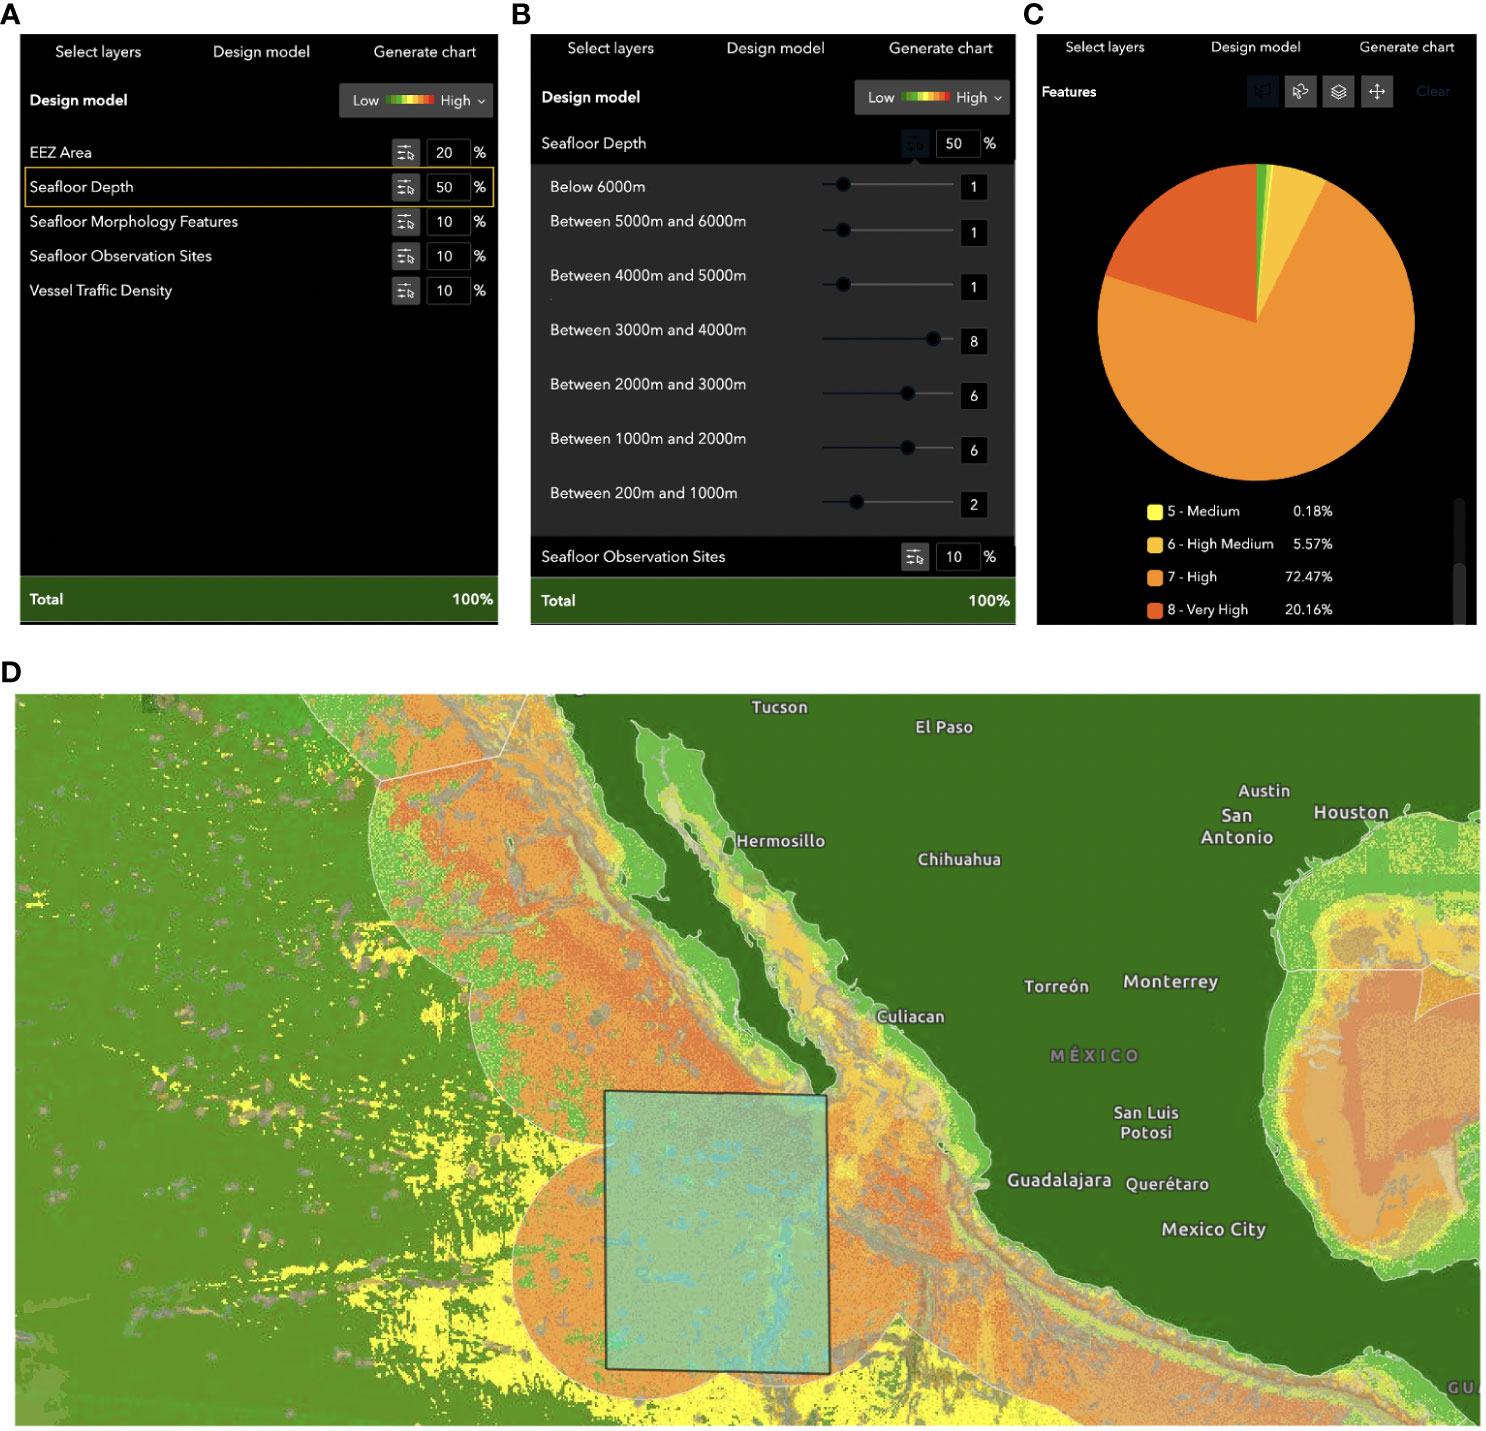
Figure 4 (A) After choosing global information layers of interest, users can assign different levels of importance to each layer by assigning a greater or lesser percentage contribution to the model. (B) Within the Seafloor Depth layer, users can use the slider to increase (larger values) or decrease (smaller values) the weight of each depth range in the model. (C) Suitability breakdown pie chart for the user-drawn region of interest within the EEZ of Mexico. (D) Heatmap of suitability for a user-drawn region of interest within the EEZ of Mexico.
Users can further adjust how specific levels of a factor are important in their planning. For a factor like “seafloor depth”, levels reflect specific depth ranges (Figure 4B). Priority is assigned to levels via a numeric scale of 0-9, controlled by a simple slider interface, and reflect relative importance within a single factor; all levels can be set to be equally important, or specific levels can be given a higher value to reflect greater priority within that factor. If, for example, a stakeholder has access to depth-limited tools and technology, they can place more weight on specific depth ranges – levels of the depth factor – using higher numbers on the slider and place less weight on other ranges using lower numbers on the slider.
To illustrate, consider a stakeholder group in Mexico with the following priorities:
● Vessel access to the seafloor within the country’s EEZ;
● Access to deep submergence technology with a 4,000 m depth rating;
● Aims to capture a specific distribution of seafloor geomorphic features;
● Aims to observe unexplored areas of the seafloor; and,
● A need to avoid other vessel traffic while conducting observations.
Once all layers of interest have been specified and weighted to sum to 100% total model coverage, users can run the tool to reflect their model priorities across the entire global ocean (Figure 4D). To accommodate their region-specific planning needs, users can zoom into different areas of the resulting interactive web map and use drawing tools to create a custom polygon around regions of interest of any size (Figure 4D). In the pie chart visualization generated for the region of interest, given the stakeholder priorities listed above (Figure 4C), over 92% of the area is designated with a “High” or “Very-High” degree of suitability – reflected in shades of orange in the chart and on the map. In this way, stakeholders receive an immediate snapshot of their regions of interest with information about how suitable the seafloor in their region is, given the priorities and constraints they specified in the tool’s model design.
4 Discussion
Although sparse, historical visual observation of the seafloor has proved invaluable in understanding unique deep-sea ecosystems (Danovaro et al., 2014), discovering novel organisms, and uncovering and expanding key global geological, oceanographic, and climate processes (Ramirez-Llodra et al., 2010; Gasparin et al., 2020; Levin et al., 2023). Systematic and efficient exploration of these regions requires a sustained collective effort (Danovaro et al., 2017), undergirded by global observation observing programs such as the Global Ocean Observing Strategy and Deep Ocean Observing Strategy (Levin et al., 2019; Danovaro et al., 2020; Satterthwaite et al., 2021). Collaborative planning and exploration efforts are increasingly necessary to fulfill global conservation goals, such as the Global Biodiversity Framework “30 by 30” agreement (Convention on Biological Diversity, 2022), and to realize the deep-sea conservation opportunities enabled by ratification of the Agreement for conservation of biodiversity in areas beyond national jurisdictions (BBNJ; UN General Assembly, 2023).
This need is also reflected in the challenges put forth by the UN Decade of Ocean Science for Sustainable Development (UNESCO-IOC, 2023), which directly engages with deep ocean research and stewardship through a series of challenges (Howell et al., 2020). With these challenges top of mind, data collected through collaborative seafloor observation can contribute to “protection and restoration of ecosystems and biodiversity” (Challenge 2), “expand the Global Ocean Observing System” (Challenge 7), “create a digital representation of the ocean: (Challenge 8), develop “skills, knowledge, and technology for all” (Challenge 9), and “change humanity’s relationship with the ocean” (Challenge 10).
Our Seafloor Observation Scenario Exploration Tool contributes to a multifaceted effort to accelerate deep ocean observation on a global scale. These resources also function alongside efforts to develop low-cost, easy-to-use technology innovations to lower barriers to deep-sea data collection, global collaboration to promote and streamline high-quality data processing and sharing, and movements towards increasing global capacity and building partnerships. We envision the tool supporting current and future chief scientists and expedition leaders through programs like the Crustal Ocean Biosphere Research Accelerator (COBRA; Huber & Orcutt, 2021; Rotjan et al., 2023) and contributing to a growing set of tools for real-time marine spatial planning (e.g., SeaSketch; Berger et al., 2023). To this end, we intend to continue the development of the Seafloor Observation Scenario Exploration Tool through iterative user and community feedback, including the addition of GIS layers encoding the location of Marine Protected Areas and deep-sea fishing areas across the global ocean as well as layers containing planning-relevant data about benthic substrate, seafloor slope, environmental variables (e.g., dissolved O2, salinity, particulate organic carbon) and topography.
Data availability statement
The original contributions presented in the study are included in the article/Supplementary Material. Further inquiries can be directed to the corresponding author. The prototype Seafloor Observation Scenario Exploration Tool can be accessed at http://bit.ly/seafloor-tool.
Author contributions
KJ and KB conceived and designed the study. KJ and BK collected data. KJ drafted the article. All authors contributed to the article and approved the submitted version and agree to be accountable for all aspects of the work.
Acknowledgments
The authors would like to thank formative feedback and encouragement from Greg Rouse, Judith Gobin, Randi Rotjan, Karen Stocks, Leslie Smith, Helen Pilar, Susan Poulton and the Ocean Discovery League team. We would also like to acknowledge all the individual researchers who have shared relevant exploration data, improving the global coverage of our datasets. Continued work on this project is made possible by a generous fellowship to KJ from the Edna Bailey Sussman Fund.
Conflict of interest
The authors declare that the research was conducted in the absence of any commercial or financial relationships that could be construed as a potential conflict of interest.
Publisher’s note
All claims expressed in this article are solely those of the authors and do not necessarily represent those of their affiliated organizations, or those of the publisher, the editors and the reviewers. Any product that may be evaluated in this article, or claim that may be made by its manufacturer, is not guaranteed or endorsed by the publisher.
Supplementary material
The Supplementary Material for this article can be found online at: https://www.frontiersin.org/articles/10.3389/fmars.2023.1251562/full#supplementary-material
Footnotes
- ^ Kennedy, B. R. C., and Rotjan, R. D. Mind the gap: comparing exploration effort with global biodiversity patterns and climate projections to determine ocean areas with greatest exploration needs. Front. Mar. Sci.
- ^ Kennedy, B. R. C., and Rotjan, R. D. Mind the gap: comparing exploration effort with global biodiversity patterns and climate projections to determine ocean areas with greatest exploration needs. Front. Mar. Sci.
References
Amon D. J., Gollner S., Morato T., Smith C. R., Chen C., Christiansen S., et al. (2022a). Assessment of scientific gaps related to the effective environmental management of deep-seabed mining. Mar. Policy 138, 105006. doi: 10.1016/j.marpol.2022.105006
Amon D. J., Rotjan R. D., Kennedy B. R. C., Alleng G., Anta R., Bell K. L. C., et al. (2022b). My Deep Sea, My Backyard: A pilot study to build capacity for global deep-ocean exploration and research. Philos. Trans. R. Soc. B: Biol. Sci. 377 (1854), 20210121. doi: 10.1098/rstb.2021.0121
Amon D. J., Ziegler A. F., Dahlgren T. G., Glover A. G., Goineau A., Gooday A. J., et al. (2016). Insights into the abundance and diversity of abyssal megafauna in a polymetallic-nodule region in the eastern Clarion-Clipperton Zone. Sci. Rep. 6 (1), 30492. doi: 10.1038/srep30492
Bell K. L. C., Amon D. J. (2022). “Toward an equitable deep sea future,” in 2022 global deep-sea capacity assessment. Eds. Bell K. L. C., Quinzin M. C., Poulton S., Hope A., Amon D. (Saunderstown, USA: Ocean Discovery League). doi: 10.21428/cbd17b20.1bdfff48
Bell K. L. C., Chow J. S., Hope A., Quinzin M. C., Cantner K. A., Amon D. J., et al. (2022a). Low-cost, deep-sea imaging and analysis tools for deep-sea exploration: A collaborative design study. Front. Mar. Sci. 9. doi: 10.3389/fmars.2022.873700
Bell K. L. C., Quinzin M. C., Poulton S., Hope A., Amon D. (2022b). 2022 global deep-sea capacity assessment (Ocean Discovery League, Saunderstown, USA). doi: 10.21428/cbd17b20.48af7fcb
Berger M., McClintock W., Burt C., Welch T. (2023). “SeaSketch,” in Evaluating participatory mapping software (Cham: Springer International Publishing), 121–147. doi: 10.1007/978-3-031-19594-5_6
Brandt A., Gutt J., Hildebrandt M., Pawlowski J., Schwendner J., Soltwedel T., et al. (2016). Cutting the umbilical: new technological perspectives in benthic deep-sea research. J. Mar. Sci. Eng. 4 (2), 36. doi: 10.3390/jmse4020036
Cerdeiro D. A., Komaromi A., Liu Y., Saeed M. (2020). World seaborne trade in real time: A proof of concept for building AIS-based Nowcasts from scratch, IMF Working Papers 20/57. Int. Monetary Fund.
Clark M. R., Althaus F., Schlacher T. A., Williams A., Bowden D. A., Rowden A. A. (2016). The impacts of deep-sea fisheries on benthic communities: A review. ICES J. Mar. Sci. 73 (suppl_1), i51–i69. doi: 10.1093/icesjms/fsv123
Convention on Biological Diversity (2022) Kunming-Montreal Global biodiversity framework: Draft decision submitted by the President. Available at: https://www.cbd.int/doc/c/e6d3/cd1d/daf663719a03902a9b116c34/cop-15-l-25-en.pdf.
Danovaro R., Aguzzi J., Fanelli E., Billett D., Gjerde K., Jamieson A., et al. (2017). An ecosystem-based deep-ocean strategy. Science 355, 452–454. doi: 10.1126/science.aah7178
Danovaro R., Fanelli E., Aguzzi J., Billett D., Carugati L., Corinaldesi, et al. (2020). Ecological variables for developing a global deep-ocean monitoring and conservation strategy. Nat. Ecol. Evol. 4 (2), 181–192. doi: 10.1038/s41559-019-1091-z
Danovaro R., Snelgrove P. V., Tyler P. (2014). Challenging the paradigms of deep-sea ecology. Trends in Ecology & Evolution 29, 465–475.
Flanders Marine Institute (VLIZ), Belgium (2019). Maritime boundaries geodatabase. VLIZ. doi: 10.14284/382
Gasparin F., Hamon M., Rémy E., Le Traon P.-Y. (2020). How deep argo will improve the deep ocean in an ocean reanalysis. J. Climate 33 (1), 77–94. doi: 10.1175/JCLI-D-19-0208.1
Gooday A. J., Goineau A., Voltski I. (2015). Abyssal foraminifera attached to polymetallic nodules from the eastern Clarion Clipperton Fracture Zone: a preliminary description and comparison with North Atlantic dropstone assemblages. Mar. Biodiver. 45, 3. doi: 10.1007/s12526-014-0301-9
Harris P. T., Macmillan-Lawler M., Rupp J., Baker E. K. (2014). Geomorphology of the oceans. Mar. Geol. 352, 4–24. doi: 10.1016/j.margeo.2014.01.011
Howell K. L., Hilário A., Allcock A. L., Bailey D., Baker M., Clark M. R., et al. (2020). A decade to study deep-sea life. Nat. Ecol. Evol. 5 (3), 265–267. doi: 10.1038/s41559-020-01352-5
Huber J. A., Orcutt B. N. (2021). COBRA: A research accelerator for the crustal ocean biosphere. Mar. Technol. Soc. J. 55 (3), 130–131. doi: 10.4031/MTSJ.55.3.14
Interagency Working Group on Ocean and Coastal Mapping (2022) Strategic priorities for ocean exploration and characterization of the United States exclusive economic zone. Available at: https://www.whitehouse.gov/wp-content/uploads/2022/10/NOMEC_OEC_Priorities_Report.pdf.
International Seabed Authority (2023). Available at: https://www.isa.org.jm/.
IOC-UNESCO (2017). Global Ocean Science Report - The current status of ocean science around the world. Ed. Valdés L. (Paris: UNESCO Publishing).
Jamieson A. J., Singleman G., Linley T. D., Casey S. (2021). Fear and loathing of the deep ocean: Why don’t people care about the deep sea? ICES J. Mar. Sci. 78 (3), 797–809. doi: 10.1093/icesjms/fsaa234
Kintisch E. (2013). A sea change for U.S. Oceanography. Science 339 (6124), 1138–1143. doi: 10.1126/science.339.6124.1138
Levin L. A., Alfaro-Lucas J. M., Colaco A., Cordes E. E., Craik N., Danovaro R., et al. (2023). Deep-sea impacts of climate interventions. Science 379, 978–981. doi: 10.1038/s41893-020-0558-x
Levin L. A., Amon D. J., Lily H. (2020). Challenges to the sustainability of deep-seabed mining. Nat. Sustainability 3, 784–794. doi: 10.1038/s41893-020-0558-x
Levin L. A., Baco A. R., Bowden D., Colaco A., Cordes E. E., Cunha M. R., et al. (2016). Hydrothermal vents and methane seeps: rethinking the sphere of influence. Front. Mar. Sci. 3, 72. doi: 10.3389/fmars.2016.00072
Levin L. A., Bett B. J., Gates A. R., Heimbach P., Howe B. M., Janssen F., et al. (2019). Global observing needs in the deep ocean. Front. Mar. Sci. 6. doi: 10.3389/fmars.2019.00241
Moore T. (2022). OceanReports Tool brings ocean and coastal planning data to your fingertips. salish sea ecosystem conference. 201. Available at: https://cedar.wwu.edu/ssec/2022ssec/allsessions/201.
Rabone M., Wiethase J. H., Simon-Lledó E., Emery A. M., Jones D. O.B., Dahlgren T. G., et al. (2023). How many metazoan species live in the world’s largest mineral exploration region? Curr. Biol. 33, P2383–P2396. doi: 10.1038/s41893-020-0558-x
Ramirez Llodra E., Brandt A., Danovaro R., De Mol B., Escobar E., German C. R., et al. (2010). Deep, diverse and definitely different: Unique attributes of the world's largest ecosystem. Biogeosciences 7, 2851–2899. doi: 10.5194/bg-7-2851-2010
Ramirez-Llodra E., Tyler P. A., Baker M. C., Bergstad O. A., Clark M. R., Escobar Briones E., et al. (2011). Man and the last great wilderness: Human impact on the deep sea. PloS One 6 (7), e22588. doi: 10.1371/journal.pone.0022588
Rotjan R. D., Bell K. L. C., Huber J. A., Wheat G., Fisher A. T., Sylvan R., et al. (2023). COBRA Master Class: Providing deep-sea expedition leadership training to accelerate early career advancement. Front. Mar. Sci. 10, 1223197. doi: 10.3389/fmars.2023.1223197
Satterthwaite E. V., Bax N. J., Miloslavich P., Ratnarajah L., Canonico G., Dunn D., et al. (2021). Establishing the foundation for the global observing system for marine life. Front. Mar. Sci. 8. doi: 10.3389/fmars.2021.737416
Stauder R. (2014). Modeling suitability Vol. 17 (ArcUser), 50–53. Available at: https://www.esri.com/~/media/files/pdfs/news/arcuser/1014/modeling-suitability.pdf.
Stuart C. T., Rex M. A., Etter R. J. (2003). Large-scale spatial and temporal patterns of deep-sea benthic species diversity. Ecosyst. World, 295–312. doi: 10.1017/CBO9780511752360.006
Tyler P. A., German C. R., Ramirez-Llodra E., Van Dover C. L. (2002). Understanding the biogeography of chemosynthetic ecosystems. Oceanologica Acta 25 (5), 227–241. doi: 10.1016/S0399-1784(02)01202-1
United Nations, General Assembly (2023) Agreement under the United Nations Convention on the Law of the Sea on the conservation and sustainable use of marine biological diversity of areas beyond national jurisdiction. Available at: https://documents-dds-ny.un.org/doc/UNDOC/LTD/N23/177/28/PDF/N2317728.pdf.
Van Dover C. L. (2014). Impacts of anthropogenic disturbances at deep-sea hydrothermal vent ecosystems: a review. Mar. Environ. Res. 102, 59–72. doi: 10.1016/j.marenvres.2014.03.008
Keywords: seafloor observation, marine spatial planning, web tool, capacity development, deep submergence vehicles, seafloor geomorphology
Citation: Johannes KN, Kennedy BRC and Bell KLC (2023) Seafloor Observation Scenario Exploration Tool: enabling representative exploration of the global deep seafloor. Front. Mar. Sci. 10:1251562. doi: 10.3389/fmars.2023.1251562
Received: 01 July 2023; Accepted: 06 October 2023;
Published: 25 October 2023.
Edited by:
Aurora Elmore, National Oceanic and Atmospheric Administration (NOAA), United StatesReviewed by:
Nitin Agarwala, National Maritime Foundation, IndiaAmanda N. Netburn, NOAA’s Office of Ocean Exploration and Research, United States
Copyright © 2023 Johannes, Kennedy and Bell. This is an open-access article distributed under the terms of the Creative Commons Attribution License (CC BY). The use, distribution or reproduction in other forums is permitted, provided the original author(s) and the copyright owner(s) are credited and that the original publication in this journal is cited, in accordance with accepted academic practice. No use, distribution or reproduction is permitted which does not comply with these terms.
*Correspondence: Kristen N. Johannes, a2pvaGFubmVzQHVjc2QuZWR1