 Zhen-Long Zhang
 Hirohiko Nakamura2
 Shin’ichiro Kako
 Xiao-Hua Zhu
- 1Pan-Okhotsk Research Center, Institute of Low Temperature Science, Hokkaido University, Sapporo, Japan
- 2Faculty of Fisheries, Kagoshima University, Kagoshima, Japan
- 3Graduate School of Science and Engineering, Kagoshima University, Kagoshima, Japan
- 4State Key Laboratory of Satellite Ocean Environment Dynamics, Second Institute of Oceanography, Ministry of Natural Resources, Hangzhou, China
- 5Southern Marine Science and Engineering Guangdong Laboratory (Zhuhai), Yat-sen University, Zhuhai, China
- 6School of Oceanography, Shanghai Jiao Tong University, Shanghai, China
Interannual eddy variability in the eastern Ryukyu Island chain (RIC) was analyzed based on eddy trajectories and assimilation data. Analysis of the eddy trajectory data suggested a predominance of eddies originating near the study area. The occurrence frequency of eddies has interannual variability, but it demonstrates a different tendency with eddy kinetic energy (EKE): few eddies appear when EKE is high; however, they are strong with fast rotation speeds and increase in size. The EKE variability was correlated with the baroclinic conversion rates, suggesting a vital role of baroclinic instability in the study area. Baroclinic instability was found to be affected by the North Equatorial Current (NEC), during which more NEC water entered the eastern RIC, intensifying the vertical velocity shear between the upper and lower oceans. Consequently, baroclinic instability in the study area was enhanced.
1 Introduction
Mesoscale eddies normally have horizontal scales of O(100 km) and timescales of O(100 days), and are ubiquitous in oceans. They can transport heat, salt, and other chemical constituents of seawater over considerable distances from their generation areas. Hence, they play crucial roles in climatic and biological changes (Farneti et al., 2010; Chelton et al., 2011). Mesoscale eddies have been studied for several decades. Researchers have focused on the spatiotemporal characteristics and interactions with other physical processes (Chow et al., 2017; Yang et al., 2019).
Geographically, studies on eddy activity in the North Pacific have primarily focused on two eddy-rich regions. The first region was the Kuroshio Extension (KE, 140°–170°E, 30°–40°N) region. Large-amplitude meanders frequently occur in this region, generating vigorous mesoscale eddies (Joyce et al., 2001; Mizuno and White, 1983; Yasuda et al., 1992). Moreover, eddy activity in the KE region is affected by decadal variations in the large-scale wind stress curl in the North Pacific (Qiu and Chen, 2005; Qiu and Chen, 2011). The second eddy-rich region of the North Pacific is represented by the Subtropical Countercurrent (STCC, 125°–180° E, 18°–28° N) region (Qiu, 1999), which is characterized by the eastward STCC in the upper ocean and the westward North Equatorial Current (NEC) in the lower ocean. The STCC-NEC current system provides favorable conditions for developing instability (Qiu and Chen, 2013; Qiu et al., 2014), resulting in rich eddy activities. Eddy activity in the STCC zone exhibits distinct seasonal characteristics governed by STCC intensity variability (Qiu, 1999).
In addition to these two regions, the region east of the Ryukyu Island chain (RIC) is characterized by remarkable eddy activity in the North Pacific. A northeastward current with a subsurface velocity core (Ichikawa et al., 2004; Zhu et al., 2006; Zhao et al., 2020), that is, the Ryukyu Current (RC) exists in this area. Despite its small volume transport, the RC transports twice as much nitrate in the East China Sea as the Kuroshio (Zhu et al., 2003) and is reportedly affected by mesoscale eddies (Zhu et al., 2003; Thoppil et al., 2016). Therefore, investigating the eddy generation mechanism could help us understand the variability in materials (inorganic and organic components) and nutrients in the eastern RIC. Many studies have been conducted on eddies generated in the interior ocean because they are considered a significant source of variability near the region east of the RIC. However, these eddies do not provide a comprehensive picture of eddy activity in this region. Because eddies obtain energy from the mean-flow field through barotropic and baroclinic instability processes, the existence of the RC represents a potential energy source for eddies to grow. The eddy generation mechanism related to RC instabilities remains unclear, particularly at interannual timescales. In this study, we investigated interannual eddy variability in the region east of the RIC and its dominant mechanisms. Notably, we used ocean assimilation data and eddy trajectory products to analyze eddy variability with the aim of explaining it from multiple perspectives.
2 Method
To elucidate the driving mechanism of eddy variability, we performed an energy conversion analysis based on a four-dimensional variational ocean reanalysis of the western North Pacific (FORA-WNP) data product (Usui et al., 2013). FORA-WNP assimilates in situ temperature and salinity data in addition to sea surface temperature data and satellite-derived sea surface height anomalies. FORA-WNP is a daily assimilation data product available from 1993 to 2014 that spatially covers the western North Pacific (117°E–160°W, 15°N–65°N). It has a horizontal interval of 0.1° × 0.1° latitude/longitude and 54 levels in the vertical using a terrain-following coordinate. This dataset was previously validated by Zhang et al. (2021) (see the Appendix for data validation in their study) and was utilized to investigate the seasonal RC volume transport variability.
Eddy variability in the region east of the RIC was also examined using mesoscale eddy trajectory atlas products obtained from the Archiving Validation and Interpretation of Satellite Oceanography (AVISO). In this study, we used the META 3.1 exp DT version of the data product. This dataset was created based on the “two-satellite” daily delayed-time global absolute dynamics topography (ADT), originating from the Copernicus Climate Change Service (C3S). Mesoscale eddies have been detected using closed SSH contours at daily time intervals; eddy characteristics such as rotation speed, radius, and lifetime have been estimated (Mason et al., 2014). We selected ADT data from 1993 to 2014 to match the available period of the FORA-WNP. Notably, the reanalysis data assimilated satellite data, which were also applied to the eddy trajectory data products. Therefore, the reanalysis and eddy trajectory products used in this study were not independent of each other.
The following equations were used to quantify the relative importance of barotropic and baroclinic instabilities (Dong et al., 2007; Klein et al., 2008):
where (u,v,w) are the zonal, meridional, and vertical velocity components (m s-1), respectively; g is the gravitational acceleration (m s-2); ρ is the density and ρ0= 1,027 kg m-3 is the reference density. EKE denotes eddy kinetic energy (m2 s-2). KmKe and PeKe are the barotropic conversion rates from the mean kinetic energy to EKE and the baroclinic conversion rate from the eddy potential energy to EKE, respectively. Notably, barotropic or baroclinic instability is expected if the conversion rates are positive. The overbar in these equations denotes the time averaging for each year, and the prime denotes the anomalies or deviations from the annual averages. According to Rieck et al. (2015), the anomalies calculated in this way do not contain the year-to-year variations of the annual-mean fields.
3 Results
3.1 Interannual eddy variability revealed from the eddy trajectories data product
Over the last two decades, automatic detection methods have been successfully developed for mesoscale eddies (Chelton et al., 2007; Petersen et al., 2013; Mason et al., 2014). Here, we examine eddy properties such as the rotation direction, speed, and radius, which conventional methods cannot reveal. Figures 1A, B show the appearance of eddies in the study area (black dashed-line boxes). A total of 558 cyclonic eddies (CE) and 427 anti-cyclonic eddies (AE) were identified in the study area from 1993 to 2014. The frequencies of the two types of eddies differed slightly. Specifically, CE tended to emerge more intensively than AE on the western side of the RC. In contrast, the AE tended to emerge on the eastern side of the RC. This feature has also been observed in the Kuroshio (Han et al., 2016; Liu et al., 2017; Qin et al., 2015). Based on the initial locations where the eddies were identified, they can be divided into local and remote eddies. Local eddies indicate those that were initially identified within the study area, whereas remote eddies indicate those that were initially identified far from the study area. Most eddies (>90%) were local (figure not shown), suggesting that the interannual eddy variability in the study area was dominated by these local eddies.
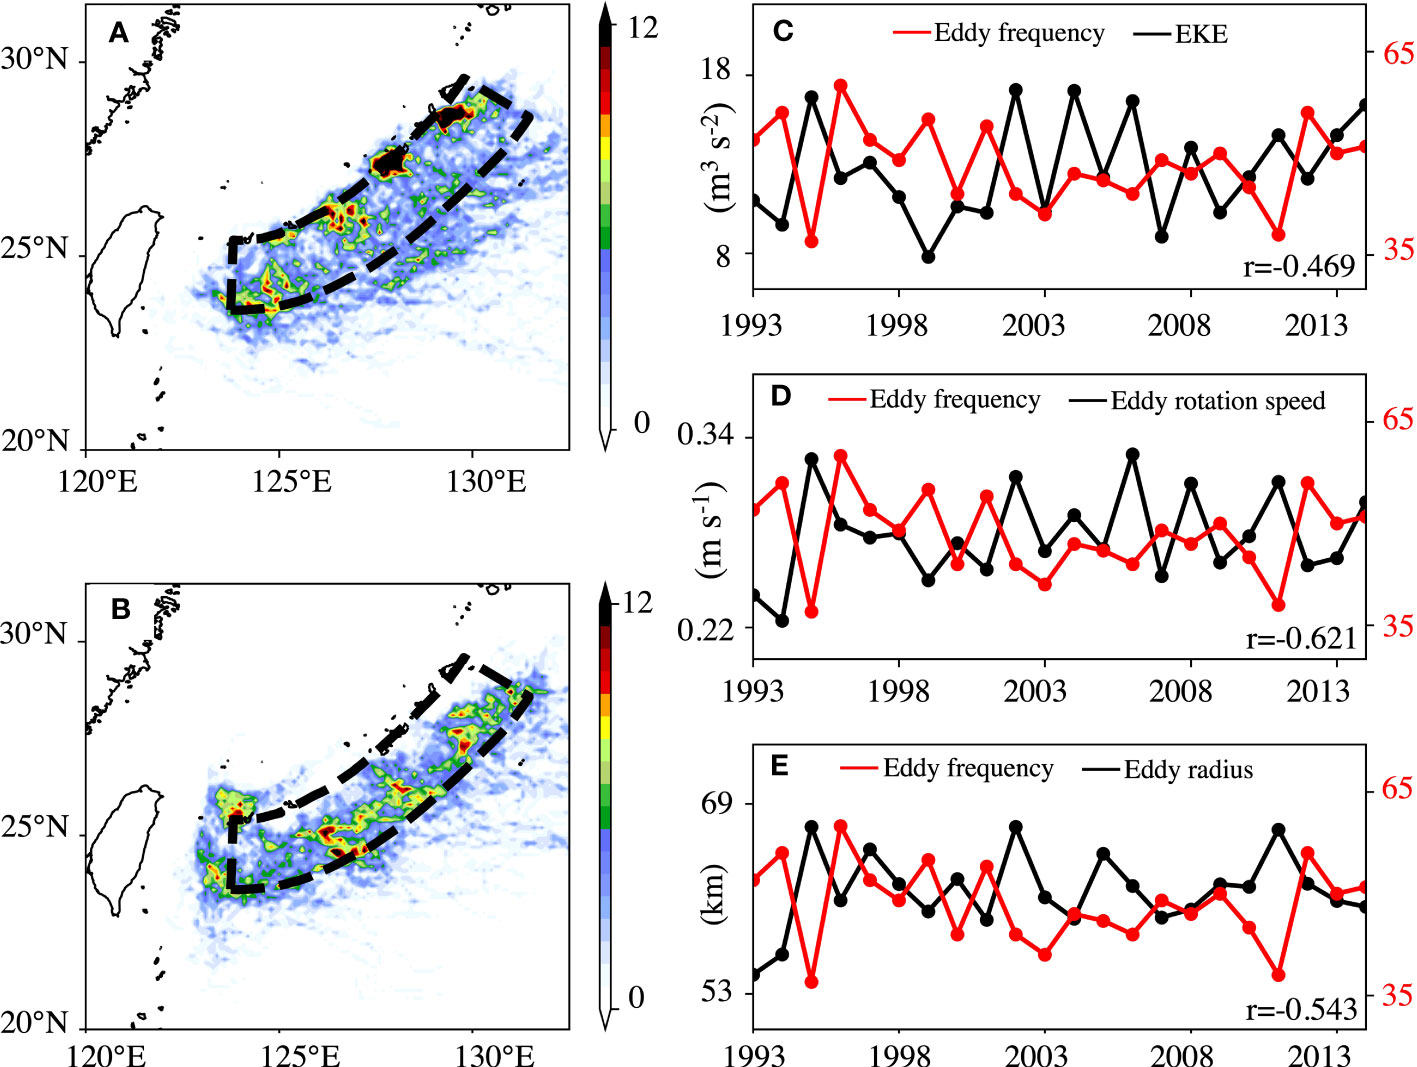
Figure 1 Quantitative analysis of (A) cyclonic eddies (CE) and (B) anti-cyclonic eddies (AE) that appeared in the study area (black dashed line box) in the period from 1993 to 2014. Time series of eddy frequency and (C) depth-integrated (above 800 m) EKE (black line), (D) eddy rotation speed (black line), and (E) eddy radius (black line) averaged in the study area. The eddy numbers in (A, B) were counted in each 0.25° × 0.25° box. The red lines in (C–E) indicate the eddy numbers appearing at each year (including AE, CE). All the correlation coefficients in (C–E) exceed the 95% confidence level.
The occurrence frequency of eddies in each year has interannual variability (Figure 1C); Notably, between 2002 and 2009, the variability in the occurrence frequency of eddies remained relatively small compared with other periods. Conversely, the EKE variability showed a distinctly high frequency from 2002 to 2009 compared to other periods. A negative correlation (r = -0.469, 95% confidence level) was observed between the depth integrated EKE and the eddy frequency (Figure 1C). This negative correlation remains significant (95% confidence level) as long as the depth for integration is no more than 800 m. Overall, the results indicate that the two quantifications exhibit opposite signs when considering interannual variability. This issue ultimately reduces to the definition of an ‘eddy’. EKE is generally used to represent mesoscale eddies in the conventional method and is calculated using an Eulerian framework. However, eddies from the trajectory data product were tracked using a Lagrangian framework. Furthermore, EKE according to its definition accounts for the velocity fluctuations due to eddies, fronts, waves, and the meandering of currents, while the Lagrangian eddy characteristics do not (Klein et al., 2019).
Other eddy properties were further examined; the appearance of eddies exhibited an evident and moderate negative correlation with the rotation speed and radius (r = -0.62 and r = -0.54, 95% confidence level), as shown in Figures 1D, E. This indicates that the eddies rotated fast and increased in size when they were fewer in number. Overall, the relationship between the two types of statistics can be summarized as follows. High EKE levels are associated with strong eddies with fast rotation speeds, wide radii, and low eddy numbers. These conclusions are consistent with those of a previous study conducted in the Bay of Bengal (Chen et al., 2012).
3.2 Interannual eddy variability revealed from the assimilation data product
The analysis in the previous section indicated that local eddies predominated the eddy variability in the study area, and the appearance of eddies correlated with the EKE variability. Therefore, the variability revealed by the eddy-trajectory data product can be understood using the conventional method. Before we discuss this issue further, it is necessary to check whether barotropic or baroclinic instabilities have occurred in the study area. For this purpose, we integrated the KmKe and PeKe terms at a depth of 800 m. Both KmKe and PeKe terms showed positive values in the study area (Figures 2A, B). This indicated that barotropic and baroclinic instabilities occurred in the study area. However, the horizontal structures of the two terms were different: depth-integrated KmKe (Figure 2A) exhibited a dipole structure with negative and positive values on the western and eastern sides of the RC, respectively, whereas depth-integrated PeKe (Figure 2B) showed a monopole structure with only positive values. The positive values of PeKe were over three-fold larger than those of KmKe in the study area. This result indicates that the baroclinic instability process in the study area contributes more to EKE variability than the barotropic instability process. The vertical sections illustrated in Figures 2C, D indicate that KmKe and PeKe were clustered above 1,000 m depth. Positive PeKe values were concentrated near the subsurface and were characterized by a positive core near 200 m. Positive KmKe values were also identified near the RC velocity core below the sea surface, indicating that both barotropic and baroclinic instabilities contributed to the EKE variation in the eastern RIC. However, it should be noted that the contributions of both barotropic and baroclinic instabilities to the EKE variation may vary depending on the location, and it is crucial to consider this when interpreting regional features.
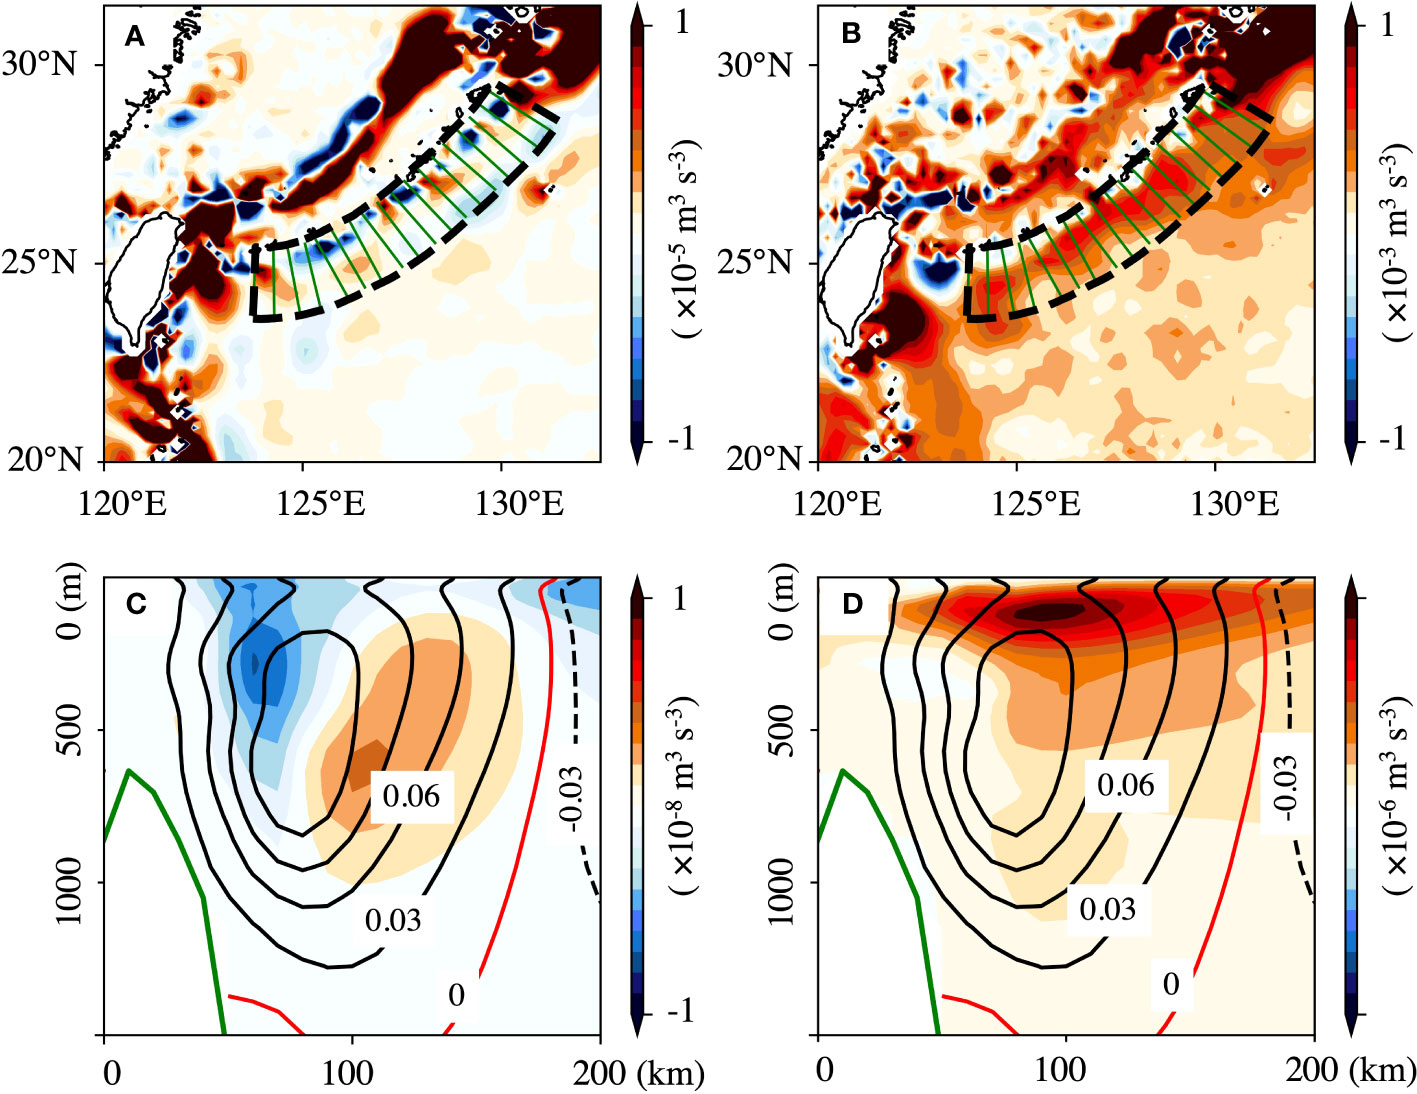
Figure 2 Horizontal distributions of the depth-integrated (above 800 m) (A) barotropic conversion rates, KmKe and (B) baroclinic conversion rates, PeKe. Vertical sections of (C) KmKe and (D) PeKe. The area covered by the black dashed lines in (A, B) was defined as our study area. The green lines in (A, B) reflect the along-stream cross sections (not all shown) in the study area. Each cross-section is 200 km in length and is aligned with a 10 km spatial interval along the 3,500 m isobath. The vertical sections show the mean values averaged in our study area. Black contours in (C, D) reflect the averaged normal velocity components (m s-1) in the study area.
As PeKe was found to be over three-fold larger than KmKe, we next compared the interannual EKE and PeKe variabilities. As illustrated in Figure 3A, the EKE variability (black line) exhibits an evident positive correlation (r = 0.64, 95% confidence level) with PeKe (red line) at the interannual timescale. The observed positive correlation between the EKE and PeKe variability suggests that changes in the intensity of baroclinic instability may have a direct impact on the EKE variability. It is important to note that the relationship between baroclinic instability and EKE is not always straightforward, as other factors such as front, wave, and current path variations can also influence EKE variability. Therefore, definitive statements regarding the relative importance of the two instability processes are not provided here. Future studies with more comprehensive analyses are required to fully understand the complex dynamics of EKE variability in the study area.
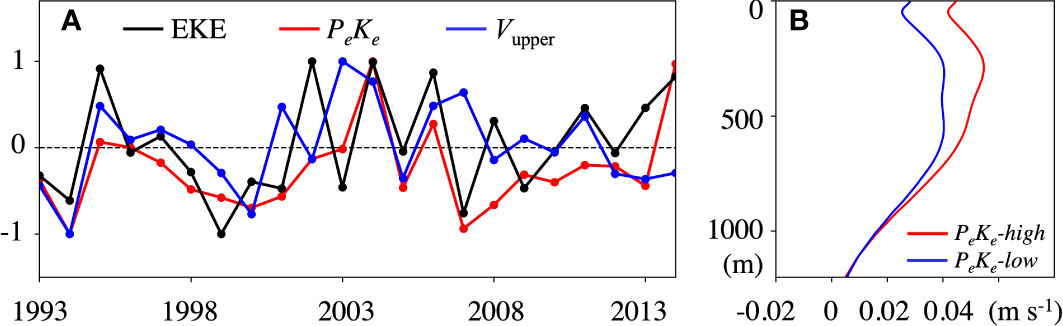
Figure 3 (A) Normalized time series of the depth-averaged (above 800 m) EKE (black line) PeKe (red line) and velocity (Vupper, green line) in the study area. (B) Vertical velocity profiles in PeKe-high (red line) and PeKe-low years (blue line) averaged in the study area. The PeKe-high years are defined as the year when the PeKe values are higher than the 22 year averaged values [black dashed line in (A)].
Given the evident positive correlation between the EKE and PeKe, it is reasonable to investigate the factors contributing to the variability in baroclinic instability. Figure 3B shows the velocity profiles averaged over the study area during PeKe-high (red line) and PeKe-low (blue line) years. The velocity variability was confined to a depth of almost 800 m. Using a two-layer model, Walker and Pedlosky (2002) revealed that the growth rates of baroclinic instability for meridional flow weaken as the vertical shear weakens. If the velocity above 800 m is considered the upper-layer velocity, the velocity variability would only exist in the upper layer, and the upper-layer velocity could serve as a practical representation of the vertical shear variability between the upper and lower layers, providing insights into the intensity of baroclinic instability. We first examined whether the upper-layer velocity was related to the baroclinic instability variability. A positive correlation (r = 0.46, 95% confidence level) was observed between PeKe (red line) and the upper-layer velocity (green line) (Figure 3A). Notably, the variabilities in PeKe and the upper-layer velocity were highly related until 2005. Qiao et al. (2022) demonstrated that a rapid phase shift accompanied by a relatively large wind-stress curl anomaly occurred in the STCC zone around 2006. The decline in the correlation after 2005 may be related to the regime shift in variability in the interior region. Nonetheless, the results generally indicate that PeKe is correlated with the upper-layer velocity for the period 1993–2014.
The time average of the upper-layer velocity (Figure 4A) indicated that the upper-layer velocity in the RC was related to the upstream condition. Apart from 23° N, water in the interior region enters the RC region through two pathways. The water north of 23°N enters the RC region directly, whereas the water south of 23° N first joins the Kuroshio east of Taiwan and then flows into the study area. As the northern edge of the westward NEC can extend to 28°N (Qiu et al., 2015), the variability in NEC is considered to have an impact on the upper-layer velocity in the RC region. The differences in the upper-layer velocity between the PeKe-high and PeKe-low years showed that the upper-layer velocity variability in the study area was affected by the variability in NEC; the velocity in NEC (122°–130°E, 20°–23°N) increased during the PeKe-high years, and more water from this area subsequently entered the study area, resulting in an increase in northeastward components. Here, PeKe -high/low years were defined as years when PeKe was larger/smaller than the 22 years average (Figure 3A). Although NEC was found to have an impact on the upper-layer velocity in the study area based on composite analysis, the correlation was not significant in the interannual time series. Other factors, such as the baroclinic response of the wind-stress curl at each latitude (Qiao et al., 2022), can also contribute to the upper-layer velocity variation. In addition, remote eddies can also be considered an external force for the upper-layer velocity in the study area (Zhu et al., 2003; Thoppil et al., 2016). Recently, Liu et al. (2022) showed that the topography of Rossby waves may also affect the RC. Further studies are necessary to clarify the driving mechanism of upper-layer velocity variability in the RC region.
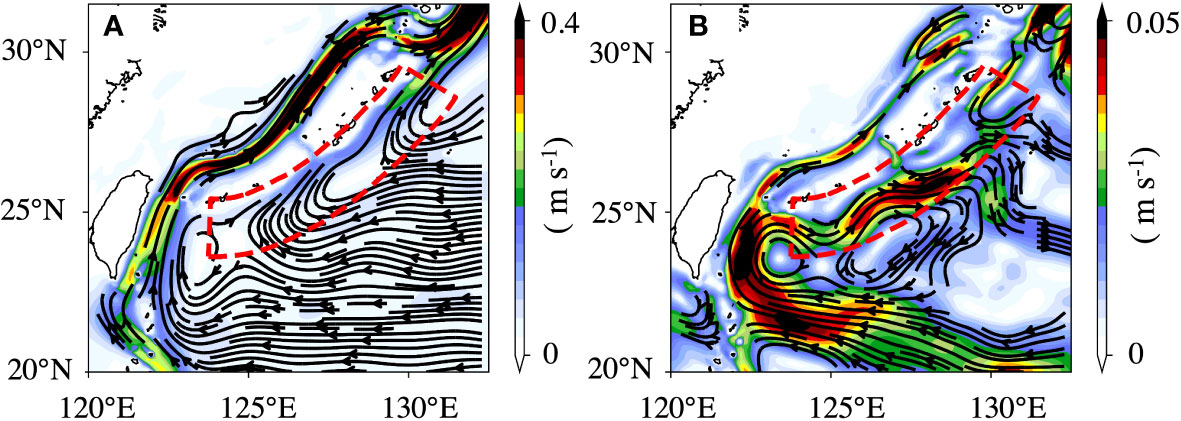
Figure 4 Horizontal distribution of (A) the depth-averaged (800 m) velocity over 22 years; (B) differences of the depth-averaged velocity in PeKe-high and PeKe-low years. The lines are streamlined based on the depth-averaged velocity field. The PeKe-high years are defined as the year when the PeKe values are higher than the 22 year averaged values (see Figure 3A). The areas covered by the red dashed lines in (A, B) were defined as our study area.
4 Discussions
This study elucidated the interannual eddy variability in the region east of the RIC based on eddy trajectory and assimilation data. Analysis on the eddy trajectory data showed that most eddies were initially identified within the study area, suggesting that interannual eddy variability in the study area was dominated by these ‘local’ eddies rather than ‘remote’ eddies that propagate far from the interior region. The occurrence frequency of eddies has interannual variability, but it demonstrates a different tendency from the results revealed by the EKE; a negative correlation was found between the occurrence frequency of eddies and the depth-integrated EKE, indicating that more eddies appear when the EKE is low. This negative correlation may be related to the following phenomenon: when the EKE is high, few eddies are identified; however, they become stronger with fast rotation speeds and increase in size. Analysis of the conversion rates revealed that the RC can act as an energy source for eddy growth. The baroclinic conversion rates were much higher than the barotropic conversion rates in the study area and were found to be highly related to EKE variability in the study area, suggesting the vital role of baroclinic instability in interannual EKE variability. The intensity of the baroclinic instability was related to the upper-layer (< 800 m) velocity variability in the study area from 1993 to 2014. Based on the composite analysis, the upper-layer velocity variability in the study area was affected by NEC. During the years when baroclinic instability intensified, the northern part of NEC, located at 122°–130°E, 20°–23°N, was enhanced. More water from NEC entered the area east of the RIC, resulting in an increase in upper-layer velocity. Consequently, baroclinic instability was enhanced, resulting in high EKE levels.
Our results demonstrate the impact of NEC on eddy variability in the region east of the RIC. At the interannual time scale, NEC variation is generally considered to be closely related to the El Niño-Southern Oscillation (ENSO). Although not all extremes of NEC transport are correlated with ENSO events, studies have found that NEC transport increases during El Niño and decreases during La Niña (Qiu and Lukas, 1996; Kashino et al., 2009). In fact, most PeKe-high years were El Niño years (1995, 2002, 2004, 2006, and 2014, based on the NINO3.4 Index). Therefore, eddies with fast rotation speeds and wide radii are expected to occur in the eastern RIC during ENSO events. Notably, the eddies analyzed in this study were tracked on closed SSH contours. Eddies can also be tracked using different methods such as the wind-angle eddy identification method (Chaigneau et al., 2009). Therefore, some differences are expected in the eddy statistical results when using different eddy trajectory data products. In addition, the choice of the dataset may also have an impact on the calculation of conversion rates. Comparative studies could help eliminate the impact of different methods on interannual eddy variability in the region east of the RIC.
Data availability statement
The FORA-WNP assimilation data product is managed by the Meteorological Research Institute of the Japan Meteorological Agency (JMA/MRI) and is open for use. Users need to apply for an account to get access to download this data product. The instructions and contact information are available here: http://search.diasjp.net/en/dataset/FORA_WNP30_JAMSTEC_MRI. The Mesoscale Eddy Trajectories Atlas products are download from the homepage of AVISO (https://www.aviso.altimetry.fr/en/home.html). An account is also required to download the data. The DOI for this data product is https://doi.org/10.24400/527896/a01-2021.001.
Author contributions
SK contributed to the original research. HK and X-HZ played instrumental roles in shaping the direction of this study. Z-LZ conducted data analysis and was responsible for writing the initial draft of the paper. All authors contributed to the article and approved the submitted version.
Funding
This work was supported by JSPS KAKENHI (grant numbers JP15H03725, JP19H05698, and JP22H04489), National Natural Science Foundation of China (grant number 41920104006), and Scientific Research Fund of the Second Institute of Oceanography, MNR (grant number JZ2001).
Acknowledgments
We would like to express our gratitude to the two reviewers for their comments and feedback, which greatly contributed to the improvement of this manuscript. Their suggestions and thorough reviews played a significant role in shaping the final version of the paper. We also extend our appreciation to the editor for their invaluable guidance and support throughout the review process. We would like to thank Editage (www.editage.jp) for English language editing.
Conflict of interest
The authors declare that the research was conducted in the absence of any commercial or financial relationships that could be construed as a potential conflict of interest.
Publisher's note
All claims expressed in this article are solely those of the authors and do not necessarily represent those of their affiliated organizations, or those of the publisher, the editors and the reviewers. Any product that may be evaluated in this article, or claim that may be made by its manufacturer, is not guaranteed or endorsed by the publisher.
References
Chaigneau A., Eldin G., Dewitte B. (2009). Eddy activity in the four major upwelling systems from satellite altimetry, (1992–2007). Prog. Oceanogr. 83, 117–123. doi: 10.1016/j.pocean.2009.07.012
Chelton D. B., Gaube P., Schlax M. G., Early J. J., Samelson R. M. (2011). The influence of nonlinear mesoscale eddies on near-surface oceanic chlorophyll. Science 334, 328–332. doi: 10.1126/science.1208897
Chelton D. B., Schlax M. G., Samelson R. M., de Szoeke R. A. (2007). Global observations of large oceanic eddies. Geophys. Res. Lett. 34, L15606. doi: 10.1029/2007GL030812
Chen G., Wang D., Hou Y. (2012). The features and interannual variability mechanism of mesoscale eddies in the Bay of Bengal. Contin. Shelf. Res. 47, 178–185. doi: 10.1016/j.csr.2012.07.011
Chow C. H., Tseng Y. H., Hsu H. H., Young C. C. (2017). Interannual variability of the subtropical countercurrent eddies in the North Pacific associated with the Western-Pacific teleconnection pattern. Contin. Shelf. Res. 143, 175–184. doi: 10.1016/j.csr.2016.08.006
Dong C., McWilliams J. C., Shchepetkin A. F. (2007). Island wakes in deep water. J. Phys. Oceanogr. 37, 962–981. doi: 10.1175/JPO3047.1
Farneti R., Delworth T. L., Rosati A. J., Griffies S. M., Zeng F. (2010). The role of mesoscale eddies in the rectification of the Southern Ocean response to climate change. J. Phys. Oceanogr. 40, 1539–1557. doi: 10.1175/2010JPO4353.1
Han S., Xu C., Wu H., Wang G., Pei J., Fan Y., et al. (2016). Study on the mesoscale eddies around the Ryukyu Islands. Acta Oceanologica Sinica 35 (3), 38–45. doi: 10.1007/s13131-016-0824-y
Ichikawa H., Nakamura H., Nishina A., Higashi M. (2004). Variability of northeastward current southeast of northern Ryukyu Islands. J. Oceanogr. 60, 351–363. doi: 10.1023/B:JOCE.0000038341.27622.73
Joyce T. M., Yasuda I., Hiroe Y., Komatsu K., Kawasaki K., Bahr F. (2001). Mixing in the meandering Kuroshio Extension and the formation of North Pacific Intermediate Water. J. Geophys. Res. 106, 4397–4404. doi: 10.1029/2000JC000232
Kashino Y., España N., Syamsudin F., Richards K. J., Jensen T., Dutrieux P., et al. (2009). Observations of the North Equatorial Current, Mindanao Current, and Kuroshio Current system during the 2006/7 El Niño and 2007/8 La Niña. J. Oceanogr. 65, 325–333. doi: 10.1007/s10872-009-0030-z
Klein P., Hua B. L., Lapeyre G., Capet X., Le Gentil S., Sasaki H. (2008). Upper ocean turbulence from high-resolution 3D simulations. J. Phys. Oceanogr. 38, 1748–1763. doi: 10.1175/2007JPO3773.1
Klein P., Lapeyre G., Siegelman L., Qiu B., Fu L. L., Torres H., et al. (2019). Ocean-scale interactions from space. Earth Space. Sci. 6, 795–817. doi: 10.1029/2018EA000492
Liu Y., Dong C., Liu X., Dong J. (2017). Antisymmetry of oceanic eddies across the Kuroshio over a shelfbreak. Sci. Rep. 7, 6761. doi: 10.1038/s41598-017-07059-1
Liu Z. J., Zhu X. H., Nakamura H., Wang M., Nishina A., Qiao Y. X., et al. (2022). Response of the Ryukyu Current to climate change during 1993–2018: Is there a robust trend? J. Geophys. Res. Oceans. 127, JC018957, e2022. doi: 10.1029/2022JC018957
Mason E., Pascual A., McWilliams J. C. (2014). A new sea surface height–based code for oceanic mesoscale eddy tracking. J. Atmos. Ocean. Technol. 31, 1181–1188. doi: 10.1175/JTECH-D-14-00019.1
Mizuno K., White W. B. (1983). Annual and interannual variability in the Kuroshio current system. J. Phys. Oceanogr. 13 (10), 1847–1867. doi: 10.1175/1520-0485(1983)013<1847:AAIVIT>2.0.CO;2
Petersen M. R., Williams S. J., Maltrud M. E., Hecht M. W., Hamann B. (2013). A three-dimensional eddy census of a high-resolution global ocean simulation. J. Geophys. Res. Oceans. 118, 1759–1774. doi: 10.1002/jgrc.20155
Qiao Y. X., Nakamura H., Kako S., Nishina A., Tomita T. (2022). Synchronized decadal variabilities in the Kuroshio and Kuroshio Extension system. Prog. Oceanogr. 204, 102808. doi: 10.1016/j.pocean.2022.102808
Qin D., Wang J., Liu Y., Dong C. (2015). Eddy analysis in the Eastern China Sea using altimetry data. Front. Earth Sci. 9 (4), 709–721. doi: 10.1007/s11707-015-0542-3
Qiu B. (1999). Seasonal eddy field modulation of the North Pacific Subtropical Countercurrent: TOPEX/Poseidon observations and theory. J. Phys. Oceanogr. 29, 2471–2486. doi: 10.1175/1520-0485(1999)029<2471:SEFMOT>2.0.CO;2
Qiu B., Chen S. (2005). Variability of the Kuroshio Extension jet, recirculation gyre, and mesoscale eddies on decadal time scales. J. Phys. Oceanogr. 35, 2090–2103. doi: 10.1175/JPO2807.1
Qiu B., Chen S. (2011). Effect of decadal Kuroshio Extension jet and eddy variability on the modification of North Pacific Intermediate Water. J. Phys. Oceanogr. 41, 503–515. doi: 10.1175/2010JPO4575.1
Qiu B., Chen S. (2013). Concurrent decadal mesoscale eddy modulations in the western North Pacific subtropical gyre. J. Phys. Oceanogr. 43, 344–358. doi: 10.1175/JPO-D-12-0133.1
Qiu B., Chen S., Klein P., Sasaki H., Sasai Y. (2014). Seasonal mesoscale and submesoscale eddy variability along the North Pacific Subtropical Countercurrent. J. Phys. Oceanogr. 44, 3079–3098. doi: 10.1175/JPO-D-14-0071.1
Qiu B., Lukas R. (1996). Seasonal and interannual variability of the North Equatorial Current, the Mindanao Current, and the Kuroshio along the Pacific western boundary. J. Geophys. Res. 101, 12315–12330. doi: 10.1029/95JC03204
Qiu B., Rudnick D. L., Cerovecki I., Cornuelle B. D., Chen S., Schönau M., et al. (2015). The pacific north equatorial current: New insights from the origins of the Kuroshio and Mindanao currents (OKMC) project. Oceanography 28, 24–33. doi: 10.5670/oceanog.2015.78
Rieck J. K., Böning C. W., Greatbatch R. J., Scheinert M. (2015). Seasonal variability of eddy kinetic energy in a global high-resolution ocean model. Geophys. Res. Lett. 42, 9379–9386. doi: 10.1002/2015GL066152
Thoppil P. G., Metzger E. J., Hurlburt H. E., Smedstad O. M., Ichikawa H. (2016). The current system east of the Ryukyu Islands as revealed by a global ocean reanalysis. Prog. Oceanogr. 141, 239–258. doi: 10.1016/j.pocean.2015.12.013
Usui N., Tsujino H., Nakano H., Matsumoto S. (2013). Long-term variability of the Kuroshio path south of Japan. J. Oceanogr. 69, 647–670. doi: 10.1007/s10872-013-0197-1
Walker A., Pedlosky J. (2002). Instability of meridional baroclinic currents. J. Phys. Oceanogr. 32, 1075–1093. doi: 10.1175/1520-0485(2002)032<1075:IOMBC>2.0.CO;2
Yang H., Chang P., Qiu B., Zhang Q., Wu L., Chen Z., et al. (2019). Mesoscale air–sea interaction and its role in eddy energy dissipation in the Kuroshio Extension. J. Clim. 32, 8659–8676. doi: 10.1175/JCLI-D-19-0155.1
Yasuda I., Okuda K., Hirai M. (1992). Evolution of a Kuroshio warm-core ring—Variability of the hydrographic structure. Deep. Sea. Res. A. 39, S131–S161. doi: 10.1016/S0198-0149(11)80009-9
Zhang Z. L., Nakamura H., Zhu X. H. (2021). Seasonal velocity variations over the entire Kuroshio path part I: data analysis and numerical experiments. J. Oceanogr. 77, 719–744. doi: 10.1007/s10872-021-00604-7
Zhao R., Nakamura H., Zhu X. H., Park J. H., Nishina A., Zhang C., et al. (2020). Tempo-spatial variations of the Ryukyu Current southeast of Miyakojima Island determined from mooring observations. Sci. Rep. 10, 6656. doi: 10.1038/s41598-020-63836-5
Zhu X. H., Han I. S., Park J. H., Ichikawa H., Murakami K., Kaneko A., et al. (2003). The northeastward current southeast of Okinawa Island observed during November 2000 to August 2001. Geophys. Res. Lett. 30 (2), 1071. doi: 10.1029/2002GL015867
Keywords: mesoscale eddy, interannual variability, Ryukyu Current, baroclinic instability, North Equatorial Current
Citation: Zhang Z-L, Nakamura H, Kako S and Zhu X-H (2023) Interannual eddy variability in the eastern Ryukyu Island chain. Front. Mar. Sci. 10:1242294. doi: 10.3389/fmars.2023.1242294
Received: 19 June 2023; Accepted: 18 August 2023;
Published: 31 August 2023.
Edited by:
Youyu Lu, Bedford Institute of Oceanography (BIO), CanadaReviewed by:
Chuanyu Liu, Chinese Academy of Sciences (CAS), ChinaYoung-Gyu Park, Korea Institute of Ocean Science and Technology (KIOST), Republic of Korea
Copyright © 2023 Zhang, Nakamura, Kako and Zhu. This is an open-access article distributed under the terms of the Creative Commons Attribution License (CC BY). The use, distribution or reproduction in other forums is permitted, provided the original author(s) and the copyright owner(s) are credited and that the original publication in this journal is cited, in accordance with accepted academic practice. No use, distribution or reproduction is permitted which does not comply with these terms.
*Correspondence: Zhen-Long Zhang, Y2hvQGxvd3RlbS5ob2t1ZGFpLmFjLmpw