 Mingxin Liu
 Wencheng Jiang1
 Ruixin Li
- 1School of Electronics and Information Engineering, Guangdong Ocean University, Zhanjiang, China
- 2School of Mechanical Engineering, Guangdong Ocean University, Zhanjiang, China
- 3Naval Architecture and Shipping College, Guangdong Ocean University, Zhanjiang, China
Introduction: Preserving the marine ecological environment and safeguarding marine species is a global priority. However, human overfishing has led to a drastic decline in fish species with longer growth cycles, disrupting the equilibrium of the marine ecosystem. To address this issue, researchers are turning to deep learning techniques and state-of-the-art underwater devices, such as underwater robots, to explore the aquatic environment and monitor the activities of endangered populations. This approach has emerged as a focal point of recent research in protecting the marine ecological environment. This study employs a deep learning-based object detection algorithm to identify fish species in complex underwater environments.
Methods: The algorithm is built upon the You Only Look Once version 7(YOLOv7) algorithm, with the addition of the attention mechanism Convolutional Block Attention Module (CBAM) in the network’s backbone. CBAM enhances the feature maps through the fusion of spatial attention and channel attention, ultimately improving the robustness and accuracy of the model’s inference by replacing the original loss function CIoU with SCYLLAIntersection over Union(SIoU). In this paper, the rockfish pictures in the dataset Label Fishes in the Wild published by the National Marine Fisheries Service are selected, and the underwater image enhancement model (UWCNN) is introduced to process the pictures.
Result: The experimental results show that the mean average precision (mAP) value of the improved model on the test set is 94.4%, which is 3.5% higher than the original YOLOv7 model, and the precision and recall rate are 99.1% and 99%, respectively. The detection performance of the algorithm in the field of complex underwater environment is improved.
Discussion: The underwater fish detection scheme proposed in this study holds significant practical value and significance in promoting the conservation of marine ecosystems and the protection of fish species.
1 Introduction
The ocean is a significant constituent of the global ecosystem, encompassing the vast majority of the Earth’s total surface area. It contains abundant resources such as water, sustenance, petroleum, minerals, and natural gas, making it a valuable treasure for the sustainable advancement of human society. Hence, safeguarding the marine environment and its resources is crucial for the sustainable progress of humankind. However, with the advancement of technology, fishing efforts have increased, leading to a significant decline in the population of fish species with longer reproductive cycles. This has had a profound impact on the stability of the marine ecosystem. Healthy marine populations provide a vital source of protein for billions of people worldwide. Preserving marine species safeguards this crucial food source. The term “Pacific rockfish” collectively denotes the bottomdwelling fish inhabiting the waters extending from Alaska to California. Several of these fish possess commercial value, they serve as sources of high-quality protein. Nevertheless, due to they have long growth periods, they are susceptible to overfishing. Marine species play pivotal roles in maintaining the equilibrium of ocean ecosystems. To preserve rockfish populations, it is imperative to engage in the observation of this population to gain insights into the status of the rockfish population.
To better understand the abundance and growth conditions of marine fish, researchers have developed underwater robots, such as Remotely Operated Vehicles (ROVs) and Autonomous Underwater Vehicles (AUVs) (Boudhane and Nsiri, 2016), to navigate complex underwater environments. These technological marvels have played a crucial role in exploring marine resources and preserving the marine environment. Over the past decade, with the progress of deep learning and computer vision, computer vision has exhibited the cutting-edge capabilities of artificial intelligencein various domains. Among the core tasks of computer vision, one of utmost importance is object detection, which serves as a primary mission for underwater robots, enabling them to execute observation tasks in underwater environments, replacing human presence. The applications of underwater object detection encompass underwater biodiversity monitoring (Ahn et al., 2017), marine organism conservation, marine environmental protection, and aquaculture, serving as an effective means to advance diverse fields. However, due to the properties of water, light undergoes absorption and scattering, resulting in significant image noise within the aquatic medium. This poses greater challenges for object detection algorithms operating in such conditions.
The algorithm proposed by R. Girshick et al, Region-based Convolutional Neural Network (RCNN) (Girshick et al., 2014), represents a milestone in object detection as it is the first time that convolutional neural networks have been employed in this task. This marks the advent of deep learning-based object detection algorithms. However, R-CNN suffers from an excessively large number of candidate boxes on the image, and limited computer resources result in slow processing speeds. In response to this challenge, Kai Ming He et al. (He et al., 2015) proposed the Spatial Pyramid Pooling Network (SPPNet) to address the issue of computationally intensive convolutional operations caused by the vast number of candidate regions in R-CNN. SPPNet calculates the feature maps of the entire image only once and generates a fixed-length feature vector, thus reducing the need for repeated convolutional computations and significantly improving processing speed. However, during training, SPPNet still employs Support Vector Machine (SVM), which stores the processed feature vectors in the disk, leading to the issue of consuming a significant amount of memory resources. To address these issues, scholars have proposed Fast Region-based Convolutional Neural Network (Fast R-CNN) (Girshick, 2015) and Faster Region-based Convolutional Neural Network (Faster R-CNN) (Ren et al., 2015). Fast R-CNN combines R-CNN and SPPNet, optimizing the computation of candidate boxes with the idea of image normalization. It achieves faster processing speed compared to R-CNN without sacrificing accuracy. Additionally, Fast R-CNN eliminates the need to store features in disks during training, thus resolving the issue of large memory consumption. However, the selective search algorithm used by Fast R-CNN to extract candidate regions occupies a significant portion of the detection time, constraining the detection speed. Faster R-CNN was proposed by S. Ren, K. He, J. Sun, and R. Girshick, the author of Fast RCNN. Based on Fast R-CNN, Faster R-CNN uses the RPN network, which not only reduces the time required for feature extraction but also easily integrates with R-CNN. It is the first end-to-end object detector. However, Faster R-CNN still has its shortcomings. On the one hand, the existence of two stages, RPN and R-CNN, prevents the network from achieving real-time detection. On the other hand, there is still a significant computational cost in obtaining region proposals and calculating the final fully connected layer. In the year 2016, R. Joseph et al. introduced You only look once (YOLO) (Redmon et al., 2016), marking the emergence of one-stage detectors. Unlike algorithms like R-CNN that generate candidate boxes for classification, YOLO transforms the problem of object bounding box localization into a regression problem, without generating any candidate boxes. The speed of YOLO is significantly improved compared to two-stage detectors such as R-CNN. However, YOLO suffers from poor localization accuracy and inadequate detection performance for small objects. Thereafter, R. Joseph et al. introduced improved versions, such as, YOLOv2 (Redmon and Farhadi, 2017), YOLOv3 (Redmon and Farhadi, 2018), YOLOv4(Bochkovskiy et al., 2020), combining both speed and accuracy improvements, resulting in an increasingly strong performance.
However, due to the particularity of underwater environments, the imaging quality of underwater optical images is poor. Therefore, traditional object detection algorithms have not been very effective in underwater application scenarios. As a result, many researchers have proposed various methods for processing underwater images. Jiang et al. (Jiang et al., 2022c)proposed a transfer learning-based adaptive framework for enhancing real-world underwater images, which involves the conversion of in-air images into enhanced underwater images. Li and colleagues (Li et al., 2022) proposed an underwater image enhancement framework comprising an adaptive color restoration module and a dehazing module based on the haze-line, capable of simultaneously restoring color and removing haze in underwater images. Wong et al. (Wong et al., 2018) proposed a method that integrates parallel operations of the Adaptive Grey World (AGW) and Differential graylevel Histogram Equalization (DHE) to eliminate color cast in underwater images and enhance the contrast. Mohd and colleagues (Mohd Azmi et al., 2019)proposed a method of red channel correction based on green and blue channels (RCCGB), and simultaneous contrast stretching and mean pixel enhancement (SCSMPE), which effectively reduced the blue-green color cast and improved image contrast. Yu et al. (Yu et al., 2020) propose an underwater image denoising method that employs operations such as homomorphic filtering, dual transmission maps, and doublelogarithmic wavelet fusion to achieve color correction and image enhancement. Image enhancement algorithms can have a positive impact on the processing of underwater images. However, due to the complexity of underwater optical environments, different enhancement algorithms may have varying results in different underwater environments. Moreover, algorithms that require learning may be time-consuming and may not achieve the desired effect when applied.
The mechanism of attention can be considered a way of allocating weight parameters in neural networks. During training, the model pays more attention to certain objects, resulting in the allocation of more weight parameters to those objects. This enables the model to extract more features related to the objects of interest, suppress irrelevant information, improve the detection effect of the objects of interest, and ultimately enhance the detection accuracy of the model. In 2014, Mnih et al. (Mnih et al., 2014) from Google made the pioneering use of the attention mechanism on RNN. Subsequently, Xu et al. (Xu et al., 2015) proposed two attention mechanisms in 2015, namely the soft deterministic mechanism trained using basic backpropagation and the hard stochastic mechanism trained using reinforcement learning, which were applied in image processing. In 2017, Fu et al. (Fu et al., 2017) proposed a recurrent attentional convolutional neural network (RA-CNN) that recursively analyzes local information of images to extract finer features. The network also includes an attention generation subnetwork which generates several regions in the image, predicts the outcomes for these regions, and then integrates all the predictions to output the final result. In the year 2017, Hu (Hu et al., 2018) and colleagues presented the Squeeze-andExcitation (SE) block, which is a classic work of channel dimension attention mechanism. This block can adaptively re-calibrate channel feature responses. Subsequently, an increasing number of researchers have introduced attention from various aspects and dimensions, such as spatial attention, Efficient Pyramid Split Attention Block on Convolutional Neural Network (EPSANet) (Zhang et al., 2021), the self-attention of Efficient Multi-Head Self-Attention (EMSA) (Zhang and Yang, 2021), the spatial and channel mixed attention of CBAM (Woo et al., 2018) and Bottleneck attention module (BAM) (Park et al., 2018), the temporal attention of Interaction-Aggregation-Update Network (IAU-Net)(Hou et al., 2020), the frequency domain attention of Frequency channel attention network (FCA-Net) (Qin et al., 2021), the global attention of Relation-aware global attention (RGANet)(Zhang et al., 2020), and the hierarchical attention of Two-level attention (Xiao et al., 2015). The introduction of attention mechanisms has become one of the key areas of improvement for many algorithms. However, it remains unknown whether the introduction of attention mechanisms can enhance model accuracy, and on the other hand, inevitably increases the number of parameters. Therefore, selecting appropriate attention mechanisms for the network is a worthwhile issue to contemplate.
In recent years, an increasing number of researchers have applied improved object detection algorithms to underwater environments, proposing numerous underwater object detection algorithms. Zeng et al. (Zeng et al., 2021) proposed an underwater object recognition algorithm based on Faster R-CNN and adversarial networks, which addresses the issue of low detection accuracy when underwater organisms are occluded. However, the training time for the network is relatively long. Lei et al. (Lei et al., 2022) have proposed utilizing Swin Transformer as the fundamental backbone network for YOLOv5 and improved the YOLOv5 object detection algorithm by enhancing the Path Aggregation Network (PANet) for multi-scale feature fusion. This approach has proven effective in accurately identifying targets in complex environments; however, the model’s size is relatively large. Chen et al. (Chen et al., 2021) proposed incorporating transpose convolutional modules and depthwise separable convolutions into YOLOv4, as well as using an improved mosaic augmentation combining the gray world algorithm in data preprocessing to enhance the complexity of the background. However, this approach is unable to reinforce the extraction of color features during training for images with color distortion. Liu et al. (Liu et al., 2023) proposed a target detection algorithm, Transformer self-attention and coordinate attention-YOLO (TC-YOLO), which is based on YOLOv5 and incorporates adaptive histogram equalization and attention mechanism. However, the adaptive histogram equalization algorithm has limitations in handling dark details in images, which may slightly affect the detection accuracy. Wei et al. (Wei et al., 2021) proposed a novel object detection algorithm based on enhanced scale and attention mechanisms, which significantly improved the detection accuracy of small targets. However, the introduction of attention mechanisms also led to an increase in model parameter size. Guan et al. (Guan et al., 2022) proposed using a cosine annealing learning rate optimization strategy to train the YOLOv4 underwater object detection model and adopted the optimized auto Multi-Scale Retinex with Color Restoration (autoMSRCR) algorithm. However, the images restored in turbid water suffer from color distortion, which leads to poor detection performance. Qu et al. (Qu et al., 2022) proposed a Multi-Color Convolution and Attention Net (MCCA-Net), which stacks to effectively enhance the features of underwater images and improve the accuracy of model classification. However, this inevitably increases the computational complexity of the model.
Some scholars have combined the attention mechanism into the YOLOv7 (Wang et al., 2022) algorithm. Jiang et al. (Jiang et al., 2022b) added the attention mechanism to the enhanced feature network extraction part of the YOLOv7 network to retain part of the original weights of the backbone network. Zheng et al. (Zheng et al., 2022) proposed to use K-means++ clustering algorithm to generate anchor boxes more suitable for detecting targets. The Coordinate Attention mechanism (CoordAtt) Module and HorBlock Module are added to the network. HorBlock Module consists of gnConv (gated convolution) and layer norm normalization, and they both use SIoU (Gevorgyan, 2022) as the loss function. Although the previous works have achieved promising results, their applications are carried out in scenes under normal light conditions, which are different from the underwater environment. In the dark underwater environment, rockfish, the detection object selected in this paper, resides in the seabed rocks, and the colors of corals and seabed plants distributed on the rocks are the natural protective colors of rockfish. Specifically, underwater image quality, realistic underwater environment and other conditions are the main challenges that limit the accuracy of underwater target detection and localization. To address the aforementioned issues and enhance the detection accuracy of target detection algorithms in underwater images, we propose a target algorithm that combines the improved YOLOv7 with UWCNN (Li et al., 2020), which can accurately detect fish and other targets in complex and dark underwater environments in the wild. The main contributions of this article are as follows:
(1) To address the problem of low detection accuracy caused by complex underwater environments, we added a CBAM module to the backbone feature extraction network of the network. This allows the backbone network to generate channel attention maps and spatial attention maps based on the channel and spatial relationships between features during feature extraction.
(2) To address the problem of missed and false detections caused by the dark underwater environment, we introduced an underwater image enhancement convolutional neural network model with underwater scene priors, called UWCNN, to enhance the images. This model does not require the estimation of parameters of the underwater imaging model and can directly reconstruct clear potential underwater images.
(3) To address the issue of slow convergence of the loss function during training, as well as to improve the speed of training and the accuracy of inference, this article replaces the original loss function Complete Intersection Over Union (CIoU) with the more superior performance loss function SIoU to enhance the model’s performance.
2 Methods
2.1 YOLOv7 network architecture
The YOLO series algorithms are typical representatives of one-stage object detection algorithms, which are based on deep convolutional neural networks for object recognition and localization. The YOLOv7 model structure comprises three main components, namely, the input terminal (Input), the backbone network (backbone), and the head (Head). The input terminal will resize the input image to a predetermined, uniform size while processing the image using Mosaic data augmentation and adaptive anchor box calculation. The backbone feature extraction network is utilized to extract features that are subsequently fused in the head and generate predictions of bounding boxes and object categories, thereby accomplishing object detection. The YOLOv7’s backbone feature extraction network is comprised of composition of Convolutional-Batch Normalization-SiLU modules (CBS), efficient layer aggregation network (ELAN) modules, and MaxPool-CBS (MP) modules, which alternately reduce the length and width of the feature maps while doubling the number of output channels in comparison to the number of input channels. YOLOv7 uses ELAN to extend, shuffle, and merge the radix without breaking the original gradient path, continuously enhancing the learning ability of the network. With in the MP module, there exist two branches, whereby the upper branch employs a max-pooling operation to reduce the length and width of the feature map by half, and subsequently halves the channel of the feature map via a convolutional operation. The lower branch of the network implements a first convolution operation to reduce the number of channels, followed by a second convolution operation to reduce the width and length of the feature map, before finally merging with the upper branch. Finally, an output feature map with half the length and width of the original, and consistent input and output channel numbers are obtained. The Head module is composed of a Path Aggregation Feature Pyramid Network (PAFPN), a Spatial Pyramid Pooling and Convolutional Spatial Pyramid Pooling (SPPCPC) module, a series of CBS modules, an MP module, a Concatenation (Concat) module, and three Repconv modules. After the image is fed into the network, the final prediction results are output through the REP and CBM modules in the Head. We have substituted the first three CBS in the backbone with the attention mechanism CBAM, preprocess the image using the UWCNN underwater enhancement algorithm. And the improved network is shown in Figure 1. The model in this article consists of 379 layers, comprising a parameter count of 36,677,869, and it occupies a memory size of approximately 71.6MB. The partial configuration of the model is precisely delineated in Table 1.

Figure 1 Structure of the improved YOLOv7 network.
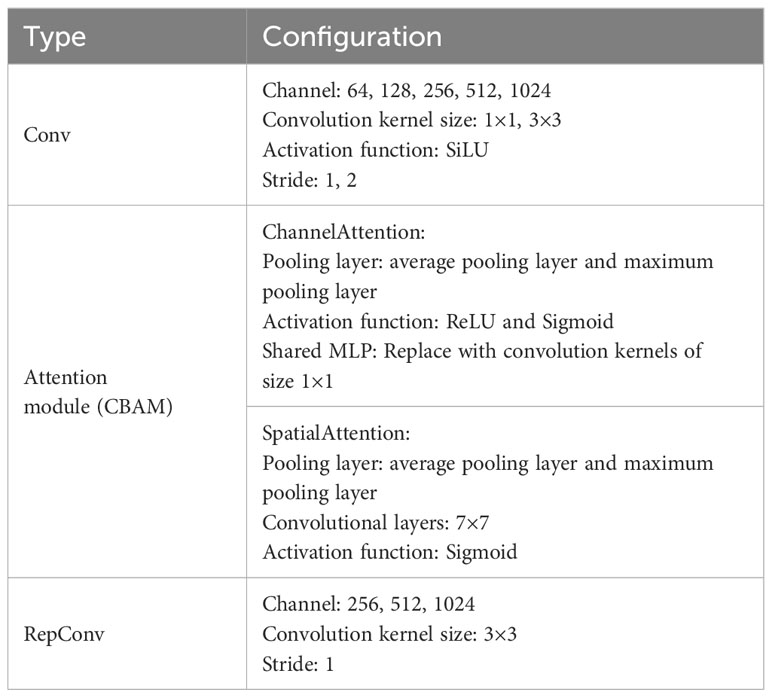
Table 1 Parameter configuration of our method.
2.2 The attention mechanism
The underwater environment is typically dimly lit and is filled with interfering elements such as rocks and aquatic plants, which can impede detection. To address the issue of missed detections and false alarms in complex underwater environments when using YOLOv7, this paper introduces an attention mechanism, CBAM, into the network. CBAM is a mechanism of attention proposed by Woo et al. in 2018, which combines two dimensions of analysis, namely channel attention and spatial attention. This module is composed of a channel attention module and a spatial attention module. The structural diagram of the CBAM module is illustrated in Figure 2.

Figure 2 CBAM module structure diagram.
The structure of the Channel Attention Module is illustrated in Figure 3. Firstly, the input feature map is subjected to both Maximum Pooling (MaxPool) and Average Pooling (AvgPool),resulting in two feature vectors of size [C,1,1], from the original feature map size of [C, H, W]. These vectors are then fed into a Multi-Layer Perceptron network (MLP) with shared network parameters. The two resulting output features are merged using an element-wise summation and normalized using the sigmoid activation function to obtain the weights (Mc(fm)), for each channel of the feature map. The calculation formula is as follows.
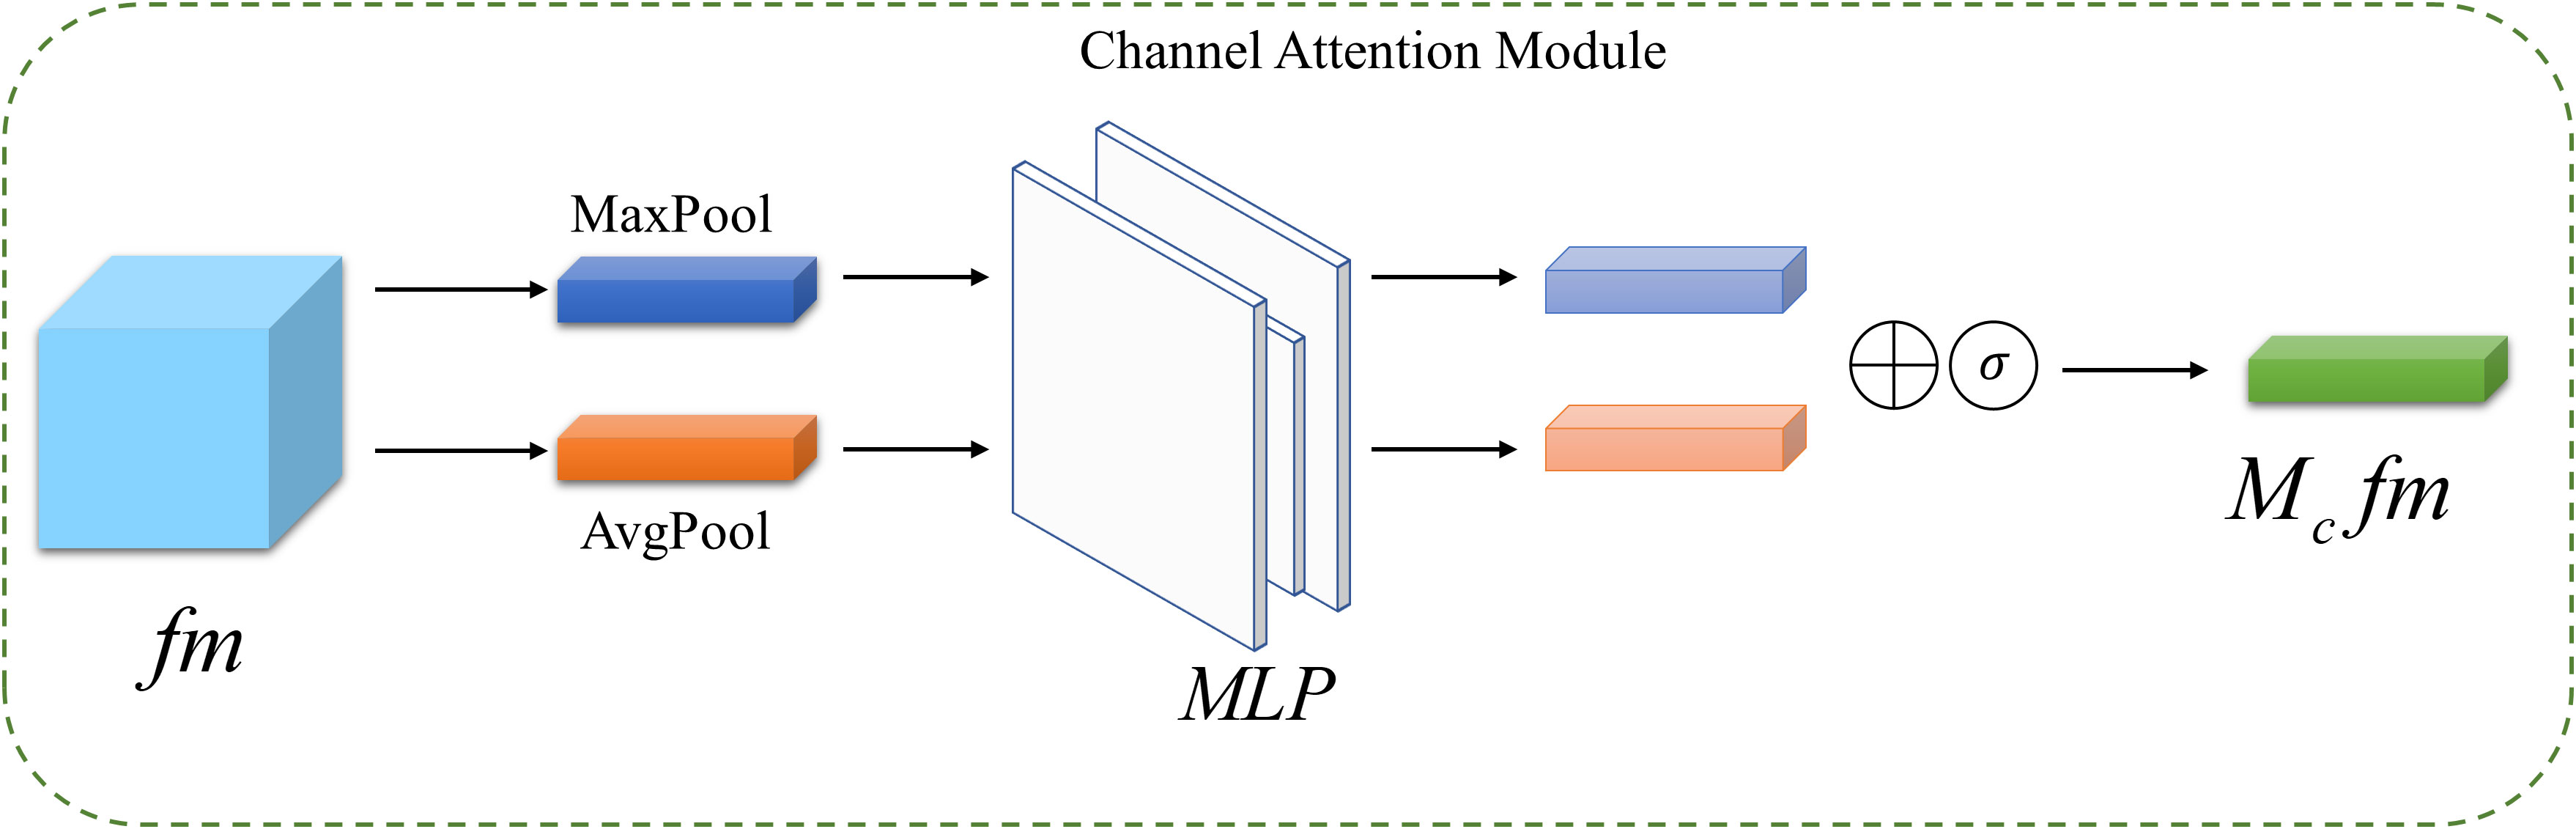
Figure 3 Channel attention module structure diagram.
In the given expression, represents the sigmoid activation function, (MLP) stands for multilayer perceptron network, (AvgPool) denotes average pooling, and (MaxPool) indicates maximum pooling. The channel attention feature map fm′ is obtained by multiplying the channel weights with the input feature map fm, as expressed by the following mathematical formula.
The symbol ⊗ denotes element-wise multiplication, as used in the given equation.
The spatial attention module is illustrated in Figure 4. Upon entering the module, the channel attention feature map undergoes both max pooling and average pooling operations, resulting in two spatial weight vectors of size [1, H, W] for each feature point across all channels. These vectors are then concatenated to form a two-dimensional spatial weight vector, which is subsequently convolved and activated by a sigmoid function to obtain a one-dimensional spatial weight, as expressed by the following mathematical formula.
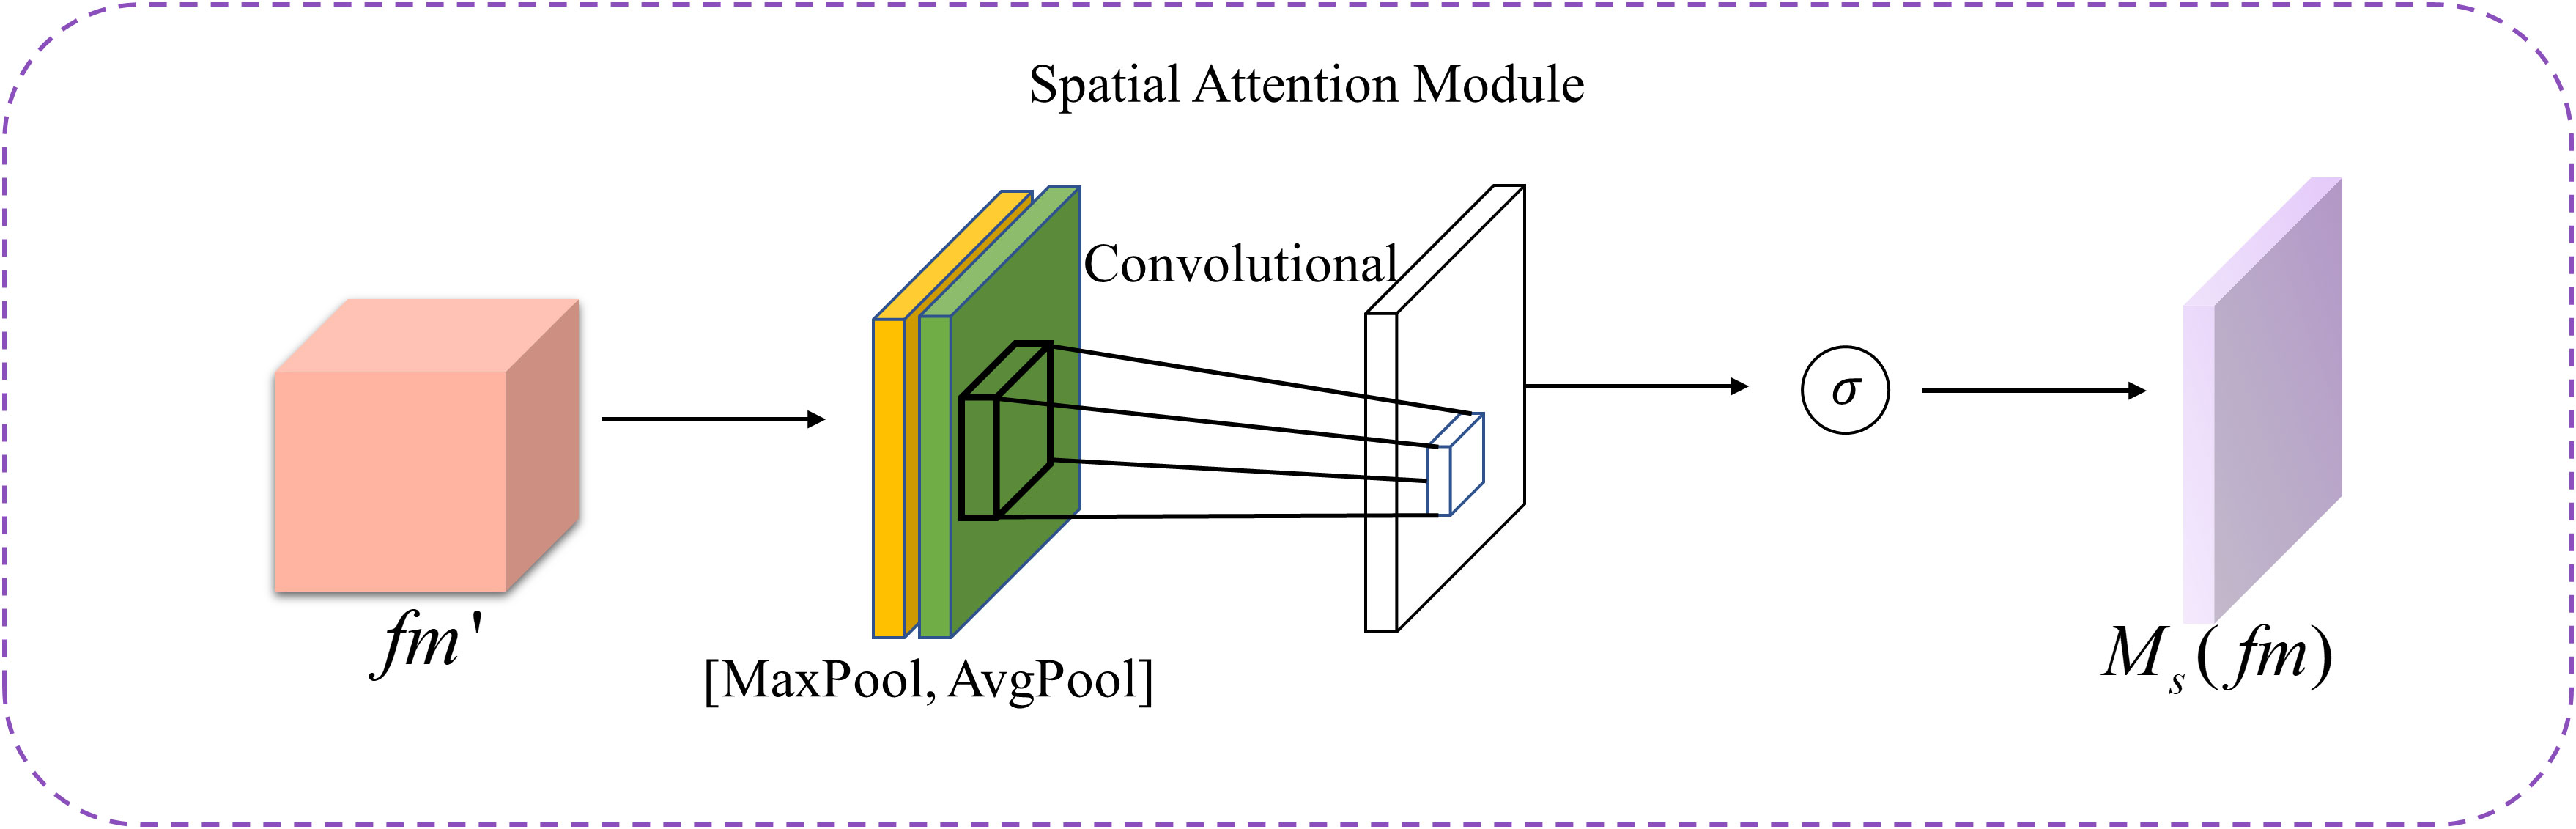
Figure 4 Spatial attention module structure diagram.
In the given equation, f7×7denotes a convolutional kernel of size 7×7.
Finally, the obtained spatial weights are multiplied with the channel attention feature map fm′ to produce the ultimate attention feature map FM, as expressed by the following mathematical formula.
2.3 The underwater enhanced algorithm UWCNN
The underwater enhancement algorithm UWCNN is a convolutional neural network model for enhancing underwater images based on underwater scene priors, proposed by Li et al. It combines the underwater imaging physical model with the optical characteristics of the underwater scene. This model does not require the estimation of parameters for the underwater imaging model but directly reconstructs clear latent underwater images. The structure of the UWCNN model is depicted in Figure 5. The network consists of three distinct layers, with the first type being a convolutional layer composed of 16 convolutional kernels of size 3×3×3, generating 16 feature maps for the first layer. The second type pertains to the activation layer “ReLU” which is utilized to introduce non-linear functions. The third type is the Concat layer, utilized to connect all convolutional layers after each block. The final convolutional layer estimates the ultimate output of the network.

Figure 5 UWCNN model structure diagram.
Due to the optical characteristics of the underwater environment, some images in the dataset suffer from poor imaging quality. With the aid of this underwater enhancement algorithm, it is effective in restoring color distortion in severely damaged images, thus processing is applied to certain images.
In Figures 6A–D represent the original images, while Figures 6E–H represent the processed.
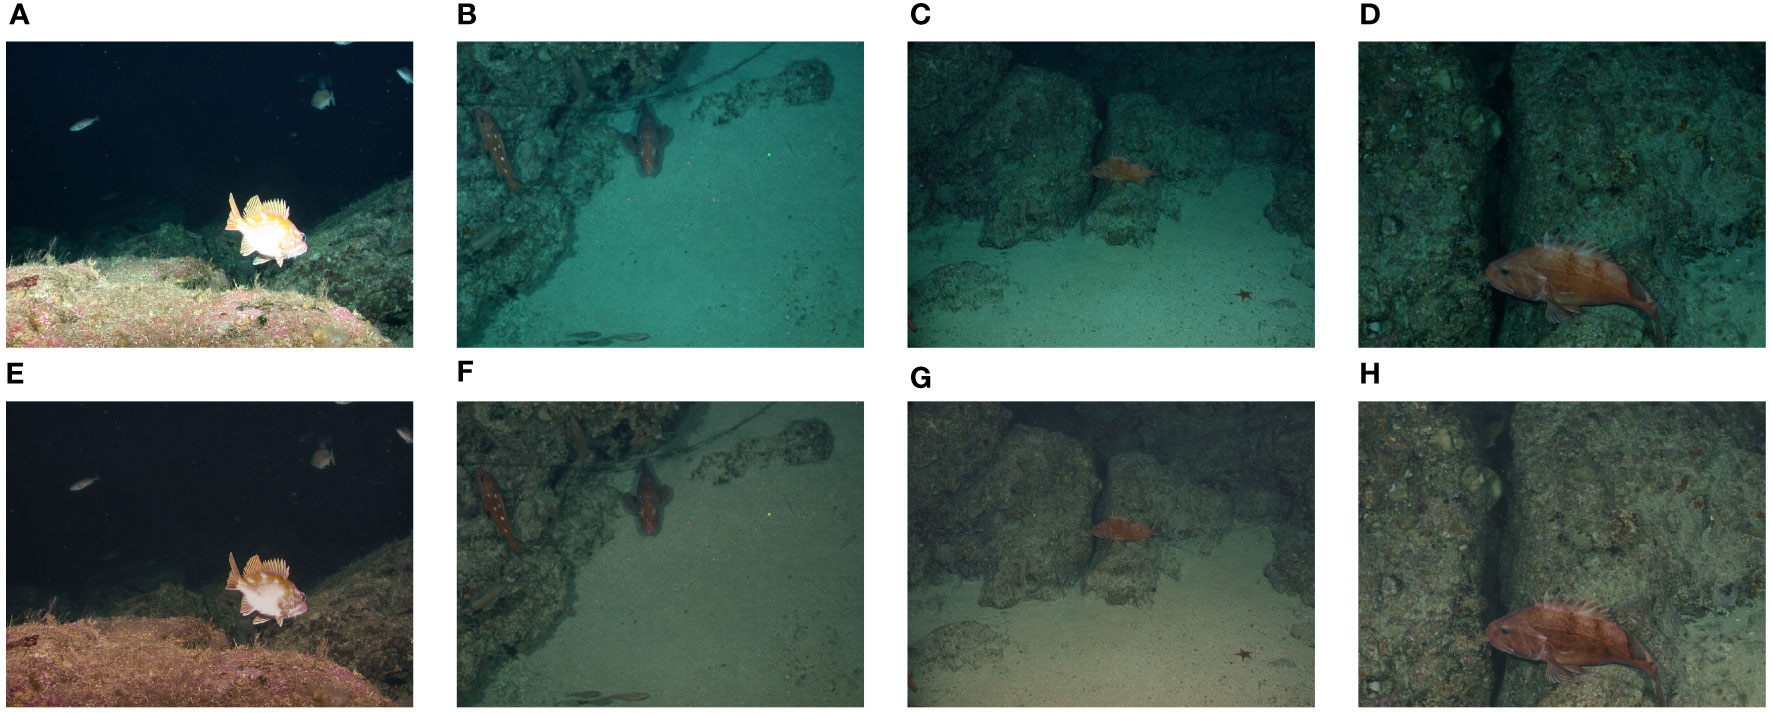
Figure 6 Image enhancement before and after picture comparison (A–D) represent the original images, while (E–H) represent the processed.
2.3.1 Network architecture
2.3.1.1 Residuals
To prevent the occurrence of gradient vanishing or exploding during model training, add the input of the network to the output of the network before the loss function, and force the network to learn the residual. Let denote the image input to the network, is the predicted latent image and this process can be represented as:
In the formula, the symbol + denotes the operation of addition between elements.
2.3.1.2 Enhancement units
The UWCNN is comprised of various modules, among which an essential module is the Enhancement Units, abbreviated as E-Units. Let Re denote the ReLU operation and C represents the convolution operation. Thus, in the -th block, the first operation of the convolution-ReLU pair can be expressed as:
In the equation, zl,0 refers to the output of the first convolution-ReLU pair in the l-th residual enhancement unit, and θl,0 represents a set of weights and biases associated with it, which can be obtained through multiple convolution-ReLU pairs.
The output of the l-th block is obtained by concatenating along the third dimension of both the output z and the input image U, which are obtained from individual convolution-ReLU pairs. The formula is given as follows:
The output of the (l + 1)-th enhancement unit is given as follows:
Finally, the concatenation of all E-Units modules is convolved with the final convolution layer having the parameter θl+m,n, resulting in the predicted component.
2.3.1.3 Network loss
In the process of reconstructing the image, the model employed the ℓ2 function to maintain the clarity of the edges and details of the image, and added the estimated residue to the input underwater image, followed by the calculation of the ℓ2.
The estimated pixel value of the latent image at the xi location is denoted by in the equation.
Furthermore, Li et al. incorporated Structure Similarity Index Measure (SSIM) loss into the objective function, which imposes structural and texture similarity on the latent image. The SSIM score was calculated using grayscale images. For each pixel x, the SSIM value is calculated within a 13×13 image patch surrounding the pixel.
In the given equation, and are the mean and standard deviation of image patches from the latent image , while and are from the ground truth image , where is obtained between the patches of and . The expression for the loss of SSIM is given as follows, where c1 = 0.02 and c2= 0.03.
The ultimate loss function L is the sum of the Mean Squared Error (MSE) and Structural Similarity Index (SSIM):
2.4 The Loss function
The loss function in YOLOv7 consists of three components: classification loss (LossClass), localization loss (LossCIoU), and confidence loss (LossConf). The expression for the loss function is:
The confidence and classification losses use the normalized cross-entropy function BCEWithLogitsLoss, while the localization loss uses the CIoU loss function. The formula for calculating CIoU is given:
Among them, Intersection Over Union (IoU) (Yu et al., 2016) represents the intersection over union ratio between the predicted and ground truth bounding boxes, while ρ2(B,BGT) represents the Euclidean distance between the predicted and ground truth bounding boxes, where B denotes the predicted target box and Bgt denotes the actual target box. α is a balancing parameter that is not involved in gradient computation. crepresents the diagonal distance of the minimum closed region that can simultaneously contain the predicted and ground truth boxes, while v represents the aspect ratio of the predicted and ground truth boxes. wgt and hgt denote the width and height of the ground truth target box, and w, h denote the width and height of the predicted target box. When the predicted and ground truth boxes have the same aspect ratio, v is set to 0.
The calculation and parameters of SIoU are shown in Figure 7.
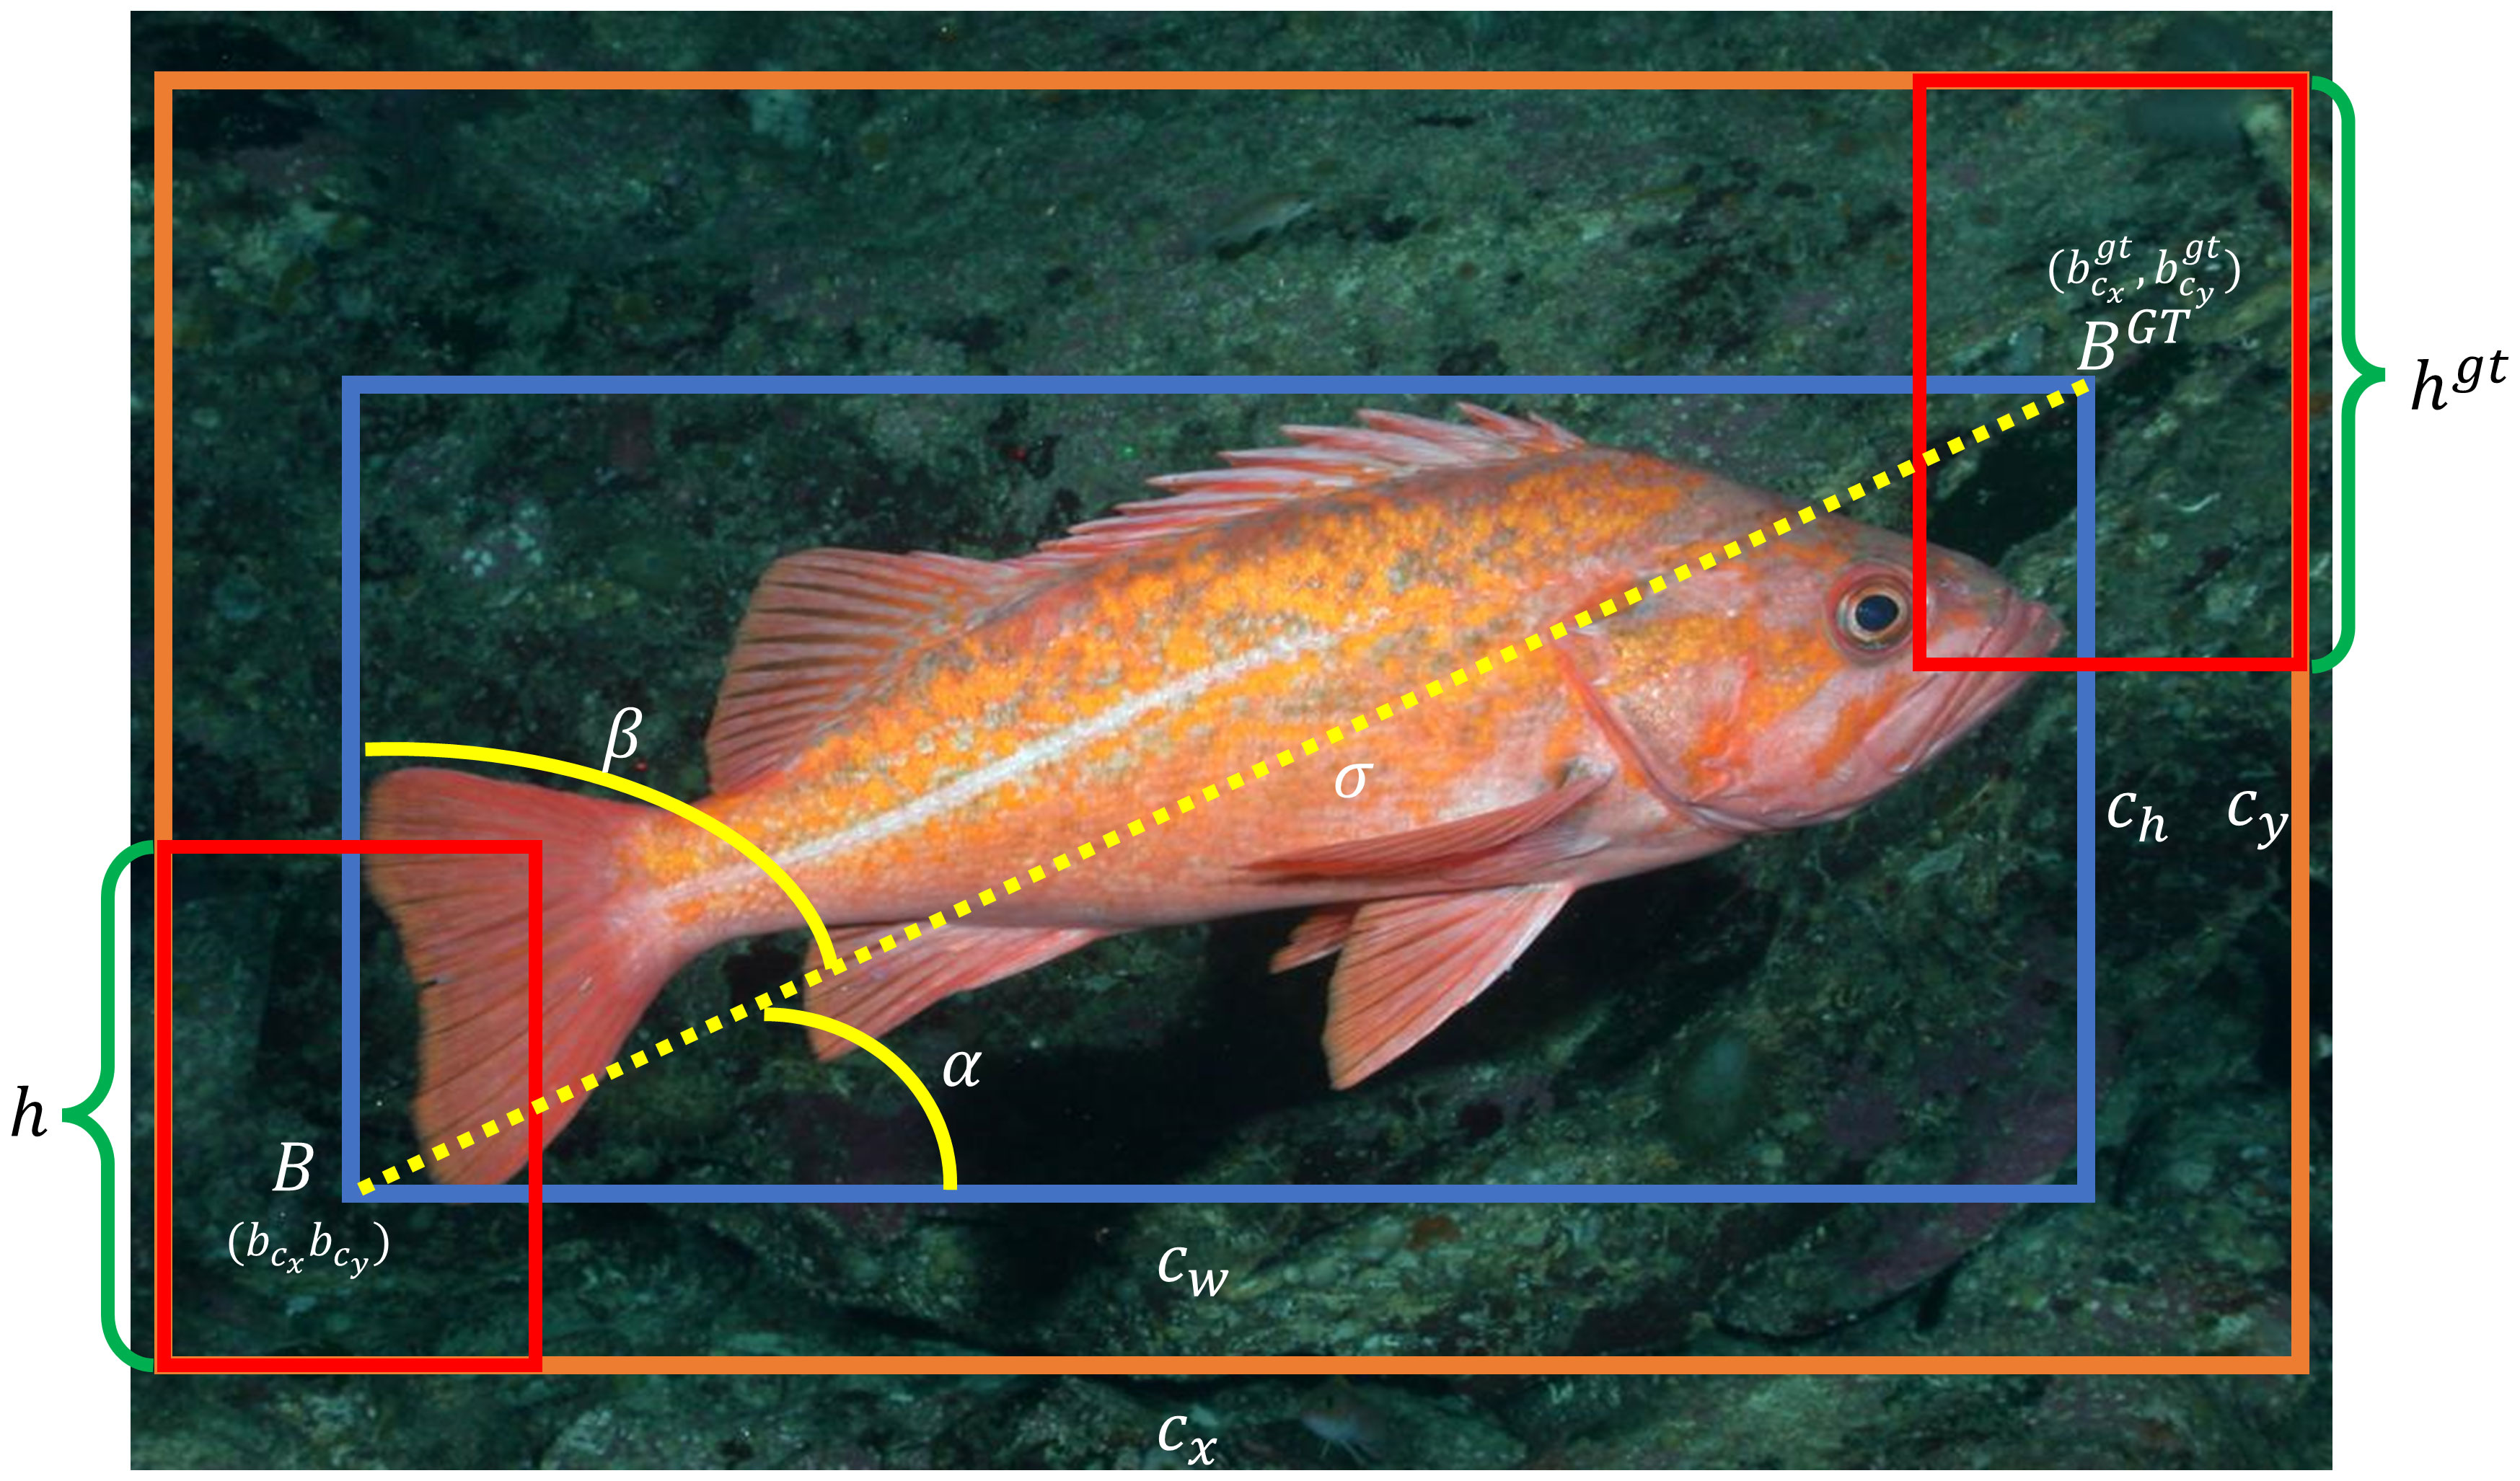
Figure 7 Calculation diagram of SIoU.
To improve the convergence speed of the loss function, this paper replaces the loss function with SIoU. The SIoU loss function consists of four cost functions: Angle cost, Distance cost, Shape cost, and IoU cost.
2.4.1 Angle cost
During the convergence process, if , then minimize α first, otherwise minimize β. The formula for computing the Angle cost is as follows:
In the equation,
In the formula, , represents the center coordinates of the ground truth box, while represents the center coordinates of the predicted box. denotes the distance between the center of the ground truth box and the center of the predicted box.
2.4.2 Distance cost
The formula for calculating Distance cost is derived from the Angle cost definition provided above.
In the equation,
As α approaches zero, it can be inferred from the above equation that the contribution of distance cost significantly decreases. Conversely, as approaches , the contribution of distance cost increases. With the increase in angle, γ is assigned a distance value that prioritizes time.
2.4.3 Shape cost
The formula for calculating Shape cost is as follows:
Among them:
wgt and hgt represent the width and height of the ground truth bounding box, while w, h denoting the width and height of the predicted bounding box. The parameter θ governs the degree of emphasis placed on the shape loss.
2.4.4 IoU cost
The formula for calculating IoU is:
In the equation, B represents the predicted bounding box, while BGT represents the ground truth bounding box.
The final expression for SIoU is:
3 Materials
3.1 The experimental environment and configuration
We conducted experiments on a research platform equipped with Inter® Xeon® Sliver 4100 and NVIDIA GeForce RTX 2080 Ti, using Pytorch1.8.2 to build deep learning networks. We accelerated GPU calculations with Cuda11.0 and cudnn8.0.5. The operating system of the research platform was Windows 10. The number of training epochs was set to 300, with an initial learning rate of 0.01, and a weight decay rate of 0.0005, and the network was trained using stochastic gradient descent (SGD) with a momentum of 0.937.
3.2 The dataset and evaluation metrics
The dataset utilized in this paper is based on the “Label Fishes in the Wild” dataset publicly released by the National Oceanic and Atmospheric Administration of the United States (Cutter et al., 2015). Rockfish was selected as the detection targets. The two rockfish species chosen in our dataset are both Pacific rockfish. Pacific rockfish serves as a collective term for bottom-dwelling fish inhabiting the waters spanning from Alaska to California. Rockfish come in many different shapes, sizes and color patterns. Colors vary from black and drab green to bright orange and red, and some rockfishes wear stripes or splotches. The original dataset comprises 1329 images. We select the images which contain wild rockfish for training. There are 275 images in the training dataset and 75 images in the validation set, for a total of 350 images. Videos captured by the Remote Operated Vehicle (ROV) underwater unmanned submersible were used as test videos.
The evaluation metrics for the model mainly include Precision P, Recall R, and mean average precision mAP, Parameters, FLOPs. Parameters are the variables that the model can learn automatically based on the data it is given. FLOPs stands for floating point of operations, and it can be used to measure the complexity of an algorithm or model. Precision represents how many of the detected samples are truly fish among those detected as fish, reflecting the accuracy of the detection results. The Recall indicates how many fish are correctly detected in all image samples, reflecting the completeness of the number of fish. F1 is a metric utilized in statistics to measure the accuracy of a binary classification model, which comprehensively considers both precision and recall. The closer the F1 score is to 1, the better the performance of the model. The AP value is equal to the area enclosed by the P-R curve and the coordinate axis in the P-R curve, which reflects the effectiveness of the model in identifying a certain category. The mean average precision (mAP) is the average of the average precision (AP) values across all categories, serving as a metric to measure the average performance of the model across all categories.The confusion matrix represents a prevalent metric for the evaluation of classification models, enabling a comprehensive and intuitive assessment of the model’s performance. Its layout is depicted in Table 2.

Table 2 Confusion Matrix.
Among them, TP represents the cases where the model’s prediction is positive and matches the actual positive values. Similarly, FP represents cases where the model predicts positive, but the actual values are negative. FN represents the situations where the model predicts negative, whereas the actual values are positive. Additionally, TN represents the cases where the model’s prediction is negative and corresponds to the actual negative values.
Precision refers to the percentage of true positive predictions among all positive predictions made by the model. The calculation formula is as follows:
Recall denotes the ratio of true positive predictions to the actual positive values in a model. The calculation formula is as follows:
F1 score is a metric used in statistics to measure the accuracy of binary classification (or multi-task binary classification) models. It takes into account both the precision and recall of the classification model. F1 score can be regarded as a weighted average of model precision and recall, with a maximum value of 1 and a minimum value of 0. A higher F1 score indicates better model performance. F1 is calculated as follows:
In this paper, the AP value is calculated based on the maximum Precision value corresponding to the 11 Recall values, and then the average of the 11 Precision values is obtained:
mAP is the average of the AP values across all classes:
4 Results
4.1 Comparison of experimental results
After introducing the attention module CBAM into the YOLOv7 network, the loss function of the improved network showed poorer convergence compared to the original YOLOv7’s loss function. Therefore, the authors of this article considered improving the loss function. Currently, the mainstream bounding box regression loss functions include Generalized Intersection over Union (GIoU) (Rezatofighi et al., 2019), Distance-IoU (DIoU)(Zheng et al., 2020), CIoU, EfficientIoU (EIoU) (Zhang et al., 2022) etc. The GIoU loss function is an improvement on the IoU loss function that introduces the minimum enclosing rectangle of the predicted and ground truth boxes. It includes the non-overlapping regions between the predicted and ground truth boxes in the calculation, addressing the issues of the IoU loss function’s inability to optimize for cases where the predicted and ground truth boxes do not intersect and uncertainty around how the predicted and ground truth boxes intersect. The GIoU loss function is better able to reflect how the ground truth and predicted boxes overlap. However, when the predicted box is inside the ground truth box, GIoU degenerates into IoU. At this point, GIoU cannot distinguish the position relationship between the predicted box and the ground truth box, resulting in slow convergence of the bounding box regression. DIoU addresses the issue where GIoU reduces to IoU by replacing the penalty term of maximizing the overlapping area with the minimum normalized distance between the centers of the predicted and ground truth boxes. However, DIoU did not consider the aspect ratio of the frame. When multiple boundary frames have the same area but different aspect ratio and the center coincides with the center of the anchor frame, DIoU cannot distinguish these cases well. The CIoU, which was proposed along with DIoU, takes into account the aspect ratio of bounding boxes. It adds a penalty term for the aspect ratio to the DIoU, which encourages the predicted box to be closer to the ground truth box and speeds up the convergence rate. Indeed, the ratio of height and width is just a proportion and not a true difference. Therefore, when the aspect ratio of the predicted box and the ground truth box have a linear relationship, the penalty term for the aspect ratio in CIoU will become ineffective. EIoU introduces a novel strategy to address the limitations of CIoU by incorporating the differences between the predicted box and the anchor box. Instead of penalizing the aspect ratio of the predicted box, EIoU calculates the differences between the predicted box and the anchor box’s height and width, which are used as penalties to make the predicted box closer to the ground truth box. This approach results in faster convergence and increased accuracy compared to CIoU. SIoU takes into account the angle between the predicted bounding box and the ground truth and introduces a new penalty term for rotation, which allows the predicted bounding box to converge quickly along the X or Y axis and speeds up the convergence rate. This article compares the CIoU, DIoU, EIoU, and SIoU loss functions and conducts experiments to evaluate their performance. The convergence curves of different networks concerning the number of iterations are shown in Figure 8.
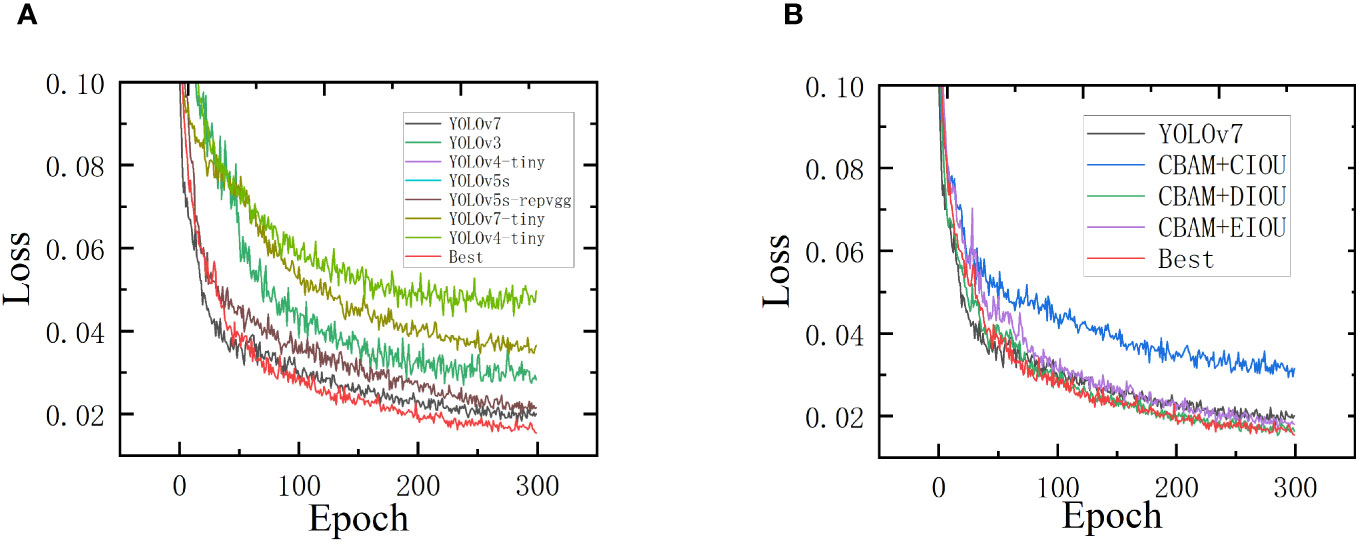
Figure 8 Comparison of network detection performance. (A) Comparison of loss values of different algorithms; (B) Comparison of loss values for different loss functions.
As can be seen from Figure 8, the addition of the attention module CBAM in the network results in a change in the model’s loss function compared to the original network’s loss function, indicating that the model’s robustness (Jiang et al., 2022a) is affected. Replacing the network’s loss function with SIoU can greatly improve the poor robustness introduced by the attention mechanism in the model. To quantitatively analyze the performance of the eight networks, precision, recall, F1, mAP@0.5, Parameters and FLOPs of the eight networks are summarized in Table 3. We have included the relevant data for Training Loss and Validation Loss for different loss functions in Table 4. According to the data in Table 4, it is evident that SIoU has a positive impact on the model’s convergence during training, with its loss values consistently lower than the other three loss functions.
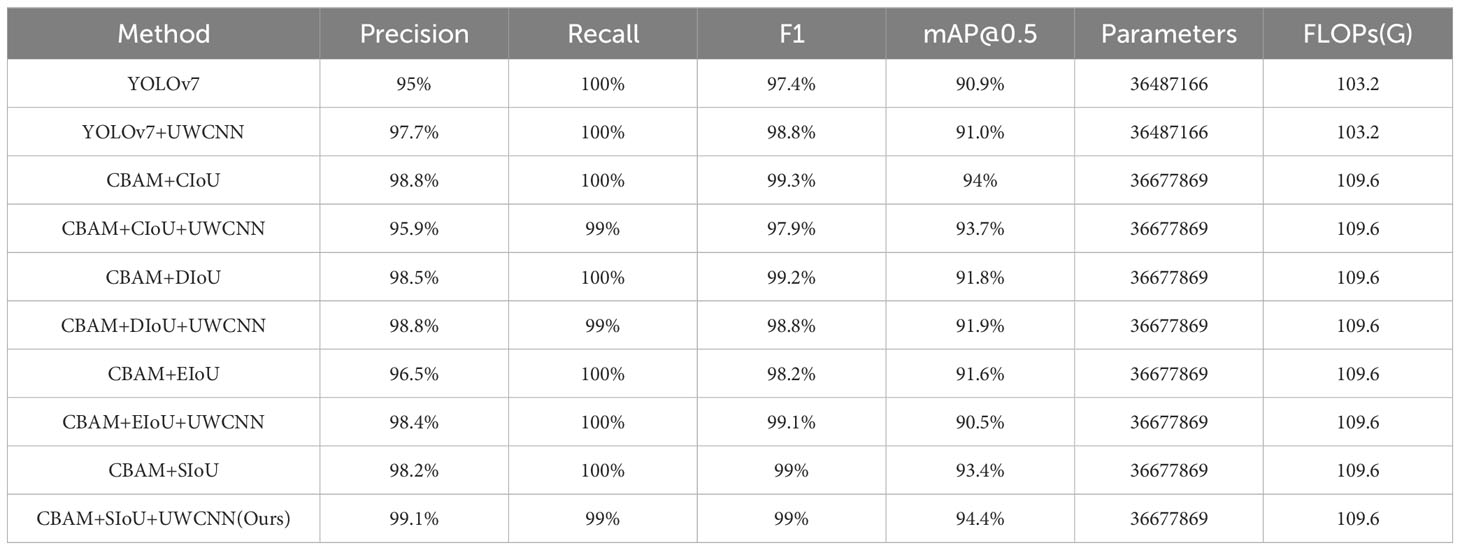
Table 3 Comparison of precision, recall, F1, mAP@0.5, Parameters and FLOPs across different networks.

Table 4 Training loss and validation loss.
From Table 3, it becomes apparent that upon the integration of the UWCNN model for the processing of select images, the model’s mAP values have experienced fluctuations, either ascending or descending. Subsequent to the introduction of UWCNN, the combination yielding the least favorable results consists of CBAM+EIoU+UWCNN, registering a decrease of 1.1% in comparison to CBAM+EIoU. Conversely, the combination yielding the most favorable outcomes involves CBAM+SIoU+UWCNN, demonstrating a 1% increase over CBAM+SIoU, thus attaining the current pinnacle of precision. Upon a consideration of the F1 metric, it becomes evident that, in the majority of instances, the introduction of UWCNN has resulted in improvements in the F1 values of the combinations, signifying that UWCNN enhances the model’s performance.
In this paper, the confusion matrix is normalized. The normalized confusion matrix for this model is illustrated in Figure 9.
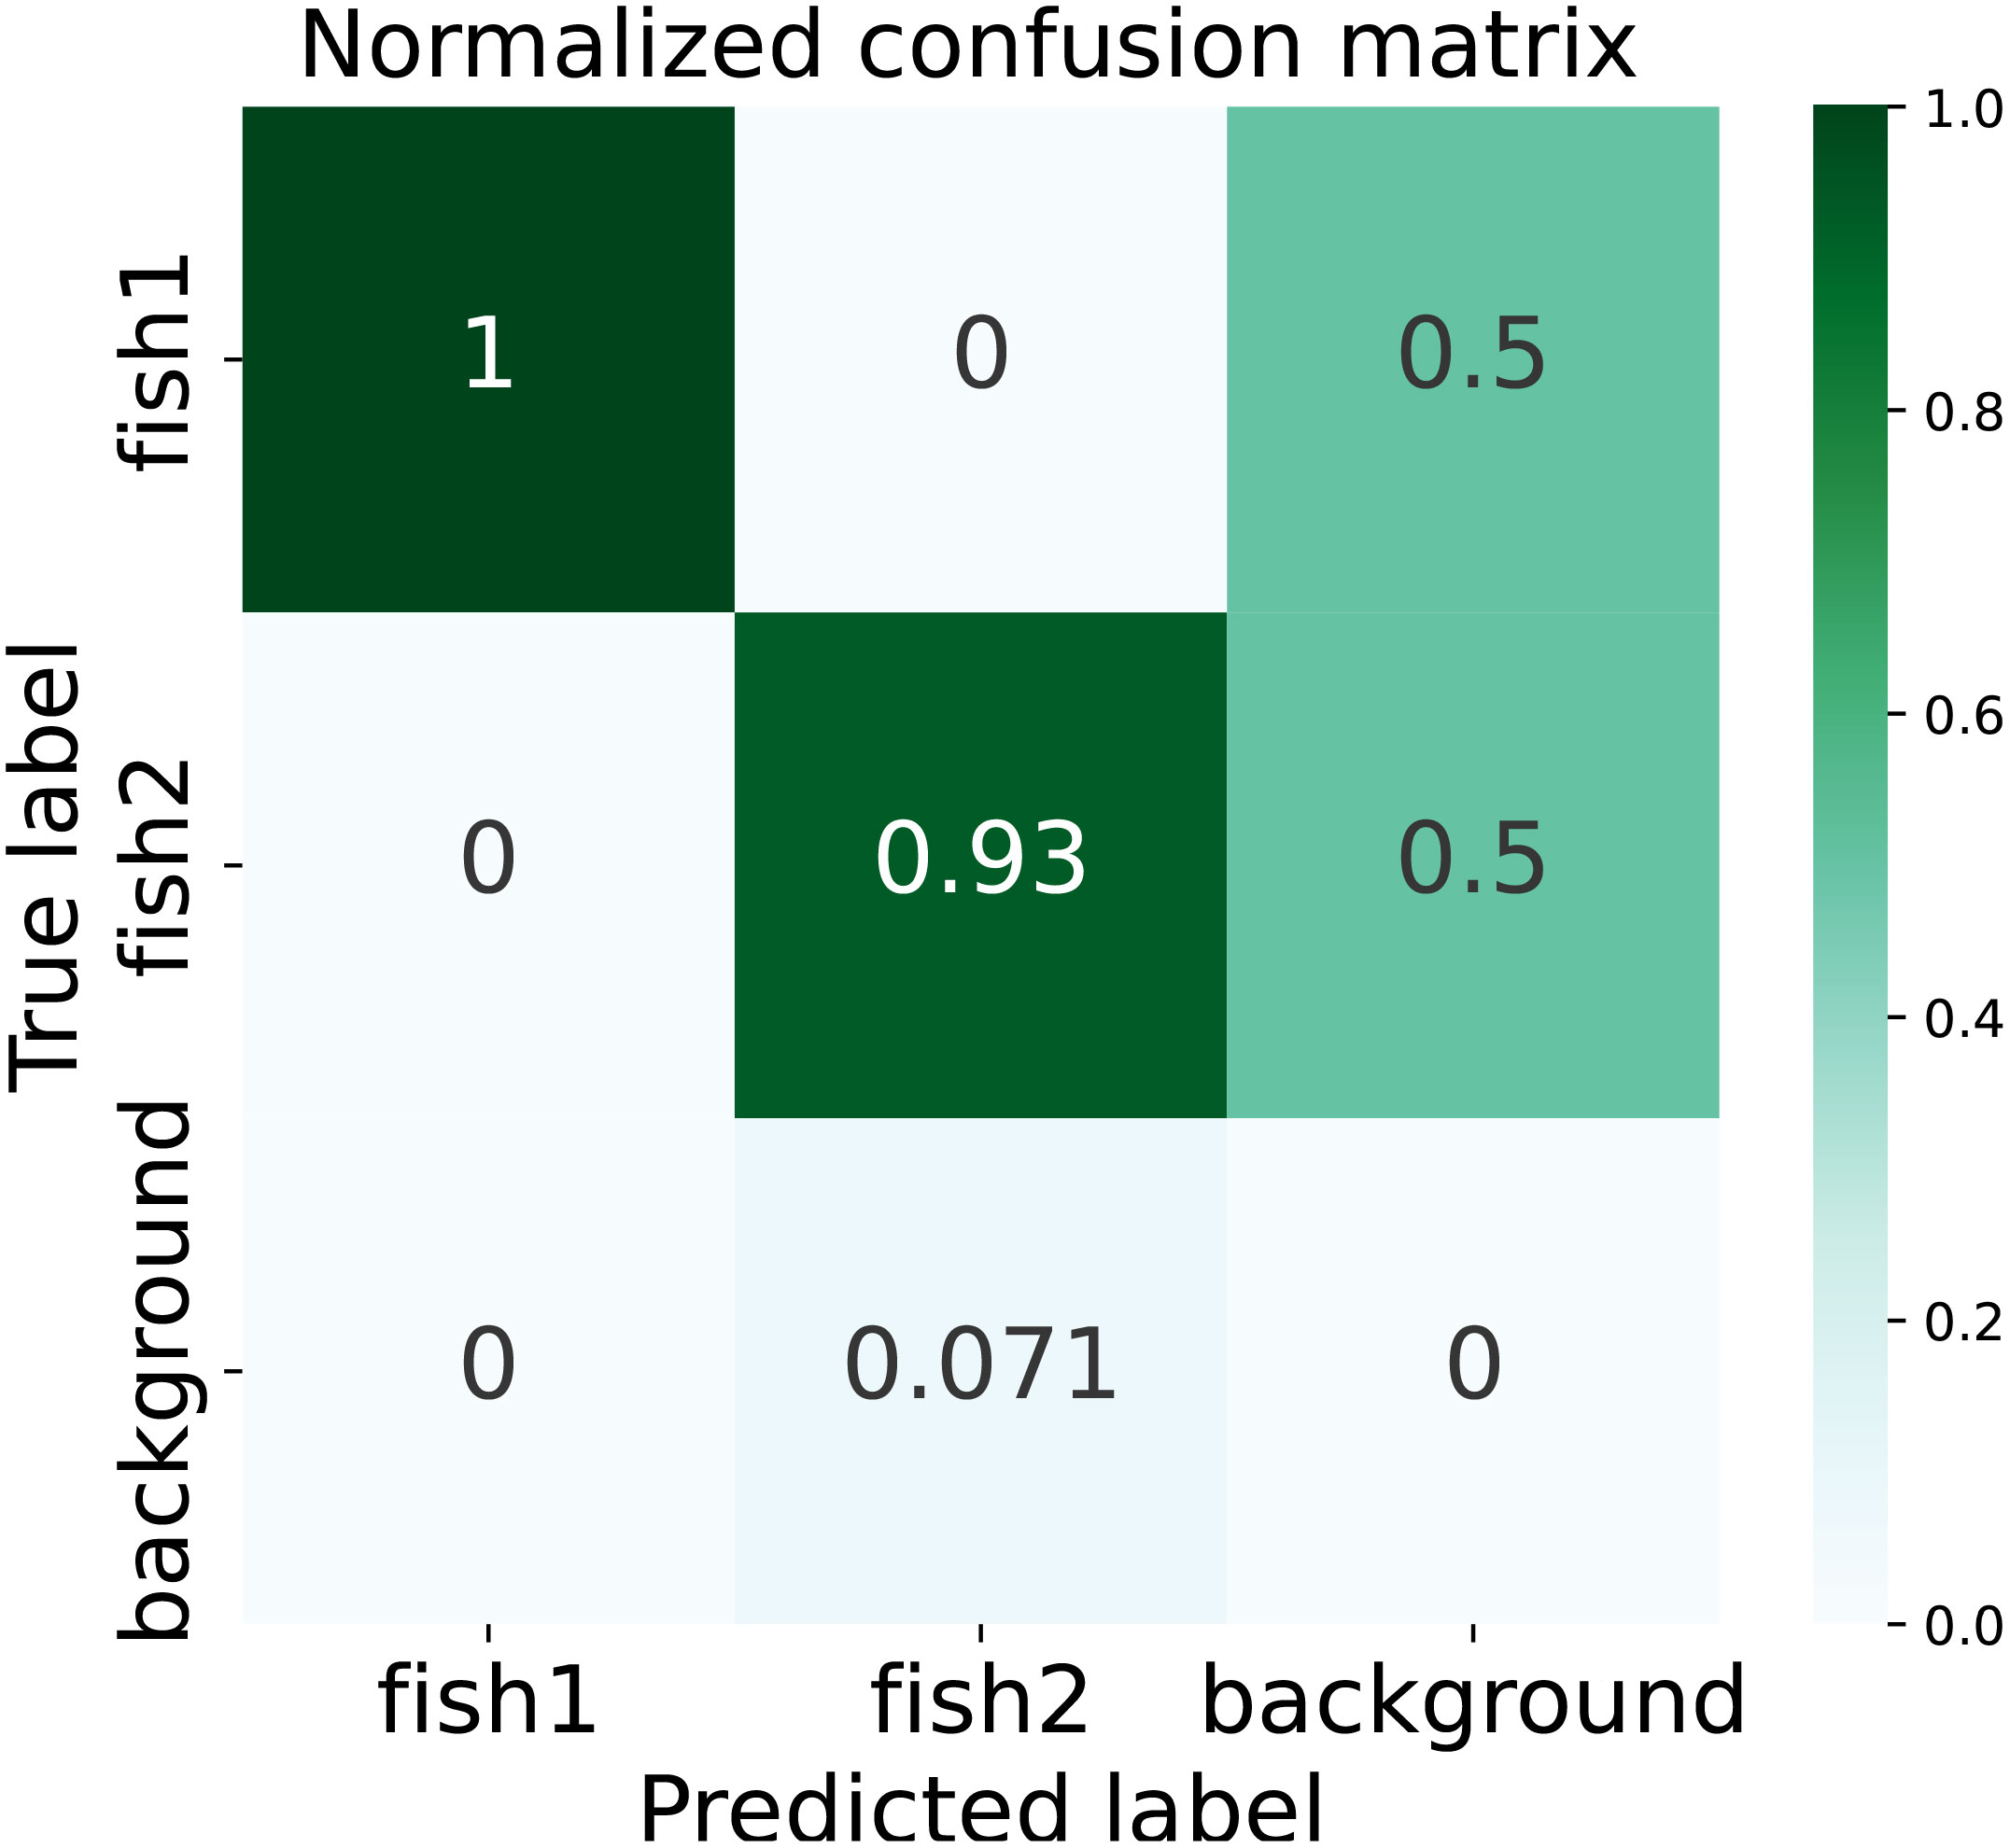
Figure 9 Normalized confusion matrix.
The row labels on the confusion matrix represent the predicted categories of fish. Each value on the diagonal indicates the percentage of correctly predicted labels out of the total samples in that category. The darker the color on the diagonal, the better the performance of the model.
4.2 Ablation experiment
The YOLO series of algorithms permit the adjustment of hyperparameters to yield an optimal model. The hyperparameters we focus on in this work are epochs, batch-size, learning rate, and the activation function of the network. Based on experience, batch size is typically chosen as a power of 2. Constrained by hardware considerations, this study exclusively employs a batch size of 4 in its experimental setups. To strike a harmonious equilibrium between model fitting capability and generalization prowess, it is crucial to ascertain an appropriate number of epochs. Given the relatively modest size of the dataset employed in this paper, and in consideration of the designated batch size, a total of 300 epochs have been chosen for model training to forestall overfitting. A learning rate that is too small can result in slow convergence, while one that is excessively large may lead to rapid initial convergence but may fail to reach the minimum value. After conducting a comparative analysis of the loss values for learning rates of 0.01 and 0.001, it has been observed that the model with a learning rate of 0.001 performs less favorably than the one with a learning rate of 0.01, indicating inferior convergence. Therefore, we have set up a learning rate of 0.01. Within multilayer neural networks, there exists a functional relationship between the output of upper-layer nodes and the input of lower-layer nodes, known as the activation function. This activation function bestows upon the network the capability for non-linear modeling. The utilization of non-linear functions as activation functions empowers deep neural networks with enhanced expressive capabilities. Consequently, the selection of an appropriate activation function can augment the performance of the neural network. In the realm of deep learning, numerous novel activation functions have emerged, including SELU (Klambauer et al., 2017), Hardswish (Howard et al., 2019), SiLU(Swish) (Ramachandran et al., 2017), and others. For comparative analysis, we have opted to contrast four activation functions: Sigmoid, SELU, Hardswish, and Tanh, against the original SiLU activation function employed in this paper. The specific results are detailed in Table 5. It is evident that the networks with the introduction of SIoU perform better than the networks with CBAM added and the networks with the loss function modified. Furthermore, we conducted ablation experiments to explore various attention mechanisms. We compared the attention mechanisms SE and Global attention mechanism (GAM) (Liu et al., 2021) with CBAM in our study on attention mechanisms. SE introduces the consideration of the relationship between feature channels. By automatically learning the importance of each feature channel, it enhances the features while suppressing the unimportant ones using the learned importance. GAM, on the other hand, considers the interaction between spatial and channel dimensions and improves upon CBAM’s sub-modules by adopting a sequential channel-spatial attention mechanism. This enhances the global dimensional interaction features, enabling the extraction of important features across all three dimensions. The experimental results of combining SE, GAM, and CBAM with different loss functions are shown in Table 6. The symbol ✓indicates the use of an item for improvement, while × indicates that the item was not used for improvement.
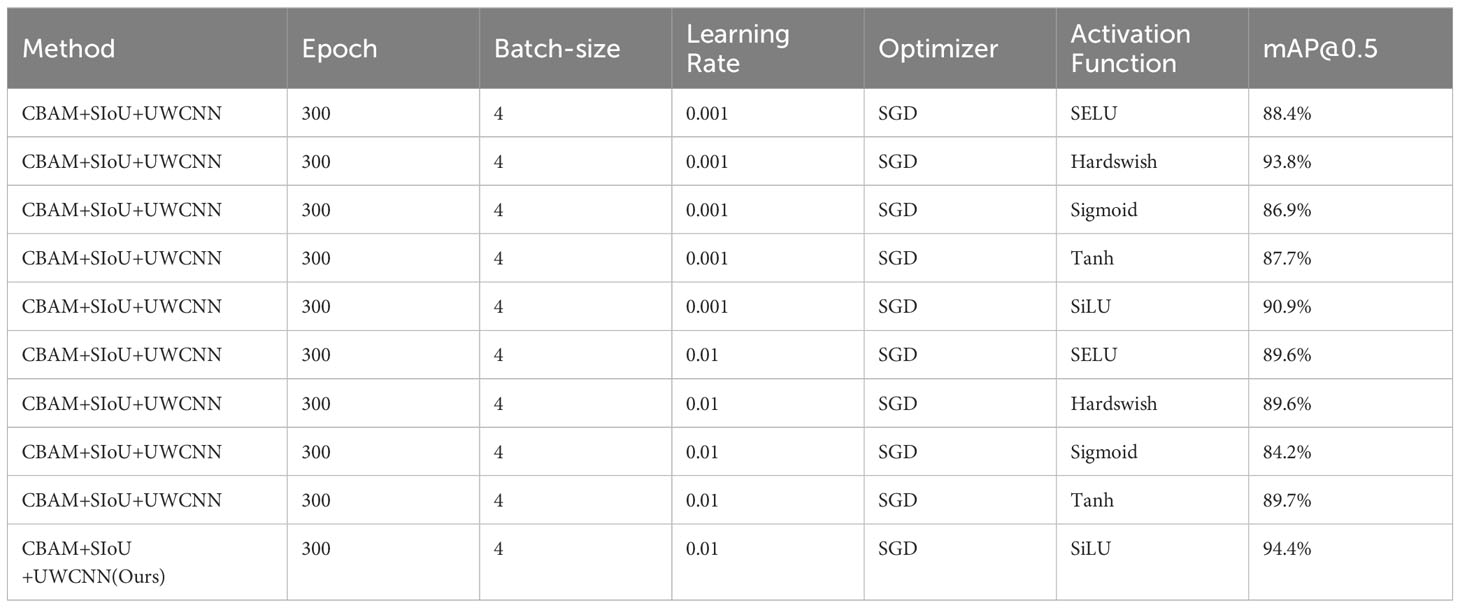
Table 5 Effect of different hyperparameters in the proposed model.
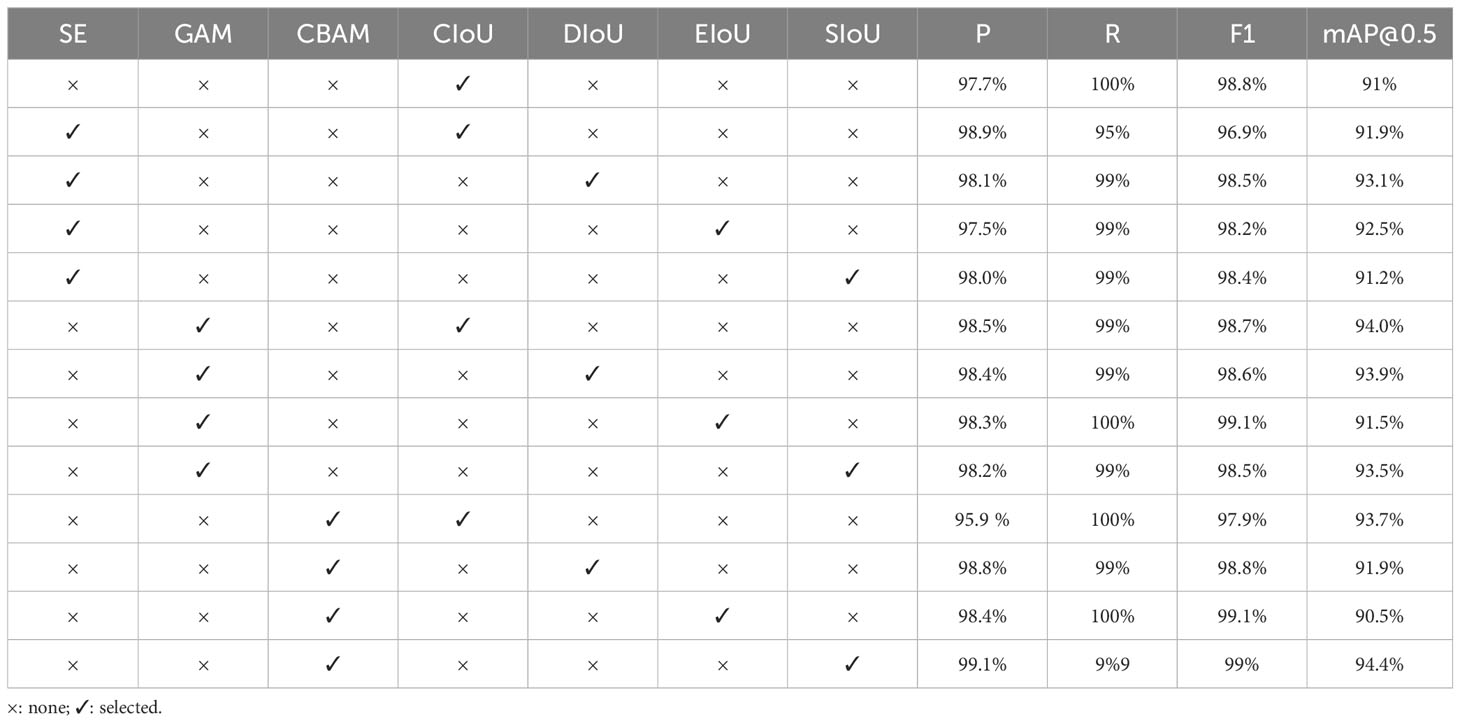
Table 6 Ablation experiments.
The first row of the table represents the original YOLOv7 algorithm. From the table, we can see that the combination of different attention mechanisms and loss functions has different effects on the performance of the network, and even may lead to a decrease in network performance. The accuracy of the networks combined with SE, GAM, and different loss functions was improved to some extent, but most of them showed mediocre performance. The combination of CBAM and SIoU leads to a significant improvement in the network’s mAP, which reached 94.4%. And, combined with the F1 score, it can be seen that the combination of CBAM+SIoU works best. In the intricate underwater environment, target detection algorithms are susceptible to the influences of background and color, and there are problems such as false detection and missed detection of the targets. Therefore, the incorporation of an attention mechanism enables the model focus on the information that is more critical to the current task, and improve the processing efficiency and accuracy of the task. SIoU is used as the loss function because SIoU takes into account the problem of direction mismatch between the predicted bounding box and the ground truth, accelerates the training convergence process, and improves the detection performance.
This passage demonstrates the visualization of thermal maps using Grad-CAM (Selvaraju et al., 2017), depicting the effects of various attention mechanisms on images. The resulting diagram is depicted in Figure 10.
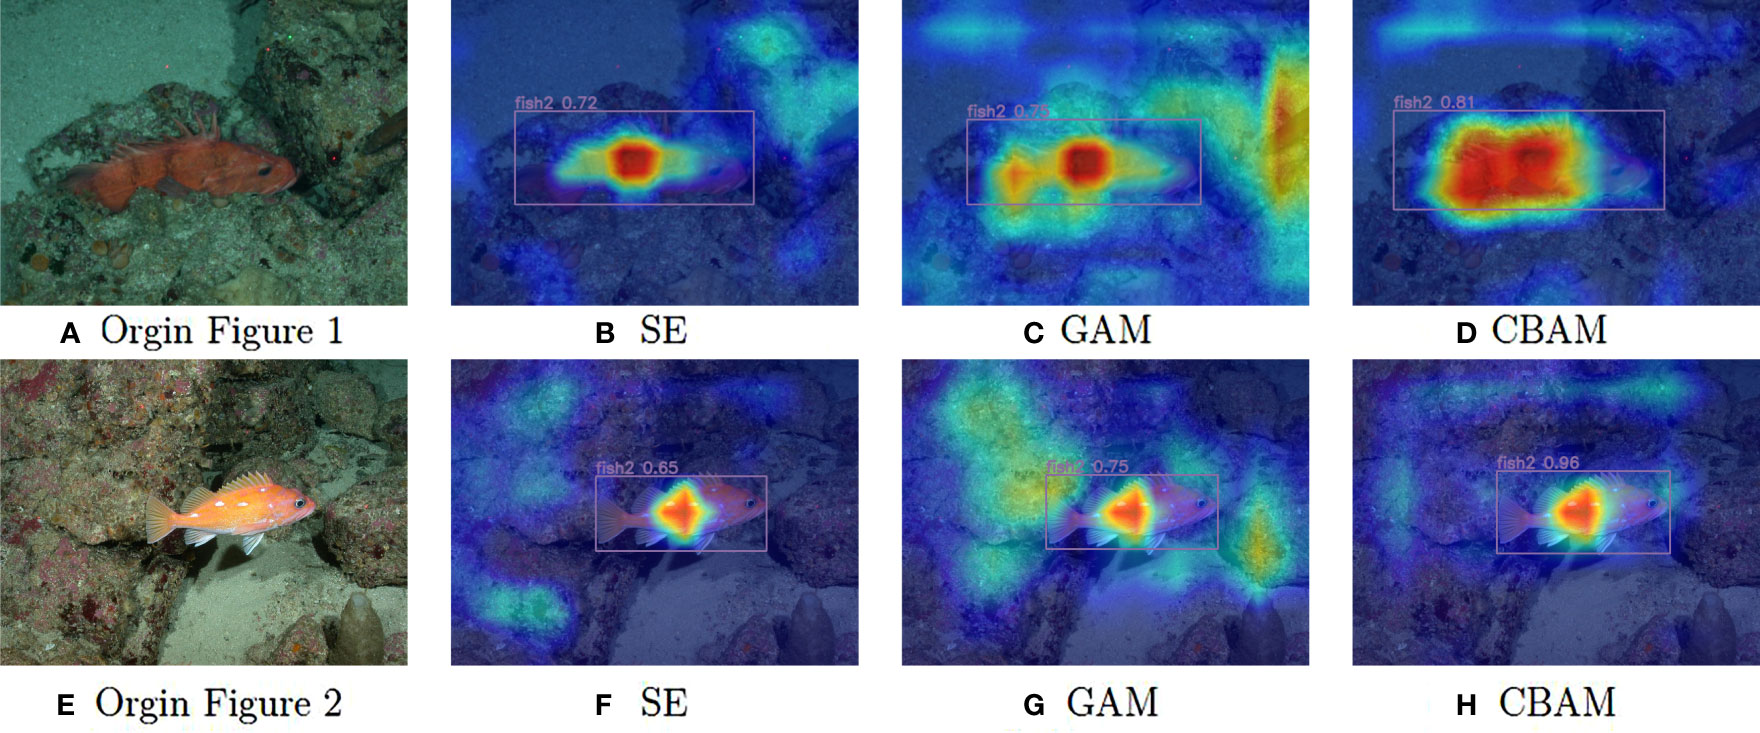
Figure 10 Comparison of heat maps of different attention mechanisms. (A, E) represent the original image, (B, F) represent the effect of the attention mechanism SE, (C, G) represent the effect of the attention mechanism GAM, (D, H) represent the effect of the attention mechanism CBAM.
The intensity of color indicates the level of attention the model places on each specific area. A darker color signifies a higher degree of attention and a larger allocation of weights during training. Models incorporating different attention mechanisms exhibit varying levels of focus on local regions within the two original images. It is evident that the model utilizing CBAM demonstrates less attention towards irrelevant factors in the surroundings, while placing greater emphasis on the fish within the image. As a result, this approach yields higher detection accuracy.
Figure 11 depicts the detection performance of the network before and after improvement in real underwater environments.
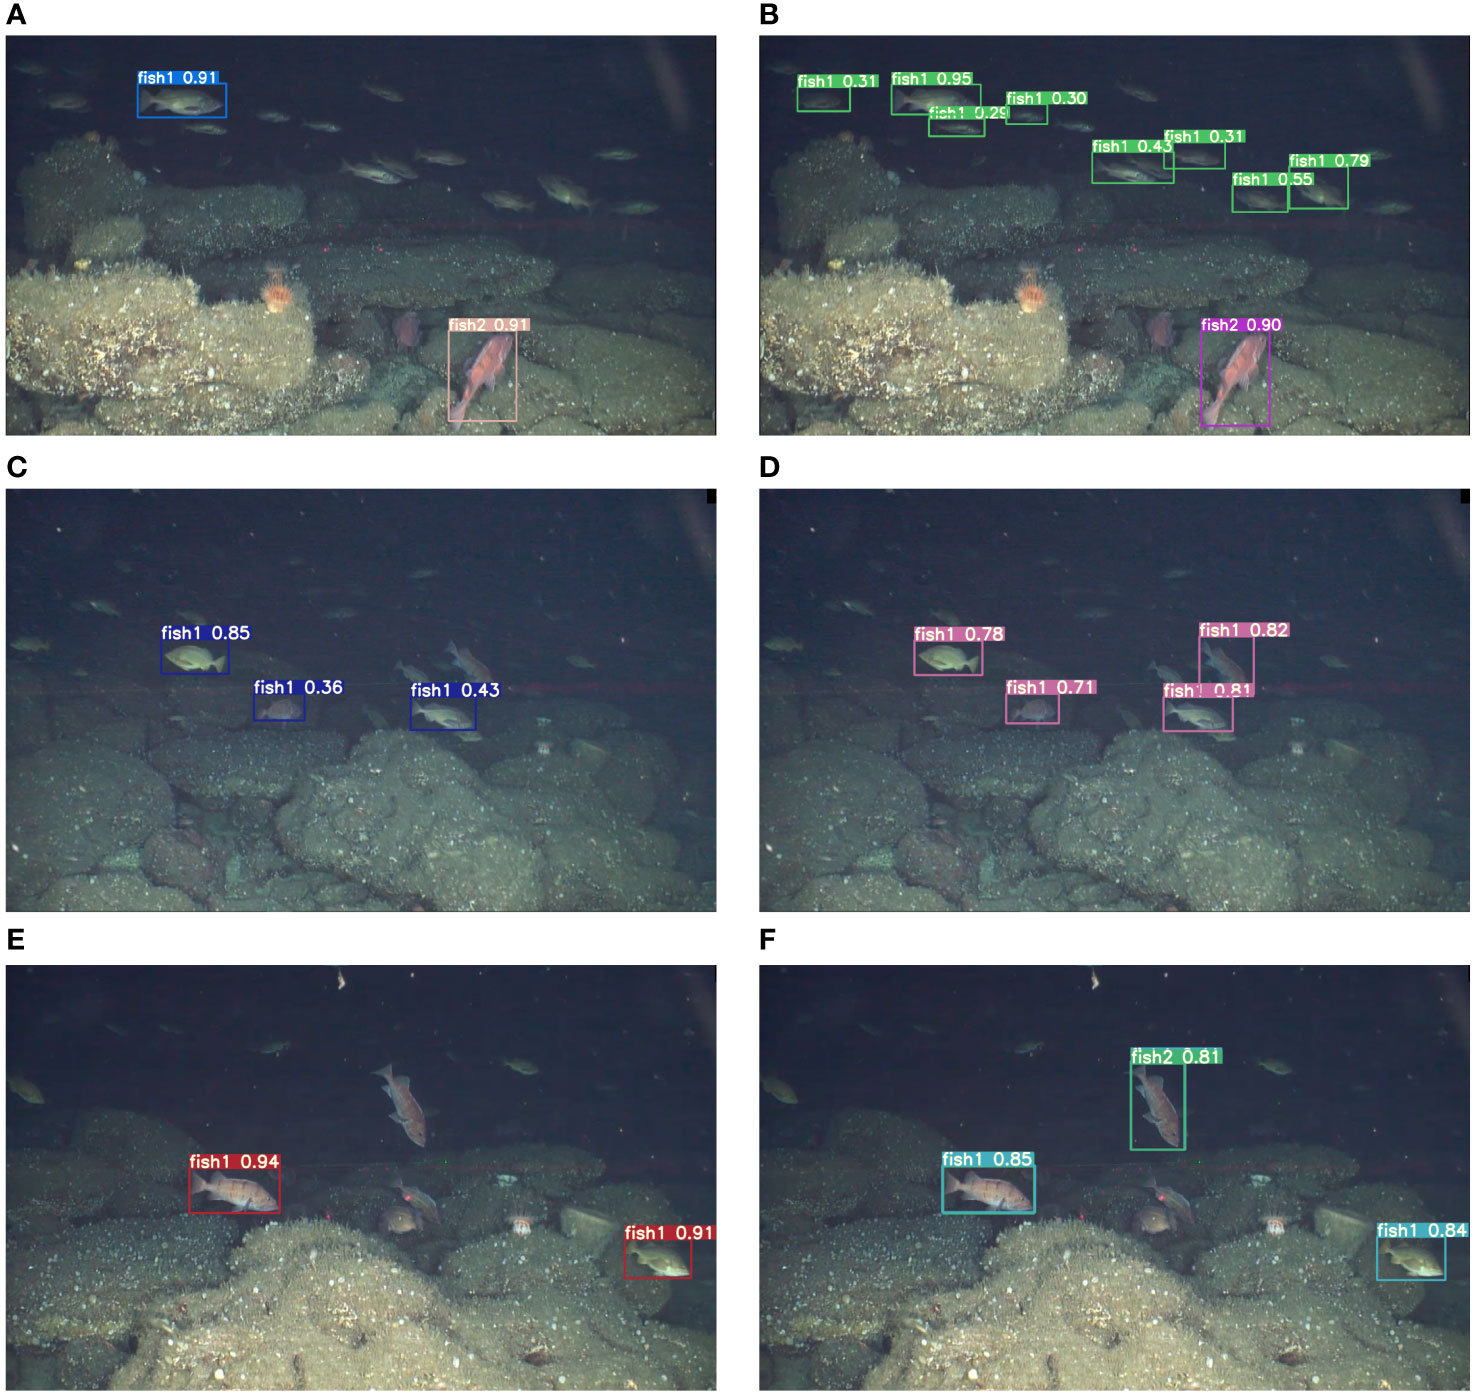
Figure 11 Comparison of network detection performance. (A, C, D) represent the performance of YOLOv7 algorithm, and (B, D, F) represent the performance of the proposed algorithm.
In Figures 11A, C, E represent the detection outputs of the YOLOv7 model, while B, D, and F depict the detection results of the model proposed in this paper.
With the experimental environment configuration and training parameters fixed, the author compared the performance of the proposed algorithm with that of other algorithms to verify the effectiveness of the improvements made in this paper. This paper mainly chooses the YOLO series algorithm as a comparison, and also includes EfficientDet (Tan et al., 2020), Faster R-CNN, SSD (Liu et al., 2016), Centernet (Zhou et al., 2019) and other algorithms as a comparison. Faster R-CNN is a classic two-stage object detection algorithm proposed by R. Girshick, and it was the first to achieve end-to-end object detection. SSD, which stands for Single Shot MultiBox Detector, was introduced by Liu et al. Similar to YOLO, SSD is a one-stage object detection algorithm that transforms the object bounding box localization problem into a regression problem. It also employs a method similar to Faster R-CNN to obtain candidate regions. CenterNet takes the center point of the target bounding box as the detection target, effectively transforming the object detection problem into a keypoint estimation problem. The EfficientDet algorithm is a series of object detection algorithms released by Google, which uses a weighted bi-directional feature pyramid network proposed by Google and a composite pyramid network scaling method to unify the resolution, depth, and width scaling of the backbone. The YOLOv3 is the third version of the YOLO series. In YOLOv3, the backbone was improved from Darknet-19 in YOLOv2 to use Residual and Darknet-35 residual networks. Additionally, it incorporated the Feature Pyramid Network (FPN) for multi-scale detection during the prediction phase. Two months after the release of YOLOv4, a lightweight version called YOLOv4-tiny was introduced. The backbone of YOLOv4 was improved to Cross Stage Partial Darknet (CSPDarknet53), compared to Darknet-19 used in YOLOv2 and YOLOv3. On the other hand, YOLOv4-tiny uses a CSPDarknet53-tiny backbone, which has fewer structures compared to YOLOv4, but its parameter count is 10 times lower. The main difference between the two is that YOLOv4-tiny did not use the Mish activation function and only used a single-feature pyramid. As for the differences between YOLOv5 and YOLOv4, YOLOv4 only used the Cross Stage Partial (CSP) structure in the Backbone, while YOLOv5 designed two CSP structures that were respectively applied to the Backbone and Neck. The difference between YOLOv5 and YOLOv4 lies mainly in the use of two different CSP structures for the Backbone and Neck. While YOLOv4 only used CSP in the Backbone, YOLOv5 applied CSP structures in both the Backbone and Neck. Additionally, the Neck of YOLOv5 utilized the FPN+PAN structure with newly designed CSP blocks, which enhanced the feature fusion capability of the network, whereas YOLOv4 used regular convolutional operations in the Neck. RepVGG (Ding et al., 2021) is a type of image classification network, characterized by its simple yet efficient structure, which can serve as a replacement for the backbone of other object detection algorithms. YOLO-X (Ge et al., 2021) is a network that builds upon the improvements made to YOLOv3. Its most notable innovation lies in the utilization of a Decoupled Head, Anchor-Free design, and Multi-positives in its Head section. This has resulted in significant enhancements to the model’s detection accuracy and convergence speed. In contrast to the aforementioned deep learning algorithms, the algorithm presented in this paper exhibits superior performance in the domain of underwater object detection, as demonstrated by the comparative results outlined in Table 7.
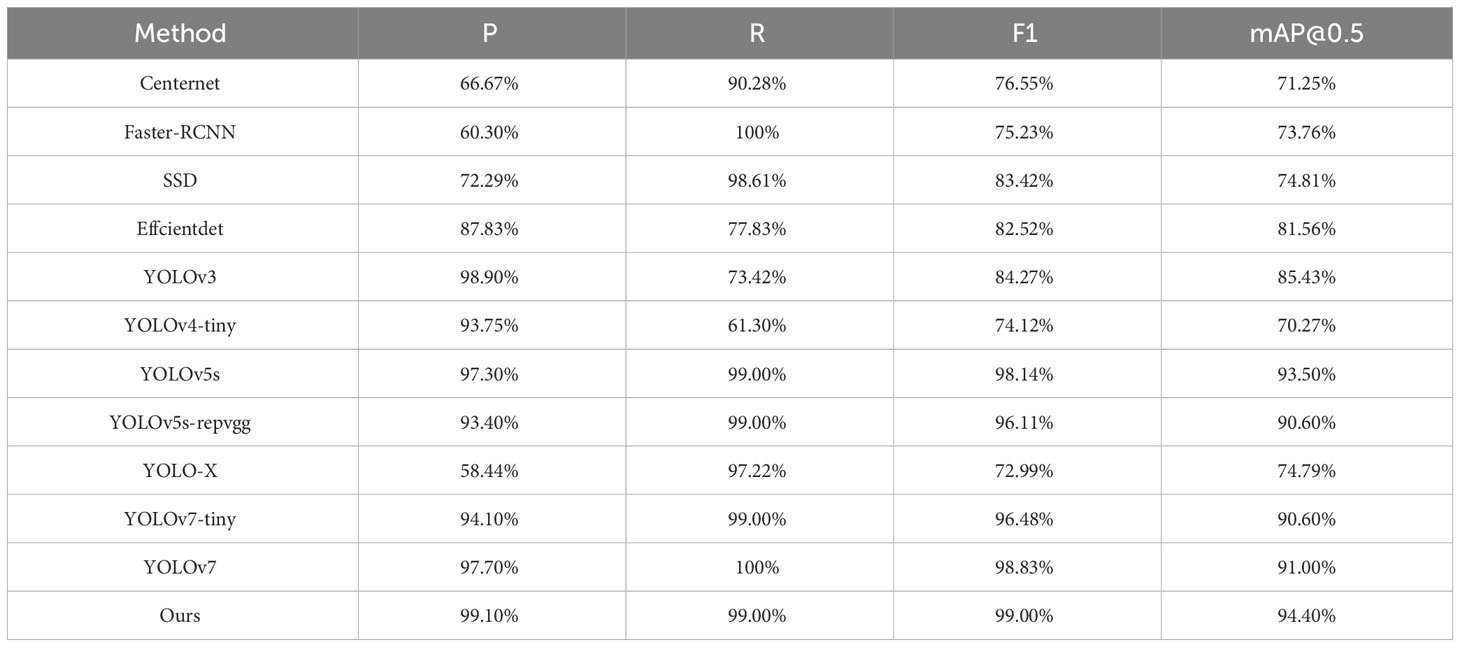
Table 7 Performance comparison of different algorithms.
5 Conclusions
Underwater robots are one of the most vital instruments in today’s exploration of the underwater environment. Utilizing underwater robots to explore unknown underwater environs holds significant importance for environmental preservation and resource development. This paper proposes an improved YOLOv7 object detection algorithm to address the issue of poor detection performance of target detection algorithms in the field of underwater exploration. By utilizing the underwater image enhancement algorithm UWCNN, underwater optical images can be restored and enhanced. The algorithm incorporates the CBAM attention mechanism module, which combines both channel and spatial dimensions to improve the network’s feature extraction capabilities. The original loss function, CIoU, has been replaced with SIoU to accelerate model convergence speed, resulting in a decrease in the Loss value from 2.01% to 1.55%. Experimental results indicate that the improved YOLOv7 algorithm has optimized all indicators compared to the original YOLOv7 algorithm, with a 3.5% increase in mAP0.5. This has effectively increased the detection accuracy of targets in underwater environments, surpassing other target detection algorithms in terms of detection performance. The next step in our plan is to expand the range of testing categories while reducing the size of the model, all while ensuring a superior level of accuracy in target detection.
Data availability statement
Publicly available datasets were analyzed in this study. This data can be found here: https://www.fisheries.noaa.gov/west-coast/science-data/labeled-fishes-wild.
Author contributions
Conceptualization, ML; methodology, ML, WJ, MH; software, ML, WJ, MH, ZQ, RL, CZ; formal analysis, ML and RL; investigation, ML, WJ and ZQ; resources, ML, WJ, MH and CZ; data curation, ML, WJ, MH and RL; writing—original draft, ML, WJ, MH, RL and CZ; writing—review and editing, ML, WJ and ZQ; visualization, ML and WJ; supervision, MH and ZQ. All authors have read and agreed to the published version of the manuscript.
Funding
The author(s) declare financial support was received for the research, authorship, and/or publication of this article. This work was partly supported by the National Natural Science Foundation of China (62171143) and Natural Science Foundation of Guangdong Province (2021A1515011948) and Special projects in key fields of ordinary universities in Guangdong Province (2021ZDZX1060) and Guangxi key research and development plan project (2022AB20112).
Conflict of interest
The authors declare that the research was conducted in the absence of any commercial or financial relationships that could be construed as a potential conflict of interest.
Publisher’s note
All claims expressed in this article are solely those of the authors and do not necessarily represent those of their affiliated organizations, or those of the publisher, the editors and the reviewers. Any product that may be evaluated in this article, or claim that may be made by its manufacturer, is not guaranteed or endorsed by the publisher.
References
Ahn J., Yasukawa S., Sonoda T., Ura T., Ishii K. (2017). Enhancement of deep-sea floor images obtained by an underwater vehicle and its evaluation by crab recognition. J. Mar. Sci. Technol. 22, 758–770. doi: 10.1007/s00773-017-0442-1
Bochkovskiy A., Wang C.-Y., Liao H.-Y. M. (2020). Yolov4: Optimal speed and accuracy of object detection. arXiv preprint arXiv:2004.10934. 4, 1–17. doi: 10.48550/arXiv.2004.10934
Boudhane M., Nsiri B. (2016). Underwater image processing method for fish localization and detection in submarine environment. J. Visual Communication Image Representation 39, 226–238. doi: 10.1016/j.jvcir.2016.05.017
Chen L., Zheng M., Duan S., Luo W., Yao L. (2021). Underwater target recognition based on improved yolov4 neural network. Electronics 10, 1634–1648. doi: 10.3390/electronics10141634
Cutter G., Stierhoff K., Zeng J. (2015). “Automated detection of rockfish in unconstrained underwater videos using haar cascades and a new image dataset: labeled fishes in the wild,” in 2015 IEEE Winter Applications and Computer Vision Workshops (IEEE). (Columbus,OH, USA: IEEE), 57–62.
Ding X., Zhang X., Ma N., Han J., Ding G., Sun J. (2021). “Repvgg: Making vgg-style convnets great again,” in Proceedings of the IEEE/CVF conference on computer vision and pattern recognition. (Nashville,TN, USA: IEEE), 13733–13742.
Fu J., Zheng H., Mei T. (2017). “Look closer to see better: Recurrent attention convolutional neural network for fine-grained image recognition,” in Proceedings of the IEEE conference on computer vision and pattern recognition. (Honolulu, HI, USA: IEEE), 4438–4446.
Ge Z., Liu S., Wang F., Li Z., Sun J. (2021). Yolox: Exceeding yolo series in 2021. arXiv preprint arXiv:2107.08430. 2, 1–7. doi: 10.48550/arXiv,2107.08430
Gevorgyan Z. (2022). Siou loss: More powerful learning for bounding box regression. arXiv preprint arXiv:2205.12740. 5, 1–12. doi: 10.48550/arXiv.2205.12740
Girshick R. (2015). “Fast r-cnn,” in Proceedings of the IEEE international conference on computer vision. (Santiago, Chile: IEEE), 1440–1448.
Girshick R., Donahue J., Darrell T., Malik J. (2014). “Rich feature hierarchies for accurate object detection and semantic segmentation,” in Proceedings of the IEEE conference on computer vision and pattern recognition. (Columbus,OH,USA: IEEE), 580–587.
Guan Z., Hou C., Zhou S., Guo Z. (2022). Research on underwater target recognition technology based on neural network. Wireless Commun. Mobile Computing. 2022, 1–12. doi: 10.1155/2022/4197178
He K., Zhang X., Ren S., Sun J. (2015). Spatial pyramid pooling in deep convolutional networks for visual recognition. IEEE Trans. Pattern Anal. Mach. Intell. 37, 1904–1916. doi: 10.1109/TPAMI.2015.2389824
Hou R., Ma B., Chang H., Gu X., Shan S., Chen X. (2020). ). Iaunet: Global context-aware feature learning for person reidentification. IEEE Trans. Neural Networks Learn. Syst. 32, 4460–4474. doi: 10.1109/TNNLS.2020.3017939
Howard A., Sandler M., Chu G., Chen L.-C., Chen B., Tan M., et al. (2019). “Searching for mobilenetv3,” in Proceedings of the IEEE/CVF international conference on computer vision. (Seoul, Korea(South): IEEE), 1314–1324.
Hu J., Shen L., Sun G. (2018). “Squeeze-and-excitation networks,” in Proceedings of the IEEE conference on computer vision and pattern recognition. (Salt Lake City, UT, USA: IEEE), 7132–7141.
Jiang C., Wu C., Xiao X., Lin C. (2022a). Robust neural dynamics with adaptive coefficient applied to solve the dynamic matrix square root. Complex Intelligent Syst., 1–14. doi: 10.1007/s40747-022-00954-9
Jiang K., Xie T., Yan R., Wen X., Li D., Jiang H., et al. (2022b). An attention mechanismimproved yolov7 object detection algorithm for hemp duck count estimation. Agriculture 12, 1659–1677. doi: 10.3390/agriculture12101659
Jiang Q., Zhang Y., Bao F., Zhao X., Zhang C., Liu P. (2022c). Two-step domain adaptation for underwater image enhancement. Pattern Recognition 122, 108324–108338. doi: 10.1016/j.patcog.2021.108324
Klambauer G., Unterthiner T., Mayr A., Hochreiter S. (2017). Self-normalizing neural networks. Adv. Neural Inf. Process. Syst. 305, 972–981.
Lei F., Tang F., Li S. (2022). Underwater target detection algorithm based on improved yolov5. J. Mar. Sci. Eng. 10, 310–329. doi: 10.3390/jmse10030310
Li C., Anwar S., Porikli F. (2020). Underwater scene prior inspired deep underwater image and video enhancement. Pattern Recognition 98, 107038–107049. doi: 10.1016/j.patcog.2019.107038
Li T., Rong S., Zhao W., Chen L., Liu Y., Zhou H., et al. (2022). Underwater image enhancement using adaptive color restoration and dehazing. Optics Express 30, 6216–6235. doi: 10.1364/OE.449930
Liu K., Peng L., Tang S. (2023). Underwater object detection using tc-yolo with attention mechanisms. Sensors 23, 2567–2582. doi: 10.3390/s23052567
Liu W., Anguelov D., Erhan D., Szegedy C., Reed S., Fu C.-Y., et al. (2016). “Ssd: Single shot multibox detector,” in Computer Vision–ECCV 2016: 14th European Conference, Amsterdam, The Netherlands, October 11–14, 2016. 21–37, Proceedings, Part I 14 (Cham: Springer).
Liu Y., Shao Z., Hoffmann N. (2021). Global attention mechanism: Retain information to enhance channel-spatial interactions. arXiv preprint arXiv:2112.05561. 12, 1–6. doi: 10.48550/arXiv.2112.05561
Mnih V., Heess N., Graves A., Kavukcuoglu K. (2014). Recurrent models of visual attention. Adv. Neural Inf. Process. Syst. 276, 1–12. doi: 10.48550/arXiv.1406.6247
Mohd Azmi K. Z., Abdul Ghani A. S., Md Yusof Z., Ibrahim Z. (2019). Deep underwater image enhancement through colour cast removal and optimization algorithm. Imaging Sci. J. 67, 330–342. doi: 10.1080/13682199.2019.1660484
Park J., Woo S., Lee J.-Y., Kweon I. S. (2018). Bam: Bottleneck attention module. arXiv preprint arXiv:1807.06514. 2, 1–14. doi: 10.48550/arXiv.1807.06514
Qin Z., Zhang P., Wu F., Li X. (2021). “Fcanet: Frequency channel attention networks,” in Proceedings of the IEEE/CVF international conference on computer vision. (Montreal, QC Canada: IEEE), 783–792.
Qu P., Li T., Li G., Tian Z., Xie X., Zhao W., et al. (2022). Mcca-net: Multi-color convolution and attention stacked network for underwater image classification. Cogn. Robotics 2, 211–221. doi: 10.1016/j.cogr.2022.08.002
Ramachandran P., Zoph B., Le Q. V. (2017). Searching for activation functions. arXiv preprint arXiv:1710.05941. 2, 1–13. doi: 10.48550/arXiv.1710.05941
Redmon J., Divvala S., Girshick R., Farhadi A. (2016). “You only look once: Unified, realtime object detection,” in Proceedings of the IEEE conference on computer vision and pattern recognition. (Las Vegas, NV, USA: IEEE), 779–788.
Redmon J., Farhadi A. (2017). “Yolo9000: better, faster, stronger,” in Proceedings of the IEEE conference on computer vision and pattern recognition. (Honolulu, HI, USA: IEEE), 7263–7271.
Redmon J., Farhadi A. (2018). Yolov3: An incremental improvement. arXiv preprint arXiv:1804.02767. 4, 1–6. doi: 10.48550/arXiv.1804.02767
Ren S., He K., Girshick R., Sun J. (2015). Faster r-cnn: Towards real-time object detection with region proposal networks. Adv. Neural Inf. Process. Syst. 3, 91–99. doi: 10.48550/arXiv.1506.01497.
Rezatofighi H., Tsoi N., Gwak J., Sadeghian A., Reid I., Savarese S. (2019). “Generalized intersection over union: A metric and a loss for bounding box regression,” in Proceedings of the IEEE/CVF conference on computer vision and pattern recognition. (Long Beach, CA,USA: IEEE), 658–666.
Selvaraju R. R., Cogswell M., Das A., Vedantam R., Parikh D., Batra D. (2017). “Gradcam: Visual explanations from deep networks via gradient-based localization,” in Proceedings of the IEEE international conference on computer vision. (Venice, Italy: IEEE), 618–626.
Tan M., Pang R., Le Q. V. (2020). “Efficientdet: Scalable and efficient object detection,” in Proceedings of the IEEE/CVF conference on computer vision and pattern recognition. (Seattle, WA,USA: IEEE), 10781–10790.
Wang C.-Y., Bochkovskiy A., Liao H.-Y. M. (2022). Yolov7: Trainable bag-of-freebies sets new state-of-the-art for real-time object detectors. arXiv preprint arXiv:2207.02696. 7, 1–15. doi: 1048550/arXiv.2207.02696
Wei X., Yu L., Tian S., Feng P., Ning X. (2021). Underwater target detection with an attention mechanism and improved scale. Multimedia Tools Appl. 80, 33747–33761. doi: 10.1007/s11042-021-11230-2
Wong S.-L., Paramesran R., Taguchi A. (2018). Underwater image enhancement by adaptive gray world and differential gray-levels histogram equalization. Adv. Electrical Comput. Eng. 18, 109–116. doi: 10.4316/AECE.2018.02014
Woo S., Park J., Lee J.-Y., Kweon I. S. (2018). “Cbam: Convolutional block attention module,” in Proceedings of the European conference on computer vision (ECCV). (Cham: Springer), 3–19.
Xiao T., Xu Y., Yang K., Zhang J., Peng Y., Zhang Z. (2015). “The application of two-level attention models in deep convolutional neural network for fine-grained image classification,” in Proceedings of the IEEE conference on computer vision and pattern recognition. (Boston, MA: IEEE), 842–850.
Xu K., Ba J., Kiros R., Cho K., Courville A., Salakhudinov R., et al. (2015). “Show, attend and tell: Neural image caption generation with visual attention,” in International conference on machine learning (PMLR). (Lille,France: PMLR), 2048–2057.
Yu H., Li X., Lou Q., Lei C., Liu Z. (2020). Underwater image enhancement based on dcp and depth transmission map. Multimedia Tools Appl. 79, 20373–20390. doi: 10.1007/s11042-020-08701-3
Yu J., Jiang Y., Wang Z., Cao Z., Huang T. (2016). “Unitbox: An advanced object detection network,” in Proceedings of the 24th ACM international conference on Multimedia. (Amsterdam, UK: ACM), 516–520.
Zeng L., Sun B., Zhu D. (2021). Underwater target detection based on faster r-cnn and adversarial occlusion network. Eng. Appl. Artif. Intell. 100, 104190. doi: 10.1016/j.engappai.2021.104190
Zhang Z., Lan C., Zeng W., Jin X., Chen Z. (2020). “Relation-aware global attention for person re-identification,” in Proceedings of the ieee/cvf conference on computer vision and pattern recognition. (Seattle,WA, USA: IEEE), 3186–3195.
Zhang Y.-F., Ren W., Zhang Z., Jia Z., Wang L., Tan T. (2022). Focal and efficient iou loss for accurate bounding box regression. Neurocomputing 2, 146–157. doi: 10.48550/arXiv.2101.08158
Zhang Q., Yang Y.-B. (2021). Rest: An efficient transformer for visual recognition. Adv. Neural Inf. Process. Syst. 34, 15475–15485.
Zhang H., Zu K., Lu J., Zou Y., Meng D. (2021). Epsanet: An efficient pyramid split attention block on convolutional neural network. arXiv preprint arXiv:2105.14447. 2, 1–12. doi: 10.48550/arXiv.2105.14447
Zheng Z., Wang P., Liu W., Li J., Ye R., Ren D. (2020). “Distance-iou loss: Faster and better learning for bounding box regression,” in Proceedings of the AAAI conference on artificial intelligence, (Menlo Park, CA: AAAI) Vol. 34. 12993–13000.
Zheng J., Wu H., Zhang H., Wang Z., Xu W. (2022). Insulator-defect detection algorithm based on improved yolov7. Sensors 22, 8801. doi: 10.3390/s22228801
Keywords: object detection, underwater image enhancement algorithm, YOLOv7, attention mechanism, biological population protection, marine environment
Citation: Liu M, Jiang W, Hou M, Qi Z, Li R and Zhang C (2023) A deep learning approach for object detection of rockfish in challenging underwater environments. Front. Mar. Sci. 10:1242041. doi: 10.3389/fmars.2023.1242041
Received: 20 June 2023; Accepted: 14 November 2023;
Published: 01 December 2023.
Edited by:
Prospero Naval, University of the Philippines, PhilippinesReviewed by:
Ruobin Gao, Nanyang Technological University, SingaporeChunlei Xia, Chinese Academy of Sciences (CAS), China
Copyright © 2023 Liu, Jiang, Hou, Qi, Li and Zhang. This is an open-access article distributed under the terms of the Creative Commons Attribution License (CC BY). The use, distribution or reproduction in other forums is permitted, provided the original author(s) and the copyright owner(s) are credited and that the original publication in this journal is cited, in accordance with accepted academic practice. No use, distribution or reproduction is permitted which does not comply with these terms.
*Correspondence: Mingxin Hou, aG91bXhAZ2RvdS5lZHUuY24=