Abstract
Understanding the spatial structure of fishing resource stocks is a fundamental aspect for the management and development of sustainable and productive fisheries. However, this aspect is usually simplified under the assumption of a stock unit, which assumes biologically similar and spatially homogeneous individuals, regardless of the real ranges and characteristics of their distribution. The persistence of geographic patterns in the biological traits of species suggests the spatial structuring of a population, a highly relevant aspect in stock assessment, calculation of Biological Reference Points (BRP), and management of fishing resources. In this work, the spatial heterogeneity of the biological traits of common hake (Merluccius gayi) from off-central Chile is modeled. Considering four reference zones, biological data collected over 26 years of monitoring fisheries and acoustic surveys is analyzed. The findings allow to biologically differentiate these areas whose main characteristics are the increase from north to south in the condition factor, gonad weight, and size at maturity. The Spawning Potential Ratio (SPR), fishing mortality, and BRP are calculated. Exploratorily, if these areas were considered closed subpopulations, results show that overexploitation is not a characteristic of all hake fishing areas, and that not considering the heterogeneity of biological traits causes the overestimation of the population condition in the main fishing areas. The aim of this research was to understand the spatial structuring of common hake based on the heterogeneity of biological attributes and its impact for fisheries management purposes.
1 Introduction
Fisheries management has traditionally considered a single-stock hypothesis. This definition has often been based on administrative agreements, on historical fishing grounds, or for practical reasons. Current knowledge has shown that species with a limited spatial structure and which are genotypically and phenotypically homogeneous are an exception rather than the rule (e.g. Ames and Lichter, 2013; Ciannelli et al., 2013; Kerr et al., 2017; Gatti et al., 2020; Shackell et al., 2022). The common-pool assumption simplifies fish populations to a set of biologically similar and spatially homogeneous individuals, regardless of the actual ranges and characteristics of their distribution. The management and evaluation of stocks are often unaware of the spatial dynamics of the resources, arguing the lack of spatially explicit data (Guan et al., 2013). However, it is becoming increasingly difficult to support the stock unit hypothesis when examining the spatial heterogeneity shown by fishing data (Punt, 2019). Defining management units that are appropriate and consistent with spatial patterns is relevant for the sustainability of fisheries and the conservation of resources, even more so given that the number of overexploited populations has increased by 34% (FAO, 2020). Failure to recognize the spatial dynamics of a population in fisheries assessment and management could increase the number of overexploited resources (e.g. Frank and Brickman, 2000; Fu and Fanning, 2004; Cadrin and Secor, 2009) due to a high probability of estimating erroneous productivity levels and biased references. This may prevent reaching the established management objectives and affect the application of a stock assessment model, impacting the sustainability of the fishery, its profitability, and the resilience of the fishing communities (Kerr et al., 2017).
Trend differences between areas, as understood in the biological data series collected from fisheries, cannot be explained simply by selectivity effects (Punt, 2019). Rather, spatial heterogeneity in biological parameters (e.g. growth, fertility, maturity, and natural mortality) often provide evidence in favor of heterogeneous spatial structures in marine populations (e.g. Ciannelli et al., 2013; Canales et al., 2016; Canales et al., 2018; Shackell et al., 2019). In fact, the spatiotemporal patterns in the biological traits of a species (e.g. size and maturity) are characteristics typical of discrete populations with low levels of admixture (Cadrin, 2020). In this sense, spatiotemporal differences in environmental conditions are considered responsible both for the pattern of movement of individuals in a population (Keyl and Wolff, 2008) and for the distinction in individual biological traits. Notwithstanding assumptions of independent populations, several studies have shown evidence to support hypotheses of connected fish subpopulations under the metapopulation theory (e.g. Petitgas et al., 2010). Some examples are Atlantic cod (Gadus morhua) (Smedbol and Wroblewski, 2002), European anchovy (Engraulis encrasicolus) subpopulations (Traina et al., 2011); cyprinids (Pogonichthys macrolepidotus) in San Francisco estuaries (Feyrer et al., 2015), Atlantic herring (Clupea harengus) (McQuinn, 1997; Ware and Schweigert, 2001); European pilchard (Sardina pilchardus) in Galicia (Carrera and Porteiro, 2003); Chilean jack mackerel (Trachurus murphyi) in Chile (Gerlotto et al., 2012); and anchoveta (Engraulis ringens) in the Chile-Peru Humboldt system (Canales et al., 2018).
From the fisheries management perspective, simulation exercises have shown that productivity estimates of fish populations improve substantially when the assessment models consider spatial structures (Hurtado-Ferro et al., 2014; Punt, 2019; Cadrin et al., 2020). Furthermore, while “traditional” population assessments view biological traits as invariant over time, studies have shown that environmental conditions explain the phenotypic expression of certain species. A phenotypic response to poor conditions (environmental and/or density-dependence) can be reflected in condition factor, inhibited growth rates, altered or modified physiology, changes in reproductive and ethological patterns (e.g. de Mérona et al., 2009; Van Beveren et al., 2014; Karjalainen et al., 2016) or due to fishing pressure (e.g. Engelhard and Heino, 2004; Sharpe and Hendry, 2009; Kuparinen et al., 2016). Evidence of this type of characteristics is recorded, for example, in the Fulton condition factor (weight) (e.g. Brosset et al., 2015; Canales et al., 2016) and in the maturity to size ratio (e.g. De Roos et al., 2006; Keck et al., 2014; Hunter et al., 2015; Brosset et al., 2016).
In Chile, one of the oldest and most important fishing populations is the common hake Merluccius gayi (Guichenot 1848), whose habitat is found in cold and poorly oxygenated coastal ecosystems off the coasts of Chile. It is distributed from 29°10’S to 42°00’S (Figure 1) at preferred depths between 100 and 200 m (Guevara-Carrasco and Lleonart, 2008). The characteristics of the seabed off Chile and the dominant environmental variables in the hake distribution area are very distinctive and characteristic. The increased width of the continental shelf, particularly south of 35°S (Sobarzo et al., 2007), determines larval retention points (Payá et al., 1994), and favorable habitat conditions for the main prey that make up the diet of common hake, such as crustaceans, decapods, euphausiids, and clupeids (Arancibia and Fuentealba, 1993; Cubillos et al., 2003; San Martín et al., 2013). This species sustains an important fishery made up of an industrial bottom trawling fleet and an artisanal fleet operating with gillnets. The most recent annual landings reach an average of 25 thousand tons (SERNAPESCA, 2021) and, following biomass estimates reported by acoustic survey, they are mainly concentrated between 31°25’S and 38°39’S, corresponding to zones 2 and 3 (Figure 1).
Figure 1
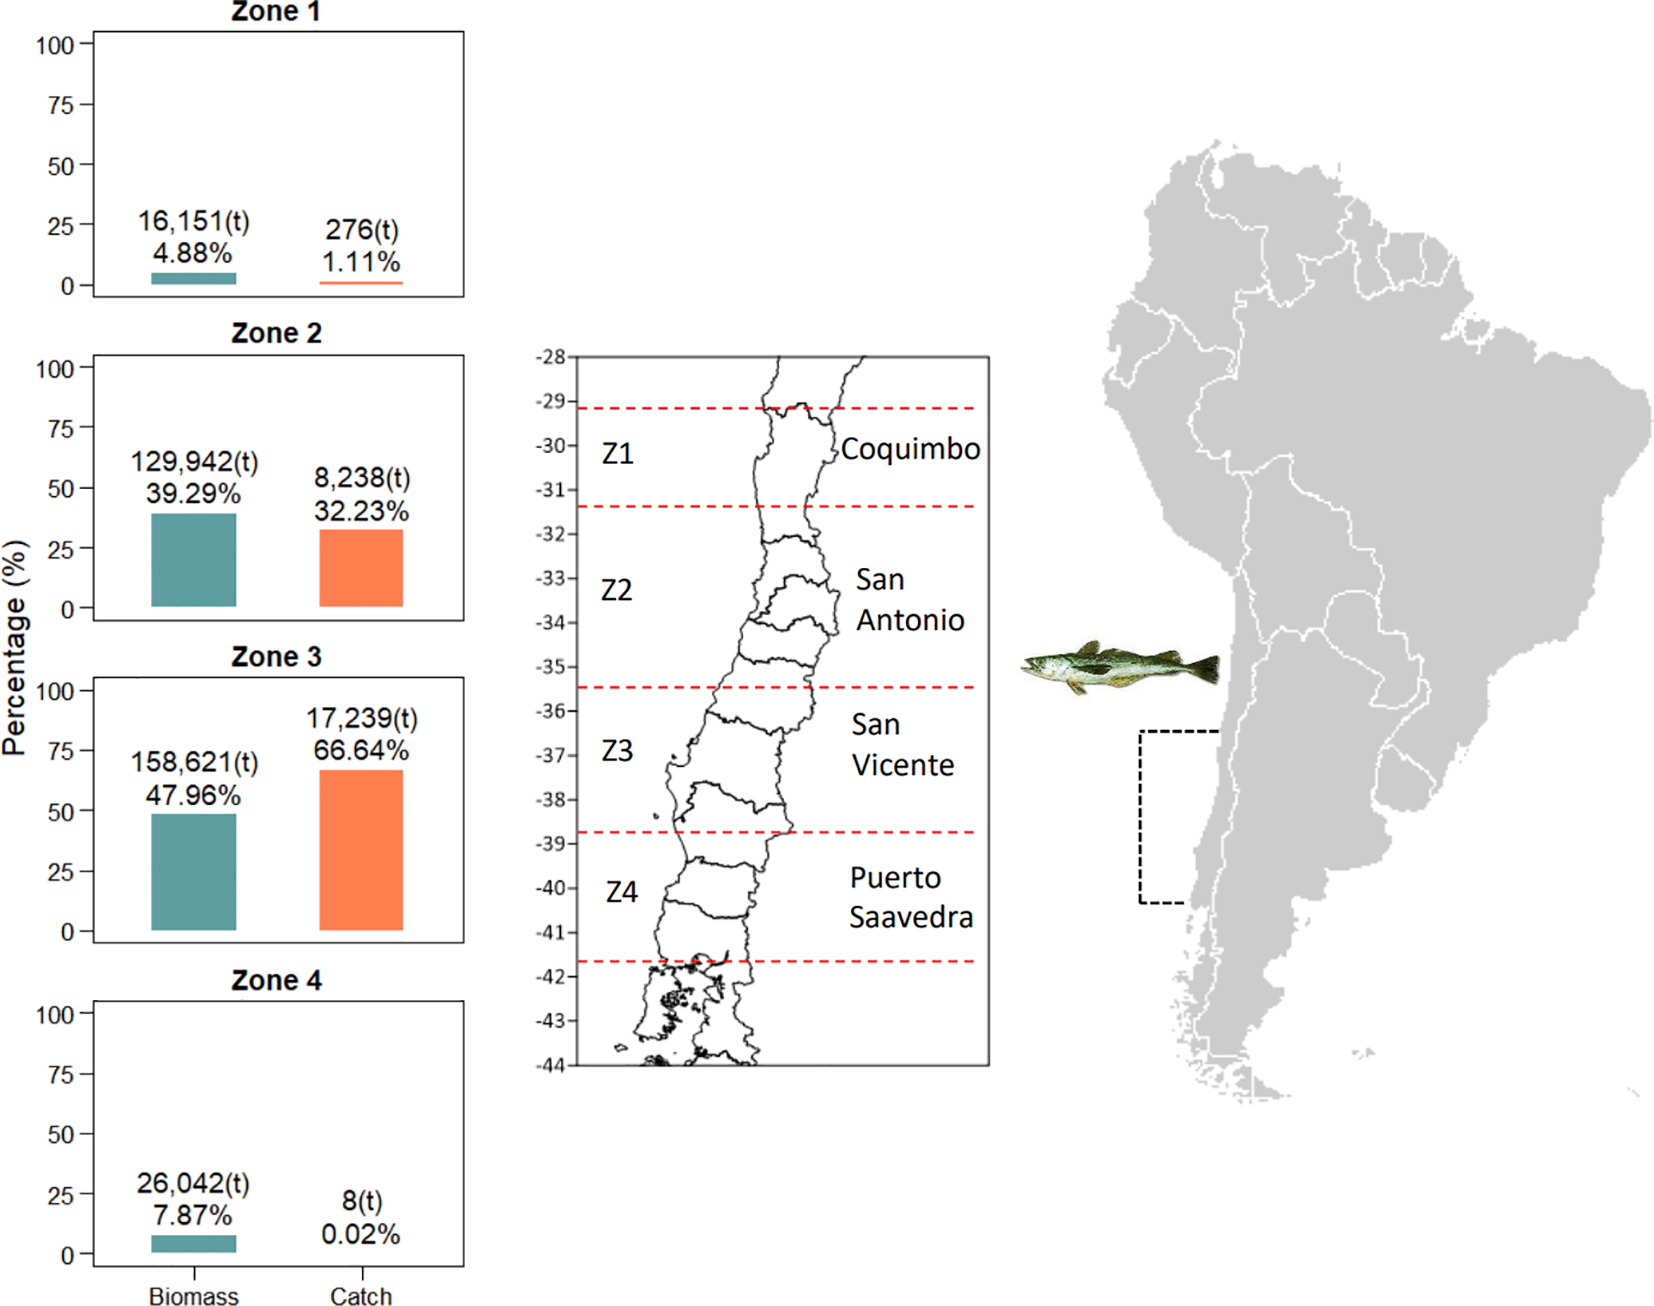
Common hake (Merluccius gayi) fishery distribution. In bars, the proportion of catches (orange) and acoustic biomass (green) recorded per zone is given. Absolute values (in tonnes) represent the average 2017-2021.
Since the late 1970s, evidence of spatial heterogeneity of the biological attributes has been reported for this species. Among these, the work of Avilés et al. (1979) stands out, who, based on biological-fishing indices, migratory patterns, and monitoring of the reproductive process, propose the existence of three possible spawning areas. In the same sense, Balbontín and Fischer (1981) reported latitudinal differences in the size at maturity of hake, also corroborated by Payá et al. (1994), who in addition determined morphological differences and proposed the current four representative zones of the fishery. In addition, George-Nascimento (1996) analyzes the parasitic fauna, suggesting at least two ecological stocks. These researches indirectly account for the ecological heterogeneity of the common hake habitat and suggest differences in the spatial structure of its population.
Notwithstanding this, the management of this fishery assumes the existence of a single population (Aguayo-Hernández, 1995) and estimates of biological productivity, expressed as annual catch quotas, are estimated based on the assumption of a homogeneous population with invariant life history parameters in time (Tascheri, 2022). In this sense, the main biological processes of common hake, such as reproduction and growth, are considered homogeneous in its extensive geographical distribution covering over 780 nautical miles (Figure 1). This population is currently overexploited (Tascheri, 2022) and it is unknown if this condition is homogeneous throughout its spatial distribution, a very relevant aspect to know in order to implement recovery actions for the hake population. Understanding the spatial structures of fish populations is essential for the development of sustainable and productive fisheries (Cadrin, 2020). This work evaluates the spatial heterogeneity of the biological traits of common hake from biological samples collected over 26 years of fishery monitoring and acoustic surveys. Exploratorily, the four reference zones of the fishery are analyzed as closed subpopulations. The spawning potential ratio (SPR), fishing mortality (Fcr), and biological reference points (BRP) are estimated by area of analysis. The impact of considering the spatial heterogeneity of biological attributes in population diagnosis and the prospects for the management and recovery of one of the most important fishing resources in the region is determined.
2 Materials and methods
2.1 Data source and study zone
Biological samples collected by the Instituto de Fomento Pesquero (www.IFOP.cl) from 1996 to 2021, both during fishery monitoring and by acoustic surveys carried out in the distribution range of common hake off Chile (29°10’S to 42°00’S) were analyzed. Fishery monitoring is carried out by a team of scientific observers both on board the vessels and in the main ports and landing coves for hake. On the other hand, the acoustic surveys are carried out between August and September of each year. The survey covers the continental platform between the 50- and 500-meter isobaths. Identification fishing hauls are carried out with bottom trawls on the continental shelf, following a systematic sampling on transects perpendicular to the coast with a spacing of ten nautical miles between them. The individual samples from fisheries corresponded to daily observations taken by landing port and consider, among other attributes: total length (TL), weight (total, gutted, and gonads), sex, and maturity status. Additionally, the haul depth data is included in the acoustic surveys sampling. The information was analyzed based on the four zones defined by Payá et al. (1994) used both in acoustic surveying and in fishery monitoring; zone 1: 29°10’S – 31°25’S, zone 2: 31°25’S – 35°30’S, zone 3: 35°30’S-38°39’S, and zone 4: 38°39’S – 42°00’S (Figure 1).
2.2 Statistical modeling
Generalized Linear Mixed Models (GLMM) (Breslow and Clayton, 1993; Tan et al., 2007; Stroup, 2012) were used to analyze the effect of various linear predictors on five biological variables of interest: total weight (TW), gonad weight (GW), gutted weight (GtW), total length (TL), and sexual maturity (Mat) by size. The models were specified and fitted using the language and environment for statistical computing and R graphics (R Core Team, 2020). The lme4 package library (version 1.1-31) was used to fit linear (lmer) and logistic (glmer) models to the data. In all the models considered, the linear predictor was made up of the year as a random variable, while sex, quarter, and zone were considered as fixed effects.
Total length (TL) was considered as a continuous predictor variable in the models related to weight and sexual maturity. Similarly, depth was considered a fixed effect in the TL model fitted to acoustic survey data (Table 1). Weight measurements were transformed into a logarithmic scale and assumed to have a normal distribution, while the proportion of mature females was treated based on a binomial distribution and a logistic model considering a “logit” link function. The maturity data collected during fishery monitoring were considered only for the third quarter of each year (July-September), the described period of maximum reproductive activity of this species (Alarcón et al., 2008), coinciding with the moment in which acoustic survey are carried out (Molina et al., 2022). The maturity state was converted to a binary variable (p) according to the microscopy scale used by IFOP (Balbontín and Fischer, 1981). Females were considered fully mature for stage values equal to or greater than 3 (p=1), and in the other cases zero was set as the value (p=0). The size at which 50% of females are mature was calculated by zone using estimator.
Table 1
| Response variable | Predictor variables | ||
|---|---|---|---|
| Fixed effects | Random effects | Continuous variable | |
| Total weight | Zone+Quarter+Sex | Year | log(Length) |
| Gonad weight | |||
| Gutted weight | |||
| Total length | Zone+Quarter+Sex+Depth (*) | Year | |
| Maturity (**) | Zone+Quarter | Year | Length |
Generalized linear mixed models (GLMM) used to describe variability of biological traits (response variables) of common hake off Chile.
(*) Considered only in acoustic surveys data modeling.
(**) Only females at 3th quarter were considered.
where μ is the intercept of the model, β the TL coefficient, and Z the fitted model coefficient in each zone. The hypothesis of spatial homogeneity of biological attributes was evaluated based on the significance of the model coefficients (p-value), the Z statistic, and the 95% overlapping of confidence intervals.
2.3 Spawning potential ratio
We used the LBPA model (Length-based pseudo-cohort analysis) (Canales et al., 2021) to analyze the size compositions of the fishery (by combining data both gillnets and trawls) and generate estimates of the Spawning Potential Ratio (SPR) and fishing mortality by zone. The analyses assumed, exploratorily, that each zone could constitute independent population sub-units. Thus, and recognizing the biological relationship between growth and sexual maturity (e.g. Stamps et al., 1998; Froese and Binohlan, 2000; Araya and Pepe-Victoriano, 2010), the proxy of asymptotic length () was calculated by zone (Z) considering the empirical relationship between the average size at first sexual maturity () and average of both sexes estimated by Cerna et al. (2013) (=63.6 cm, k=0.175) for the entire hake distribution area. The estimator used was:
On the other hand, both the weight-size relationship parameters (a and b) and the sexual maturity ogive parameters, sizes at 50% and 95% maturity ( and ), were calculated from the coefficients obtained in the GLMM model (see 2.2). For comparative purposes, the biological homogeneity scenario considered the growth parameters obtained by Cerna et al. (2013), while those of maturity and weight-length relationship corresponded to the average of the estimates obtained in this work. The instantaneous rate of natural mortality (M=0.33) corresponded to the value reported by Tascheri (2022). In order to represent the population status of the most recent period, the LBPA model was adjusted to the size compositions of the fishery over the last five years. The SPR value by zone represents the ratio of current spawning biomass to unfished or virgin biomass. This was calculated based on the spawning biomass per recruit (SSBPR) assumed at the beginning of the reproductive period.
where Fcr is the full recruitment fishing mortality of the fishery. The SSBPR for the level of fishing mortality was calculated from a recruit analysis from the results of the LBPA model. For diagnostic purposes, the management objective established by the Undersecretariat of Fisheries and Aquaculture of Chile was considered, which corresponds to 40% of the virgin biomass. Thus, the reference fishing mortality corresponded to the equivalent F40% ~ Fmsy (“proxy” of Fmsy) (SUBPESCA, 2023).
The LBPA model assumes equilibrium conditions in fishing mortality and recruitment. It also considers that selectivity is logistical and that the fishing effort is the main responsible factor for the depletion of the largest reproductive individuals. The model details are given in Appendix and a priori parameters distributions are provided in Table 2.
Table 2
| Parameters | Symbol | Priors |
|---|---|---|
| Asymptotic length (cm) | Loo | 47.9; 60.9;72.1;73.3 (fixed by zone) |
| Growth coefficient (year-1) | k | 0.17 (fixed for all zones) |
| Natural mortality rate (year-1) | M | 0.33 (fixed for all zones) |
| Fishing mortality rate (year-1) | Fcr | ~N(log(M); 0.52) |
| Length at 50% selectivity (cm) | L50 | ~N(log(ML); 0.12) |
| Selectivity slope (cm) | d | ~N(log(0.1L50); 0.12) |
| Size of recruitment (cm) | Lr | ~N(log(0.75L50); 0.12) |
| c.v. length at-age | cv | ~N(-2.3; 0.52) |
Initial LBPA model parameters applied to common hake catch at-length by zone.
(ML, mean length of size compositions sample).
3 Results
Biometric measurements were analyzed from over 610,000 M. gayi specimens collected in fishery monitoring, and independently, over 76,000 specimens measured over 25 years of acoustic survey data. The highest frequency of the measured specimens showed sizes between 34 cm and 42 cm, with an average of 38 cm and 422 g of total weight. 60% of the samples consisted of females with average sizes around 40 cm TL, larger than the males (36 cm TL). The prevalence of mature females (reproductive stage greater than three) is higher during the third quarter, when their sizes reach an average of 41.4 cm (Figure 2A). A boxplot diagram of the average size shows that, regardless of sex, the average size of individuals increases from north (zone 1) to south (zone 4), as does their variability range (Figure 2C). In zone 1, the fishery is mainly artisanal with gillnets. In zones 2 and 3, artisanal fleets and industrial trawlers operate simultaneously, the latter outside the first 5 nm. Also, this information shows there are no substantial differences neither patterns in mean length between fleets (e.g. zones 2 and 3, trawl vs gillnet) (Figures 2B, D), being the most differences explained by the spatial particularities analyzed in this paper.
Figure 2
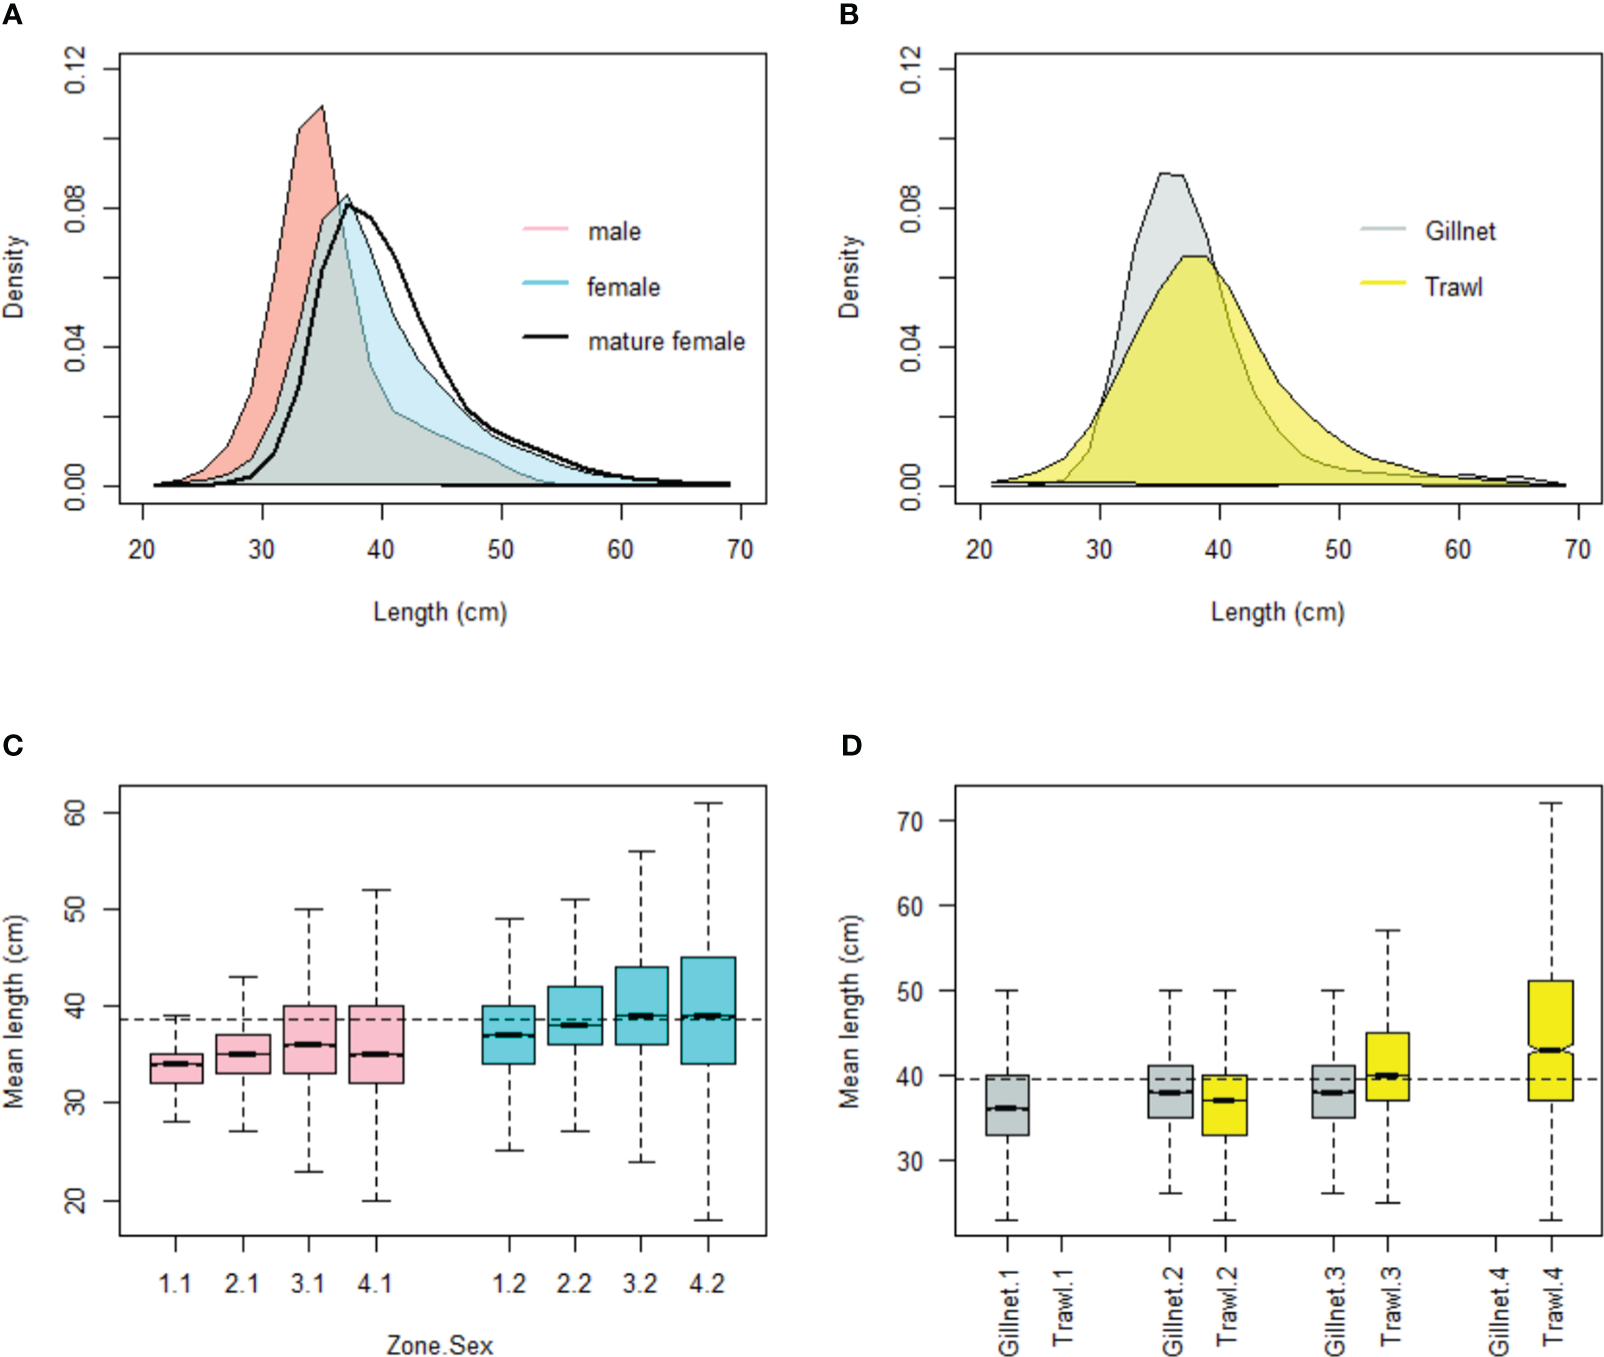
Size frequency of common hake fishery in the period 1997-2021 by sex (A) and fleet (B). Box-plot of the average length by zone (1-4), sex (1: male, 2: female) (C) and fleet (D). The mature females correspond to the 3rd quarter of the year. The horizontal line represents the total average.
3.1 Biological traits modeling
The GLMM models were fitted to the data according to different specifications. The good performance of the models to the assumptions was corroborated with the qq-plot diagram of the studentized residuals, in which most of the selected points (for a subsample of 10,000 values) are located around the expected straight line of predicted values (Figure 3). Likewise, the goodness of fit stands out in the variables related to weight (total, gonad, and gutted weight), whose variability was notably reproduced (only a sample of the first 100 values is presented). The individual size (TL) model stands out with a lower quality of fit, in which case the predictions were mainly determined by spatiotemporal patterns, and to a lesser extent by their variability. In all the cases analyzed, the studentized residuals did not show significant trends regarding the predicted values. Additionally and without prejudice to the models and the significance of the effects on the linear predictor considered, the conditional coefficient of determination was the highest (r2>0.95) for the total weight (TW) and gutted weight (GtW) variables, and the lowest value was recorded in the total length (TL) model (r2<0.5) ratified in both data sources (Tables 3, 4).
Figure 3
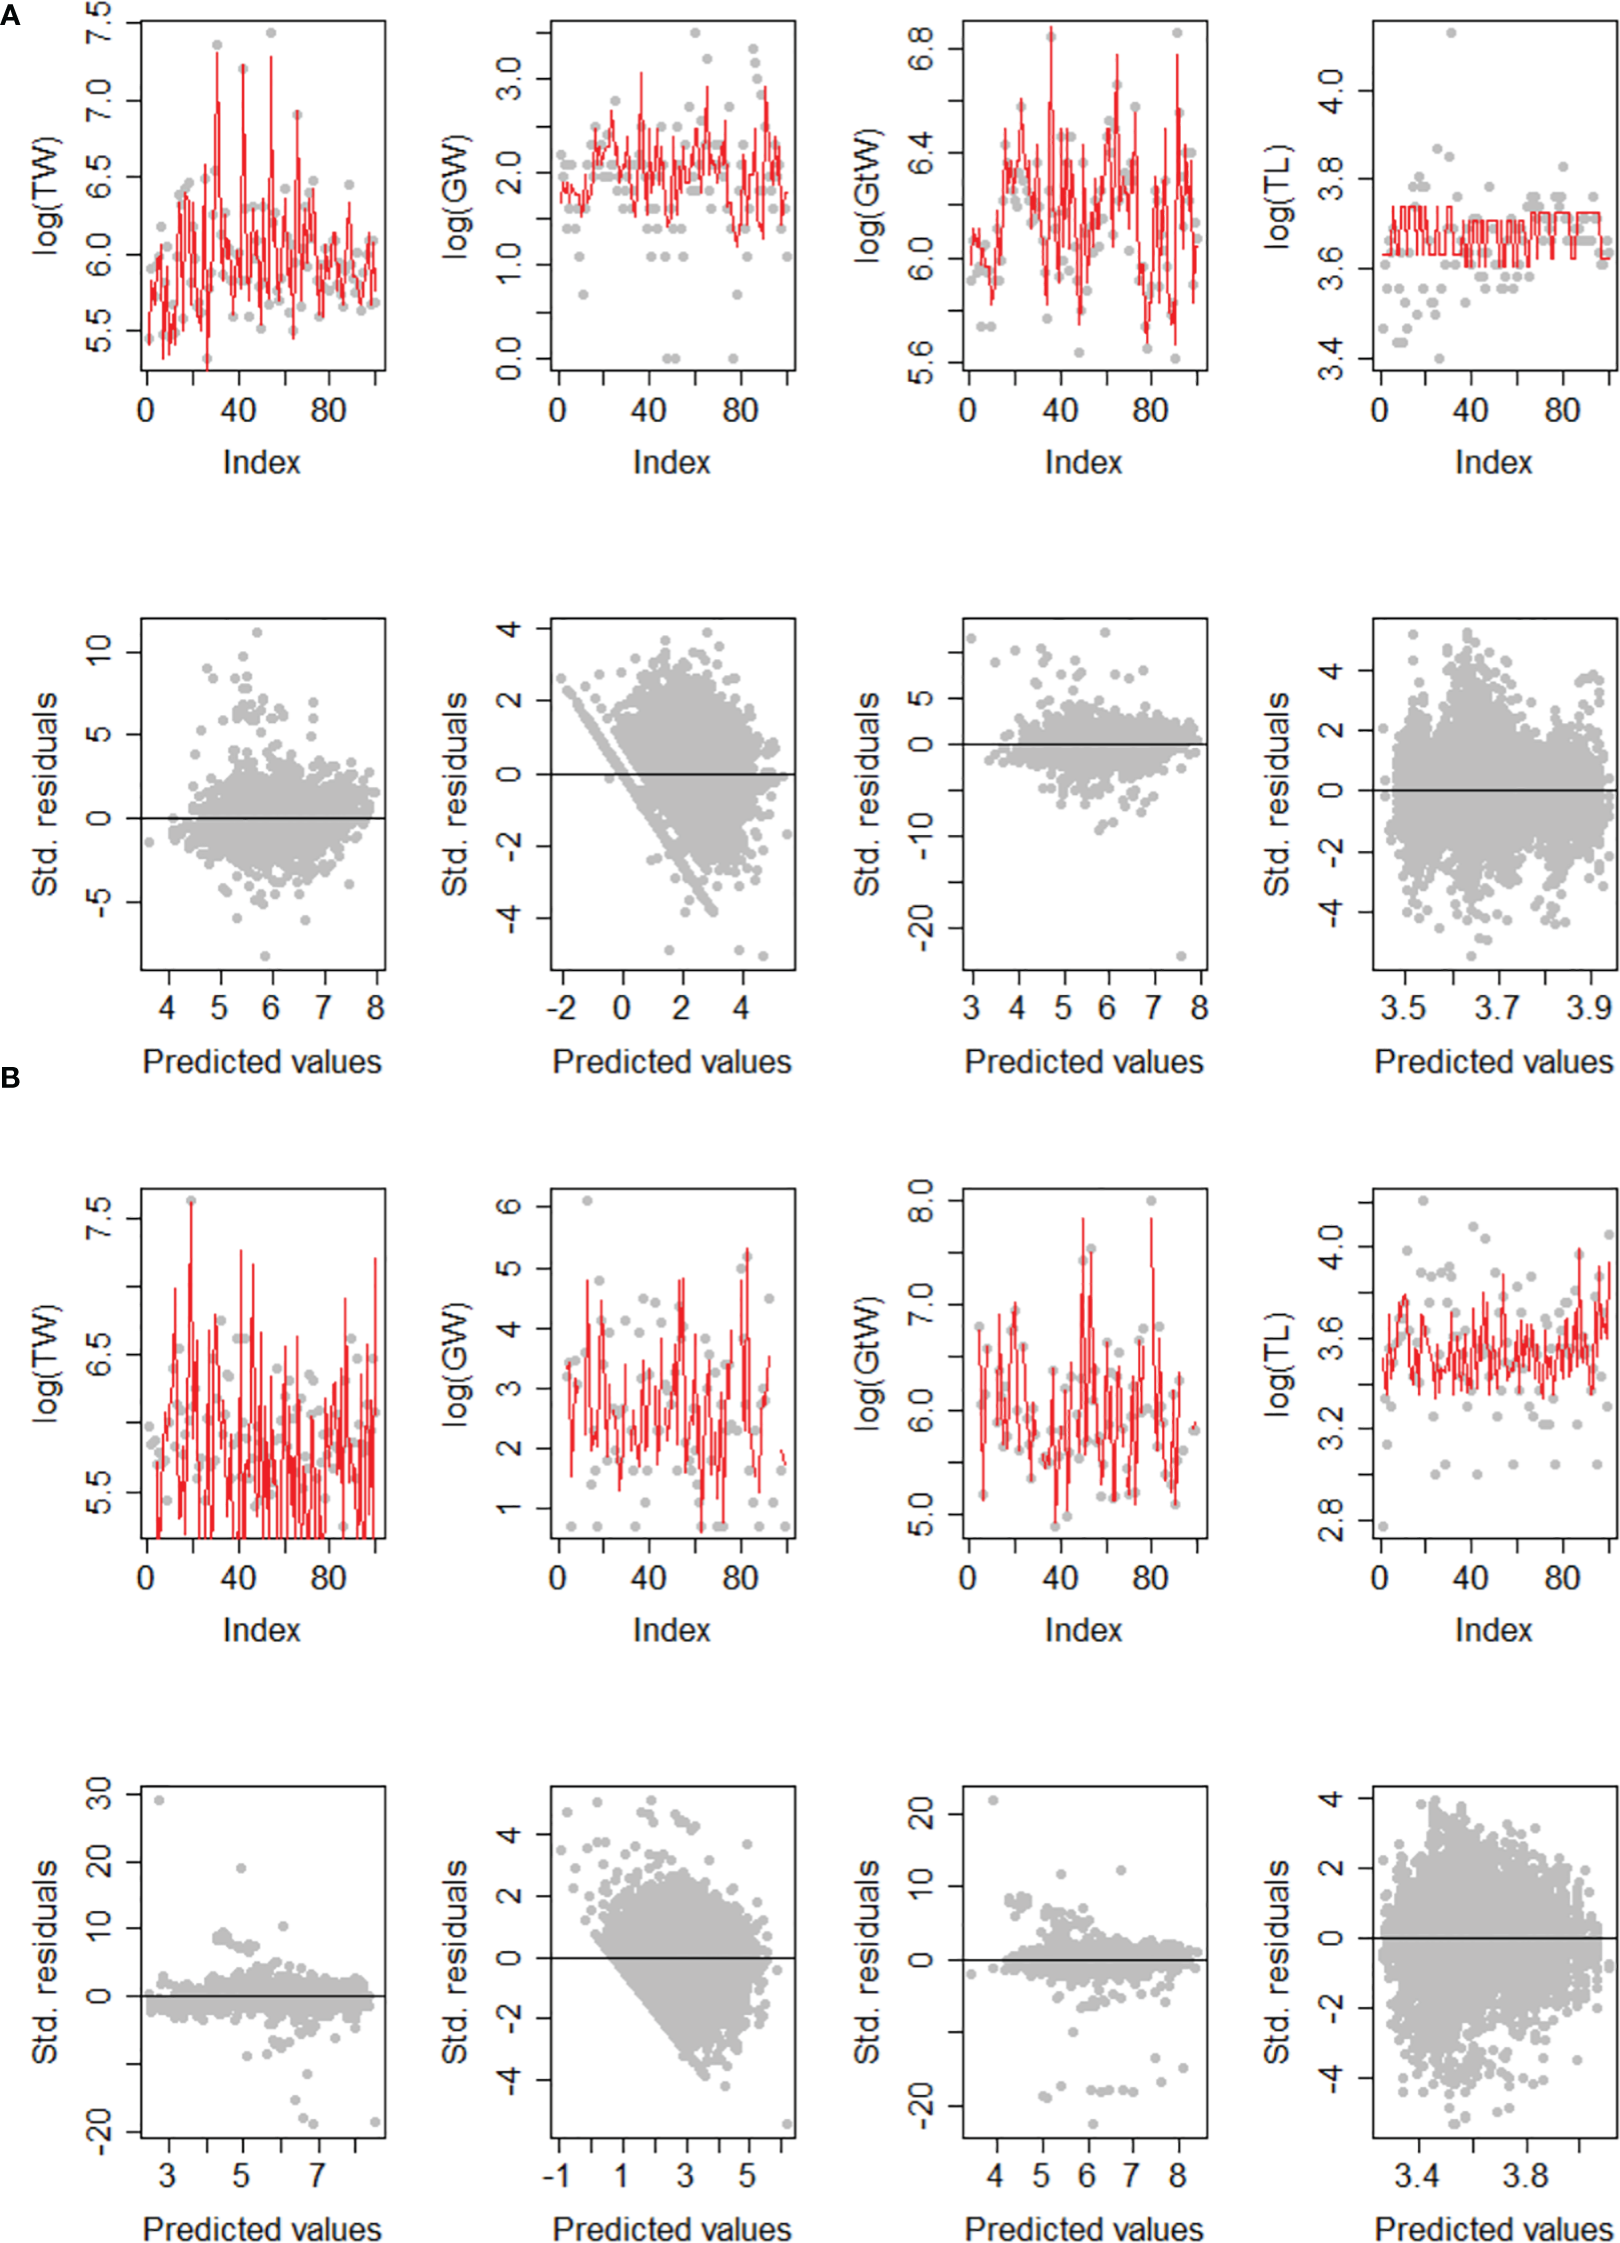
Example of model fit diagnostic for Total weight (TW), Gonad weight (GW), Gutted weight (GtW), and Total length (TL). (A) Models for fisheries monitoring data. (B) Models for data from acoustic surveys.
Table 3
| Predictors | Total weight (TW) | Biological response variable | |||||||||||||
|---|---|---|---|---|---|---|---|---|---|---|---|---|---|---|---|
| Gonad weight (WG) | Gutted weight (GtW) | Total length (log TL) | Maturity (Mat) | ||||||||||||
| Estimates | t value | p | Estimates | t value | p | Estimates | t value | p | Estimates | t value | P | Estimates | z value | P | |
| (Intercept) | -4.495 | -566.838 | <0.001 | -14.331 | -220.463 | <0.001 | -4.557 | -589.55 | <0.001 | 3.543 | 167.464 | <0.001 | -6.540 | -13.69 | <0.001 |
| Female | 0.015 | 47.652 | <0.001 | -0.086 | -22.077 | <0.001 | 0.006 | 12.612 | <0.001 | 0.105 | 291.876 | <0.001 | |||
| Zone 2 | 0.087 | 76.746 | <0.001 | -0.047 | -1.233 | 0.218 | 0.033 | 6.933 | <0.001 | 0.055 | 41.985 | <0.001 | -1.792 | -4.48 | <0.001 |
| Zone 3 | 0.094 | 81.615 | <0.001 | -0.554 | -14.558 | <0.001 | 0.056 | 11.965 | <0.001 | 0.076 | 57.428 | <0.001 | -3.323 | -8.30 | <0.001 |
| Zone 4 | 0.114 | 82.634 | <0.001 | -0.295 | -7.688 | <0.001 | 0.070 | 14.645 | <0.001 | 0.076 | 47.488 | <0.001 | -3.500 | -8.66 | <0.001 |
| 2th Quarter | 0.014 | 33.563 | <0.001 | 0.235 | 45.361 | <0.001 | 0.006 | 9.461 | <0.001 | -0.002 | -3.753 | <0.001 | |||
| 3th Quarter | 0.018 | 42.459 | <0.001 | 0.997 | 189.742 | <0.001 | -0.013 | -19.43 | <0.001 | 0.020 | 38.454 | <0.001 | |||
| 4th Quarter | -0.015 | -35.852 | <0.001 | 0.548 | 105.581 | <0.001 | -0.022 | -35.03 | <0.001 | 0.010 | 19.988 | <0.001 | |||
| TL (log) | 2.833 | 2628.811 | <0.001 | 4.427 | 397.883 | <0.001 | 2.837 | 2090.067 | <0.001 | ||||||
| TL | 0.278 | 64.57 | <0.001 | ||||||||||||
| Observations | 610,023 | 203,341 | 207,448 | 549,472 | 38,891 | ||||||||||
| Conditional r2 | 0.946 | 0.582 | 0.968 | 0.463 | 0.615 | ||||||||||
Main statistics of GLMMs applied to biological variables collected in monitoring of common hake fishery: total weight, gonad weight, gutted weight, total length and maturity proportion.
Table 4
| Predictors | Total weight (TW) | Biological response variable | |||||||||||||
|---|---|---|---|---|---|---|---|---|---|---|---|---|---|---|---|
| Gonad weight (WG) | Gutted weight (GtW) | Total length (log TL) | Maturity (Mat) | ||||||||||||
| Estimates | t value | P | Estimates | t value | p | Estimates | t value | p | Estimates | t value | p | Estimates | z value | p | |
| (Intercept) | -4.957 | -546.458 | <0.001 | -14.430 | -234.529 | <0.001 | -4.805 | -498.137 | <0.001 | 3.355 | 139.253 | <0.001 | -7.226 | -34.114 | <0.001 |
| Female | -0.005 | -4.610 | <0.001 | -0.322 | -44.543 | <0.001 | -0.003 | -2.405 | 0.016 | 0.115 | 67.068 | <0.001 | |||
| Zone 2 | 0.010 | 7.128 | <0.001 | 0.020 | 1.945 | 0.052 | 0.009 | 5.836 | <0.001 | 0.075 | 29.242 | <0.001 | 0.029 | 0.716 | 0.474 |
| Zone 3 | 0.027 | 18.697 | <0.001 | -0.342 | -32.710 | <0.001 | 0.029 | 18.936 | <0.001 | 0.121 | 45.287 | <0.001 | -0.959 | -23.938 | <0.001 |
| Zone 4 | 0.058 | 37.546 | <0.001 | -0.147 | -13.210 | <0.001 | 0.052 | 31.866 | <0.001 | 0.059 | 20.440 | <0.001 | -0.792 | -18.333 | <0.001 |
| TL (log) | 2.986 | 1523.405 | <0.001 | 4.652 | 312.847 | <0.001 | 2.916 | 1332.011 | <0.001 | ||||||
| Depth 100-200 | 0.006 | 2.046 | 0.041 | ||||||||||||
| Depth 200-300 | 0.096 | 33.274 | <0.001 | ||||||||||||
| Depth 300-400 | 0.218 | 66.697 | <0.001 | ||||||||||||
| Depth >400 | 0.259 | 55.687 | <0.001 | ||||||||||||
| TL | 0.22 | 98.84 | <0.001 | ||||||||||||
| Observations | 76,914 | 74,612 | 74,603 | 76,914 | 50,303 | ||||||||||
| Conditional r2 | 0.977 | 0.644 | 0.972 | 0.366 | 0.662 | ||||||||||
Main statistics of GLMMs applied to biological variables collected in acoustic surveys of common hake: total weight, gonad weight, gutted weight, total length and maturity proportion.
3.2 Body and gonads weight
For most of the fixed effects analyzed, the linear predictor coefficients on the weight-for-size metrics (TW, GW, and GtW) were significant for both the data from fishery monitoring and from acoustic surveys. This was verified with the value p<0.001 and the t-student statistic of the coefficients related to the zone, sex, and quarter fixed effects (∣t value ∣>1.96). The total weight (TW) and gutted weight (GtW) model coefficients indicate that regardless of the size, this variable increases linearly from north (zone 1) to south (zone 4) (Tables 3, 4), with all coefficients being significantly different from zero and greater than the reference value (zone 1) (p<0.001, Tables 3, 4; Figures 4A, E). The allometric exponent of total weight (TW) at size indicates that M. gayi has a slight negative allometry (TL coefficient (log)<3) (Tables 3, 4) and that females weigh significantly more than males (Coeff =0.015, p-value<0.001).
Figure 4
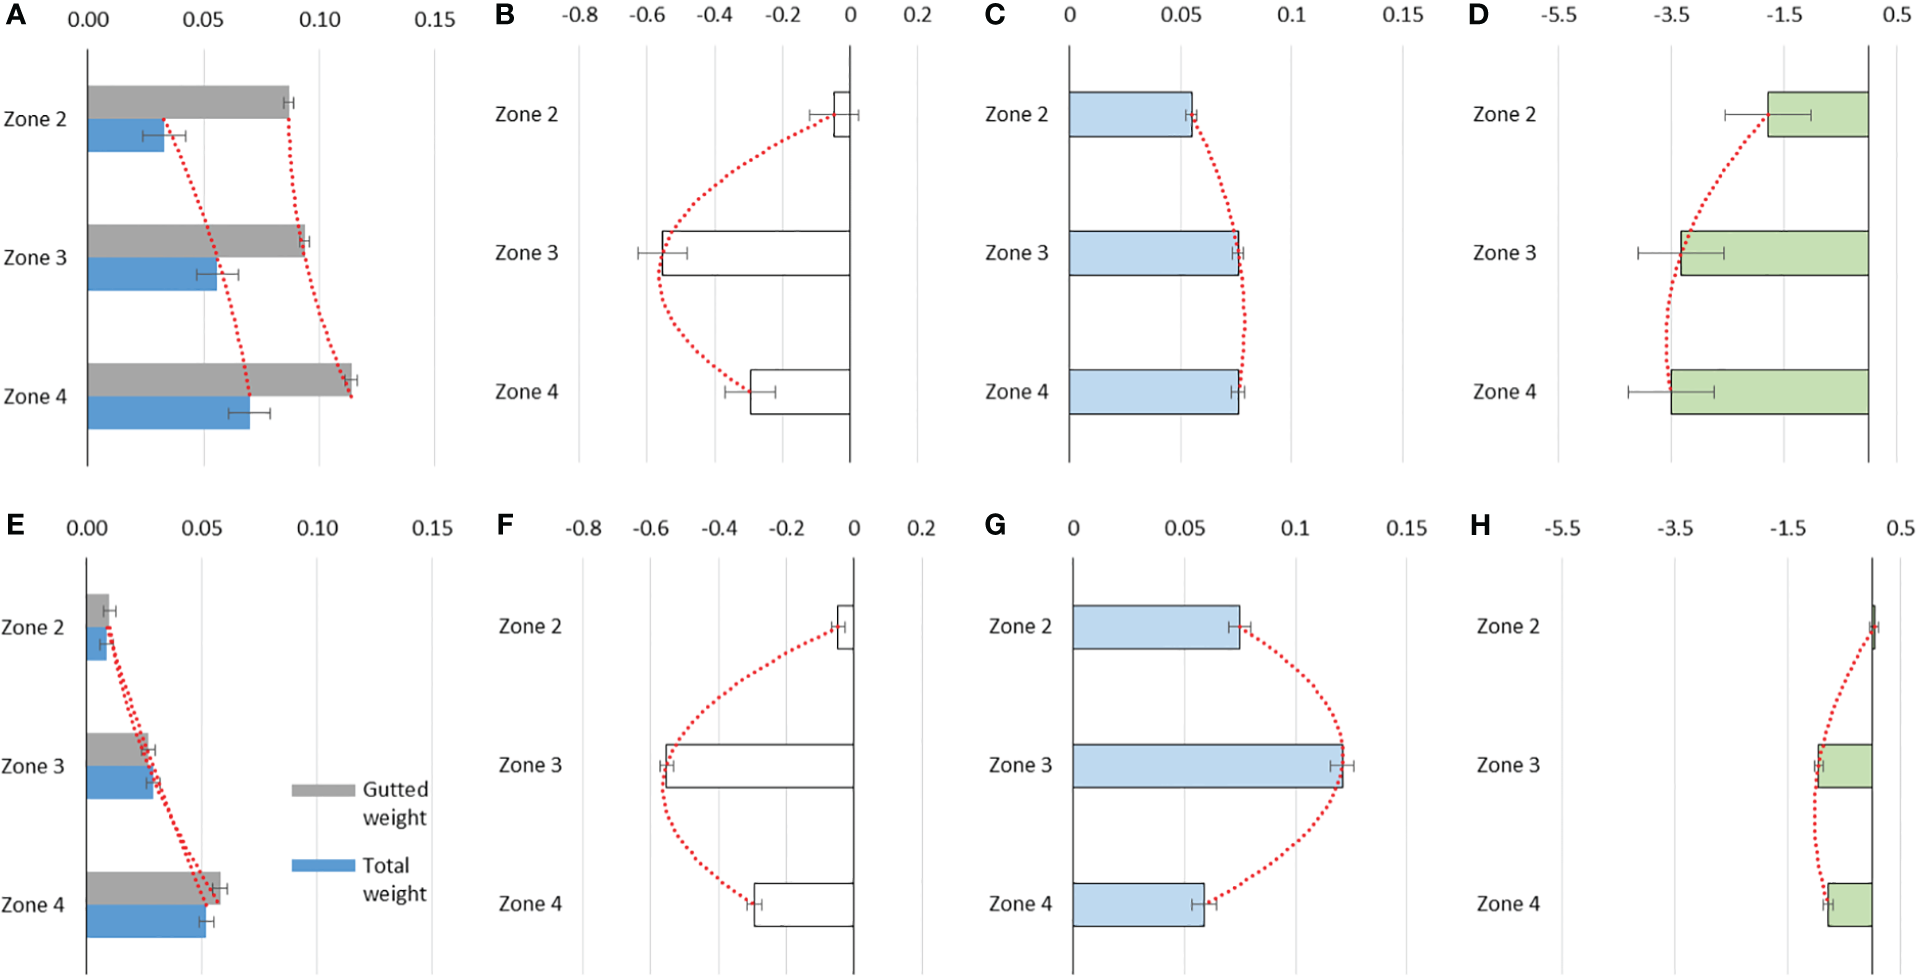
Coefficients of the spatial effect in the General Linear Mixed Models (GLMM) fitted to the biological variables of common hake: (A, E) total weight and gutted weight, (B, F) gonad weight, (C, G) total length, (D, H) sexual maturity. Upper panels: Fishery monitoring data. Bottom panels: Acoustic survey data. The segmented red line represents the trend. The error bar represents the 95% confidence interval.
The spatial pattern recorded in TW and GtW was not observed in the gonad weight-for-size (GW) model. Indeed, in both data sources (fishery monitoring and acoustic surveys) the effect of zone 2 was not significant (p-value >0.05, Tables 3, 4) and, therefore, it is considered similar to zone 1 (reference effect). The maximum GW is recorded in zone 3 and decreases slightly in zone 4 (Tables 3, 4; Figures 4B, F). Like TW, GW presents its highest value during the 3rd quarter of each year (Table 3), which is expected during the reproductive period of M. gayi. In the same sense, GtW shows the lowest value during the fourth quarter of each year (coeff=-0.022, Table 3) in relation to the post-reproductive period. Notwithstanding the spatial and temporal heterogeneity of these biological traits, the homogeneity exhibited by GW between zones 1 and 2 is noteworthy (Z=-1.23, Table 5).
Table 5
| Source | Zone 1 | Zone 2 | Zone 3 | ||||
|---|---|---|---|---|---|---|---|
| Fishery | Surveys | Fishery | Surveys | Fishery | Surveys | ||
| TW | 76.80 | 7.10 | |||||
| GW | -1.20 | 5.10 | |||||
| Zone 2 | GtW | 6.90 | 6.70 | ||||
| TL | 42.00 | 29.20 | |||||
| Mat | -4.50 | 0.70 | |||||
| TW | 81.60 | 18.70 | -6.20 | -11.90 | |||
| GW | -14.60 | -17.80 | 13.30 | 23.70 | |||
| Zone 3 | GtW | 12.00 | 21.50 | -4.80 | -15.70 | ||
| TL | 57.40 | 45.30 | -16.00 | -17.90 | |||
| Mat | -8.30 | -23.90 | 3.80 | 24.30 | |||
| TW | 82.60 | 37.50 | -23.80 | -33.60 | -17.40 | -21.20 | |
| GW | -7.70 | 15.20 | 6.50 | -12.50 | -6.80 | -34.70 | |
| Zone 4 | GtW | 14.70 | 33.30 | -7.80 | -31.80 | -3.00 | -15.50 |
| TL | 47.50 | 20.40 | -16.00 | 6.30 | 0.00 | 23.20 | |
| Mat | -8.70 | -18.30 | 4.30 | 20.20 | 0.40 | -4.20 | |
Z-test statistics for homogeneity of common hake biological traits between zones and data source; total weight (TW), gonad weight (GW), gutted weight (GtW), total length (TL) and Maturity at size (Mat).
Bold values reflect non-significant differences.
3.3 Total length and maturity at-length
The total length (TL) model for the fishery data shows that females are significantly larger than males (coeff =0.11, p-value<0.001) (Tables 3, 4), and in general the size of M. gayi increases from north (zone 1) to south (zones 3-4) (Table 3, Figure 4C). This situation is partially corroborated in the data from acoustic surveys, as the average size in zone 4 is slightly lower (coeff=0.059, p-value<0.001) (Table 3 and Figure 4G). Likewise, this data source reveals that size increases significantly at greater depths (coeff depth>400 = 0.259, p-value<0.001, Table 3), while the seasonal effect shows that the maximum record is observed in the 3rd quarter of each year (coeff 3rd quarter=0.02 p-value<0.001, Table 3). Despite the spatial heterogeneity exhibited by M. gayi TL throughout its distribution, the Z statistic indicates a significant homogeneity between zones 3 and 4 (Z=0.00, Table 4).
On the other hand, the maturity to size model shows that all coefficients were significant (p-value<0.001), as well as being different between zones with a general decrease pattern from north to south between zones 1 and zones 3-4 (coeff=-3.50) (Tables 3, 4; Figures 4D, H). Overall, the Z test shows high spatial heterogeneity in biological traits (Z>1.96) for both the GLMM coefficients of the fishery and the acoustic surveys. As a particular case, the significant homogeneity in sexual maturity stands out between zones 3 and 4 (Z=0.40, Table 5) according to the data collected in the fishery monitoring, as well as between zones 1 and 2 reflected in acoustic survey data. This is also represented in the sexual maturity to size model in females and in the calculation of size at first sexual maturity (Figure 5). There is a notable difference in maturity ogives and in length at first sexual maturity throughout the distribution of M. gayi. The TL50m increases from north to south by more than 40%, being lower in zone 1 (TL50m=23.6 cm, Figure 5) and greater in zones 3 and 4 (TL50m=35-36 cm, Figure 5). The TL50m in zone 2 exhibits an estimated intermediate value of 30.0 cm TL.
Figure 5
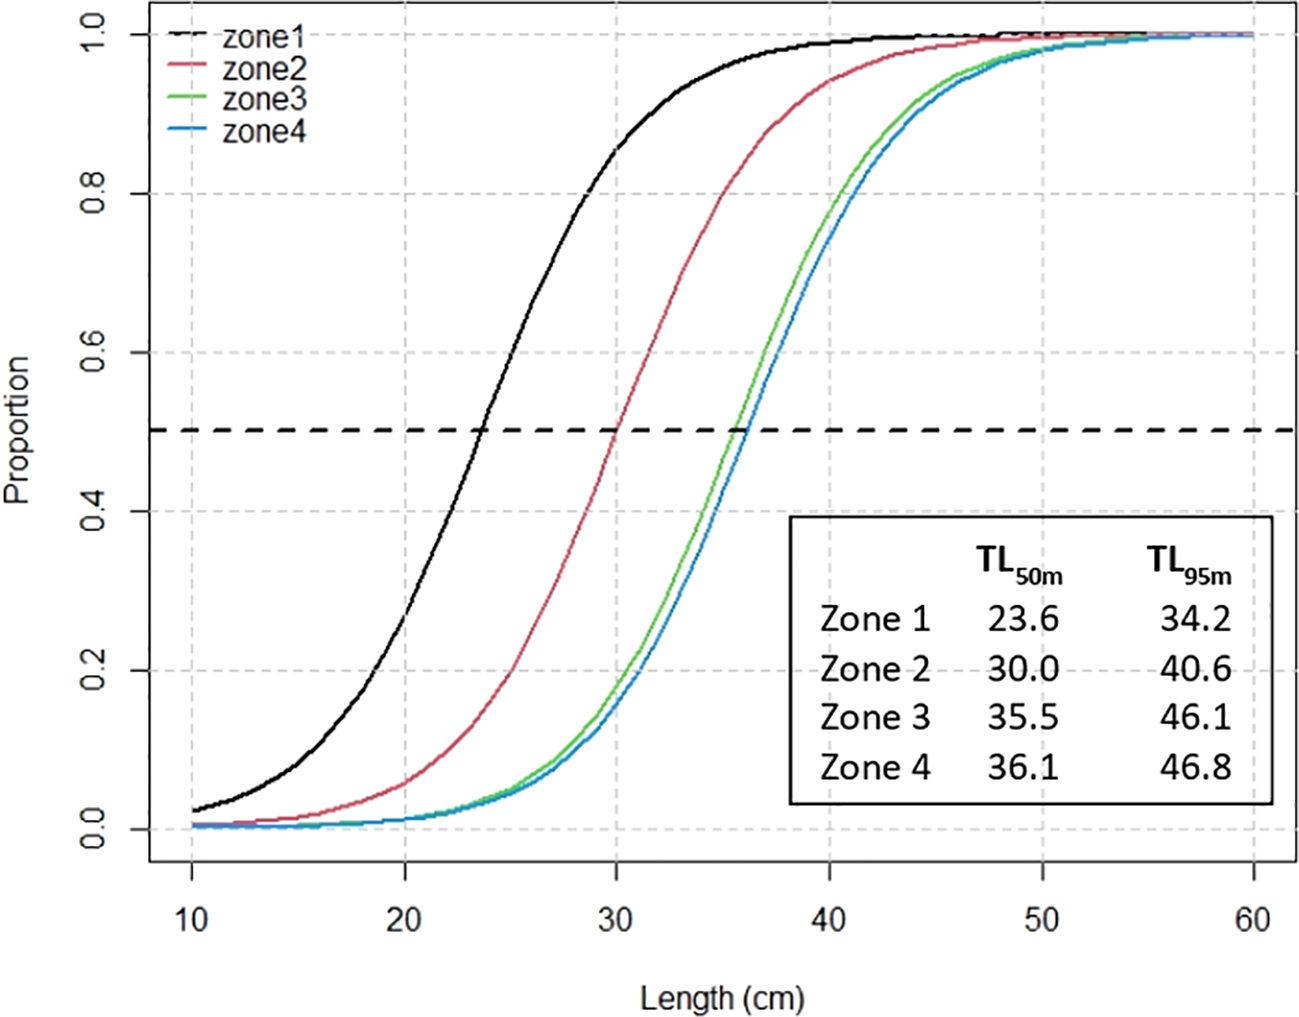
Proportion of maturity at-length in females of common hake by zones. TL50m and TL95m represent the length (in cm) at 50% and 95% maturity by zone, respectively.
3.4 Spawning potential ratio and biological reference points
The size compositions of the fishery, growth parameters, natural mortality, and biological traits were integrated around the LBPA estimation model. The model was fitted to the variability of the length frequency data by area for the last five years of the fishery (2017-2021) (Figure 6). The model underestimates the fish proportion around the length, but adequately adjusts both the segment of incompletely recruited specimens to the fishery and the segment representing the largest specimens in the population (Figure 6A). The goodness of fit is confirmed with the distribution of the standardized residuals represented by a normal distribution (Figure 6B). The selectivity curves show that in zones 1 and 2 mainly mature individuals (L50>TL50m) are affected (Figure 6C), while in zones 3 and 4 individuals over TL50m but which have not yet reached full maturity are affected (Figure 6C). Other model parameters indicate that the size at recruitment (Lr) to the fishery is smaller in zones 1 (27.2 cm TL) and 4 (27.9 cm TL) and higher in zones 2-3 (Lr~ 31 cm TL) (Table 6). The highest estimates of SPR are recorded in zones 1 (SPR =0.64) and 4 (SPR=0.38), while the lowest are found in zones 3 and 4 (SPR<0.18), well below a reference value (SPRmsy=0.4) (Figure 6D; Table 6). As highlighted from the acoustic information and the landings by zone (Figure 1), zones 1 and 4 present lower density and therefore low interest for the fishing fleet, thus explaining their better population condition. The estimates of fishing mortality (Fcr) in zones 2 (Fcr=1.24) and 3 (Fcr=1.12) are the highest and significantly exceed the reference values (Fmsy) (Table 6), incidentally explaining the SPR values found. The negative correlation between spawning potential (SPR) and fishing mortality (Fcr) is also highlighted (Figure 6E). In the same sense and according to the differences in the maturity curves at size, selectivity, mean weight, and asymptotic length, the reference fishing mortality values Fmsy between zones turned out to be different with a latitudinal pattern of decrease from north (Fmsy= 0.87) to south (Fmsy=0.26) (Table 6).
Figure 6
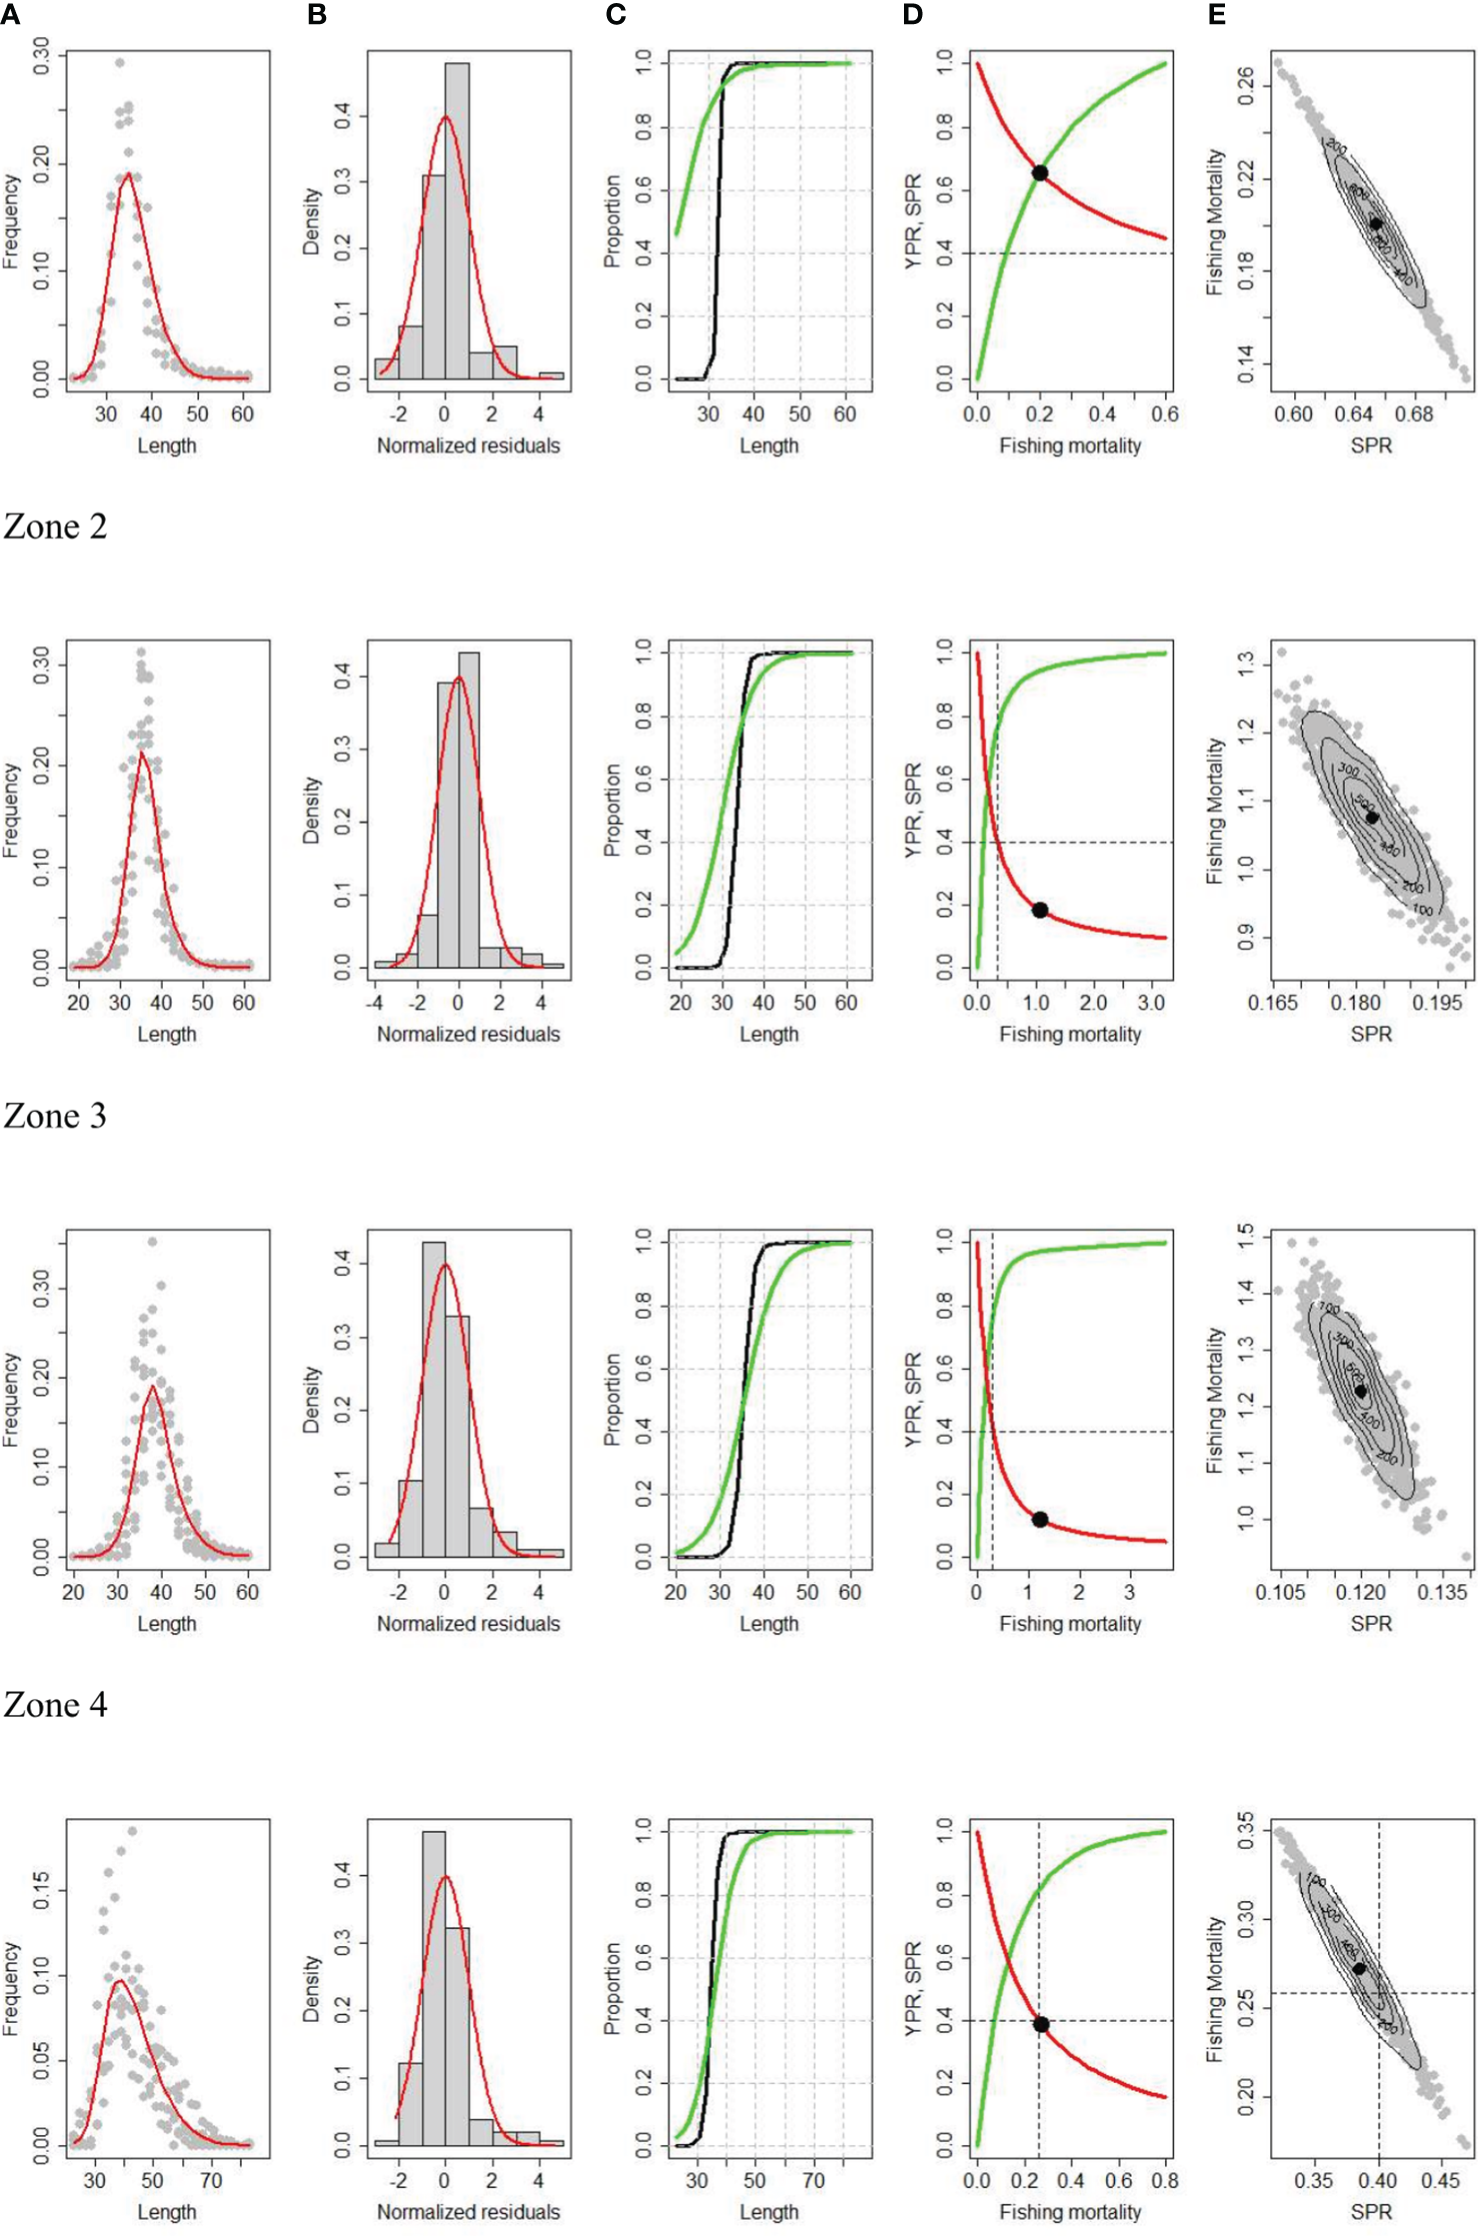
LBPA model fit to length composition data (A), histograms of residuals (B), selectivity (black) and maturity (green) curves (C), yield (green) and spawning biomass (red) per recruit curves (D), and correlation between SPR and fishing mortality (E) for common hake by zone.
Table 6
| Parameters/variable | Zone 1 | Zone 2 | Zone 3 | Zone 4 |
|---|---|---|---|---|
| Fcr | 0.219 (0.023) | 1.241 (0.091) | 1.121 (0.072) | 0.272 (0.029) |
| L50 (cm) | 32.166 (0.198) | 34.004 (0.217) | 35.054 (0.348) | 34.760 (0.382) |
| d (cm) | 1.082 (0.089) | 2.840 (0.177) | 2.959 (0.222) | 3.269 (0.349) |
| Lr (cm) | 27.273 (0.203) | 30.765 (0.180) | 31.023 (0.177) | 27.943 (0.851) |
| cv | 0.103 (0.002) | 0.094 (0.003) | 0.088 (0.003) | 0.120 (0.007) |
| SPR | 0.642 (0.019) | 0.178 (0.006) | 0.115 (0.005) | 0.386 (0.024) |
| Fmsy | 0.873 (0.023) | 0.352 (0.091) | 0.262 (0.072) | 0.258 (0.029) |
LBPA model’s parameters and variables estimated by zone.
The values in parentheses indicate the standard deviation.
A Kobe diagram shows the relative position of Fcr and SPR regarding four quadrants of interest. In zones 2 and 3, fishing mortality is 3.5 and 4.2 times higher than the respective reference values (Fcr/Fmsy>1) (overfishing) (Figure 7). At the same time, the lowest SPR values are recorded in these zones, below the reference value and, therefore, in a state of overexploitation (SPR/SPRmsy<1). A better condition is recorded in zone 1, where Fcr/Fmsy and SPR/SPRmsy levels are far from undesired levels. The exploitation condition in zone 4 is located around the management objective, however the 95% confidence intervals (CI95%) prevent ruling out the risks of overfishing and overexploitation (Figure 7). In all analyzed cases, a positive correlation stands out between the CI95% amplitude and the value of their respective variables. This same figure shows that, if the differences in biological traits were disregarded, zones 1, 2, and 3 would represent overfished and overexploited populations (Figure 7), while zone 4 would be far from any risk of conservation (SPR/SPRmsy > 1 and Fcr/Fmsy<1). The coincidence of results in zone 2 is also highlighted, which would be due to the similarity of the life history parameters used in this zone versus those reported by Cerna et al. (2013).
Figure 7
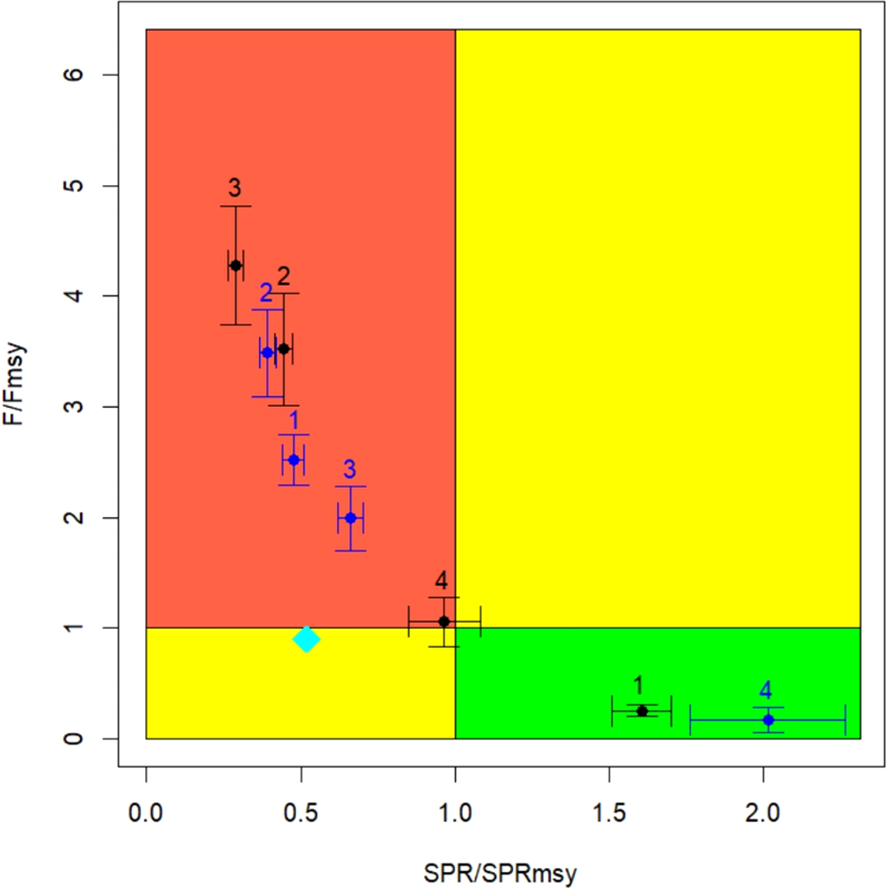
Kobe plot for the LBPA model estimations applied in common hake by zone. Error bars represent the confidence intervals at 95%. Black points are the results of considering spatial heterogeneity in biological traits. Blue points represent a homogeneous biological condition. The red zone is where overfishing and overexploitation occur simultaneously. Cyan diamond represents the current status reported by Tascheri (2022).
In comparative terms, the current relative biomass level based on a single stock and biological homogeneity SPR/SPRmsy ∼0.5 (Tascheri, 2022), is double that estimated in the most important hake fishing area (zone 3), and simultaneously less when assuming homogeneity of biological traits with spatial population differentiation (blue dots) (Figure 7). The discrepancy in the fishing mortality axis with respect to that reported by Tascheri (2022), is due to the fact that LBPA accounts for average fishing mortality values (equilibrium) responsible for the current conditions of the hake population.
4 Discussion
4.1 Spatial heterogeneity
This study provides evidence of significant heterogeneity in the spatial and temporal patterns of the main biological traits of common hake. The large amount of information analyzed, both from fishery monitoring and from acoustic surveys, allowed determining that independently of the size of the fish and the fleets selectivity, in the four main distribution areas of this species, the individual weight of the gonads, gutted weight, and total weight, as well as the proportion of mature females, differ geographically. The general pattern of these variables showed that the northern distributions of M. gayi presents individuals with lower weights and females maturing at smaller sizes. It is known that these types of phenotypic trait patterns can vary within populations of the same species or between species, in response to natural adaptive plasticity (Santoul et al., 2005) and genetic variability (e.g. Cadrin et al., 2010; Crozier and Hutchings, 2014; Denechaud et al., 2020). Similarly, and in the same area of analysis, Canales et al. (2016) found similar patterns in the condition and size at sexual maturity factor of Heterocarpus reedi (Crustacea Decapoda), explained by the greater supply of food around coastal upwelling areas and the mouths of major rivers located south of 32°S.
The particular spatial heterogeneity where inhabits this species, would explain why M. gayi specimens are larger in this area and have a better condition factor. The greater availability of food is determined mainly by the current system, the greater presence of upwelling areas (Arcos and Navarro, 1986; Landaeta and Castro, 2006; Gatica et al., 2015), and the contribution of nutrients from river discharge (Sobarzo et al., 2007; Canales et al., 2016). Additionally, these conditions are favorable as spawning and nursery areas for epipelagic and mesopelagic species (Castillo et al., 1991; Castro et al., 1993; Landaeta and Castro, 2002).
The evidence found in this study regarding the heterogeneity of biological traits in M. gayi suggest that this population is spatially structured. This statement is reinforced by parasitological studies carried out by George-Nascimento (1996) and Oliva and Ballón (2002), who suggested the existence of two stock units. Additionally, mitochondrial DNA analyses indicated the existence of at least three different genetic units (Vidal et al., 2012). The results suggest that biologically zones 1 and 2 exhibit greater differences than zones 3 and 4, so these latter could be considered as a common homogeneous zone. This emphasizes the need to delve further into the findings reported by different researchers in view of the implications for the fishery management of this resource.
4.2 Biological traits and management implications
One of the most distinctive features found in M. gayi is the geographic heterogeneity in sexual maturity at size (and most likely also in individual growth), a key variable for determining the reference fishing mortality Fmsy. Often these evidences are not considered for purposes of managing fishery resources (e.g. Jansen et al., 2016). This study showed that if the information is analyzed by fishing zone, the subpopulation located towards the south of the distribution (zone 4) could radically change its status when using the appropriate sexual maturity ogive and selectivity pattern. Similarly, this consideration would reduce the high level of overfishing reported in zone 3, one of the main fishing areas for this resource. According to this, the overexploitation of common hake (SPR/SPRmsy ∼0.5; Tascheri, 2022) does not represent the current condition of the population throughout its entire distribution, and overestimates its status in the two most important areas of the fishery (zones 2 and 3). If the assumption of exploitation pattern (logistic) were a dome-shape model, the condition of the hake stock could even improve because this model type tends to underestimate the fishing mortality of the oldest (spawners) fish.
Although the assumption of independent stock units could be strengthened with additional analyses, we believe that a spatially explicit stock assessment analysis would have less bias compared to assuming a common pool as currently used to manage this resource. This analysis allows identifying the notable implications that the incorrect specification of biological variables can have for population diagnosis, an aspect that has already been demonstrated in other works (e.g. Truesdell et al., 2016; Barrett et al., 2022).
The sustainability of the fishery and the conservation of the resource depend on the application of adequate levels of exploitation in accordance with the biological aspects of the species in an area of interest, and in particular, its effects on the estimation of the biological reference points (Hintzen et al., 2015; Barrett et al., 2022). In the case analyzed, the highest levels of fishing mortality reference Fmsy were estimated to the north of the M. gayi distribution, which translates into areas that are more tolerant to the potential increase in fishing effort. The latter is explained by the smaller size at first sexual maturity in regards to the catch size or current selectivity, which allows the natural protection of spawners in the population. This type of evidence should be considered in a recovery plan for this resource, for example, directing part of the fishing effort from more overexploited areas to lower latitudes. In order to implement this, the Fisheries and Aquaculture Law in force in Chile allows the definition of spatial units of fisheries management based on the best available scientific evidence and the biological characteristics of the resources, and in this sense, the results found in this work emerge as the most robust by considering the appreciable volume of information analyzed.
4.3 Population structure for assessment
The temporal reproducibility of geographic patterns in the phenotypic characteristics of a species (e.g. size and maturity) are typical characteristics of discrete populations with low levels of admixture (Cadrin, 2020), and are considered determining aspects for stock assessment purposes (Begg et al., 2005). The spatial differences in the biological traits of hake could be considered sufficient reason to carry out spatially explicit stock assessments (e.g. Punt, 2019). The results obtained in this research are evidence against the assumption of a single homogeneous stock unit in the distribution area of common hake off Chile. The common hake population is likely to have a high affinity with its areas of origin (spawning) and to be spatially structured into subpopulations with various levels of connectivity. In this regard, Cope and Punt (2011) indicate that all populations and fisheries of a species exhibit mixing patterns, or different levels of connectivity (Ciannelli et al., 2013), or the same population may contribute to different management units and vice versa (e.g. Smedbol and Stephenson, 2001; Reiss et al., 2009). The results found in this work thus suggest that the stock assessment approach currently in use should leave aside the common-pool concept and incorporate some spatial structuring (e.g. Goethel et al., 2011; Punt, 2019), for example, in the form of a metapopulation (e.g. Canales et al., 2016; Jardim et al., 2018). Finally, and in addition to the results obtained, an analysis of the biological traits at a higher spatial resolution would allow accurately identifying the geographic limits of proposed population sub-units.
5 Conclusions
In this study, 26 years of information from biological samplings of M. gayi, carried out both in fishery management and in acoustic survey throughout its entire spatial distribution, were integrated. The modeling of the main biological traits revealed important spatio-temporal patterns that contradict the bases that support the evaluation and fisheries management of this resource in Chile. Considering the implications of these aspects for the purposes of sustainable fishery management, we suggest complementing this work with studies that would provide greater precision and justification to the spatial structuring of hake stock. An example of this is the estimation of parameters of growth and natural mortality by area. Similarly, the performance of integrated stock assessment models with a spatially explicit structure (metapopulations or in discrete population units) should be explored. While this happens, we recommend considering the results and the approach used in this research in order to provide guidelines at the moment of allocating effort or catches, an aspect that is mainly useful for a recovery plan for this important fishing resource in the Southeastern region of the Pacific Ocean.
Statements
Data availability statement
Publicly available datasets were analyzed in this study. This data can be found here: https://drive.google.com/drive/folders/1WiX55Eimzj7bhf1-mkrQ8ZLr7-05lf9X?usp=sharing.
Ethics statement
The manuscript presents research on animals that do not require ethical approval for their study.
Author contributions
CC developed the original idea and conducted statistical analyses. NS conducted LBPA analysis. Both authors contributed to figures and tables productions, and the manuscript writing. NA performed redaction and revision of the Discussion segment, particularly on the matters of understanding spatial heterogeneity implications, and management implications and contributed to the revision of the whole article. All authors contributed to the article and approved the submitted version.
Funding
This study was carried out thanks to the financial support of the OCEANA Foundation.
Acknowledgments
The authors thank the Instituto de Fomento Pesquero (IFOP) for providing the analyzed databases. They also thank Dr. Dante Queirolo, Jesús Curiel, and Onelys Alvarado for their contributions and collaboration in the different stages of preparing this research.
Conflict of interest
The authors declare that the research was conducted in the absence of any commercial or financial relationships that could be construed as a potential conflict of interest.
Publisher’s note
All claims expressed in this article are solely those of the authors and do not necessarily represent those of their affiliated organizations, or those of the publisher, the editors and the reviewers. Any product that may be evaluated in this article, or claim that may be made by its manufacturer, is not guaranteed or endorsed by the publisher.
References
1
Aguayo-HernándezM. (1995). “Biology and fisheries of Chilean hakes (M. gayi and M. australis),” in Hake: biology, fisheries and markets (Dordrecht: Springer Netherlands), 305–337.
2
AlarcónR.BalbontínF.AguayoM.RuizP.NúñezS.HerreraG.et al. (2008). Biología reproductiva de Merluza común. Informe Final Corregido Proyecto FIP 2006-16, 292 pp. Available at: https://www.subpesca.cl/fipa/613/articles-89139_informe_final.pdf.
3
AmesE. P.LichterJ. (2013). Gadids and alewives: structure within complexity in the Gulf of Maine. Fish Res.141, 70–78. doi: 10.1016/j.fishres.2012.09.011
4
ArancibiaH.FuentealbaM. (1993). Análisis de la alimentación de Merluccius gayi gayi (Guichenot 1848) de Chile central, en el largo plazo. Biol. Pesq22 (1), 5–11.
5
ArayaM.Pepe-VictorianoR. (2010). La constancia de la razón entre la longitud de madurez y la longitud asintótica en peces de la costa de Chile: Un meta-análisis. Rev. biología marina y oceanografía45 (3), 371–377. doi: 10.4067/S0718-19572010000300001
6
ArcosD. F.NavarroN. (1986). Analysis of an upwelling index for Talcahuano, Chile (Lat. 37S). Investigaciones Pesqueras (Chile)33, 91–98.
7
AvilésS.AguayoM.InostrozaF.CañonJ. (1979). “Merluza común, Merluccius gayi (Guichenot). Teleostomi, Gadiformes, Merluccidae,” in Estado actual de los principales recursos pesquerías nacionales. Bases para un desarrollo pesquero. Parte I (PECES) (IFOP-CORFO, AP 79/18), 89. Available at: https://190.151.20.106/exlibris/aleph/a23_1/apache_media/PH1PIEI67FLEFB8GHAGK32D93KRXTN.pdf.
8
BalbontínF.FischerW. (1981). Ciclo sexual y fecundidad de la merluza, Merluccius gayi gayi, en la costa de Chile. Rev. Biol. Mar. Valparaíso17, 285–334.
9
BarrettT. J.HordykA. R.BarrettM. A.van den HeuvelM. R. (2022). Spatial and temporal differences in fecundity of Atlantic herring (Clupea harengus) off Nova Scotia and consequences for biological reference points. Can. J. Fish Aquat. Sci.79 (7), 1086–1096. doi: 10.1139/cjfas-2021-0269
10
BeggG. A.O’NeillM. F.CadrinS. X.BergeniusM. A. J. (2005). “Stock assessment of the Australian east coast spotted mackerel fishery,” in CRC reef research centre technical report no. 58 (Townsville, Australia: CRC Reef Research Centre).
11
BreslowN. E.ClaytonD. G. (1993). Approximate inference in generalized linear mixed models. J. Am. Stat. Assoc.88 (421), 9–25. doi: 10.2307/2290687
12
BrossetP.Le BourgB.CostalagoD.BanaruD.Van BeverenE.BourdeixJ. H.et al. (2016). Linking small pelagic dietary shifts with ecosystem changes in the Gulf of Lions. Mar. Ecol. Prog. Ser.554, 157–171. doi: 10.3354/meps11796
13
BrossetP.MenardF.FromentinJ. M.BonhommeauS.UlsesC.BourdeixJ. H.et al. (2015). Influence of environmental variability and age on the body condition of small pelagic fish in the Gulf of Lions. Mar. Ecol. Prog. Ser.529, 219–231. doi: 10.3354/meps11275
14
CadrinS. X. (2020). Defining spatial structure for fishery stock assessment. Fish Res.221, 105397. doi: 10.1016/j.fishres.2019.105397
15
CadrinS. X.BernreutherM.DaníelsdóttirA. K.HjörleifssonE.JohansenT.KerrL.et al. (2010). Population structure of beaked redfish, Sebastes mentella: evidence of divergence associated with different habitats. ICES J. Mar. Sci.67 (8), 1617–1630. doi: 10.1093/icesjms/fsq046
16
CadrinS. X.MaunderM. N.PuntA. E. (2020). Spatial Structure: theory, estimation and application in stock assessment models. Fish Res.229, 105608. doi: 10.1016/j.fishres.2020.105608
17
CadrinS. X.SecorD. H. (2009). Accounting for spatial population structure in stock assessment: past, present, and future. Future fisheries Sci. North America31, 405–426. doi: 10.1007/978-1-4020-9210-7_22
18
CanalesC. M.Adasme.N.CubillosL. A.CuevasM. J.SanchezN. (2018). Long-time spatio-temporal variations in anchovy (Engraulis ringens) biological traits off northern Chile: an adaptive response to long-term environmental change? – ICES J. Mar. Sci. (2018)75 (6), 1908–1923. doi: 10.1093/icesjms/fsy082
19
CanalesC. M.CompanyJ. B.AranaP. M. (2016). Spatio-temporal modelling of the maturity, sex ratio, and physical condition of nylon shrimp Heterocarpus reedi (Decapoda, Caridea), off Central Chile. Fish. Res.179, 1–9. doi: 10.1016/j.fishres.2016.02.001
20
CanalesC. M.PuntA. E.MardonesM. (2021). Can a length-based pseudo-cohort analysis (LBPA) using multiple catch length-frequencies provide insight into population status in data-poor situations? Fish Res.234, 105810. doi: 10.1016/j.fishres.2020.105810
21
CarreraP.PorteiroC. (2003). Stock dynamic of the Iberian sardine (Sardina pilchardus, W.) and its implication on the fishery off Galicia (NW Spain). Sci. Mar.67 (S1), 245–258. doi: 10.3989/scimar.2003.67s1245
22
CastilloG.MuñozH.GonzálezH.BernalP. (1991). Daily analysis of abundance and size variability of fish larvae in relation to oceanic water intrusions in coastal areas. Biol. Pesq.20, 21–35.
23
CastroL. R.BernalP. A.TroncosoV. A. (1993). Coastal intrusion of copepods: mechanisms and consequences on the population biology of Rhincalanus nasutus. J. Plankton Res.15 (5), 501–515. doi: 10.1093/plankt/15.5.501
24
CernaF.CubillosL. A.PlazaG. (2013). Análisis histórico del crecimiento somático de merluza común (Merluccius gayi gayi) frente a la costa central de Chile. Latin Am. J. Aquat. Res.41 (3), 558–569. doi: 10.3856/vol41-issue3-fulltext-17
25
CiannelliL.FisherJ. A.Skern-MauritzenM.HunsickerM. E.HidalgoM.FrankK. T.et al. (2013). Theory, consequences and evidence of eroding population spatial structure in harvested marine fishes: a review. Mar. Ecol. Prog. Ser.480, 227–243. doi: 10.3354/meps10067
26
CopeJ. M.PuntA. E. (2011). Reconciling stock assessment and management scales under conditions of spatially varying catch histories. Fish Res.107 (1-3), 22–38. doi: 10.1016/j.fishres.2010.10.002
27
CrozierL. G.HutchingsJ. A. (2014). Plastic and evolutionary responses to climate change in fish. Evol. Appl.2014, 68–87. doi: 10.1111/eva.12135
28
CubillosL. A.RebolledoH.HernándezA. (2003). Prey composition and estimation of Q/B for the Chilean hake, Merluccius gayi (Gadiformes-Merluccidae), in the central-south area off Chile (34°-40°S). Arch. Fish. Mar. Res.50 (3), 271–286.
29
DenechaudC.SmolinskiS.GeffenA. J.GodiksenJ. A.CampanaS. E. (2020). A century of fish growth in relation to climate change, population dynamics and exploitation. Glob. Change Biol.26 (10), 5661–5678. doi: 10.1111/gcb.15298
30
De RoosA. M.BoukalD. S.PerssonL. (2006). Evolutionary regime shifts in age and size at maturation of exploited fish stocks. Proc. R. Soc. B: Biol. Sci.273 (1596), 1873–1880. doi: 10.1098/rspb.2006.3518
31
EngelhardG.HeinoM. (2004). Matury changes in Norwegian spring-spawning herring Clupea harengus: compensatory or evolutionary responses? Mar. Ecol. Prog. Ser.272, 245–256. doi: 10.3354/meps272245
32
FAO (2020). El estado mundial de la pesca y la acuicultura 2020 (Roma: La sostenibilidad en acción). doi: 10.4060/ca9229es
33
FeyrerF.HobbsJ.AcunaS.MahardjaB.GrimaldoL.BaerwaldM.et al. (2015). Metapopulation structure of a semi-anadromous fish in a dynamic environment. Can. J. Fish Aquat. Sci.72 (5), 709–721. doi: 10.1139/cjfas-2014-0433
34
FrankK. T.BrickmanD. (2000). Allee effects and compensatory population dynamics within a stock complex. Can. J. Fish Aquat. Sci.57 (3), 513–517. doi: 10.1139/f00-024
35
FroeseR.BinohlanC. (2000). Empirical relationships to estimate asymptotic length, length at first maturity and length at maximum yield per recruit in fishes, with a simple method to evaluate length frequency data. J. fish Biol.56 (4), 758–773. doi: 10.1111/j.1095-8649.2000.tb00870.x
36
FuC.FanningL. P. (2004). Spatial considerations in the management of Atlantic cod off Nova Scotia, Canada. North Am. J. Fish Manage.24 (3), 775–784. doi: 10.1577/M03-134.1
37
GaticaC.NeiraS.ArancibiaH.VásquezS. (2015). The biology, fishery and market of Chilean hake (Merluccius gayi gayi) in the Southeastern Pacific Ocean (Hakes: Biology and exploitation), 126–153.
38
GattiP.RobertD.FisherJ. A.D.MarshallR. C.Le BrisA. (2020). Stock-scale electronic tracking of Atlantic halibut reveals summer site fidelity and winter mixing on common spawning grounds. ICES J. Mar. Sci.77 (7-8), 2890–2904. doi: 10.1093/icesjms/fsaa162
39
George-NascimentoM. (1996). Populations and assemblages of parasites in hake, Merluccius gayi, from the southeastern Pacific Ocean: stock implications. J. Fish Biol.48 (4), 557–568. doi: 10.1111/j.1095-8649.1996.tb01452.x
40
GerlottoF.GutiérrezM.BertrandA. (2012). Insight on population structure of the Chilean jack mackerel (Trachurus murphyi). Aquat. Living Resour.25, 341–355. doi: 10.1051/alr/2012036
41
GoethelD. R.QuinnT. J.CadrinS. X. (2011). Incorporating spatial structure in stock assessment: movement modeling in marine fish population dynamics. Rev. Fish Sci.19 (2), 119–136. doi: 10.1080/10641262.2011.557451
42
GuanW.CaoJ.ChenY.CieriM. (2013). Impacts of population and fishery spatial structures on fishery stock assessment. Can. J. Fish Aquat. Sci.70 (8), 1178–1189. doi: 10.1139/cjfas-2012-0364
43
Guevara-CarrascoR.LleonartJ. (2008). Dynamics and fishery of the Peruvian hake: Between nature and man. J. Mar. Syst.71 (3-4), 249–259. doi: 10.1016/j.jmarsys.2007.02.030
44
HintzenN. T.RoelB.BendenD. P. L. D.ClarkeM.EganA.NashR. D. M.et al. (2015). Managing a complex population structure: exploring the importance of information from fisheries-independent sources. ICES J. Mar. Sci.72 (2), 528–542. doi: 10.1093/icesjms/fsu102
45
HunterA.SpeirsD. C.HeathM. R. (2015). Fishery-induced changes to age and length dependent maturation schedules of three demersal fish species in the Firth of Clyde. Fish Res.170, 14–23. doi: 10.1016/j.fishres.2015.05.004
46
Hurtado-FerroF.PuntA. E.HillK. (2014). Use of multiple selectivity patterns as a proxy for spatial structure. Fish. Res.158, 102–115. doi: 10.1016/j.fishres.2013.10.001
47
JansenT.KristensenK.KaingeP.DurholtzD.StrømmeT.ThygesenU. H.et al. (2016). Migration, distribution and population (stock) structure of shallow-water hake (Merluccius capensis) in the Benguela Current Large Marine Ecosystem inferred using a geostatistical population model. Fish Res.179, 156–167. doi: 10.1016/j.fishres.2016.02.026
48
JardimE.EeroM.SilvaA.UlrichC.PawlowskiL.HolmesS. J.et al. (2018). Testing spatial heterogeneity with stock assessment models. PloS One13 (1), e0190791. doi: 10.1371/journal.pone.0190791
49
KarjalainenJ.UrpanenO.KeskinenT.HuuskonenH.SarvalaJ.ValkeajärviP.et al. (2016). Phenotypic plasticity in growth and fecundity induced by strong population fluctuations affects reproductive traits of female fish. Ecol. Evol.6 (3), 779–790. doi: 10.1002/ece3.1936
50
KeckB. P.MarionZ. H.MartinD. J.KaufmanJ. C.HardenC. P.SchwartzJ. S.et al. (2014). Fish functional traits correlated with environmental variables in a temperate biodiversity hotspot. PloS One9 (3), e93237. doi: 10.1371/journal.pone.0093237
51
KerrL. A.HintzenN. T.CadrinS. X.ClausenL. W.Dickey-CollasM.GoethelD. R.et al. (2017). Lessons learned from practical approaches to reconcile mismatches between biological population structure and stock units of marine fish. ICES J. Mar. Sci.74 (6), 1708–1722. doi: 10.1093/icesjms/fsw188
52
KeylF.WolffM. (2008). Environmental variability and fisheries: what can models do? Rev. Fish Biol. Fish18 (3), 273–299. doi: 10.1007/s11160-007-9075-5
53
KuparinenA.BoitA.ValdovinosF. S.LassauxH.MartínezN. D. (2016). Fishing-induced life-history changes degrade and destabilize harvested ecosystems. Sci. Rep.6, 22245. doi: 10.1038/srep22245
54
LandaetaM. F.CastroL. R. (2002). Spring spawning and early nursery zone of the mesopelagic fish Maurolicus parvipinnis at the coastal upwelling zone off Talcahuano, central Chile. Mar. Ecol. Prog. Ser.226, 179–191. doi: 10.3354/meps226179
55
LandaetaM. F.CastroL. R. (2006). Variabilidad estacional en los patrones espaciales de las asociaciones ictioplanctónicas de la zona de fiordos de Chile austral. Ciencia y Tecnología del Mar.29 (2), 107–127.
56
McQuinnI. (1997). Metapopulations and the Atlantic Herring. Rev. Fish Biol. Fish7, 297–329. doi: 10.1023/A:1018491828875
57
MéronaB. D.MolJ.VigourouxR.ChavesP. D. T. (2009). Phenotypic plasticity in fish life-history traits in two neotropical reservoirs: Petit-Saut Reservoir in French Guiana and Brokopondo Reservoir in Suriname. Neotropical Ichthyol.7, 683–692. doi: 10.1590/S1679-62252009000400018
58
MolinaE.OlivaresJ.DíazE.RojasM.OsorioF.BonicelliJ.et al. (2022). Evaluación directa de merluza común 2021. Informe final, Corregido 3 (Valparaíso: Subsecretaría de Economía y Empresas de Menor Tamaño-IFOP).
59
OlivaM. E.BallónI. (2002). Metazoan parasites of the Chilean hake Merluccius gayi gayi as a tool for stock discrimination. Fish Res.56 (3), 313–320. doi: 10.1016/S0165-7836(01)00329-0
60
PayáI.OyarzunC.GallegillosR.Oliva.M. (1994). Unidades de stock en el recurso merluza común de la zona centro sur. Unidades de stock en el reurso merluza común de la zona centro sur. FIP-IT/94-18 (Valparaíso, Chile: Instituto de Fomento Pesquero), 138.
61
PetitgasP.SecorD. H.McQuinnI.HuseG.LoN. (2010). Stock collapses and their recovery: mechanisms that establish and maintain life-cycle closure in space and time. ICES J. Mar. Sci.67 (9), 1841–1848. doi: 10.1093/icesjms/fsq082
62
PuntA. E. (2019). Spatial stock assessment methods: A viewpoint on current issues and assumptions. Fish Res.213, 132–143. doi: 10.1016/j.fishres.2019.01.014
63
R Core Team (2020). R: A language and environment for statistical computing (Vienna, Austria: R Foundation for Statistical Computing). Available at: https://www.r-project.org/.
64
ReissH.HoarauG.Dickey-CollasM.WolffW. J. (2009). Genetic population structure of marine fish: mismatch between biological and fisheries management units. Fish Fisheries10 (4), 361–395. doi: 10.1111/j.1467-2979.2008.00324.x
65
San MartínM. A.WiffR.Saavedra-NievasJ. C.CubillosL. A.LilloS. (2013). Relationship between Chilean hake (Merluccius gayi gayi) abundance and environmental conditions in the central-southern zone of Chile. Fish Res.143, 89–97. doi: 10.1016/j.fishres.2013.01.010
66
SantoulF.CayrouJ.MastrorilloS.CereghinoR. (2005). Spatial patterns of the biological traits of freshwater fish communities in south-west France. J. fish Biol.66 (2), 301–314. doi: 10.1111/j.0022-1112.2005.00579.x
67
SERNAPESCA (2021). Anuarios Estadisticos de Pesca y Acuicultura 2021 (Servicio Nacional de Pesca y Acuicultura). Available at: https://www.sernapesca.cl/informacion-utilidad/anuarios-estadisticos-de-pesca-y-acuicultura.
68
ShackellN. L.FergusonK. J.den HeyerC. E.BrickmanD.WangZ.RansierK. T. (2019). Growing degree-day influences growth rate and length of maturity of Northwest Atlantic halibut (Hippoglossus hippoglussus L.) across the southern stock domain. J. Northw. Atl. Fish. Sci.50, 25–35. doi: 10.2960/J.v50.m716
69
ShackellN. L.FisherJ. A.den HeyerC. E.HennenD. R.SeitzA. C.Le BrisA.et al. (2022). Spatial ecology of Atlantic Halibut across the Northwest Atlantic: a recovering species in an era of climate change. Rev. Fish. Sci. Aquac.30 (3), 281–305. doi: 10.1080/23308249.2021.1948502
70
SharpeD. M.HendryA. P. (2009). SYNTHESIS: life history change in commercially exploited fish stocks: an analysis of trends across studies. Evol. Appl.2 (3), 260–275. doi: 10.1111/j.1752-4571.2009.00080.x
71
SmedbolR. K.StephensonR. (2001). The importance of managing within-species diversity in cod and herring fisheries of the north-western Atlantic. J. Fish Biol.59, 109–128. doi: 10.1111/j.1095-8649.2001.tb01382.x
72
SmedbolR. K.WroblewskiJ. S. (2002). Metapopulation theory and northern cod population structure: interdependency of subpopulations in recovery of a groundfish population. Fish Res.55 (1-3), 161–174. doi: 10.1016/S0165-7836(01)00289-2
73
SobarzoM.BravoL.DonosoD.Garcés-VargasJ.SchneiderW. (2007). Coastal upwelling and seasonal cycles that influence the water column over the continental shelf off central Chile. Prog. Oceanogr.75 (3), 363–382. doi: 10.1016/j.pocean.2007.08.022
74
StampsJ. A.MangelM.PhillipsJ. A. (1998). A new look at relationships between size at maturity and asymptotic size. Am. Nat.152 (3), 470–479. doi: 10.1086/286183
75
StroupW. W. (2012). Generalized linear mixed models: modern concepts, methods and applications (CRC press). doi: 10.1201/b13151
76
SUBPESCA (2023). Estado de la situación de las principales pesquerías Chilenas 2022 (División de Administración Pesquera). 137 pp. Available at: https://www.subpesca.cl/portal/618/articles-117812_recurso_1.pdf.
77
TanF.JiangZ.BaeS. J. (2007). Generalized linear mixed models for reliability analysis of multi-copy repairable systems. IEEE Trans. Reliability56 (1), 106–114. doi: 10.1109/TR.2006.884596
78
TascheriR. (2022). Convenio de Desempeño 2020: Estatus y posibilidades de explotación biológicamente sustentables de los principales recursos pesqueros nacionales, año 2022: Merluza común 2022. Segundo Informe Técnico (Instituto de Fomento Pesquero), 143. Subsecretaría de Economía y EMT. Available at: https://www.ifop.cl/wp-content/contenidos/uploads/RepositorioIfop/InformeFinal/2022/P-483259_merluza_comun.pdf.
79
TrainaA.BasiloneG.Saborido-ReyF.FerreriR.QuinciE.MasulloT.et al. (2011). Assessing population structure of European anchovy (Engraulis encrasicolus) in the Central Mediterranean by means of traditional morphometry. Adv. Oceanogr. Limnol.2 (2), 141–153. doi: 10.4081/aiol.2011.5322
80
TruesdellS. B.HartD. R.ChenY. (2016). Effects of spatial heterogeneity in growth and fishing effort on yield-per-recruit models: an application to the US Atlantic sea scallop fishery. ICES J. Mar. Sci.73 (4), 1062–1073. doi: 10.1093/icesjms/fsv238
81
Van BeverenE.BonhommeauS.FromentinJ. M.BigotJ. L.BourdeixJ. H.BrossetP.et al. (2014). Rapid changes in growth, condition, size and age of small pelagic fish in the Mediterranean. Mar. Biol.161, 1809–1822. doi: 10.1007/s00227-014-2463-1
82
VidalR. R.CarsonE. W.GoldJ. R. (2012). Population structure in Chilean hake Merluccius gayi as revealed by mitochondrial DNA sequences. J. fish Biol.81 (5), 1763–1772. doi: 10.1111/j.1095-8649.2012.03440.x
83
WareD.SchweigertJ. (2001). Metapopulation structure and dynamics of British Columbia herring. Canadian Stock Assessment Secretariat Research Document 2001/127, 27 pp. Available at: https://publications.gc.ca/collections/collection_2015/mpo-dfo/Fs70-5-2001-127-eng.pdf.
Appendix
Length-based pseudocohort analysis (LBPA)
The LBPA model (Canales et al., 2021) (https://github.com/criscan/LBPA) corresponds to an equilibrium age-based analysis formulated to obtain information on fishing mortality (F) and Spawning Potential Ratio (SPR) from catch length-frequency data. The model is fitted to multiple years of CLF data simultaneously.
The per-recruit survival is represented as a function of age (), natural mortality (M) and age-specific fishing mortality:
where a is age, A+ is the plus group, is age-specific fishing mortality as a function of selectivity at-age ( ) and a logistic length-specific selectivity :
where L50 corresponds to the length where 50% of individuals are retained by fishing gear and Δ is a slope parameter. The expected catch at length (Eq. 7) is calculated from the conversion of catch at-age (Eq. 6) by a length at-age probability matrix (Eq. 8).
Matrix is determined using a growth equation (Eq. 10) parameterized in terms of Loo, k, and the coefficient of variation of the length at age (cv) (Eqs. 9, 10).
The initial length at-age corresponds to the size at the age of fishery recruitment = . The spawning biomass-per-recruit (SSBPR) is calculated as:
Where is the total mortality by age, γ = 0.583 is the fraction of the year when common hake spawns, is the maturity proportion at-length, and is the average weight-at-length. Virgin spawning biomass-per-recruit SSBPR0 is calculated using Eq. 11 when Z = M and the Spawning Potential Ratio (SPR) is the ratio SSBPR/SSBPR0. LBPA parameters (θ = [Lar, L50, Δ, F, cv]) are estimated using penalized maximum likelihood. The length-composition data are assumed to be multinomial and the model parameters (θ) are estimated by minimizing a penalized log-likelihood as:
where is the effective sample size (e.g., = 100), is the catch proportion at length-class l by year, and is the model-predicted proportion of the catch by length class l. The second term in Eqn 12 are the model penalties, where represents the a priori value of the j-th parameter and its standard deviation in log-space.
Summary
Keywords
generalized linear mixed model, length-based pseudo-cohort analysis (LBPA), single stock, spatial biological traits, spatially structured population, spawning potential ratio
Citation
Canales CM, Sánchez N and Adasme NA (2023) Spatial heterogeneity of biological traits and effects on fisheries management based on the assumption of a single stock. The case of the common hake (Merluccius gayi) in Chile. Front. Mar. Sci. 10:1241587. doi: 10.3389/fmars.2023.1241587
Received
16 June 2023
Accepted
13 October 2023
Published
09 November 2023
Volume
10 - 2023
Edited by
Vladimir Laptikhovsky, Centre for Environment, Fisheries and Aquaculture Science (CEFAS), United Kingdom
Reviewed by
Nancy Louise Shackell, Bedford Institute of Oceanography (BIO), Canada; Nicola Walker, Centre for Environment, Fisheries and Aquaculture Science (CEFAS), United Kingdom
Updates
Copyright
© 2023 Canales, Sánchez and Adasme.
This is an open-access article distributed under the terms of the Creative Commons Attribution License (CC BY). The use, distribution or reproduction in other forums is permitted, provided the original author(s) and the copyright owner(s) are credited and that the original publication in this journal is cited, in accordance with accepted academic practice. No use, distribution or reproduction is permitted which does not comply with these terms.
*Correspondence: Cristian M. Canales, cristian.canales.r@pucv.cl
Disclaimer
All claims expressed in this article are solely those of the authors and do not necessarily represent those of their affiliated organizations, or those of the publisher, the editors and the reviewers. Any product that may be evaluated in this article or claim that may be made by its manufacturer is not guaranteed or endorsed by the publisher.