 Melchor González-Dávila
 J. Magdalena Santana-Casiano
94% of researchers rate our articles as excellent or good
Learn more about the work of our research integrity team to safeguard the quality of each article we publish.
Find out more
ORIGINAL RESEARCH article
Front. Mar. Sci., 14 August 2023
Sec. Ocean Observation
Volume 10 - 2023 | https://doi.org/10.3389/fmars.2023.1236214
This article is part of the Research TopicTime-Series Observations of Ocean Acidification: a Key Tool for Documenting Impacts on a Changing PlanetView all 18 articles
Using 25 years of data from the North-East Atlantic Ocean at the ESTOC site, we confirm the surface ocean is actively absorbing carbon emissions caused by human activities and undergoing ocean acidification. The carbon dioxide is also increasing in the subsurface and deepest waters. Seawater salinity normalized inorganic carbon (NCT), fugacity of CO2 (fCO2) and anthropogenic CO2 increase at a rate of 1.17 ± 0.07 µmol kg−1, 2.1 ± 0.1 µatm yr−1 and 1.06 ± 0.11 μmol kg−1 yr−1, respectively, while the ocean pHT fixed to the average temperature of 21°C, declines at a rate of 0.002 ± 0.0001 pH yr−1 in the first 100 m. These rates are 20% higher than values determined for the period 1995–2010. Over the 25 years, the average surface fCO2 increased by 52.5 µatm while the pHT declined by 0.051 pH units (~13% increase in acidity), like the observed seasonal signal. After 2020, seawater conditions are outside the range of surface fCO2 and pHT seasonal amplitude observed in the 1990s. It was also predicted by the year 2040, fCO2 seawater data will be smaller than atmospheric one and the area will be acting as a sink the full year around. Parameterizations of AT, CT, pHT and fCO2 using observations of water temperature, salinity and dissolved oxygen were determined for the ESTOC site with standard error of estimation of 6.5 µmol kg−1, 6.8 µmol kg−1, 0.010 pH and 9.6 µatm, respectively, and were applied to the North-East Atlantic Ocean. The observations and the parameterizations showed that the trends of the carbonate variables along the water column in the eastern subtropical ESTOC region are dominated by anthropogenically induced changes, observed in the whole water profile.
Global climate change is primarily attributed to the dominant influence of human activities, particularly the emission of carbon dioxide into the atmosphere through the combustion of fossil fuels (Denman et al., 2007; Friedlingstein et al., 2022). The ocean plays a crucial role in mitigating the effects of this perturbation to the climate system, having to date sequestered roughly a third of the cumulative anthropogenic CO2 emissions from the atmosphere. The 2022 assessment carried out by the Global Carbon Project revealed that over the decade spanning 2012 to 2021, the ocean actively absorbed an average of 2.9 ± 0.4 PgC yr−1, which constituted a significant 26% portion of the total anthropogenic CO2 emissions, CAnt. The estimation provided is obtained by analyzing simulation results generated by global ocean biogeochemical models (GOBMs) and is contrasted with data-products derived from observations of surface ocean pCO2 (partial pressure of CO2). Although surface ocean pCO2 and GOBMs display a reasonable level of accord, disparities arise when comparing the resulting sink estimate from GOBMs to the data-products (Hauck et al., 2020).
The North Atlantic Ocean is recognized as a key player in the absorption and long-term storing of CAnt, highlighting its critical significance in global carbon balance (up to 25% of that in oceans, despite its surface representing only 13% of the global ocean, Sabine et al., 2004) (Vázquez-Rodríguez et al., 2009; Watson et al., 2009; Pérez et al., 2010). The entrance of CAnt into the Atlantic Ocean interior takes place through deep convection in the North Atlantic Subpolar Gyre (NASPG). The process of lateral transport is responsible for sustaining approximately 65 ± 13% of the CAnt, which involves the transportation of CO2-rich subtropical waters to northern latitudes via the upper branch of the Meridional Overturning Circulation (MOC) (Álvarez et al., 2003; Macdonald et al., 2003; Pérez et al., 2013). Due to the importance of the North Atlantic Subtropical Gyre (NASTG) in the uptake of CAnt from the atmosphere, two oceanic Carbon time-series stations were established in the NASTG for the evaluation and quantification of the North Atlantic high resolution of in situ CO2 system. These are the Bermuda Time Series (BATS), to the west, and the European Time Series in the Ocean at the Canary Islands (ESTOC), to the east. It is widely acknowledged that the most fundamental and robust method for directly detecting CO2 uptake rates and variations is through the acquisition of more accurate and longer time-series observations at designated fixed stations (Dore et al., 2009; Currie et al., 2011; Bates et al., 2014; Takahashi et al., 2014; Bates and Johnson, 2020; Skjelvan et al., 2022).
As CO2 is absorbed by the ocean, its buffering capacity diminishes, affecting to the carbonate distribution. The observed decrease in pH of 0.1 since the onset of the industrial era intensifies the concentration of hydrogen ions (H+), leading to a lower pH level, while simultaneously reducing the saturation state of CaCO3 (Ω) by diminishing the concentration of carbonate ions (CO32−) and increasing the bicarbonate ion concentration (HCO3−) (Caldeira and Wickett, 2003). This phenomenon, known as ocean acidification (OA), even when pH of ocean seawater will be kept basic, would subsequently reduce the saturation levels of significant biominerals such as calcite and aragonite (Orr et al., 2005). These alterations in carbonate chemistry profoundly impact marine organisms and ecosystems across the global ocean (e.g., Riebesell et al., 2000; Doney et al., 2009; Gao et al., 2020). The complex interplay of climate-related physical and biological feedbacks within the carbon cycle, such as rising temperatures, deoxygenation (Gruber, 2011), stratification (Bopp et al., 2013), and intensified winds (Borges et al., 2008), is expected to complicate future changes in carbonate chemistry.
Increases of pCO2 and dissolved inorganic carbon (CT) together with a pH decrease in the surface waters from 1995 to 2010 were detected by time-series observations at ESTOC in the subtropical eastern North Atlantic Ocean (Santana-Casiano et al., 2007; González-Dávila et al., 2010; Bates et al., 2014; Takahashi et al., 2014). The seasonal changes of surface inorganic carbon normalized to a constant salinity, NCT, were attenuated when compared to CT seasonality, reflecting the influence of salinity changes on CT. The residual seasonal variability in NCT is a composite of biological and physical processes such as net community production (NCP), air–sea CO2 gas exchange, mixing, and advection (González-Dávila et al., 2007). To validate the observed trends, it is imperative to conduct more comprehensive and extended studies that encompass a wider range of data points, as the previously reported changes in the surface subtropical eastern North Atlantic were solely derived from a 10–15-year period from 1995 to 2010 (González-Dávila et al., 2010; Bates et al., 2014). González-Dávila et al. (2010) presented ESTOC trend data for the period September 1995 to February 2004, which only allowed the determination of significant changes over the first 1000 m, due to the short time-span that was considered. Therefore, the chemical characteristics of time-series which include intermediate and deep-water data in addition to surface data are valuable as they can contribute to highlighting the changing carbonate cycle within the whole water column.
The history of the ESTOC time-series research and basic understanding of the physicochemical and biological characteristics of this site have been described in detail in prior works (González-Dávila et al., 2003; Neuer et al., 2007; Santana-Casiano et al., 2007). ESTOC is positioned at 29°10’N 15°30’W in the northeast Atlantic Ocean with a depth of 3685m (Figure 1). The first visit to the ESTOC site took place in February 1994, while carbonate system observations were established in October 1995. Until December 2019, a total of 212 visits were carried out, with 4350 discrete samples analyzed along the 3650 m deep water profile. From those, a total of 2876, 2632 and 1156 samples were analyzed, respectively, for total alkalinity (AT), pH in total scale (pHT), and total dissolved inorganic carbon (CT). On each ESTOC cruise, a quasi-Lagrangian sampling scheme is employed and for the purposes of this work, all CTD/hydrocasts at ESTOC site (29°10’N, 15°30’ W) were considered. Until 2005, monthly samples (over 9 different sampling months a year with gaps related to bad weather conditions) were established. Between 2005 and 2011, sampling was carried out every two months. Ship operations were stopped during 2012 and 2013, and re-started on February 2014, with seasonal visits to ESTOC since then. On 2016, a surface buoy with physical and biochemical sensors was included in ESTOC. Starting on February 2019, a General Oceanic™ GO 8050 continuous underway pCO2 system with four calibration gases together with sea surface temperature and salinity sensors (Curbelo-Hernández et al., 2021) was included in a volunteer observing ship (CanOA VOS line, ICOS-ERIC, https://meta.icos-cp.eu/labeling/last visited 07/05/2023) passing close to ESTOC (25–30 km to the East). Surface seawater fCO2 data (located at 7 m) were included in this work to provide extended trends covering 28 years of surface data. Samples for a wide range of core measurements (Table 1) were collected at 24 depths between the surface and 3650 m and are considered in the present work. However, since the number of samples analyzed for carbonate variables at 900 m was low, trends were not computed for this depth. Brief descriptions of the relevant methods are included in the following sections.
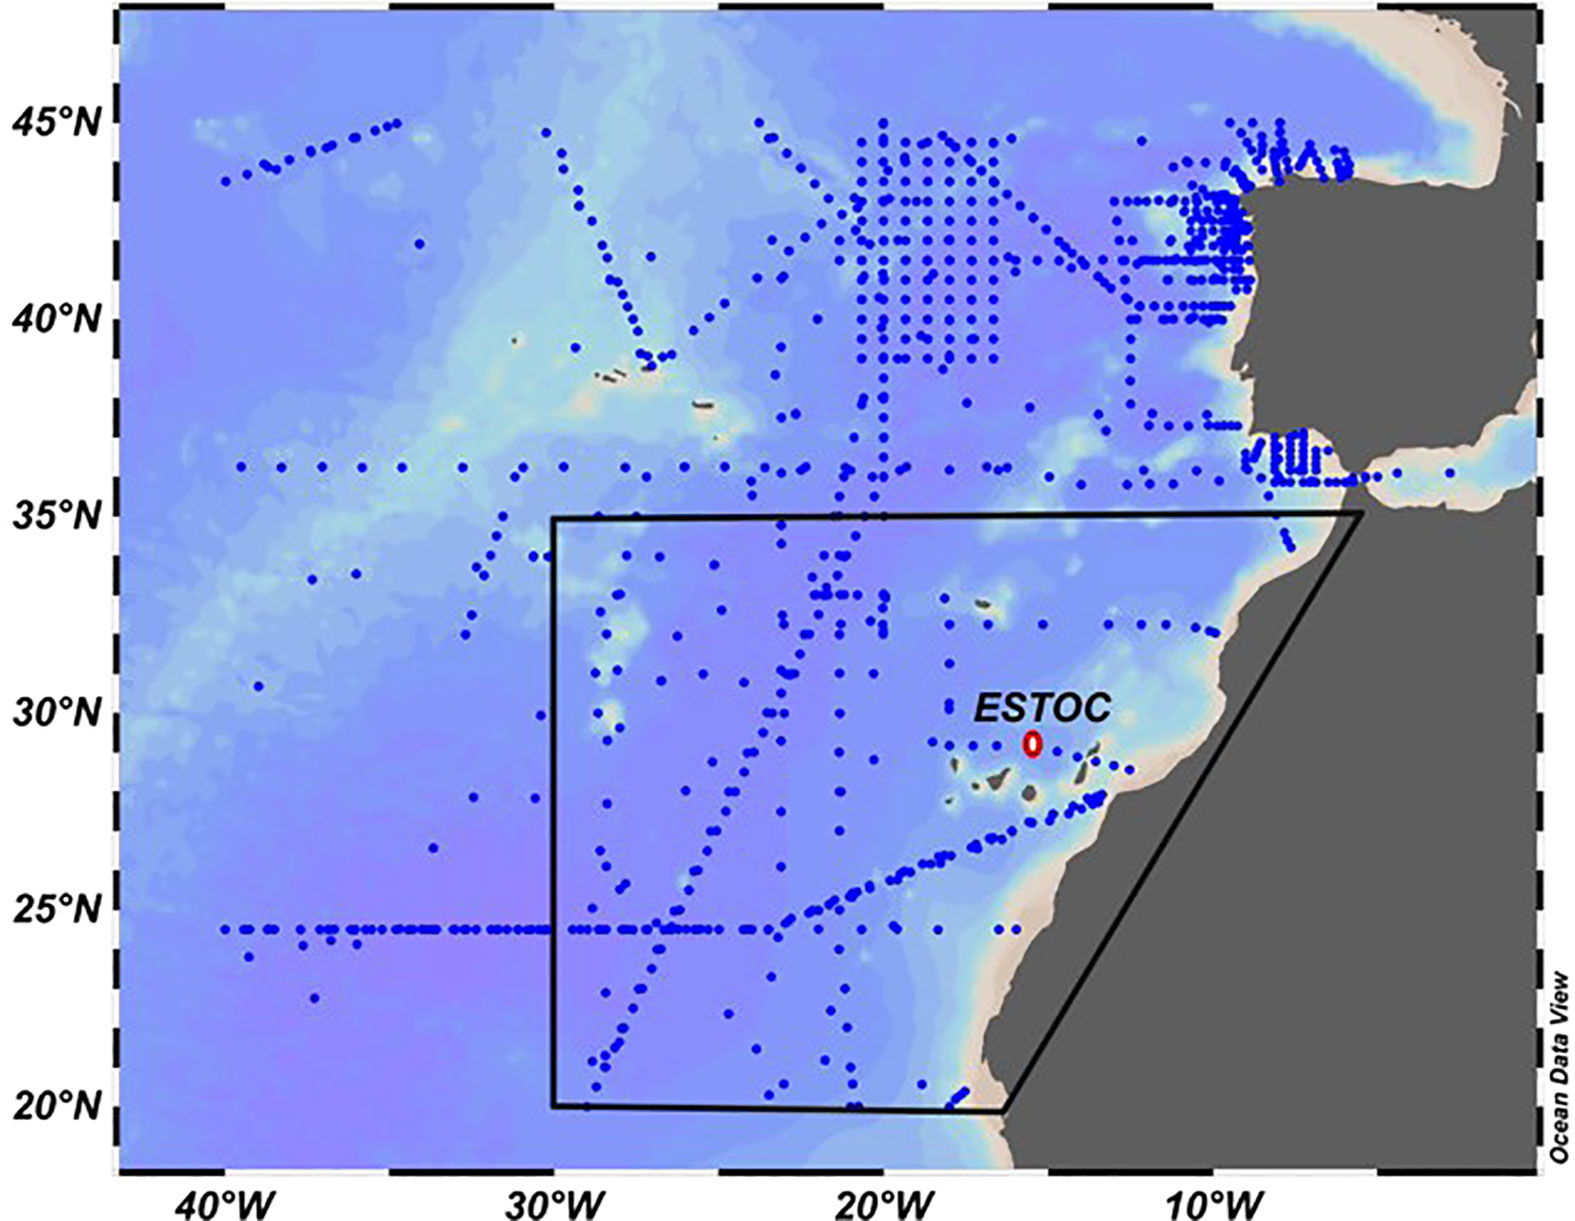
Figure 1 Location of the ESTOC site (29°10’N, 15°30’ W, red dot) at the Canary Islands in the Eastern North Atlantic Ocean. The location of GLODAP oceanic data for the period 1995–2005 in the region 20°N–45°N and east of 40°W is indicated (blue dots). The area between 20°N–35°N and east of 30°W is indicated by the black line. (Ocean Data View images, Schlitzer, 2021),.
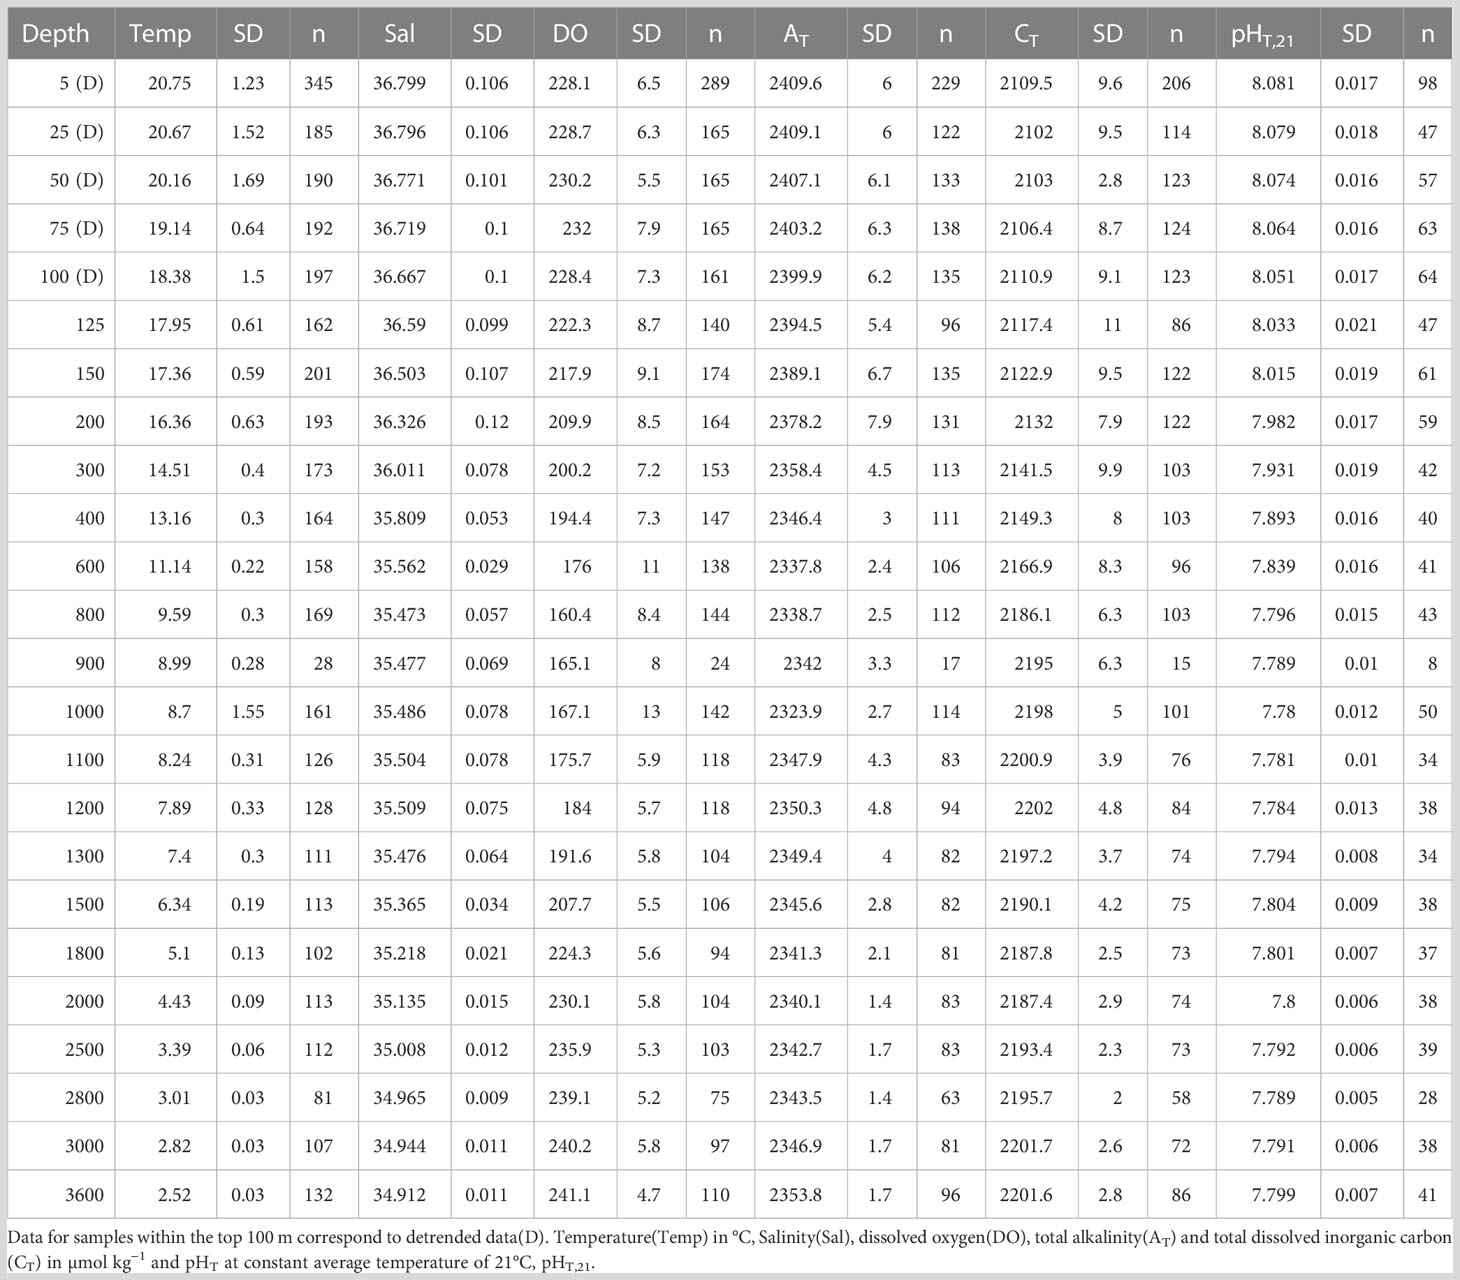
Table 1 Average measured variables for the period 1995–2019 at the 24 CTD depths including standard deviation(SD, 95% confidence) and amount of data(n).
Dissolved oxygen (DO) samples were taken from the Niskin bottle first, by using 125 calibrated glass bottles, with replicates including the surface, the deepest depth, and the oxygen minimum. Samples were analyzed using an automated potentiometric Winkler titration method (e.g., Dickson, 1996) calibrated to a potassium iodate solution.
Samples for the carbonate system characterization were drawn after DO samples. pH and AT samples were the two variables measured until 2004. From 2004 through present, which accounts for most of the samples (over 90%), a third variable, CT, was also included in the sampling strategy. Samples for pH were always measured on board while AT and CT samples, when not analyzed during the cruise, were fixed (100 µl) with saturated mercury chloride solution and analyzed on land no later than a week after their collection. For the pH in total scale, a potentiometric system was used during the first 2 years, calibrated against TRIS-artificial seawater buffers at 25°C. After 1996, an automatic spectrophotometric pH system was developed using m-cresol purple (Sigma-Aldrich) with a precision of ± 0.0015 (n=15 for different batches of certified reference material, CRM) (González-Dávila et al., 2003). Samples for AT were potentiometrically titrated with HCl in a closed cell to the carbonic acid endpoint until 2004, as described in detail in Mintrop et al. (2000). Since 2004, AT and CT were measured for the same 500 ml borosilicate glass bottle sample using a VINDTA 3C system (González-Dávila et al., 2010) with coulometric determination. Sample accuracy for the three measured variables (pH ±0.0015; AT ±1.5 µmol kg−1, CT ± 1.0 µmol kg−1) was maintained by routine analysis of seawater certified reference materials (CRMs; prepared by and acquired from Andrew Dickson, UCSD).
The program CO2sys V2.3 (Pierrot et al., 2006) was used to compute the values of seawater carbonate variables that were not measured. It provides pCO2, pH and CT when not measured, [CO32−], mineral saturation states for calcite (ΩCal) and aragonite (ΩAra), and the Revelle factor, R. These are computed from AT and pHT pairs (when pH is the only second measured variable) or AT and CT (when CT is a measured variable), together with temperature and salinity. Phosphate and silicate data were obtained from the PANGAEA data repository for ESTOC (https://www.pangaea.de/). Using the three measured carbonate variables (more than 1000 samples), the highest consistency of experimental data was determined considering the set of carbonic acid dissociation constants of Lueker et al. (2000) that was used in the further calculations. CT computed from AT and pHT pairs were better than 2.9 ± 3.2 µmol kg−1 (n = 1020). The Mehrbach et al. (1973) set of constants, as refit by Dickson and Millero (1987) were also valid for AT and CT inputs and presented a slightly higher error of estimate for pH from ±0.003 to ± 0.005. When xCO2 for the surface waters was the only measured variable (VOS line), AT was computed from salinity (see below).
To remove the effects of evaporation and precipitation we applied the traditional normalization NXT = XT/Smea · SRef, where SRef was fixed to the salinity of 35, even though this salinity is in the low salinity range of most Atlantic seawater (e.g., Pérez et al., 2001). When surface data were compared or plotted with and without normalization, the average salinity for surface ESTOC seawater (36.8) was used and indicated. The TrOCA (Tracer combining Oxygen, Inorganic Carbon and total Alkalinity) (Touratier et al., 2007) was used to test ocean chemistry changes in the ocean surface and water column. CAnt estimations are not valid for surface and mixed layer depth (MLD) waters, where the apparent oxygen utilization (AOU) could be negative due to gas exchange and biological activity (i.e., Metzl et al., 2022). For surface waters inside the 100 m, a theoretical CAntTheo (e.g., Equation 5b in Matear et al., 2003) was computed assuming disequilibrium between the atmosphere and the ocean has not changed since preindustrial time (Matear et al., 2003 and reference herein). For this calculation, the preformed alkalinity normalized to constant salinity of 35 for surface waters at ESTOC was fixed to 2307 µmol kg−1 (González-Dávila et al., 2010). The average CAntTheo inside the MLD and the CAnt computed for the sub-surface water just below the MLD (where always AOU > 5 µmol kg−1) were inside ± 0.08 µmol kg−1.
Trend analyses were conducted at 23 different depth levels for the time-series of temperature and salinity, seawater carbonate chemistry (CT, AT, fCO2, Revelle factor) and ocean acidification indicators (pHT, carbonate concentration, ΩCal and ΩAra) (e.g., Sutton et al., 2022). Here, trend analyses were carried out for NCT and NAT as well as for fCO2 and pHT normalized to a mean temperature of 21°C (fCO2,21 and pHT,21, respectively) to account for salinity and temperature controls on those variables. Trend analyses were performed using the observed data values from samples taken beneath the MLD of 100 m (González-Dávila et al., 2010) and with seasonally detrended data for those samples taken within the MLD (Table 2). Regression statistics provided slope, Standard Error (SE), r2, p-value and n, but only the two first values are presented in Table 2. The n value for each variable in Table 2 is that indicated in Table 1 for AT (maximum number of measured variables) and p-value results were always better than <0.01. SE values presented are those computed for the linear fitting of the experimental data without considering the experimental error of the measurements.
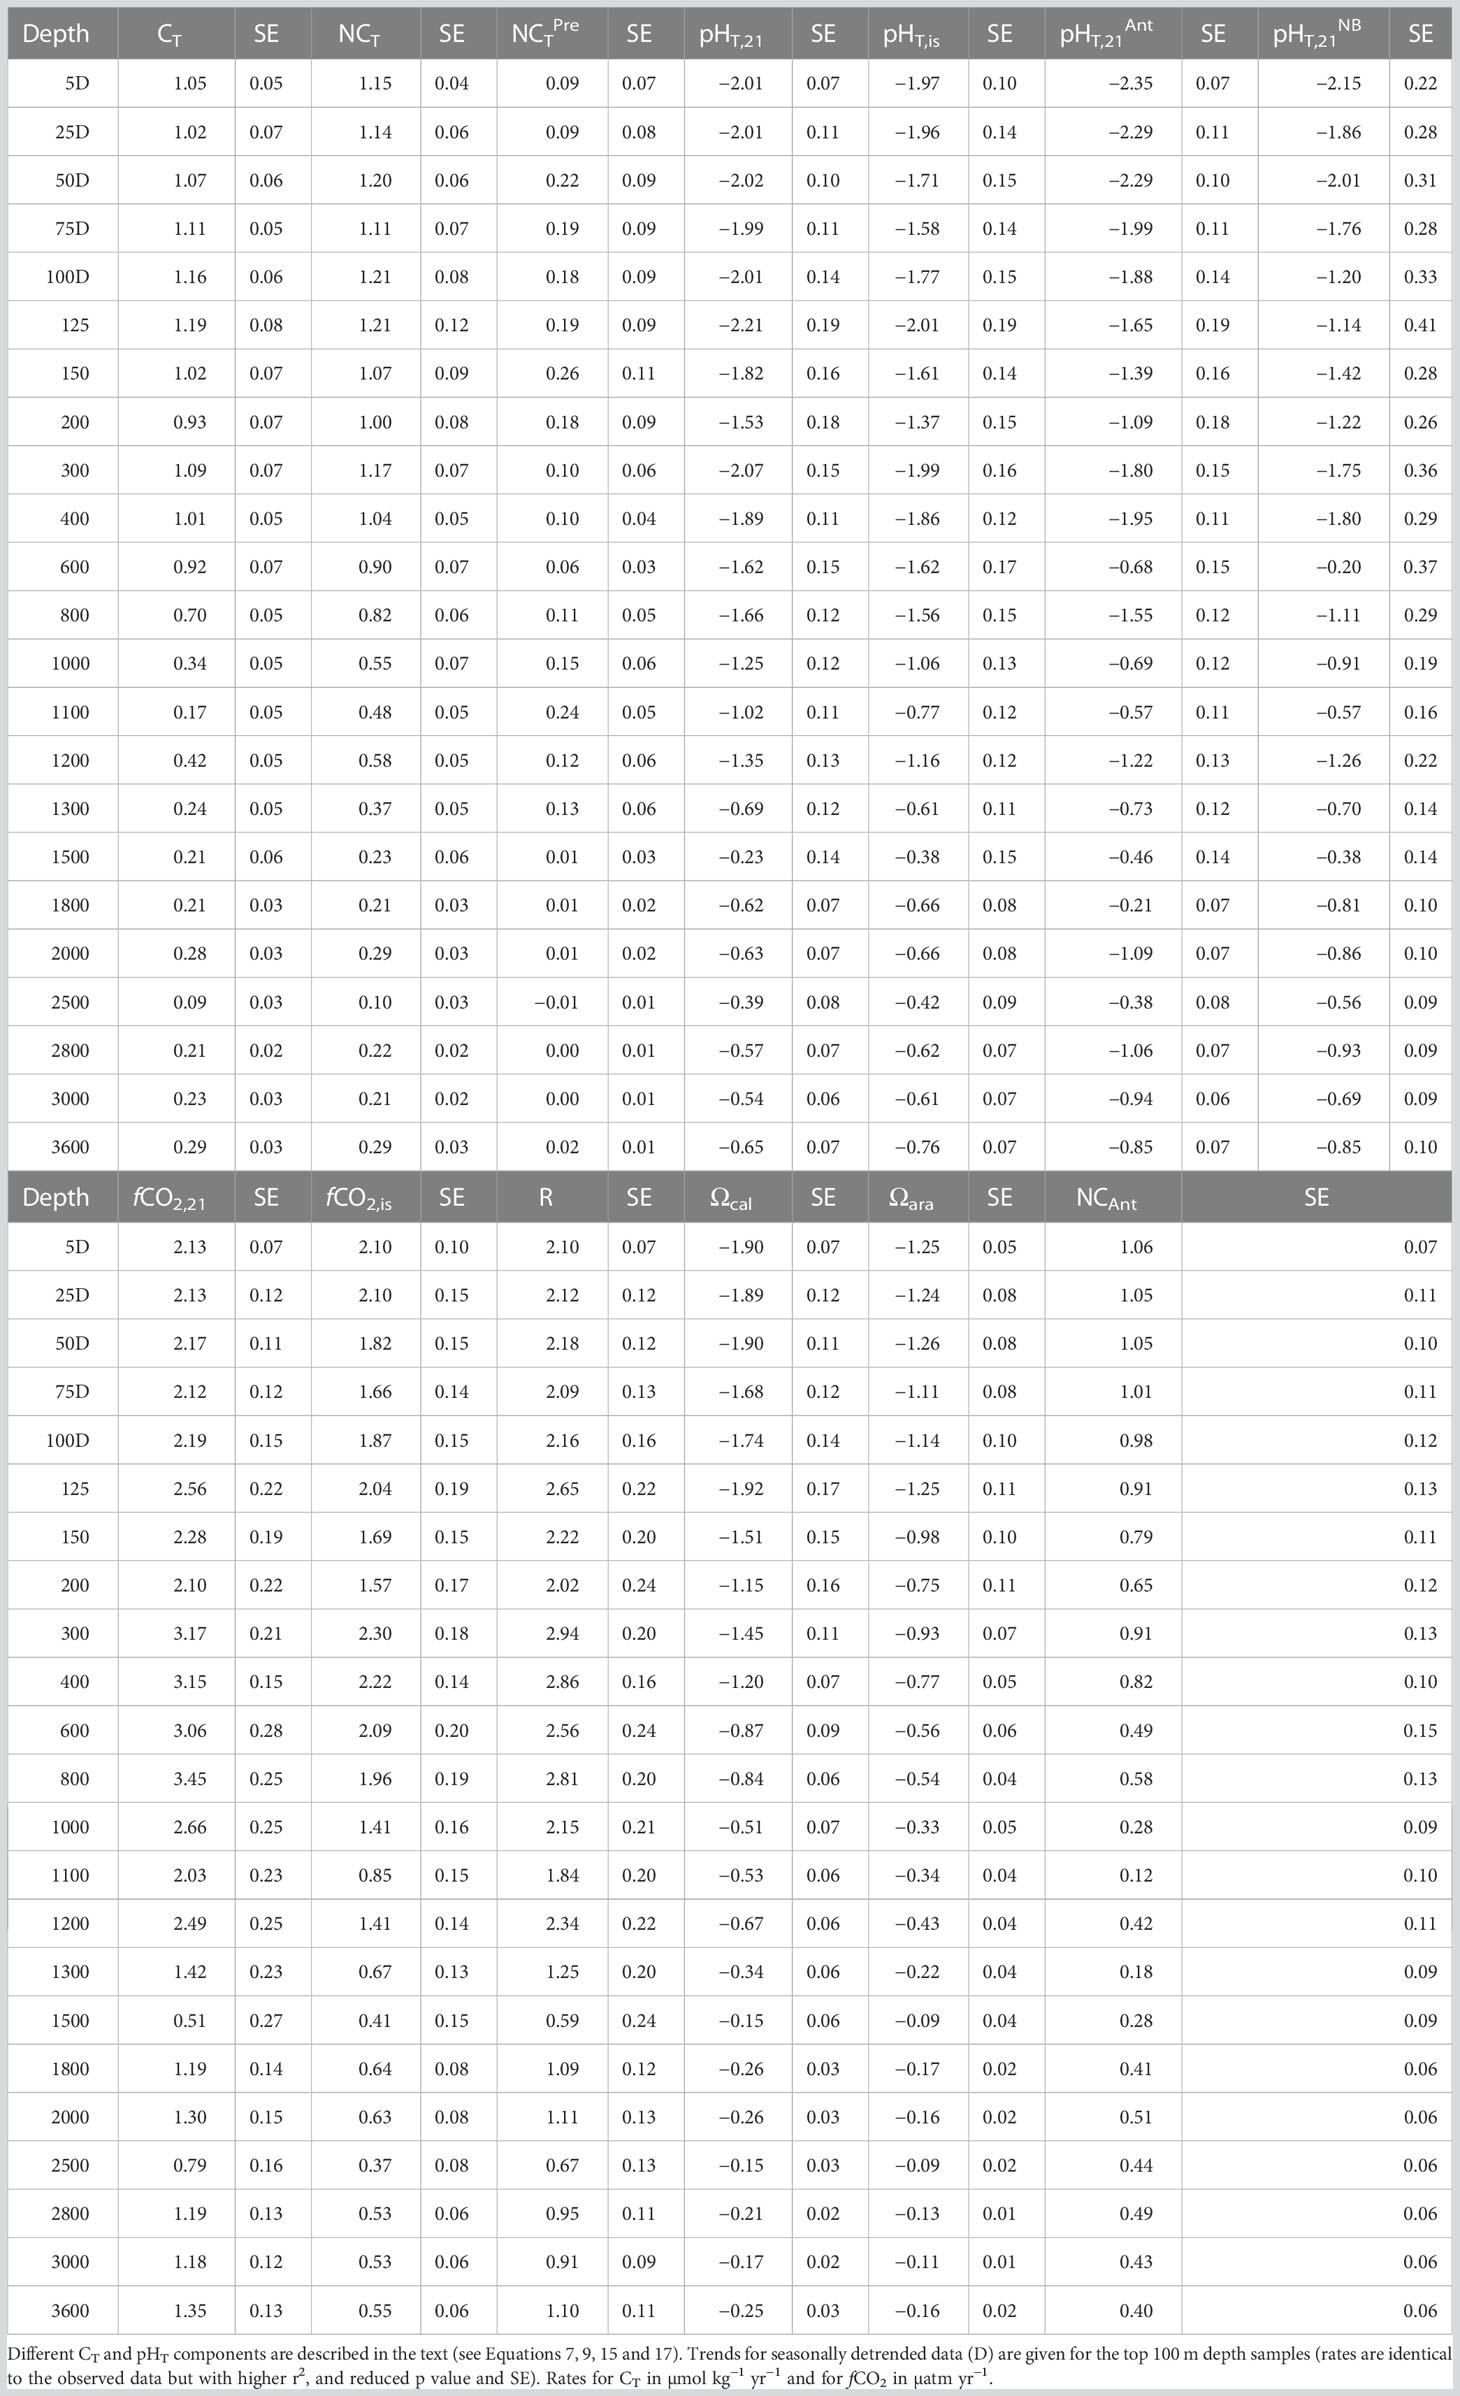
Table 2 Trend analysis (rate yr−1 and standard error of the fitting, SE) of seawater carbonate variables and ocean acidification indicators at ESTOC from 1995 to 2019.
Trend analyses for observed data inside the MLD would exhibit seasonal variability as well as different weighting due to sampling irregularity during the 25 years of observation. Seasonal detrending of the ESTOC data was accomplished following the same strategy used in other time series (e.g., Bates et al., 2012). Data were binned into each appropriate month throughout the time series. For each month between 1995 and 2019, the mean and standard deviation was determined for the surface (first 10 m) (Figure 2) data and for depths of 25, 50, 75 and 100 m (± 5 m) (Table 1; Figure 3). Anomalies were computed by subtracting the mean monthly value from each experimental data points. Trends and regression statistics for seasonally detrended data in the first 100 m and for data until the bottom depth are given in Table 2 and depicted in Figure 3 for 12 selected depths. This analysis allowed the lack of temporal uniformity to be reduced as much as possible. The use of harmonic fitting as presented in previous ESTOC data (González-Dávila et al., 2010) was also applied and provided similar trends inside the estimated error for each variable.
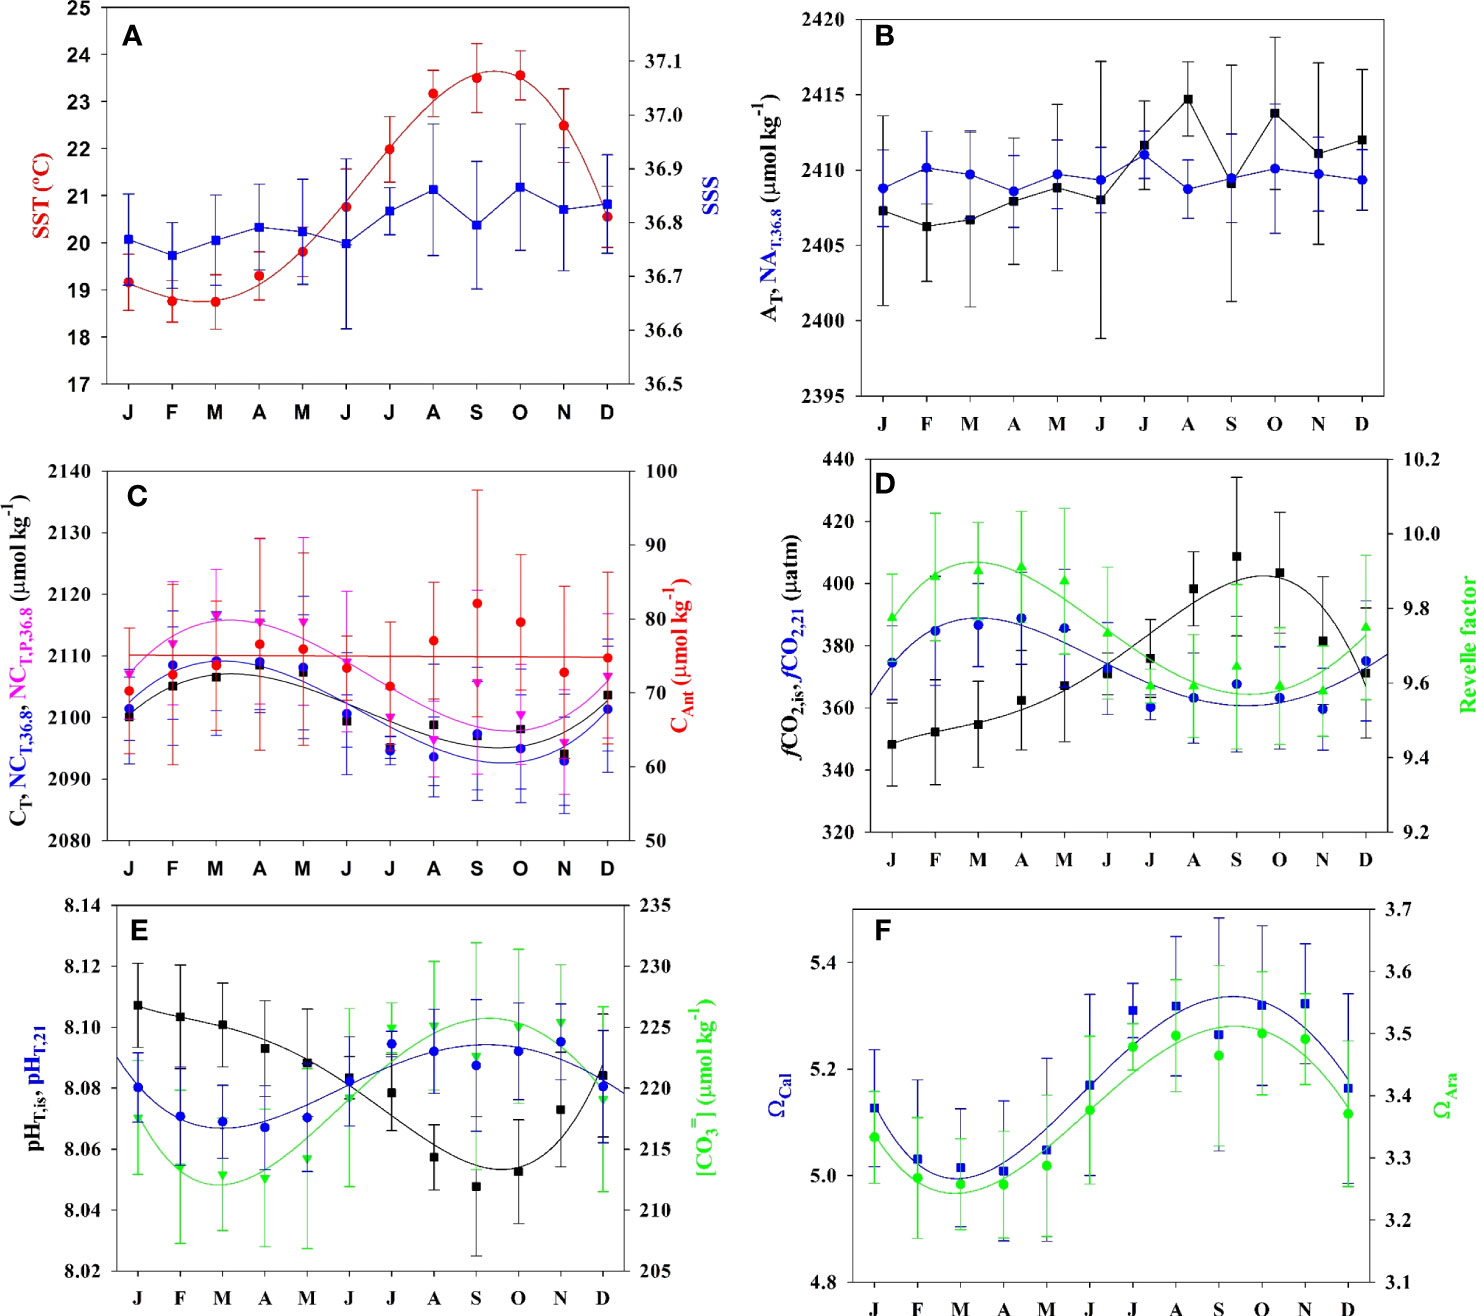
Figure 2 Mean and standard deviation seasonal climatology of surface (5 ± 5 m) seawater properties at ESTOC (1995–2019) for (A) sea surface temperature (SST, °C) and salinity (SSS), (B) total alkalinity (AT) and salinity (36.8) normalized alkalinity (NAT) in µmol kg−1, (C) inorganic carbon (CT), salinity (36.8) normalized CT (NCT), preformed CT (NCT,P) in µmol kg−1 and anthropogenic carbon (CAnt)) in µmol kg−1, (D) fugacity of CO2 at in situ (fCO2,is) and at constant temperature of 21°C (fCO2,21) in µatm, and Revelle factor (R), (E) pH in total scale at in situ (pHT,is) and at constant temperature of 21°C (pHT,21) and [CO32−] (µmol kg−1), (F) saturation states for calcite ΩCal and aragonite ΩCal. Third order polynomial fitting is used for joining average monthly values.
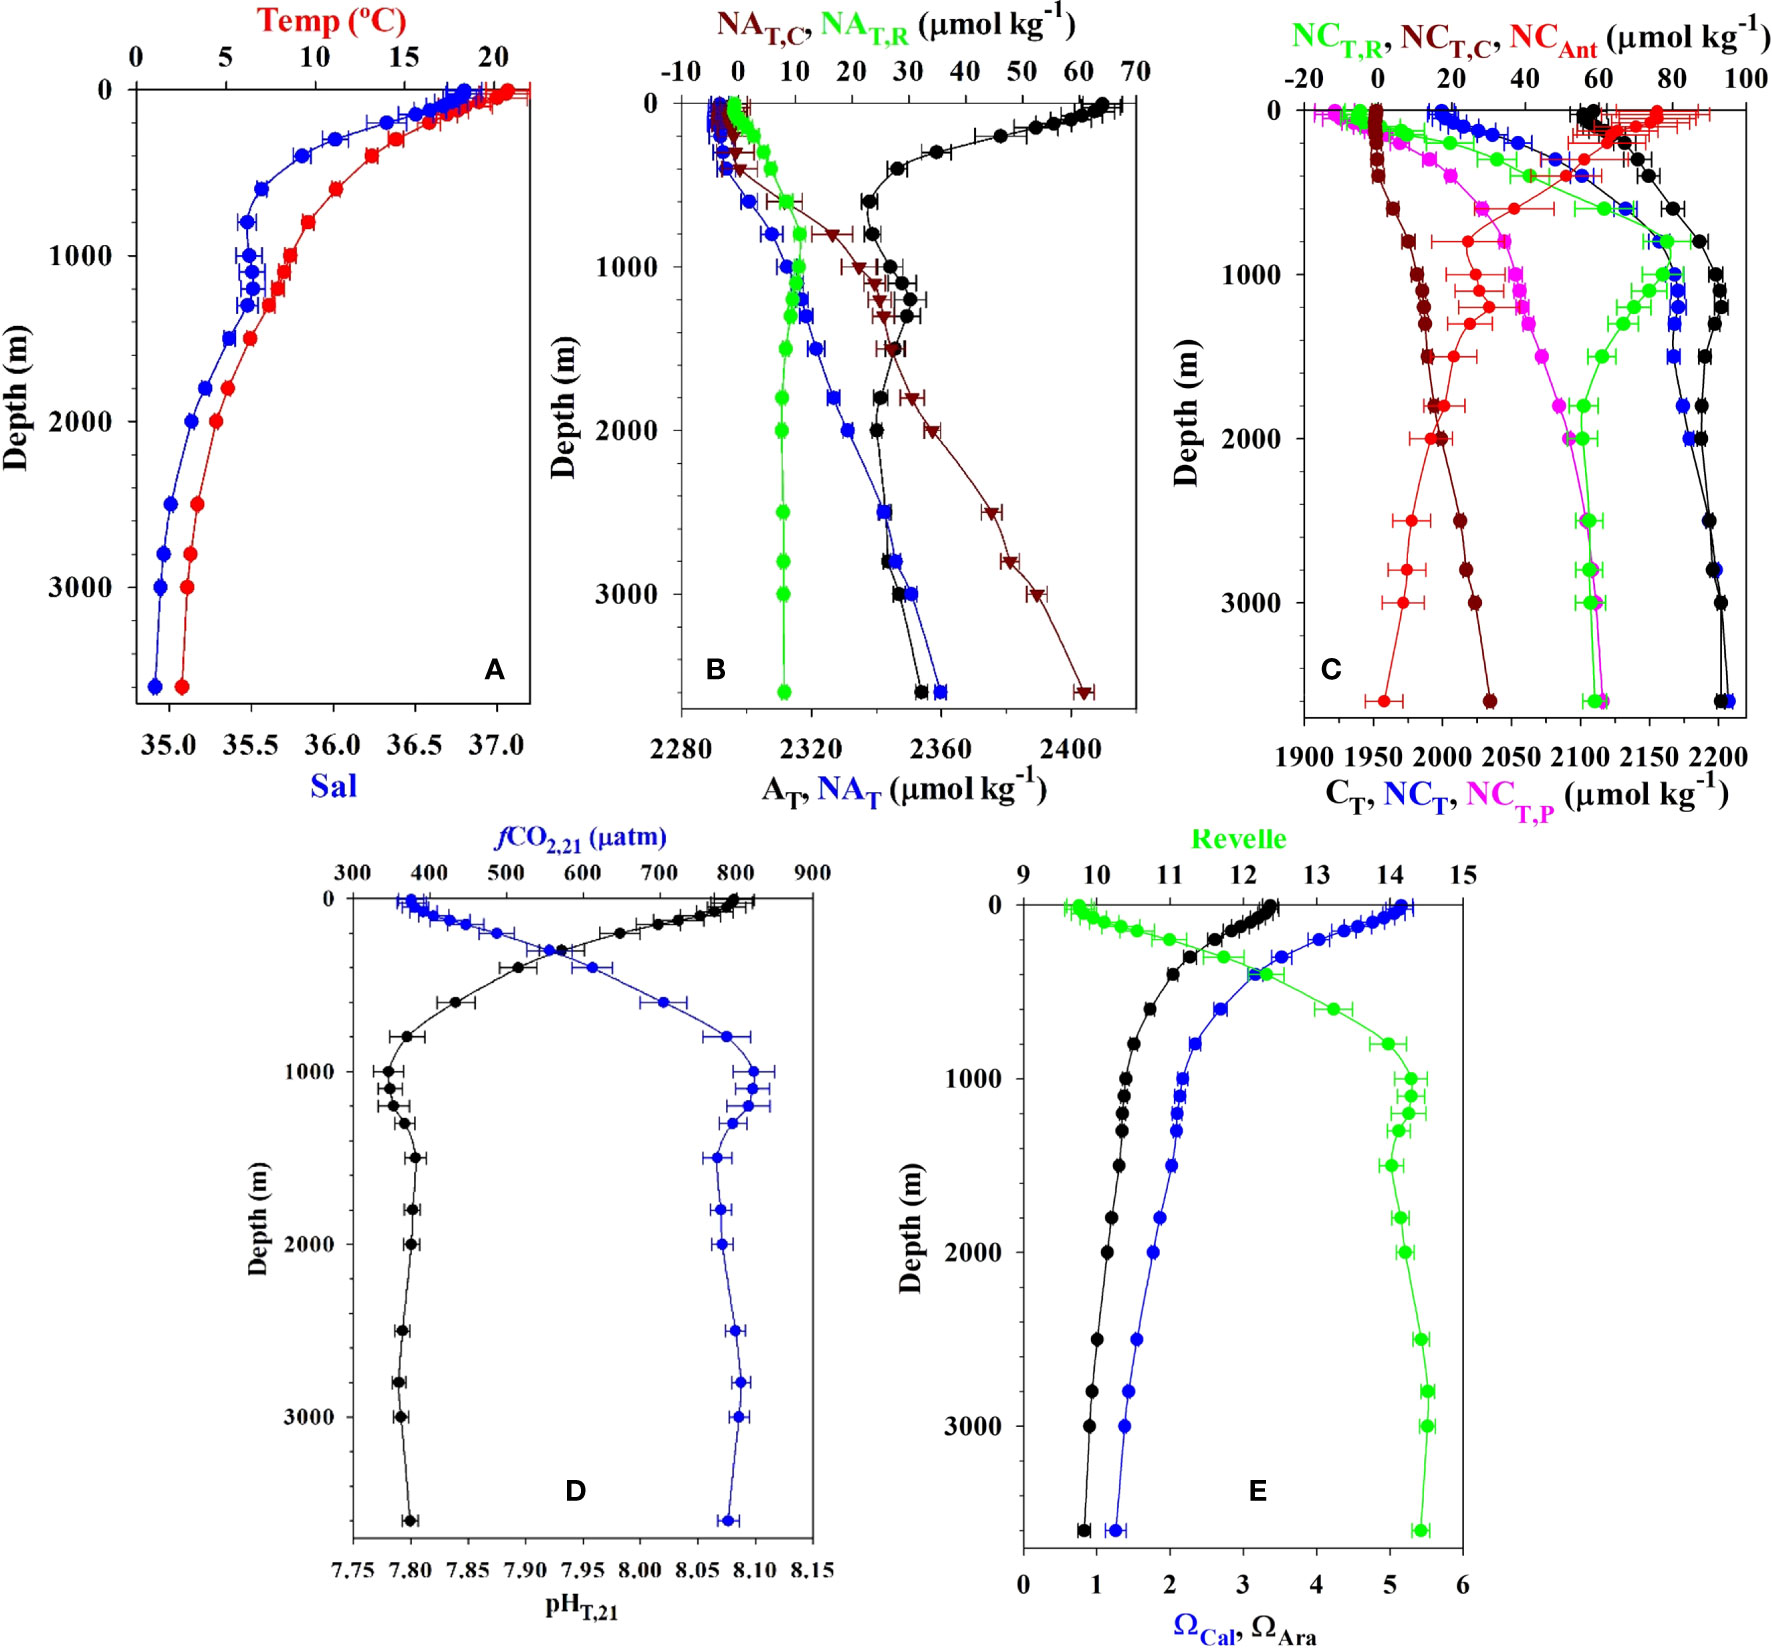
Figure 3 ESTOC average and standard deviation values at the 24 selected depths for (A) Temperature and salinity, (B) AT, NAT and carbonate NAT,C and soft-tissue remineralization NAT,R contributors (µmol kg−1), (C) CT, NCT and preformed (NCT,P), remineralization (NCT,R), carbonate (NCT,C) and anthropogenic (NCAnt) contributors (µmol kg−1), (D) pH in total scale and fugacity of CO2 (µatm) at 21°C, (E) the Revelle factor and saturation states for calcite (ΩCal) and aragonite (ΩAra). Values for the top 100 m are seasonally detrended.
Given the non–uniform sampling frequency at ESTOC, we determined the monthly mean physical and chemical properties (Figure 2) and the average value for the period 1995–2019 (Table 1) The range of mean surface seasonal temperature at ESTOC varies between 18.7°C in February–March to 23.5°C in October, with an average standard deviation in each month of 0.6°C with a maximum of 0.8°C during the warmest months (Figure 2A). The observed monthly variability over long periods of years highlights the need to leverage long time series to account for accurate long-term trend studies. Salinity at ESTOC presented average values of 36.8 (Table 1), being lower during winter due to winter convection, during which the MLD reached over 100 m (Santana-Casiano et al., 2007) and increasing in the summer to close to 36.9 (Figure 2A). Accordingly, AT presented a similar seasonality with a concentration of 2407 µmol kg−1 during winter, increasing to values of 2414 µmol kg−1 after June (Figure 2B). After normalization to the average salinity of 36.8, the value remained at 2409.2 ± 2.2 µmol kg−1, like that determined in the first 10 years of study (2409.7 ± 2.2 µmol kg−1, Santana-Casiano et al., 2007). This constant value for NAT allows us to compute surface AT from salinity (AT = 2409.2/36.8 * S) when xCO2 is the only measured concentration.
The surface inorganic carbon content CT (Figure 2C) showed increased values until April, reaching an average concentration of 2108.5 ± 7.2 µmol kg−1, due to winter convective mixing. The notable deviation in the observed mean value is related to both inter-annual variability of the mixed layer depth that brings CT-rich sub-surface waters up from depth and to the interannual increase in CT during the study period. The drawdown of CT in the Spring–Summer, related to the biological uptake in the mixed-layer, decreases the concentrations to an average value of 2094.1 ± 9.7 µmol kg−1. When normalized to a constant salinity of 36.8, the maximum average concentration was recorded in March at 2109.2 ± 8.0 µmol kg−1, which decreased to 2092.9 ± 7.2 µmol kg−1 by October. González-Dávila et al. (2007) showed that the significant interannual variability in CT anomalies was negatively correlated to the SST. To explain these anomalies, a model including the biological processes, the air-sea exchange, lateral transport, entrainment, and vertical diffusion processes acting on the surface and MLD carbon cycle was applied and discussed in detail previously (González-Dávila et al., 2007). The most important conclusions were that the model confirmed the entrainment transport, controlled by the seasonal change of the mixed layer, and to a lesser degree, the NCP, were the major drivers for the seasonal variations in CT. There were not significant changes in the model contributor when data were extended to the period 1995–2019 (data not shown). Moreover, these processes were also affected by the seasonal displacement of the Eastern sub-tropical gyre, which is closely linked to the Trade wind regime. The gyre is stronger West of the Canary Islands from October to March, while from April to September, the Southward transport is near the African coast. Therefore, a significant correlation (González-Dávila et al., 2007) was obtained with the winter North Atlantic Oscillation index, NAO, with a 3-year lag for the ESTOC biogeochemical properties and for all the CT contributors. The NAO seems to control the baroclinic transport and the spatial pattern of the Eastern part of the sub-tropical gyre (González-Dávila et al., 2007; Santana-Casiano et al., 2007).
In ESTOC, the surface derived CAnt (CAntTheo) presented an average concentration of 76 ± 8 μmol kg−1 (Figure 2C). The high standard deviation in CAnt reflects the significant increase in the signal throughout the 25 years of data collection.
The surface partial pressure of CO2 expressed as fugacity, fCO2, (Figure 3D) varies seasonally, with lower values during the cold months that increase to values over 400 µatm in September, reflecting the underlying seasonality of temperature and CT. When normalized to a constant temperature of 21°C (Takahashi et al., 1993), maximum values are observed by the end of March, due to convective vertical mixing, and then decrease until September–October due to NCP. A similar distribution is observed in the Revelle factor, R. R reflects the ease of air–sea CO2 exchange (Revelle and Suess, 1957) which decreases, as does the chemical buffering capacity, with increasing R values. In ESTOC, the maximum seasonal amplitude of R is about ~0.5, with minimum values of 9.57 ± 0.12 in October–November, when the fCO2 is the highest.
The typical surface seasonal changes in pH at ESTOC (Figure 2E) ranged from in situ pHT,is wintertime highs of 8.10 ± 0.02 to summertime lows of 8.05 ± 0.02. When temperature effects on pH variability are removed, winter vertical mixing results in lower pHT,21 during March, increasing until October with a seasonal amplitude of about 0.03 pH. These values agree with the climatology for the ESTOC area for the reference year 2005 (Takahashi et al., 2014), with a pHT,is range between 8.09 in January and 8.066 in September and a seasonal amplitude of about 0.03 pH. Both ΩCal and ΩAra exhibit seasonal changes of ~0.3–0.5 (Figure 2F) with maximum values at the end of summer, following the same distribution as that for the [CO32−] (Figure 2E), which presented a seasonal amplitude of ~25–30 µmol kg−1.
The average and standard deviation for the vertical distribution of physicochemical variables at ESTOC for the period 1995–2019 are shown in Table 1 and depicted in Figure 3. As indicated above, all the concentrations for MLD (first 100m) were computed considering seasonally detrended data. The vertical distribution of water masses (Pérez et al., 2001) controls all the profiles. The subtropical (from the bottom of the surface layer down to 500 m, following the 35.66 isohaline) and the subpolar (a narrow layer centered at about 35.23 salinity) varieties of the Eastern North Atlantic Central Water (ENACW) control the central waters. The intermediate waters present both the influence of the northward advection of the low salinity Antarctic Intermediate water, AAIW (Santana-Casiano et al., 2001) centered at about 900 m (salinity of 35.5) and the modified Mediterranean water, MW, identified by the salinity maximum from 1100 m to 1200 m. Both present a significant inter-annual variability (Cianca et al., 2007), indicated by the highest standard deviation in all the variables (Figure 3). The continuous decrease in salinity and temperature (Figure 3A) to the bottom denotes the presence of North Atlantic deep water, NADW. The influence of Antarctic Bottom Waters (AABW) north of 26°N has also been recognized (Krasheninnikova et al., 2021).
The vertical distribution of AT and NAT (for fixed salinity of 35) is shown in Figure 3B. NAT increased from surface values of 2291.7 ± 2.7 µmol kg−1 to 2359.8 ± 1.7 µmol kg−1. This increase is due to both the soft-tissue biological pump changes, caused by organic matter remineralization (NAT,R), and changes to the carbonate pump, due to carbonate dissolution (NAT,C) (González-Dávila et al., 2010). These were estimated considering oxygen data (Cianca et al., 2013), the calculated apparent oxygen utilization (AOU) and the stoichiometric coefficient (Anderson and Sarmiento, 1994) proportional to the proton flux during photosynthesis and remineralization
The carbonate dissolution effect was estimated considering AT,R and the preformed values of the water mass at the time of its formation at surface outcrops (Wanninkhof et al., 1999; González-Dávila et al., 2010)
The dissolution of this hard material increases the measured AT below 400 m and predominates after 600 m as the result of increased pressure, decreased temperature and longer residence time. The organic matter remineralization decreases alkalinity in the first 800–900 m until a maximum of NAT,R = 10.7 ± 0.95 µmol kg−1.
Figure 3C depicts the vertical distribution of the dissolved inorganic carbon (CT and NCT,35) and the corresponding preformed (CT,P), organic matter remineralization (CT,R), carbonate dissolution (CT,C) and CAnt contributions, where
The CAnt contribution below the MLD was estimated using the TrOCA method. Despite its limitations (e.g., Yool et al., 2010), this method provides a useful tracer of ocean chemical changes when used at a fixed location (Bates and Johnson, 2020). In the first 1000m, NCT increases 170 ± 8 µmol kg−1 even when NCAnt decreases from a surface average of 75 ± 11 µmol kg−1 to 25 ± 9 µmol kg−1. The increase in NCT is the result of a 29% contribution from anthropogenic carbon, a 75% related to the increase in preformed values, 48% due to the remineralization of organic matter and 6% from the dissolution of calcium carbonate. Towards the bottom of the water column, NCT continues to increase another ~40 µmol kg−1 (140% due to the increase in preformed carbon plus another 45% due to the increase in carbonate dissolution), while NCAnt reduces from 25 ± 9 µmol kg−1 to 2 ± 5 µmol kg−1 (~40% decrease) and the NCT,R decreases from 78 ± 5 µmol kg−1 to 58 ± 4 µmol kg−1 at 3650 m (45% decrease).
The vertical profiles for pHT,21 and fCO2,21 (Figure 3D) and for in situ ΩCal, ΩAra and R factor (Figure 3E) showed the influence of the different water masses and carbonate changes related to the remineralization of organic matter and carbonate dissolution. While pHT,21 decreases from average detrended surface values of 8.08 ± 0.02 to 7.78 ± 0.01 at 1000 m, where CT,R contribution was maximum (Figure 3C), fCO2,21 increased by 445 µatm from a surface average value of 375 ± 18 µatm. The preformed water mass characteristics controlled the Revelle factor (Figure 3E), which increased from the average surface value of 9.7 ± 0.2 to 14.3 ± 0.2 at 1000m. The saturation state for both calcite and aragonite decreased by 58%, reaching an average value of ~2.2 for ΩCal and ~1.4 for ΩAra in the first 1000m. The saturation horizon for aragonite (ΩAra = 1) is located at around 2500 m at ESTOC (Figure 3E; Table 2), but has decreased by 100 m in 25 years from around 2560 m in 1995 to 2460 m in 2019 (data not shown).
Figures 4, 5 and Table 2 show the observed trends and standard errors of measured physicochemical and carbonate variables, along with derived carbonate variables for September 1995 to December 2019. 23 depths were selected at the ESTOC site (Table 2) but only 12 are plotted in Figure 4 for clarity. There were no significant changes in the potential density profiles for the studied period and, therefore, depth values (± 5 m in the first 200 m and ± 15 m below) were used to show the trends. The first 50 m of water showed a significant increase in temperature of 0.4°C for the observed period (Figure 5B), confirming the warming of the North Atlantic Water (e.g., Taboada and Anadón, 2012; Kessler et al., 2022). Below, the increase in temperature by 0.08°C of the subpolar ENACW at 600m during the 25 years was the only significant change (95%). However, at the bottom of ESTOC, the temperature decreased by 0.04°C for the same period. This result is in accordance with the analysis of the long-term trends (Krasheninnikova et al., 2021) in average annual temperature for the AABW based on the reanalyzes and RAPID data for the period 2004–2015 South of ESTOC, at 26°N, that indicates an increased contribution of AABW to bottom waters in the area.
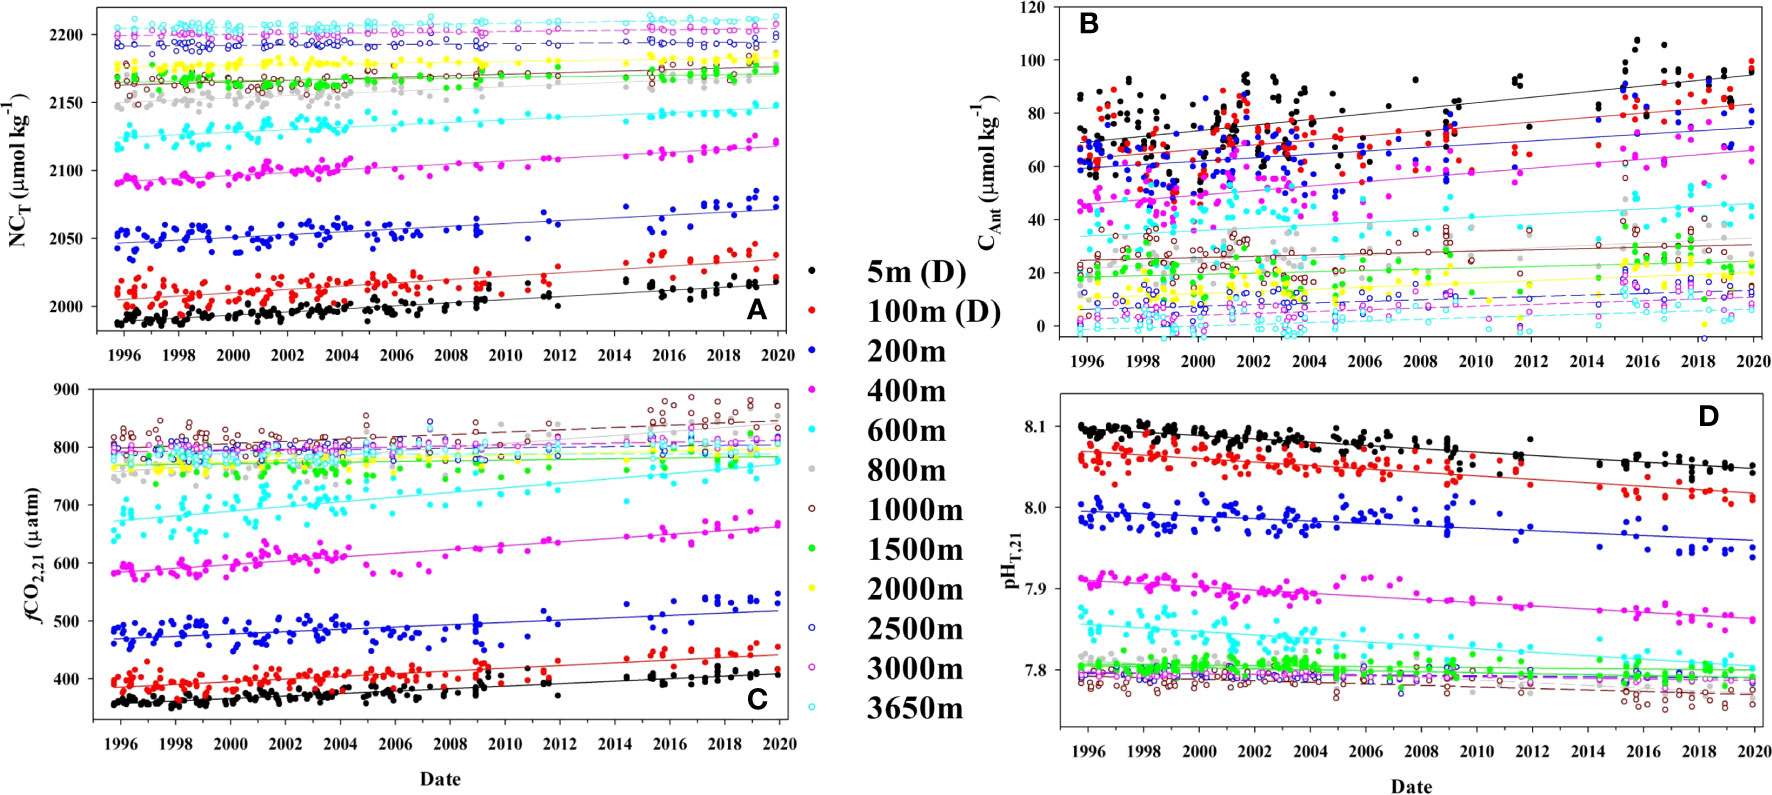
Figure 4 Time series of (A) salinity (35) normalized inorganic carbon, NCT (µmol kg−1), (B) Anthropogenic carbon, CAnt (µmol kg−1), (C) the fugacity of CO2 at a constant temperature of 21°C (µatm) and D) pH at a constant temperature of 21°C for 12 selected fixed depths at ESTOC. Surface (5 ± 5 m) and 100 ± 5 m water depth concentrations are seasonally detrended data (D). Lines represent fitted linear regression for the experimental data.
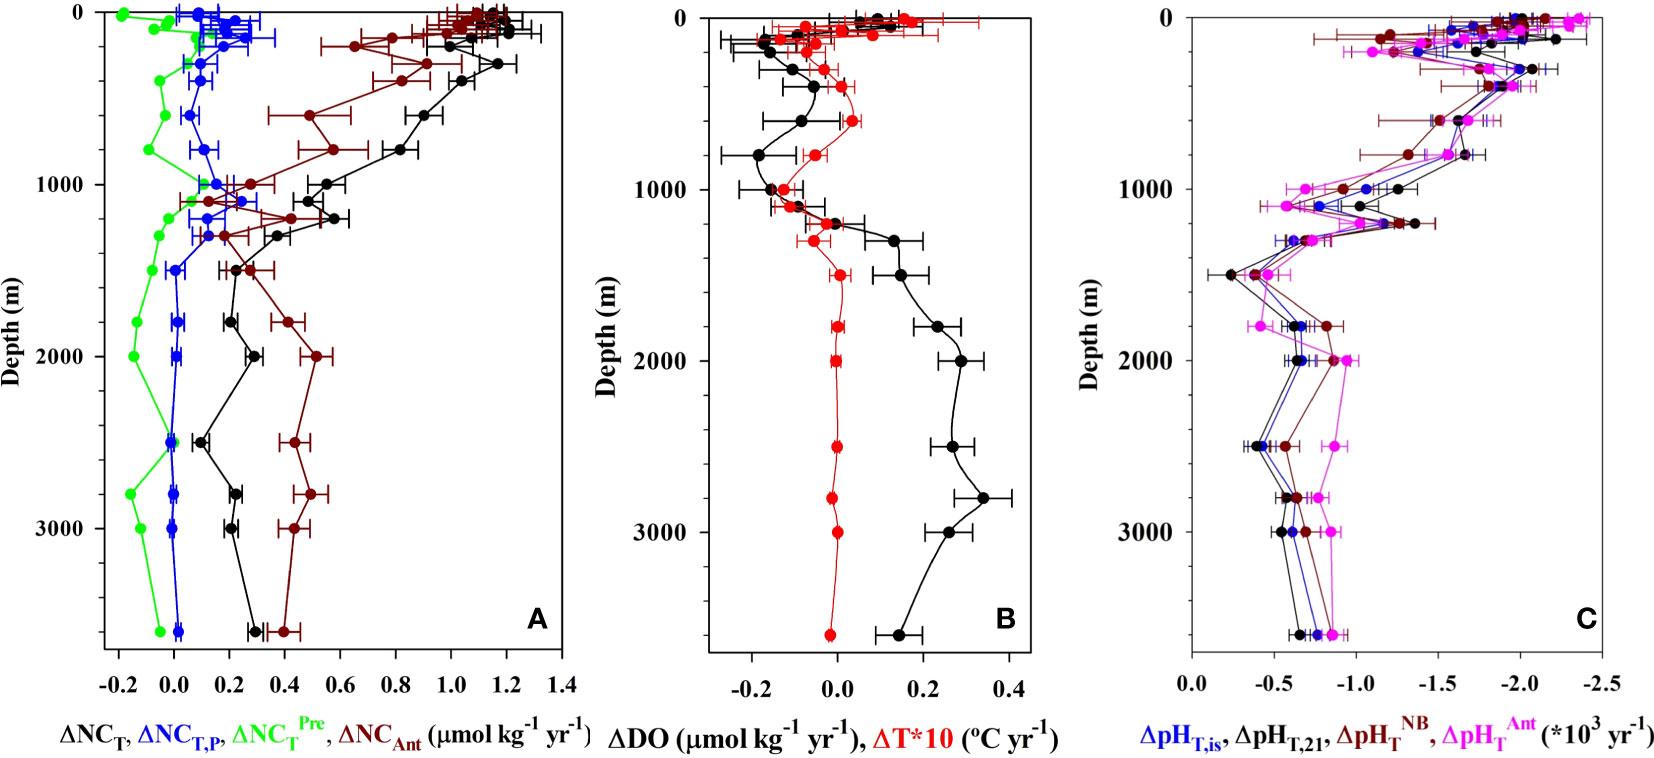
Figure 5 Rates of change in (A) salinity (35) normalized inorganic carbon NCT, preformed NCT,P, predicted NCTPre and anthropogenic NCAnt (µmol kg−1 yr−1) contributors, (B) dissolved oxygen DO (µmol kg−1 yr−1) and temperature (°C yr−1) and (C) pHT at in situ conditions, at constant temperature of 21°C, and the non-biological pHTNB and anthropogenic pHTAnt contributors at ESTOC for the period from 1995 to 2019. Error bars denote standard deviations. Different CT and pHT components are described in the text (see Equations 7, 9, 15 and 17).
The interannual increase in seasonal detrended NCT (Figures 4A, 5A; Table 2) in the first 125 m is constant at 1.17 ± 0.07 µmol kg−1 yr−1, higher than that determined for the first 10 years (0.85 ± 0.16 μmol kg−1 yr−1, González-Dávila et al., 2010) and 17 years (1.08 ± 0.08 μmol kg−1 yr−1), (Bates et al., 2014; Takahashi et al., 2014). The rate of increase of CT was 1.12 ± 0.06 μmol kg−1 yr−1, related to the effects of the small salinity changes on the observed annual increase in surface CT. The increase in rate responds to the nonlinear increase in atmospheric CO2, with much larger values of CO2 in the air-side boundary layer increasing CO2 uptake by seawater, even when the surface waters are warmer than before, with the R factor increasing at a rate of 0.021 ± 0.001 yr−1. Moreover, both an increase in the years used in the trend estimation and the influence of bidecadal changes in surface ocean carbon (e.g., Arzel et al., 2018) could also contribute to the observed new values. In 25 years, surface dissolved inorganic carbon concentrations at ESTOC have increased by ~30 μmol kg−1. There was not any significant variability inside the MLD in CT,R related to changes in biological activity (data not shown). The observed rate of increase in NCT was close to the increase in anthropogenic carbon (1.06 ± 0.11 μmol kg−1 yr−1), controlling the rate of increase of dissolved carbon in the subtropical gyre (Figure 4B; Table 2). This rate of increase in NCT will in itself result in an increase in fCO2,is of 2.3 µatm yr−1 and a decrease in pHT,is of 0.002 pH yr−1 according to the average Revelle factor of 9.9 for the MLD. Indeed, the observed trends in the surface waters are +2.1 ± 0.1 µatm yr−1 for fCO2,is and −0.002 ± 0.0001 pH yr−1 for pHT,21 (Table 2). Due to the logarithmic scale for pH, the corresponding rate of increase in hydrogen ion concentration results 40 ± 1 pM H+ yr−1, indicating that the ESTOC site has increased its hydrogen ion concentration in 13% in the last 25 years. Again, the rates of change in fCO2,is and pHT,21 at ESTOC have increased with respect to those determined for the first 10 years (1.55 ± 0.43 μatm yr−1 and −0.0017 ± 0.0003 pH yr−1, González-Dávila et al., 2010) and 17 years (1.92 ± 0.24 µatm yr−1 and –0.0018 ± 0.0002 pH yr−1, Bates et al., 2014), representing an increase of nearly 20% from 1995-2005. Over the 25 years of study, the average surface value of fCO2 has increased by 52.5 µatm while the pHT has declined by 0.051 units (Figure 6). Considering the seasonal amplitude of both fCO2 (~50–60 µatm) and pHT (~0.05), the seawater conditions in ESTOC in 1995–1996 are observed to be completely different from those recorded nowadays (Figure 6, which includes the most recent surface data until April 2023).
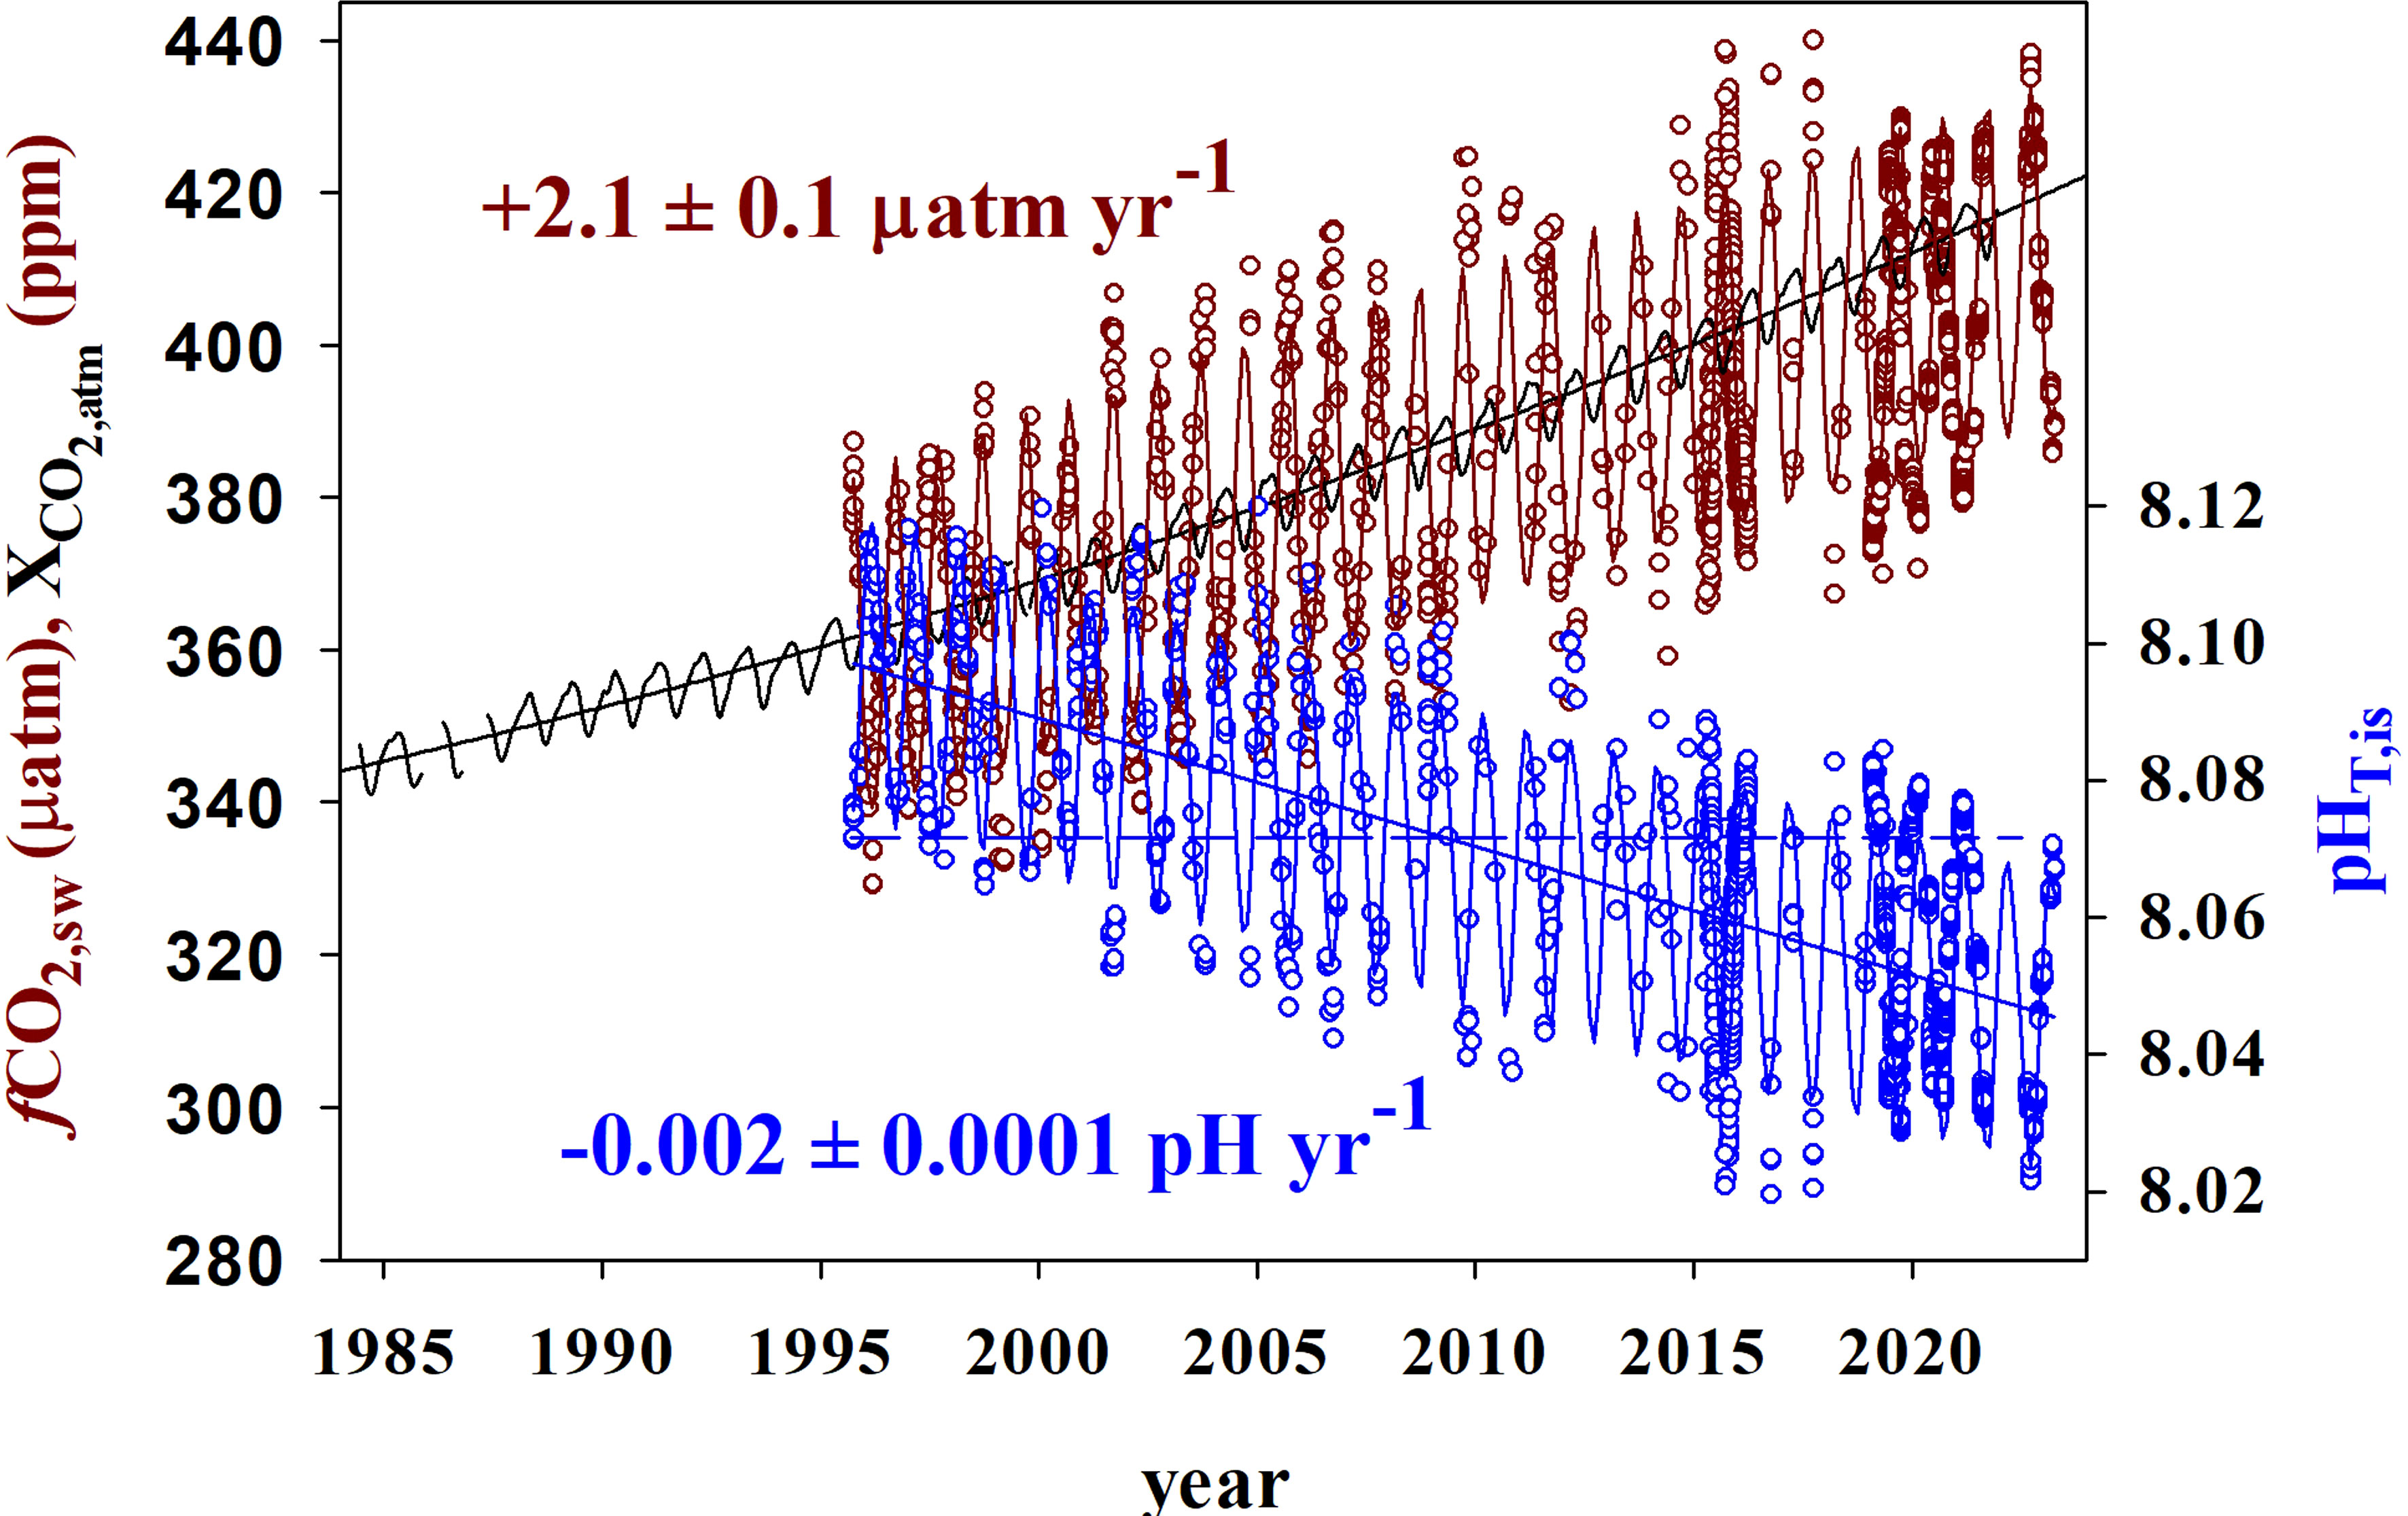
Figure 6 Observed surface data (open circles) for fCO2 (µatm) (dark red) and pHT (blue) at in situ temperature and salinity conditions at ESTOC for the period October 1955 to April 2023 together with atmospheric CO2 molar fraction (black line, ppm) at the reference station Izaña (the Canary Islands) (https://gml.noaa.gov/ccgg/trends/gl_gr.html, last visit 20/04/2023 ). Lines indicate average seasonal fitting and trend values for fCO2 and pHT. The dashed blue line joins the lowest pHT values in 1995 and the highest pHT in 2020.
It was also shown that in the period 1995–2005, the rate of increase in detrended fCO2,sw (1.55 ± 0.43 μatm yr−1) was similar to that for fCO2,atm (1.6 ± 0.7 μatm yr−1) at the atmospheric station Izaña, and ESTOC was acting as a small sink of CO2 of 51 ± 36 mmol m−2 yr−1 (Santana-Casiano et al., 2007), controlled by the predominant Trade Winds. Accordingly, Figure 6 shows how for the period 1995–2005, climatological fCO2,sw was symmetrically distributed with respect to fCO2,atm. However, the maximum climatological fCO2,sw is shown to increase at a slower rate than the atmospheric trend, with ESTOC behaving as a sink of CO2 for longer periods of time at present. If the rates of increase in both climatological seawater and atmospheric CO2 at ESTOC (rates of 1.97 μatm yr−1 vs 2.3 μatm yr−1, respectively, in the last 5 years 2019–2023) are maintained as observed in Figure 6, it is predicted that by 2040, all the climatological fCO2 seawater values will be smaller than the atmospheric values and thus, the area will be acting as a sink throughout the whole year.
The surface saturation states of both calcite and aragonite have decreased at a rate of 0.019 and 0.0125 yr−1 (0.48 ± 0.02 and 0.31 ± 0.01, respectively, in the 25 years of study). Although the present rate of decrease of At/Ct is ~0.5% per decade, observed increases in CT due to the uptake of rapidly increasing atmospheric CO2 may lower the ratio significantly in a time scale of several decades. This ratio significantly controls the carbonate chemistry of the oceans and the ocean CO2 uptake rate (Lenton et al., 2012; Takahashi et al., 2014).
Below the MLD, NCT continues to increase yearly (Table 2; Figures 4A, 5A) at a rate over +1 μmol kg−1 yr−1 in the first 400 m. Then, the rate decreases until 1500m, where it keeps a constant value of 0.21 ± 0.08 μmol kg−1 yr−1 until 3000 m. The rates of change for fCO2 and pHT show a similar behavior with positive and negative rates, respectively (Figures 4C,D, 5C). However, due to the increase in the R factor in the first 1000 m (Figure 3E), relatively constant rates were observed in the first 800 m, before decreasing to 0.5 ± 0.1 µatm yr−1 and −0.0005 ± 0.0001 pH yr−1, respectively below 1500 m. As observed for the temperature in the bottom layer (3500–3650 m), the rate for all the variables showed a slight increase (Table 2) which could be related to a higher influence of AABW signal at ESTOC in recent years. This higher AABW influence was not significantly richer in anthropogenic CO2, as the rate of increase in CAnt was not affected.
Changes in NCT (Figure 5A) due to variability in the preformed NCT,P along the water column contributed less than 10%, except in the 1000–1300 m depth range where the NCT,P of the MW influence increased at a rate of 0.16 ± 0.06 μmol kg−1 yr−1 (~30% contribution). Results in the Strait of Gibraltar (Flecha et al., 2019) showed that the MW outflow has increased CAnt and DO due to increased absorption of atmospheric CO2 and an intensified transport from the surface to the ocean interior in the western Mediterranean.
The rate of increase for CAnt below 1500 m was constant at 0.35 ± 0.14 μmol kg−1 yr−1 (Figure 5A). The higher rate of increase in CAnt below 2000 m compared to that in CT seems to be related to an increased rate in DO content (0.25 ± 0.08 μmol kg−1 yr−1) inside the NADW. NADW, comprising varying proportions of Labrador Sea Water (CLSW; ~45%), Iceland-Scotland Overflow Water (ISOW; ~30%), and Denmark Strait Overflow Water (DSOW; ~5%), while the remaining portion (~20%) is sourced from modified Antarctic Bottom Water (AABW) (Jenkins et al., 2015), could potentially witness an increase in oxygen content. This is attributed to the reduction in sea ice coverage in the Labrador Sea and Nordic seas, promoting deep Atlantic ventilation, as highlighted in research conducted by de Vernal and Hillaire-Marcel (2000) and Koelling et al. (2022). The increase in DO content (Figure 5B) reduces the value of AOU, which controls the estimation of organic matter remineralization (Equation 3) and its contribution to the computation of CAnt, without implying a change in the biological soft-tissue pump. Therefore, this aspect should be considered in anthropogenic carbon estimations.
The use of empirical equations, which take into account different hydrographic properties, allows for the reconstruction of carbonate species concentration in the ocean water column. (e.g., DO, potential temperature (θ), Salinity (S), chlorophyll–a and major nutrients) (e.g., Millero et al., 1998; Lee et al., 2000; Friis et al., 2005; Li et al., 2016). The changes observed in the carbonate system of seawater are predominantly influenced by both physical and biological processes. The DO can be utilized as a metric for gauging biological activity, while temperature and salinity serve as indicators of physical dynamics. To determine decadal changes in the carbonate variables, reconstruction of the concentration of AT, CT, pHT,is and pHT,21 and fCO2,is and fCO2,21 for the full set of ESTOC data for the period 1995-2005 was selected and carried out using DO, θ and S. These variables form the core set of parameters measured by the majority of Argo profiling floats. These floats are designed to autonomously collect hydrographic data at regular intervals of approximately every 2 weeks (Argo website, http://argo.argo.net/). The inclusion of nutrient or chlorophyll data does not improve the fittings.
We obtained the predicted values for seawater AT, CT, pHT and fCO2 using the following Equations (6)–(11), where the super index Pre refers to predicted and SEE to the standard error of the estimation, applied for the decadal period 1995–2005.
(n = 1454, r2 = 0.949, SEE = 6.5 µmol kg−1)
(n =1443, r2 = 0.973, SEE = 6.8 µmol kg−1)
(n=1057, r2 = 0.976, SEE = 0.010)
(n = 1158, r2 = 0.994, SEE = 0.009)
(n = 1099 r2 = 0.954, SEE = 9.6 µatm)
(n = 722, r2 = 0.997, SEE = 10.8 µatm)
The SEE for the parameterizations of AT, CT, pHT,is and fCO2,is were 6.5 µmol kg−1, 6.8 µmol kg−1, 0.010 pH and 9.6 µatm, respectively. The equilibrium equations of carbon chemistry and the influence of remineralization/photosynthesis processes (Wolff et al, 2007; Li et al., 2016) reveal that salinity has a significant effect on AT, with a strong positive relationship observed between the two variables. Using the average data in Table 1 for surface waters (5 m), surface alkalinity can be computed both by the alkalinity to salinity relationship indicated above valid only for those water (AT = 2409.2/36.8 * S) and by Equation (6), valid for the whole profile. Results were consistent (95% confidence) with any of those equations. The CT (Equation 7) presented the strongest relationship with DO and T, changing negatively with increases in both. For pHT,21 (fCO2,21) a positive (negative) change was observed with increases in DO, presenting the strongest effect. Hence, Equations (6)–(11) are useful for reconstructing the carbonate variables on a decadal scale for the ESTOC site. It should be considered that the predicted concentrations obtained from Equations (6)–(11) include the natural background component (Xnbc) and the anthropogenic component in the year 2000 (the average for the period 1995-2005) considered for constructing the parameterizations (Equation 12) (McNeil and Matear, 2013). The carbon data collected from the ESTOC site is already affected by the rising levels of anthropogenic atmospheric CO2.
In order to see if this same set of equations could be useful for reconstructing the carbonate variables over the North East Atlantic subtropical region, 12,406 AT, 9452 CT and 7019 pHT,is GLODAP oceanic data for the same period (1995–2005) in the region 20°N–45°N and east of 40°W (Figure 1) were downloaded (GLODAP v2022; Key et al., 2015; Olsen et al., 2016) and compared with the estimated values using Equations (6)–(8). The deviations between the measured and predicted values for each variable were found to be within 9.8 µmol kg−1, 10.3 µmol kg−1 and 0.024 pH, respectively. Furthermore, if the area was restricted to 20°N–35°N and 10°W–30°W (Figure 1, data inside the black line), in the eastern North Atlantic influenced also by North African upwelled waters, the average differences between the predicted and measured (XPre − Xmed) values at every observation point and for the full depth profile were 0.55 ± 6.96 µmol kg−1 for ΔAT (n=2133), 1.75 ± 7.26 µmol kg−1 for ΔCT (n = 1935) and −0.006 ± 0.019 for ΔpHT,is (n = 1851).
As indicated in Table 2, the hydrographic properties have changed along the water column during the 1995–2019 period, and if we apply Equations (6)–(11) to the observational data for the year 2019 and to the average conditions for the years 1995–1996, any change in the predicted concentrations will provide the change in ocean background or the non-steady state (nbc) signal (McNeil and Matear, 2013) (Equation 13).
Considering the observed trends and errors of measured carbonate variables for the period 1995–2019 (Table 2) and applying Equation (13) for each of the predicted values (Equations 6–11), an estimation of the anthropogenic changes in ESTOC and North-East Atlantic water column carbonate variables can also be determined without using any stoichiometric relationships (Friis et al., 2005; Watanabe et al., 2020). For the anthropogenic inorganic carbon concentration, Equation (14) indicates
Differences in ΔNCAnt between data determined using the TrOCA approach and the parameterization technique along the water column (Table 2) were within −0.14 ± 0.13 μmol kg−1 yr−1. Higher rates of increase determined through the parameterization technique comparing singles years are in accordance with the increased rate of change in all the parameters at ESTOC when 10 or 15 years of data were considered. This could be due to decadal variability in the North East Atlantic but also to the increase in atmospheric CO2 rates since the preindustrial era to 1.5 ± 0.11 µatm yr−1 in the 90s to 2.36 ± 0.17 µatm yr−1 for the years 2019–2020 (https://gml.noaa.gov/ccgg/trends/gl_gr.html , last visit 20/04/2023).
The 1995-2019 average detrended trends for ocean acidification variables pHT and [CO32] in the first 100 m at ESTOC are ΔpHT,21 = −0.002 ± 0.0001 pH yr−1 and Δ[CO32-] = − 0.81 ± 0.03 μmol kg−1 yr−1. These rates are also accompanied by important changes in the [HCO3−] that increases by 1.8 ± 0.1 μmol kg−1 yr−1 and in the corresponding carbonate saturation states, with decreases in ΔΩCal = −0.019 ± 0.001 yr−1 and ΔΩAra = −0.012 ± 0.001 yr−1 (Table 2). Although warming leads to an increase in Ω, the temperature rise in surface water has a minimal impact on the overall change in Ω. At ESTOC, the variations in Ω are primarily driven by changes in NCT. The parameterization of ocean pHT,is in ESTOC (Equation 9) has an uncertainty of 0.009 pH that increased to 0.019 for the eastern north Atlantic GLODAP data. Decadal observational data show a decreasing trend of ocean pH of about ~ 0.020 pH decade. Therefore, the temporal distribution of ocean acidification based on at least decadal observations could use the above equations to clarify the temporal distribution of ocean acidification. Moreover, the results based on ESTOC data are in the range of the trends deduced from reconstructed pCO2 monthly fields based on neural network model (pCO2 trend = +1.91 µatm yr−1 and pH trend = -0.019/decade around ESTOC for 1985-2021 (Chau et al., 2022)). Based on a model at higher resolution, Chau et al. (2023) estimated a pH trend of -0.018 ( ± 0.002)/decade at ESTOC for the period 1995-2012 and ΩAra trend of -0.103 ( ± 0.031)/decade.
When normalized pHT,21 data are considered, the change in direct anthropogenic ocean pH (pHT,21Ant), (Figure 5C), can be estimated using Equation (15) (combining Equations 12 and 13)
Moreover, biological contribution to the pHT,21 could be removed applying Equation (16) (Flecha et al., 2019)
and the contribution of anthropogenic and natural drivers, that is the non-biological pHT,21 processes, pHT,21NB, could be estimated using Equation (17).
ΔpHT,21Pre contributed to observed trends in the full water column by −0.0001 ± 0.0003. Therefore, the differences between computed anthropogenic ocean pH by Equations (15) and (17) are due to changes in the biological contribution related to AOU values (Figure 5C). The DO has decreased in ENACW, while in the NADW domain the DO has increased (Figure 5B) which increases and decreases, respectively, the corresponding AOU independently of changes in the remineralization processes. This explains the differences in anthropogenic and measured rates observed in both regions.
In the 1994–2004 period (González-Dávila et al., 2010), the rates of acidification along the water column were statistically significant at a 95% confidence level for the first 1000 m, where the pHT decreases at a rate of −0.0008 ± 0.0003 pH yr−1, having increased to the −0.0012 ± 0.0003 pH yr−1 rate computed in this work. At this depth, the ΔpHT,21Ant and ΔpHT,21NB were 0.0010 ± 0.0003 pH yr−1 for the period 1995–2005, increasing to 0.0013 ± 0.0004 pH yr−1 for 1995–2019, which is consistent with the calculated trends of oceanic pH decline (Figure 5C). Table 2 indicates that rates of change in all the carbonate variables were significant at a 95% confidence for the whole water profile. The consistency between observed and anthropogenic rates indicates that change in the natural background component ΔpHT,21Pre is small; hence, the decreasing trend of observed pHT,21 and other variables along the water column in the eastern subtropical ESTOC region is dominated by anthropogenically induced changes.
The analysis of 25 years of data at ESTOC has shown a clear increase in the fCO2 content of surface waters, which can be attributed to the changes in atmospheric fCO2 resulting from the release of anthropogenic CO2. Consequently, the surface CT increased by 1.17 ± 0.07 µmol kg−1 and pHT and [CO32−] declined at a rate of 0.002 ± 0.0001 pH yr−1 and 0.80 ± 0.04 µmol kg−1 yr−1 in the first 100 m. The surface value of fCO2 has increased by 52.5 µatm in the last 25 years while the pHT has declined in 0.051 units and ΩCal and ΩAra decreased 0.48 ± 0.02 and 0.31 ± 0.01, respectively. These rates are 20% higher than values determined for the period 1995–2010. Due to different rates of increase in fCO2 in seawater and in the atmosphere, it is predicted that by the year 2040, all the climatological fCO2 seawater values will be lower than the atmospheric ones and the area will be acting as a sink throughout the whole year. The strength of this sink will also be affected by changes in the Trade Winds regime related to climate change variability. The increase of the CO2 sink was also previously observed in the North-Eastern Atlantic region (Macovei et al, 2020) suggesting this is a response at large scale in this domain (e.g., Schuster et al, 2013; Rödenbeck et al, 2022).
Significant changes were also observed in the whole water profile, showing decadal changes with values at 1000 m where the pHT decreased at a rate of 0.0012 ± 0.0003 pH yr−1 compared to 0.0008 ± 0.0003 pH yr−1 for the 1995–2005 period. Changes in the carbonate variables also tracked changes in DO in the ENACW (decrease) and NADW (increase). The saturation horizon for aragonite has moved from depths of around 2560 m in 1995 to 2460 m in 2019.
We obtained parameterizations for the whole ESTOC profile to determine changes in the vertical distributions of AT, CT, pHT and fCO2 by using DO, potential temperature, and salinity during the period 1995–2004. The standard errors of estimation were 6.5 µmol kg−1, 6.8 µmol kg−1, 0.010 pH and 9.6 µatm, respectively. When applied to GLODAP data centered at ESTOC for the North-East Atlantic it was possible to reconstruct vertical distributions within 0.55 ± 6.96 µmol kg−1 for AT (n=2133), 1.75 ± 7.26 µmol kg−1 for CT (n = 1935) and −0.006 ± 0.019 for pHT,is (n = 1851). These relationships can also be applied to sensor data from Argo profiling floats in the region to compute natural background variability and anthropogenic changes if carbonate variables are known.
In the future, the increase in anthropogenic CO2 will change the rate of acidification as the ratio AT/CT and R continue to vary, making it necessary to continue monitoring their behavior. The interplay between this process and the combined effects of surface water warming and alterations in the largescale overturning circulation of the upper ocean, driven by interannual to decadal modes of climate variability, will collectively shape the overall dynamics. The convergence of these processes will drive changes in carbon transport to the deeper ocean and the spatio-temporal distribution of ocean carbonate species, making the use of long-term carbon time series even more important.
The datasets presented in this study can be found in online repositories. The names of the repository/repositories and accession number(s) can be found below: https://doi.org/10.1594/PANGAEA.959856, https://doi.pangaea.de/10.1594/PANGAEA.856590, https://doi.pangaea.de/10.1594/PANGAEA.856615, https://doi.pangaea.de/10.1594/PANGAEA.856608, https://doi.pangaea.de/10.1594/PANGAEA.856616, https://doi.pangaea.de/10.1594/PANGAEA.856593, https://doi.pangaea.de/10.1594/PANGAEA.856612, https://doi.pangaea.de/10.1594/PANGAEA.856614, https://doi.pangaea.de/10.1594/PANGAEA.856607, https://doi.pangaea.de/10.1594/PANGAEA.956272.
Both authors contributed to the analysis of data, designed the study and wrote the manuscript. Both authors contributed to the article and approved the submitted version.
This publication was supported by the Canary Islands Government and the Loro Parque Foundation through the CanBIO project, CanOA subproject (2019–2022), and the Consejería de Transición Ecológica, Lucha contra el Cambio Climático y Planificación Territorial del Gobierno de Canarias.
The authors thank all the participants in the cruises, together with the masters, officers and crew of the several research vessels who have lent their support to the cruises over the years. We thank all the researchers and technicians, members of the QUIMA group at IOCAG, who have helped in the seawater sampling and analysis. We would also like to thank Dr. Andres Cianca, Dr. Octavio Llinás and all the members of the Instituto Canario de Ciencias Marinas and later to the Canary Island Oceanic Platform, PLOCAN, for their efforts to keep running this infrastructure and for physical and dissolved oxygen concentrations data. We thank all the EU projects which partially have supported the observations carried out by the QUIMA group at the IOCAG-ULPGC in ESTOC (CANIGO, CARBOOCEAN, CARBOCHANGE, EUROSITES, ATLANTOS).
The authors declare that the research was conducted in the absence of any commercial or financial relationships that could be construed as a potential conflict of interest.
All claims expressed in this article are solely those of the authors and do not necessarily represent those of their affiliated organizations, or those of the publisher, the editors and the reviewers. Any product that may be evaluated in this article, or claim that may be made by its manufacturer, is not guaranteed or endorsed by the publisher.
Álvarez M., Ríos A. F., Pérez F. F., Bryden H. L., Rosón G. (2003). Transports and budgets of total inorganic carbon in the subpolar and temperate North Atlantic. Global Biogeochem Cycles 17, 2-1-2–2-121. doi: 10.1029/2002GB001881
Anderson L. A., Sarmiento J. L. (1994). Redfield ratios of remineralization determined by nutrient data analysis. Global Biogeochem Cycles 8, 65–80. doi: 10.1029/93GB03318
Arzel O., Huck T., Colin de Verdière A. (2018). The internal generation of the atlantic ocean interdecadal variability. J. Clim 31, 6411–6432. doi: 10.1175/JCLI-D-17-0884.1
Bates N., Astor Y., Church M., Currie K., Dore J., González-Dávila M., et al. (2014). A time-series view of changing ocean chemistry due to ocean uptake of anthropogenic CO2 and ocean acidification. Oceanography 27, 126–141. doi: 10.5670/oceanog.2014.16
Bates N. R., Best M. H. P., Neely K., Garley R., Dickson A. G., Johnson R. J. (2012). Detecting anthropogenic carbon dioxide uptake and ocean acidification in the North Atlantic Ocean. Biogeosciences 9, 2509–2522. doi: 10.5194/bg-9-2509-2012
Bates N. R., Johnson R. J. (2020). Acceleration of ocean warming, salinification, deoxygenation and acidification in the surface subtropical North Atlantic Ocean. Commun. Earth Environ. 1, 33. doi: 10.1038/s43247-020-00030-5
Bopp L., Resplandy L., Orr J. C., Doney S. C., Dunne J. P., Gehlen M., et al. (2013). Multiple stressors of ocean ecosystems in the 21st century: projections with CMIP5 models. Biogeosciences 10, 6225–6245. doi: 10.5194/bg-10-6225-2013
Borges A. V., Tilbrook B., Metzl N., Lenton A., Delille B. (2008). Inter-annual variability of the carbon dioxide oceanic sink south of Tasmania. Biogeosciences 5, 141–155. doi: 10.5194/bg-5-141-2008
Caldeira K., Wickett M. E. (2003). Anthropogenic carbon and ocean pH. Nature 425, 365–365. doi: 10.1038/425365a
Chau T. T. T., Gehlen M., Chevallier F. (2022). A seamless ensemble-based reconstruction of seuface ocean pCO2 and air-sea CO2 fluxes over the flobal coastal and open oceans. Biogesociences 19, 1087–1109. doi: 10.5194/bg-19-1087-2022
Chau T.-T.-T., Gehlen M., Metzl N., Chevallier F. (2023). CMEMS-LSCE: A global 0.25-degree, monthly reconstruction of the surface ocean carbonate system. Earth Syst. Sci. Data Discuss.doi: 10.5194/essd-2023-146
Cianca A., Helmke P., Mouriño B., Rueda M. J., Llinás O., Neuer S. (2007). Decadal analysis of hydrography and in situ nutrient budgets in the western and eastern North Atlantic subtropical gyre. J. Geophys Res. 112, C07025. doi: 10.1029/2006JC003788
Cianca A., Santana R., Hartman S. E., Martín-González J. M., González-Dávila M., Rueda M. J., et al. (2013). Oxygen dynamics in the North Atlantic subtropical gyre. Deep Sea Res. 2 Top. Stud. Oceanogr 93. doi: 10.1016/j.dsr2.2013.01.004
Curbelo-Hernández D., González-Dávila M., González A. G., González-Santana D., Santana-Casiano J. M. (2021). CO2 fluxes in the Northeast Atlantic Ocean based on measurements from a surface ocean observation platform. Sci. Total Environ. 775, 145804. doi: 10.1016/j.scitotenv.2021.145804
Currie K. I., Reid M. R., Hunter K. A. (2011). Interannual variability of carbon dioxide drawdown by subantarctic surface water near New Zealand. Biogeochemistry 104, 23–34. doi: 10.1007/s10533-009-9355-3
Denman K. L., Brasseur G. P., Ciais P., Cox P. M. (2007) Couplings between changes in the climate system and biogeochemistry. Available at: https://www.researchgate.net/publication/224942928.
de Vernal A., Hillaire-Marcel C. (2000). Sea-ice cover, sea-surface salinity and halo-/thermocline structure of the northwest North Atlantic: modern versus full glacial conditions. Quat Sci. Rev. 19, 65–85. doi: 10.1016/S0277-3791(99)00055-4
Dickson A. G. (1996). “Determination of dissolved oxygen in seawater by Winkler titration,” in WOCE operations manual. Volume 3: the observational programme. Volume 3. Section 3.1: WOCE hydrographic programme. Part 3.1.3: WHP operations and methods (Massachusetts, USA: World Ocean Circulation Experiment, Woods Hole).
Dickson A. G., Millero F. J. (1987). A comparison of the equilibrium constants for the dissociation of carbonic acid in seawater media. Deep Sea Res. Part A. Oceanographic Res. Papers 34, 1733–1743. doi: 10.1016/0198-0149(87)90021-5
Doney S. C., Fabry V. J., Feely R. A., Kleypas J. A. (2009). Ocean Acidification: The other CO2 problem. Ann. Rev. Mar. Sci. 1, 169–192. doi: 10.1146/annurev.marine.010908.163834
Dore J. E., Lukas R., Sadler D. W., Church M. J., Karl D. M. (2009). Physical and biogeochemical modulation of ocean acidification in the central North Pacific. Proc. Natl. Acad. Sci. 106, 12235–12240. doi: 10.1073/pnas.0906044106
Flecha S., Pérez F. F., Murata A., Makaoui A., Huertas I. E. (2019). Decadal acidification in Atlantic and Mediterranean water masses exchanging at the Strait of Gibraltar. Sci. Rep. 9, 15533. doi: 10.1038/s41598-019-52084-x
Friedlingstein P., O’Sullivan M., Jones M. W., Andrew R. M., Gregor L., Hauck J., et al. (2022). Global carbon budget 2022. Earth Syst. Sci. Data 14, 4811–4900. doi: 10.5194/essd-14-4811-2022
Friis K., Körtzinger A., Pätsch J., Wallace D. W. R. (2005). On the temporal increase of anthropogenic CO2 in the subpolar North Atlantic. Deep Sea Res. Part I: Oceanographic Res. Papers 52, 681–698. doi: 10.1016/j.dsr.2004.11.017
Gao K., Gao G., Wang Y., Dupont S. (2020). Impacts of ocean acidification under multiple stressors on typical organisms and ecological processes. Mar. Life Sci. Technol. 2, 279–291. doi: 10.1007/s42995-020-00048-w
González-Dávila M., Santana-Casiano J. M., González-Dávila E. F. (2007). Interannual variability of the upper ocean carbon cycle in the northeast Atlantic Ocean. Geophys Res. Lett. 34, L07608. doi: 10.1029/2006GL028145
González-Dávila M., Santana-Casiano J. M., Rueda M. J., Llinás O. (2010). The water column distribution of carbonate system variables at the ESTOC site from 1995 to 2004. Biogeosciences 7, 3067–3081. doi: 10.5194/bg-7-3067-2010
González-Dávila M., Santana-Casiano J. M., Rueda M.-J., Llinás O., González-Dávila E.-F. (2003). Seasonal and interannual variability of sea-surface carbon dioxide species at the European Station for time series in the Ocean at the Canary Islands (ESTOC) between 1996 and 2000. Global Biogeochem Cycles 17, 1076. doi: 10.1029/2002GB001993
Gruber N. (2011). Warming up, turning sour, losing breath: ocean biogeochemistry under global change. Philos. Trans. R. Soc. A: Mathematical Phys. Eng. Sci. 369, 1980–1996. doi: 10.1098/rsta.2011.0003
Hauck J., Zeising M., Le Quéré C., Gruber N., Bakker D. C. E., Bopp L., et al. (2020). Consistency and challenges in the ocean carbon sink estimate for the global carbon budget. Front. Mar. Sci. 7. doi: 10.3389/fmars.2020.571720
Jenkins W. J., Smethie W. M., Boyle E. A., Cutter G. A. (2015). Water mass analysis for the U.S. GEOTRACES (GA03) North Atlantic sections. Deep Sea Res. Part II: Topical Stud. Oceanography 116, 6–20. doi: 10.1016/j.dsr2.2014.11.018
Kessler A., Goris N., Lauvset S. K. (2022). Observation-based Sea surface temperature trends in Atlantic large marine ecosystems. Prog. Oceanogr 208, 102902. doi: 10.1016/j.pocean.2022.102902
Key R. M., Olsen A., Van Heuven S., Lauvset S. K., Velo A., Lin X., et al. (2015). doi: 10.3334/CDIAC/OTG.NDP093_GLODAPv2
Koelling J., Atamanchuk D., Karstensen J., Handmann P., Wallace D. W. R. (2022). Oxygen export to the deep ocean following Labrador Sea Water formation. Biogeosciences 19, 437–454. doi: 10.5194/bg-19-437-2022
Krasheninnikova S. B., Demidov A. N., Ivanov A. A. (2021). Variability of the characteristics of the antarctic bottom water in the subtropical north atlantic. Oceanology (Wash D C) 61, 151–158. doi: 10.1134/S0001437021020090
Lee K., Wanninkhof R., Feely R. A., Millero F. J., Peng T.-H. (2000). Global relationships of total inorganic carbon with temperature and nitrate in surface seawater. Global Biogeochem Cycles 14, 979–994. doi: 10.1029/1998GB001087
Lenton T. M., Livina V. N., Dakos V., van Nes E. H., Scheffer M. (2012). Early warning of climate tipping points from critical slowing down: comparing methods to improve robustness. Philos. Trans. R. Soc. A: Mathematical Phys. Eng. Sci. 370, 1185–1204. doi: 10.1098/rsta.2011.0304
Li B., Watanabe Y. W., Yamaguchi A. (2016). Spatiotemporal distribution of seawater pH in the North Pacific subpolar region by using the parameterization technique. J. Geophys Res. Oceans 121, 3435–3449. doi: 10.1002/2015JC011615
Lueker T. J., Dickson A. G., Keeling C. D. (2000). Ocean pCO2 calculated from dissolved inorganic carbon, alkalinity, and equations for K1 and K2: validation based on laboratory measurements of CO2 in gas and seawater at equilibrium. Mar. Chem. 70, 105–119. doi: 10.1016/S0304-4203(00)00022-0
Macdonald A. M., Baringer M. O., Wanninkhof R., Lee K., Wallace D. W. R. (2003). A 1998–1992 comparison of inorganic carbon and its transport across 24.5°N in the Atlantic. Deep Sea Res. Part II: Topical Stud. Oceanography 50, 3041–3064. doi: 10.1016/j.dsr2.2003.07.009
Macovei V. A., Hartman S. E., Schuster U., Torres-Valdés S., Moore C. M., Sanders R. J. (2020). Impact of physical and biological processes on temporal variations of the ocean carbon sink in the mid-latitude North Atlantic, (2002–2016). Prog. Oceanography 180. doi: 10.1016/j.pocean.2019.102223
Matear R. J., Wong C. S., Xie L. (2003). ). Can CFCs be used to determine anthropogenic CO2? Global Biogeochem Cycles 17, 1013. doi: 10.1029/2001GB001415
McNeil B. I., Matear R. J. (2013). The non-steady state oceanic CO2 signal: its importance, magnitude and a novel way to detect it. Biogesociences 10, 2219–2228. doi: 10.5194/bg-10-2219-2013
Mehrbach C., Culberson C. H., Hawley J. E., Pytkowicx R. M. (1973). Measurement of the apparent dissociation constants of carbonic acid in seawater at atmospheric pressure. Limnol Oceanogr 18, 897–907. doi: 10.4319/lo.1973.18.6.0897
Metzl N., Lo Monaco C., Leseurre C., Ridame C., Fin J., Mignon C., et al. (2022). The impact of the South-East Madagascar Bloom on the oceanic CO2 sink. Biogeosciences 19, 1451–1468. doi: 10.5194/bg-19-1451-2022
Millero F. J., Lee K., Roche M. (1998). ). Distribution of alkalinity in the surface waters of the major oceans. Mar. Chem. 60, 111–130. doi: 10.1016/S0304-4203(97)00084-4
Mintrop L., Pérez F. F., González-Dávila M., Santana-Casiano J. M., Körtzinger A. (2000). Alkalinity determination by potentiometry: Intercalibration using three different methods. Cienc Mar. 26, 23–37. doi: 10.7773/cm.v26i1.573
Neuer S., Cianca A., Helmke P., Freudenthal T., Davenport R., Meggers H., et al. (2007). Biogeochemistry and hydrography in the eastern subtropical North Atlantic gyre. Results from the European time-series station ESTOC. Prog. Oceanogr 72, 1–29. doi: 10.1016/j.pocean.2006.08.001
Olsen A., Key R. M., van Heuven S., Lauvset S. K., Velo A., Lin X., et al. (2016). The Global Ocean Data Analysis Project version 2 (GLODAPv2) – an internally consistent data product for the world ocean. Earth Syst. Sci. Data 8, 297–323. doi: 10.5194/essd-8-297-2016
Orr J. C., Fabry V. J., Aumont O., Bopp L., Doney S. C., Feely R. A., et al. (2005). Anthropogenic ocean acidification over the twenty-first century and its impact on calcifying organisms. Nature 437, 681–686. doi: 10.1038/nature04095
Pérez F. F., Mercier H., Vázquez-Rodríguez M., Lherminier P., Velo A., Pardo P. C., et al. (2013). Atlantic Ocean CO2 uptake reduced by weakening of the meridional overturning circulation. Nat. Geosci 6, 146–152. doi: 10.1038/ngeo1680
Pérez F. F., Mintrop L., Llinás O., Glez-Dávila M., Castro C. G., Alvarez M., et al. (2001). Mixing analysis of nutrients, oxygen and inorganic carbon in the Canary Islands region. J. Mar. Syst. 28, 183–201. doi: 10.1016/S0924-7963(01)00003-3
Pérez F. F., Vázquez-Rodríguez M., Mercier H., Velo A., Lherminier P., Ríos A. F. (2010). Trends of anthropogenic CO2 storage in North Atlantic water masses. Biogeosciences 7, 1789–1807. doi: 10.5194/bg-7-1789-2010
Pierrot D., Lewis E., Wallace D. W. R. (2006). “MS excel program developed for CO2 system calculations,” in ORNL/CDIAC-105a. Carbon dioxide information analysis center (Oak Ridge, Tennessee: Oak Ridge National Laboratory, U.S. Department of Energy). doi: 10.3334/CDIAC/otg.CO2SYS_XLS_CDIAC105a
Revelle R., Suess H. E. (1957). Carbon dioxide exchange between atmosphere and ocean and questions of an increase of atmospheric CO2 during the past decades. Tellus 9, 18–27. doi: 10.3402/tellusa.v9i1.9075
Riebesell U., Zondervan I., Rost B., Tortell P. D., Zeebe R. E. (2000). Reduced calcification of marine plankton in response to increased atmospheric CO2. M. M.Nature 407, 364–367. doi: 10.1038/35030078
Rödenbeck C., DeVries T., Hauck J., Le Quéré C., Keeling R. F. (2022). Data-based estimates of interannual sea–air CO2 flux variations 1957–2020 and their relation to environmental drivers. Biogeosciences 19, 2627–2652. doi: 10.5194/bg-19-2627-2022
Sabine C. L., Feely R. A., Gruber N., Key R. M., Lee K., Bullister J. L., et al. (2004). The oceanic sink for anthropogenic CO 2. Sci. (1979) 305, 367–371. doi: 10.1126/science.1097403
Santana-Casiano J. M., González-Dávila M., Laglera-Baquer L. M., Rodriguez-Somoza M. J. (2001). Carbon dioxide system in the Canary region during October 1995. Sci. Mar. 65. 41–49 doi: 10.3989/scimar.2001.65s141
Santana-Casiano J. M., González-Dávila M., Rueda M.-J., Llinás O., González-Dávila E.-F. (2007). The interannual variability of oceanic CO2 parameters in the northeast Atlantic subtropical gyre at the ESTOC site. Global Biogeochem Cycles 21, GB1015. doi: 10.1029/2006GB002788
Schlitzer R. (2021) Ocean data view. Available at: https://odv.awi.de.
Schuster U., McKinley G. A., Bates N., Chevallier F., Doney S. C., Fay A. R., et al. (2013). An assessment of the Atlantic and Arctic sea-air CO2 Fluxes 1990-2009. Biogeosciences 10, 607–627. doi: 10.5194/bg-10-607-2013
Skjelvan I., Lauvset S. K., Johannessen T., Gundersen K., Skagseth Ø. (2022). Decadal trends in ocean acidification from the ocean weather station M in the norwegian sea. J. Mar. Syst. 234, 103775. doi: 10.1016/j.jmarsys.2022.103775
Sutton A. J., Battisti R., Carter B., Evans W., Newton J., Alin S., et al. (2022). Advancing best practices for assessing trends of ocean acidification time series. Front. Mar. Sci. 9. doi: 10.3389/fmars.2022.1045667
Taboada F. G., Anadón R. (2012). Patterns of change in sea surface temperature in the North Atlantic during the last three decades: beyond mean trends. Clim Change 115, 419–431. doi: 10.1007/s10584-012-0485-6
Takahashi T., Olafsson J., Goddard J. G., Chipman D. W., Sutherland S. C. (1993). Seasonal variation of CO 2 and nutrients in the high-latitude surface oceans: A comparative study. Global Biogeochem Cycles 7, 843–878. doi: 10.1029/93GB02263
Takahashi T., Sutherland S. C., Chipman D. W., Goddard J. G., Ho C., Newberger T., et al. (2014). Climatological distributions of pH, pCO2, total CO2, alkalinity, and CaCO3 saturation in the global surface ocean, and temporal changes at selected locations. Mar. Chem. 164, 95–125. doi: 10.1016/j.marchem.2014.06.004
Touratier F., Azouzi L., Goyet C. (2007). CFC-11, Δ14C and 3H tracers as a means to assess anthropogenic CO2 concentrations in the ocean. Tellus B 59, 318–325. doi: 10.1111/j.1600-0889.2006.00247.x
Vázquez-Rodríguez M., Touratier F., Lo Monaco C., Waugh D. W., Padin X. A., Bellerby R. G. J., et al. (2009). Anthropogenic carbon distributions in the Atlantic Ocean: data-based estimates from the Arctic to the Antarctic. Biogeosciences 6, 439–451. doi: 10.5194/bg-6-439-2009
Wanninkhof R., Doney S. C., Peng T.-H., Bullister J. L., Lee K., Feely R. A. (1999). Comparison of methods to determine the anthropogenic CO 2 invasion into the Atlantic Ocean. Tellus B Chem. Phys. Meteorol. 51 (2), 511–530. doi: 10.1034/j.1600-0889.1999.00027.x
Watanabe Y. W., Li B. F., Yamasaki R., Yunoki S., Imai K., Hosoda S., et al. (2020). Spatiotemporal changes of ocean carbon species in the western North Pacific using parameterization technique. J. Oceanogr 76, 155–167. doi: 10.1007/s10872-019-00532-7
Watson A. J., Schuster U., Bakker D. C. E., Bates N. R., Corbière A., González-Davila M., et al. (2009). Tracking the variable North Atlantic sink for atmospheric CO2. Sci. (1979) 326, 1391–1393. doi: 10.1126/science.1177394
Wolff G., Sarmiento J. L., Gruber N. (2007). Ocean biogeochemical dynamics. Geol Mag (Princeton, Woodstock) 144, 1034–1034. doi: 10.1017/S0016756807003755
Keywords: time series, ESTOC, ocean acidification, long-term trends, inorganic carbon, anthropogenic carbon
Citation: González-Dávila M and Santana-Casiano JM (2023) Long-term trends of pH and inorganic carbon in the Eastern North Atlantic: the ESTOC site. Front. Mar. Sci. 10:1236214. doi: 10.3389/fmars.2023.1236214
Received: 07 June 2023; Accepted: 25 July 2023;
Published: 14 August 2023.
Edited by:
Adrienne J. Sutton, National Oceanic and Atmospheric Administration (NOAA), United StatesReviewed by:
Wei-Jen Huang, National Sun Yat-sen University, TaiwanCopyright © 2023 González-Dávila and Santana-Casiano. This is an open-access article distributed under the terms of the Creative Commons Attribution License (CC BY). The use, distribution or reproduction in other forums is permitted, provided the original author(s) and the copyright owner(s) are credited and that the original publication in this journal is cited, in accordance with accepted academic practice. No use, distribution or reproduction is permitted which does not comply with these terms.
*Correspondence: Melchor González-Dávila, TWVsY2hvci5nb256YWxlekB1bHBnYy5lcw==; J. Magdalena Santana-Casiano, TWFnZGFsZW5hLnNhbnRhbmFAdWxwZ2MuZXM=
Disclaimer: All claims expressed in this article are solely those of the authors and do not necessarily represent those of their affiliated organizations, or those of the publisher, the editors and the reviewers. Any product that may be evaluated in this article or claim that may be made by its manufacturer is not guaranteed or endorsed by the publisher.
Research integrity at Frontiers
Learn more about the work of our research integrity team to safeguard the quality of each article we publish.