 Jess I. T. Hillman1*
 Sally Joan Watson2,3
 Katherine Leigh Maier2
 Jasper Justus Lutz Hoffmann4,5
 Kyle J. Bland1
 Fynn Warnke4
 Ingo A. Pecher6
 Andrew Robert Gorman7
 Bryan Davy1
 Suzanne Bull1
 Susi Woelz2
- 1Department of Earth Structure and Processes, GNS Science, Lower Hutt, New Zealand
- 2Ocean Geology, National Institute of Water and Atmospheric Research (NIWA), Wellington, New Zealand
- 3Institute of Marine Science, University of Auckland, Auckland, New Zealand
- 4Alfred-Wegener-Institute, Helmholtz Centre for Polar and Marine Research, List, Germany
- 5Marine Geology and Seafloor Surveying Group, Department of Geosciences, University of Malta, Msida, Malta
- 6Department of Physical & Environmental Sciences, Texas A&M University, Corpus Christi, TX, United States
- 7Department of Geology, University of Otago, Dunedin, New Zealand
Seafloor pockmarks are abundant around Aotearoa New Zealand, occurring across a diverse range of tectonic, sedimentological and geomorphological settings. Globally, the formation and source of pockmarks is widely researched because they: 1) have potential links to subsurface hydrocarbon systems, 2) can provide important habitats for benthic organisms and 3) may be indications of fluid escape pathways or areas of sediment disturbance, which influence seafloor stability and could pose a risk to infrastructure. Pockmarks are widely associated with fluid release (such as gas or water) from subsurface reservoirs. However, the formation of pockmarks, the processes that shape and modify their morphology over time, and the relative timing of these events, remains enigmatic. Here, we compile the first national database of over 30,000 pockmarks around Aotearoa New Zealand, allowing us to begin to comprehend the dynamic processes that shape and affect pockmarks by exploring regional and inter-regional patterns in pockmark geometry and seabed characteristics. This compilation reveals several significant trends, including a distinct lack of correlation between active seafloor seeps and pockmarks, and a strong association of pockmarks with mud-rich seafloor substrate. Furthermore, we highlight key knowledge gaps that require further investigation moving forward, including a lack of constraint on the timing of pockmark formation, and limited modelling of the processes involved in their formation.
Introduction
Seafloor depressions, including pockmarks, have been identified in hydroacoustic data since at least 1970, when King and MacLean (1970) described small concave, craterlike depressions occurring on the muddy seafloor of the Scotian Shelf off the Atlantic coast of Canada. Whilst the term ‘pockmark’ is primarily describing a morphology, over time the term has come to be associated with features formed by fluid venting from the seabed into the water column (Whiticar and Werner, 1981; Hovland and Judd, 1988; Paull et al., 2002; Audsley et al., 2019). However, in many circumstances it is very difficult to determine a definitive mechanism of formation, and the connection to fluid flow is assumed. Although numerous focused studies have demonstrated the ubiquity of pockmarks globally, more regional studies of pockmarks across large and diverse areas are needed to investigate common drivers of pockmark formation, due to a lack of coincident data to confirm a fluid seepage origin. In this study, we use the term pockmark to describe seafloor features identified in multibeam bathymetric data as discrete, enclosed depressions. Many of these pockmarks may have been formed as a result of seabed fluid expulsion, but we do not aim to draw definitive links between pockmarks and source fluids in this study. Pockmarks are common morphological features on shelves and slopes worldwide, and have generated considerable interest and debate, particularly as technological advances in seafloor imaging reveal greater detail, and larger areas are mapped (Hovland et al., 2002; Maier et al., 2022). Pockmarks can occur as isolated structures, in clusters or chains, on areas of expansive flat seafloor, or alongside steeply incised canyons. They predominantly occur in fine-grained sediments, in water depths of metres to several thousand metres, and in a wide range of depositional environments (Hovland et al., 2002).
Pockmarks are commonly inferred to result from the erosive power of venting related to overpressured fluids such as gases and (or) interstitial water (Gay et al., 2007; Pilcher and Argent, 2007; Andresen and Huuse, 2011; Hillman et al., 2015). The occurrence of pockmarks is frequently related to subsurface features such as discontinuities that create pathways for fluid migration, further reinforcing the hypothesis of fluid venting induced formation. In this study we also consider processes other than fluid escape that may create enclosed depressions at the seafloor, and that the formation of pockmarks may result from a complex interplay between fluid seepage, biological activity, ocean currents and other factors. For example, turbidity currents scouring the seafloor, and the infilling of abandoned canyons can both generate semi-circular to elongated depressions, and the action of oceanic currents may significantly alter crater-like features formed by alternative mechanisms (Loncke et al., 2004; Heiniö and Davies, 2009; Hillman et al., 2015; Hillman et al., 2018; Wenau et al., 2021; Maier et al., 2022; Warnke et al., 2023; Yu et al., 2023).
Pockmarks around Aotearoa New Zealand were first described by Nelson and Healy (1984) offshore Tairāwhiti Gisborne (Figure 1), in water depths of >15 m in Tūranga-nui-a-Kiwa Poverty Bay (Hovland and Judd, 1988). Subsequent surveys revealed the presence of pockmarks around much of Aotearoa New Zealand. While not all areas have been mapped in detail, transit lines offer some clues as to what may lie in the gaps. In this study we have compiled a database of pockmarks around Aotearoa New Zealand to provide an overview of the characteristics of these diverse features, with a more focused analysis of areas with better data coverage for detailed investigation. This compilation and analysis form the basis of the first national database of pockmarks worldwide. Furthermore, whilst paleopockmarks — those that are buried in the subsurface — have been observed in locations such as offshore Taranaki (Chenrai and Huuse, 2017), the Chatham Rise, and Great South Basin (Davy et al., 2010; Stott et al., 2019; Karaket et al., 2021), and offshore Canterbury and Otago (Hillman et al., 2015; Hoffmann et al., 2019; Micallef et al., 2022) (Figure 1), here we focus only on pockmarks imaged at the present-day seafloor for which other datasets are readily available to investigate modern drivers. This study is unique as it compiles pockmarks across a range of geological and geomorphological regions (Figure 1D), from the tectonically active Hikurangi and South Westland margins to the passive Otago and Taranaki margins (Figure 1A). In doing so, this study will provide: 1) a summary of published pockmark studies around Aotearoa New Zealand, 2) a basis for ongoing research, 3) the first Aotearoa-wide database of pockmarks, and 4) a means to investigate regional and inter-regional trends in pockmark geometry and seabed characteristics to understand the dynamic seafloor processes that form and influence pockmarks.
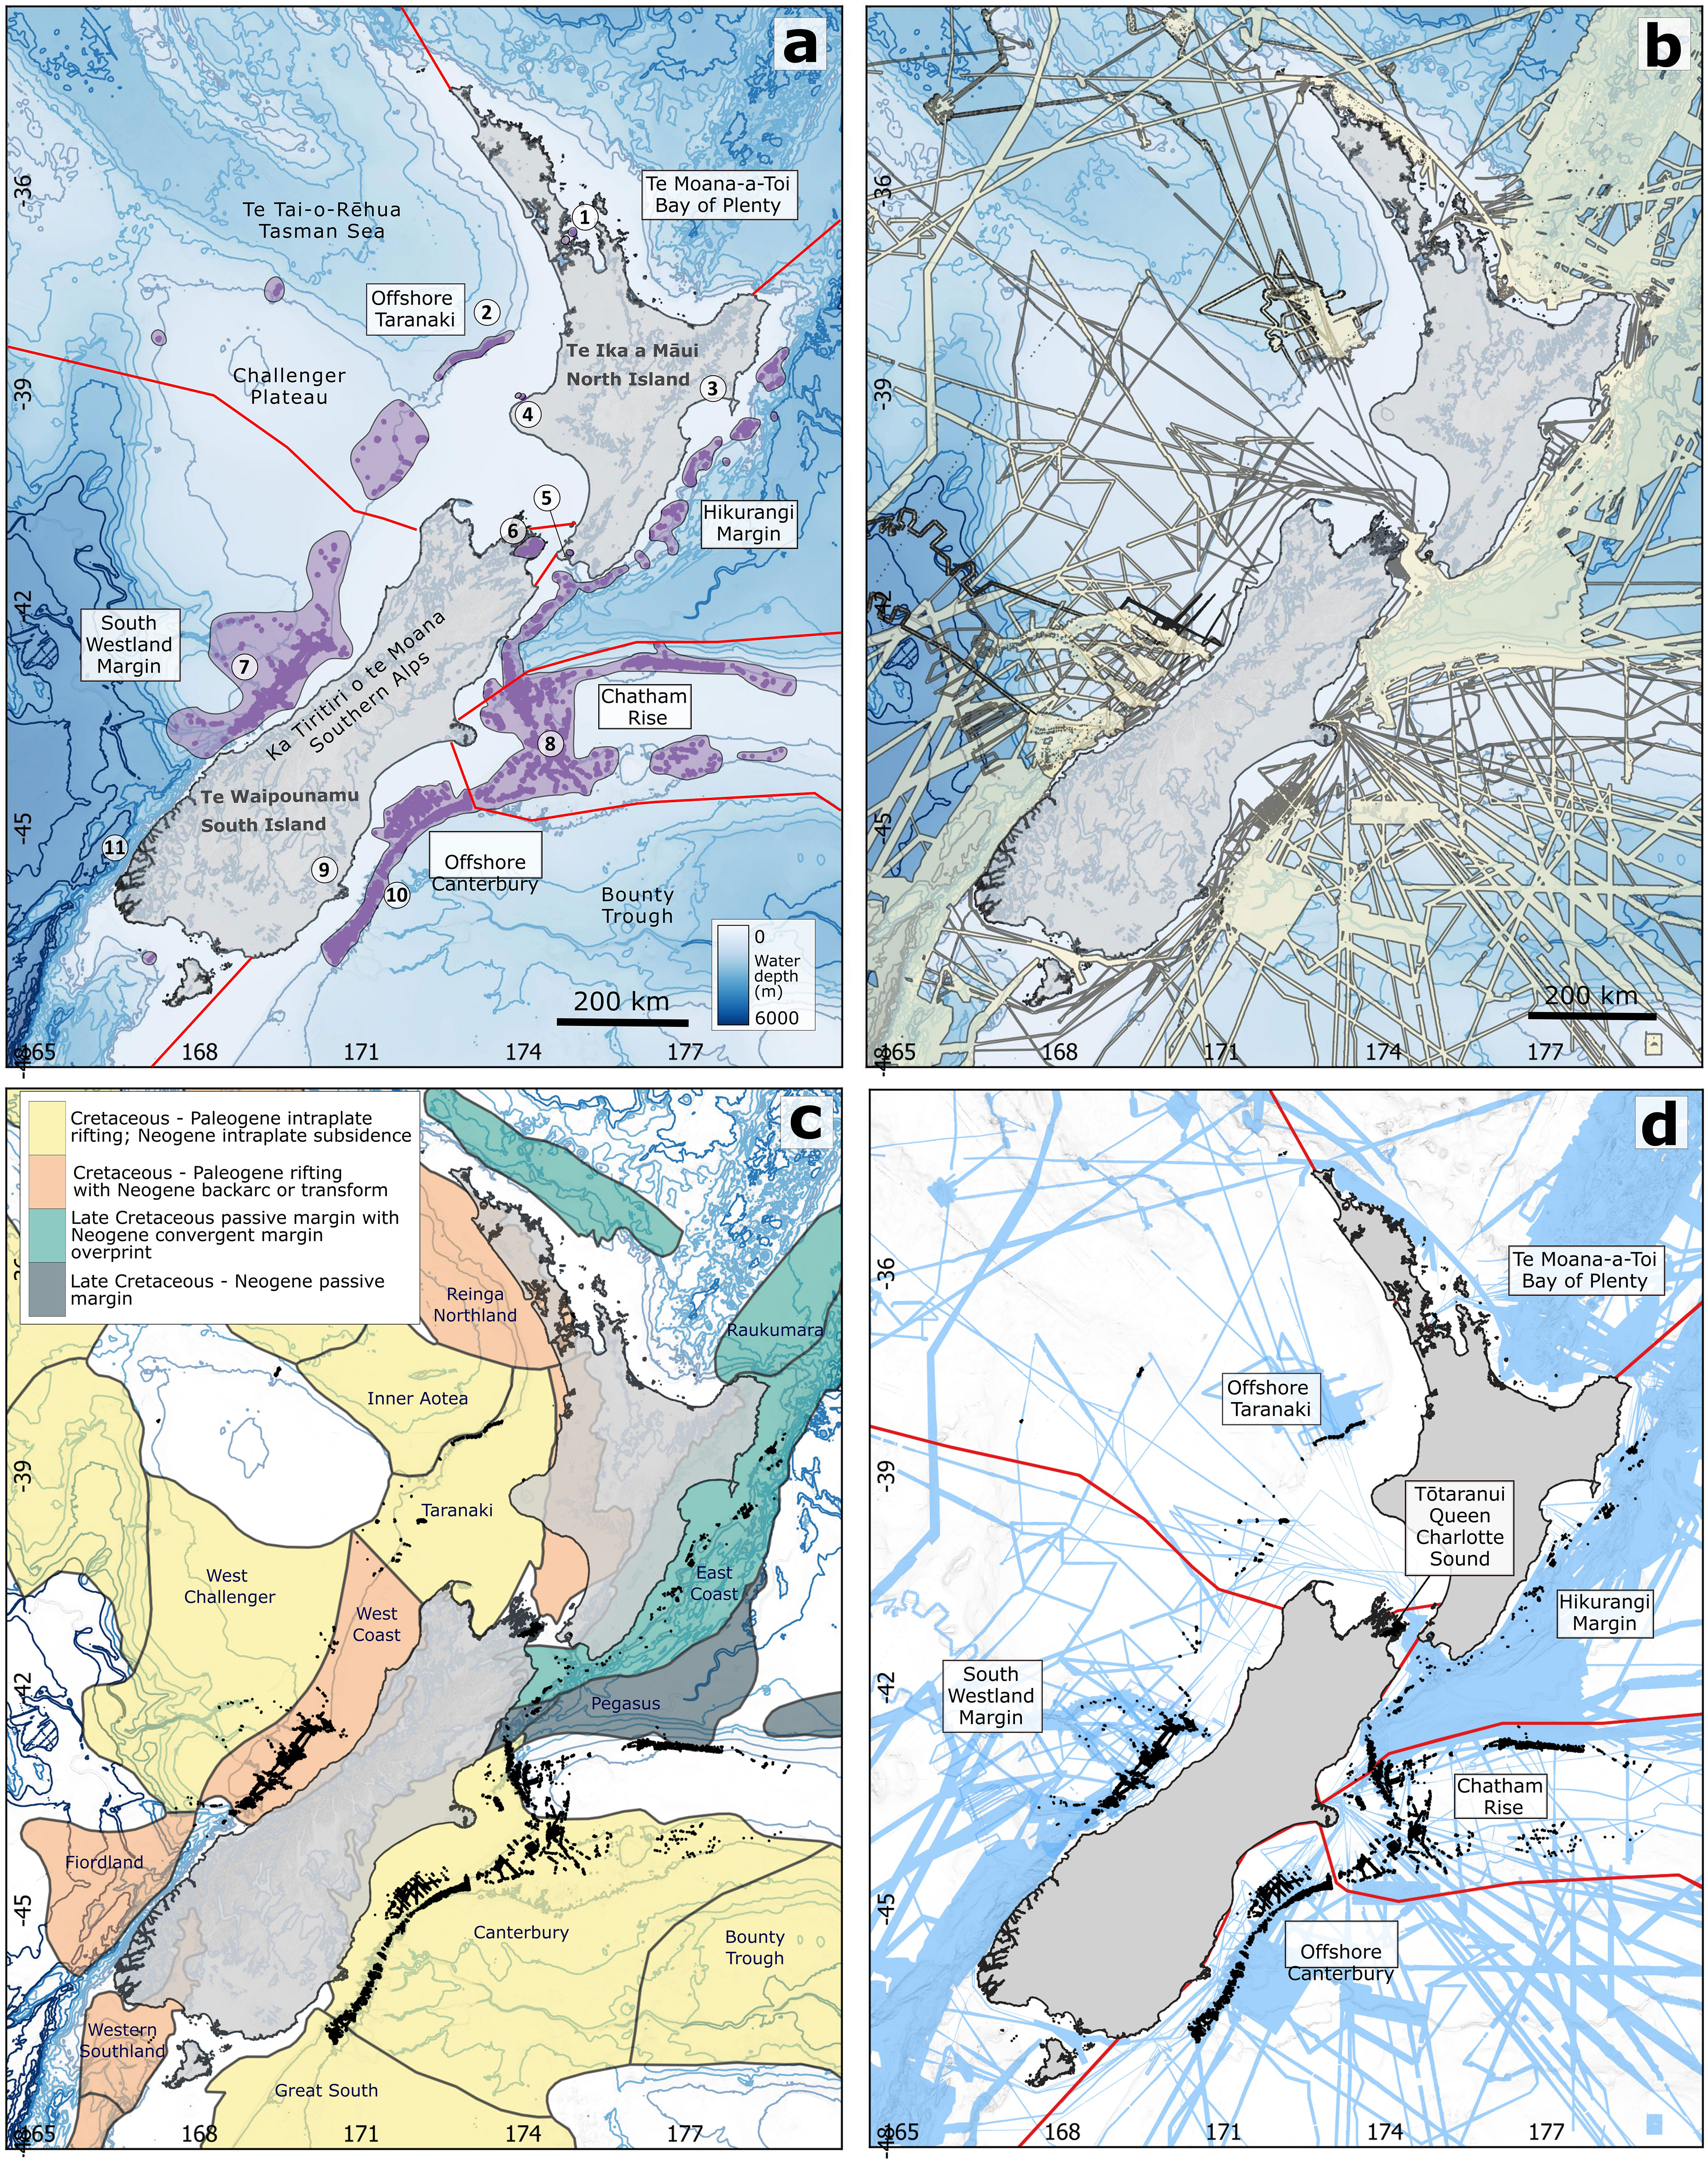
Figure 1 (A) Distribution of pockmarks around Aotearoa New Zealand. Purple dots indicate mapped features, interpolated distribution is shown by purple shaded regions. (1) Hauraki Gulf (2) Inner Aotea Basin (3) Te Tai Rāwhiti Gisborne (4) Ngāmotu New Plymouth (5) Te Whanganui-ā-Tara Wellington (6) Tōtaranui Queen Charlotte Sounds (7) South Westland Canyons (8) Mernoo Saddle (9) Otago (10) Otago Submarine Canyons (11) Fiordland Puysegur Margin. (B) Coverage of multibeam swath mapping data. (C) Sedimentary basins around Aotearoa New Zealand (after Mortimer et al., 2020; Strogen et al., 2022). (D) Location of the offshore regions discussed in this study, bounded by red lines. Black dots indicate mapped pockmarks in (C, D).
Data
In this study we have compiled numerous multibeam bathymetry datasets from around Aotearoa New Zealand and identified pockmarks at the present-day seafloor (Figure 1A). These datasets include dedicated mapping surveys, which tend to be of high quality (e.g., sound velocity profiles applied, calm sea state, survey lines planned according to seafloor morphology) and well processed, in addition to transit datasets where the data quality may be significantly lower. Some datasets (e.g., transit data) require cleaning and processing to identify pockmark features accurately, and such work lies outside the scope of the current project. Only 34% of the seafloor within the Exclusive Economic Zone (EEZ) of Aotearoa New Zealand has been mapped by the multibeam bathymetry datasets available in this study (Figure 1B); there is therefore an element of data bias as some areas have far better coverage than others. Bathymetric data used in this study are gridded at between 2–50 m cell size (see Table 1 for more details), depending on data quality, water depth and echosounder capabilities. The average resolution from the coastline to the first contour (<500 m water depth) (Figure 1A) is 25 m, beyond the first contour (>500 m water depth) the average resolution is 25–50 m. For the wider regional context, we utilised the bathymetric grid available online through the E Tūhura – Explore Zealandia data portal (https://data.gns.cri.nz/tez) – a research data compilation that includes all publicly available bathymetric data around Aotearoa New Zealand, gridded at a resolution of 50 m. The average resolution for multibeam bathymetry data grids is 25 m, so it is therefore not possible to identify smaller features (roughly 4x4 pixels = 100 m x 100 m in size), which introduces an element of data bias into our interpretations. Data analysis for this study was carried out in ArcGIS™ and QGIS software packages. Whilst water column imaging and multibeam backscatter data are also valuable tools in the identification of seafloor features such as pockmarks, these are not as widely available across the region. Such datasets also require more intensive processing, and it can be difficult to compare the results across surveys acquired with different instruments. Therefore, to have a regionally extensive, consistent dataset we have only included multibeam bathymetric data in this study.
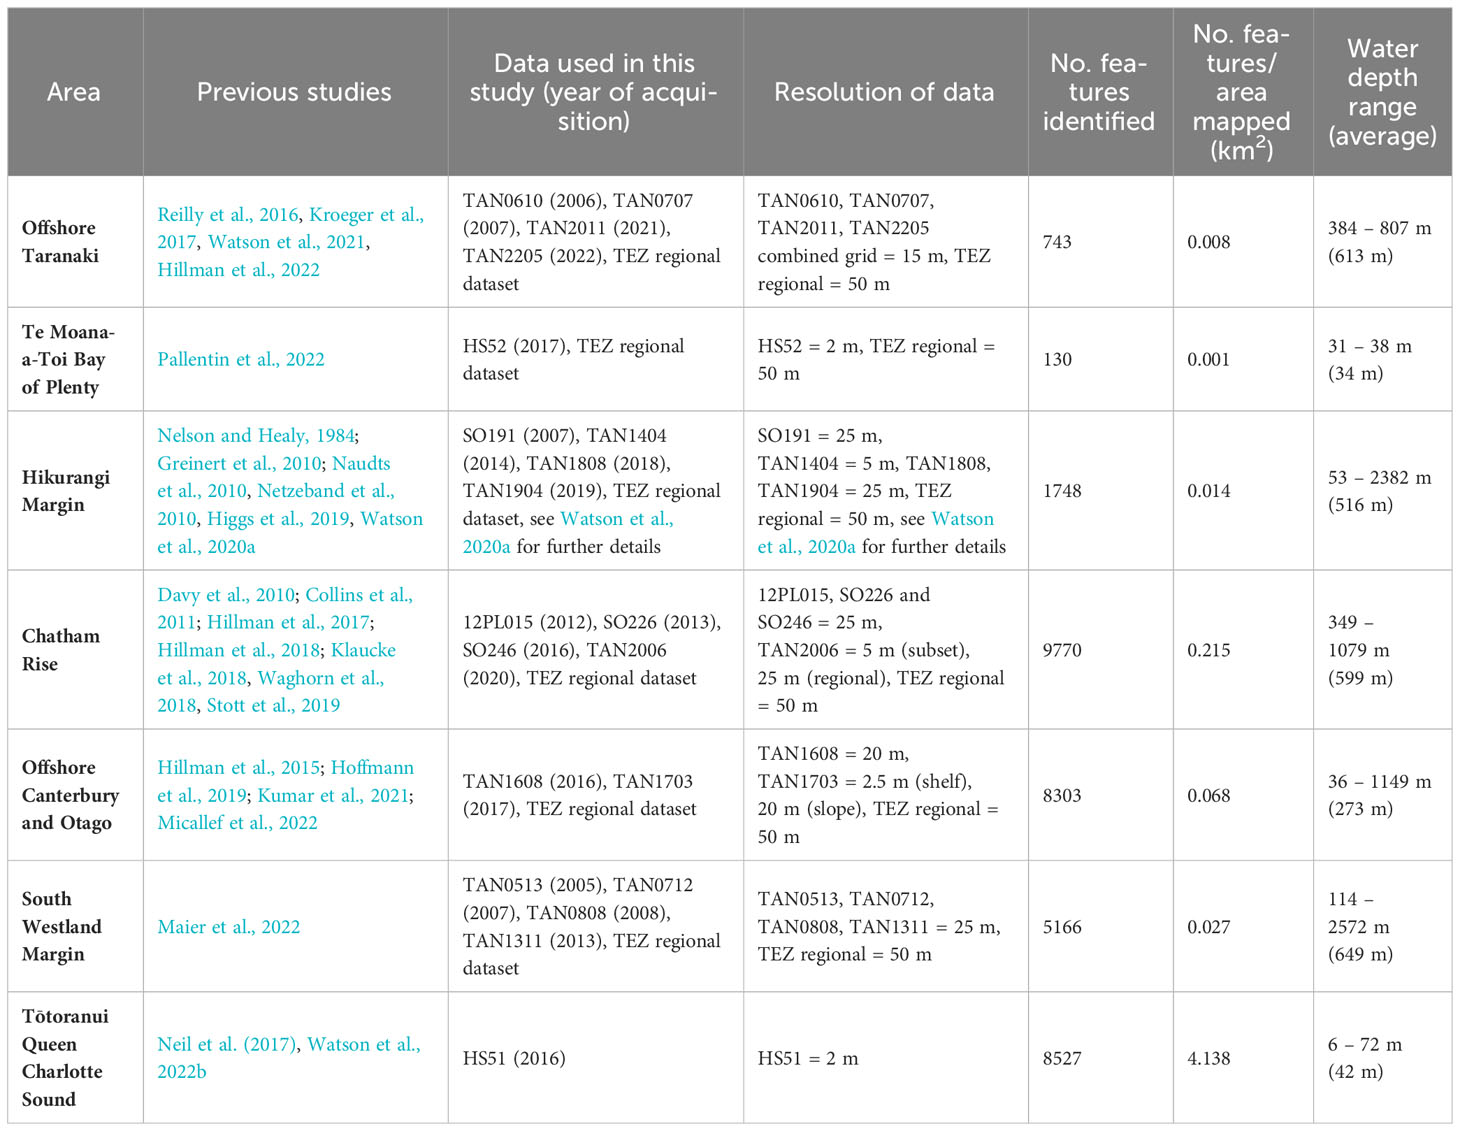
Table 1 Summary of previous studies and datasets across the seven offshore regions discussed in this study.
By drawing on existing datasets such as those published by Watson et al. (2020a), Maier et al. (2022) and Micallef et al., (2022), we have established a comprehensive overview of pockmarks around Aotearoa New Zealand. Table 1 summarises the regions covered in this study and previous publications on pockmarks in these areas. The study area around Aotearoa New Zealand has been divided into five broad sections for the purposes of discussion here (Figure 1D), spanning an area of 2.5 × 10⁵ km2, and encompassing different tectonic, sedimentary, and geomorphologic environments (Table 2). The diverse nature of this dataset, and its resulting insights, thereby have global implications, that are applicable to a wide range of situations and contexts.
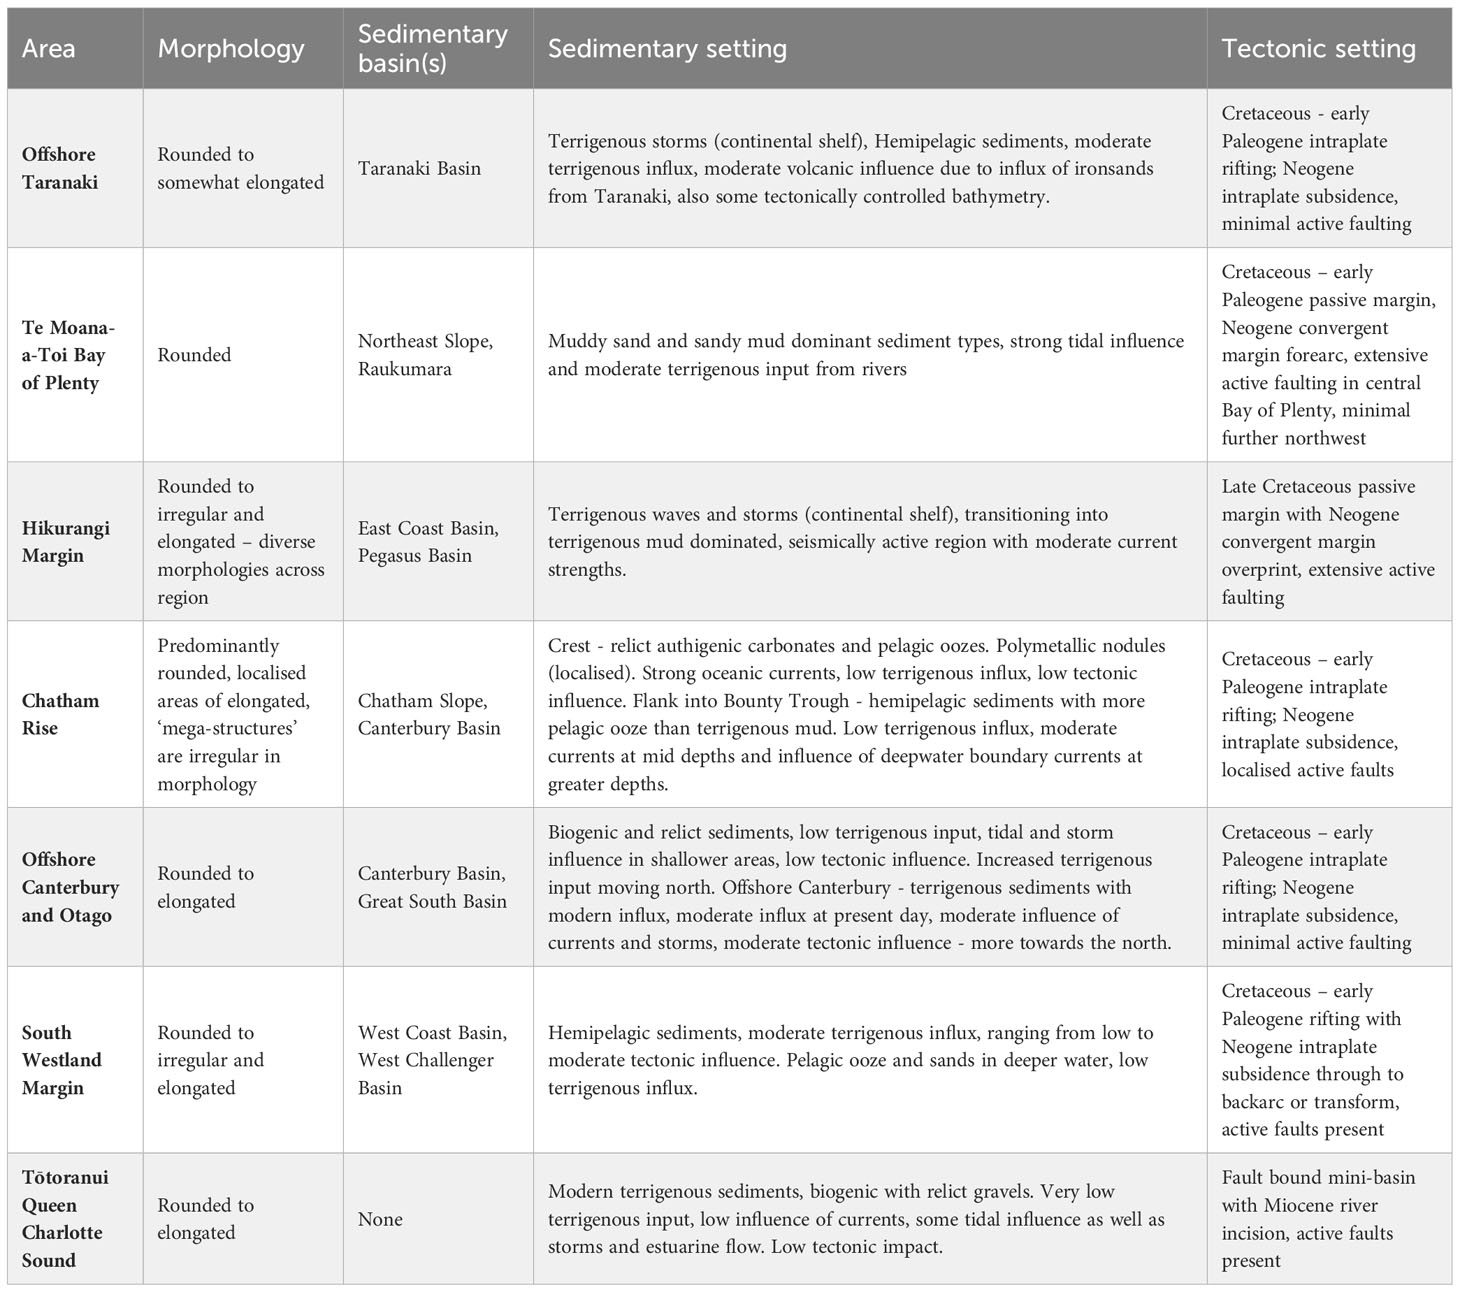
Table 2 Summary of regional characteristics across the seven study areas (Bostock et al., 2010; Litchfield et al., 2014, New Zealand Petroleum and Minerals, 2014a; New Zealand Petroleum and Minerals, 2014b; Arnot et al., 2016; Sahoo et al., 2017; Bland and Strogen, 2018; Bland et al., 2018a; Bland et al., 2018b; Bostock et al., 2018a; Bostock et al., 2018b; Strogen et al., 2018; Watson et al., 2019; Boxberg et al., 2020; Maier et al., 2022).
Regions of focused pockmark mapping around Aotearoa New Zealand
The results of the pockmark compilation analysis highlight several common trends in characteristics (Table 2). Aside from those found in shallow water on the Canterbury Shelf and Tōtaranui Queen Charlotte Sound, the majority of pockmarks cluster in water depths of 250–700 m, are <2 km2 in area, and are sub-rounded in morphology (Figures 2, 3). The average area of all pockmarks mapped out as polygons (21,397 features) is 0.165 km2, and if we multiply this by the total number of features mapped, we estimate that >5,600 km2 of the seafloor around Aotearoa New Zealand is covered in pockmarks. This is somewhat skewed by the ‘mega-pockmarks’ on the Chatham Rise (Davy et al., 2010); however, even if we remove all pockmarks with areas >10 km2, we get an average area of 0.022 km2, resulting in a total coverage of over 750 km2. There are of course some outliers across all of these trends, such as the ‘mega-pockmarks’ on the Chatham Rise with areas of 7 – 450 km2, and a handful of structures in South Westland that lie in water depths of >2,600 m (Figures 2, 3). Similarly, in areas of strong bottom currents, the morphology of the pockmarks becomes elongated in the direction of flow, most notably along the east coast of Te Waipounamu South Island, off Canterbury and Otago (Figure 4). Within the available data, the highest accumulation of pockmarks per square kilometre is observed in Tōtaranui Queen Charlotte Sound (Table 1); however, this is somewhat skewed by the small area mapped and relatively high data resolution (2 m) relative to the number of observed features. It is likely that such high-resolution datasets in these shallow environments will reveal features which would have been missed in lower resolution datasets typical of the deeper continental slopes. Another characteristic of the study areas is the spatial proximity of pockmarks to submarine canyons and gullies, with the exception of the Chatham Rise and the shallow water areas, as shown in Figure 5.
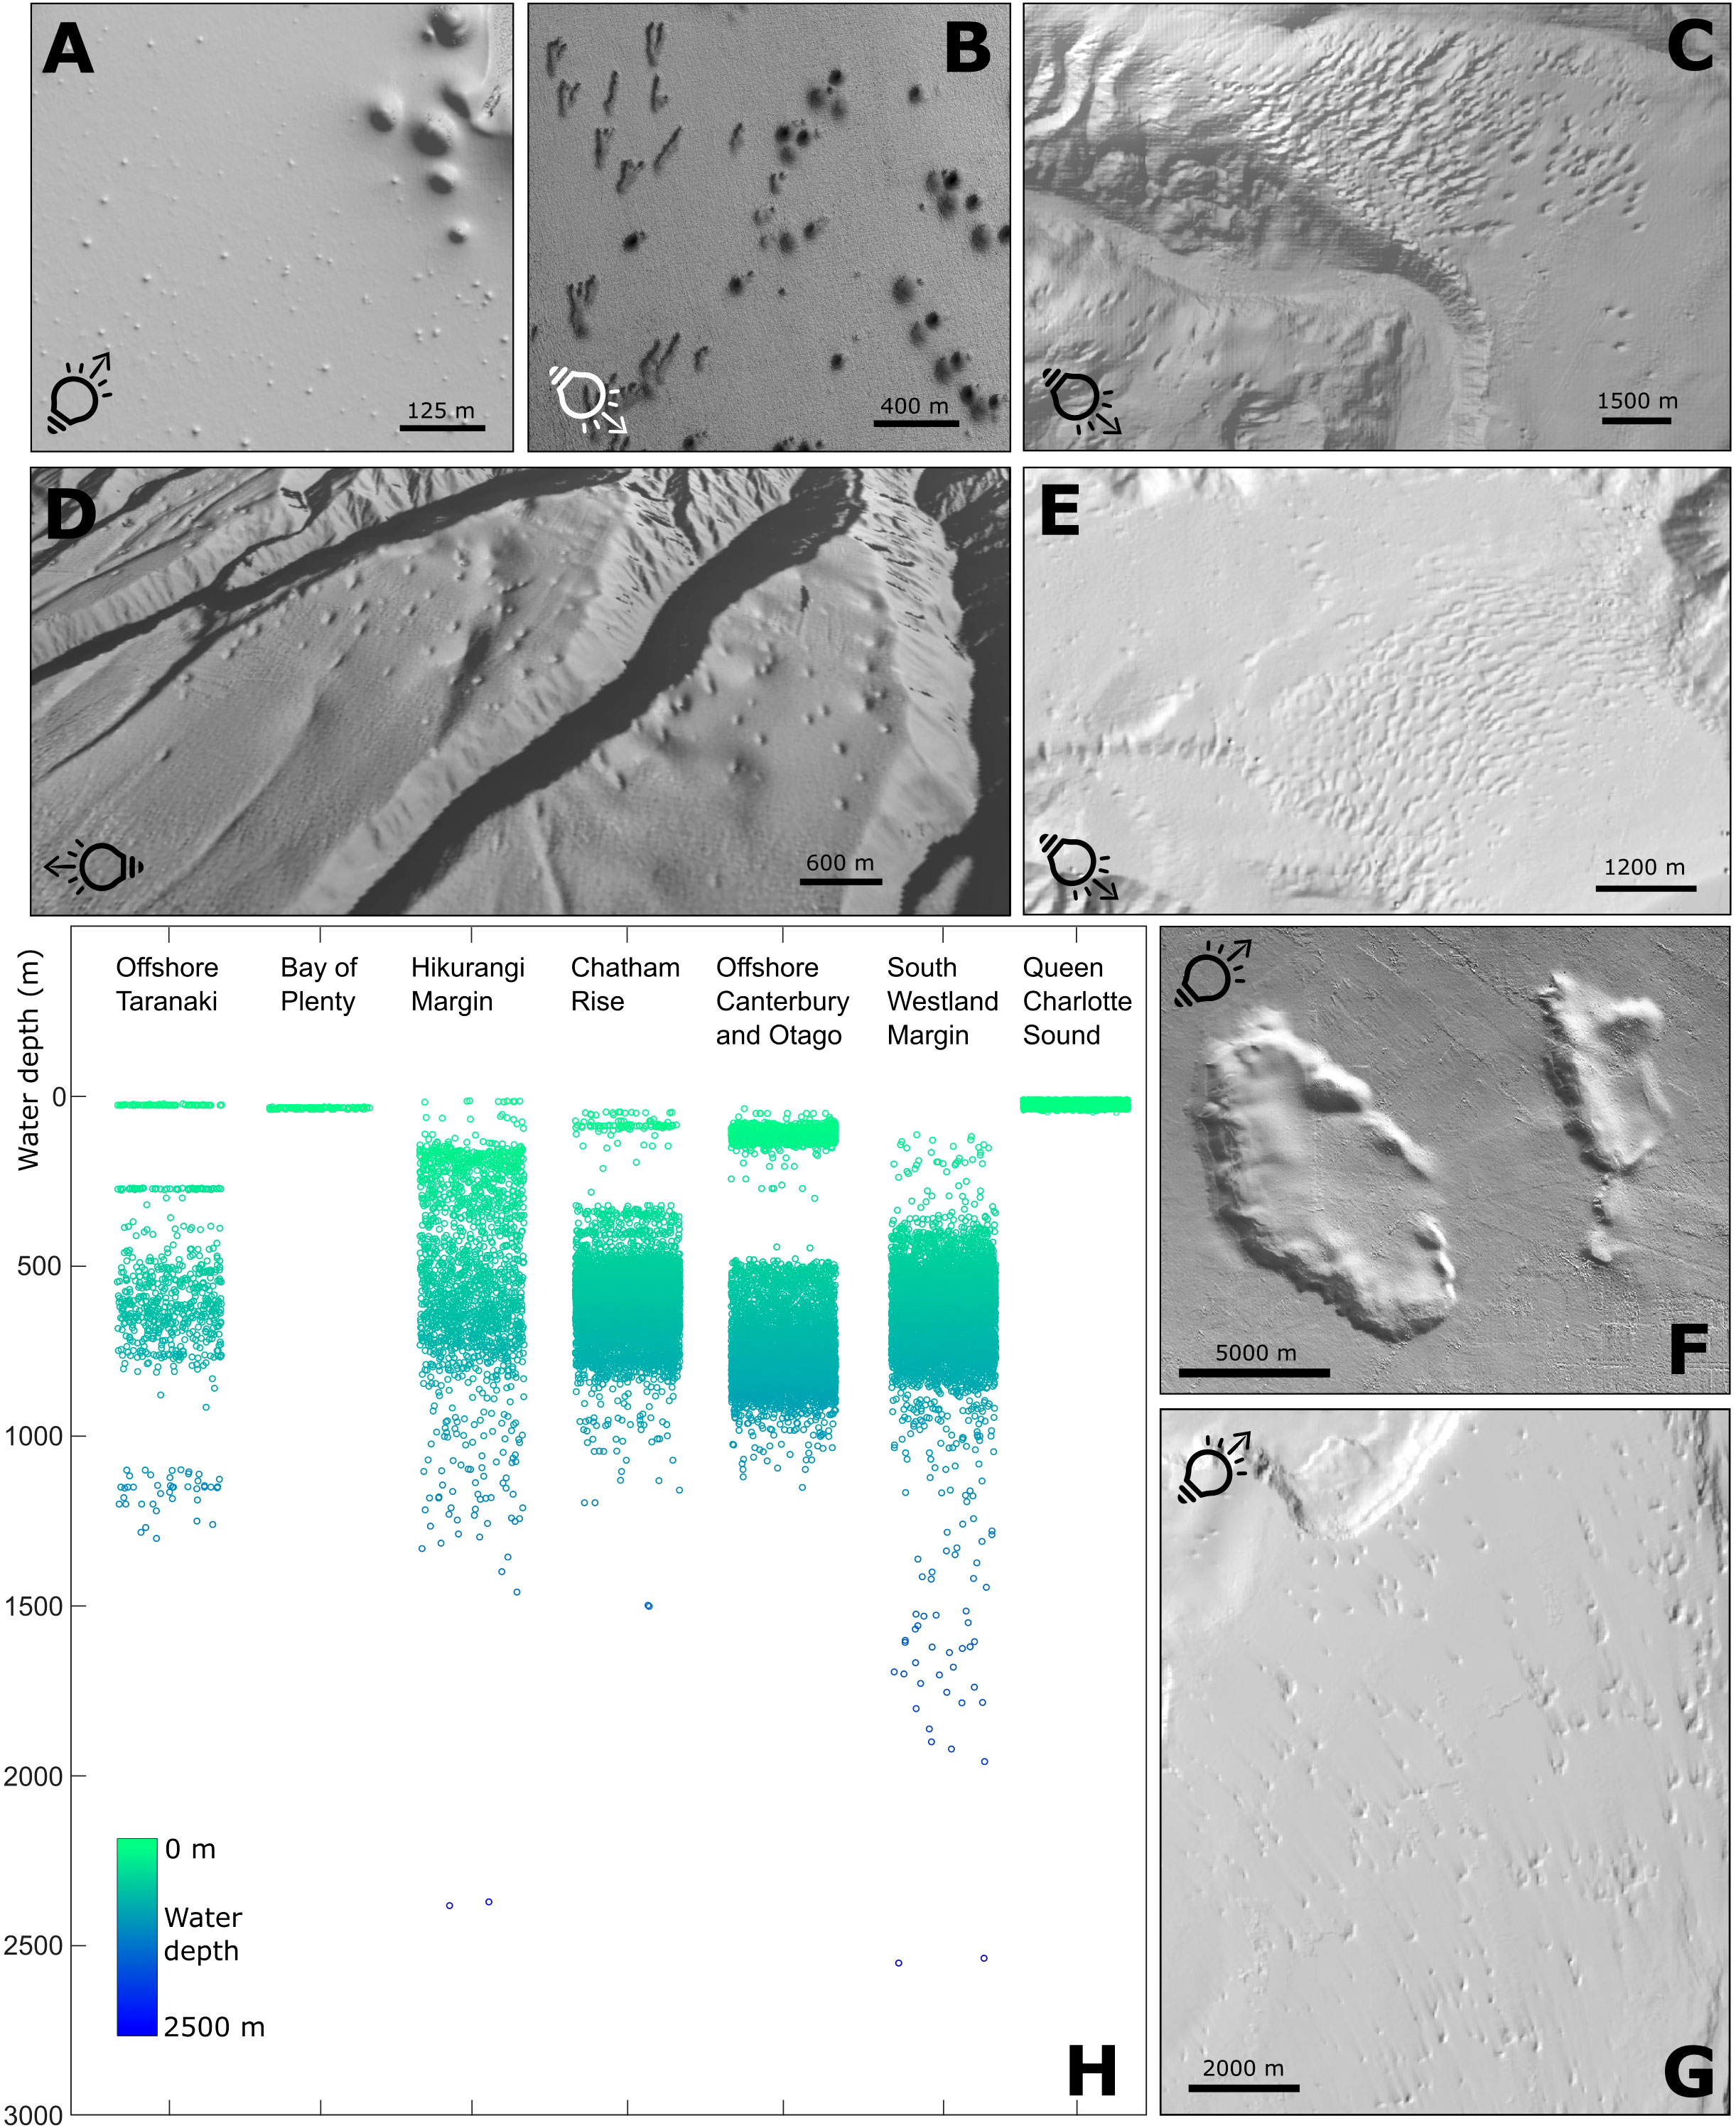
Figure 2 These panels show examples of pockmarks imaged in multibeam bathymetry data. Inset icons show direction of illumination. (A) Mixture of large and small pockmarks in Tōtaranui Queen Charlotte Sound, both with rounded morphology. (B) Rounded pockmarks on the Chatham Rise, alongside elongate depressions modified by ocean currents. (C) Elongated pockmarks adjacent to Waitaki Canyon offshore Otago. (D) Pockmarks on canyon spurs offshore Taranaki. (E) Along the South Westland Margin pockmarks are variably elongate to rounded in shape. (F) ‘Mega-pockmarks’ on the Chatham Rise, partially infilled by sediment drift deposits. (G) Sub-rounded pockmarks in the Pegasus Basin (southern Hikurangi Margin) are associated with elongate ‘tails’ due to erosional bottom currents. (H) Pockmarks are observed in water depths ranging from a few tens of metres to 2600 m, with the majority of these features occurring in depths of 250-700 m.
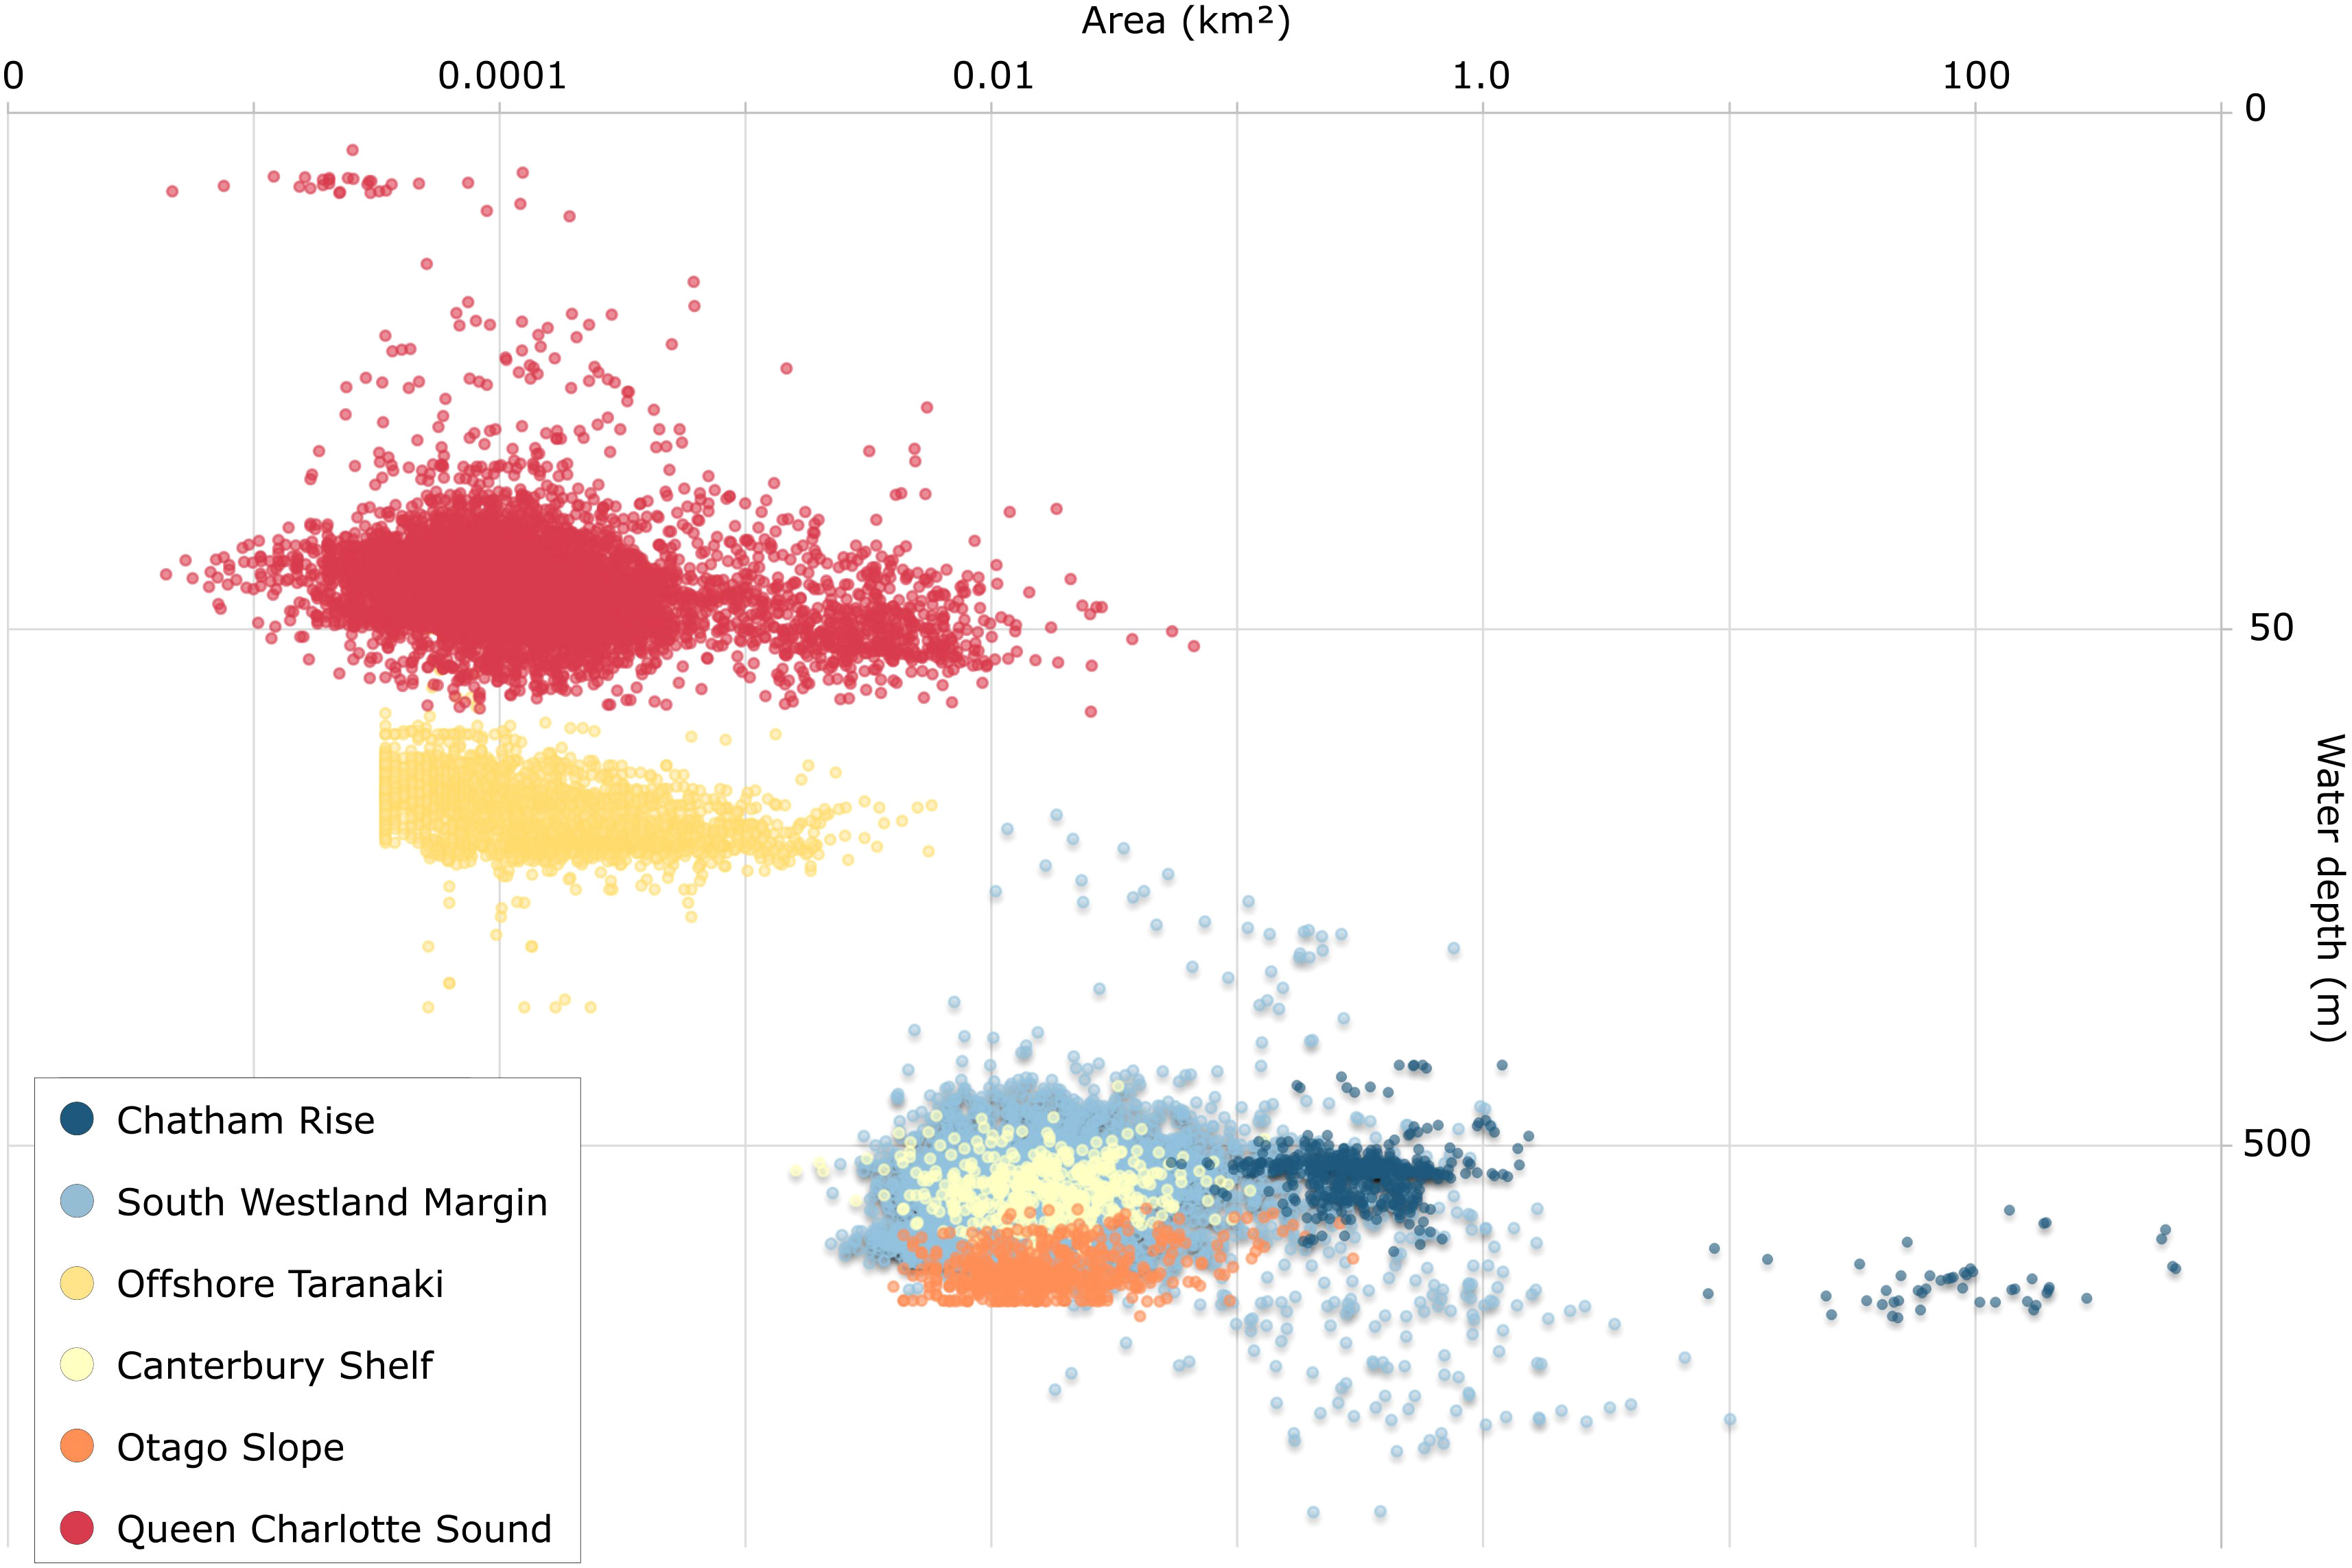
Figure 3 Water depth vs. mapped area of individual pockmarks. Area data is not available for all features included in the distribution maps. The vast majority of the pockmarks are small features (<2 km2 in area), with a few exceptions on the Chatham Rise, known as ‘mega-pockmarks’. Note log scales on both axes.
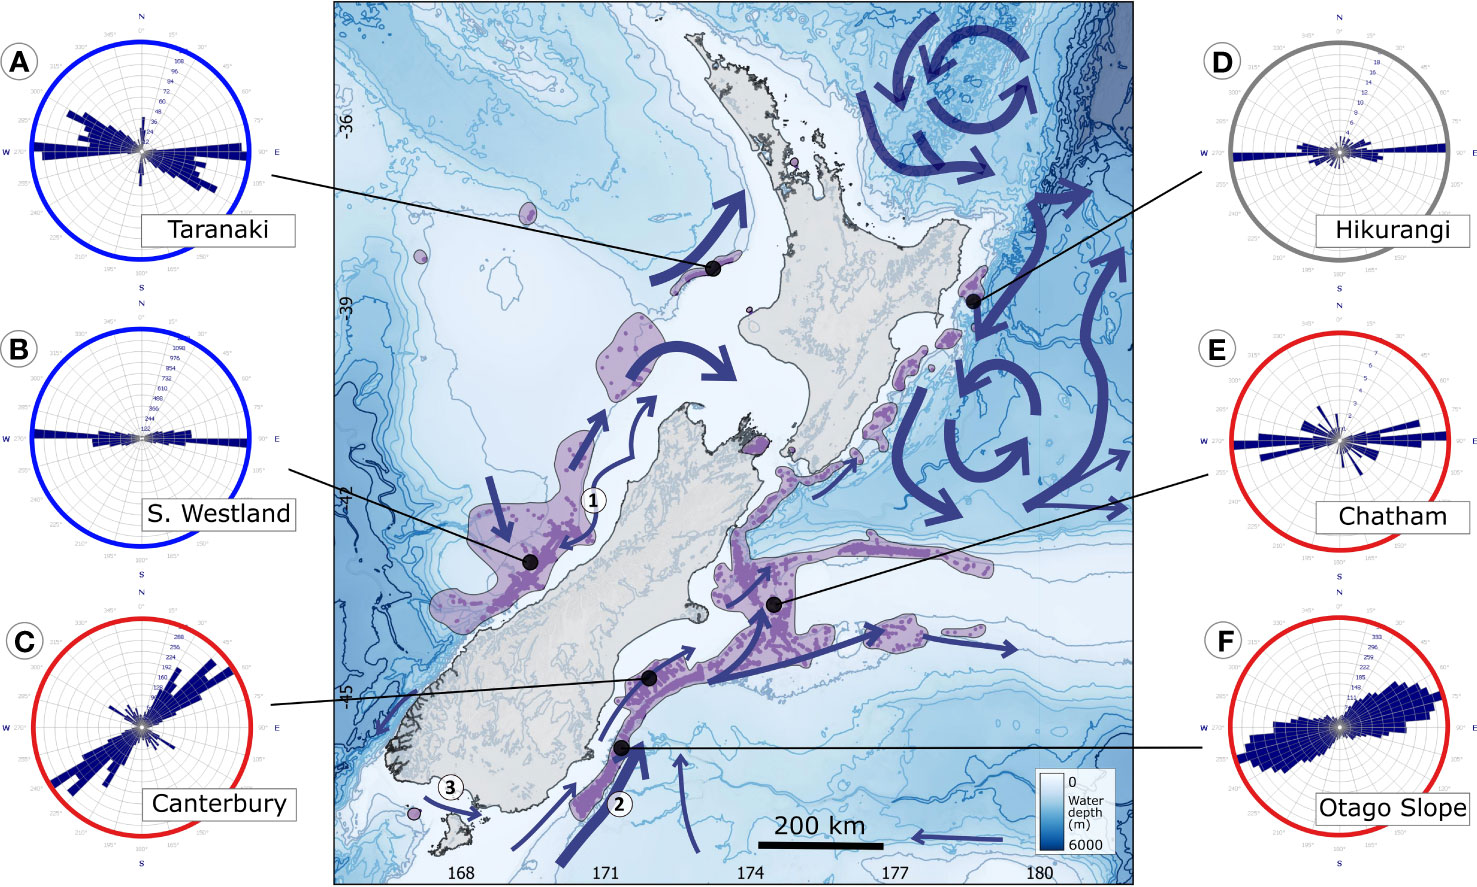
Figure 4 The orientation of pockmarks aligns well with dominant ocean current pathways (blue) in some areas, such as the Otago Shelf (C, F) and Chatham Rise (E) (red). Along the west coast (A, B) pockmarks are predominantly aligned downslope (blue). On the Hikurangi Margin (D) pockmarks are not strongly aligned; however, current velocities are low in this area. Current pathways after (Chiswell et al., 2015; Sutton, 2003). (1) South Westland Current (2) Southern Tropical Front (3) Southland Current.
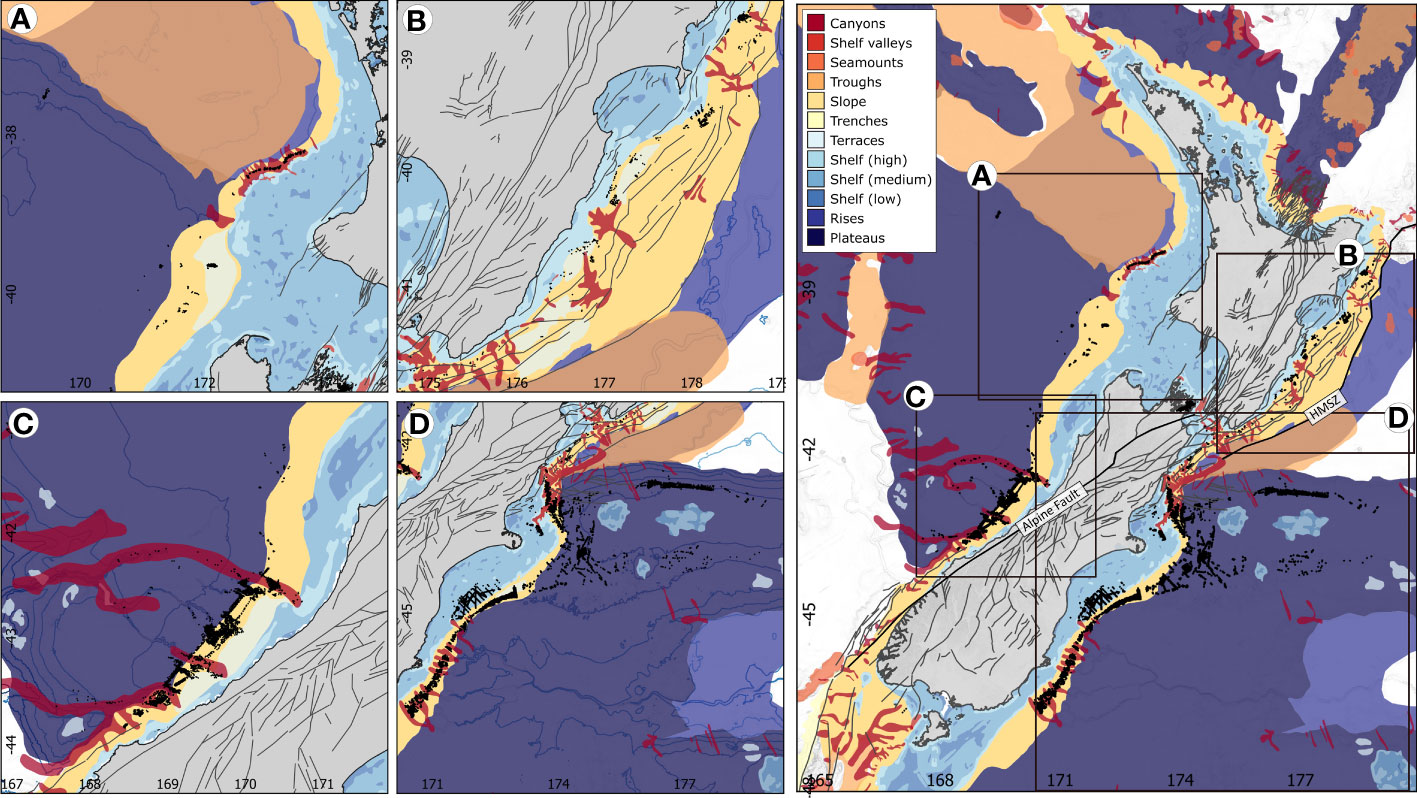
Figure 5 Geomorphological classification of the seafloor using the global seafloor geomorphic features map layers (adapted from Harris et al., 2014). Active faults (black lines) after Litchfield et al. (2015). Black dots indicate mapped pockmarks. HMSZ = Hikurangi Margin Subduction Zone. (A) Pockmarks offshore Taranaki correlate well with slopes. (B) Along the Hikurangi Margin there is a strong correlation between terraces and pockmarks distribution. (C) Pockmarks along the South Westland Margin correspond well with slope and canyon environments. (D) Offshore Canterbury and Otago pockmarks are identified in a range of geomorphic settings, clustering on the slope and out onto the plateau of the Chatham Rise.
The Hikurangi Margin lies off the east coast of Te Ika-a-Māui North Island, where the Pacific Plate is subducting beneath the Australian Plate. The morphology of the region is dominated by the accretionary wedge and deformation associated with the plate boundary since 23 Ma (Ballance, 1993; Lewis and Pettinga, 1993; Nicol et al., 2007; Barnes et al., 2010; Bostock et al., 2018a). The region is characterised by margin-parallel ridges and small fault-controlled basins, occasionally cross-cut by submarine canyons and abundant submarine slope failures (Barnes et al., 2010; Litchfield et al., 2014; Bostock et al., 2018a; Watson et al., 2019). Due to the high influx of sediment from rivers along the east coast of Te Ika-a-Māui North Island, seafloor sediments along the margin are dominated by terrigenous muds (Hicks et al., 2011; Bostock et al., 2018a), with occasional patches of sand, gravel and bioclastic carbonate. Active seafloor gas seeps are abundant along the margin, which, along with observations of seep fauna, indicate widespread ongoing and relict seafloor seeps (Greinert et al., 2010; Naudts et al., 2010; Watson et al., 2020a). The Hikurangi Margin is also the largest gas hydrate province around Aotearoa New Zealand, with extensive accumulations of hydrate, frequently located beneath reverse-fault-controlled topographic ridges associated with contractional deformation (Crutchley et al., 2011; Pecher et al., 2013; Bland et al., 2015; Crutchley et al., 2019; Kroeger et al., 2019; Hillman et al., 2020). Significant gas shows have also been encountered in the Pegasus and East Coast Basins along the Hikurangi Margin (Uruski and Bland, 2010; Bland et al., 2015). Over 1,700 pockmarks were identified along the outer shelf and upper slope of the Hikurangi Margin by Watson et al., (2020a), in water depths of 110 to 2,400 m. Pockmarks in this area are variable in size and morphology, but are generally sub-circular in shape. Bottom simulating reflections (BSRs), interpreted as indications of the base of the gas hydrate stability zone, are abundant on the Hikurangi Margin (Pecher et al., 2013). Interestingly, mapped pockmarks rarely correlate with the location of active seeps, except for some shelfal locations in the northern Hikurangi Margin (Higgs et al., 2019; Watson et al., 2022).
The Chatham Rise is a large bathymetric high of submerged continental crust extending over 1,000 km due east of Te Waipounamu South Island, with water depths of 500–900 m along its crest (Figure 1). It forms part of the fossilised accretionary wedge of the Zealandia section of the Gondwana subduction margin, and the northern boundary of a failed rift associated with the mid-late Cretaceous breakup of Gondwana (Wood et al., 1989; Bland et al., 2015; Mortimer et al., 2017; Nelson et al., 2022; Strogen et al., 2022). The seafloor atop the rise is characterised by complex sediment patterns, including a unique veneer of greensand and glauconite rich deposits that are indicative of minimal sedimentation rates and reworking by oceanic currents (Nelson et al., 2022). The rise is strongly influenced by oceanic currents due to the bathymetrically constrained sub-tropical front that flows along the southern flank (Figure 4) (Hillman et al., 2017; Bostock et al. 2018a). Near-seafloor sediments across the Chatham Rise are predominantly composed of Paleogene and Miocene chalk deposits (Wood et al., 1989). These carbonate-rich units are draped by thin, patchy authigenic and biogenic silty sand, but are locally exposed due to erosion associated with strong oceanic currents flowing along the plateau (McDougall, 1982; Hillman et al., 2017; Bostock et al. 2018a). Along the northern and southern flanks of the Chatham Rise pelagic carbonate and hemipelagic sediment cover is present; however, this is patchy due to winnowing by deep currents and the occurrence of mass failures (Barnes, 1992). The northern flank of the Chatham Rise borders the Pegasus Basin (Bland et al., 2015; Kroeger et al., 2019), where gas reserves have been identified; however, there is no evidence for gas occurrence along the rise itself. The Chatham Rise hosts almost 10,000 identified pockmarks – and is estimated to have >45,000, based on the density of pockmarks in mapped regions to the extent over which they occur. The distribution of pockmarks on the Chatham Rise appears to be strongly bathymetrically controlled. In particular, sub-circular pockmarks with diameters of ~150–500 m occur at ~470–700 m water depths. The Chatham Rise is relatively unique in that it is a large, laterally extensive flat-topped plateau, with densely spaced small pockmarks. This contrasts with the other areas in this study, which are frequently characterised by submarine canyons. Although there are the isolated ‘mega-pockmarks’ located on the central Chatham Rise, halfway between Te Waipounamu South Island and the Chatham Islands (Davy et al., 2010; Collins et al., 2011; Hillman et al., 2017; Klaucke et al., 2018), the vast majority of the pockmarks are small, densely spaced features. Pockmarks on the rise are generally sub-circular in plan view, with isolated areas of elongated morphologies where locally strengthened currents have a greater influence at the seafloor (Figure 2B). The asymmetrical infill of the ‘mega-pockmarks’ by sediment drift deposits indicates that current activity has been significant in this region (Figure 2F) (Hillman et al., 2018; Klaucke et al., 2018).
The region east of Te Waipounamu South Island, south of the Chatham Rise and off Canterbury and Otago is presently a passive margin. The mid-Neogene–Quaternary sedimentary evolution of the margin, which extends out onto submerged Zealandia continental crust, has been controlled by the interplay of the uplift and erosion of the distal Kā Tiritiri o te Moana Southern Alps (Figure 1A), the consequent supply of sediment from onshore rivers, and the strong submarine currents associated with the Subtropical Front (Figure 4) (Mortimer, 2004; Osterberg, 2006; Hillman et al., 2015). The area is underlain by mid-Cretaceous to present-day sediments up to ~8.5 km thick, encompassing non-marine facies including coal measures, and marginal to deep-marine sandstone, mudstone, and marls. Some early Paleogene mudstone units are comparatively rich in terrestrially derived organic matter (Carter, 1988; Cook et al., 1999; Schiøler et al., 2010; Hollis et al., 2014; Sahoo et al., 2017). Sub-commercial gas reserves have been identified in the Great South and Canterbury Basins (Killops et al., 1997; Hoffmann et al., 2019). The shelf off the coast of Otago is incised by seven major submarine canyons, known as the Otago Submarine Canyon Complex (Figure 1A), which are presently supplied with terrigenous sediments from the adjacent shelf (Osterberg, 2006; Mitchell and Neil, 2012). The canyons are bordered by mud-rich levees, predominantly built up on the northern flanks, with sandy deposits on the surrounding seafloor (Lu et al., 2003). Levees and associated sediment wave-field deposits are up to 400 m thick, and built up during glacial periods of wave growth, interrupted by low sedimentation during interglacial phases of pelagic calcareous oozes (Carter et al., 1990; Lu et al., 2003; Lu and Fulthorpe, 2004; Allen and Durrieu de Madron, 2009). Closely spaced pockmarks are also prevalent off Canterbury and Otago with >8,000 features identified. About half of these lie in water depths <350 m on the relatively flat Canterbury Shelf where they form small pockmarks, a few tens of metres in diameter (Hoffmann et al., 2019; Micallef et al., 2022); however, on the Otago Slope the pockmarks are clustered in the vicinity of submarine canyons incising the shelf edge (Figure 2C), in water depths of 600–1,000 m with diameters of 100s of metres (Hillman et al., 2015; Hoffmann et al., 2019; Kumar et al., 2021). Both regions are characterised by strongly elongated pockmarks, where the orientation of elongation correlates well with the position and flow direction of the Subtropical Front flowing northeast along the east coast (Figure 4), while the smaller pockmarks on the shelf are elongated in the opposite direction, potentially related to eddy currents (Micallef et al., 2022).
The South Westland Margin lies off the west coast of Te Waipounamu South Island, where the southernmost extent of the Challenger Plateau meets the West Coast Basin (Figure 1) (Maier et al., 2022). The main structural component in this region is the onshore transpressional Alpine Fault (Figure 5), which forms the boundary between Australian and Pacific Plate continental crust. High uplift rates along the Kā Tiritiri o te Moana Southern Alps have resulted in rapid erosion and high sedimentation rates associated with steep, short, often braided rivers along the margin, leading to seafloor sediments dominated by terrigenous muds (Cox and Sutherland, 2007; Hicks et al., 2011; Bostock et al., 2018a; Maier et al., 2022). There is no evidence in the area for subsurface gas (Maier et al., 2022). The region is influenced by complex, locally variable current systems, dominated by the South Westland current, which generally flow north along the margin (Chiswell et al., 2015). Like much of the shelf edge around Aotearoa New Zealand, the narrow (<60 km wide) South Westland Margin is incised by numerous submarine canyons (Figure 1) (Maier et al., 2022). Pockmarks on the South Westland Margin are observed in water depths of 100–2600 m, with the majority occurring in depths of 400–850 m (Maier et al., 2022). As seen on the Otago Slope, these features occur in the vicinity of submarine canyons that incise the continental slope along the margin. The depressions range from large, irregular features (>0.5 km2 in area) to small, circular depressions (Figure 2E) (0.008–0.03 km2) (Maier et al., 2022). In addition, there are irregular depressions that are elongated along slope. Farther to the south, small, oval pockmarks, up to 200 m in diameter, were observed in the Solander Basin, to the south of Te Waipounamu (Patel et al., 2021). It is likely that such features are more widespread along the southern and western shelf edge; however, existing data coverage limits our observations in this region.
The Offshore Taranaki region, western Te Ika-a-Māui North Island, has been extensively studied due to the occurrence of economically significant petroleum reserves (e.g., King and Thrasher, 1996; Arnot et al., 2016). However, these studies primarily focused on structures deep below the surface, not the modern-day seafloor. In this study we focus on the Inner Aotea Basin (Figure 1) due to the recent acquisition of a large multibeam bathymetry survey (Hillman et al., 2022; Watson et al., 2022). This area is characterised by thick (>10 km) sediments that have accumulated in a rift basin following the breakup of Gondwana (Uruski, 2010; Arnot et al., 2016; Strogen et al., 2017; Strogen et al., 2022). The northern Taranaki shelf is underlain by the Plio-Pleistocene aged Giant Foresets Formation, a strongly progradational late Neogene-Quaternary shelf to slope to basin floor succession of fine-grained mudstones, siltstones and sandstones (Nodder, 1995; King and Thrasher, 1996; Hansen and Kamp, 2004; Strogen et al., 2014; Anell and Midtkandal, 2017). High sediment supply in the region was related to the uplift of Kā Tiritiri o te Moana Southern Alps and the central Te Ika-a-Māui North Island hinterland (Hansen and Kamp, 2004; Kamp et al., 2004; Pulford and Stern, 2004; Trewick and Bland, 2012; Bull et al., 2019). The Offshore Taranaki region is Aotearoa New Zealand’s only area of commercial hydrocarbon production, with significant gas fields and evidence of shallow gas (King and Thrasher, 1996; Singh et al., 2016). Where seafloor mapping data are available, the shelf edge is incised by a series of complex submarine canyons (Hillman et al., 2022; Watson et al., 2022). These are likely more widespread, but much of the area has yet to be adequately mapped. Seafloor pockmarks off Taranaki were little known until late 2021 when two research voyages (TAN2111 and TAN2205) mapped a large area extending >140 km from the shelf edge (Hillman et al., 2022; Watson et al., 2022). This revealed numerous small depressions along the shelf break, clustered along spurs in between submarine canyons in water depths of 300–550 m (Figure 2D). No active seeps were observed in the vicinity of pockmarks during the TAN2111 survey, although sub-bottom profiler and 2D seismic data revealed numerous occurrences of shallow gas.
Pockmarks have been observed in shallow water (<300 m) in several areas around Aotearoa New Zealand (Figure 1), including Tōtaranui Queen Charlotte Sound (Figure 2G) (Watson et al., 2020b), offshore from Ngāmotu New Plymouth (Allis et al., 1997) the Hauraki Gulf (Pallentin et al., 2022) and in Te Whanganui-a-Tara Wellington Harbour (Hoffmann et al., 2023). Tōtaranui Queen Charlotte Sound (Watson et al., 2020b) lies at the northern end of Te Waipounamu South Island, within the Marlborough Sounds, the latter being a lozenge-shaped region bounded by active faults along its northwest and southeast sides(Nicol, 2011; Langridge et al., 2016). During the last glacial maximum (~18 ka) this region, a classic ria geomorphic feature, was subaerially exposed due to sea level being ~113 m below present day (Nodder, 1995; Watson et al., 2020b). Subsequent subsidence and sea-level rise resulted in the deposition of up to 400 m of sediment within the paleo-river valleys that form the sounds (Singh, 2001; Nicol, 2011). Te Whanganui-ā-Tara Wellington Harbour, at the southern tip of Te Ika-a-Māui, formed primarily as a result of vertical movements along the Wellington Fault. Sediments accumulated to thicknesses of over 600 m since the Middle to Late Quaternary (Donaldson and Campbell, 1977; Jones and Baker, 2005). The basin was predominantly filled by alluvial sediments supplied by the Te Awakairangi Hutt River, which are interbedded with fine-grained marine sequences deposited during eustatic sea-level high stands (Mildenhall, 1994).
Whilst this study focuses on the occurrence and distribution of pockmarks around Aotearoa New Zealand, there is one offshore area where these features are notably absent – the Te Moana-a-Toi Bay of Plenty (Figure 1A). This is not for lack of data coverage — as shown in Figures 1A and 2, a substantial proportion of this area has been mapped with multibeam bathymetry data. However, only a small cluster of pockmarks has been identified, to the northwest, in the outer Hauraki Gulf (Pallentin et al., 2022). Interestingly, these pockmarks occur in a distinct linear pattern, suggesting they may be related to a subsurface fluid flow pathway such as a fault. The absence of pockmarks in these areas could be due to limited sediment thickness, a lack of organic matter in sediments to generate biogenic methane, or the presence of volcanic sediments.
Are pockmarks related to seafloor venting?
Pockmarks have often been defined as representing primary evidence of rapid biogenic/thermogenic gas build up and fluid release from seabed sediments to the water column (Hovland and Judd, 1988; Paull et al., 2002; Audsley et al., 2019; Micallef et al., 2022). Through compiling numerous multibeam bathymetry datasets around Aotearoa New Zealand we have identified over 30,000 pockmark structures on the seafloor. These pockmarks occur across passive to active margin settings, variable underlying lithologies, and a diverse range of morphological environments, from canyons to plateaux; however, one of the key things that stands out is that virtually none of these pockmarks are coincident with identified sites of active seafloor seeps. While this is not a unique observation (e.g., Rise et al., 2015), it is the first time this has been demonstrated for Aotearoa New Zealand. This may challenge the assumption that fluid seepage is the primary cause of pockmark formation (Gay et al., 2007; Pilcher and Argent, 2007; Andresen and Huuse, 2011), or highlight that the formation process is time-sensitive, underscoring the need for further investigation into the timing of pockmark formation. One region where fluid venting from the seafloor is known to create pockmarks around Aotearoa New Zealand is the submarine groundwater springs in Te Whanganui-ā-Tara Wellington Harbour (Hoffmann et al., 2023). Here an extensive freshwater aquifer system is recharged on land and creates artesian groundwater discharge that forms pockmarks in the muddy harbour sediments.
Several previous publications have hypothesised that the trigger resulting in the formation of pockmarks was a change in overburden pressure due to sea-level rise or fall (Davy et al., 2010; Sultan et al., 2010; Andresen and Huuse, 2011; Riboulot et al., 2014; Karstens et al., 2018; Ketzer et al., 2020; Micallef et al., 2022). The depth range at which small (<2 km2) pockmarks are predominantly observed around Aotearoa New Zealand coincides roughly with the region of the seafloor that is predicted to move across the methane hydrate stability boundary through glacial-interglacial cycles (Davy et al., 2010; Stott et al., 2019). Gas hydrates have been identified along the Hikurangi Margin, and in localised areas offshore Taranaki and along the Fiordland Puysegur margin (Crutchley et al., 2007, Ogebule and Pecher, 2010). This depth restriction initially led to the hypothesis that the pockmarks on the Chatham Rise, in particular, formed due to methane hydrate dissociation near the end of a glacial period (Davy et al., 2010). While seismic data acquired across the Chatham Rise in 2013 show evidence for fluid migration linked to pockmark formation, sulphate profiles from pore water show no evidence of methane flux (Bialas et al., 2013; Coffin et al., 2013), let alone methane hydrate formation. In addition, δ13C data point towards a lack of isotopically light methane typical for gas hydrate dissociation. Δ14C data, on the other hand, point towards an influx of old carbon from below (Davy et al., 2010; Stott et al., 2019). Gas samples acquired from the Hikurangi Margin and surrounding sedimentary basins (Pegasus and East Coast; Figure 1C) are methane rich, with >99% methane measured at several locations (Hulme et al., 2015). In general, a sediment thickness of >3.5 km is required for organic matter to reach a burial depth great enough for the generation of thermogenic hydrocarbons in the region (Killops et al., 1997; New Zealand Petroleum and Minerals, 2014a). Around Aotearoa New Zealand this restricts significant thermogenic generation of hydrocarbons to the Taranaki, Canterbury-Great South, East Coast and Pegasus basins (Figure 6). However, notable oil seeps and thermogenic gas have been identified onshore along the west coast of Te Waipounamu South Island, and there are oil seeps on the coast of South Westland (Cook, 1982; Czochanska et al., 1987; Beggs et al., 2008; Sykes et al., 2012). This depth constraint is only applicable to thermogenic hydrocarbon generation, whereas biogenic hydrocarbons may be generated at shallower depths, and occurrences of biogenic hydrocarbon generation have been documented along the East Coast Basin (Hikurangi Margin), Canterbury Shelf and offshore Otago (Hulme et al., 2015; Micallef et al., 2022). Notably, pockmarks are found in shallow waters of Tōtaranui Queen Charlotte Sound, offshore from New Plymouth, in Te Whanganui-ā-Tara Wellington Harbour and the inner Canterbury Shelf.
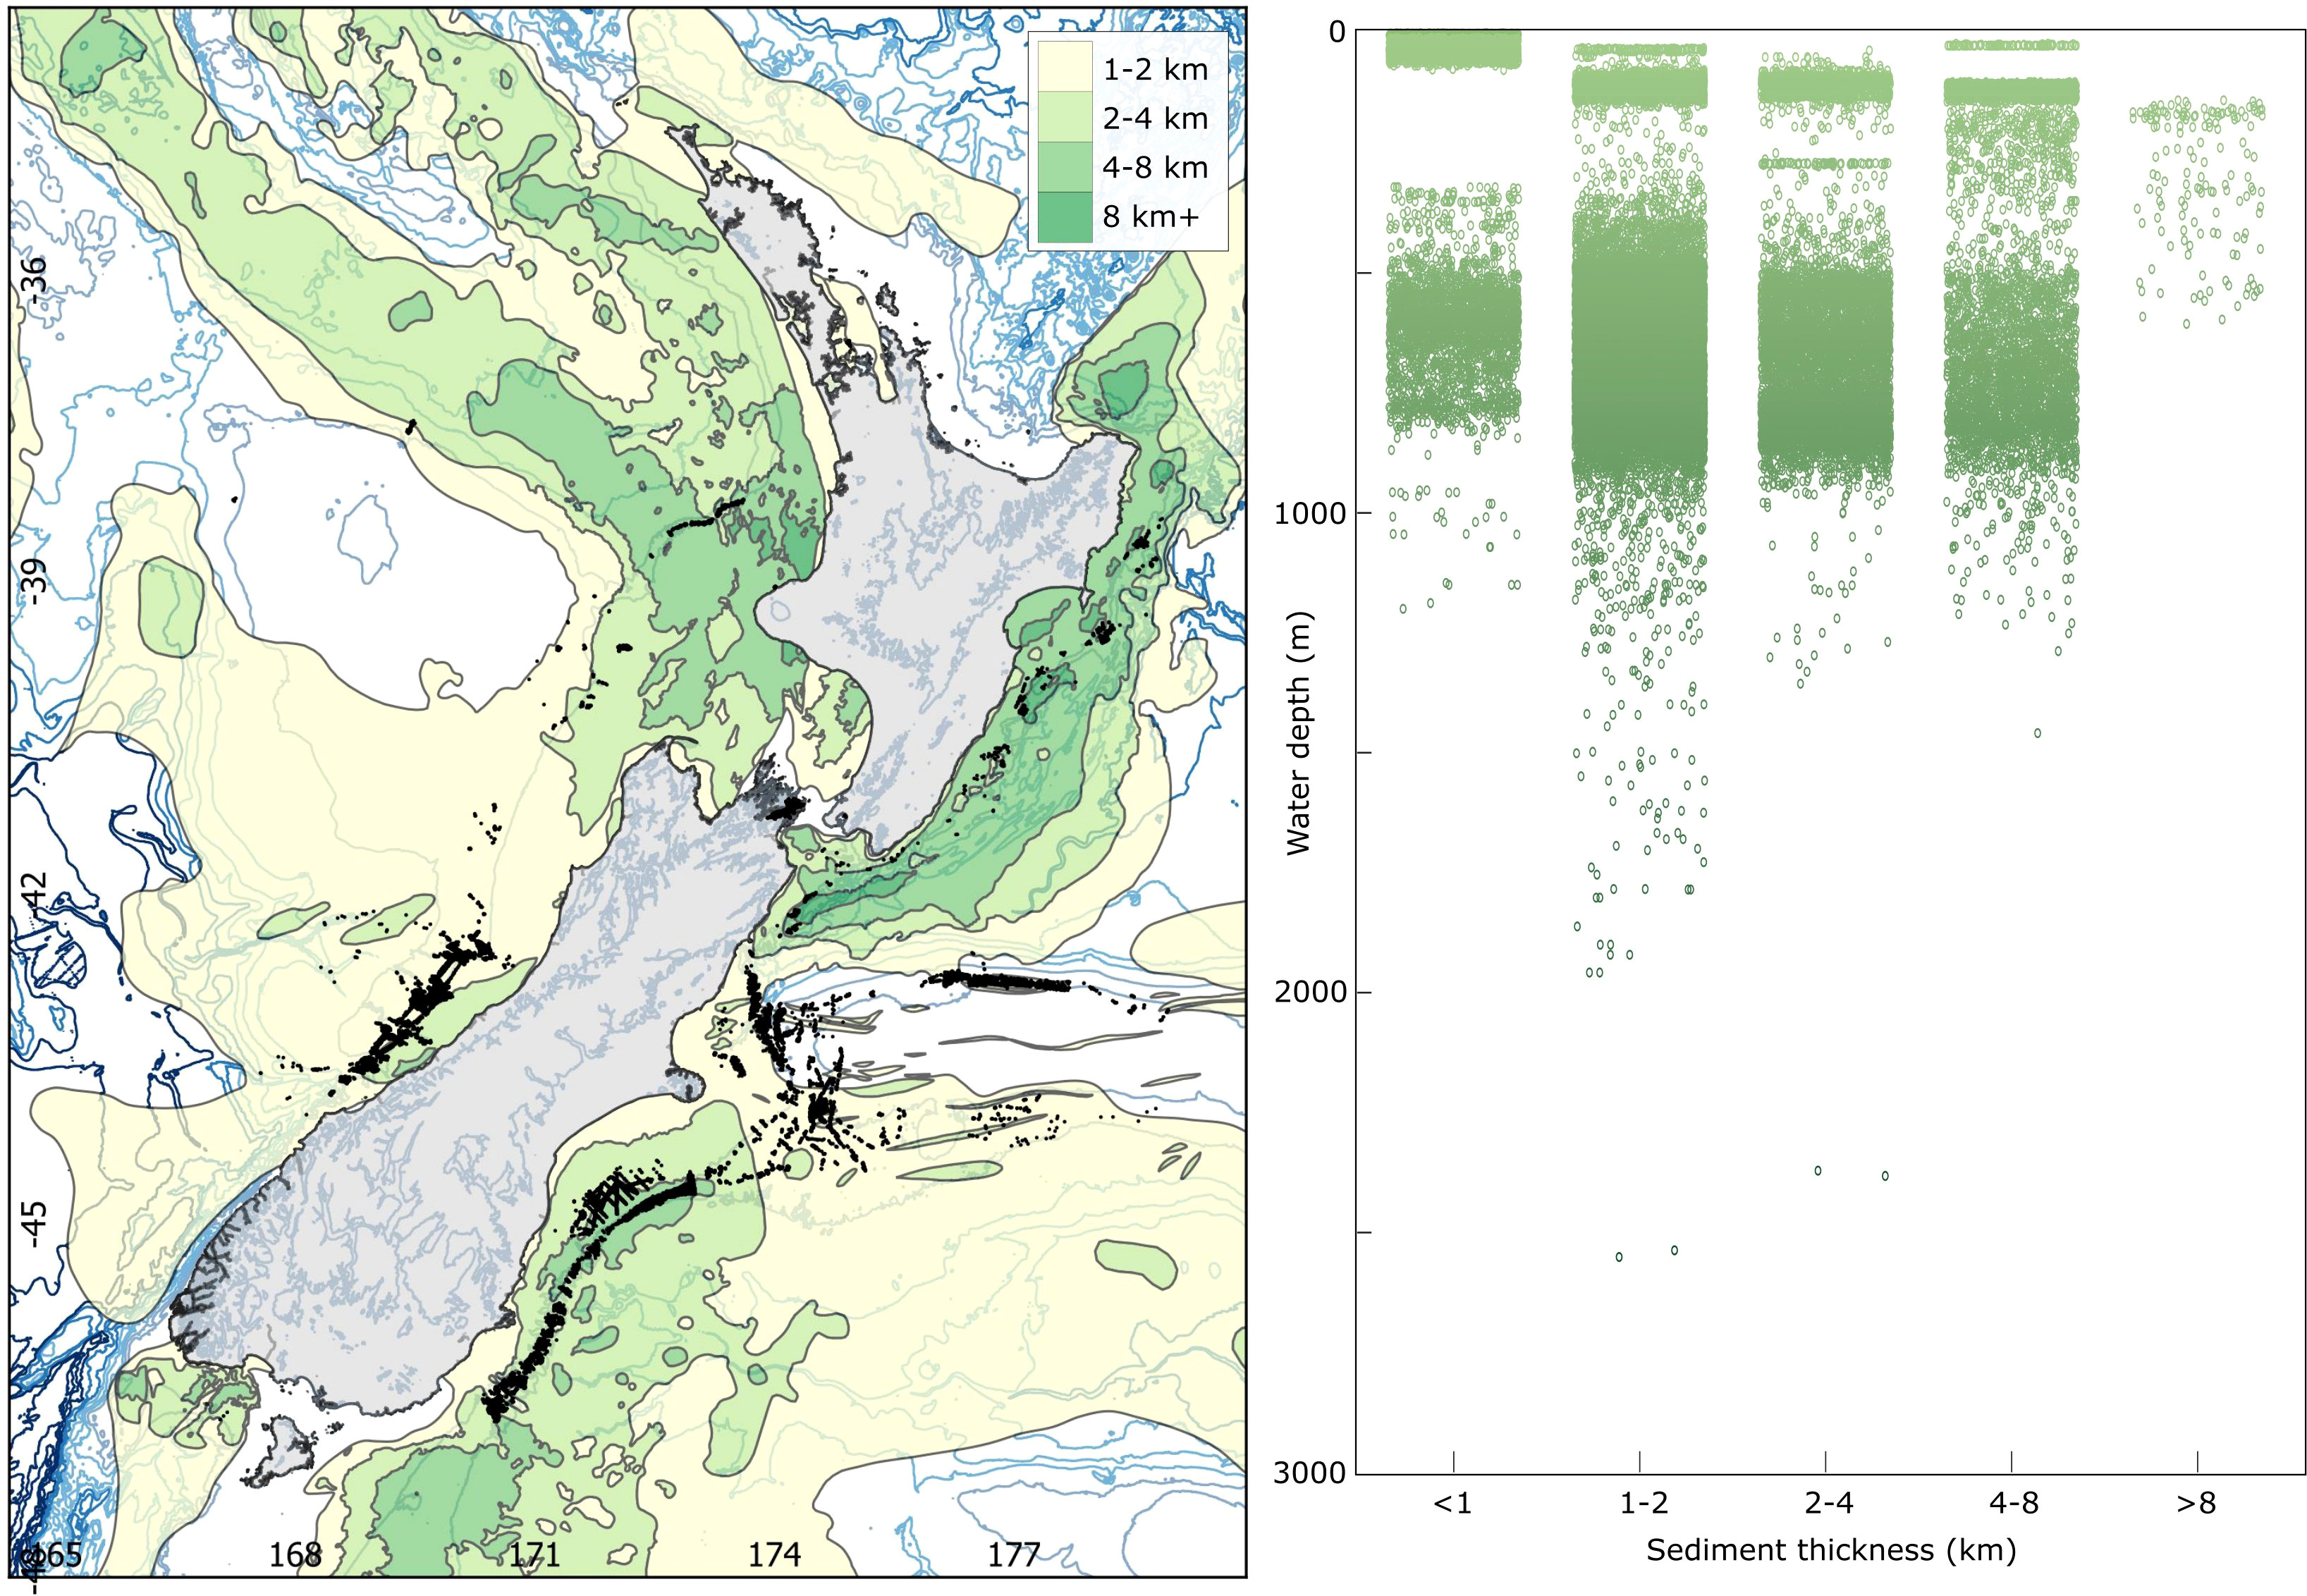
Figure 6 Sediment thickness map based on analysis of seismic reflection and drillhole data (after Arnot et al., 2016; Sahoo et al., 2017; Bland and Strogen, 2018; Bland et al., 2018a; Bland et al., 2018b; Strogen et al., 2018). Sediment accumulations of <1 km in thickness are not included, and data are limited in some regions, especially the Chatham Rise and South Westland Margin, leading to higher uncertainty in these areas. Black dots indicate the location of pockmarks. The sediment thickness has been sampled at each mapped pockmark location and displayed in the waterfall plot on the right. Pockmarks predominantly correlate to sediment thicknesses of 1-4 km. The majority of those in the <1 km sediment thickness band lie within areas such as Tōtaranui Queen Charlotte Sound (<200 m water depth) and the crest of the Chatham Rise (500-800 m water depth), where limited data is available to assess sediment thickness, or sediment accumulation is highly localised.
Fluid venting, either in the form of free gas mixed with porewater, or groundwater, is the most commonly proposed mechanism of formation for pockmarks (Whiticar and Werner, 1981; Rise et al., 1999; Hübscher and Borowski, 2006). A lack of spatial correlation between pockmarks and gas seeps is evident in this dataset. However, this does not necessarily preclude fluid venting as a mechanism of formation. Seafloor seeps are known to be ephemeral in nature, with some strongly influenced by factors such as tidal or seasonal cycles, or earthquakes (Field and Jennings, 1987; Li et al., 2019; Sultan et al., 2020). Seepage that cannot be imaged (e.g., diffuse seepage rather than focussed gas expulsion), or at scales below detection limits of modern echosounders is possible and may also account for a lack of coincident seep observations across pockmarks. As a result, without repeat surveys at different intervals to capture the full range of conditions, and multi-instrument/sensor observations of seepage, it is difficult to determine whether there truly is no seep activity at a site. Repeat surveys are rare due to the expense and time required, and the ephemeral nature of seeps on timescales of days (tidal) to millennia (glacial cycles) makes results difficult to interpret. Nevertheless, the fact that numerous active seep sites have been imaged, which do not correlate to the presence of pockmarks at the seafloor, suggests that these features are not necessarily coincident. Numerous active cold seeps have been imaged along the Hikurangi Margin (Baco et al., 2010; Jones et al., 2010; Klaucke et al., 2010; Watson et al., 2020a; Turco et al., 2022); however, there are limited observations elsewhere around Aotearoa New Zealand, such as offshore Canterbury (Micallef et al., 2022). This does not necessarily mean that seeps do not occur elsewhere due to their ephemeral nature and the fact that not all multibeam bathymetry surveys include water column imaging; however, it does suggest that they are less common in other regions. Active seep sites along the Hikurangi Margin are predominantly characterised by rugose, irregular seafloor associated with high multibeam backscatter anomalies, indicating carbonate outcrops (Jones et al., 2010; Klaucke et al., 2010; Watson et al., 2020a).
An alternative hypothesis is that there are two different styles of seeps. Firstly, those related to diffuse seepage, (seepage) active over long periods of time, readily imaged in water column data but lacking sufficient flow rates and/or velocity to displace sediment and create pockmarks. Secondly, ‘monogenetic’ episodes of forceful venting due to strongly overpressured shallow gas and/or fluid, such events would require a trigger to cause rapid release of a large volume of fluid, displacing significant volumes of sediment and creating pockmarks. Talukder (2012) describe these two types of fluid flow – venting and seeping – as the end members of a spectrum, ranging from slow, diffuse seepage in mineral prone settings, through to rapid venting in mud prone settings. Without additional, more detailed datasets for the pockmarks identified in this study it is not possible to fully characterise our sites using this type of classification. Furthermore, pockmarks could be formed by very gradual, diffuse fluid flow, which cannot be detected by our water column imaging systems. Such diffuse flow could gradually displace small quantities of sediment over time, forming pockmarks; however, to form discrete features such as pockmarks, there must be some mechanism focusing the flow to a specific area, which seems contrary to the idea of flow being diffuse. Finally, could it be that we cannot image the fluids being released at pockmarks, due to the lack of density contrast between the surrounding water column and the fluid seeping from the seafloor, resulting in sufficient flow to displace sediment without the readily imaged scattering of bubbles? This would be the case for groundwater seepage. The majority of pockmarks in this dataset lie at water depths shallower than 1,000 m, which places them well within the detectable range of fluids with any density contrast using multibeam echosounders (Lurton, 2010; Urban et al., 2017; Nau et al., 2022), even if no ‘true bubbles’ were present. This suggests that further clarification is necessary in discussions of “fluids” within such studies.
Influence of lithology, subsurface structure, and geomorphology
Hovland and Judd (1988) note that pockmarks are generally observed on muddy seabeds; however, here we have quantified this correlation for the first time in offshore Aotearoa New Zealand. The results of this study show that muddy substrate at the seafloor is the best predictor for the location of pockmarks, with a high correlation of pockmark occurrence in areas of >60% mud (Figure 7). Whether this correlation is a matter of preservation or formation remains to be determined. This correlation could be explained as a result of pockmarks forming more readily in mud-rich sediments because, as suggested by Audsley et al. (2019), fine-grained sediments are easier to displace with relatively little force. Or is this a matter of preservation bias, with pockmarks remaining visible at the seafloor for longer periods of time in mud-rich substrate, whereas in sand-rich substrate a pockmark may rapidly collapse in on itself and be lost from the geological record? Or is this simply a coincidence due to muddy substrate being the most abundant seafloor substrate type? According to the framework proposed by Talukder (2012), this would indicate that these pockmarks relate to active venting style settings. Krämer et al. (2017) show that pockmarks abruptly form in sandy sediments of the shallow North Sea (~30 m water depth); however, these pockmarks only remain stable for several months before they are levelled out again and diminish into a flat seafloor. It has been suggested that pockmarks are typically preserved under low sedimentation conditions (Schattner et al., 2016; Watson et al., 2020b). Regional-scale sediment thickness maps for offshore basins within New Zealand’s extended economic zone and extended continental shelf were compiled through the Atlas of Petroleum Prospectivity database (Arnot et al., 2016; Sahoo et al., 2017; Bland and Strogen, 2018; Bland et al., 2018a; Bland et al., 2018b; Strogen et al., 2018). Where data coverage and quality allowed, non-basement Zealandia Megasequence sedimentary ‘cover rocks’, all younger than c. 110 Ma (after Mortimer et al., 2014), were mapped using available 2D seismic reflection lines, well ties, and a regionally consistent set of seismic horizons (after Strogen & King 2014), and then depth converted (e.g., Arnot et al., 2016; Arnot et al., 2018). These sediment thickness maps show a generally good correlation between the distribution of pockmarks and areas with 1-4 km of sediment accumulation (Figure 6), particularly in water depths of 500-800 m. Areas of >4 km sediment thickness are generally restricted to localised areas along the Hikurangi Margin, and offshore Taranaki, Otago, and Canterbury. Along the Hikurangi Margin there is a relatively close correlation between these patches of thicker sediment, which indicate the location of mini-basins bound by thrust faulted ridges, and the occurrence of pockmarks (Bland et al, 2015; Tek et al., 2021).
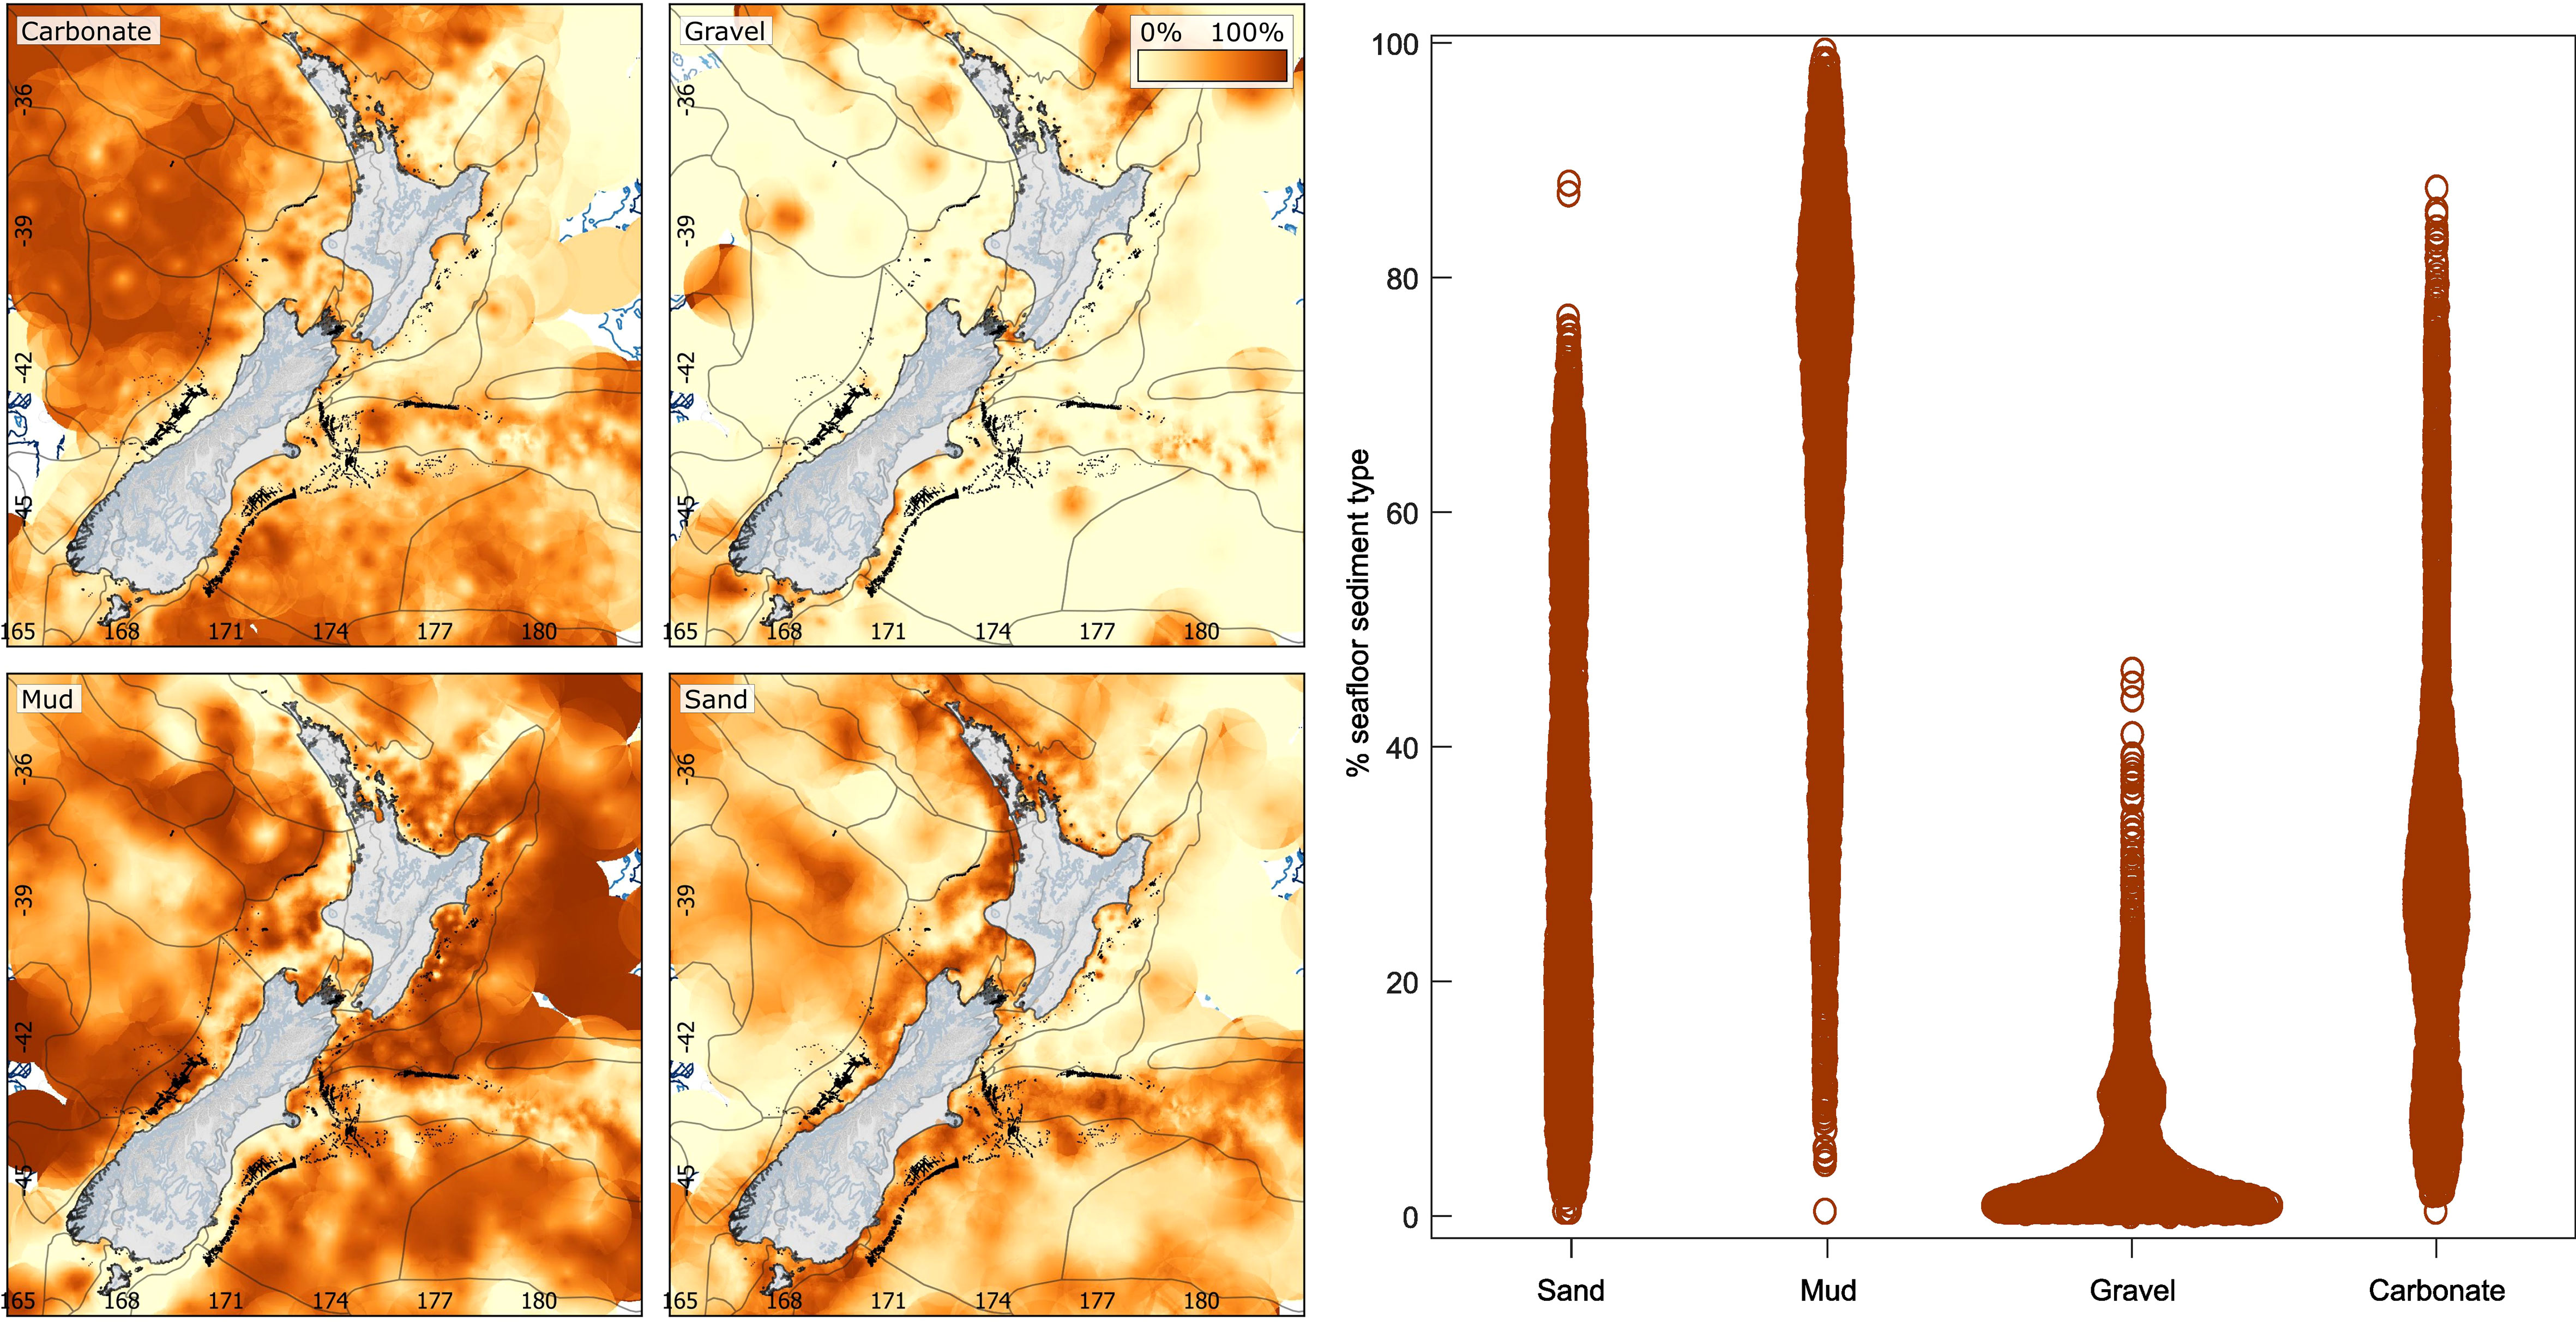
Figure 7 Distribution of pockmarks (black dots) in comparison to the surficial sediment maps of Bostock et al. (2018a, b). The sediment composition has been sampled at each mapped pockmark location and displayed in the violin plot on the right, illustrating a strong correlation between the occurrence of pockmarks and higher proportions of mud at the seafloor. The width of the plot for each substrate type is indicative of the number of mapped pockmarks.
The correlation of sediment thickness to the presence of pockmarks is not as evident on the Chatham Rise and along the South Westland Margin, where pockmarks occur in areas of <2 km of sediment thickness. On the Chatham Rise depressions correlate with thin ‘ribbons’ of sediment that form isolated, elongated basins (Cook et al., 1989; Wood et al., 1989; Bland et al., 2018a). Likewise, off the west coast of Te Waipounamu South Island, sediment thicknesses are only 1–2 km (Arnot et al., 2018) where the depressions identified by Maier et al. (2022) occur. However, in both of these areas, seismic data used to assess sediment thickness is relatively sparse, resulting in greater uncertainty. As shown in Figure 1C, pockmarks occur across the majority of offshore sedimentary basins surrounding Aotearoa New Zealand, with one key exception being the Fiordland Basin. In addition to sediment thickness, the rate of sediment deposition may be a key factor in the formation of pockmarks. Rapid sedimentation can result in sediment loading, generating pore pressures that reach and/or exceed lithostatic pressure, which would be sufficient to displace seafloor sediments and interstitial fluids within them, resulting in the formation of pockmarks (Micallef et al., 2022). High sedimentation rates may be connected to rapid uplift and erosion onshore, resulting in increased sediment supply offshore, such as the uplift of Ka Tiritiri-o-te-Moana Southern Alps (Cox and Sutherland, 2007; Hicks et al., 2011; Maier et al., 2022). Changes in sea level also influence sediment supply offshore, with deposition rates that depend on the subaerial exposure of land and changes in erosional processes (Browne and Naish, 2003; Blum and Hattier-Womack, 2009; Carter et al., 2009; Gerber et al., 2010).
Pockmarks are frequently observed in the vicinity of submarine canyons in several locations around Aotearoa New Zealand, including the Otago Slope, South Westland margin, Tasman Sea and the Hikurangi Margin. There are commonalities in the characteristics of these pockmarks, particularly those on the Otago Slope, South Westland margin and offshore Taranaki. These pockmarks occur within similar water depths of 250 – 550 m, are 100-300 m in diameter, and are generally sub-rounded in plan view, except for those on the Otago Slope being elongated due to the influence of oceanic seafloor currents. Furthermore, on both the Otago Slope and South Westland margin pockmarks have been associated with underlying sediment wave fields between submarine canyons (Hillman et al., 2015; Maier et al., 2022).
The majority of pockmarks around Aotearoa New Zealand are <2 km2 in area (Figure 3), with the exception of the ‘mega-pockmarks’ on the Chatham Rise. In general, those pockmarks observed in shallow water in locations such as Tōtaranui Queen Charlotte Sound and offshore Taranaki are smaller in area (<1 km2), while the largest pockmarks occur in water depths >600 m. However, there is no consistent correlation between pockmark size and water depth. Similarly, there is no clear correlation between the size of the pockmarks and the seafloor substrate type (Figure 7) or the geomorphic setting (Figure 5); however, the larger structures are predominantly restricted to the Chatham Rise with a few features >2 km2 along the South Westland Margin. As discussed previously, these larger pockmarks offshore the west coast of Te Waipounamu South Island are thought to be the result of submarine canyons infilling (Maier et al., 2022). The mega-pockmarks on the Chatham Rise are likely the result of multiple formation processes interacting, for example an initial venting episode creating a small pockmark that is then significantly altered and enlarged by the erosive action of currents (Hillman et al., 2018; Klaucke et al., 2018). The larger pockmarks on the South Westland Margin and the Chatham Rise are therefore not considered to be monogenetic, since there are likely to have been multiple stages of their formation and in some cases they may be composites of multiple features amalgamating to form one large pockmark (Judd and Hovland, 2007; Karaket et al., 2021).
Subsurface structures such as faults and fractures also play a role in controlling the location of pockmarks. Seismic data reveal widespread Eocene–Miocene polygonal faulting beneath the Chatham Rise and the Otago Slope (Bland et al., 2018a; Hillman et al., 2018; Klaucke et al., 2018). Such structures are often associated with compaction dewatering (Gay et al., 2006; Andresen and Huuse, 2011) or dewatering during opal A/CT transformation (Klaucke et al., 2018). These polygonal fault systems act as flow conduits bringing fluids to the seafloor, where fluid venting can then form pockmarks. However, along the Otago Slope and on the Chatham Rise, there is no clear correlation between the distribution of polygonal faulting in the subsurface relative to the position of pockmarks at the seafloor (Hillman et al., 2015; Hoffmann et al., 2019).
The role of oceanic currents
The erosive activity of strong oceanic currents such as the Southland Current has been invoked as a possible formation and/or modification mechanism of pockmarks (Hillman et al., 2018; Cojean et al., 2021; Maier et al., 2022). Elongation of depressions due to strong bottom currents has been observed beyond Aotearoa New Zealand, and recently tested using numerical modelling (Hovland et al., 2002; Yu et al., 2023). Due to the geomorphology of the region, the Southland Current is bathymetrically constrained to the shelf edge along the Otago and Canterbury coast, and the southern flank of the Chatham Rise, coinciding with the depth interval in which many pockmarks are observed. Pockmarks observed around submarine canyons on the Otago Slope, and Canterbury Slope are also strongly aligned NE–SW, which fits with the dominant current direction (Figure 4) (Hillman et al., 2018; Micallef et al., 2022). Micallef et al. (2022) also suggest that localised variation in the orientation and morphology of pockmarks off Canterbury may be the result of eddy currents induced by turbulence; such variability is also seen on the Chatham Rise where the variable bathymetry of Mernoo Saddle results in restricted north-flowing currents breaking off from the dominant east-flowing Subtropical Front (Nelson et al., 2000). Further to the south, Patel et al. (2021) observe that currents associated with the Subtropical Front have elongated pockmarks located in the Solander Basin. Similarly, pockmarks observed further north within the South Westland margin are also elongated along slope, correlating with the dominant flow direction of the Westland Current (Chiswell et al., 2015; Maier et al., 2022). The currents discussed here are surface circulation, which may not fully represent the oceanic influence at the sediment-water interface as these currents may not reach nor influence the seafloor. Furthermore, circulation/geostrophic currents are not capturing full water movement, i.e., weak currents do not mean a quiescent setting. Not all pockmarks here are elongated along slope; some are elongated downslope, indicating that overflowing turbidity currents may be a primary factor in modifying the morphology of these depressions (Maier et al., 2022). Furthermore, the action of currents may maintain pockmarks, preventing them from infilling with sediment over time due to the suspension of fine sediment by turbulence as currents flow across the pockmark and/or the deflection of currents due to the irregular seafloor morphology of the pockmarks (Hammer et al., 2009; Pau and Hammer, 2013; Cojean et al., 2021; Maier et al., 2022). Beyond scouring of the seafloor and modification of pre-existing structures, a novel mechanism linking pockmark formation to currents has been proposed: current-induced groundwater flow through canyon walls (Allen and Durrieu de Madron, 2009; Hillman, 2015). As discussed previously, a large number of pockmarks observed around Aotearoa New Zealand occur within the vicinity of submarine canyons (Figure 5); however, it is not clear whether these two geomorphic features are related in all cases, and this could be due to the fact that both sets of features occur in similar water depths.
Biological influence on seafloor geomorphology
The influence of marine mammals and fish on seafloor morphology has been discussed in several studies. Cojean et al. (2021) and Pau and Hammer (2013) suggest that the activity of fish, or bioerosion, may help to maintain pockmarks by preventing infill by sedimentation. Mueller (2015) presents the first evidence that bottom-grubbing fish are responsible for a wide variety of pockmarks along the Australian coastline. Previous studies indicate that grey whale and Cuvier’s beaked whale feeding behaviour creates pockmark like pits on the seafloor (Johnson and Nelson, 1984; Nelson et al., 1987; Woodside et al., 2006), similar features were also identified in the abyssal Pacific Ocean, which are thought to be the result of sperm whale or Ziphiidae (beaked whales) activity (Marsh et al., 2018; Purser et al., 2019). Additionally, Schneider von Deimling et al. (under review) suggest that harbour porpoise create hundreds of thousands of pockmarks in the shallow North Sea, and Purser et al. (2022) discovered large icefish breeding grounds containing circular pockmark-like nest structures. It is therefore evident that biological activity influences seafloor geomorphology and can create pockmark structures. These biogenic pockmarks are often too small to be detected by conventional multibeam echosounder systems in water depths exceeding a few hundreds of metres but can be modified and scoured out by currents. During a recent research voyage offshore from the east coast of Te Ika-a-Māui North Island, small, subtle depressions were observed during an ROV transit (Figure 8). These features are ~2 m in diameter and occur at a water depth of 1,870 m in an area of the seafloor that appears to be predominantly muddy substrate, with signs of extensive bioturbation. Whilst there is no direct evidence to identify a particular species that might be responsible for forming these structures, they are similar in appearance to those observed by Purser et al. (2019) and could conceivably be of similar biogenic origin. Due to the depth at which they occur, and their small size, such features are not visible in ship-based multibeam bathymetry data. It is possible that such features are more abundant and widespread, but poorly known due to limited data in which they can be observed.
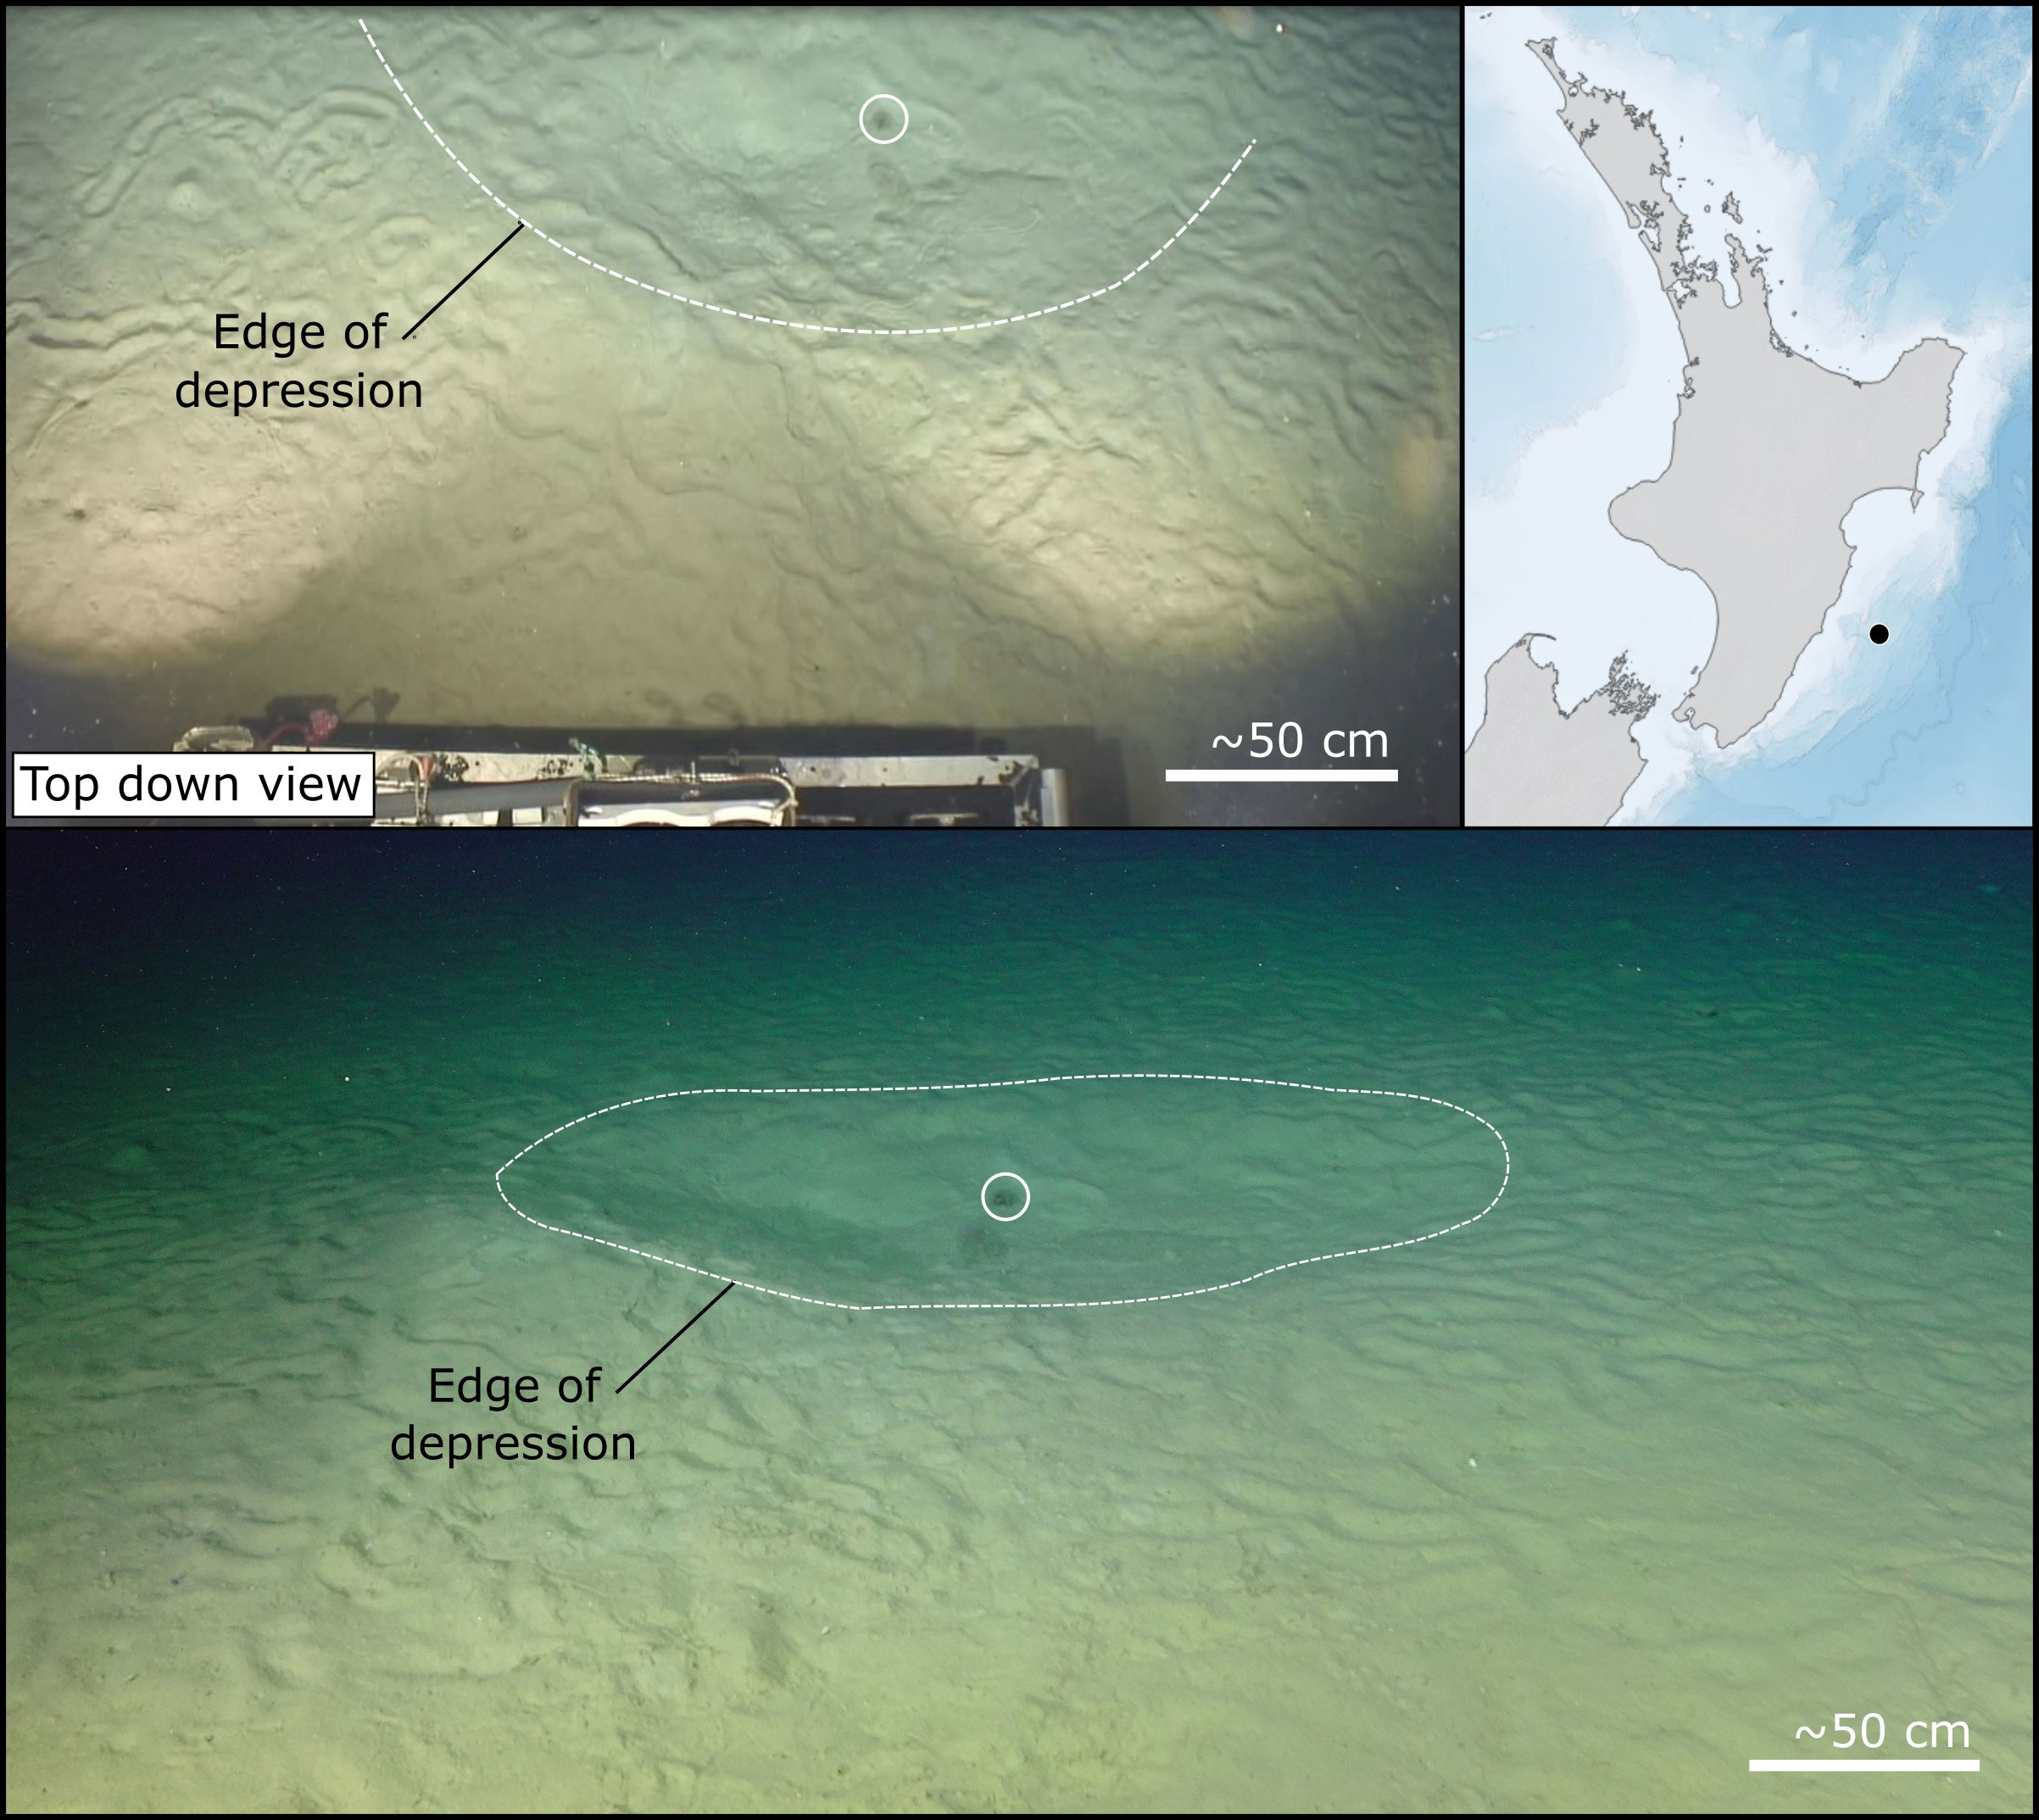
Figure 8 Depression observed at water depth of ~1,800 m during an ROV dive near Madden Canyon on the Hikurangi Margin (location indicated by the black dot on the map). The same dark coloured object on the seafloor is circled in both images as a common reference point. These depressions could be the result of bottom feeding and may be enlarged over time by the action of seafloor currents to form larger pockmarks. Image credit: ROV JASON/NSF.
Constraining the timing of formation
Pinpointing when pockmarks formed is a critical gap in our current understanding. Accurately dating the formation of these structures is problematic in the absence of targeted sampling of infill sediments that may allow us to pinpoint a minimum age of formation. The action of ocean currents further complicates this as infill may undergo phases of erosion and/or resuspension due to current activity. Furthering our understanding of sedimentation rates and their temporal variability would help to decipher not only the potential role of overburden pressure and dewatering in the formation of pockmarks, but also help constrain when they may have formed through enhanced stratigraphic control. Finally, determining the timing of formation would be an important step towards deciphering the mechanism(s) for pockmark formation. For example, correlating coeval widespread formation of pockmarks across different areas around Aotearoa New Zealand with a change in sea level would indicate that the change in hydraulic overburden, and/or changes in sediment supply due to shifting water depths and coastlines played a critical role in their formation. Conversely, if localised variability in formation timing were revealed, this would indicate that locally restricted factors such as biogenic gas generation from shallow, locally heterogeneous sediments may be more influential.
Previous studies have used several approaches to better constrain the timing of pockmark formation. Seismic interpretation has proved useful in some settings (e.g., Cole et al., 2000 , Hustoft et al., 2009; Andresen and Huuse, 2011); however, this approach relies on a robust stratigraphic model for the region in order to tie the formation of pockmarks to specific time horizons, or distinct overprinting of landforms (e.g., Batchelor et al., 2022). Isotopic dating of organic carbon, cold seep fauna, authigenic carbonates and planktonic foraminifera has also been used to better constrain the geological evolution of seep sites and their associated structures (e.g., Paull et al., 2002; Feng et al., 2010). Others have applied non-steady state models in order to further understand the timing of pockmark formation (e.g., Luo et al., 2015). A combination of these methods would likely be the best approach to gain a better understanding of the timing of pockmark formation around Aotearoa New Zealand, as the availability of suitable datasets and samples for analysis is highly variable.
Conclusions
This study provides the first Aotearoa-wide opportunity to bring together observations of pockmarks across diverse tectonic, sedimentological, and geomorphic settings, and investigate trends in pockmark distribution and characteristics. One notable finding is that there is little to no correlation between pockmarks and active seafloor seeps, which suggests that other factors potentially contribute to their formation, or that processes of formation are ephemeral or episodic. Furthermore, pockmarks are more likely to occur in regions with over 60% mud substrate at the seafloor; however, whether this is a factor of formation or preservation remains to be answered. Pockmarks have been found in almost all sedimentary basins around Aotearoa New Zealand, aside from Te Moana-a-Toi Bay of Plenty and the offshore Fiordland Basin where they are notably absent. This study also highlights critical knowledge gaps in our understanding of pockmark formation, particularly the lack of constraints on the timing of pockmark formation, which hinders our understanding of the dynamic seafloor processes that shape and influence them. Future studies would therefore benefit by focusing on constraining the timing of formation of pockmarks across a range of sites to determine whether these structures formed contemporaneously.
This compilation allows us to identify several key knowledge gaps in our understanding of pockmark formation mechanisms and the timing of formation. Firstly, better constraining bottom-current flow velocities and down-canyon flow would help to determine whether the interaction of canyon flow and sidewall groundwater mechanisms could be responsible for the formation of pockmarks. Modern seafloor observations and monitoring would help to resolve this. Furthermore, modelling of pockmark formation through gas, fluid, or mixed venting would help to determine the conditions under which these mechanisms might occur, and help characterise the resulting structures (Beggs et al., 2008). One key element would be constraining the timing of pockmark formation. If pockmarks form rapidly, in one extreme period of violent venting, then that would indicate that we are presently in a period of quiescence, with no such venting occurring. Alternatively, if they formed slowly over a long period of time, then the possibility of gradual diffuse venting that is not readily detected becomes more plausible. Modelling of pockmark formation and active monitoring of pockmark sites using instrumented deployments would also be useful in further understanding the interaction of different processes in the formation and subsequent modification of pockmarks.
Data availability statement
The raw data supporting the conclusions of this article will be made available by the authors, without undue reservation.
Author contributions
JIH, SJW, KM, JJH: data processing and analysis. JIH, SJW, KM. JJH, KB: conceptualization, literature review, writing. FW, IP, AG, BD, SB, SW: writing review. JIH: HYDEE (gas hydrate) project lead. IP: Geologic Champagne project lead. All authors contributed to the article and approved the submitted version
Funding
Funding for SJW and JTH for this work was provided by the New Zealand Hīkina Whakatutuki MBIE Endeavor Fund Programme Gas Hydrates: Economic Opportunities and Environmental Impact (HYDEE; contract CO5X1708). Additional funding for JIH, BD and IP was provided by Te Apārangi Royal Society New Zealand Te Pūtea Rangahau a Marsden Fund (Geologic Champagne: contract 19-UOA-339). Funding for KB came from the Ministry of Business, Innovation, and Employment (MBIE) Strategic Science Investment Fund (SSIF). Funding for SB was provided by the New Zealand Hīkina Whakatutuki MBIE Smart Ideas Fund Project Assessing silent tsunami risk in the Tasman Sea/Te Tai-o-Rēhua (contract C05X2104). JJH was supported by the Marie Curie action KARST, under the EU H2020 program, project number 101027303.
Acknowledgments
Data used for this study came from a large number of surveys using several different vessels, but primarily RV Tangaroa. We are grateful to the science and ship officers and crew staffing those surveys for the provision of the accumulated survey data that made this study possible.
Conflict of interest
The authors declare that the research was conducted in the absence of any commercial or financial relationships that could be construed as a potential conflict of interest.
Publisher’s note
All claims expressed in this article are solely those of the authors and do not necessarily represent those of their affiliated organizations, or those of the publisher, the editors and the reviewers. Any product that may be evaluated in this article, or claim that may be made by its manufacturer, is not guaranteed or endorsed by the publisher.
References
Allen S. E., Durrieu de Madron X. (2009). A review of the role of submarine canyons in deep-ocean exchange with the shelf. Ocean Sci. 5, 607–620. doi: 10.5194/os-5-607-2009
Allis R. G., Zhan X., Evans C., Kroopnick P. (1997). ). Groundwater flow beneath Mt Taranaki, New Zealand, and implications for oil and gas migration. New Z. J. Geology Geophysics 40, 137–149. doi: 10.1080/00288306.1997.9514748
Andresen K. J., Huuse M. (2011). “Bulls-eye” pockmarks and polygonal faulting in the Lower Congo Basin: Relative timing and implications for fluid expulsion during shallow burial. Mar. Geol. 279, 111–127. doi: 10.1016/j.margeo.2010.10.016
Anell I., Midtkandal I. (2017). The quantifiable clinothem - types, shapes and geometric relationships in the Plio-Pleistocene Giant Foresets Formation, Taranaki Basin, New Zealand. Basin Res. 29, 277–297. doi: 10.1111/bre.12149
Arnot M. J., Bland K. J., Arnot J., Kroeger K. F., Seebeck H. C. M. J. (2016). Atlas of Petroleum Prospectivity, Northwest Province: ArcGIS geodatabase and technical report (Lower Hutt, New Zealand: GNS Science). Available at: www.gns.cri.nz.
Arnot M. J., Lawrence M. J. F., Viskovic G. P. D., Zhu H., Bland K. J., Strogen D. P., et al. (2018). Atlas of Petroleum Prospectivity, Southwest Province (West Coast, Fiordland, and western Southland basins) (Lower Hutt, New Zealand: GNS Science Data Series 23e).
Audsley A., Bradwell T., Howe J. A., Baxter J. M. (2019). Distribution and classification of pockmarks on the seabed around western Scotland. J. Maps 15, 807–817. doi: 10.1080/17445647.2019.1676320
Baco A. R., Rowden A. A., Levin L. A., Smith C. R., Bowden D. A. (2010). Initial characterization of cold seep faunal communities on the New Zealand Hikurangi margin. Mar. Geol. 272, 251–259. doi: 10.1016/J.MARGEO.2009.06.015
Ballance P. F. (1993). “The New Zealand neogene forearc basins,” in South Pacific sedimentary basins, sedimentary basins of the world. Ed. Hsü K. J. (Amsterdam: Elsevier Sciences Publishers).
Barnes P. M. (1992). Mid-bathyal current scours and sediment drifts adjacent to the Hikurangi deep-sea turbidite channel, eastern New Zealand: Evidence from echo character mapping. Mar. Geol. 106, 169–187. doi: 10.1016/0025-3227(92)90128-5
Barnes P. M., Lamarche G., Bialas J., Henrys S. A., Pecher I., Netzeband G. L., et al. (2010). Tectonic and geological framework for gas hydrates and cold seeps on the Hikurangi subduction margin, New Zealand. Mar. Geol. 272, 26–48. doi: 10.1016/J.MARGEO.2009.03.012
Batchelor C. L., Frinault B. A. V., Christie F. D. W., Montelli A., Dowdeswell J. A. (2022). The morphology of pockmarks on the north-east Antarctic Peninsula continental shelf. Antarct Sci. 34, 313–324. doi: 10.1017/S0954102022000177
Beggs J. M., Ghisetti F. C., Tulloch A. J. (2008). Basin and petroleum systems analysis of the West Coast Region (South Island, New Zealand).
Bialas J., Klaucke I., Mögeltönder J. (Eds.) (2013). RV SONNE fahrtbericht/cruise report SO226 - CHRIMP CHatham RIse methane pockmarks GEOMAR report, N. Ser. 007 (Kiel, Germany: GEOMAR Helmholtz-Zentrum für Ozeanforschung, Kiel, Germany). doi: 10.3289/GEOMAR_REP_NS_7_2013
Bland K. J., Sahoo T. R., Viskovic G. P. D. (2018a). Atlas of Petroleum Prospectivity, Campbell frontier (Far Frontiers Province): ArcGIS geodatabase, illustrated seismic transects and technical report (GNS Science, Lower Hutt, New Zealand). Available at: www.gns.cri.nz.
Bland K. J., Strogen D. P. (2018). Atlas of Petroleum Prospectivity, Tasman frontier (Far Frontiers Province): ArcGIS geodatabase, illustrated seismic transects, and technical report (GNS Science, Lower Hutt, New Zealand). Available at: www.gns.cri.nz.
Bland K. J., Uruski C. I., Isaac M. J. (2015). Pegasus Basin, eastern New Zealand: A stratigraphic record of subsidence and subduction, ancient and modern. New Z. J. Geology Geophysics 58, 319–343. doi: 10.1080/00288306.2015.1076862
Bland K. J., Zhu H., Strogen D. P., Viskovic G. P. D. (2018b) Atlas of Petroleum Prospectivity, Chatham-Bounty frontier (Far Frontiers Province): ArcGIS geodatabase, illustrated seismic transects and technical report. Available at: www.gns.cri.nz.
Blum M. D., Hattier-Womack J. (2009). “Climate change, sea-level change, and fluvial sediment supply to deepwater depositional systems,” in External controls of deep-water depositional systems, Editors: Ben Kneller, Ole J. Martinsen, Bill McCaffrey, SEPM Special Publication No. 92, SEPM (Society for Sedimentary Geology), USA 15–39. doi: 10.2110/SEPMSP.092.015
Bostock H., Jenkins C., Mackay K., Carter L., Nodder S., Orpin A., et al. (2018a). Distribution of surficial sediments in the ocean around New Zealand/Aotearoa. Part A: continental slope and deep ocean. New Z. J. Geology Geophysics 62, 1–23. doi: 10.1080/00288306.2018.1523198
Bostock H., Jenkins C., Mackay K., Carter L., Nodder S., Orpin A., et al. (2018b). Distribution of surficial sediments in the ocean around New Zealand/Aotearoa. Part B: continental shelf. New Z. J. Geology Geophysics 62, 1–22. doi: 10.1080/00288306.2018.1523199
Bostock H., Maas E., Mountjoy J., Nodder S. (2010). Bay of Islands OS20/20 survey report chapter 03: seafloor and subsurface sediment characteristics. NIWA Client Report WG2010-38 (National Institute of Water and Atmospheric Research (NIWA), Wellington, New Zealand), 73p.
Boxberg F., Blossier B., de Lange W. P., Fox B., Hebbeln D. (2020). Sediment deposition in the central Hauraki Gulf, New Zealand. Geo-Mar Lett. 40, 227–241. doi: 10.1007/s00367-019-00583-1
Browne G. H., Naish T. R. (2003). Facies development and sequence architecture of a late Quaternary fluvial-marine transition, Canterbury Plains and shelf, New Zealand: implications for forced regressive deposits. Sediment Geol. 158, 57–86. doi: 10.1016/S0037-0738(02)00258-0
Bull S., Nicol A., Strogen D., Kroeger K. F., Seebeck H. S. (2019). Tectonic controls on Miocene sedimentation in the Southern Taranaki Basin and implications for New Zealand plate boundary deformation. Basin Res. 31, 253–273. doi: 10.1111/bre.12319
Carter R. M. (1988). Post-breakup stratigraphy of the Kaikoura Synthem (Cretaceous-Cenozoic), continental margin, southeastern New Zealand. New Z. J. Geology Geophysics 31, 405–429. doi: 10.1080/00288306.1988.10422141
Carter R. M., Abbott S. T., Fulthorpe C. S., Haywick D. W., Henderson R. A. (2009). “Application of global sea-level and sequence-stratigraphic models in southern hemisphere neogene strata from New Zealand,” in Sedimentation, tectonics and eustasy, Wiley, USA, 41–65. doi: 10.1002/9781444303896.CH2
Carter L., Carter R. M., Nelson C. S., Fulthorpe C. S., Neil H. L. (1990). Evolution of Pliocene to Recent abyssal sediment waves on Bounty Channel levees, New Zealand. Mar. Geol. 95, 97–109. doi: 10.1016/0025-3227(90)90043-J
Chenrai P., Huuse M. (2017). Pockmark formation by porewater expulsion during rapid progradation in the offshore Taranaki Basin, New Zealand. Mar. Pet. Geol. 82, 399–413. doi: 10.1016/j.marpetgeo.2017.02.017
Chiswell S. M., Bostock H. C., Sutton P. J., Williams M. J. (2015). Physical oceanography of the deep seas around New Zealand: a review. N Z J. Mar. Freshw. Res. 49, 286–317. doi: 10.1080/00288330.2014.992918
Coffin R. B., Boyd T. J., Rose P. S., Yoza B., Milholland L. C., Downer R., et al. (2013). Geochemical cruise report: SO226/2 RV sonne chatham rise expedition (Washington, DC, USA: US Naval Research Laboratory).
Cojean A. N. Y., Kremer K., Bartosiewicz M., Fabbri S. C., Lehmann M. F., Wirth S. B. (2021). Morphology, Formation, and Activity of Three Different Pockmark Systems in Peri-Alpine Lake Thun, Switzerland. Front. Water 3. doi: 10.3389/frwa.2021.666641
Cole D., Stewart S. A., Cartwright J. A. (2000). Giant irregular pockmark craters in the Palaeogene of the Outer Moray Firth Basin, UK North Sea. Mar. Pet. Geol. 17, 563–577. doi: 10.1016/S0264-8172(00)00013-1
Collins J. A., Molnar P., Sheehan A. F. (2011). Multibeam bathymetric surveys of submarine volcanoes and mega-pockmarks on the Chatham Rise, New Zealand. New Z. J. Geology Geophysics 54, 329–339. doi: 10.1080/00288306.2011.589860
Cook R. A. (1982). An oil seep at Leask Bay, Stewart Island, New Zealand. New Z. J. Geology Geophysics 25, 115–119. doi: 10.1080/00288306.1982.10422510
Cook R. A., Sutherland R., Zhu H. (1999). Cretaceous-Cenozoic geology and petroleum systems of the Great South Basin, New Zealand (GNS Science, Lower Hutt, New Zealand).
Cook R. A., Wood R. A., Campbell H. J. (1989). The Chatham Rise: an exploration frontier. in 1989 Petroleum Conference (New Zealand), Ministry of Economic Development, New Zealand Petroleum and Minerals. 81, 35–41. Wellington, New Zealand.
Cox S. C., Sutherland R. (2007). “Regional geological framework of South Island, New Zealand, and its significance for understanding the active plate boundary”, in A Continental Plate Boundary: Tectonics at South Island, New Zealand, AGU Geophysical Monograph Series, Volume 175, 19–46. doi: 10.1029/175GM03
Crutchley G. J., Gorman A. R., Fohrmann M. (2007). Investigation of the role of gas hydrates in continental slope stability west of Fiordland, New Zealand. New Zealand Journal of Geology and Geophysics 50, 357–364. doi: 10.1080/00288300709509842
Crutchley G. J., Gorman A. R., Pecher I. A., Toulmin S., Henrys S. A. (2011). Geological controls on focused fluid flow through the gas hydrate stability zone on the southern Hikurangi Margin of New Zealand, evidenced from multi-channel seismic data. Mar. Pet. Geol. 28, 1915–1931. doi: 10.1016/j.marpetgeo.2010.12.005
Crutchley G. J., Kroeger K. F., Pecher I. A., Gorman A. R. (2019). How tectonic folding influences gas hydrate formation: New Zealand’s Hikurangi subduction margin. Geology 47, 39–42. doi: 10.1130/G45151.1
Czochanska Z., Sheppard C. M., Weston R. J., Woolhouse A. D. (1987). A biological marker study of oils and sediments from the West Coast, South Island, New Zealand. New Z. J. Geology Geophysics 30, 1–17. doi: 10.1080/00288306.1987.10422190
Davy B., Pecher I., Wood R., Carter L., Gohl K. (2010). Gas escape features off New Zealand: Evidence of massive release of methane from hydrates. Geophys Res. Lett. 37, 1–5. doi: 10.1029/2010GL045184
Donaldson I. G., Campbell D. G. (1977). Groundwater of the hutt valley-port nicholson alluvial basin - A resource evaluation (GNS Science, Lower Hutt, New Zealand).
Feng D., Roberts H. H., Cheng H., Peckmann J., Bohrmann G., Lawrence Edwards R., et al. (2010). U/Th dating of cold-seep carbonates: An initial comparison. Deep Sea Res. Part II: Topical Stud. Oceanography 57, 2055–2060. doi: 10.1016/j.dsr2.2010.09.004
Field M. E., Jennings A. E. (1987). Seafloor gas seeps triggered by a northern California earthquake. Mar. Geol. 77, 39–51. doi: 10.1016/0025-3227(87)90082-X
Gay A., Lopez M., Berndt C., Séranne M. (2007). Geological controls on focused fluid flow associated with seafloor seeps in the Lower Congo Basin. Mar. Geol. 244, 68–92. doi: 10.1016/j.margeo.2007.06.003
Gay A., Lopez M., Cochonat P., Seranne M., Levache D., Sermondadaz G. (2006). Isolated seafloor pockmarks linked to BSRs, fluid chimneys, polygonal faults and stacked Oligocene-Miocene turbiditic palaeochannels in the Lower Congo Basin. Mar. Geol. 226, 25–40. doi: 10.1016/j.margeo.2005.09.018
Gerber T. P., Pratson L. F., Kuehl S., Walsh J. P., Alexander C., Palmer A. (2010). The influence of sea level and tectonics on Late Pleistocene through Holocene sediment storage along the high-sediment supply Waipaoa continental shelf. Mar. Geol. 270, 139–159. doi: 10.1016/J.MARGEO.2009.10.002
Greinert J., Bialas J., Lewis K., Suess E. (2010). Methane seeps at the Hikurangi Margin, New Zealand: Overview of studies in2002, 006 and2002, 007 and new evidence from visual, bathymetric and hydroacoustic investigations. Mar. Geol. 272, 1–3. doi: 10.1016/j.margeo.2010.02.018
Hammer Ø., Webb K. E., Depreiter D. (2009). Numerical simulation of upwelling currents in pockmarks, and data from the inner Oslofjord, Norway. Geo-Mar. Lett. 29, 269–275. doi: 10.1007/s00367-009-0140-z
Hansen R. J., Kamp P. J. J. (2004). Late Miocene to early Pliocene stratigraphic record in northern Taranaki Basin: Condensed sedimentation ahead of Northern Graben extension and progradation of the modern continental margin. New Z. J. Geology Geophysics 47, 645–662. doi: 10.1080/00288306.2004.9515081
Harris P. T., Macmillan-Lawler M., Rupp J, Baker E. K. (2014). Geomorphology of the oceans. Mar Geol. 352, 4–24. doi: 10.1016/j.margeo.2014.01.011
Heiniö P., Davies R. J. (2009). Trails of depressions and sediment waves along submarine channels on the continental margin of Espirito Santo Basin, Brazil. GSA Bull. 121, 698–711. doi: 10.1130/B26190.1
Hicks D. M., Shankar U., McKerchar A. I., Basher L., Jessen M., Lynn I., et al. (2011). Suspended sediment yields from New Zealand rivers. J. Hydrol (Amst) 50, 81–142.
Higgs B., Mountjoy J. J., Crutchley G. J., Townend J., Ladroit Y., Greinert J., et al. (2019). Seep-bubble characteristics and gas flow rates from a shallow-water, high-density seep field on the shelf-to-slope transition of the Hikurangi subduction margin. Mar. Geol. 417, 105985. doi: 10.1016/J.MARGEO.2019.105985
Hillman J. I. T. (2015) Investigation of seafloor depressions east of New Zealand’s South Island to explore their potential link to methane transport processes between the seafloor and ocean. Available at: http://hdl.handle.net/10523/5612.
Hillman J. I. T., Crutchley G. J., Kroeger K. F. (2020). Investigating the role of faults in fluid migration and gas hydrate formation along the southern Hikurangi Margin, New Zealand. Mar. Geophysical Res. 41, 8. doi: 10.1007/s11001-020-09400-2
Hillman J. I. T., Gorman A. R., Pecher I. (2015). Geostatistical analysis of seafloor depressions on the southeast margin of New Zealand’s South Island – Investigating the impact of dynamic near seafloor processes on geomorphology. Mar. Geol. 360, 70–83. doi: 10.1016/j.margeo.2014.11.016
Hillman J. I. T., Klaucke I., Pecher I. A., Gorman A. R., Schneider von Deimling J., Bialas J. (2018). The influence of submarine currents associated with the Subtropical Front upon seafloor depression morphologies on the eastern passive margin of South Island, New Zealand. New Z. J. Geology Geophysics 61, 112–125. doi: 10.1080/00288306.2018.1434801
Hillman J. I. T., Lamarche G., Pallentin A., Pecher I. A., Gorman A. R., Schneider von Deimling J. (2017). Validation of automated supervised segmentation of multibeam backscatter data from the Chatham Rise, New Zealand. Mar. Geophysical Res. 39, 1–23. doi: 10.1007/s11001-016-9297-9
Hillman J. I. T., Watson S. J., Bull S., Arnot M. J., Pallentin A., Quinn W., et al. (2022). Te tai-o-rēhua – silent tsunami voyage report R/V tangaroa TAN2205 17 march – 7 april2022, 022, Wellington–Wellington (GNS Science, Lower Hutt, New Zealand). doi: 10.21420/ZXQ4-6T90
Hoffmann J. J. L., Gorman A. R., Crutchley G. J. (2019). Seismic evidence for repeated vertical fluid flow through polygonally faulted strata in the Canterbury Basin, New Zealand. Mar. Pet. Geol. 109, 317–329. doi: 10.1016/J.MARPETGEO.2019.06.025
Hoffmann J., Mountjoy J., Spain E., Gall M., Tait L. W., Ladroit Y., et al. (2023). Fresh submarine groundwater discharge offshore Wellington (New Zealand): Hydroacoustic characteristics and its influence on seafloor geomorphology. Front. Mar. Sci. 10. doi: 10.3389/fmars.2023.1204182
Hollis C. J., Tayler M. J. S., Andrew B., Taylor K. W., Lurcock P., Bijl P. K., et al. (2014). Organic-rich sedimentation in the South Pacific Ocean associated with Late Paleocene climatic cooling. Earth Sci. Rev. 134, 81–97. doi: 10.1016/j.earscirev.2014.03.006
Hovland M., Gardner J. V., Judd A. G. (2002). The significance of pockmarks to understanding fluid flow processes and geohazards. Geofluids 2, 127–136. doi: 10.1046/j.1468-8123.2002.00028.x
Hovland M., Judd A. G. (1988). Seabed pockmarks and seepages: impact on geology, biology and the marine environment (Graham and Trotman Inc, UK).
Hübscher C., Borowski C. (2006). Seismic evidence for fluid escape from Mesozoic cuesta type topography in the Skagerrak. Mar. Pet. Geol. 23, 17–28. doi: 10.1016/j.marpetgeo.2005.07.004
Hulme S., Doolittle D., Hutnak M., Gharib J. (2015). Unpublished petroleum report PR5365: PEP57083, PEP57085, PEP57087 integrated final report: geophysical, geochemical and heat flow survey (Fugro Marine Geoservices, Houston, USA).
Hustoft S., Bünz S., Mienert J., Chand S. (2009). Gas hydrate reservoir and active methane-venting province in sediments on <20 Ma young oceanic crust in the Fram Strait, offshore NW-Svalbard. Earth Planet Sci. Lett. 284, 12–24. doi: 10.1016/j.epsl.2009.03.038
Johnson K. R., Nelson C. H. (1984). Side-scan sonar assessment of gray whale feeding in the Bering Sea. Science 225, 1150–1152. doi: 10.1126/science.225.4667.1150. (1979)
Jones A., Baker T. (2005). Groundwater monitoring technical report (Greater Wellington Regional Council, Wellington, New Zealand).
Jones A. T., Greinert J., Bowden D. A., Klaucke I., Petersen C. J., Netzeband G. L., et al. (2010). Acoustic and visual characterisation of methane-rich seabed seeps at Omakere Ridge on the Hikurangi Margin, New Zealand. Mar. Geol. 272, 154–169. doi: 10.1016/J.MARGEO.2009.03.008
Judd A., Hovland M. (2007). Seabed fluid flow: the impact on geology, biology and the marine environment (Cambridge, UK: Cambridge University Press).
Kamp P. J. J., Vonk A. J., Bland K. J., Hansen R. J., Hendy A. J. W., McIntyre A. P., et al. (2004). Neogene stratigraphic architecture and tectonic evolution of Wanganui, King Country, and eastern Taranaki Basins, New Zealand. New Z. J. Geology Geophysics 47, 625–644. doi: 10.1080/00288306.2004.9515080
Karaket A., Chenrai P., Huuse M. (2021). Seismic characteristics of paleo-pockmarks in the great south basin, New Zealand. Front. Earth Sci. (Lausanne) 9. doi: 10.3389/feart.2021.683617
Karstens J., Haflidason H., Becker L. W. M., Berndt C., Rüpke L., Planke S., et al. (2018). Glacigenic sedimentation pulses triggered post-glacial gas hydrate dissociation. Nat. Commun. 9, 635. doi: 10.1038/s41467-018-03043-z
Ketzer M., Praeg D., Rodrigues L. F., Augustin A., Pivel M. A. G., Rahmati-Abkenar M., et al. (2020). Gas hydrate dissociation linked to contemporary ocean warming in the southern hemisphere. Nat. Commun. 11, 3788. doi: 10.1038/s41467-020-17289-z
Killops S. D., Cook R. A., Sykes R., Boudou J. P. (1997). Petroleum potential and oil-source correlation in the Great South and Canterbury Basins. New Z. J. Geology Geophysics 40, 405–423. doi: 10.1080/00288306.1997.9514773
King L. H., MacLean B. (1970). Pockmarks on the scotian shelf. Geol Soc. Am. Bull. 81, 3141–3148. doi: 10.1130/0016-7606(1970)81[3141:POTSS]2.0.CO;2
King P. R., Thrasher G. P. (1996). Cretaceous-Cenozoic geology and petroleum systems of the Taranaki Basin, New Zealand (Lower Hutt: GNS Science).
Klaucke I., Sarkar S., Bialas J., Berndt C., Dannowski A., Dumke I., et al. (2018). Giant depressions on the Chatham Rise offshore New Zealand – Morphology, structure and possible relation to fluid expulsion and bottom currents. Mar. Geol. 399. 158–169. doi: 10.1016/j.margeo.2018.02.011
Klaucke I., Weinrebe W., Petersen C. J., Bowden D. (2010). Temporal variability of gas seeps offshore New Zealand: Multi-frequency geoacoustic imaging of the Wairarapa area, Hikurangi margin. Mar. Geol. 272, 49–58. doi: 10.1016/J.MARGEO.2009.02.009
Krämer K., Holler P., Herbst G., Bratek A., Ahmerkamp S., Neumann A., et al. (2017). Abrupt emergence of a large pockmark field in the German Bight, southeastern North Sea. Sci. Rep. 7, 5150. doi: 10.1038/s41598-017-05536-1
Kroeger K. F., Crutchley G. J., Hill M., Pecher I. A. (2017). Potential for gas hydrate formation at the northwest New Zealand shelf margin – New insights from seismic reflection data and petroleum systems modelling. Mar. Pet. Geol. doi: 10.1016/j.marpetgeo.2017.02.025
Kroeger K. F., Crutchley G. J., Kellett R., Barnes P. M. (2019). A 3D model of gas generation, migration and gas hydrate formation at a young convergent margin (Hikurangi Margin, New Zealand). Geochemistry Geophysics Geosystems. doi: 10.1029/2019GC008275
Kumar P. C., Alves T. M., Sain K. (2021). Submarine canyon systems focusing sub-surface fluid in the Canterbury Basin, South Island, New Zealand. Sci. Rep. 11, 16990. doi: 10.1038/s41598-021-96574-3
Langridge R., Ries W., Litchfield N., Villamor P., Van Dissen R., Barrell D., et al. (2016). The New Zealand active faults database. New Z. J. Geology Geophysics 59, 86–96. doi: 10.1080/00288306.2015.1112818
Lewis K. B., Pettinga J. R. (1993). “The emerging imbricate frontal wedge of the Hikurangi Margin,” in Sedimentary basins of the world, vol. 2 . Ed. Ballance P. F. (Amsterdam: The Netherlands: Elsevier Science), 225–250.
Li J., White P. R., Roche B., Bull J. M., Davis J. W., Leighton T. G., et al. (2019). “Natural seabed gas leakage -- variability imposed by tidal cycles,” in Oceans 2019 MTS/IEEE Seattle (IEEE), 1–6. doi: 10.23919/OCEANS40490.2019.8962746
Litchfield N., Van Dissen R., Sutherland R., Barnes P., Cox S., Norris R., et al. (2014). A model of active faulting in New Zealand. New Z. J. Geology Geophysics 57, 32–56. doi: 10.1080/00288306.2013.854256
Loncke L., Mascle J., Fanil Scientific Parties (2004). Mud volcanoes, gas chimneys, pockmarks and mounds in the Nile deep-sea fan (Eastern Mediterranean): geophysical evidences. Mar. Pet. Geol. 21, 669–689. doi: 10.1016/j.marpetgeo.2004.02.004
Lu H. B., Fulthorpe C. S. (2004). Controls on sequence stratigraphy of a middle Miocene-Holocene current-swept, passive margin: Offshore Canterbury Basin, New Zealand. GSA Bull. 116, 1345–1366. doi: 10.1130/B2525401.1
Lu H. B., Fulthorpe C. S., Mann P. (2003). Three-dimensional architecture of shelf-building sediment drifts in the offshore Canterbury Basin, New Zealand. Mar. Geol. 193, 19–47. doi: 10.1016/S0025-3227(02)00612-6
Luo M., Dale A. W., Wallmann K., Hensen C., Gieskes J., Yan W., et al. (2015). Estimating the time of pockmark formation in the SW Xisha Uplift (South China Sea) using reaction-transport modeling. Mar. Geol. 364, 21–31. doi: 10.1016/j.margeo.2015.03.006
Lurton X. (2010). An introduction to underwater acoustics : principles and applications (London; New York: Springer). Available at: http://www.loc.gov/catdir/enhancements/fy0813/2002030560-d.html.
Maier K. L., Orpin A. R., Neil H. (2022). Seafloor pockmarks on the South Westland margin of the South Island/Te Waipounamu, Aotearoa New Zealand. New Z. J. Geology Geophysics 66, 1–17. doi: 10.1080/00288306.2021.2011328
Marsh L., Huvenne V. A. I., Jones D. O. B. (2018). Geomorphological evidence of large vertebrates interacting with the seafloor at abyssal depths in a region designated for deep-sea mining. R Soc. Open Sci. 5, 180286. doi: 10.1098/rsos.180286
McDougall J. C. (1982). Bounty sediments. New Zealand oceanographic institute chart, oceanic series, 1:1 000 000. (New Zealand Oceanographic Institute, Wellington, New Zealand).
Micallef A., Averes T., Hoffmann J., Crutchley G., Mountjoy J. J., Person M., et al. (2022). Multiple drivers and controls of pockmark formation across the Canterbury Margin, New Zealand. Basin Res. 34, 1374–1399. doi: 10.1111/bre.12663
Mildenhall D. C. (1994). Palynostratigraphy and paleoenvironments of Wellington, New Zealand, during the last 80 ka, based on palynology of drillholes. New Z. J. Geology Geophysics 37, 421–436. doi: 10.1080/00288306.1994.9514631
Mitchell J., Neil H. L. (2012). OS20/20 canterbury - Great South Basin: TAN1209 voyage report (National Institute of Water and Atmospheric Research Ltd (NIWA), Wellington, New Zealand).
Mortimer N. (2004). New Zealand’s geological foundations. Gondwana Res. 7, 261–272. doi: 10.1016/S1342-937X(05)70324-5
Mortimer N., Campbell H. J., Tulloch A. J., King P. R., Stagpoole V. M., Wood R. A., et al. (2017). Zealandia: Earth’s hidden continent. GSA Today, 27–35. doi: 10.1130/GSATG321A.1
Mortimer N., Rattenbury M., King P., Bland K., Barrell D., Bache F., et al. (2014). High-level stratigraphic scheme for New Zealand rocks. New Z. J. Geology Geophysics 57, 402–419. doi: 10.1080/00288306.2014.946062
Mortimer N., Smith Lyttle B., Black J. (2020). Te Riu-a-Māui / Zealandia digital geoscience data compilation, scale 1:8 500 000. GNS Science Geological Map 11. Lower Hutt, New Zealand. doi: 10.21420/GYZR-YW05
Mueller R. J. (2015). Evidence for the biotic origin of seabed pockmarks on the Australian continental shelf. Mar. Pet. Geol. 64, 276–293. doi: 10.1016/j.marpetgeo.2014.12.016
Nau A. W., Scoulding B., Kloser R. J., Ladroit Y., Lucieer V. (2022). Extended detection of shallow water gas seeps from multibeam echosounder water column data. Front. Remote Sens. 3. doi: 10.3389/FRSEN.2022.839417
Naudts L., Greinert J., Poort J., Belza J., Vangampelaere E., Boone D., et al. (2010). Active venting sites on the gas-hydrate-bearing Hikurangi Margin, off New Zealand: Diffusive- versus bubble-released methane. Mar. Geol. 272, 233–250. doi: 10.1016/j.margeo.2009.08.002
Neil H., Mackay K., Davey N. (2017). Queen Charlotte Sound / Tōtaranui and Tory Channel / Kura Te Au (HS51) Hydrographic Survey Marine Mammal Observations. The National Institute of Water and Atmospheric Research (NIWA), Wellington, New Zealand, Sampling event Dataset. doi: 10.15468/s7ctpf
Nelson C. S., Healy T. R. (1984). Pockmark-like structures on the Poverty Bay sea bed — possible evidence for submarine mud volcanism. New Z. J. Geology Geophysics 27, 225–230. doi: 10.1080/00288306.1984.10422530
Nelson C. S., Hendy I. L., Neil H. L., Hendy C. H., Weaver P. P. E. (2000). Last glacial jetting of cold waters through the Subtropical Convergence zone in the Southwest Pacific off eastern New Zealand, and some geological implications. Palaeogeogr Palaeoclimatol Palaeoecol 156, 103–121. doi: 10.1016/S0031-0182(99)00134-0
Nelson C. H., Johnson K. R., Barber J. H. (1987). Gray whale and walrus feeding excavation on the Bering Shelf, Alaska. J. Sedimentary Res. 57, 419–430.
Nelson C. S., Lawless A. S., Nodder S. D., Zwingmann H. (2022). Latest Miocene (Kapitean/Messinian) glauconite and the central Chatham Rise greensand: an enigmatic, highly condensed, relict/palimpsest deposit on the modern seafloor. New Z. J. Geology Geophysics 65, 529–554. doi: 10.1080/00288306.2021.1977341
Netzeband G. L., Krabbenhoeft A., Zillmer M., Petersen C. J., Papenberg C., Bialas J. (2010). The structures beneath submarine methane seeps: Seismic evidence from Opouawe Bank, Hikurangi Margin, New Zealand. Mar Geol. 272, 59–70. doi: 10.1016/J.MARGEO.2009.07.005
New Zealand Petroleum and Minerals (2014a). New Zealand petroluem basins - part one (Wellington, New Zealand: New Zealand Petroleum and Minerals). Available at: https://www.nzpam.govt.nz/assets/Uploads/doing-business/nz-petroleum-basins-part-one.pdf.
New Zealand Petroleum and Minerals (2014b). New Zealand petroluem basins - part one (Wellington, New Zealand: New Zealand Petroleum and Minerals). Available at: https://www.nzpam.govt.nz/assets/Uploads/doing-business/nz-petroleum-basins-part-two.pdf.
Nicol A. (2011). Landscape history of the marlborough sounds, New Zealand. New Z. J. Geology Geophysics 54, 195–208. doi: 10.1080/00288306.2010.523079
Nicol A., Mazengarb C., Chanier F., Rait G., Uruski C., Wallace L. (2007). Tectonic evolution of the active Hikurangi subduction margin, New Zealand, since the Oligocene. Tectonics 26. doi: 10.1029/2006TC002090. n/a-n/a.
Nodder S. D. (1995). Late quaternary transgressive/regressive sequences from Taranaki continental shelf, western New Zealand. Mar. Geol. 123, 187–214. doi: 10.1016/0025-3227(95)00004-I
Ogebule O., Pecher I. (2010). Possible gas hydrates in the Northland and northern Taranaki Basins: Indirect evidence from seismic data. New Zealand Journal of Geology and Geophysics 53, 369–373. doi: 10.1080/00288306.2010.526546
Osterberg E. C. (2006). Late Quaternary (marine isotope stages 6-1) seismic sequence stratigraphic evolution of the Otago continental shelf, New Zealand. Mar. Geol. 229, 159–178. doi: 10.1016/j.margeo.2006.03.005
Pallentin A., Watson S. J., Spain E., Woelz S., Steinmetz T., Otis P. (2022). Benthic habitat analysis of approaches to Auckland. Desktop classifications using multibeam bathymetric data collected from hydrographic survey HS52. Prepared by the National Institute of Water and Atmospheric Research, NIWA for Auckland Council. Wellington.
Patel J., Sutherland R., Gurnis M., Van Avendonk H., Gulick S. P. S., Shuck B., et al. (2021). Stratigraphic architecture of Solander Basin records Southern Ocean currents and subduction initiation beneath southwest New Zealand. Basin Res. 33, 403–426. doi: 10.1111/bre.12473
Pau M., Hammer T. (2013). Sediment mapping and long-term monitoring of currents and sediment fluxes in pockmarks in the Oslofjord, Norway. Mar. Geol. 346, 262–273. doi: 10.1016/j.margeo.2013.09.012
Paull C. K., Ussler W., Maher N., Greene H. G., Rehder G., Lorenson T. D., et al. (2002). Pockmarks off big sur, California. Mar. Geol. 181, 323–335. doi: 10.1016/S0025-3227(01)00247-X
Pecher I. A., Plaza-Faverola A., Fohrmann M., Gorman A. R., Bowden D., Rowden A., et al. (2013). Gas hydrate resources (GHR2012 010-2012) summary report on the GHR Research Programme. GNS Science miscellaneous series (GNS Science, Lower Hutt, New Zealand). Available at: https://shop.gns.cri.nz/ms_65-pdf/.
Pilcher R., Argent J. (2007). Mega-pockmarks and linear pockmark trains on the West African continental margin. Mar. Geol. 244, 15–32. doi: 10.1016/j.margeo.2007.05.002
Pulford A., Stern T. (2004). Pliocene exhumation and landscape evolution of central North Island, New Zealand: The role of the upper mantle. J. Geophys Res. Earth Surf 109. doi: 10.1029/2003JF000046
Purser A., Hehemann L., Boehringer L., Tippenhauer S., Wege M., Bornemann H., et al. (2022). A vast icefish breeding colony discovered in the Antarctic. Curr. Biol. 32, 842–850.e4. doi: 10.1016/j.cub.2021.12.022
Purser A., Herr H., Dreutter S., Dorschel B., Glud R. N., Hehemann L., et al. (2019). Depression chains in seafloor of contrasting morphology, Atacama Trench margin: A comment on Marsh et al. (2018). R Soc. Open Sci. 6. doi: 10.1098/rsos.182053
Reilly C., Nicol A., Walsh J. J., Kroeger K. F. (2016). Temporal changes of fault seal and early charge of the Maui Gas-condensate field, Taranaki Basin, New Zealand. Mar. Pet. Geol. 70, 237–250. doi: 10.1016/j.marpetgeo.2015.11.018
Riboulot V., Thomas Y., Berné S., Jouet G., Cattaneo A. (2014). Control of Quaternary sea-level changes on gas seeps. Geophys Res. Lett. 41, 4970–4977. doi: 10.1002/2014GL060460
Rise L., Bellec V. K., Chand S., Bøe R. (2015). Pockmarks in the southwestern Barents Sea and Finnmark fjords. Norwegian J. Geology 94, 263–282. doi: 10.17850/njg94-4-02
Rise L., Sættem J., Fanavoll S., Thorsnes T., Ottesen D., Bøe R. (1999). Sea-bed pockmarks related to Fuid migration from Mesozoic bedrock strata in the Skagerrak offshore Norway. Mar. Pet. Geol. 16, 619–631. doi: 10.1016/S0264-8172(99)00017-3
Sahoo T. R., Bland K. J., Strogen D. P., Arnot M. J., Boyes A. F., Lawrence M. J. F., et al. (2017). Atlas of Petroleum Prospectivity, Southeast Province: ArcGIS geodatabase and technical report (Lower Hutt Available at: www.gns.cri.nz).
Schattner U., Lazar M., Souza L. A. P., Ten Brink U., Mahiques M. M. (2016). Pockmark asymmetry and seafloor currents in the Santos Basin offshore Brazil. Geo-Marine Lett. 36, 1–8. doi: 10.1007/s00367-016-0468-0
Schiøler P., Rogers K., Sykes R., Hollis C. J., Ilg B., Meadows D., et al. (2010). Palynofacies, organic geochemistry and depositional environment of the Tartan Formation (Late Paleocene), a potential source rock in the Great South Basin, New Zealand. Mar. Pet. Geol. 27, 351–369. doi: 10.1016/j.marpetgeo.2009.09.006
Singh L. J. (2001). Late quarternary sea level and tectonic history of marlborough sounds. (PhD Thesis, University of Wellington)
Singh D., Kumar P. C., Sain K. (2016). Interpretation of gas chimney from seismic data using artificial neural network: A study from Maari 3D prospect in the Taranaki basin, New Zealand. J. Natural Gas Sci. Eng. 36, 339–357. doi: 10.1016/j.jngse.2016.10.039
Stott L., Davy B., Shao J., Coffin R., Pecher I., Neil H., et al. (2019). CO2 release from pockmarks on the chatham rise-bounty trough at the glacial termination. Paleoceanogr Paleoclimatol 2019PA003674, 1726–1743. doi: 10.1029/2019PA003674
Strogen D. P., Bland K. J., Nicol A., King P. R. (2014). Paleogeography of the Taranaki Basin region during the latest Eocene–Early Miocene and implications for the ‘total drowning’ of Zealandia. New Zealand Journal of Geology and Geophysics. 57, 110–127. doi: 10.1080/00288306.2014.901231
Strogen D. P., Bland K. J., Kellett R., Viskovic G. (2018). Atlas of Petroleum Prospectivity, Northeast Province (Raukumara, East Coast, and Pegasus basins): ArcGIS geodatabase, illustrated seismic transects and technical report (GNS Science Report, Lower Hutt, New Zealand).
Strogen D. P., King P. R. (2014). A new Zealandia-wide seismic horizon naming scheme, Report No. 34 (20 p). GNS Science Report, Lower Hutt, New Zealand. GNS Science, Lower Hutt, New Zealand.
Strogen D. P., Seebeck H., Hines B. R., Bland K. J., Crampton J. S. (2022). Palaeogeographic evolution of Zealandia: mid-Cretaceous to present. New Z. J. Geology Geophysics 66, 1–30. doi: 10.1080/00288306.2022.2115520
Strogen D. P., Seebeck H., Nicol A., King P. R. (2017). Two-phase Cretaceous–Paleocene rifting in the Taranaki Basin region, New Zealand; implications for Gondwana break-up. J. Geol Soc. London 174, 929–946. doi: 10.1144/jgs2016-160
Sultan N., Marsset B., Ker S., Marsset T., Voisset M., Vernant A. M., et al. (2010). Hydrate dissolution as a potential mechanism for pockmark formation in the Niger delta. J. Geophys Res. 115, B08101. doi: 10.1029/2010JB007453
Sultan N., Plaza-Faverola A., Vadakkepuliyambatta S., Buenz S., Knies J. (2020). Impact of tides and sea-level on deep-sea Arctic methane emissions. Nat. Commun. 11, 5087. doi: 10.1038/s41467-020-18899-3
Sutton P. (2003). The Subtropical Front: a subantarctic current. N Z J Mar Freshwater Res. 37, 645–652.
Sykes R., Zink K., Rogers K. M., Phillips A., Ventura G. T. (2012). New and updated geochemical databases for New Zealand petroleum samples, with assessments of genetic oil families, source age, facies and maturity, GNS Science Consultancy Report (GNS Science, Lower Hutt, New Zealand).
Talukder A. R. (2012). Review of submarine cold seep plumbing systems: leakage to seepage and venting. Terra Nova 24 (4), 255–272. doi: 10.1111/j.1365-3121.2012.01066.x
Tek D. E., McArthur A. D., Poyatos-Moré M., Colombera L., Allen C., Patacci M., McCaffrey W. D. (2022). Controls on the architectural evolution of deep-water channel overbank sediment wave fields: insights from the Hikurangi Channel, offshore New Zealand. New Z. J. Geology Geophysics 65 (1), 141–178. doi: 10.1080/00288306.2021.1978509
Trewick S., Bland K. (2012). Fire and slice: palaeogeography for biogeography at New Zealand’s North Island/South Island juncture. J. R Soc. N Z 42, 153–183. doi: 10.1080/03036758.2010.549493
Turco F., Ladroit Y., Watson S. J., Seabrook S., Law C. S., Crutchley G. J., et al. (2022). Estimates of methane release from gas seeps at the southern hikurangi margin, New Zealand. Front. Earth Sci. (Lausanne) 10. doi: 10.3389/feart.2022.834047
Urban P., Köser K., Greinert J. (2017). Processing of multibeam water column image data for automated bubble/seep detection and repeated mapping. Limnol Oceanogr Methods 15, 1–21. doi: 10.1002/LOM3.10138
Uruski C. I. (2010). New Zealand’s deepwater frontier. Mar. Pet. Geol. 27, 2005–2026. doi: 10.1016/j.marpetgeo.2010.05.010
Uruski C. I., Bland K. J. (2010). Pegasus basin and the prospects for oil and gas, GNS science consultancy report2012, 010/291. GNS Science, Lower Hutt, New Zealand
Waghorn K. A., Pecher I., Strachan L. J., Crutchley G., Bialas J., Coffin R., et al. (2018). Paleo-fluid expulsion and contouritic drift formation on the Chatham Rise, New Zealand. Basin Research 30, 5–19. doi: 10.1111/bre.12237
Warnke F., Schwenk T., Miramontes E., Spiess V., Wenau S., Bozzano G., et al. (2023). Evolution of complex giant seafloor depressions at the northern Argentine continental margin (SW Atlantic Ocean) under the influence of a dynamic bottom current regime. Front. Earth Sci. (Lausanne) 11. doi: 10.3389/feart.2023.1117013
Watson S. J., Hillman J. I. T., Bull S., Pallentin A., Eton N. (2021). TE TAI-O-RĒHUA TASMAN SEA TSUNAMI – VOYAGE PART I. National Institute of Water and Atmospheric Research, NIWA, Wellington, New Zealand.
Watson S. J., Hillman J. I. T., Bull S., Pallentin A., Eton N. (2022). TE TAI-O-RĒHUA TASMAN SEA TSUNAMI – VOYAGE PART I (National Institute of Water and Atmospheric Research, NIWA, Wellington, New Zealand).
Watson S. J., Mountjoy J. J., Barnes P. M., Crutchley G. J., Lamarche G., Higgs B., et al. (2020a). Focused fluid seepage related to variations in accretionary wedge structure, Hikurangi margin, New Zealand. Geology 48, 56–61. doi: 10.1130/G46666.1
Watson S. J., Mountjoy J. J., Crutchley G. J. (2019). Tectonic and geomorphic controls on the distribution of submarine landslides across active and passive margins, eastern New Zealand. Geological Society London Special Publications 500, SP500-2019–165. doi: 10.1144/SP500-2019-165
Watson S. J., Neil H., Ribó M., Lamarche G., Strachan L. J., MacKay K., et al. (2020b). What we do in the shallows: natural and anthropogenic seafloor geomorphologies in a drowned river valley, New Zealand. Front. Mar. Sci. 7. doi: 10.3389/fmars.2020.579626
Wenau S., Spiess V., Zabel M. (2021). Giant seafloor depressions caused by slope failures and bottom currents on the Namibia continental margin. Geochemistry Geophysics Geosystems 22. doi: 10.1029/2020GC009548
Whiticar M. J., Werner F. (1981). Pockmarks: Submarine vents of natural gas or freshwater seeps? Geo-Marine Lett. 1, 193–199.
Wood R. A., Andrews P. B., Herzer R. H. (1989). Cretaceous and cenozoic geology of the Chatham Rise Region, South Island, NEW ZEALAND (Lower Hutt, New Zealand: New Zealand Geological Survey).
Woodside J. M., David L., Frantzis A., Hooker S. K. (2006). Gouge marks on deep-sea mud volcanoes in the eastern Mediterranean: Caused by Cuvier’s beaked whales? Deep Sea Res. Part I: Oceanographic Res. Papers 53, 1762–1771. doi: 10.1016/j.dsr.2006.08.011
Keywords: pockmarks, New Zealand, bathymetry, seafloor acoustics, geomorphhology
Citation: Hillman JIT, Watson SJ, Maier KL, Hoffmann JJL, Bland KJ, Warnke F, Pecher IA, Gorman AR, Davy B, Bull S and Woelz S (2023) The diverse morphology of pockmarks around Aotearoa New Zealand. Front. Mar. Sci. 10:1235928. doi: 10.3389/fmars.2023.1235928
Received: 06 June 2023; Accepted: 15 August 2023;
Published: 05 September 2023.
Edited by:
Benjamin Misiuk, Dalhousie University, CanadaReviewed by:
Joana Gafeira, The Lyell Centre, United KingdomValérie Karin Bellec, Geological Survey of Norway, Norway
Copyright © 2023 Hillman, Watson, Maier, Hoffmann, Bland, Warnke, Pecher, Gorman, Davy, Bull and Woelz. This is an open-access article distributed under the terms of the Creative Commons Attribution License (CC BY). The use, distribution or reproduction in other forums is permitted, provided the original author(s) and the copyright owner(s) are credited and that the original publication in this journal is cited, in accordance with accepted academic practice. No use, distribution or reproduction is permitted which does not comply with these terms.
*Correspondence: Jess I. T. Hillman, ai5oaWxsbWFuQGducy5jcmkubno=