 Panpan Wang1,2,3,4,5,6
 Shumin Xie1,2Xinyang Li1,2Jiawei Zhu1,2Ziqi You1,2Xinlei Zhou1,2Xinyi Zhou1,2Binlun Yan1,2,3,4,5
 Huan Gao1,2,3,4,5Chaofan Xing1,2,3,4,5*
- 1Jiangsu Key Laboratory of Marine Bioresources and Environment, Jiangsu Ocean University, Lianyungang, China
- 2Jiangsu Key Laboratory of Marine Biotechnology, Jiangsu Ocean University, Lianyungang, China
- 3Co-Innovation Center of Jiangsu Marine Bio-industry Technology, Jiangsu Ocean University, Lianyungang, China
- 4Jiangsu Institute of Marine Resources Development, Jiangsu Ocean University, Lianyungang, China
- 5The Jiangsu Provincial Infrastructure for Conservation and Utilization of Agricultural Germplasm, Nanjing, China
- 6Key Laboratory of Experimental Marine Biology, Institute of Oceanology, Chinese Academy of Sciences, Qingdao, China
Marsupenaeus japonicus has two types of phenotypic differences that are mainly reflected in the stripe pattern of the carapace. However, the underlying mechanism regulating the stripe patterns is not clear. In the present study, we first observed the composition of pigment cells and detected the contents of different carotenoids in the carapace of M. japonicus. We clearly observed the setae structure on the carapace. There were red pigment cells in the stripe pattern and yellow pigment cells in the other parts. Both red pigment cells and yellow pigment cells showed dendritic morphology. In the carapace, the content of astaxanthin was the highest, significantly (P < 0.05) higher than that of other carotenoids. Some differentially expressed genes between two pattern types of M. japonicus, may be associated with the body color formation, such as crustacyanin (CRCN), apolipoprotein D (ApoD), tubulin alpha-1 chain, cuticle protein, and ABC transporter, which were verified by quantitative PCR experiments. The amino acid composition and secondary structure of CRCN A2, CRCN C1, and ApoD were significantly different. The results of this study will help to elucidate the molecular mechanism of the differential pattern formation of M. japonicus and provide a reference for further exploration of the formation mechanism of crustacean color.
1 Introduction
The kuruma shrimp Marsupenaeus japonicus (Decapoda, Penaeidae, Marsupenaeus) is one of the most important farmed shrimp species in the world (Dall et al., 1990; Tsoi et al., 2014). M. japonicus has been regarded as the only morphological species of Marsupenaeus (Tirmizi, 1971; Lavery et al., 2004). Tsoi et al. noted, however, M. japonicus has two types of phenotypic differences, which are mainly reflected in the stripe pattern of the carapace (Tsoi et al., 2005; Tsoi et al., 2007). The carapace stripe pattern of M. japonicus variety I individuals extends to the bottom margin, whereas the stripe pattern of variety II individuals extends to the middle of the lateral border (Figure 1). The two varieties have obvious geographical distribution characteristics; variety I was confined to the Taiwan Strait, the East China Sea and the Sea of Japan, and variety II was mainly distributed in the South China Sea and Southeast Asia (Tsoi et al., 2014). Using genotyping-by sequencing (GBS), we analyzed the genetic structure of natural populations of M. japonicus in the northwestern Pacific region, and the results support the existence of two highly differentiated evolutionary units (Wang et al., 2020). Moreover, we conducted choice and no-choice interbreeding experiments, which provided support for the biological species concept by showing the existence of reproductive isolation or incompatibility (Wang et al., 2020). Animal markings are the result of different pigmentation sites and play an important role in animal survival, reproduction and information exchange, which are important phenotypic characteristics for understanding key issues in evolutionary biology such as speciation, adaptation and polymorphism maintenance (Djurdjevič et al., 2015; Lemoine et al., 2019; Berdan et al., 2021).
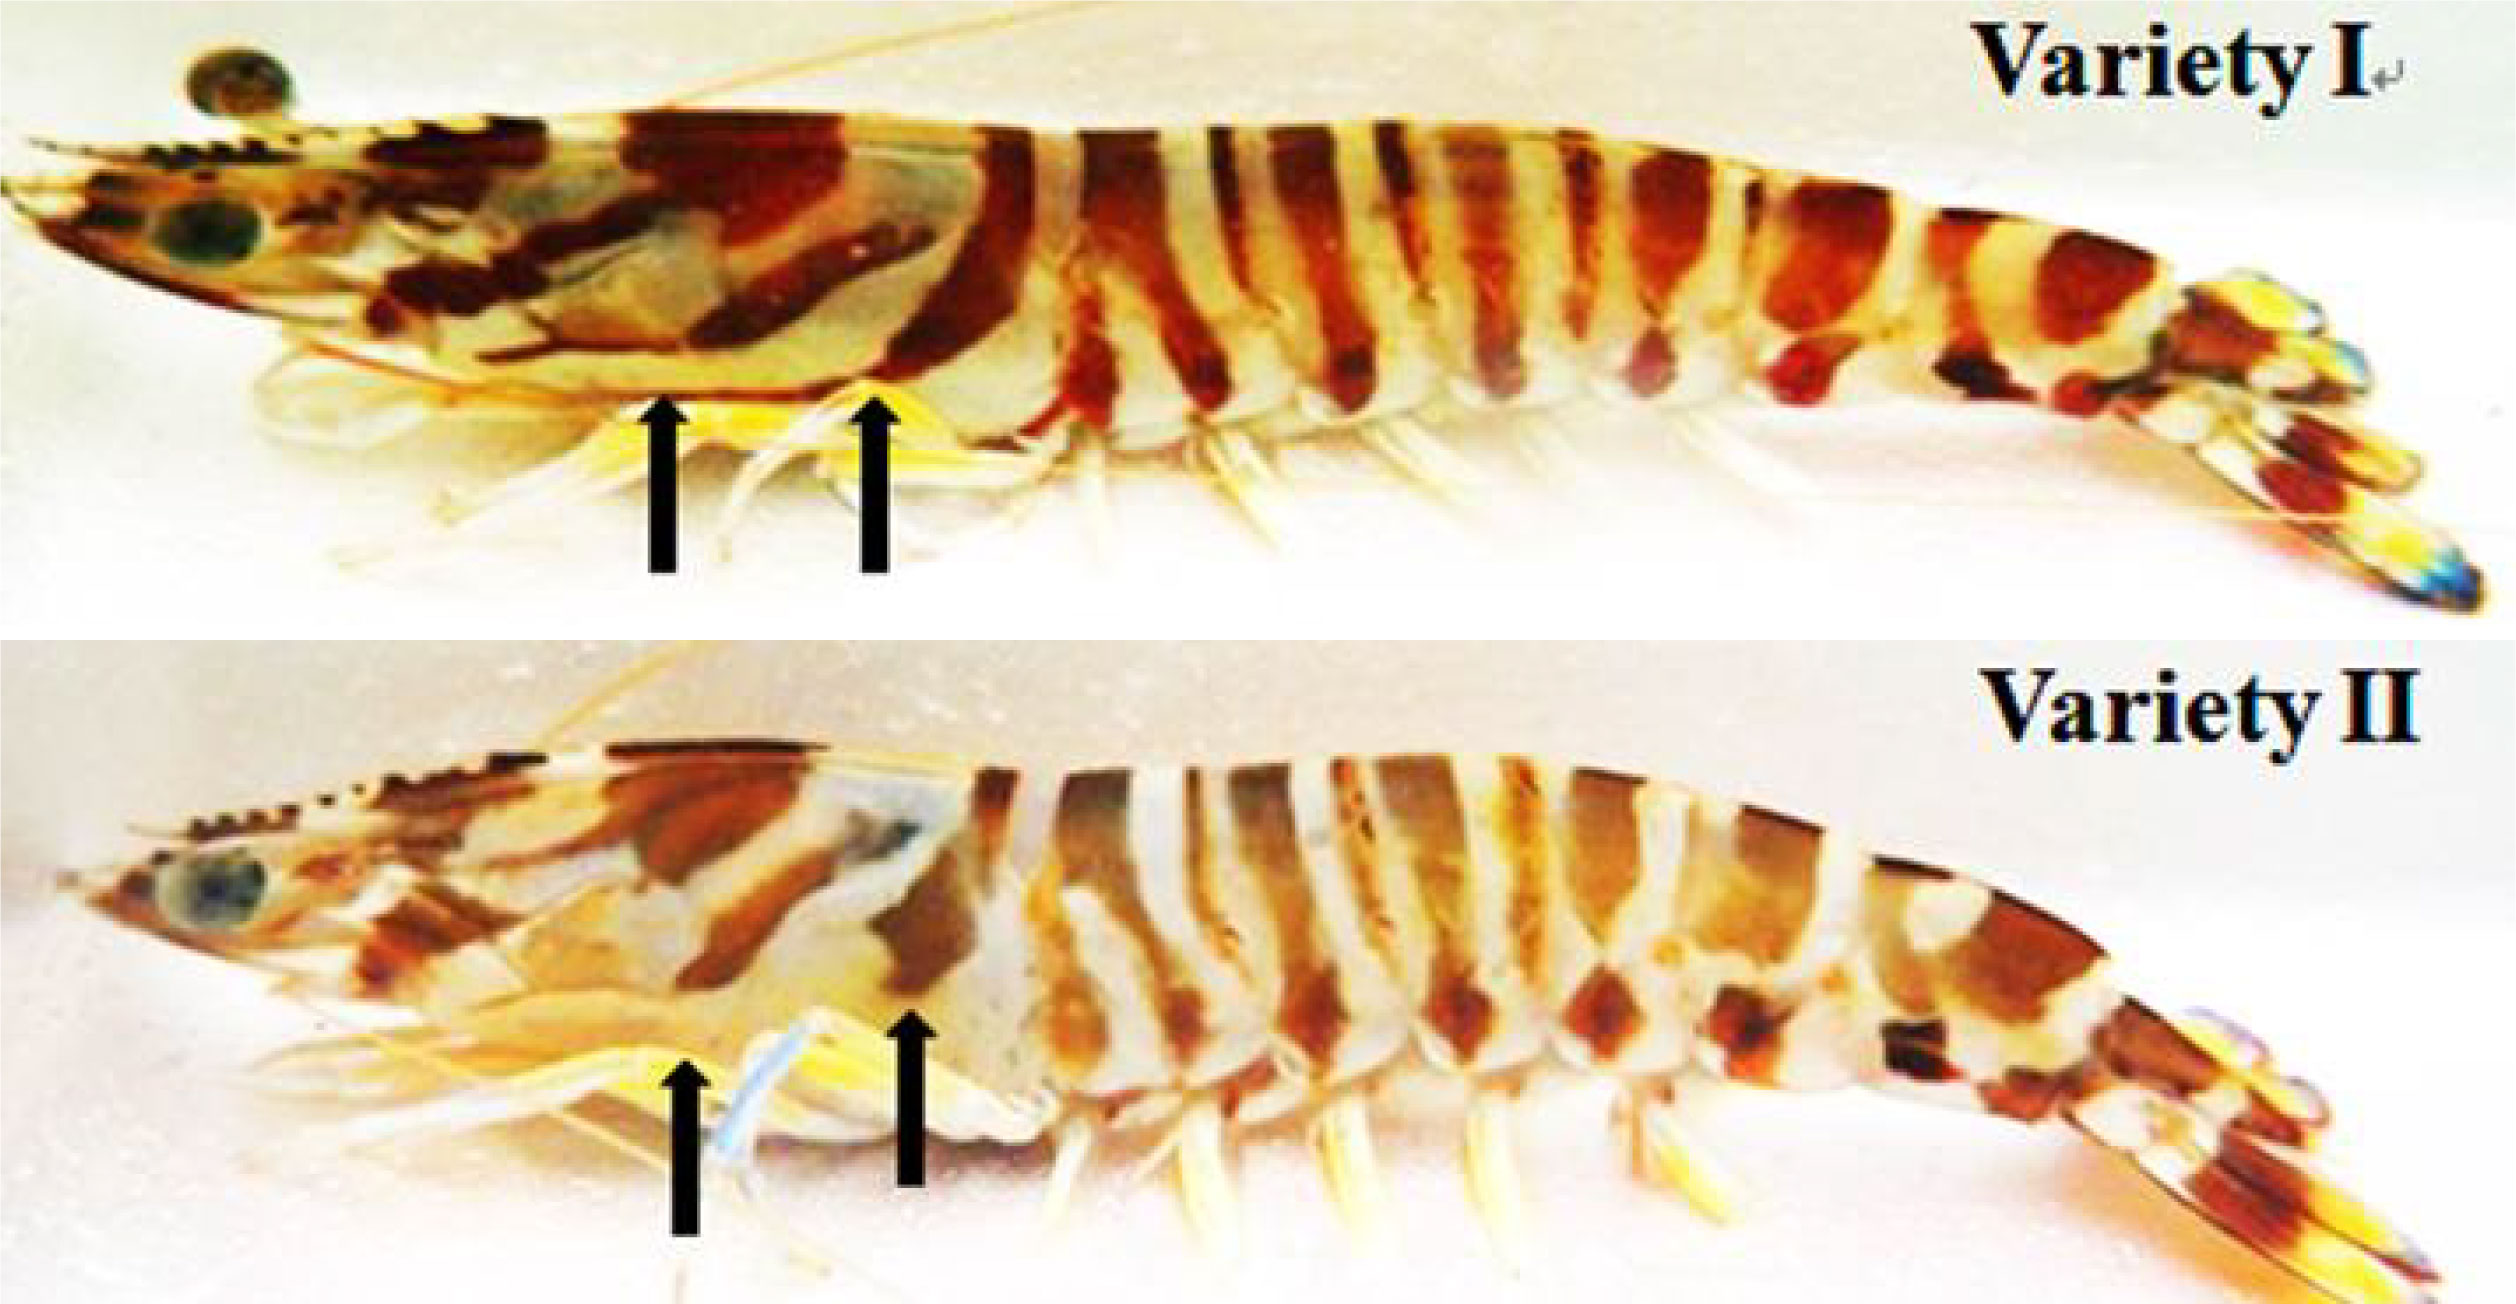
Figure 1 Two pattern types of M. japonicus, with arrows indicating carapace stripe.
Previous studies have shown that red pigment cells of crustaceans contain mostly red and orange carotenoids, of which astaxanthin accounts for 65%-98% (Angell et al., 2018; Maoka et al., 2018; Jin et al., 2021). The total carotenoid content in the shell of red Panulirus cygnus was significantly higher than that of white individuals, but there was no significant difference in the content of free astaxanthin in the endocuticle, indicating that esterified astaxanthin content has a significant effect on the formation of shell color (Wade et al., 2005). In total, 75.6% of the astaxanthin in the muscle of Exopalaemon carinicauda was esterified, while 94% of the astaxanthin in the muscle of the new variety “Kesuhong 1” was free (Zhang et al., 2018). The potential mechanism of regulating the enrichment of free astaxanthin remains unclear. The ratio of esterified astaxanthin to total astaxanthin in all tissues of purple-shelled individuals of Eriochier sinensis was significantly higher than that of dark green individuals (Li et al., 2020).
Carotenoids in aquatic animals usually exist in free and esterified forms, but free carotenoids are unstable and need to combine with carrier proteins to form stable esterified complexes (Matsuno, 2001; Budd et al., 2017). In crustaceans, carotenoid-binding protein (CBP) is important for stabilizing carotenoids, regulating color, and participating in development and antioxidant activities (Wade et al., 2017; Maoka, 2020; Tan et al., 2020). Crustacyanin (CRCN) covalently binds to ingested astaxanthin to form a complex, resulting in a conformational change in astaxanthin that determines the species-specific color and pattern of the crustacean exoskeleton (Wade et al., 2012; Jin et al., 2021; Zhao et al., 2021; Chen et al., 2022). Zhao et al. demonstrated that the CRCN gene of Penaeus monodon was involved in astaxanthin accumulation by using RNA interference and gene overexpression techniques (Zhao et al., 2021). After interference with the expression of the CRCN gene in P. monodon, the body color of the experimental group changed obviously (Budd et al., 2017). After the CRCN gene was knocked down, the body color of Macrobrachium rosenbergii changed from cyan to orange-red, and the fat granules in the subcutaneous adipose tissue were significantly reduced, which might be related to free astaxanthin (Yang et al., 2011). The expression levels of the CRCN-A and CRCN-C genes in albino Fenneropenaeus merguiensis were significantly decreased compared with those in light and dark individuals (Ertl et al., 2013). At present, it is well known that CRCN protein binding astaxanthin can produce exoskeleton color in crustaceans, but the regulatory mechanism of CRCN gene expression and the effect of the CRCN-astaxanthin complex on exoskeleton color are still poorly understood (Budd et al., 2017). Huang et al. enriched Class C scavenger receptor genes and sololytic carrier protein family genes from the carapace transcriptome of three pigmentation phenotypes (red, yellow and chocolate) of N. denticulate sinensis and found that the expression levels of ABC transporters (abcg1 and abcg14) and muscular calcium binding protein genes in chocolate individuals were significantly higher than those in the other two body color individuals (Huang et al., 2022).
The two pattern types in the natural population of M. japonicus are ideal materials for studying the pattern and body color formation of crustaceans. However, the underlying mechanism regulating the stripe patterns of the carapace in M. japonicus is not clear. In the present study, we first observed the composition of pigment cells and detected the contents of different carotenoids in the carapace of M. japonicus. To identify differentially expressed genes associated with stripe pattern formation, comparative transcriptome analysis was performed on the two varieties of M. japonicus. The results of this study will help to elucidate the molecular mechanism of the differential pattern formation of M. japonicus and provide a reference for further exploration of the formation mechanism of the pattern and body color of crustaceans.
2 Materials and methods
2.1 Ethics statement
This study was approved by the Animal Care and Use Committee of Jiangsu Ocean University (protocol no. 2020-37; approval date: September 1, 2019). All procedures involving animals were performed in accordance with guidelines for the Care and Use of Laboratory Animals in China.
2.2 Sample collection
Healthy M. japonicus individuals were obtained from the Jiangsu Key Laboratory of Marine Biotechnology of Jiangsu Ocean University (Lianyungang, China). All individuals were acclimated for two weeks in environmentally controlled breeding tanks. The average body length and body weight of M. japonicus were 6.30 ± 1.12 cm and 1.48 ± 0.75 g, respectively. The experimental shrimp were euthanized with the anesthetic alcohol: eugenol = 10:1. The carapaces of 20 individuals were sampled to detect the contents of different carotenoids, including astaxanthin, lutein, zeaxanthin, and beta-carotene. Three individuals from each of the two varieties were used to observe the composition of pigment cells in the carapace using an optical microscope. A total of 60 individuals, including 30 variety I individuals and 30 variety II individuals, were sampled for comparative transcriptome analysis. The carapace of these prawns was sampled and immediately preserved in liquid nitrogen for total RNA extraction.
2.3 Detection of carotenoids content in the carapace
The obtained carapace was dried at 60°C for 48 hours, crushed with a high-speed grinder, and stored at 20°C for later use. The astaxanthin extraction was slightly modified from the method of Hu et al. (Hu et al., 2018). Approximately 1 g of the sample was accurately weighed and placed in a 50 mL round-bottomed centrifuge tube with 4 mL of 0.1% BHT ethanol solution. The homogenizer (IKA-T 18 basic, Germany) was fully homogenized for 2 min. The mixed homogenate was ultrasonically extracted for 10 min below 15°C, and centrifuged for 5 min at 8000 r/min. The extract was dehydrated through anhydrous sodium sulfate filtration and filtered into a 100 mL brown rotary evaporation bottle. Depressurized concentration at 40°C ± 2°C was performed on the rotary evaporator, nearly dry. After drying with nitrogen, 1.0 mL of 0.1% BHT ethanol solution was accurately added and the extract was fully dissolved. It was filtered through a 0.22 μm organic membrane and detected by the high-performance liquid chromatography (HPLC) (LC 2030C 3D, Shimadzu, Japan).
The extraction methods of the other three carotenoids have been slightly modified. Approximately 4 g of the sample was accurately weighed and placed in a 50 mL centrifugal tube, and the 20 mL of 0.1% BHT ethanol solution was added. The mixed homogenate was extracted for 10 min below 15°C, added to 10 mL of 30% KOH solution, placed in a thermostatic oscillating water bath preheated to 50°C ± 2°C, and saponified for 20 min. The solution was removed and allowed to cool to room temperature. Then, 50 mL extraction solvent was added and extracted for 3 min in vortex oscillation against light. Ten milliliters extraction was dried with nitrogen. For example, 1.0 mL of 0.1% BHT ethanol solution was added accurately to fully dissolve the extract. The solution was filtered through a 0.22 μm organic membrane and examined by the HPLC.
2.4 RNA isolation, sample pooling, and cDNA synthesis
Total RNA was extracted from the carapace of 30 individuals of types I and II. TRIzol reagent (Takara, Dalian, China) was used to extract RNA from the carapace tissue samples. The degradation and contamination of total RNA were assessed by 1% agarose gel electrophoresis, RNA purity and concentration were determined by spectrophotometry, and total RNA integrity was determined by a bioanalyzer. The total RNA from each group of 30 shrimp was randomly divided into 6 portions. Total RNA from each sample (containing 5 individuals) was mixed equally. Finally, each group had 6 RNA samples, of which 3 RNA samples were used for transcriptome analysis, and the remaining samples were used for fluorescence quantitative PCR analysis.
2.5 Library construction and sequencing
Approximately 3 micrograms of RNA per sample was used to synthesize first- and second-strand cDNA. Six cDNA libraries were generated by an Illumina kit and sequenced on the sequencing platform. High-quality data are obtained by deleting joint sequences and low-quality data. Reassembled high-quality data were obtained by the Trinity software (Grabherr et al., 2013) with the recommended parameters. The resulting reference sequence was used for subsequent analysis. HISAT2 software (https://daehwankimlab.github.io/hisa t2/) was used to align the high-quality reads with the reference genome of Marsupenaeus japonicus (unpublished), and the location information of reads on the reference genome was obtained. The assembled transcripts were annotated against the Nr, GO and Swiss-Prot databases.
2.6 Analysis and validation of differentially expressed unigenes
The feature v1.5 tool (Yang et al., 2014) of the subread software was used to determine the number of reads corresponding to each gene. RSEM software (Simon and Huber, 2010) was used to normalize the expression levels of transcripts from different groups to transcripts per kilobase per million fragments. Gene function annotation was performed using the NCBI and KEGG databases. The DESeq2 method (Love et al., 2014) was used to screen differentially expressed genes between the two groups (variety I and variety II). When the p value < 0.05 and log2(fold change) ≥ 1, the gene was considered to be significantly differentially expressed. GO enrichment and KEGG analysis were performed using ClusterProfile software (Wu et al., 2021) with a q-value < 0.05.
The fluorescence quantitative PCR was used to detect the expression levels of ten differentially expressed genes in the two groups. Quantitative primers were designed using Primer software based on transcript sequences (Table S1). The elongation factor 1-α (EF1-α) was served as the house-keeping gene. The PCR efficiency was determined by calculating the slopes and regression curves of the standard curves. The SYBR kit (Takara, Dalian, China) was used for quantitative PCR. Three biological replicates and three technical replicates were performed for all samples.
2.7 Multiple sequence alignment and phylogenetic analysis
Total RNA was extracted using the TRIzol reagent (Takara, Dalian, China). The purity and integrity of RNA were also determined. First strand cDNA was synthesized using the TransScript kit (Takara, Dalian, China) as instructed. Primers were designed based on our transcripts and the sequences of related species in NCBI. The PCR amplification product was connected to the vector and double-ended sequencing was performed. The gene’s open reading frame was predicted using the ORF finder tool. Expasy software (https://web.expasy.org/compute_pi/) was used to predict the molecular weight and isoelectric point of the protein sequence. The amino acid sequence of the gene was deduced by EMBOSS software. SOPMA (Geourjon and Deleage, 1995) and PROSITE software (Sigrist et al., 2010) were used to predict the secondary structure of protein sequences. ClustalW (Larking et al., 2007) was used for the multiple sequence alignment and MEGA software (Kumar et al., 2016) was used for phylogenetic analysis.
3 Results
3.1 The composition of pigment cells in the carapace
We observed the composition of pigment cells in the carapace of the two varieties using an optical microscope. The setae structure on the carapace was clearly observed. It is possible that the manipulation of sampling makes the setae disorganized. The results showed that there were red pigment cells in the stripe pattern and yellow pigment cells in the other parts (Figure 2). Both red pigment cells and yellow pigment cells showed dendritic morphology. The red pigment cells are larger than the yellow pigment cells.
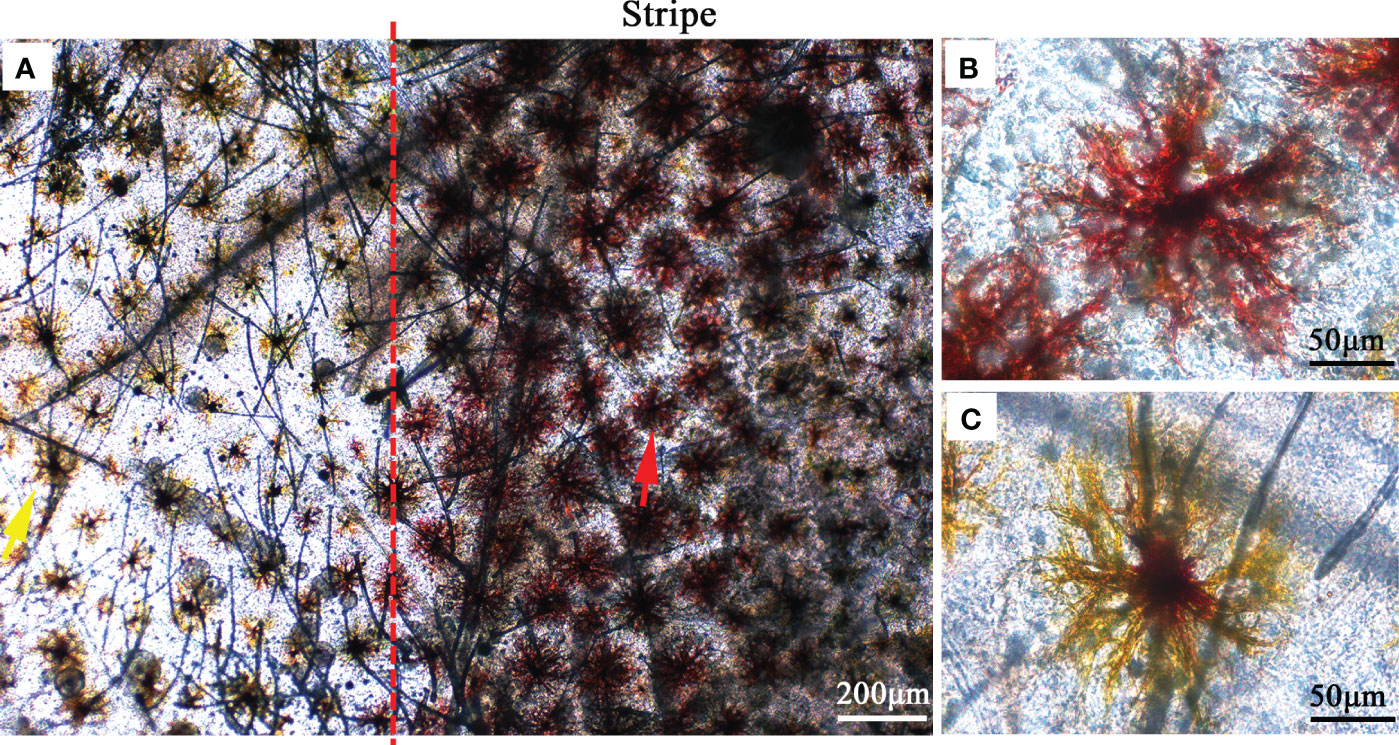
Figure 2 Microscopic observations of pigmented cells in the carapace. (A) Pigment cells on the body surface and stripe. The yellow arrow indicates yellow pigmented cells and the red arrow indicates red pigmented cells. (B) Red pigmented cells in the stripe. (C) Yellow pigmented cells on the body surface.
3.2 Carotenoid content of the carapace
We determined the contents of different carotenoids, including astaxanthin, lutein, zeaxanthin, and beta-carotene in the carapace using the HPLC (Figure 3). The results showed that the content of astaxanthin was the highest, which was significantly (P < 0.05) higher than that of other carotenoids. The contents of zeaxanthin and beta-carotene were comparable, and both were significantly (P < 0.05) higher than the content of lutein. The lutein content was significantly (P < 0.05) lower than that of the other carotenoids.
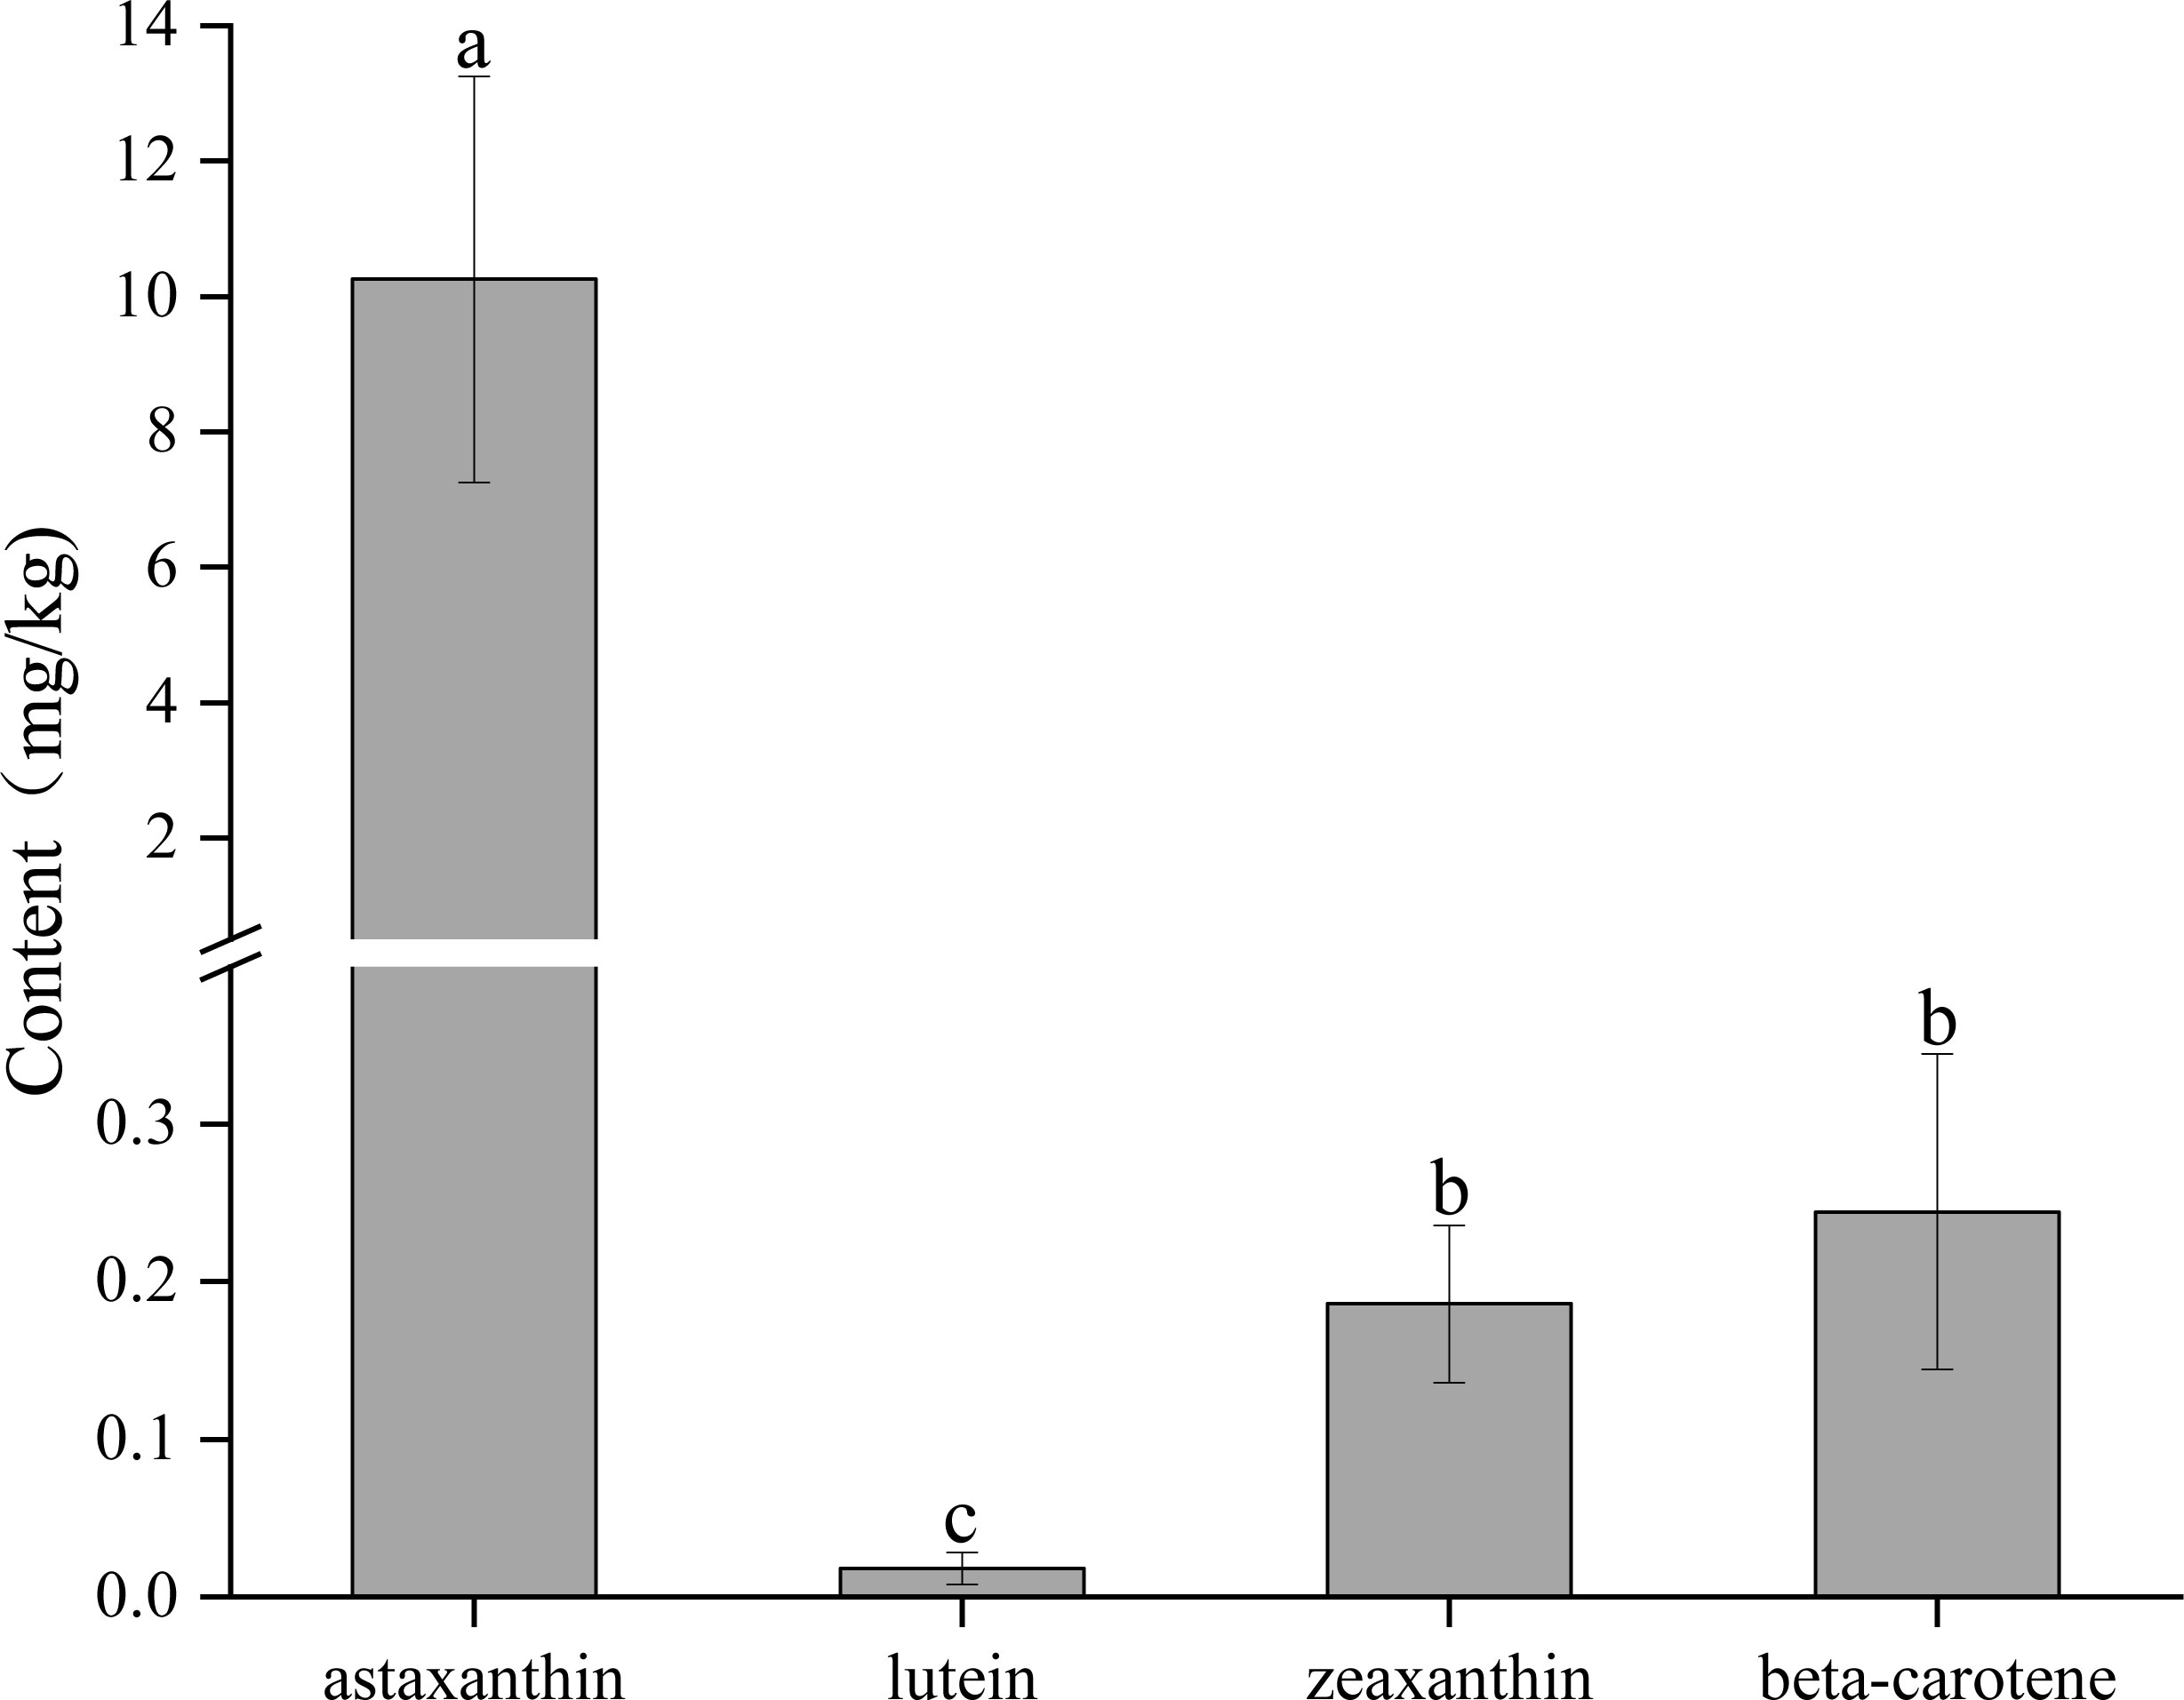
Figure 3 The contents of different carotenoids in the carapace. A significant difference between groups at p < 0.05 is indicated by different letters.
3.3 Transcriptome sequencing and assembly
In the variety I group (VI-A, VI-B, VI-C), Illumina sequencing obtained 134.5 million raw data and 132.4 million clean data, with a total of 19.86 Gb of data (Table S2). The variety II group (VII-A, VII-B, VII-C) obtained 134.7 million raw data points, 131.6 million clean data points, and a total of 19.74 Gb of data. The mapping rate of 6 cDNA libraries to the reference genome of M. japonicus ranged from 72.85% to 89.2%. A total of 23629 unigenes were obtained, with an average length of 1630.17 bp, and 2457 new genes were predicted. The Pearson correlation coefficient R2 between groups calculated based on the FRKM value was greater than 0.86.
3.4 Identification of differentially expressed genes
A total of 1984 differentially expressed genes were identified in this study, of which 1125 genes were upregulated and 859 genes were downregulated (Figure 4). Among these differentially expressed genes, we observed some genes that may be associated with body color formation, such as CRCN, apolipoprotein D (ApoD), tubulin alpha-1 chain, cuticle protein, and low-density lipoprotein receptor (Table S3).
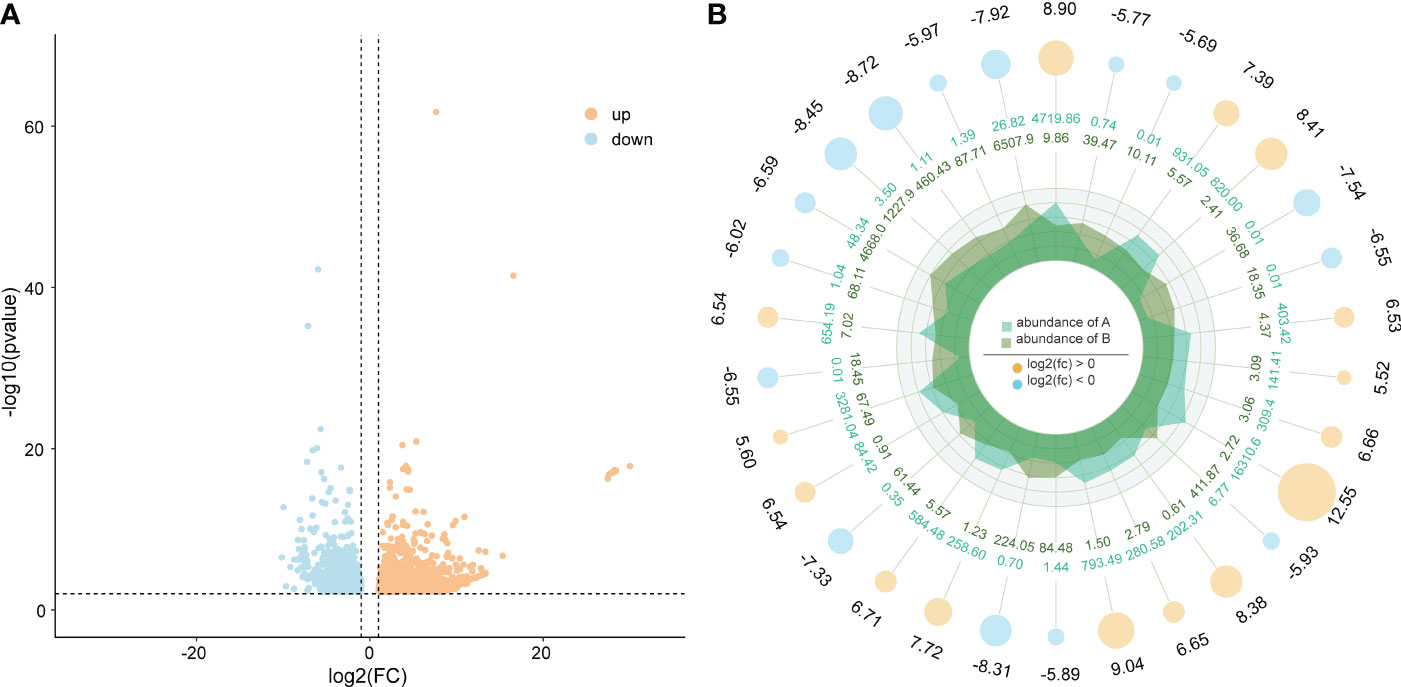
Figure 4 (A) differentially expressed genes and (B) the top 10 up- and downregulated genes. Orange and blue show the upregulated and downregulated genes in the two varieties of M. japonicus.
3.5 GO term and KEGG pathway enrichment analysis of DEGs
To understand which biological processes and pathways are involved in the body color formation or material transport of M. japonicus, we performed GO and KEGG enrichment analyses of differentially expressed genes. In the biological process category, most DEGs were annotated with involvement in proteolysis, transmembrane transport, and oxidation-reduction processes (Figure 5). Among the DEGs categorized as cellular components, intracellular membrane-bounded organelle, membrane-bounded organelle, and extracellular regions were the best represented. Additionally, most of the molecular function-related DEGs were associated with transmembrane transporter activity, peptidase activity, and oxidoreductase activity. In general, “anion transport”, “inorganic anion transport”, “anion transmembrane transporter activity”, and “inorganic anion transmembrane transporter activity” were the terms with the most differentially expressed unigenes.
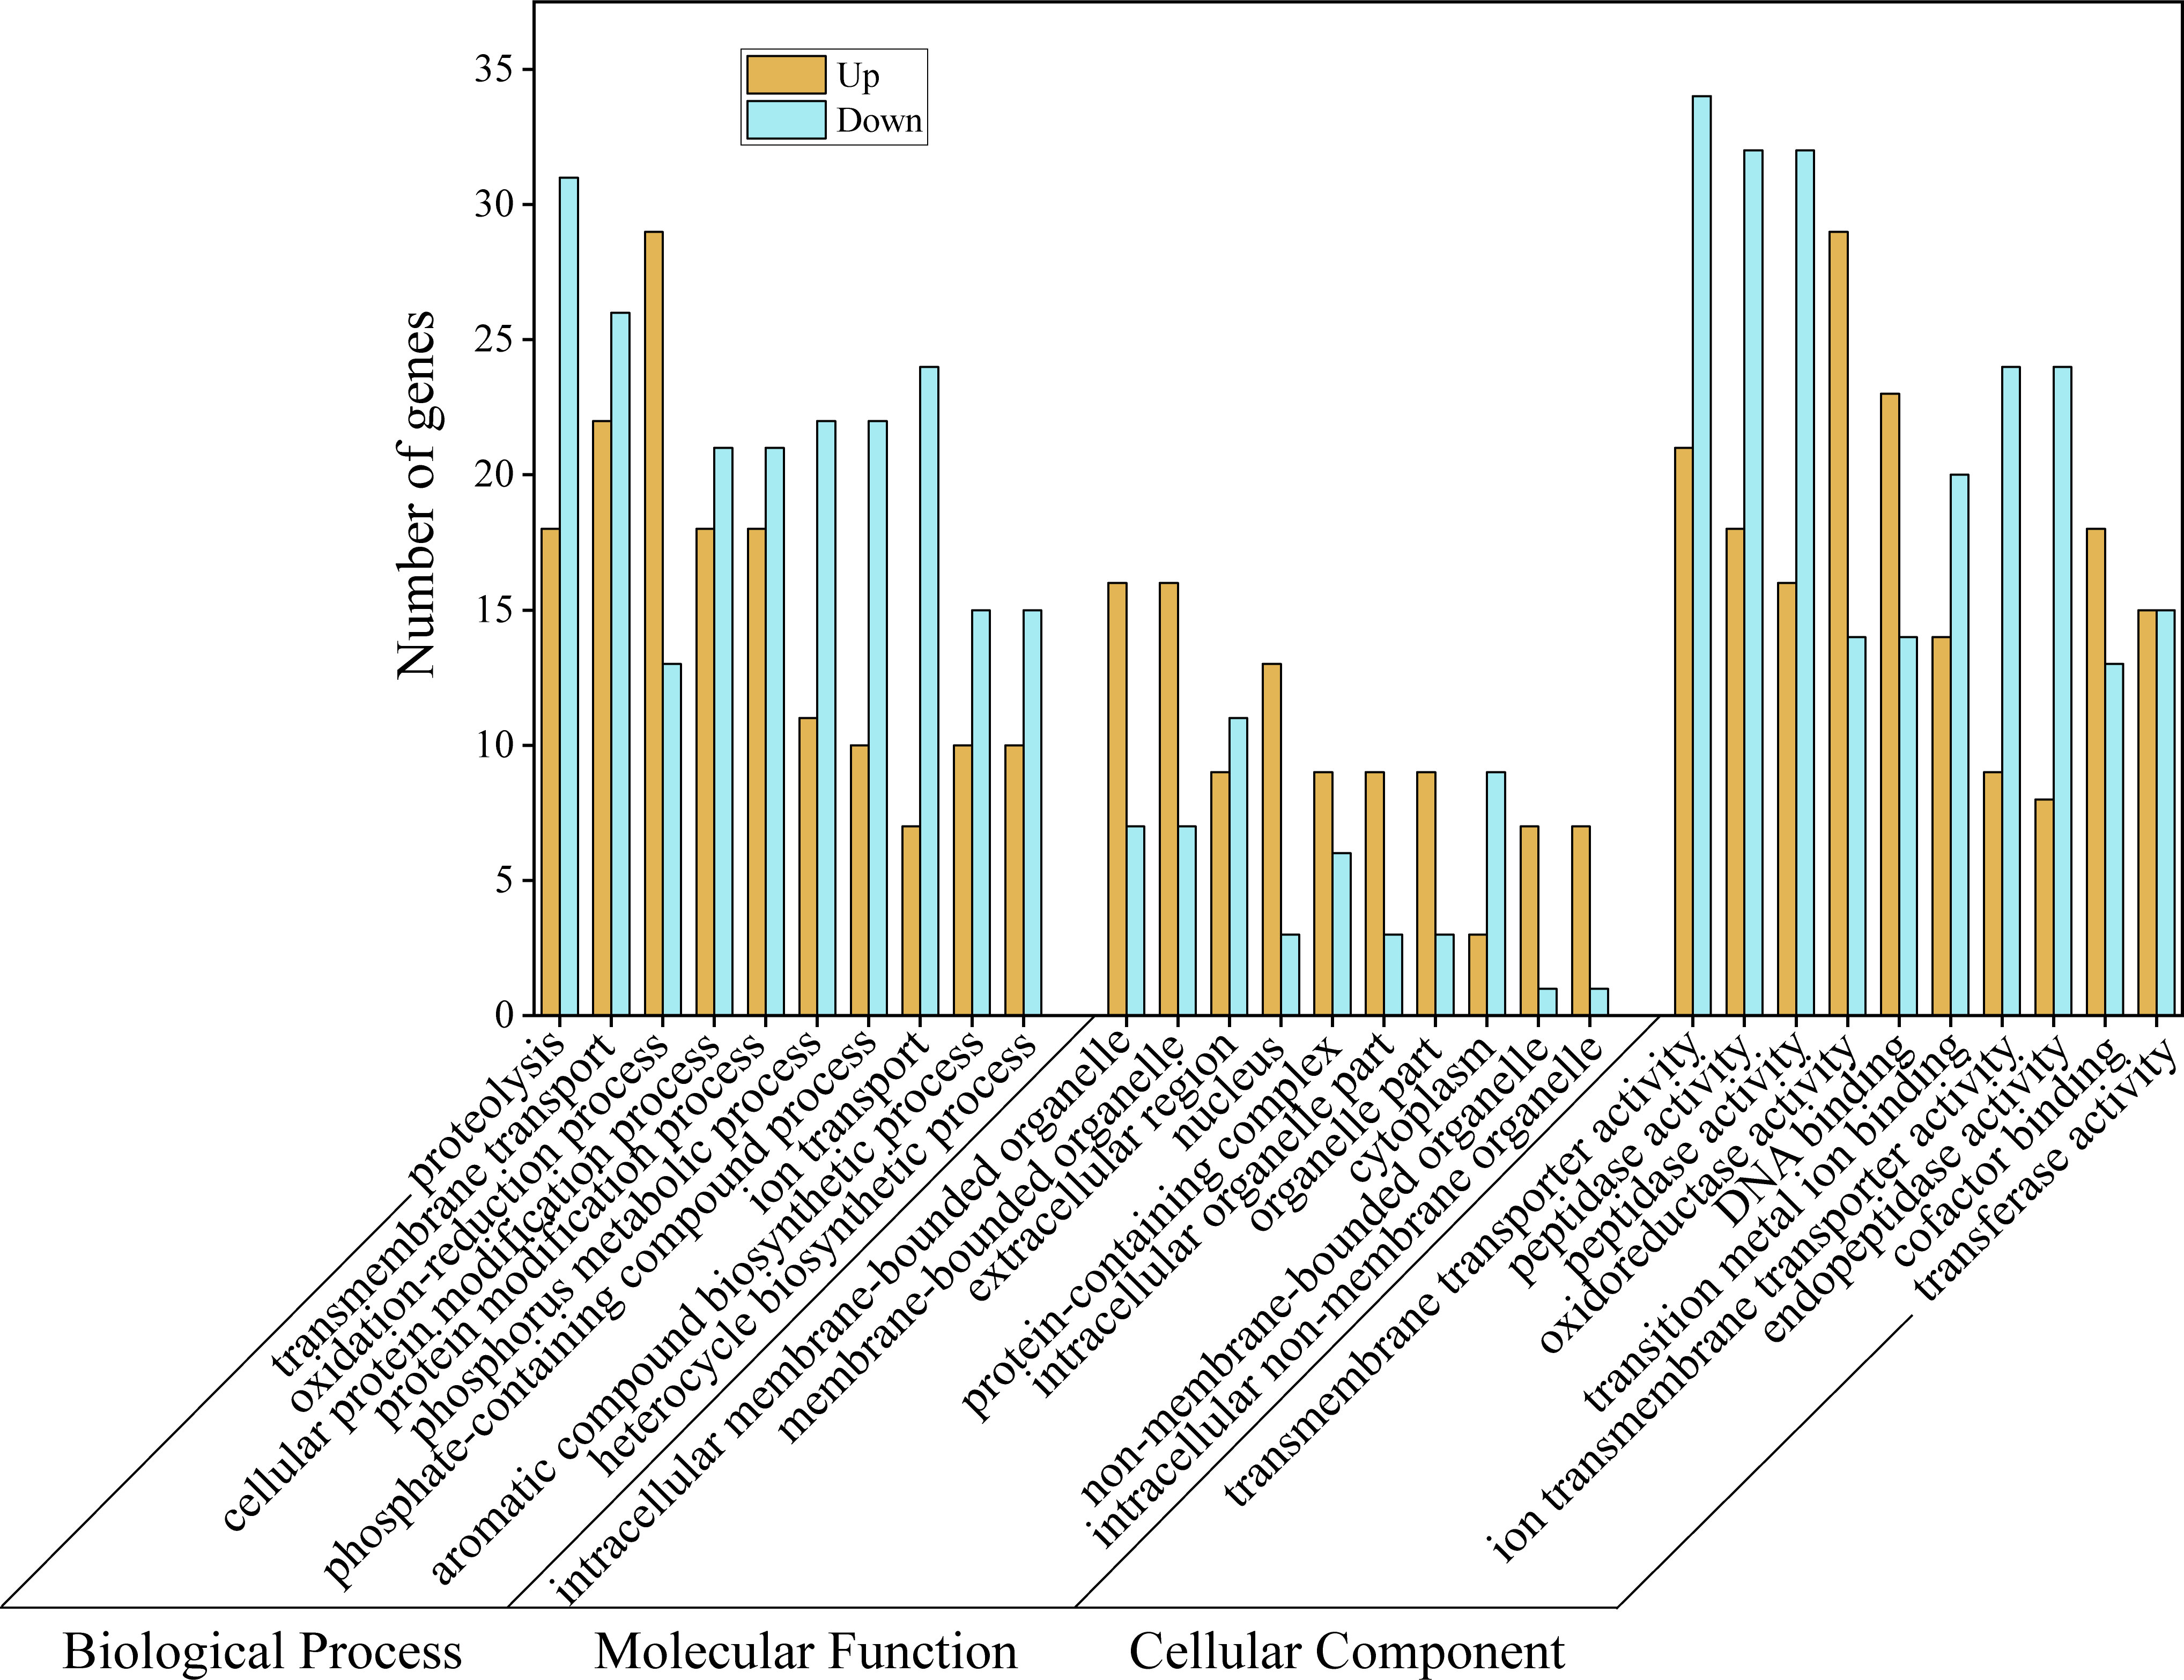
Figure 5 GO functional annotation for differentially expressed genes.
The obtained differentially expressed genes were annotated in the KEGG database. The DEGs were mapped to 108 KEGG pathways. Figure 6 showed the 20 significantly enriched pathways of the upregulated and downregulated genes. More upregulated genes were enriched in the lysosome (dpx04142), metabolism of xenobiotics by cytochrome P450 (dpx00983), glycolysis/gluconeogenesis (dpx00010), and pentose and glucuronate interconversions (dpx00040). More downregulated genes were enriched in the endocytosis (dpx04144), purine metabolism (dpx00230), glycosaminoglycan biosynthesis (dpx00532), and the Wnt signaling pathway (dpx04310).
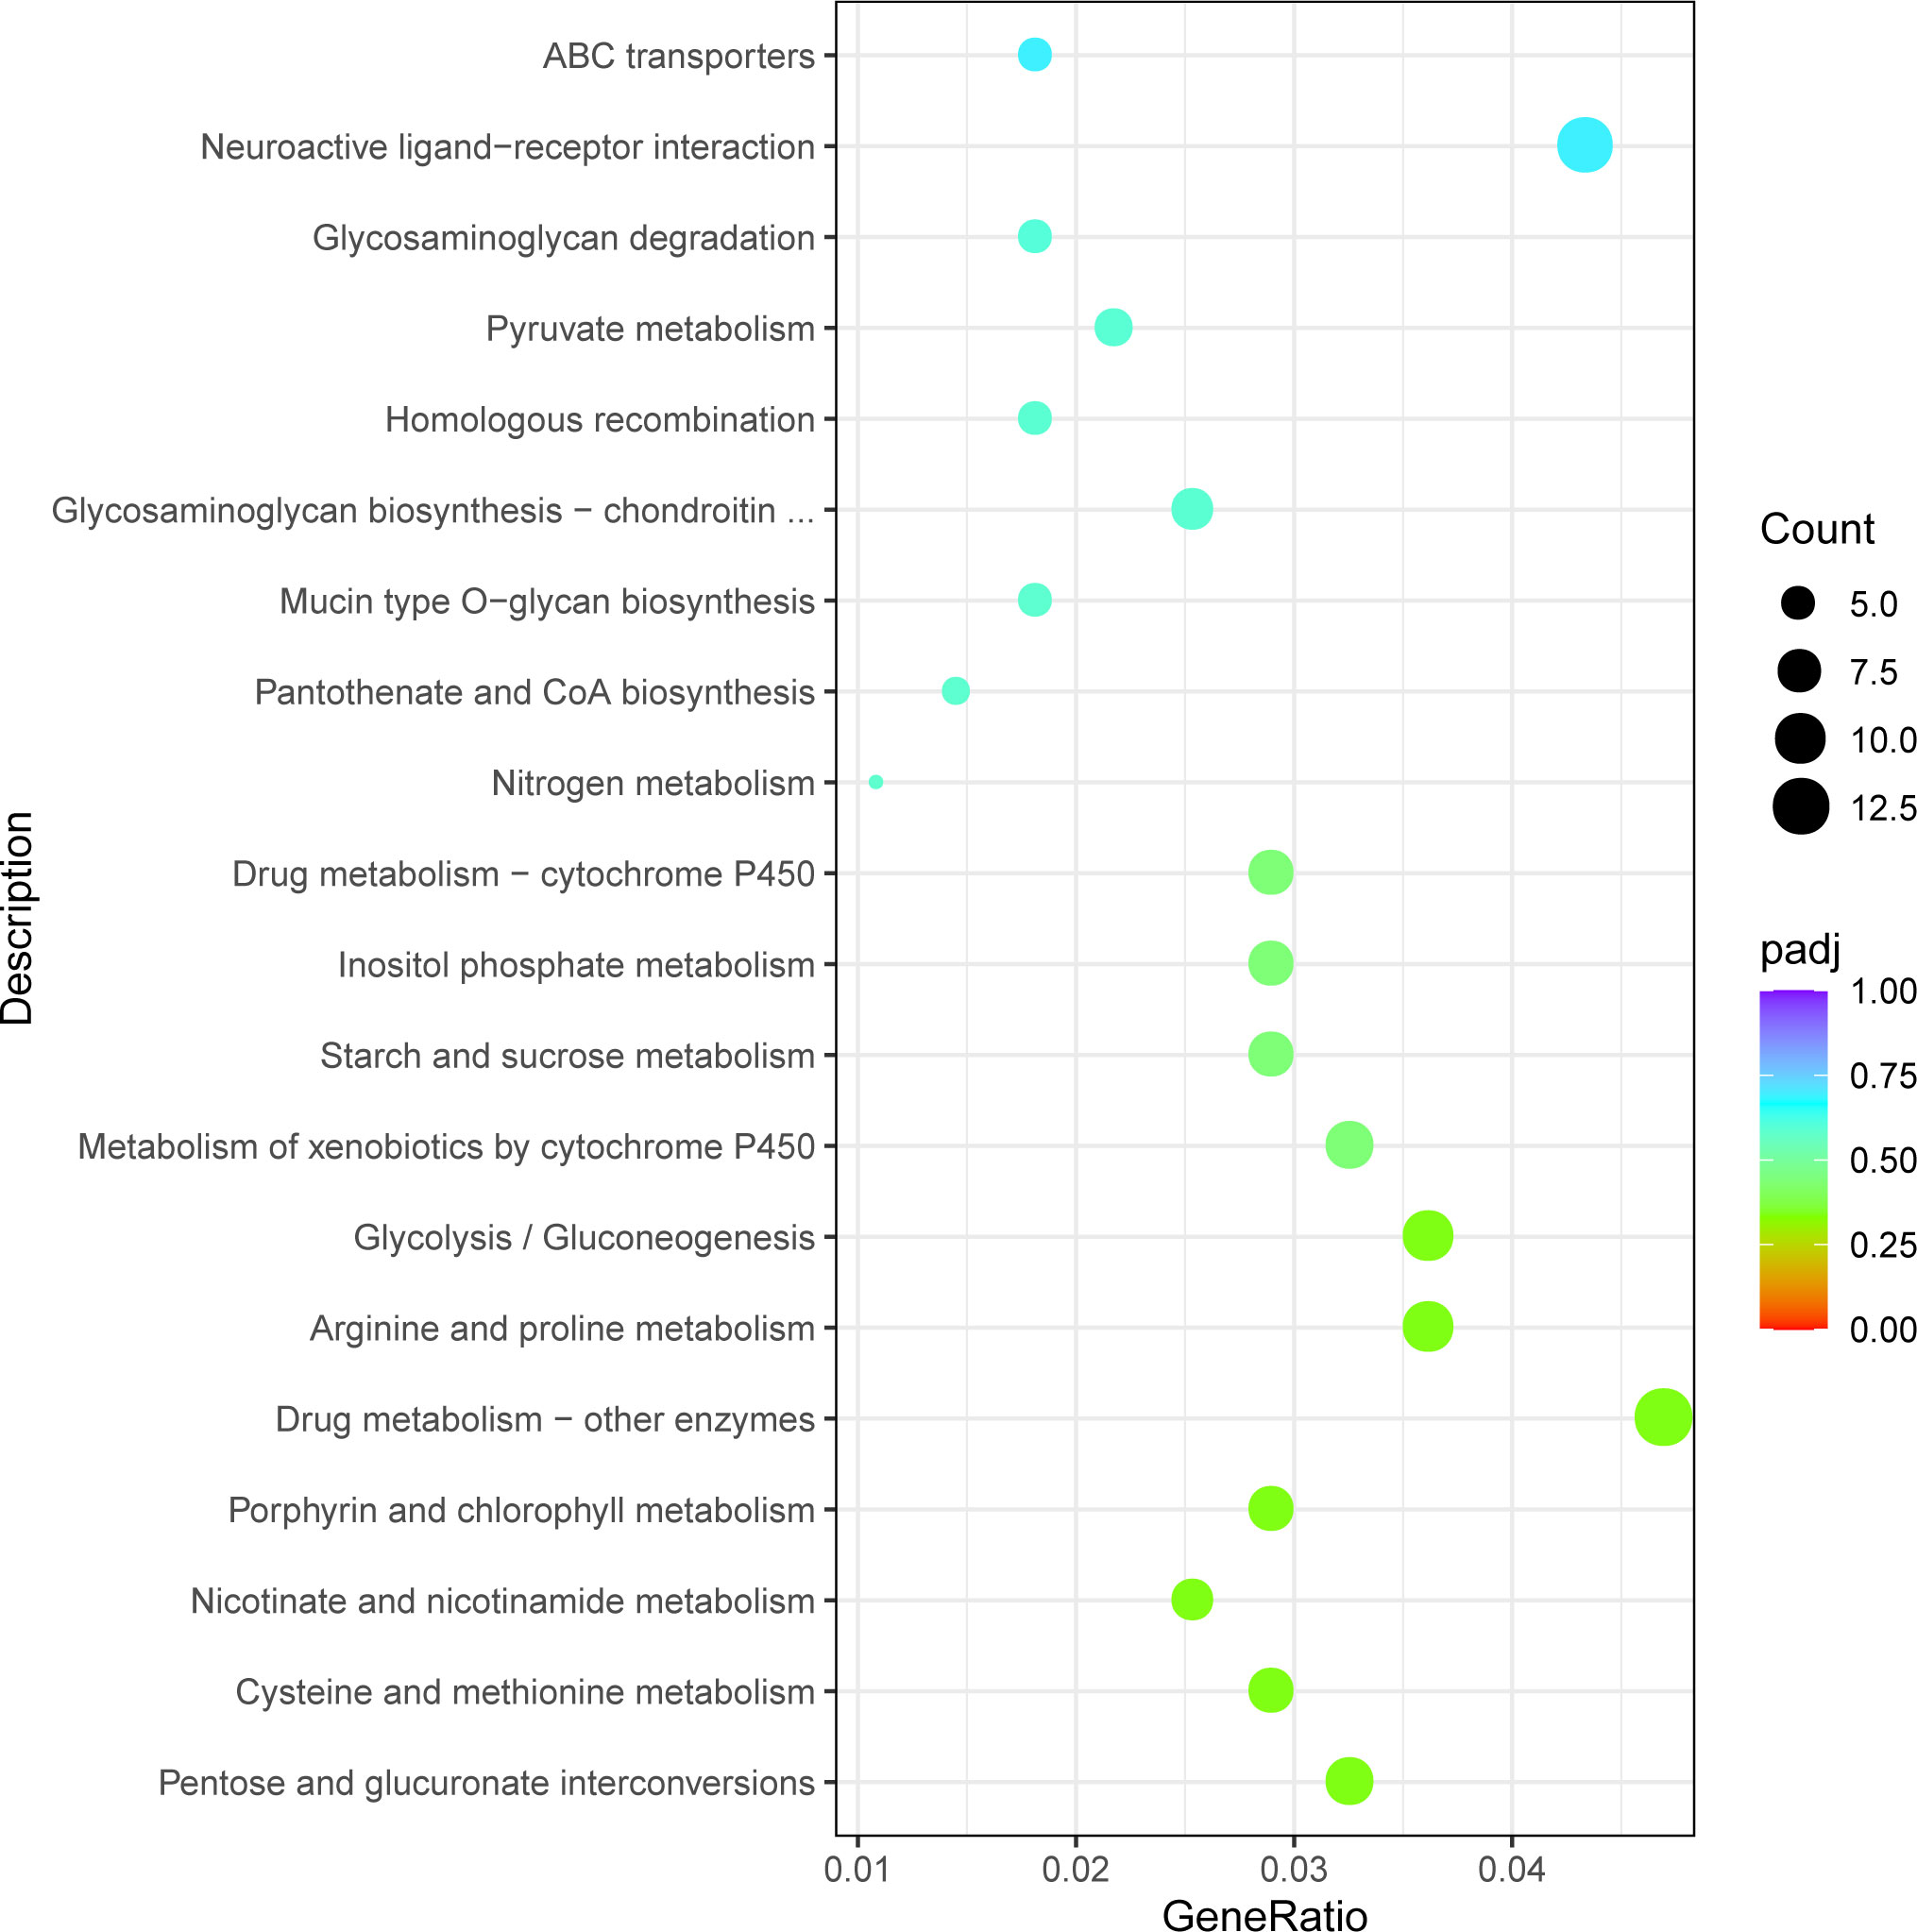
Figure 6 The top 20 statistically significant KEGG classifications.
3.6 Verification of transcriptomic data by qRT-PCR
Ten differentially expressed genes of interest were screened from the carapace tissue of M. japonicus for real-time quantitative PCR analysis to verify the expression patterns of unigenes in transcriptome data. The fluorescence quantitative PCR results of candidate genes showed good correlation with the expression level from RNA-seq data, and the expression trend of the same gene was consistent between the two groups (Figure 7).
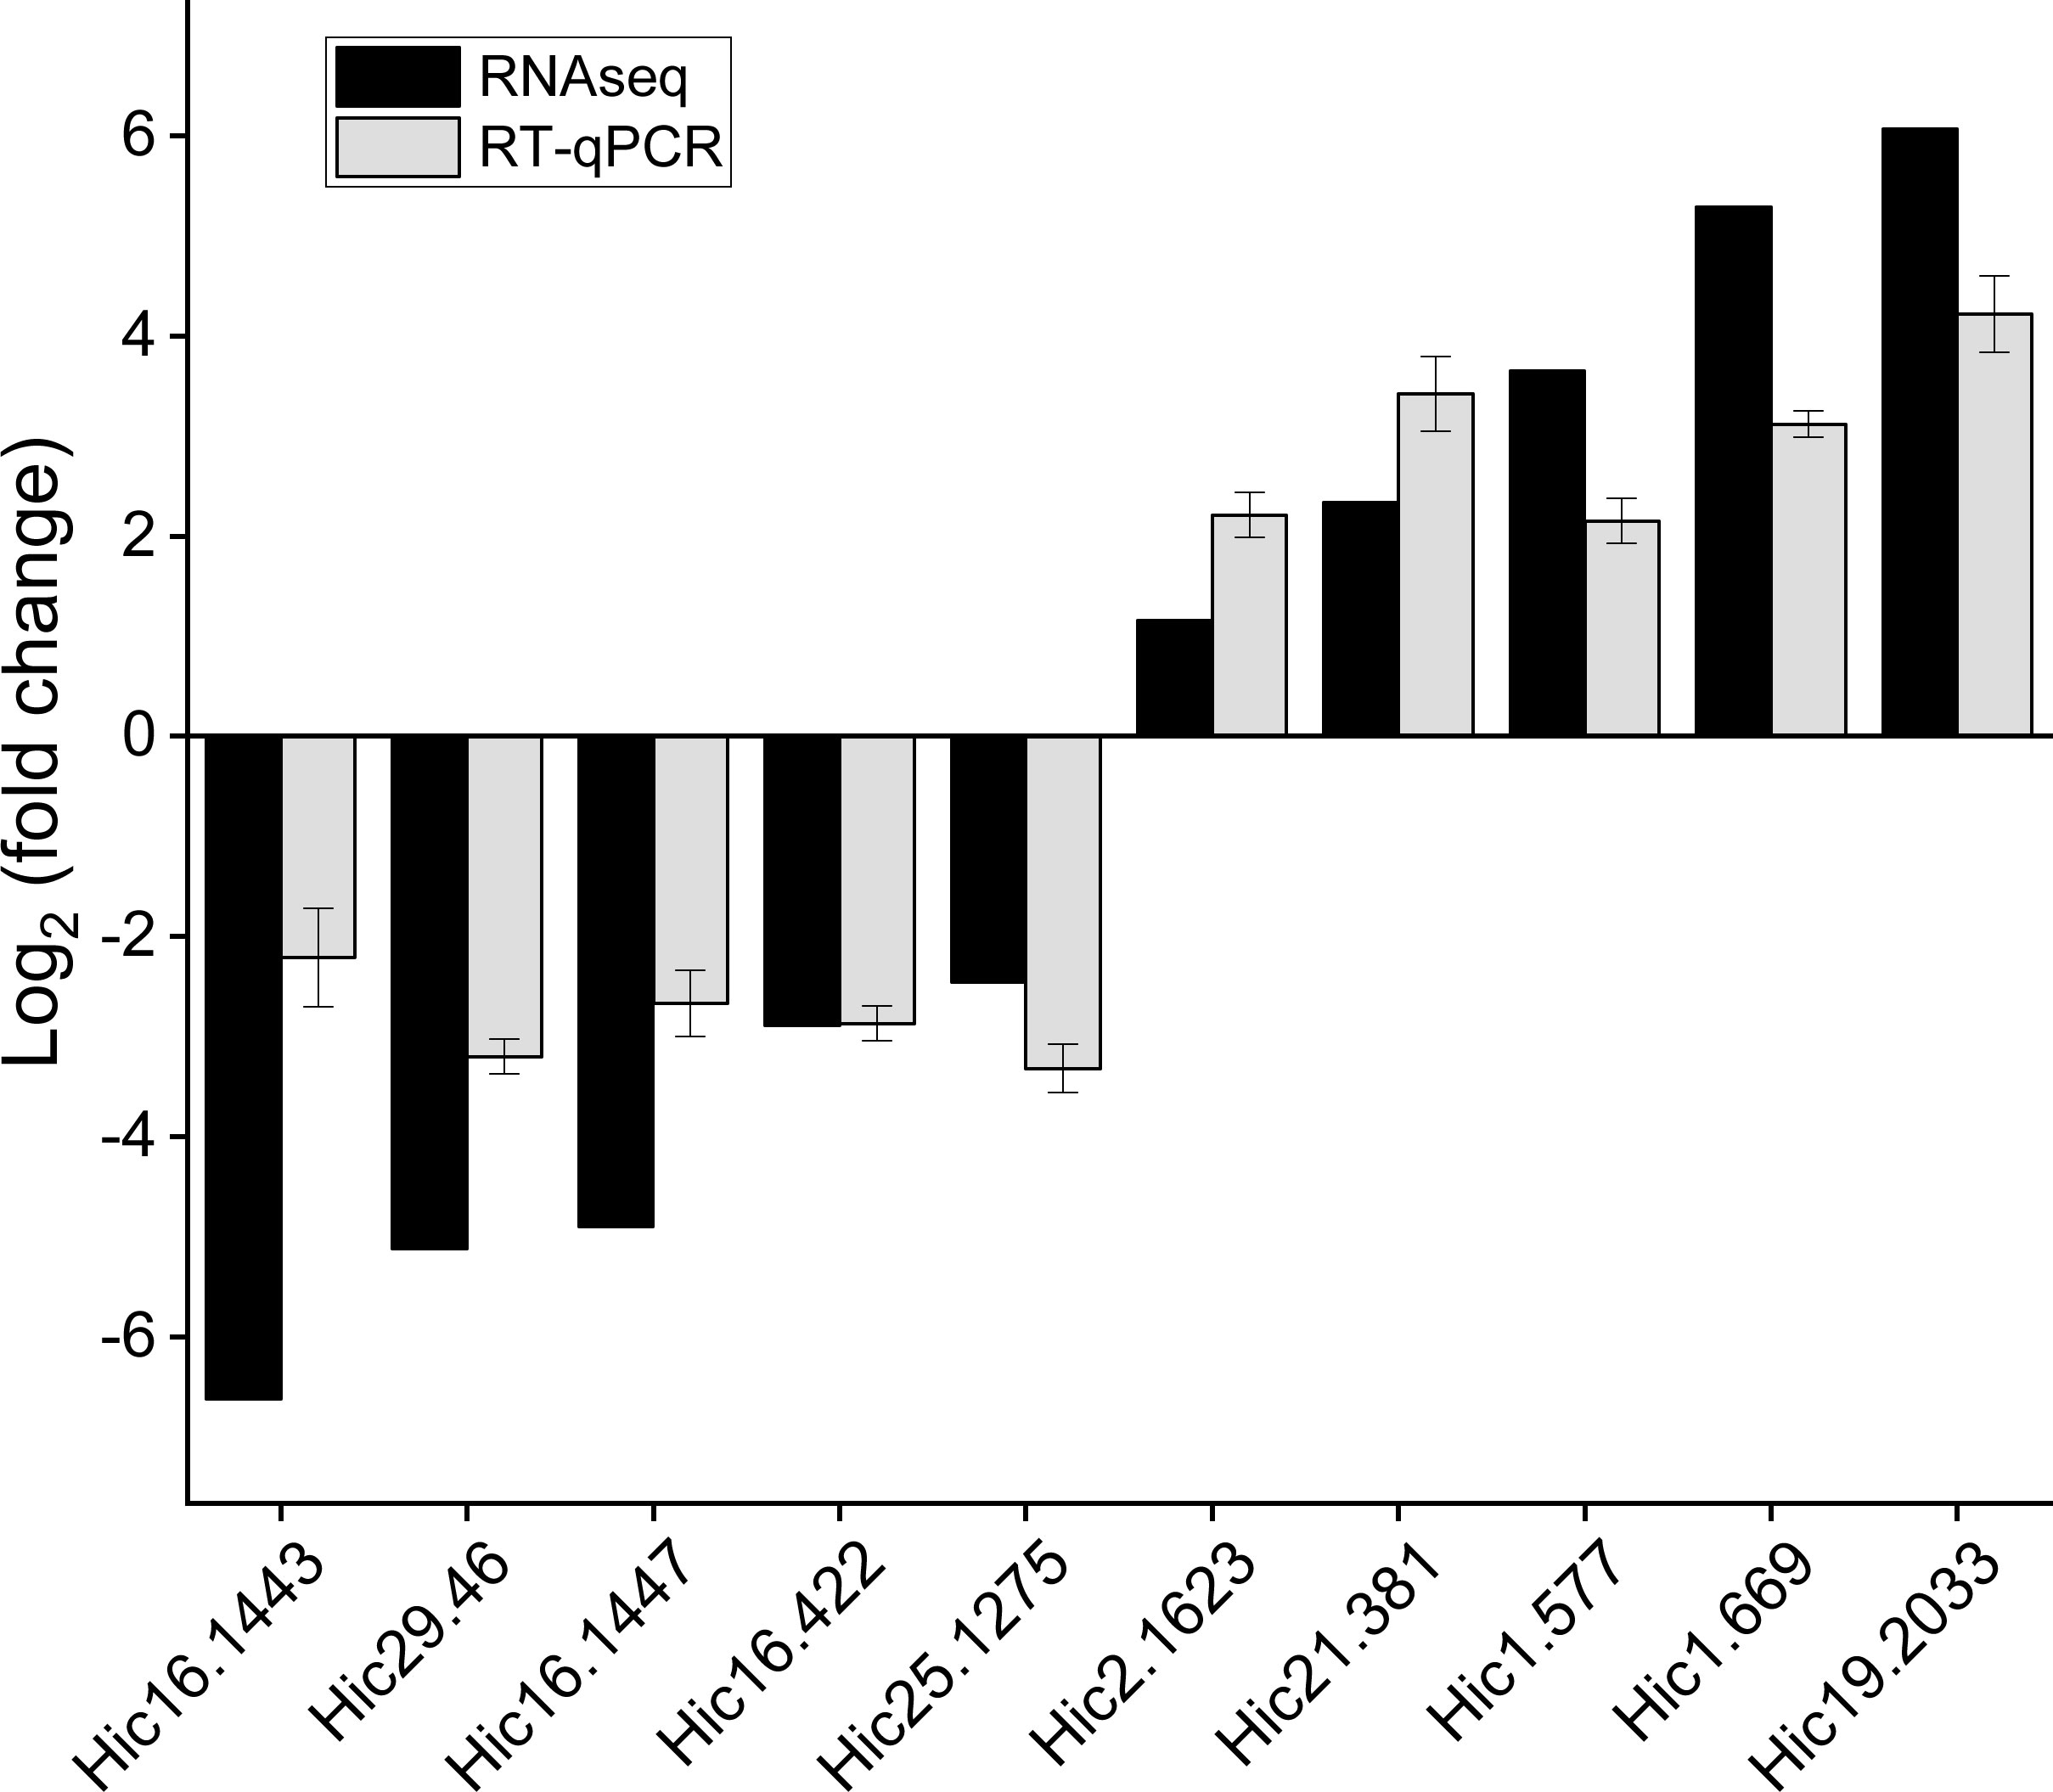
Figure 7 The fold change of DEGs was determined by RNA-Seq and qRT-PCR.
3.7 Functional classification of DEGs
According to the transcriptome analysis, a total of 15 unigenes encoding cuticular proteins or related proteins exhibited higher expression levels in variety II than in variety I (Table S3). These unigenes were classified into two groups based on domains. The unigene Evm.Hic29.46 encoded a protein containing a carbohydrate-binding domain (CBM) 14 domain, and other unigenes encoded proteins containing a chitin_bind_4 domain.
GO analysis also showed that the binding process was the term with the most differentially expressed unigenes. In this study, we identified several genes with binding functions, such as tubulin- and fibronectin-related genes, which were significantly higher in the variety I than in the variety II (Figure 8). As carotenoid-binding proteins, CRCN-A2 and CRCN-C1 subunit also had higher expression levels in the variety I individuals. The results of sequence alignment showed that crustacyanin A2 in the variety I and variety II shared 98.42% sequence identity, with three amino acid differences (18:S & G, 112:A & V, 113:L & F). The results of sequence alignment showed that crustacyanin C1 in the variety I and variety II shared 99.49% sequence identity, with one amino acid difference (28:A & S). The lipocalin consensus region marked in orange showed no amino acid residue differences (Figure 7). There were two obvious differences in the secondary structures of the CRCN-A2 and CRCN-C1 (Figure S1). Phylogenetic analysis showed that the CRCN-A2 and CRCN-C1 of M. japonicus were highly similar to those of its genetically close species (Figure 9).
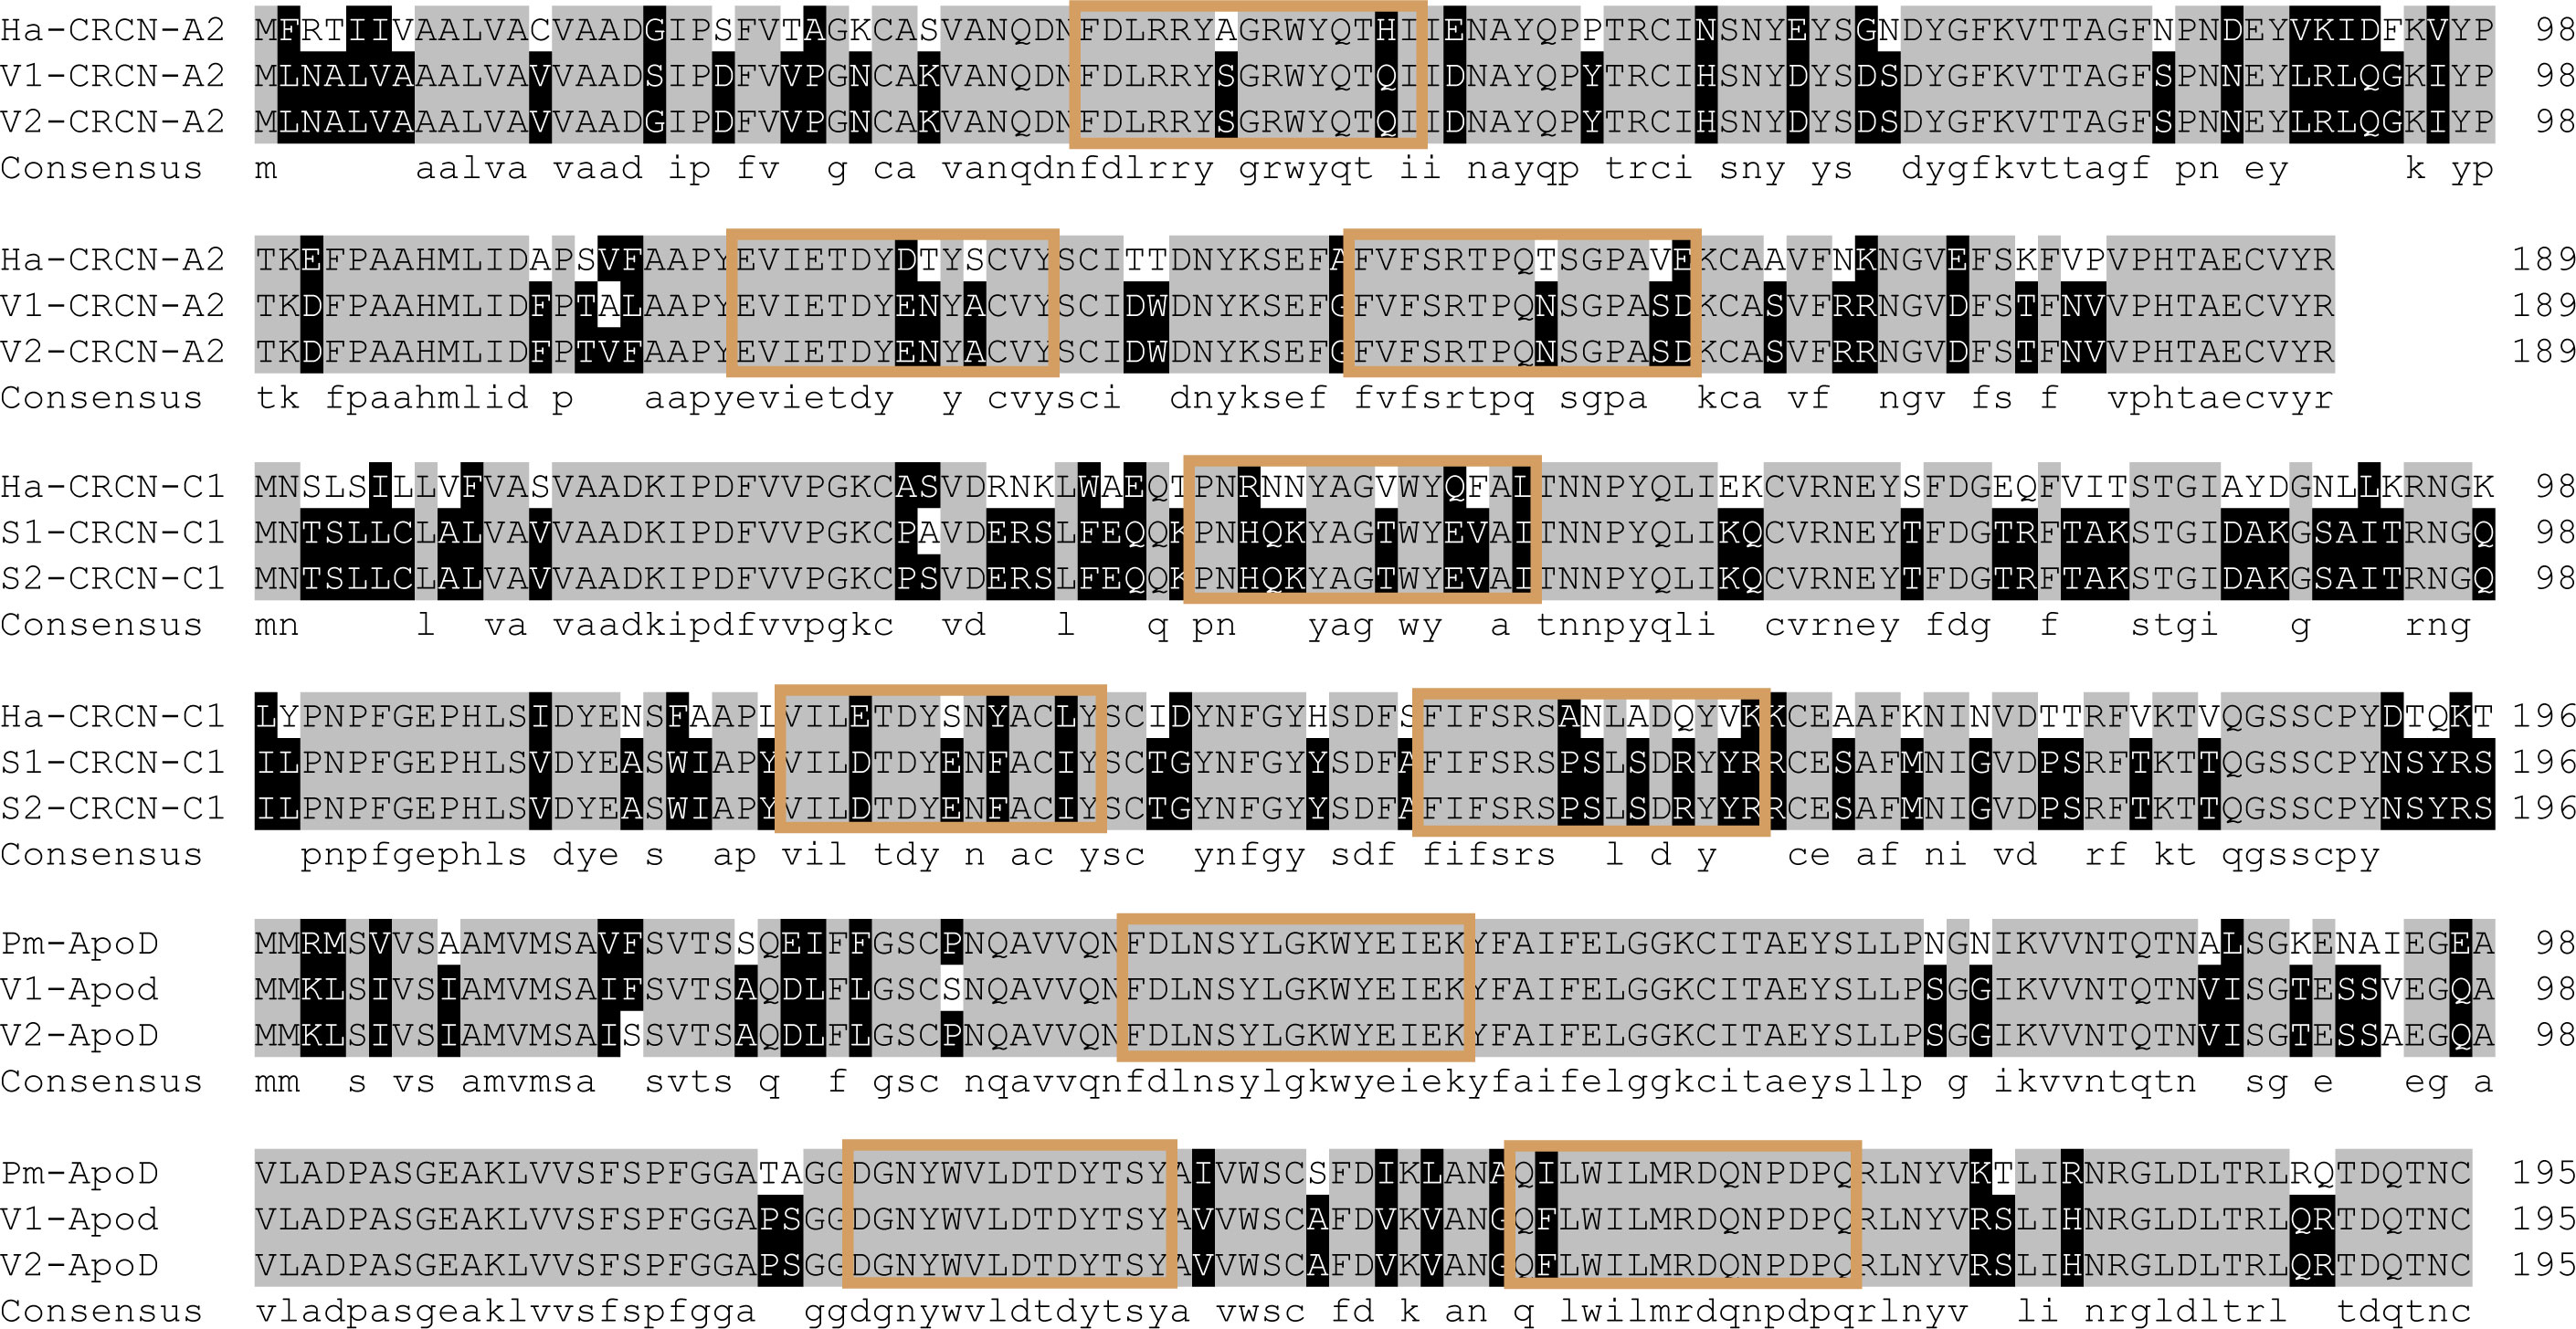
Figure 8 Alignment of crustacyanin and apod amino acid sequences. Ha and Pm represented Homarus americanus and Penaeus monodon. V1 and V2 represented the two varieties of M. japonicus. Amino acid sequences of consensus regions were colored.
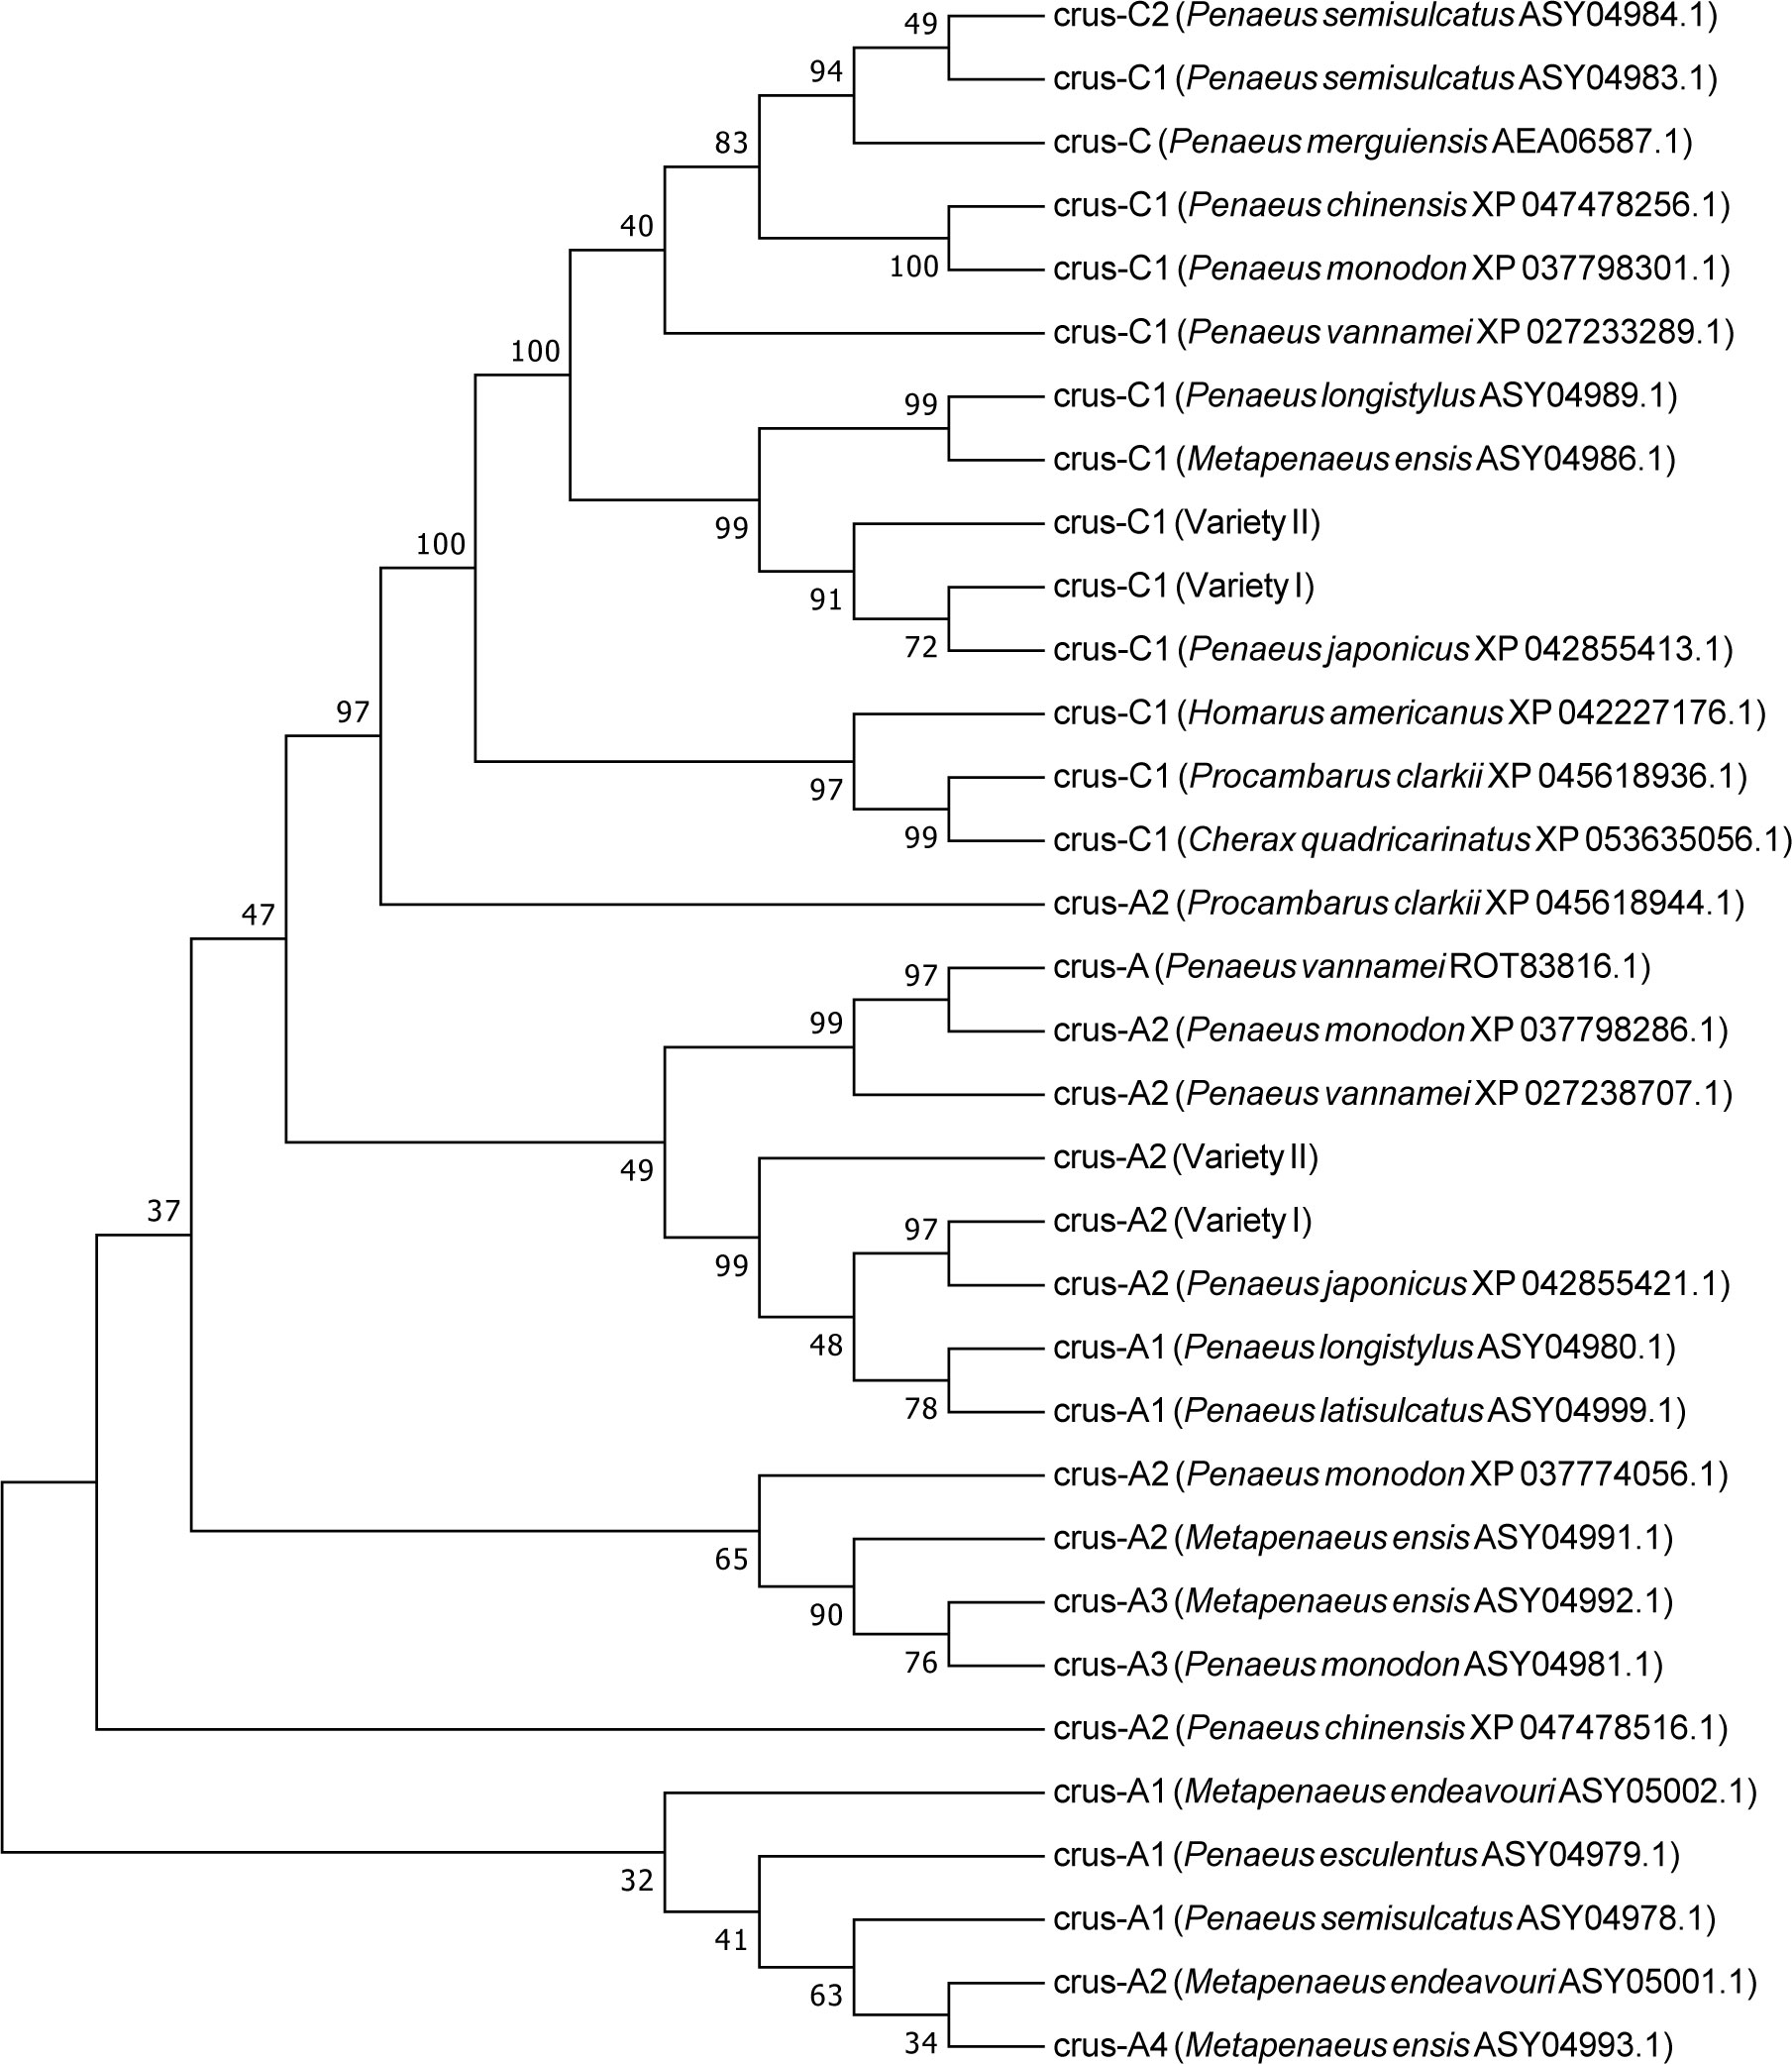
Figure 9 Evolutionary relationships of crustacyanin from M. japonicus and other species.
Unlike the crustacyanin gene, apolipoprotein D, a lipid transfer protein, had a higher expression level in the variety II individuals (Figure 7). The results of sequence alignment showed that apolipoprotein D in the variety I and variety II shared 98.47% sequence identity, with three amino acid differences (17: F & S, 31: S & P, 92: V & A). The consensus region marked in orange showed no amino acid residue differences (Figure 8). Similarly, there are two obvious differences in the secondary structure of these two amino acid sequences, which may be related to their functions (Figure S1).
4 Discussion
Animal markings play an important role in animal survival, reproduction and information exchange, which are important phenotypic characteristics for understanding key issues in evolutionary biology such as speciation, adaptation and polymorphism maintenance. In this study, we first observed the composition of pigment cells and detected the contents of different carotenoids in the carapace of M. japonicus. Comparative transcriptome analysis was performed on the two varieties of M. japonicus to identify differentially expressed genes associated with stripe pattern formation.
4.1 Distribution characteristics of pigment cells
The type and number of pigment cells determine the color and vividness of the animal (Border et al., 2019; Vissio et al., 2021). The species of pigment cells in crustaceans include melanocytes, yellow pigment cells, red pigment cells and mixed pigment cells (Qin et al., 2021). N. denticulata sinensis has five basic colors, including red, yellow, blue, black and white, and the pigment forms include dot, branch, snowflake, line, ribbon, etc (Lu et al., 2022; Zhang et al., 2022). The red pigment cells were mainly punctate and dendritic, and the yellow pigment cells were mainly linear or banded (Lindsay-Mosher and Pearson, 2019). Most of the time, there are five common pigment cells on N. denticulata sinensis, some of which overlap. In this study, the setae structure on the carapace was clearly observed, and there were red pigment cells in the stripe pattern and yellow pigment cells in the other parts. The distribution of pigmented cells directly affects the pattern characteristics of the carapace, which has been studied in similar ways in other animals (Bullara and De Decker, 2015; Djurdjevič et al., 2019). Red pigment cells are the main pigments in the stripe pattern of M. japonicus. The pigment cells in crustaceans are regulated by the actions of pigment-dispersing and pigment-concentrating peptide hormones on epidermal chromatophores (Gaus et al., 1990; Wei et al., 2021).
4.2 The relationship between astaxanthin and body color
The crustacean exoskeleton perfectly reflects the pattern and color of the underlying epithelial tissue (Ghidalia et al., 1985). Carotenoids, particularly astaxanthin, are the primary pigment in crustacean shell color (Wade et al., 2005). Compared with other carotenoids, the content of astaxanthin was the highest in the carapace of M. japonicus. In Panulirus cygnus, Wade et al. found a 2.4-fold difference in the amount of total carotenoids present in the shell extracts of reds compared to whites, and a correlated twofold difference in the amount of esterified astaxanthin present in the epithelium of red versus white individuals (Wade et al., 2005). The effect of esterified astaxanthin on body color was more significant, which has been studied in Oncorhynchus mykiss, Amphiprion ocellaris, and P. monodon (White et al., 2002; Tume et al., 2009; Ho et al., 2013).
4.3 The function of crustacyanin and apolipoproteins
In crustaceans, carotenoid-binding protein is important for stabilizing carotenoids, regulating color, and participating in development and antioxidant activities (Wade et al., 2017; Maoka, 2020; Tan et al., 2020). The shell color of crustaceans is primarily determined by incorporated of the carotenoid astaxanthin into a macromolecular protein complex known as crustacyanin (Chayen et al., 2003). Crustacyanin covalently binds to ingested astaxanthin to form a complex that results in a conformational change in astaxanthin that determines the species-specific color and pattern of the crustacean exoskeleton (Wade et al., 2012; Jin et al., 2021; Zhao et al., 2021; Chen et al., 2022). In this study, we found that the expression levels of CRCN A2 and CRCN C1 in variety I individuals were higher than those in variety I individuals. A lower expression level of crustacyanin might limit the binding and subsequent utilization of free astaxanthin (Jin et al., 2021). Whether low expression levels are directly or indirectly related to the formation of markings still needs further investigation.
Once loaded with carotenoids, apolipoproteins can help absorbed carotenoids target various tissues (Bhosale and Bernstein, 2007). As a lipid transfer protein, apolipoprotein D (ApoD) had higher expression levels in the variety II individuals. Jin et al. found that ApoD had a higher expression level in the wild-type E. carinicauda (Jin et al., 2021). In addition, the ABC transporter member 14 and solute carrier family 45 member 3 showed higher expression in variety II individuals. The pigmentation transport function of ABC transporters has been verified in silkworm, Drosophila and Harmonia axyridis (Tatematsu et al., 2011; Tsuji et al., 2018; Zuber et al., 2018; Shirk et al., 2023). Solute carriers (SLCs) are a group of membrane transport proteins, comprising over 300 members whose primary function is to facilitate the transport and absorption of various substrates across biofilms (Saikrithi et al., 2020; Girardin, 2022). Multiple SLC family genes were differentially expressed in different developmental stages of yellow mutant rainbow trout (Wu et al., 2022).
5 Conclusion
The two pattern types in the natural population of M. japonicus are ideal materials for studying the pattern and body color formation of crustaceans. In this study, we found that there were red pigment cells in the stripe pattern and yellow pigment cells in the other parts. We identified some differentially expressed genes associated with stripe pattern formation or pigment transport between the two varieties. In future studies, we will further clone pigment-dispersing and pigment-concentrating genes and analyze the relationship between free and esterified astaxanthin content and markings in two varieties of M. japonicus. The relationship between gene expression level and protein structure and their function in the pattern formation process still needs to be further explored. The results of this study will help to elucidate the molecular mechanism of the differential pattern formation of M. japonicus and provide a reference for further exploration of the formation mechanism of crustacean color.
Data availability statement
The datasets presented in this study can be found in online repositories. The names of the repository/repositories and accession number(s) can be found in the article/Supplementary Material.
Ethics statement
This study was approved by the Animal Care and Use Committee of Jiangsu Ocean University (protocol no. 2020-37; approval date: September 1, 2019). All procedures involving animals were performed in accordance with guidelines for the Care and Use of Laboratory Animals in China.
Author contributions
PW and CX: designed the experiment. SX, XL and JZ: conducted the experiment; ZY, XLZ and XYZ: formal analysis. PW: writing-original draft preparation. BY, HG and CX: writing-review and editing. CX: provided fund for the experiment. All authors contributed to the article and approved the submitted version.
Funding
This study was supported by the Natural Science Foundation of Jiangsu Province (No. BK20210924); the Open-end Funds of Jiangsu Key Laboratory of Marine Bioresources and Environment (SH20221205); Project funded by China Postdoctoral Science Foundation (2022M721397); Project funded by Postdoctoral Science Foundation of Lianyungang (LYG20220021); the Postgraduate Research & Practice Innovation Program of Jiangsu Province (KYCX23-3454, KYCX2023-104); the Innovation and Entrepreneurship Project of Jiangsu Ocean University (SY202311641631003, SY202311641631010); “521”scientific research projects of Lianyungang (LYG06521202128); Fisheries high quality development project of Yancheng (YCSCYJ2021006); the Priority Academic Program Development of Jiangsu Higher Education Institutions (PAPD).
Conflict of interest
The authors declare that the research was conducted in the absence of any commercial or financial relationships that could be construed as a potential conflict of interest.
Publisher’s note
All claims expressed in this article are solely those of the authors and do not necessarily represent those of their affiliated organizations, or those of the publisher, the editors and the reviewers. Any product that may be evaluated in this article, or claim that may be made by its manufacturer, is not guaranteed or endorsed by the publisher.
Supplementary material
The Supplementary Material for this article can be found online at: https://www.frontiersin.org/articles/10.3389/fmars.2023.1234940/full#supplementary-material
Supplementary Figure 1 | Secondary structure of crustacyanin and apod amino acid sequences.
References
Angell A., de Nys R., Mangott A., Vucko M. J. (2018). The effects of concentration and supplementation time of natural and synthetic sources of astaxanthin on the colouration of the prawn Penaeus monodon. Algal Res. 35, 577–585. doi: 10.1016/j.algal.2018.09.031
Berdan E. L., Fuller R. C., Kozak G. M. (2021). Genomic landscape of reproductive isolation in Lucania killifish: The role of sex loci and salinity. J. Evolutionary Biol. 34 (1), 157–174. doi: 10.1111/jeb.13725
Bhosale P., Bernstein P. S. (2007). Vertebrate and invertebrate carotenoid-binding proteins. Arch. Biochem. biophysics 458 (2), 121–127. doi: 10.1016/j.abb.2006.10.005
Border S. E., Piefke T. J., Fialkowski R. J., Tryc M. R., Funnell T. R., DeOliveira G. M., et al. (2019). Color change and pigmentation in a color polymorphic cichlid fish. Hydrobiologia 832 (1), 175–191. doi: 10.1007/s10750-018-3755-0
Budd A. M., Hinton T. M., Tonks M., Cheers S., Wade N. M. (2017). Rapid expansion of pigmentation genes in penaeid shrimp with absolute preservation of function. J. Exp. Biol. 220 (22), 4109–4118. doi: 10.1242/jeb.164988
Bullara D., De Decker Y. (2015). Pigment cell movement is not required for generation of Turing patterns in zebrafish skin. Nat. Commun. 6 (1) 1–7. doi: 10.1038/ncomms7971
Chayen N. E., Cianci M., Grossmann J. G., Habash J., Helliwell J. R., Nneji G. A., et al. (2003). Unravelling the structural chemistry of the colouration mechanism in lobster shell. Acta Crystallographica Section D: Biol. Crystallogr. 59 (12), 2072–2082. doi: 10.1107/S0907444903025952
Chen H., Ji H., Pan C., Zhang D., Su W., Liu S., et al. (2022). Purification and characterisation of two novel pigment proteins from the carapace of red swamp crayfish (Procambarus clarkii). Foods 11 (1), 35. doi: 10.3390/foods11010035
Dall W., Hill B. J., Rothlisberg P. C., Sharples D. J. (1990). The biology of the penaeidae. J. Crustacean Biol. 27 (6), 1–461.
Djurdjevič I., Furmanek T., Miyazawa S., Sušnik Bajec S. (2019). Comparative transcriptome analysis of trout skin pigment cells. BMC Genomics 20 (1), 1–15. doi: 10.1186/s12864-019-5714-1
Djurdjevič I., Kreft M. E., Sušnik Bajec S. (2015). Comparison of pigment cell ultrastructure and organisation in the dermis of marble trout and brown trout, and first description of erythrophore ultrastructure in salmonids. J. Anat. 227 (5), 583–595. doi: 10.1111/joa.12373
Ertl N. G., Elizur A., Brooks P., Kuballa A. V., Anderson T. A., Knibb W. R. (2013). Molecular characterisation of colour formation in the prawn Fenneropenaeus merguiensis. PloS One 8 (2), e56920. doi: 10.1371/journal.pone.0056920
Gaus G., Kleinholz L. H., Kegel G., Keller R. (1990). Isolation and characterization of red-pigment-concentrating hormone (RPCH) from six crustacean species. J. Comp. Physiol. B 160, 373–379. doi: 10.1007/BF01075668
Geourjon C., Deleage G. (1995). SOPMA: significant improvements in protein secondary structure prediction by consensus prediction from multiple alignments. Bioinformatics 11 (6), 681–684. doi: 10.1093/bioinformatics/11.6.681
Ghidalia W., Bliss D., Mantel L. (1985). Structural and biological aspects of pigments. Biol. crustacea 9, 301–395. doi: 10.1016/B978-0-12-106409-9.50016-6
Girardin F. (2022). Membrane transporter proteins: a challenge for CNS drug development. Dialogues Clin. Neurosci 8 (3), 311–321. doi: 10.31887/DCNS.2006.8.3/fgirardin
Grabherr M. G., Haas B. J., Yassour M., Levin J. Z., Amit I. (2013). Trinity: reconstructing a full-length transcriptome without a genome from RNA-Seq data. Nat. Biotechnol. 29, 644. doi: 10.1038/nbt.1883
Ho A. L., O’Shea S. K., Pomeroy H. F. (2013). Dietary esterified astaxanthin effects on color, carotenoid concentrations, and compositions of clown anemonefish, Amphiprion ocellaris, skin. Aquaculture Int. 21, 361–374. doi: 10.1007/s10499-012-9558-9
Hu J., Lu W., Lv M., Wang Y., Ding R., Wang L. (2018). Extraction and purification of astaxanthin from shrimp shells and the effects of different treatments on its content. Rev. Bras. Farmacogn. 29, 24–29. doi: 10.1016/j.bjp.2018.11.004
Huang Y., Zhang L., Wang G., Huang S. (2022). De novo assembly transcriptome analysis reveals the genes associated with body color formation in the freshwater ornamental shrimps Neocaridina denticulate sinensis. Gene 806, 145929. doi: 10.1016/j.gene.2021.145929
Jin Y., Li S., Yu Y., Zhang C., Zhang X., Li F. (2021). Transcriptome analysis provides insights into the mechanism of astaxanthin enrichment in a mutant of the ridgetail white prawn Exopalaemon carinicauda. Genes 12 (5), 618. doi: 10.3390/genes12050618
Kumar S., Stecher G., Tamura K. (2016). MEGA7: molecular evolutionary genetics analysis version 7.0 for bigger datasets. Mol. Biol. Evol. 33 (7), 1870–1874. doi: 10.1093/molbev/msw054
Larking M., Blackshields G., Brown N., Chenna R., McGettigan G., McWilliam H., et al. (2007). ClustalW and clustalX version 2. Bioinformatics 23 (21), 2947–2948. doi: 10.1093/bioinformatics/btm404
Lavery S., Chan T. Y., Tam Y. K., Chu K. H. (2004). Phylogenetic relationships and evolutionary history of the shrimp genus Penaeus s.l. derived from mitochondrial DNA. Mol. Phylogenet. Evol. 31 (1), 39–49. doi: 10.1016/j.ympev.2003.07.015
Lemoine M., Barluenga M., Lucek K., Mwaiko S., Haesler M., Chapman L. J., et al. (2019). Recent sympatric speciation involving habitat-associated nuptial colour polymorphism in a crater lake cichlid. Hydrobiologia 832 (1), 297–315. doi: 10.1007/s10750-018-3746-1
Li Q., Zu L., Cheng Y., Wade N. M., Liu J., Wu X. (2020). Carapace color affects carotenoid composition and nutritional quality of the Chinese mitten crab, Eriochier sinensis. LWT 126, 109286. doi: 10.1016/j.lwt.2020.109286
Lindsay-Mosher N., Pearson B. J. (2019). The true colours of the flatworm: Mechanisms of pigment biosynthesis and pigment cell lineage development in planarians. Semin. Cell Dev. Biol. 87, 37–44. doi: 10.1016/j.semcdb.2018.05.010
Love M. I., Huber W., Anders S. (2014). Moderated estimation of fold change and dispersion for RNA-seq data with DESeq2. Genome Biol. 15 (12), 1–21. doi: 10.1186/s13059-014-0550-8
Lu X., Zhang L., Wang G., Huang S., Zhang Y., Xie Y. (2022). The occurrence process of chromatophores in three body color strains of the ornamental shrimp Neocaridina denticulata sinensis. Zoomorphology 141 (3-4), 283–295. doi: 10.1007/s00435-022-00563-7
Maoka T. (2020). Carotenoids as natural functional pigments. J. Natural Medicines 74 (1), 1–16. doi: 10.1007/s11418-019-01364-x
Maoka T., Kawashima Y., Takaki M. (2018). Structures of yellow xanthophylls and metabolism of astaxanthin in the prawn Penaeus japonicus. J. oleo Sci. 67 (11), 1425–1433. doi: 10.5650/jos.ess18103
Matsuno T. (2001). Aquatic animal carotenoids. Fisheries Sci. 67 (5), 771–783. doi: 10.1046/j.1444-2906.2001.00323.x
Qin Z., Jiang Y., Liu X., Jiang Y. (2021). The advance in the research of chomatophores in shrimps and crabs. Hebei Fishery 8), 38–44. doi: 10.3969/j.issn.1004-6755.2021.08.010.
Saikrithi P., Balasubramanian C., Otta S. K., Tomy S. (2020). Expression dynamics of solute carrier family 15 member 4 (SLC15A4) and its potential regulatory role in ovarian development of the Indian white shrimp, Penaeus indicus. Mol. Biol. Rep. 47 (5), 3797–3805. doi: 10.1007/s11033-020-05471-x
Shirk B. D., Shirk P. D., Furlong R. B., Scully E. D., Wu K., Siegfried B. D. (2023). Gene editing of the ABC Transporter/White locus using CRISPR/Cas9-mediated mutagenesis in the Indian Meal Moth. J. Insect Physiol. 145, 104471. doi: 10.1016/j.jinsphys.2022.104471
Sigrist C. J. A., Lorenzo C., Edouard D. C., Langendijk-Genevaux P. S., Virginie B., Amos B., et al. (2010). PROSITE, a protein domain database for functional characterization and annotation. Nucleic Acids Res. 38, D161. doi: 10.1093/nar/gkp885
Simon A., Huber (2010). Differential expression analysis for sequence count data. Genome Biol. 1, 1–13. doi: 10.1186/gb-2010-11-10-r106
Tan K., Zhang H., Lim L.-S., Ma H., Li S., Zheng H. (2020). Roles of carotenoids in invertebrate immunology. Front. Immunol. 10, 3041. doi: 10.3389/fimmu.2019.03041
Tatematsu K.I., Yamamoto K., Uchino K., Narukawa J., Iizuka T., Banno Y., et al. (2011). Positional cloning of silkworm white egg 2 (w-2) locus shows functional conservation and diversification of ABC transporters for pigmentation in insects. Genes to Cells 16 (4), 331–342. doi: 10.1111/j.1365-2443.2011.01490.x
Tirmizi N. (1971). Marsupenaeus, a new subgenus of Penaeus Fabricius1978 (Decapoda, natantia). Pakistan J. Zoology 3 (2), 193–194.
Tsoi K. H., Chan T. Y., Chu K. H. (2007). Molecular population structure of the kuruma shrimp Penaeus japonicus species complex in western Pacific. Mar. Biol. 150 (6), 1345–1364. doi: 10.1007/s00227-006-0426-x
Tsoi K. H., Ma K. Y., Wu T. H., Fennessy S. T., Chu K. H., Chan T. Y. (2014). Verification of the cryptic species Penaeus pulchricaudatus in the commercially important kuruma shrimp P. japonicus (Decapoda : Penaeidae) using molecular taxonomy. Invertebrate Systematics 28 (5), 476–490. doi: 10.1071/IS14001
Tsoi K. H., Wang Z. Y., Chu K. H. (2005). Genetic divergence between two morphologically similar varieties of the kuruma shrimp Penaeus japonicus. Mar. Biol. 147 (2), 367–379. doi: 10.1007/s00227-005-1585-x
Tsuji T., Gotoh H., Morita S., Hirata J., Minakuchi Y., Yaginuma T., et al. (2018). Molecular characterization of eye pigmentation-related ABC transporter genes in the ladybird beetle Harmonia axyridis reveals striking gene duplication of the white gene. Zoological Sci. 35 (3), 260–267. doi: 10.2108/zs170166
Tume R., Sikes A., Tabrett S., Smith D. (2009). Effect of background colour on the distribution of astaxanthin in black tiger prawn (Penaeus monodon): Effective method for improvement of cooked colour. Aquaculture 296 (1-2), 129–135. doi: 10.1016/j.aquaculture.2009.08.006
Vissio P. G., Darias M. J., Di Yorio M. P., Sirkin D. I. P., Delgadin T. H. (2021). Fish skin pigmentation in aquaculture: The influence of rearing conditions and its neuroendocrine regulation. Gen. Comp. Endocrinol. 301, 113662. doi: 10.1016/j.ygcen.2020.113662
Wade N. M., Anderson M., Sellars M. J., Tume R. K., Preston N. P., Glencross B. D. (2012). Mechanisms of colour adaptation in the prawn Penaeus monodon. J. Exp. Biol. 215 (2), 343–350. doi: 10.1242/jeb.064592
Wade N. M., Gabaudan J., Glencross B. D. (2017). A review of carotenoid utilisation and function in crustacean aquaculture. Rev. Aquaculture 9 (2), 141–156. doi: 10.1111/raq.12109
Wade N., Goulter K. C., Wilson K. J., Hall M. R., Degnan B. M. (2005). Esterified astaxanthin levels in lobster epithelia correlate with shell colour intensity: potential role in crustacean shell colour formation. Comp. Biochem. Physiol. Part B: Biochem. Mol. Biol. 141 (3), 307–313. doi: 10.1016/j.cbpc.2005.04.004
Wang P., Chen B., Zheng J., Cheng W., Zhang H., Wang J., et al. (2020). Fine-scale population genetic structure and parapatric cryptic species of kuruma shrimp (Marsupenaeus japonicus), along the northwestern pacific coast of China. Front. Genet. 11 (118). doi: 10.3389/fgene.2020.00118
Wei L.-L., Chen T.-T., Luo B.-Y., Qiu G.-F. (2021). Evidences for red pigment concentrating hormone (RPCH) and beta-pigment dispersing hormone (β-PDH) inducing oocyte meiotic maturation in the chinese mitten crab, eriocheir sinensis. Front. Endocrinol. 12, 1751. doi: 10.3389/fendo.2021.802768
White D., Page G., Swaile J., Moody A., Davies S. (2002). Effect of esterification on the absorption of astaxanthin in rainbow trout, Oncorhynchus mykiss (Walbaum). Aquaculture Res. 33 (5), 343–350. doi: 10.1046/j.1365-2109.2002.00680.x
Wu T., Hu E., Xu S., Chen M., Guo P., Dai Z., et al. (2021). clusterProfiler 4.0: A universal enrichment tool for interpreting omics data. Innovation (Camb) 2 (3), 100141. doi: 10.1016/j.xinn.2021.100141
Wu S., Huang J., Li Y., Zhao L., Liu Z. (2022). Analysis of yellow mutant rainbow trout transcriptomes at different developmental stages reveals dynamic regulation of skin pigmentation genes. Sci. Rep. 12 (1), 256. doi: 10.1038/s41598-021-04255-y
Yang L., Smyth G. K., Wei S. (2014). featureCounts: an efficient general purpose program for assigning sequence reads to genomic features. Bioinformatics 7), 923–930. doi: 10.1093/bioinformatics/btt656
Yang F., Wang M. R., Ma Y. G., Ma W. M., Yang W. J. (2011). Prawn lipocalin: characterization of a color shift induced by gene knockdown and ligand binding assay. J. Exp. Zoology Part A: Ecol. Genet. Physiol. 315 (9), 562–571. doi: 10.1002/jez.706
Zhang C., Su F., Li S., Yu Y., Xiang J., Liu J., et al. (2018). Isolation and identification of the main carotenoid pigment from a new variety of the ridgetail white prawn Exopalaemon carinicauda. Food Chem. 269, 450–454. doi: 10.1016/j.foodchem.2018.06.143
Zhang R., Wang Y., Xu C., Chen F., Yu Q., Sun Y., et al. (2022). Characterization of peroxiredoxin from Neocaridina denticulata sinensis and its antioxidant and DNA protection activity analysis. Fish Shellfish Immunol. 127, 211–218. doi: 10.1016/j.fsi.2022.06.028
Zhao C., Peng C., Fan S., Wang P., Yan L., Xie Z., et al. (2021). Identification of a novel crustacyanin-like lipocalin in Penaeus monodon: Molecular cloning, tissue distribution and its functional studies in astaxanthin accumulation. Aquaculture 539, 736615. doi: 10.1016/j.aquaculture.2021.736615
Zuber R., Norum M., Wang Y., Oehl K., Gehring N., Accardi D., et al. (2018). The ABC transporter Snu and the extracellular protein Snsl cooperate in the formation of the lipid-based inward and outward barrier in the skin of Drosophila. Eur. J. Cell Biol. 97 (2), 90–101. doi: 10.1016/j.ejcb.2017.12.003
Keywords: Marsupenaeus japonicus, carapace stripe, transcriptome, crustacyanin, formation mechanism
Citation: Wang P, Xie S, Li X, Zhu J, You Z, Zhou X, Zhou X, Yan B, Gao H and Xing C (2023) Transcriptome analysis provides insights into the mechanism of carapace stripe formation in two closely related Marsupenaeus species. Front. Mar. Sci. 10:1234940. doi: 10.3389/fmars.2023.1234940
Received: 05 June 2023; Accepted: 19 July 2023;
Published: 04 August 2023.
Edited by:
Menghong Hu, Shanghai Ocean University, ChinaReviewed by:
Lei Wei, Ludong University, ChinaXianliang Meng, Chinese Academy of Fishery Sciences (CAFS), China
Copyright © 2023 Wang, Xie, Li, Zhu, You, Zhou, Zhou, Yan, Gao and Xing. This is an open-access article distributed under the terms of the Creative Commons Attribution License (CC BY). The use, distribution or reproduction in other forums is permitted, provided the original author(s) and the copyright owner(s) are credited and that the original publication in this journal is cited, in accordance with accepted academic practice. No use, distribution or reproduction is permitted which does not comply with these terms.
*Correspondence: Chaofan Xing, WGluZ2NmQGpvdS5lZHUuY24=