 Kwanwoo Kim1
 Sun-Yong Ha2
 Kyung-Hoon Shin3
 Jee-Hoon Kim2
 C. J. Mundy4
 Laura A. Dalman4,5
 Bo Kyung Kim3
 Dabin Lee1
 Hyo Keun Jang1
 Yejin Kim1
 Sanghoon Park1
 Sang Heon Lee1*
- 1Department of Oceanography and Marine Research Institute, Pusan National University, Busan, Republic of Korea
- 2Division of Polar Ocean Sciences, Korea Polar Research Institute, Incheon, Republic of Korea
- 3Department of Marine Science and Convergent Technology, Hanyang University, Ansan, Republic of Korea
- 4Department of Environment and Geography, Centre for Earth Observation Science (CEOS), University of Manitoba, Winnipeg, MB, Canada
- 5Institute for Marine and Antarctic Studies, University of Tasmania, Hobart, TAS, Australia
Ice algae thriving within sea ice play a crucial role in transferring energy to higher trophic levels and influencing biogeochemical processes in polar oceans; however, the distribution of organic matter within the ice interior is not well understood. This study aimed to investigate the vertical distribution of organic matter, including chlorophyll a (Chl-a), particulate organic carbon and nitrogen (POC and PON), carbohydrates (CHO), proteins (PRT), lipids (LIP), and food material (FM), within the sea ice. Samples were collected from the bottom, middle, and top sections of the sea ice column near Cambridge Bay during the spring of 2018. Based on the δ13C signature, biochemical composition, and POC contribution of biopolymeric carbon (BPC), the organic substances within the sea ice were predominantly attributed to marine autotrophs. While the highest concentrations of each parameter were observed at the sea ice bottom, notable concentrations were also found in the upper sections. The average sea ice column-integrated Chl-a concentration was 5.05 ± 2.26 mg m−2, with the bottom ice section contributing 59% (S.D. = ± 10%) to the total integration. The column-integrated concentrations of FM, BPC, POC, and PON were 2.05 ± 0.39, 1.10 ± 0.20, 1.47 ± 0.25, and 0.09 ± 0.03 g m−2, respectively. Contributions of the bottom ice section to these column-integrated concentrations varied for each parameter, with values of 20 ± 6, 21 ± 7, 19 ± 5, and 28 ± 7%, respectively. While the bottom ice section exhibited a substantial Chl-a contribution in line with previous studies, significantly higher contributions of the other parameters were observed in the upper sea ice sections. This suggests that the particulate matter within the interior of the sea ice could potentially serve as an additional food source for higher trophic grazers or act as a seeding material for a phytoplankton bloom during the ice melting season. Our findings highlight the importance of comprehensive field measurements encompassing the entire sea ice section to better understand the distribution of organic carbon pools within the sea ice in the Arctic Ocean.
Introduction
Ice algae thrive within sea ice and play a crucial role in transferring energy and organic matter to upper trophic levels in ice-covered polar oceans (Michel et al., 2002; Jin et al., 2006; Søreide et al., 2010; Daase et al., 2013; Van Leeuwe et al., 2018). These algae become incorporated into the ice matrix, which forms during the Arctic autumn (Ratkova and Wassmann, 2005; Riedel et al., 2007; Arrigo et al., 2010). Particularly, large-sized diatoms among these algae become selectively enriched in the ice, leading to elevated particle concentrations during the early stage of the ice formation (Gradinger and Ikävalko, 1998; Von Quillfeldt et al., 2003; Riedel et al., 2007; Arrigo et al., 2010). After the Arctic winter darkness, when sunlight returns, the primary production of ice algae occurs at the bottom of the sea ice, leading to an ice algal bloom (Leu et al., 2015). This bloom emerges several months before the pelagic bloom and provides essential nutrition for zooplankton such as amphipods and copepods, that survive the Arctic polar night (Lizotte, 2001; Michel et al., 2002; Søreide et al., 2010; Lee et al., 2011; Leu et al., 2015). Previous studies on sympagic (ice-associated) organisms have mainly focused on the sea ice’s bottom section due to the crucial role of ice algae in the ice-covered Arctic food chain (Lee et al., 2008; Leu et al., 2015; Kim et al., 2020). Nevertheless, some evidence suggests that the ice algal biomass within the ice’s interior should not be overlooked (Gradinger and Zhang, 1997; Gradinger, 1999; Werner et al., 2007; Song et al., 2016). Gradinger (1999) reported that 4-62% of algal biomass resided in the lowermost 20 to 40 cm of the sea ice column, implying that solely focusing on the bottom section could overlook a critical biomass reservoir. Song et al. (2016) detected a significant amount of particulate organic carbon and primary production throughout the entire sea ice column in the Chukchi Sea. As summer approaches, the ice algae bloom ends with the ice melting, releasing biomass into the water column (Michel et al., 1996; Fortier et al., 2002; Michel et al., 2006). This biomass serves as a seed for the pelagic bloom and a food source for pelagic and benthic grazers (Constable et al., 2003; Arrigo, 2014; Olsen et al., 2017). Therefore, the various organic matter within the sea ice interior can significantly influence biogeochemical processes in the Arctic Ocean. However, in comparison to the sea ice bottom, the biochemical compositions of particulate matter within the sea ice interior are still largely unknown (Lee et al., 2008; Pogorzelec et al., 2017; Kim et al., 2020).
The ongoing climate change induces noticeable shifts in the timing of sea ice formation and melting in the Arctic Ocean (Howell et al., 2006; Markus et al., 2009; Stroeve et al., 2012; Howell and Brady, 2019). Furthermore, the prevalent sea ice components are transitioning from multi-year sea ice to young first-year sea ice (Comiso, 2012; Li et al., 2021). However, no information on the sea ice algae’s status is currently available in the landfast first-year sea ice zone near Cambridge Bay in the Canadian Arctic. Given the limited availability of field measurement data in the remote Arctic region, the objectives of this study were to examine the environmental characteristics within sea ice and the underlying water. Specifically, the study aimed to investigate the vertical distribution of biological parameters and their relative contributions between the bottom and upper sections of the ice column in the landfast first-year sea ice zone near Cambridge Bay, Canadian Arctic. The study also sought to estimate the column-integrated concentrations of biological parameters, which could potentially serve as an additional food source for pelagic and benthic grazers along the melting of the sea ice. By addressing these research objectives, the study aimed to enhance our understanding of ecological dynamics and biogeochemical processes occurring within the sea ice environment. This information holds particular value in the light of ongoing climate events affecting the Arctic region and associated changes in the sea ice coverage. The logistical challenges posed by accessing the remote Arctic region have limited the availability of field data, making studies like this crucial for expanding our knowledge of significant and rapidly changing ecosystems.
Materials and methods
Study area
During the research period from April 7 to April 26, 2018, ice and water samples were collected from the landfast sea ice and the underlying water near Cambridge Bay in the Kitikmeot Sea of the Canadian Arctic (Figure 1). The sampling locations were chosen based on a transect that crossed a narrow-constricted waterway, following the findings of Dalman et al. (2019), who observed enhanced nutrient supply from the ocean to the sea ice towards the center of the Finlayson Islands. Four stations, labeled as st.1, st.2, st.3, and st.4, were selected for this study. Due to logistical issues, st.1 and st.2 were visited twice during this program, while st.3 and st.4 were visited only once. To examine the vertical distribution of biological components, sea ice samples were categorized into two sections: the bottom section and the upper section (consisting of the top, mid-1, mid-2, and mid-3 sections).
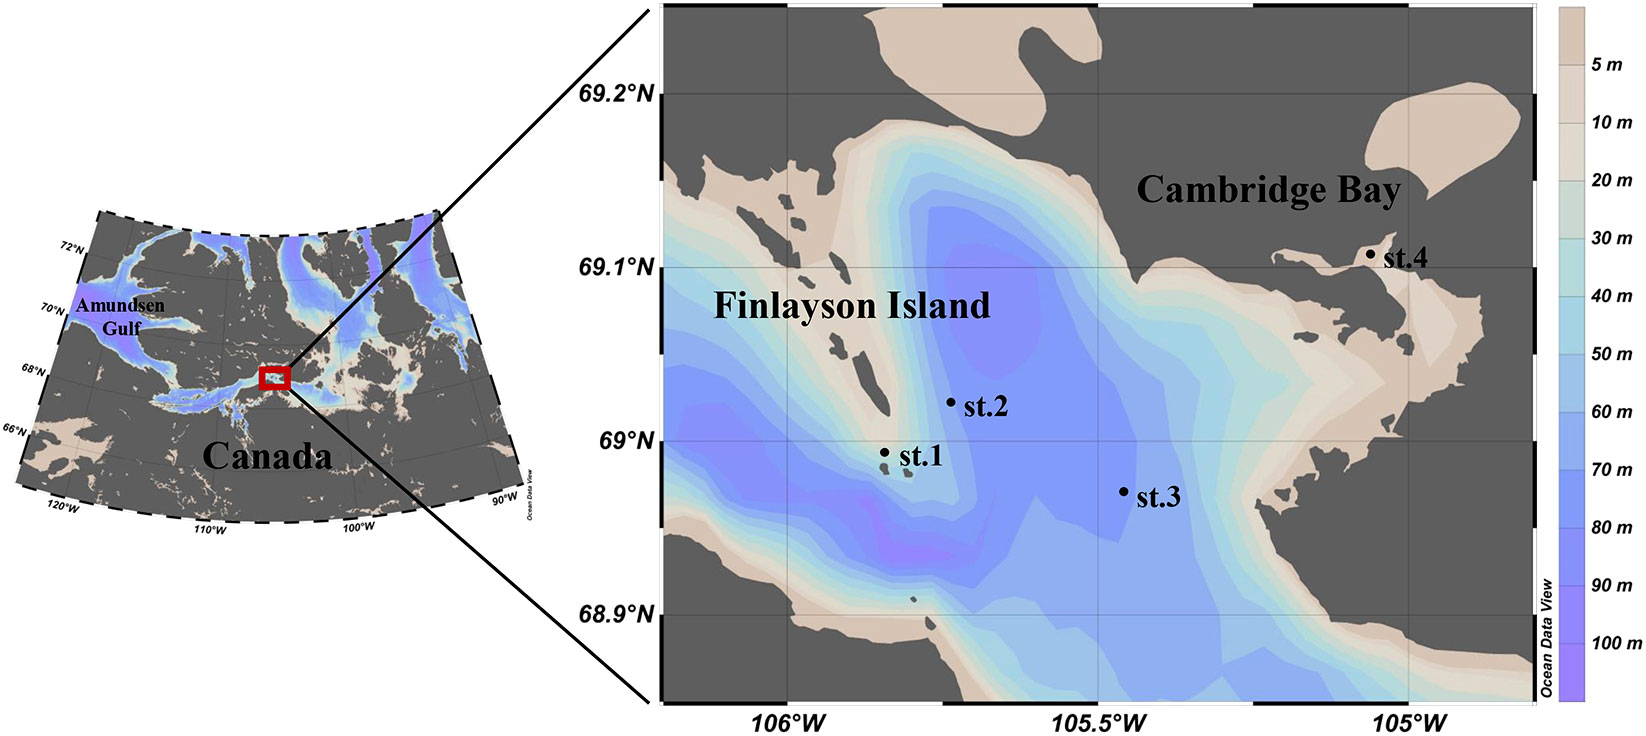
Figure 1 Location of the sampling site near Cambridge Bay, Canada in 2018.
Samplings
Before conducting the ice coring work, snow depths were measured at five different locations around the sampling sites. Using a Mark II Kovacs core barrel with an inner diameter of 9 cm, sea ice samples were extracted from each ice core hole, and their thickness was measured. For the analysis of the vertical distribution of various biological parameters, 10 cm segments of ice were obtained from the bottom and upper sections of the sea ice. The ice samples were transported to the laboratory in a dark insulated box to minimize light exposure. In the field laboratory, the ice samples were used for the analysis of pigments (Chl-a), macro-nutrients, biochemical components, and particulate organic carbon (POC) and particulate organic nitrogen (PON). Two ice segments from similar locations of ice columns obtained from each station were melted together without the addition of filtered seawater. The melting process was conducted in the dark at room temperature overnight.
Underlying water samples were collected using a submersible pump through the auger hole and stored in the LDPE water collection bottles. All the bottles containing water samples were placed in a cooler to maintain optimal conditions of low light and temperature. Subsequently, they were transported to the laboratory for a comprehensive analysis of both chemical and biological components.
The salinity of the melted ice and seawater samples was measured using a YSI model 30 salinity meter (YSI, Yellow Springs, Ohio), calibrated with a conductivity standard (50 mS cm−1, YSI Catalog# 3169) with an accuracy of ± 0.1. Macro-nutrient concentrations, including ammonium, nitrite + nitrate, phosphate, and silicate, were measured by filtering the melted ice and water samples through a 0.7 μm pore-sized 47 mm GF/F filter after homogenization. The filtrates were collected in 50 ml conical tubes and stored in a freezer at −20°C until analysis. Macro-nutrient concentrations were determined using a QuAAtro Auto analyzer (Bran + Luebbe, Germany) at the National Institute of Fisheries Science in South Korea.
Chlorophyll a analysis
To measure the total Chlorophyll a (Chl-a) concentrations of ice algae and phytoplankton, melted ice and water samples were filtered onto 25 mm GF/F filters. For size-fractionated Chl-a analysis, the samples underwent sequential filtration through membrane filters of varying pore sizes. First, the samples were filtered through 20 μm pore-sized Nucleopore filters (47 mm), followed by 2 μm pore-sized Nucleopore filters (47 mm), and finally through 0.7 μm pore-sized Whatman GF/F filters (47 mm). This approach allowed us to discern the contributions of different size classes to overall Chl-a content.
After filtration, the membrane filters containing the retained particles were placed in 15 ml conical tubes and stored in a freezer at −80°C until analysis. The analysis of Chl-a was performed using a 10-AU fluorometer (Turner Design) calibrated with commercially purified Chl-a standard. Prior to analysis, membrane filters were extracted in 90% acetone at 4°C for 24 hours, following the protocol described by Parsons et al. (1984).
Analysis for carbohydrates, proteins, and lipids
To measure the total carbohydrate (CHO), protein (PRT), and lipid (LIP) concentrations of particulate organic matter (POM) in the sea ice and underlying water, melted ice and seawater samples were filtered onto 47 mm GF/F filters. The filters containing the retained POM were then placed in petri dishes (50 mm diameter) and stored in a freezer (−80°C) until spectrophotometric analysis at Pusan National University in South Korea.
The concentrations of each biochemical component were quantified following the method described by Bhavya et al. (2019). For CHO, filtered samples were extracted using the method described by Dubois et al. (1956), and a glucose solution (1 mg mL−1, SIGMA) was used as a standard for calibration. PRT was extracted using the method from Lowry et al. (1951), and a protein standard (Bovine Serum Albumin; 2 mg mL−1, SIGMA) was used to create a calibration curve. LIP was measured using the methods of Bligh and Dyer (1959) and Marsh and Weinstein (1966). A tripalmitin solution (SIGMA) was used to create a calibration curve, and the concentration of LIP was estimated using the equation derived from the curve. The quantification of each biochemical component was performed using a HITACHI UH5300 spectrophotometer. The measurement uncertainties were ± 4.3, ± 8.5, and ± 5.6% for carbohydrate, protein, and lipid concentrations, respectively.
The food material (FM) was defined as the sum of CHO, PRT, and LIP concentrations, following the approach described by Danovaro et al. (2000). The biopolymeric carbon (BPC) was calculated using the equation described by Fichez (1991a); Fichez (1991b) and Danovaro et al. (2000).
Particulate organic carbon and nitrogen analysis
To measure the particulate organic carbon (POC) and nitrogen (PON) concentrations and stable carbon isotope composition, the melted ice and water samples were filtered onto 25 mm GF/F filters. These filters were then stored in the freezer at −20°C until they were prepared for mass spectrometric analysis at the stable isotope laboratory of the University of Alaska Fairbanks (UAF). The uncertainties for the measurements are ± 3.7% for POC and ± 4.5% for PON, respectively. The stable carbon and nitrogen isotope ratios of the filtered samples were expressed in parts per thousand (‰), providing information on the isotopic composition of carbon and nitrogen in the samples. Additionally, the C/N ratio (mol/mol) was calculated using the POC and PON concentration results.
Results
Environmental conditions within the sea ice and underlying water
The average snow depth at the sampling sites was 11.1 ± 4.5 cm, while the average sea ice thickness was 146.8 ± 17.0 cm, respectively (Table 1). The average sea ice thickness at st.1 was significantly thinner compared to other sampling sites in this study (t-test, p < 0.01). The average bulk salinity of the bottom sections was 6.0 ± 0.5, while the upper ice sections had an average of 5.2 ± 1.3. The highest salinity of 9.5 was observed in the upper section of the sea ice. However, no significant differences were found in salinity among the different vertical sections of the sea ice (one-way ANOVA, p > 0.05). In comparison, the underlying water showed higher salinity values with an average of 28.5 (S.D. = ± 1.4), and there was a significant difference in salinity between melted ice samples and the underlying water (one-way ANOVA, p < 0.05).
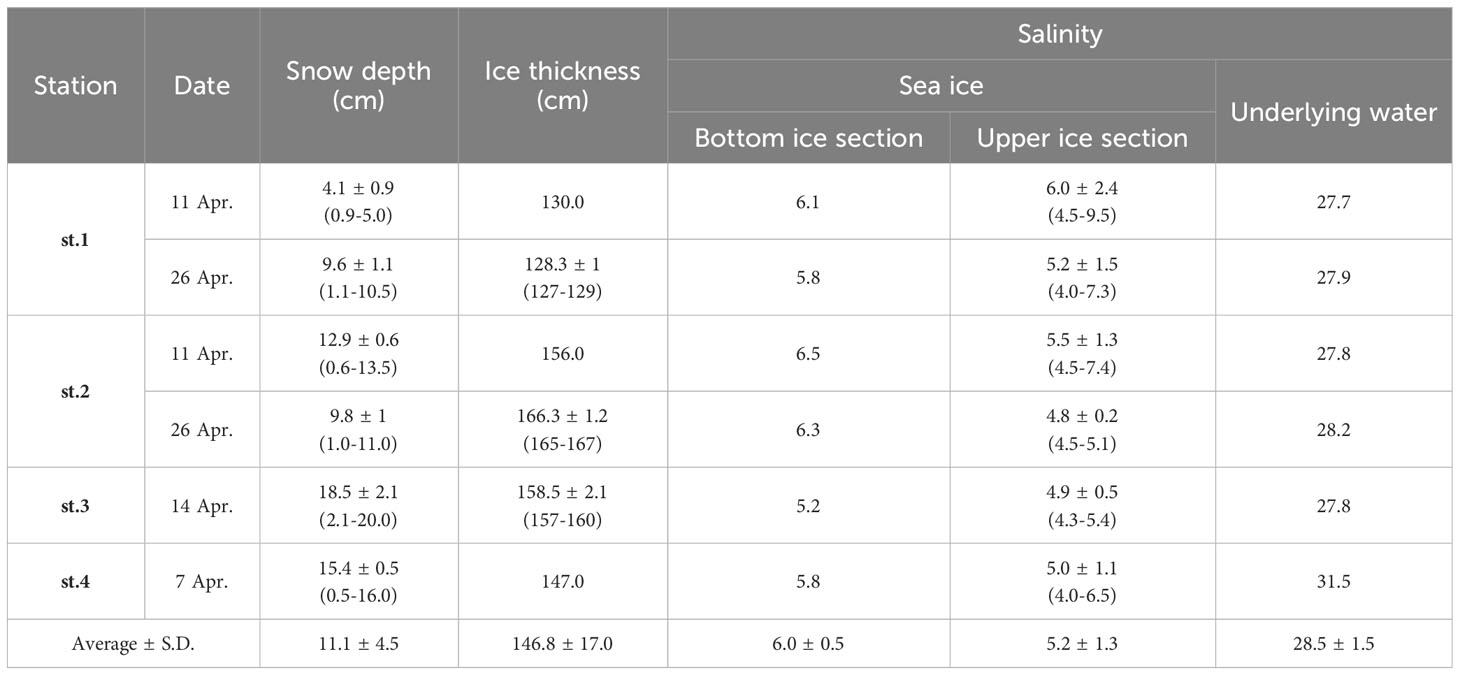
Table 1 Environmental conditions of the study site near Cambridge Bay in 2018.
Figure 2 and Table 2 present the vertical distributions of major nutrients (ammonium, nitrite + nitrate, phosphate, and silicate) in the sea ice and underlying water. The average concentrations of these nutrients in the upper ice section were 1.87 ± 1.50 µM for ammonium, 0.88 ± 0. 38 µM for nitrite + nitrate, 0.09 ± 0.06 µM for phosphate, and 0.91 ± 0.45 µM for silicate. The average concentrations for each nutrient in the bottom ice section were 2.48 ± 1.00, 1.31 ± 0.48, 0.38 ± 0.27, and 1.05 ± 0.48 µM for ammonium, nitrite + nitrate, and silicate, respectively. The average phosphate concentration in the bottom ice section was higher than that in the upper ice sections (one-way ANOVA, p < 0.05). However, no significant differences were observed in the average concentrations of ammonium, nitrite + nitrate, and silicate among the upper ice sections (one-way ANOVA, p > 0.05). Regarding the underlying water, there were no significant differences in the average concentrations of ammonium and nitrite + nitrate compared between each ice section (one-way ANOVA, p > 0.05). However, the average phosphate and silicate concentrations were higher in the underlying water than in the entire ice sections, except for the phosphate concentration in the bottom ice section (one-way ANOVA, p < 0.05).
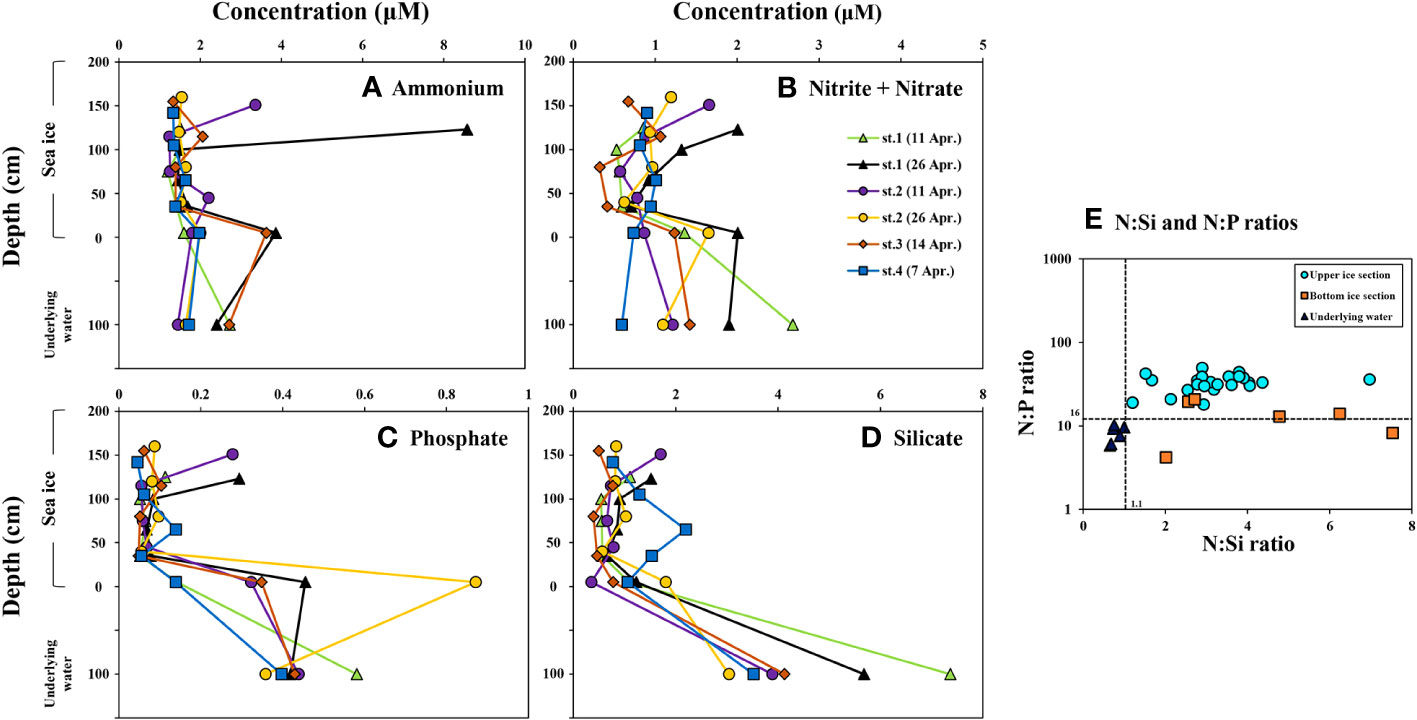
Figure 2 Vertical distributions of the macro-nutrients (A) = Ammonium, (B) = Nitrite + Nitrate, (C) = Phosphate, (D) = Silicate) and the molar nutrient ratios of N:P and N:Si (E) in the sea ice column and underlying water near Cambridge Bay, Canada in 2018.
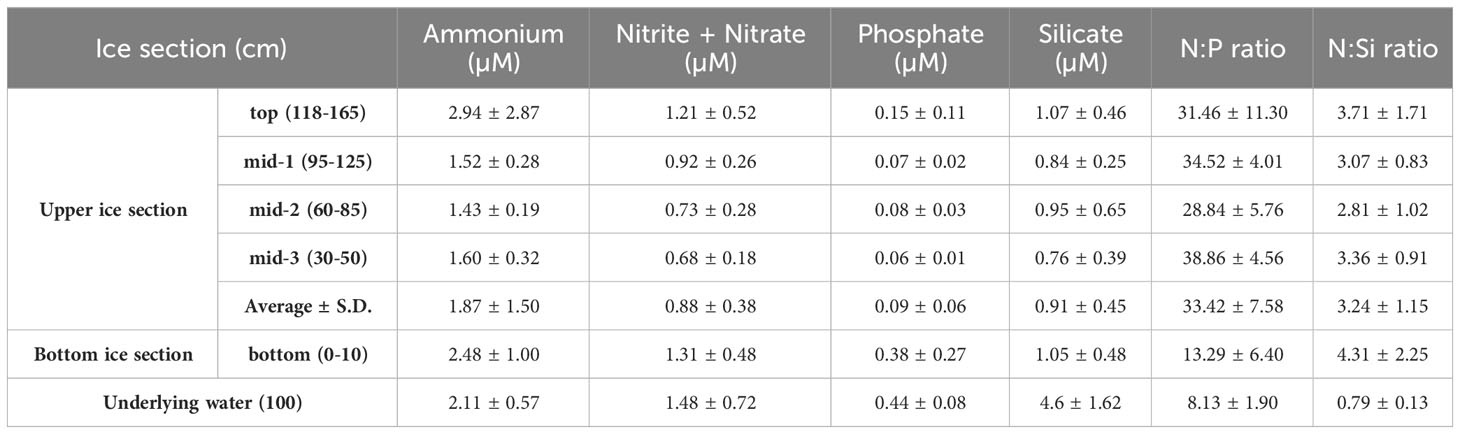
Table 2 The average concentrations of inorganic nutrients and N:P, N:Si ratios from the bottom and upper ice sections near Cambridge Bay in 2018.
Chlorophyll a concentration in the sea ice and underlying water
Figure 3 and Table 3 illustrate the vertical distributions of total and size-fractionated Chl-a concentrations in the sea ice and underlying water. The total Chl-a concentration in the entire sea ice column ranged from 0.03 to 53.43 μg L−1, with an average of 6.37 ± 14.52 μg L−1. The upper ice section had an average Chl-a concentration of 0.16 ± 0.21 μg L−1, whereas higher concentrations were observed in the bottom ice section, averaging 31.23 μg L−1 (S.D. = ± 17.19 μg L−1) (one-way ANOVA, p < 0.05). The majority of Chl-a was concentrated in the bottom ice section, with a high proportion of micro-sized cells comprising an average of 70 ± 4%, followed by nano- (27 ± 3%) and pico-sized cells (3 ± 2%). In contrast, significantly lower concentrations (ranging from 0.03 to 0.72 μg L−1, mean ± S.D. = 0.16 ± 0.21 μg L−1) were observed in the upper ice section, with nano-sized cells dominating at an average of 48 ± 12%, followed by micro-sized (mean ± S.D. = 32 ± 13%) and pico-sized cells (mean ± S.D. = 19 ± 9%). No significant differences were found in total and size-fractionated Chl-a concentrations within the upper ice sections (one-way ANOVA, p > 0.05). A negative relationship between the column-integrated Chl-a and the snow depth was observed (y = −0.42x + 11.22, r = − 0.65, p < 0.01, where x is the snow depth and y is the column-integrated Chl-a) during the study period.
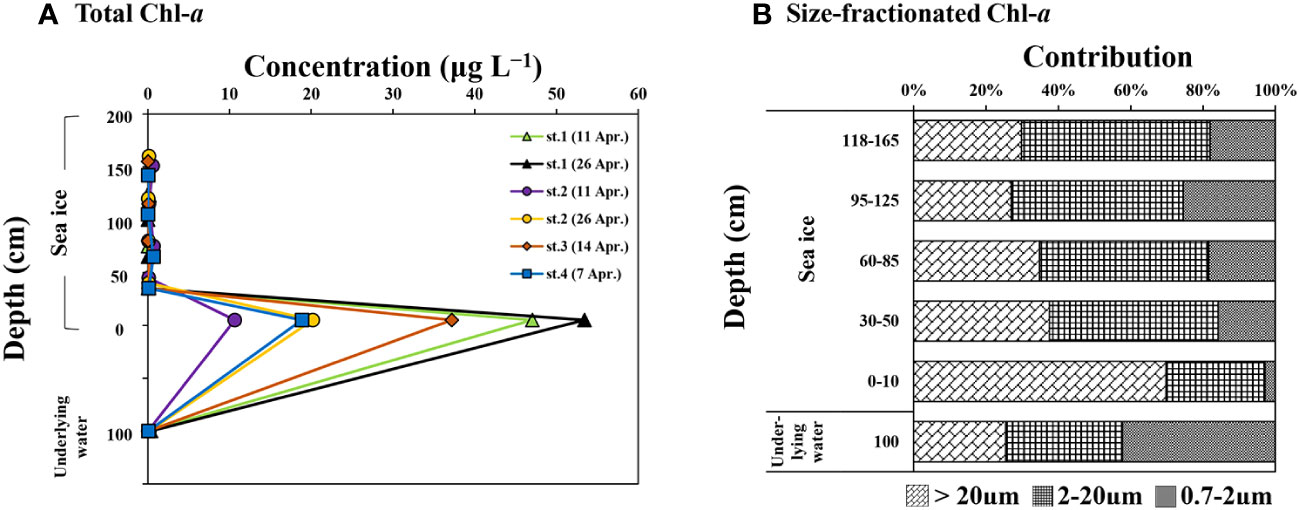
Figure 3 Vertical distributions of total chlorophyll a (Chl-a) concentration (A) and size-fractionated Chl-a (B) in the sea ice column and underlying water near Cambridge Bay, Canada in 2018.
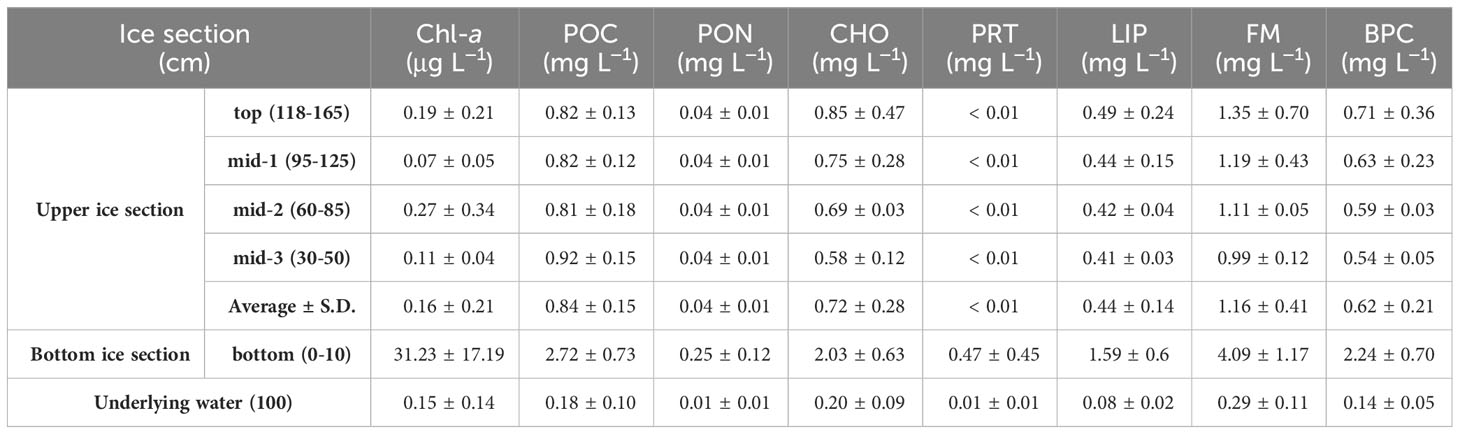
Table 3 The average concentrations of biological parameters measured from the bottom and upper ice sections near Cambridge Bay in 2018.
In the underlying water, the Chl-a concentration was 0.15 μg L−1 (S.D. = ± 0.14 μg L−1), which was significantly lower than the concentrations in the bottom ice sections but not statistically different from those of the upper ice sections (one-way ANOVA, p > 0.05). The phytoplankton community in the underlying water was dominated by pico-sized cells, accounting for 42% (S.D. = ± 16%), followed by nano-sized (mean ± S.D. = 32 ± 4%) and micro-sized cells (mean ± S.D. = 25 ± 17%).
Biochemical composition of POM in the sea ice and underlying water
Figure 4 and Table 3 summarize the average concentrations of CHO, PRT, LIP, and FM in the POM within the sea ice column. The average concentrations of CHO, PRT, LIP, and FM in the sea ice column were 0.98 ± 0.64, 0.10 ± 0.27, 0.67 ± 0.55, and 1.75 ± 1.34 mg L−1, respectively. The average concentrations of CHO, PRT, and LIP in the bottom ice section were significantly higher than those in the upper ice sections (one-way ANOVA, p < 0.05). PRT was rarely detected in the upper ice sections, while CHO and LIP were present with average concentrations of 0.72 mg L−1 (S.D. = ± 0.28 mg L−1) and 0.44 mg L−1 (S.D. = ± 0.14 mg L−1), respectively. No significant differences were observed in CHO, PRT, LIP, and FM concentrations among the upper ice sections (one-way ANOVA, p > 0.05). In the underlying water, the average concentrations of CHO, PRT, LIP, and FM were 0.20 ± 0.09, 0.01 ± 0.01, 0.08 ± 0.02, and 0.29 ± 0.11 mg L−1, respectively. The concentrations in the underlying water were much lower than those of the entire ice sections, no statistical difference was found in the average PRT concentrations between the upper ice sections and underlying water (one-way ANOVA, p > 0.05).
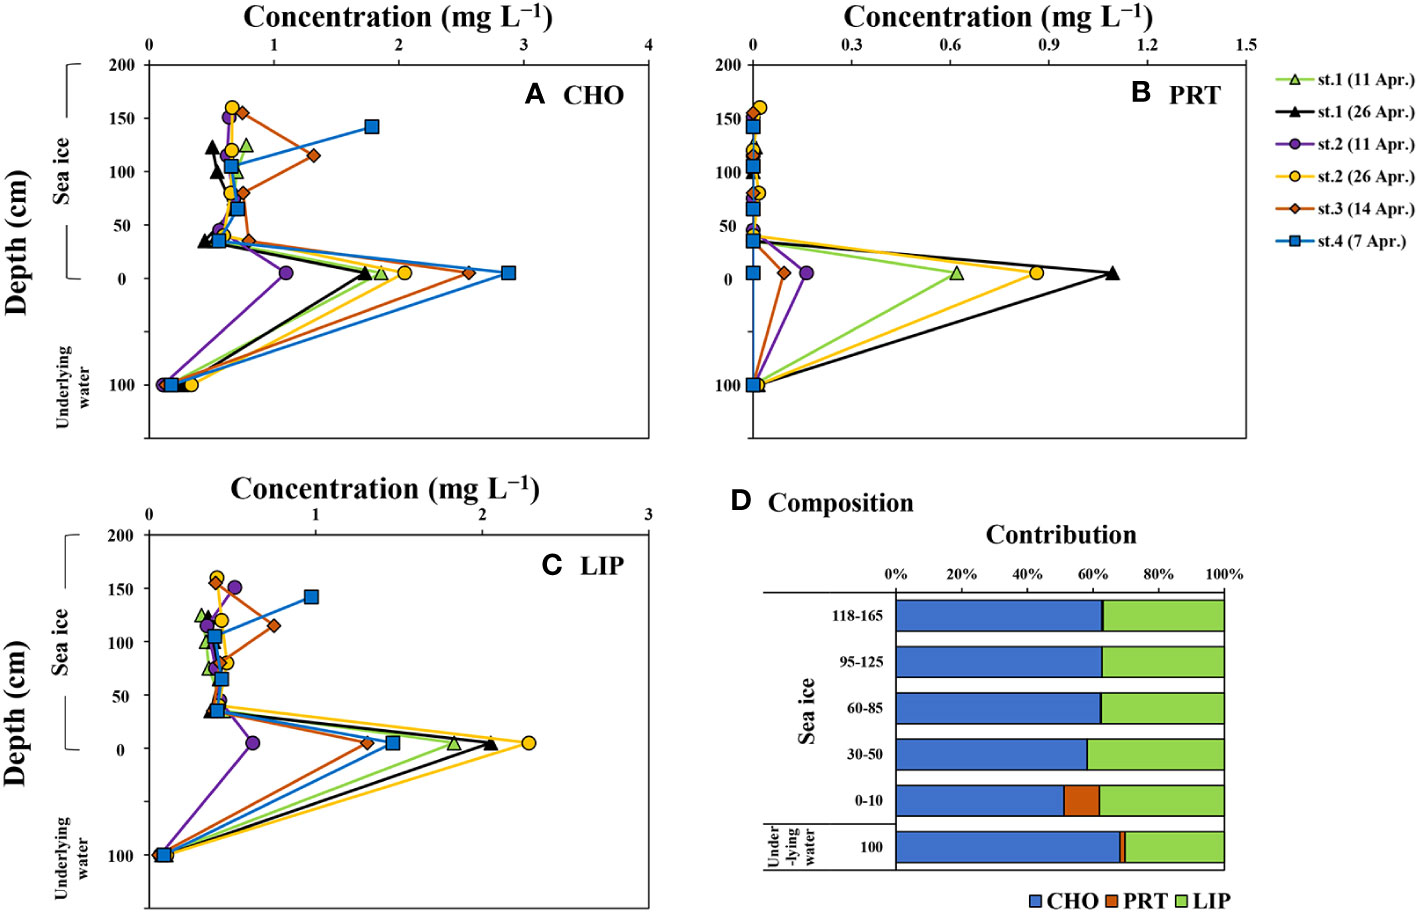
Figure 4 Vertical distributions of carbohydrates (CHO) (A), proteins (PRT) (B), and lipids (LIP) (C) and the contribution of each component to food material (sum of CHO, PRT, and LIP; FM) (D) in the sea ice column and underlying water near Cambridge Bay, Canada in 2018.
The major biochemical component of POM in the sea ice column was CHO, accounting for 59% (S.D. = ± 8%), followed by LIP (mean ± S.D. = 38 ± 4%) and PRT (mean ± S.D. = 2 ± 6%). There were no significant vertical differences in the contribution of each component to FM within the entire ice sections, except for PRT, which had a higher proportion in the bottom ice section compared to the upper ice sections (one-way ANOVA, p > 0.05). The POM in the underlying water mainly consisted of CHO (mean ± S.D. = 68 ± 4%) and LIP (mean ± S.D. = 30 ± 5%), with a smaller proportion of PRT (mean ± S.D. = 2 ± 2%). The average contributions of CHO and PRT in the underlying water were statistically different from those in the bottom ice sections, while no statistical differences were found in the average contributions of CHO and PRT between the underlying water and the upper ice sections (one-way ANOVA, p > 0.05). The average contributions of LIP were not statistically different between the underlying water and the entire ice sections (one-way ANOVA, p > 0.05).
Particulate organic carbon and nitrogen, and biopolymeric carbon in the sea ice and underlying water
Figure 5 and Table 3 provide information on the vertical distributions of POC, PON, and BPC concentrations in the sea ice and underlying water. The ranges of POC, PON, and BPC in the ice column were 0.57-3.73 mg L−1 (mean ± S.D. = 1.22 ± 0.83 mg L−1), 0.02-0.40 mg L−1 (mean ± S.D. = 0.08 ± 0.10 mg L−1), and 0.45-2.95 mg L−1 (mean ± S.D. = 0.94 ± 0.74 mg L−1), respectively. There were no significant differences in the average concentrations of these components among the upper ice sections (one-way ANOVA, p > 0.05), but the concentrations in the bottom ice section were significantly higher than those in the upper ice sections (one-way ANOVA, p < 0.05).
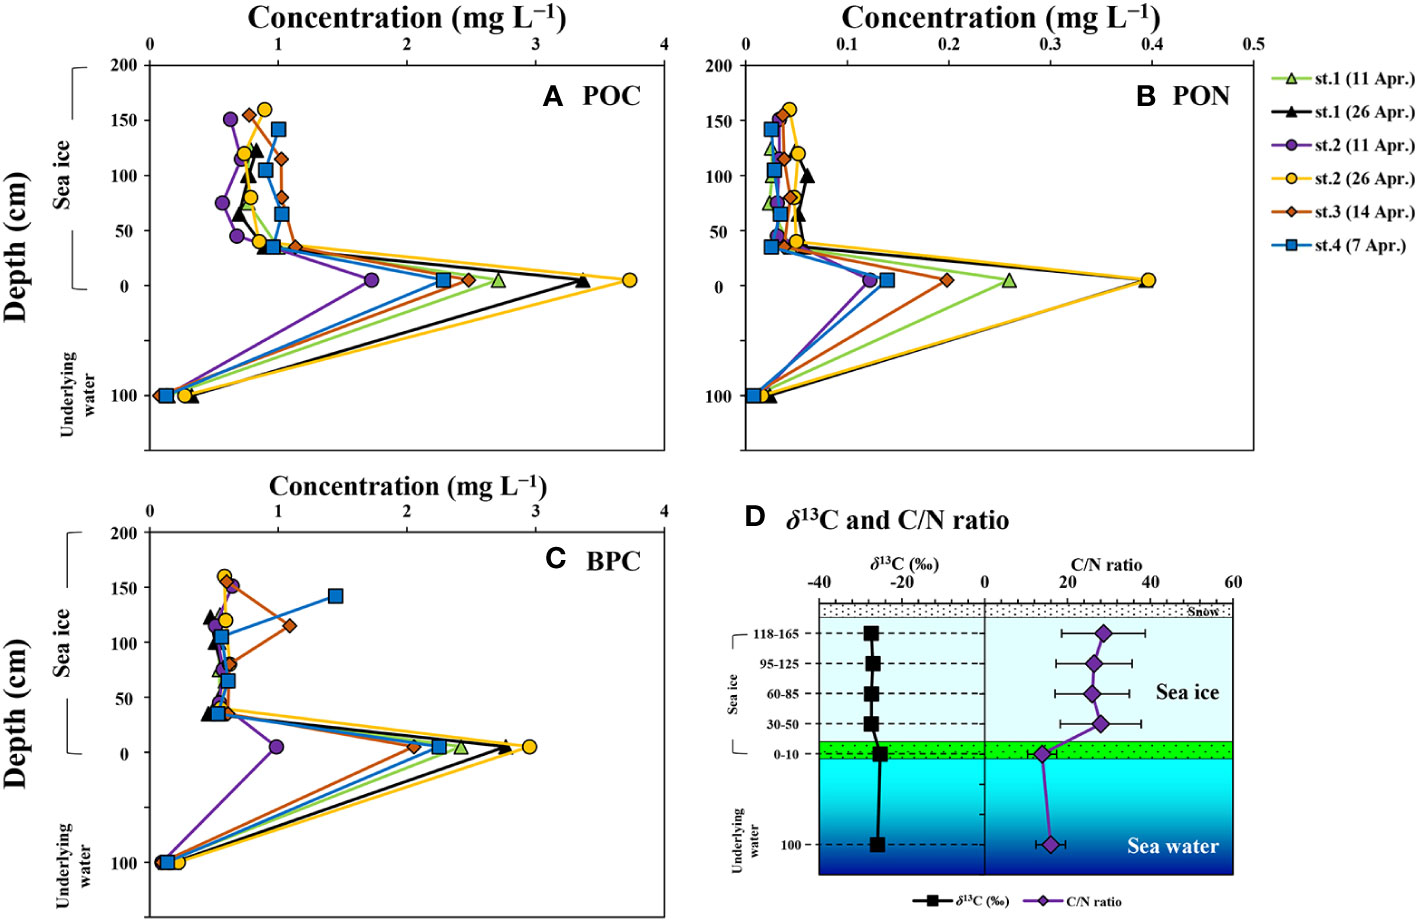
Figure 5 Vertical distributions of particulate organic carbon (POC) (A), particulate organic nitrogen (PON) (B), and biopolymeric carbon (BPC) (C), carbon isotope signature of POC (δ13C) (D), and C/N ratio (D) in the sea ice column and underlying water near Cambridge Bay, Canada in 2018.
The δ13C value of POM in the sea ice column ranged from −28.3 to −24.0‰, with an average of −26.9‰ (S.D. = ± 1.0‰) (Figure 5D). The highest δ13C value was observed in the bottom ice sections, and the mean δ13C value of the upper ice sections was significantly lower than that of the bottom ice sections (one-way ANOVA, p < 0.05). Furthermore, a strong linear relationship was found between δ13C and POC in the bottom ice sections (y = 1.48*x-29.27, r = 0.97, p < 0.01, where x is POC, y is δ13C). The C/N ratio in the sea ice column ranged from 10.0 to 45.9, with an average of 24.6 (S.D. = ± 9.8‰) (Figure 5D). The C/N ratio was higher in the upper ice sections compared to the bottom ice sections (one-way ANOVA, p < 0.05).
In the underlying water, the average concentrations of POC, PON, and BPC were 0.18 ± 0.10, 0.01 ± 0.01, and 0.14 ± 0.05 mg L−1, respectively. The average δ13C value of POM and C/N ratio in the underlying water were −26.0 ± 0.3‰ and 16.6 ± 3.2, respectively. The concentrations of POC, PON, and BPC in the underlying water were significantly lower than those in the entire ice sections (one-way ANOVA, p < 0.05). The average δ13C value and C/N ratio in the underlying water were statistically different from those in each ice section, except for the bottom ice sections (one-way ANOVA, p < 0.05).
BPC accounted for 51 to 100% (mean ± S.D. = 74 ± 16%) and 58 to 100% (mean ± S.D. = 83 ± 16%) of the POC in the ice column and underlying water, respectively (Figure 6). The highest BPC contribution was observed in the underlying water, but there were no significant differences among the entire ice sections and the underlying water (one-way ANOVA, p < 0.05).
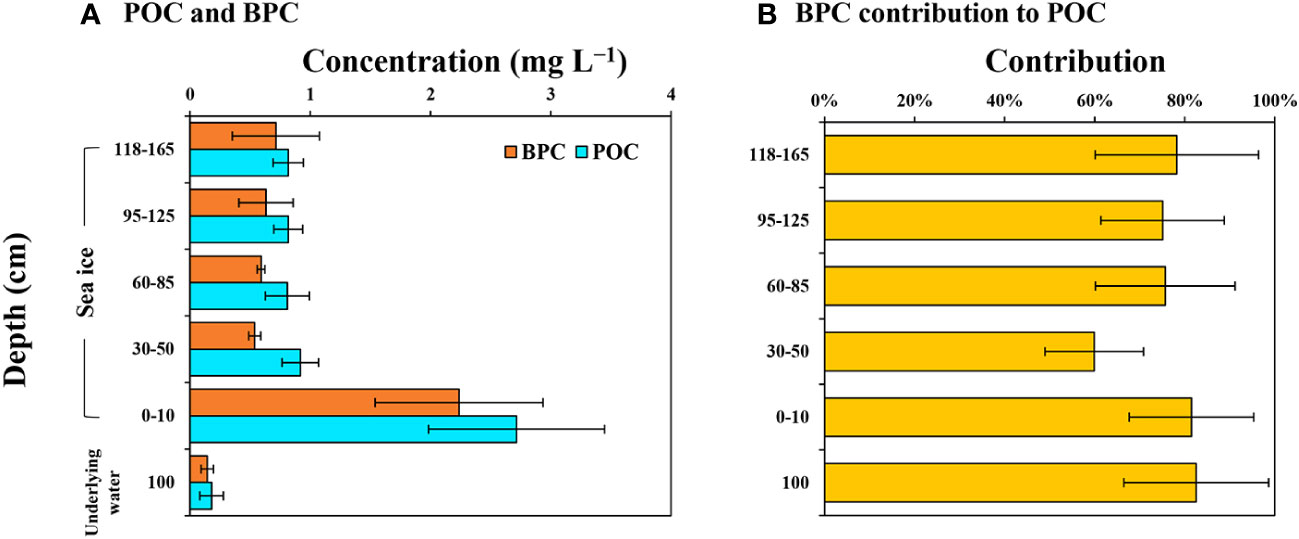
Figure 6 Vertical distributions of the average POC and BPC concentration (A) and the BPC contribution to POC (B) in the sea ice and underlying water near Cambridge Bay, Canada in 2018.
Contributions of the bottom ice section to the entire sea ice column
The column-integrated Chl-a concentration in the sea ice ranged from 2.59 to 8.07 mg m−2, with an average of 5.05 mg m−2 (S.D. = ± 2.26 mg m−2). The integrated concentration of FM, BPC, POC, and PON ranged from 1.68 to 2.51 g m−2 (mean ± S.D. = 2.05 ± 0.39 g m−2), 0.90 to 1.32 g m−2 (mean ± S.D. = 1.10 ± 0.20 g m−2), 1.16 to 1.76 g m−2 (mean ± S.D. = 1.47 ± 0.25 g m−2), and 0.06 to 0.14 g m−2 (mean ± S.D. = 0.09 ± 0.03 g m−2), respectively (Table 4). The contribution of each parameter in the bottom ice sections to the entire sea ice columns varied from 11 to 66% (Table 5). In the upper ice sections, the average Chl-a concentrations were significantly lower compared to those in the bottom ice sections (one-way ANOVA, p < 0.05) (Figure 7A). The Chl-a was highly concentrated in the bottom ice sections, accounting for 59% (S.D. = ± 10%) of the column-integrated concentrations. On the other hand, the average contributions of the other parameters (FM, BPC, POC, and PON) in the bottom ice sections to the column-integrated concentrations were substantially lower (20 ± 6, 21 ± 7, 19 ± 5, and 28 ± 7%, respectively) compared to Chl-a (Figure 7B).
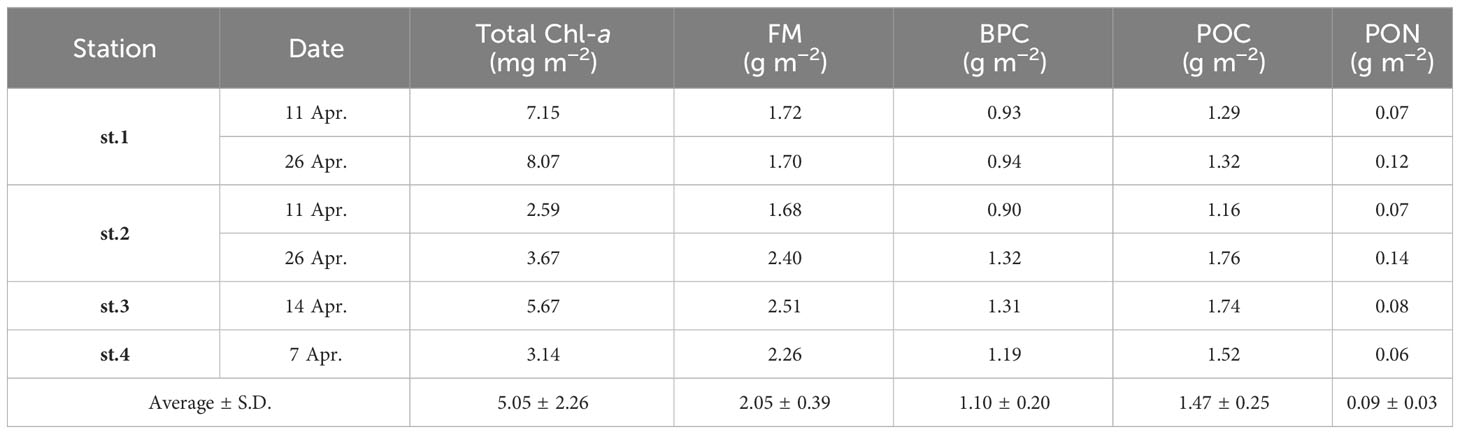
Table 4 The ice column-integrated concentrations for each biological parameter near Cambridge Bay in 2018.
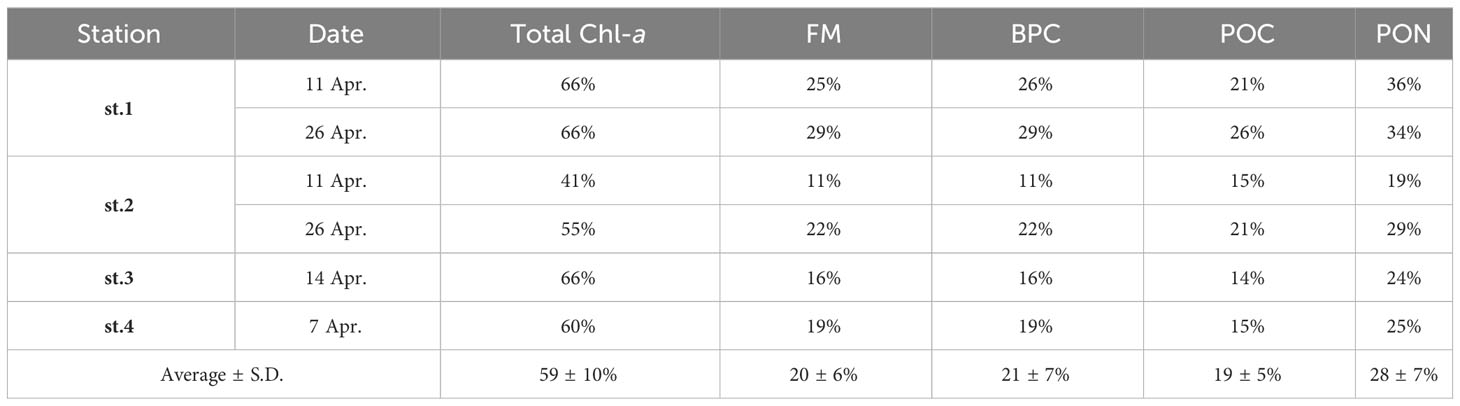
Table 5 Contributions of the bottom ice section to the column-integrated concentration of each biological parameter near Cambridge Bay in 2018.
A linear relationship was observed between the Chl-a concentration in the bottom ice section and the column-integrated Chl-a during this study period (y = 0.13*x + 0.96, r = 0.99, p < 0.01, where x is the Chl-a concentration in the bottom ice section and y is the integrated Chl-a) (Figure 7C). However, such relationships were not observed for the other parameters between the bottom ice section and the column-integrated values in this study (Figure 7D).

Figure 7 Vertical distributions of the average Chl-a (A) and FM concentration (B) and the relationships between the column integrated value and concentration at the bottom ice section for Chl-a (C) and FM (D).
Discussion
Environmental conditions of study area
The study area near Cambridge Bay in 2018 exhibited diverse environmental conditions that influenced the sea ice ecosystem. One notable aspect was the marked variation in sea ice thickness across the sampling sites, with site 1 exhibiting considerably thinner ice in comparison to other locations. This consistent pattern of sea ice thickness distribution corresponds with earlier studies conducted by Dalman et al. (2019) and Kim et al. (2020), suggesting a recurring trend. It is worth noting that st.1 is characterized by a shallow sill generating currents exceeding 20 cm s−1 beneath the sea ice (Dalman et al., 2019). This hydrodynamic feature significantly influences sea ice thickness by transferring additional momentum and heat flux from the ocean to the sea ice (Widell et al., 2006; Melling et al., 2015; Dalman et al., 2019). These flow dynamics can also lead to the transport of deeper saline water to shallower depths (Gosselin et al., 1985; Cota et al., 1987; Vancoppenolle et al., 2013), further illustrating the intricate interplay between hydrodynamics and ice thickness.
The snow cover on the sea ice introduces distinct physical characteristics, including a high albedo and light scattering capacity upon exposure to incident light (Petrich and Eicken, 2010). Particularly, a thick snow layer exceeding 30 cm can significantly hinder light penetration to the bottom ice algae during the spring growing season (Rysgaard et al., 2001; Sturm and Massom, 2009; Campbell et al., 2015). Although the average snow depth in our study (11.7 ± 5.0 cm) appears to pose relatively minor limitations on light penetration, the observed distinct negative relationship between snow depth and column-integrated chlorophyll-a (Chl-a) concentrations points to the significant influence of snow cover on the light conditions experienced by the ice algal community. These findings indicate that the presence of snow cover did indeed influence the light conditions experienced by the ice algal community during the study period (Campbell et al., 2015; Leu et al., 2015).
Given that a significant proportion of ice algae inhabit brine channels (Arrigo et al., 2014), the nutrient content within these channels becomes pivotal in governing their growth dynamics. In this regard, analyzing bulk nutrient concentrations serve as a reliable indicator of the prevalent nutrient conditions within the sea ice. While the bulk nitrite + nitrate concentration within the entire sea ice column in our study falls within the reported ranges (Campbell et al., 2016; Kim et al., 2020), the concentration of phosphate and silicate were notably lower than previously documented levels at Cambridge Bay during the spring (Campbell et al., 2016; Dalman et al., 2019; Kim et al., 2020). This contrast extends the nutrient concentrations in the underlying water, which remain consistent with prior studies conducted in the region (Campbell et al., 2016; Dalman et al., 2019; Kim et al., 2020; Back et al., 2021). These distinct nutrient patterns reflect Cambridge Bay’s unique environmental context characterized by low salinity and N-limited environmental condition due to the limited water exchange with the neighboring water bodies (McLaughlin et al., 2004; Campbell et al., 2016). This is further substantiated by the lower N:P ratios in the underlying water and the bottom ice section relative to the Redfield ratio (Redfield et al., 1963), suggesting a potential N-limited environmental condition during the study’s observation period. Conversely, the notably elevated average N:P ratio in the upper ice section (Figure 2E) indicates a potential P-limited condition for ice algal cells within the ice interior (Meiners et al., 2002).
While a potential for correlation between inorganic nutrients and biological parameters was explored, no statistically significant correlation emerged. Possible explanations for this lack of correlation could include the utilization of non-chronological data or a limited of sample size. Notably, Campbell et al. (2016) identified a temporal correlation between POC and Chl-a concentrations in the bottom ice section (5 cm) at Cambridge Bay, underscoring the importance of seasonality. In this study, the constrained data coverage might have hindered the establishment of correlations between nutrients and other biological factors.
Origin of particulate organic matter in sea ice
Identifying the source of POM within sea ice is imperative due to its capacity to incorporate substances from various origins during sea ice formation (Garrison et al., 1990; Giannelli et al., 2001; Amon, 2004; Riedel et al., 2007; Stedmon et al., 2007; Dieckmann and Hellmer, 2010; Bachy et al., 2011). To discern this origin, the carbon isotopic signature of POC (δ13C), the C/N ratio, and the contribution of BPC to POC (%) have been widely employed across various oceans (Danovaro et al., 2000; Lobbes et al., 2000; Lee and Whitledge, 2005; Kim et al., 2016; Kim et al., 2021).
Our investigation revealed that the observed δ13C values in both the sea ice column and the underlying water consistently fall within a previously reported range in polar waters dominated by marine autotrophs (Schubert and Calvert, 2001; Kennedy et al., 2002). Furthermore, the strong correlation between POC and δ13C observed in this study supports findings from the Arctic and Antarctic Oceans (Fry, 1996; Gradinger, 2009; Thomas et al., 2010).
While C/N ratios within the sea ice column during our study were notably higher than the general ratio of phytoplankton (6-10) (Redfield et al., 1963; Miller and Wheeler, 2012; Kim et al., 2015), it is noteworthy that ice algal POM can exhibit a wide range of C/N ratios, ranging from 3 to 50, depending on light and nutrient conditions (Gosselin et al., 1990; Gradinger, 2009; Niemi and Michel, 2015; Campbell et al., 2016). In our case, the P-limited conditions in the upper ice section likely contributed to the elevated C/N ratios for POM. Conversely, the ratios within the bottom ice section remained consistent with the reported range for the Canadian Arctic Archipelago (6.4-17.0) (Niemi and Michel, 2015). Moreover, the pronounced contributions of BPC to POC in both sea ice and underlying water provided additional support for the notion that the POM in this study predominantly originated from marine autotrophs (Pusceddu et al., 1996; Danovaro and Fabiano, 1997; Danovaro et al., 2000). Overall, the convergence of δ13C values, C/N ratios, and BPC contribution offers insights into the origin and composition of POM within the sea ice, affirming marine autotrophs as the primary contributors to the POM in this study.
Chlorophyll a concentration in sea ice and underlying water
Our investigation revealed the average Chl-a concentrations for under-ice phytoplankton that exceeded reported values during the Arctic polar night period (0.01-0.06 µg L−1; see Berge et al., 2015 references therein). This likely results from re-illumination following the dark winter period in our study region. Previous studies underscore that many sea ice diatoms, having endured long darkness, can rapidly resume photosynthesis upon re-illumination (Wulff et al., 2008; McMinn et al., 2010; Nymark et al., 2013; Kennedy et al., 2019). The higher Chl-a concentration in the bottom ice section implies that available light supported photosynthesis for autotrophs within the upper ice sections. However, the prevailing cold air temperatures during our study (ranging from −31.3 to −7.2°C; https://www.canada.ca/en.html) are likely to have restrained the increase in temperature within the upper sea ice section, consequently impeding brine channel connectivity (Olsen et al., 2017). Therefore, the low contribution of micro-sized cells to total Chl-a within the upper sea ice could be due to a low biological activity caused by cold ice temperature during this study. In contrast to the upper ice section, the bottom ice section could have experienced higher temperatures as a result of its proximity to the underlying seawater, which could have been at the freezing point of seawater (−1.8°C). This potentially leads to increased porosity in the lower ice, facilitating algal activity and enabling exchanges between the bottom ice section, the ice-water interface, and the underlying water (Petrich and Eicken, 2010). For these reasons, the bottom ice section, known as an ideal habitat for ice algae to thrive (Kaartokallio et al., 2007; Arrigo et al., 2010), could have displayed a notably heightened Chl-a concentration contrary to the upper ice section within this investigation. Moreover, this heightened concentration was concomitant with a significant proportion of micro-sized cells, consistent with polar ocean studies (Kaartokallio et al., 2007; Arrigo et al., 2010; Arrigo, 2014; Leu et al., 2015).
Contrasting with a micro-sized cell dominance in the phytoplankton community during the pelagic bloom in Cambridge Bay in July 2016 (Marshall, 2018), our study interval was characterized by a prevailing abundance of pico-sized cells, indicating the non-occurrence of a phytoplankton bloom. Notable under-ice phytoplankton blooms dominated by diatoms have been reported in the Chukchi Sea when melt ponds constituted a significant portion of sea ice cover (30-40%; Arrigo et al., 2014; Laney and Sosik, 2014). The melt ponds can transmit a substantial portion of incident light (approximately 60%) to the underlying water, fostering massive phytoplankton blooms beneath the sea ice (Arrigo et al., 2014; Laney and Sosik, 2014). However, in this study, no visible melt ponds were observed around the sampling sites. Moreover, Campbell et al. (2016) reported that less than 5% of the incident light reached the underlying water under thin snow cover (< 5cm) at Cambridge Bay during the spring of 2014. Consequently, this constrained light availability might have limited phytoplankton growth during our study’s observation period.
In summation, our findings illuminate that while Chl-a concentrations were notably elevated within the bottom ice section, re-illumination likely contributed to photosynthesis within the upper ice sections. Yet, environmental factors, notably the limited alight availability could have acted as constraints, impeding phytoplankton bloom development in the underlying water.
Biochemical composition of POM in the entire sea ice column and underlying water
A significant proportion of CHO and LIP within the sea ice during our study was likely derived from the inherent biological characteristics of POM that became entrapped during ice formation. The seasonal process of sea ice formation in the coastal area of Cambridge Bay typically begins in early September, reaching its maximum thickness by the following April (Shen et al., 2021). The frigid atmospheric conditions during the dark Arctic winter cause the sea ice to grow downward (Langhorne and Robinson, 1983; Petrich and Eicken, 2010). As the ice thickens, POM from the underlying water becomes incorporated into the sea ice.
Although macromolecular composition data of phytoplankton and ice algae POM during the polar night period in the Arctic is limited, studies from the Antarctic polar night provide valuable insights. Kim et al. (2021) noted that during the Antarctic polar night at Jang Bogo Station (JBS) in the Ross Sea in 2015, CHO constituted the predominant component (73.0%) of POM, followed by LIP (20.9%), and PRT (6.1%). A similar observation of elevated proportions of CHO and LIP in under-ice phytoplankton was made by Park et al. (2021) at JBS. While these investigations pertain to the Antarctic region, they suggest a prevalent composition of CHO and LIP in the polar region phytoplankton during the dark winter. Under adverse conditions, diatoms have been found to suppress metabolism and enhance the accumulation of energy storage compounds (CHO and LIP) within their cellular structure (Kuwata et al., 1993; Zhang et al., 1998; Oku and Kamatani, 1999). Given that diatoms constitute the predominant ice algal community in Cambridge Bay (Campbell et al., 2016; Dalman et al., 2019), the elevated compositions of CHO and LIP within sea ice could signify a physiological adaptation for survival under harsh conditions, coinciding with the diminished activity of ice algae. The low proportion of micro-sized cells relative to the total Chl-a within the sea ice further supports the inference of reduced biological activity in the upper ice section. Conversely, the heightened proportion of PRT, accompanied by a higher proportion of micro-sized cells to the total Chl-a in the bottom ice section, indicates a thriving ice algal bloom with relatively higher activity during our study period (Morris, 1981; Kim et al., 2020).
These insights enhance our understanding of the intricate relationship between POM composition and the distinct environmental conditions characterizing polar regions during periods of limited light availability.
Relative contributions of ice sections to column-integrated value
Traditionally, research efforts in the Arctic have predominantly focused on investigating the bottom section of sea ice, primarily due to its hosting of the majority of primary producers, particularly ice algae. These microorganisms typically inhabit the lowermost centimeters of the ice layer, benefiting from optimal environmental conditions for efficient light and nutrient utilization (Lee et al., 2008; Arrigo et al., 2010; Leu et al., 2015; Kim et al., 2020). Previous investigations conducted in Cambridge Bay have primarily concentrated on the bottom ice section (Campbell et al., 2016; Dalman et al., 2019; Kim et al., 2020), and the reported Chl-a concentrations in these studies align with the spectrum of the entire ice column-integrated Chl-a concentrations observed in our study. However, it is important to note that Chl-a distribution can be distributed within the interior of sea ice, not solely confined to its the bottom section. Several studies have reported that the presence of Chl-a within the upper ice sections, emphasizing the need for a comprehensive assessment of the entire sea ice column, including the upper segment, to achieve precise assessments of integrated Chl-a concentrations (Gradinger and Zhang, 1997; Gradinger, 1999).
Our study demonstrates that while the biological parameters exhibited the highest concentrations in the bottom ice section, their contributions to the overall sea ice column remained below approximately 60%. This notable finding implies that a substantial proportion, approximately 40%, of POM might be sequestered in the upper section of the sea ice. This realization carries considerable implications: previous research predominantly centered on bottom ice algae might have overlooked this reservoir, which could potentially serve as a critical early nutrient source for upper trophic organisms during the subsequent growth seasons (Runge and Ingram, 1988; Legendre et al., 1992; Søreide et al., 2010; Vancoppenolle et al., 2013).
As sea ice melting proceeds, POM from both the upper and bottom sections is released into the surface water. This process holds the potential to exert a significant influence on marine biogeochemistry and food webs (Michel et al., 1996; Fortier et al., 2002; Constable et al., 2003; Michel et al., 2006; Arrigo, 2014; Olsen et al., 2017). Therefore, to attain a comprehensive understanding of the ecological role of organic matter within sea ice across ice-covered oceans, it is crucial to consider POM present in the upper sea ice section and its consequent contribution to the encompassing sea ice column.
Summary and conclusions
In this study, we conducted an investigation into the vertical distribution of key biological parameters including Chl-a, FM, BPC, POC, and PON concentrations within the sea ice column at the landfast sea ice zone near Cambridge Bay during the spring growing season, specifically spanning from 7 to 26 April 2018.
Our findings indicate that the particulate organic matter (POM) present in both the sea ice and the underlying water predominantly originates from marine autotrophs. Similar to observations in the Arctic and Antarctic sea ice, the distribution of Chl-a exhibited a concentration peak in the bottom section of the sea ice, with micro-sized cells dominating. While the Chl-a concentration in the upper ice section was notably lower than that in the bottom ice section, it remained relatively higher compared to the reported mean concentrations for the underlying water during the dark Arctic winter period.
Although the bottom ice section exhibited the highest concentrations of various biological parameters, their contributions to the entire sea ice column were relatively smaller when compared to the upper ice section, with the exception of Chl-a. It’s worth noting that previous research predominantly focused on bottom ice algae, underestimating the significance of the upper ice section as a vital early food source for herbivorous grazers after the extended Arctic winter (See Leu et al., 2015 and references therein).
The biochemical composition of the entire sea ice POM, as observed in this study, is predominantly composed of energy storage compounds such as CHO and LIP. These compounds could potentially serve as an additional food source for higher trophic levels following the complete melting of the sea ice.
This study has some limitations that warrant consideration. The relatively small number of samples and the confined spatiotemporal scope may hinder a comprehensive understanding of the ecological dynamics within the landfast sea ice zone at Cambridge Bay. Additionally, the omission of key physical variables, such as atmospheric and sea ice temperatures, constrains our insights into the sea ice environment as explored in this study. Recent shifts in the timing, thickness, and melting patterns of sea ice due to climate change have been reported in the Arctic Ocean. Given the scarcity of field measurement data in the landfast first-year sea ice zone near Cambridge Bay, predicting future changes in the POM components and their vertical distributions within the ice remains a formidable challenge. Nevertheless, our study provides a comprehensive investigation into the vertical distribution of vital biological parameters within the sea ice column near Cambridge Bay, highlighting the importance of both upper and bottom ice sections in understanding ecological dynamics and food availability in ice-covered ecosystems, particularly in the context of ongoing climate warming trends. Our findings emphasize the need for a comprehensive perspective when assessing the ecological roles of different ice layers in these rapidly changing polar environments.
Data availability statement
The original contributions presented in the study are included in the article/supplementary material. Further inquiries can be directed to the corresponding author.
Author contributions
SL conceived the ideas and designed the methodology. KK, J-HK, and LD performed the field campaign for sampling. The lab experiment was conducted by KK, DL, HJ, YK, and SP. KK and SL contributed to writing the original draft. KK, S-YH, K-HS, CM, BK, and SL contributed to writing extensive reviews and editing. All authors agreed with the submission of the published version of the manuscript. All authors contributed to the article and approved the submitted version.
Funding
This research was supported by grants from the National Research Foundation of Korea (NRF) funded by the Korean government (MSIT; NRF-2019R1A2C1003515), the Korea Institute of Marine Science & Technology Promotion (KIMST) funded by the Ministry of Oceans and Fisheries (20210605, Korea-Arctic Ocean Warming and Response of Ecosystem, KOPRI), and the Korea Polar Research Institute for the project ‘Carbon Cycle Change and Ecosystem Response under Southern Ocean Warming’ (PE23110).
Conflict of interest
The authors declare that the research was conducted in the absence of any commercial or financial relationships that could be construed as a potential conflict of interest.
Publisher’s note
All claims expressed in this article are solely those of the authors and do not necessarily represent those of their affiliated organizations, or those of the publisher, the editors and the reviewers. Any product that may be evaluated in this article, or claim that may be made by its manufacturer, is not guaranteed or endorsed by the publisher.
References
Amon R. M. W. (2004). The role of dissolved organic matter for the organic carbon cycle in the arctic ocean. Org. Carbon Cycle Arct. Ocean, 83–99. doi: 10.1007/978-3-642-18912-8_4
Arrigo K. R. (2014). Sea ice ecosystems. Ann. Rev. Mar. Sci. 6, 439–467. doi: 10.1146/annurev-marine-010213-135103
Arrigo K. R., Mock T., Lizotte M. P. (2010). “Primary producers and sea ice,” in Sea ice, 2 Edn. Eds. Thomas D. N., Dieckmann G. (Ames, IA: Blackwell Publishing Ltd), 283–326.
Arrigo K. R., Perovich D. K., Pickart R. S., Brown Z. W., van Dijken G. L., Lowry K. E., et al. (2014). Phytoplankton blooms beneath the sea ice in the Chukchi sea. Deep. Res. Part II Top. Stud. Oceanogr. 105, 1–16. doi: 10.1016/j.dsr2.2014.03.018
Bachy C., López-García P., Vereshchaka A., Moreira D. (2011). Diversity and vertical distribution of microbial eukaryotes in the snow, sea ice and seawater near the North Pole at the end of the polar night. Front. Microbiol. 2. doi: 10.3389/fmicb.2011.00106
Back D. Y., Ha S. Y., Else B., Hanson M., Jones S. F., Shin K. H., et al. (2021). On the impact of wastewater effluent on phytoplankton in the Arctic coastal zone: A case study in the Kitikmeot Sea of the Canadian Arctic. Sci. Total Environ. 764, 143861. doi: 10.1016/j.scitotenv.2020.143861
Berge J., Renaud P. E., Darnis G., Cottier F., Last K., Gabrielsen T. M., et al (2015). In the dark: A review of ecosystem processes during the Arctic polar night. Prog. Oceanogr. 139, 258–271. doi: 10.1016/j.pocean.2015.08.005
Bhavya P. S., Kim B. K., Jo N., Kim K., Kang J. J., Lee J. H., et al. (2019). A review on the macromolecular compositions of phytoplankton and the implications for aquatic biogeochemistry. Ocean Sci. J 54, 1–14. doi: 10.1007/s12601-018-0061-8
Bligh E. G., Dyer W. J. (1959). Canadian journal of biochemistry and physiology. Can. J. Biochem. Physiol. 37, 911–917. doi: 10.1139/o59-099
Campbell K., Mundy C. J., Barber D. G., Gosselin M. (2015). Characterizing the sea ice algae chlorophyll a-snow depth relationship over Arctic spring melt using transmitted irradiance. J. Mar. Syst 147, 76–84. doi: 10.1016/j.jmarsys.2014.01.008
Campbell K., Mundy C. J., Landy J. C., Delaforge A., Michel C., Rysgaard S. (2016). Community dynamics of bottom-ice algae in Dease Strait of the Canadian Arctic. Prog. Oceanogr. 149, 27–39. doi: 10.1016/j.pocean.2016.10.005
Comiso J. C. (2012). Large decadal decline of the arctic multiyear ice cover. J. Clim 12, 1176–1193. doi: 10.1175/JCLI-D-11-00113.1
Constable A. J., Nicol S., Strutton P. G. (2003). Southern Ocean productivity in relation to spatial and temporal variation in the physical environment. J. Geophys. Res. Ocean. 108, 1–6. doi: 10.1029/2001jc001270
Cota G. F., Prinsenberg S. J., Bennett E. B., Loder J. W., Lewis M. R., Anning J. L., et al. (1987). Nutrient fluxes during extended blooms of Arctic ice algae. J. Geophys. Res. 92, 1951–1962. doi: 10.1029/JC092iC02p01951
Daase M., Falk-Petersen S., Varpe Ø., Darnis G., Søreide J. E., Wold A., et al. (2013). Timing of reproductive events in the marine copepod Calanus glacialis: A pan-Arctic perspective. Can. J. Fish. Aquat. Sci. 70, 871–884. doi: 10.1139/cjfas-2012-0401
Dalman L. A., Else B. G. T., Barber D., Carmack E., Williams W. J., Campbell K., et al. (2019). Enhanced bottom-ice algal biomass across a tidal strait in the Kitikmeot Sea of the Canadian Arctic. Elementa 7, 1–16. doi: 10.1525/elementa.361
Danovaro R., Dell’Anno A., Pusceddu A., Marrale D., Della Croce N., Fabiano M., et al (2000). Biochemical composition of pico-, nano- and micro-particulate organic matter and bacterioplankton biomass in the oligotrophic Cretan Sea (NE Mediterranean). Prog. Oceanogr. 46, 279–310. doi: 10.1016/S0079-6611(00)00023-9
Danovaro R., Fabiano M. (1997). Seasonal changes in quality and quantity of food available for benthic suspension-feeders in the Golfo Marconi (North-western Mediterranean). Estuar. Coast. Shelf Sci 44, 723–736. doi: 10.1006/ecss.1996.0135
Dieckmann G. S., Hellmer H. H. (2010). “An importance of sea ice: an overview,” in Sea ice. Eds. Thomas D. N., Dieckmann G. S. (Chichester: John Wiley & Sons), 1–22.
Dubois M., Gilles K. A., Hamilton J. K., Rebers P. A., Smith F. (1956). Colorimetric method for determination of sugars and related substances. Anal. Chem 28, 350–356. doi: 10.1021/ac60111a017
Fichez R. (1991a). Composition and fate of organic matter in submarine cave sediments; implications for the biogeochemical cycle of organic carbon. Oceanol. Acta 14, 369–377.
Fichez R. (1991b). Suspended particulate organic matter in a Mediterranean submarine cave. Mar. Biol 108, 167–174. doi: 10.1007/BF01313485
Fortier M., Fortier L., Michel C., Legendre L. (2002). Climatic and biological forcing of the vertical flux of biogenic particles under seasonal Arctic sea ice. Mar. Ecol. Prog. Ser. 225, 1–16. doi: 10.3354/meps225001
Fry B. (1996). 13C/12C fractionation by marine diatoms. Mar. Ecol. Prog. Ser. 134, 283–294. doi: 10.3354/meps134283
Garrison D. L., Close A. R., Reimnitz E. (1990). “Microorganisms concentrated by frazil ice: Evidence from laboratory experiments and field measurements,” in Sea ice properties and processes. Eds. Ackley S. F., Weeks W. F. (Hanover, N. H: U.S. Army Corps of Eng., Cold Reg. Res. and Eng. Lab.), 92–96.
Giannelli V., Thomas D. N., Haas C., Kattner G., Kennedy H., Dieckmann G.S (2001). Behaviour of dissolved organic matter and inorganic nutrients during experimental sea-ice formation. Ann. Glaciol. 33, 317–321. doi: 10.3189/172756401781818572
Gosselin M., Legendre L., Demers S., Ingram R. G. (1985). Responses of sea-ice microalgae to climatic and fortnightly tidal energy inputs (Manitounuk sound, hudson bay). Can. J. Fish. Aquat. Sci. 42, 999–1006. doi: 10.1139/f85-125
Gosselin M., Legendre L., Therriault J.-C., Demers S. (1990). Light and nutrient limitation of sea-ice microalgae (Hudson Bay, Canadian Arctic). J. Phycol. 26, 220–232. doi: 10.1111/j.0022-3646.1990.00220.x
Gradinger R. (1999). Integrated abundance and biomass of sympagic meiofauna in Arctic and Antarctic pack ice. Polar Biol. 22, 169–177. doi: 10.1007/s003000050407
Gradinger R. (2009). Sea-ice algae: Major contributors to primary production and algal biomass in the Chukchi and Beaufort Seas during May/June 2002. Deep. Res. Part II Top. Stud. Oceanogr. 56, 1201–1212. doi: 10.1016/j.dsr2.2008.10.016
Gradinger R., Ikävalko J. (1998). Organism incorporation into newly forming arctic sea ice in the Greenland sea. J. Plankton Res. 20, 871–886. doi: 10.1093/plankt/20.5.871
Gradinger R., Zhang Q. (1997). Vertical distribution of bacteria in Arctic sea ice from the Barents and Laptev Seas. Polar Biol. 17, 448–454. doi: 10.1007/s003000050139
Howell S. E. L., Brady M. (2019). The dynamic response of sea ice to warming in the canadian arctic archipelago. Geophys. Res. Lett. 46, 13119–13125. doi: 10.1029/2019GL085116
Howell S. E. L., Tivy A., Yackel J. J., Scharien R. K. (2006). Application of a SeaWinds/QuikSCAT sea ice melt algorithm for assessing melt dynamics in the Canadian Arctic Archipelago. J. Geophys. Res. Ocean. 111, 1–21. doi: 10.1029/2005JC003193
Jin M., Deal C. J., Wang J., Shin K. H., Tanaka N., Whitledge T. E., et al. (2006). Controls of the landfast ice-ocean ecosystem offshore Barrow, Alaska. Ann. Glaciol. 44, 63–72. doi: 10.3189/172756406781811709
Kaartokallio H., Kuosa H., Thomas D. N., Granskog M. A., Kivi K. (2007). Biomass, composition and activity of organism assemblages along a salinity gradient in sea ice subjected to river discharge in the Baltic Sea. Polar Biol. 30, 183–197. doi: 10.1007/s00300-006-0172-z
Kennedy F., Martin A., Bowman J. P., Wilson R., McMinn A. (2019). Dark metabolism: a molecular insight into how the Antarctic sea-ice diatom Fragilariopsis cylindrus survives long-term darkness. New Phytol. 223, 675–691. doi: 10.1111/nph.15843
Kennedy H., Thomas D. N., Kattner G., Haas C., Dieckmann G. S. (2002). Particulate organic matter in Antarctic summer sea ice: Concentration and stable isotopic composition. Mar. Ecol. Prog. Ser. 238, 1–13. doi: 10.3354/meps238001
Kim K., Ha S. Y., Kim B. K., Mundy C. J., Gough K. M., Pogorzelec N. M., et al. (2020). Carbon and nitrogen uptake rates and macromolecular compositions of bottom-ice algae and phytoplankton at Cambridge Bay in Dease Strait, Canada. Ann. Glaciol. 61, 106–116. doi: 10.1017/aog.2020.17
Kim B. K., Lee J. H., Joo H. T., Song H. J., Yang E. J., Lee S. H., et al. (2016). Macromolecular compositions of phytoplankton in the Amundsen Sea, Antarctica. Deep. Res. Part II Top. Stud. Oceanogr. 123, 42–49. doi: 10.1016/j.dsr2.2015.04.024
Kim B. K., Lee J. H., Yun M. S., Joo H. T., Song H. J., Yang E. J., et al. (2015). High lipid composition of particulate organic matter in the northern Chukchi Se. Deep. Res. Part II Top. Stud. Oceanogr. 120, 72–81. doi: 10.1016/j.dsr2.2014.03.022
Kim K., Park J., Jo N., Park S., Yoo H., Kim J., et al. (2021). Monthly variation in the macromolecular composition of phytoplankton communities at jang bogo station, terra nova bay, ross sea. Front. Microbiol. 12, 1–19. doi: 10.3389/fmicb.2021.618999
Kuwata A., Hama T., Takahashi M. (1993). Ecophysiological characterization of two life forms, resting spores and resting cells, of a marine planktonic diatom, Chaetoceros pseudocurvisetus, formed under nutrient depletion. Mar. Ecol. Prog. Ser. 102, 245–256. doi: 10.3354/meps102245
Laney S. R., Sosik H. M. (2014). Phytoplankton assemblage structure in and around a massive under-ice bloom in the Chukchi Sea. Deep. Res. Part II Top. Stud. Oceanogr. 105, 30–41. doi: 10.1016/j.dsr2.2014.03.012
Langhorne P. J., Robinson W. H. (1983). Effect of acceleration on sea ice growth. Nature 305, 695–698. doi: 10.1038/305695a0
Lee S. H., McRoy C. P., Joo H. M., Gradinger R., Cui X. H., Yun M. S., et al. (2011). Holes in progressively thinning Arctic sea ice lead to new ice algae habitat. Oceanography 24, 302–308. doi: 10.5670/oceanog.2011.81
Lee S. H., Whitledge T. E. (2005). Primary and new production in the deep Canada Basin during summer 2002. Polar Biol 25, 190–197. doi: 10.1007/s00300-004-0676-3
Lee S. H., Whitledge T. E., Kang S. H. (2008). Spring time production of bottom ice algae in the landfast sea ice zone at Barrow, Alaska. J. Exp. Mar. Bio. Ecol. 367, 204–212. doi: 10.1016/j.jembe.2008.09.018
Legendre L., Ackley S., Dieckmann G., Gulliksen B., Horner R., Hoshiai T., et al. (1992). Ecology of sea ice biota. Polar Biol. 12, 429–444. doi: 10.1007/bf00243114
Leu E., Mundy C. J., Assmy P., Campbell K., Gabrielsen T. M., Gosselin M., et al. (2015). Arctic spring awakening - Steering principles behind the phenology of vernal ice algal blooms. Prog. Oceanogr. 139, 151–170. doi: 10.1016/j.pocean.2015.07.012
Li M., Ke C. Q., Shen X., Cheng B., Li H. (2021). Investigation of the Arctic Sea ice volume from 2002 to 2018 using multi-source data. Int. J. Climatol. 41, 2509–2527. doi: 10.1002/joc.6972
Lizotte M. P. (2001). The contributions of sea ice algae to antarctic marine primary production. Am. Zool. 41, 57–73. doi: 10.1093/icb/41.1.57
Lobbes J. M., Fitznar H. P., Kattner G. (2000). Biogeochemical characteristics of dissolved and particulate organic matter. Geochim. Cosmochim. Acta 64, 2973–2983. doi: 10.1016/S0016-7037(00)00409-9
Lowry O. H., Rosebrough N. J., Farr A. L., Randall R. J. (1951). Protein measurement with the Folin phenol reagent. J. Biol. Chem. 193, 265–275. doi: 10.1016/s0021-9258(19)52451-6
Markus T., Stroeve J. C., Miller J. (2009). Recent changes in Arctic sea ice melt onset, freezeup, and melt season length. J. Geophys. Res. Ocean. 114: C12024, 1–14. doi: 10.1029/2009JC005436
Marsh J. B., Weinstein D. B. (1966). Simple charring method for determination of lipids. J. Lipid Res 7, 574–576. doi: 10.1016/S0022-2275(20)39274-9
Marshall M. (2018). Progression of marine phytoplankton blooms and environmental dynamics from sea-ice coverage to open waters in the coastal Arctic: comparing experimental data with continuous cabled observations (Canada: Master of Science. University of Victoria).
McLaughlin F. A., Carmack E. C., Ingram R. G., Williams W. J., Michel C. (2004). Oceanography of the northwest passage. Sea 14, 1211–1242.
McMinn A., Martin A., Ryan K. (2010). Phytoplankton and sea ice algal biomass and physiology during the transition between winter and spring (McMurdo Sound, Antarctica). Polar Biol 33, 1547–1556. doi: 10.1007/s00300-010-0844-6
Meiners K., Fehling J., Granskog M. A., Spindler M. (2002). Abundance, biomass and composition of biota in Baltic sea ice and underlying water (March 2000). Polar Biol. 25, 761–770. doi: 10.1007/s00300-002-0403-x
Melling H., Haas C., Brossier E. (2015). Invisible polynyas: Modulation of fast ice thickness by ocean heat flux on the Canadian polar shelf. J. Geophys. Res. Ocean. 120, 777–795. doi: 10.1002/2014JC010404
Michel C., Ingram R. G., Harris L. R. (2006). Variability in oceanographic and ecological processes in the Canadian Arctic Archipelago. Prog. Oceanogr. 71, 379–401. doi: 10.1016/j.pocean.2006.09.006
Michel C., Legendre L., Ingram R. G., Gosselin M., Levasseur M. (1996). Carbon budget of sea-ice algae in spring: evidence of a significant transfer to zooplankton grazers. J. Geophys. Res. Oceans 101, 18345–18360. doi: 10.1029/96jc00045
Michel C., Nielsen T. G., Nozais C., Gosselin M. (2002). Significance of sedimentation and grazing by ice micro- and meiofauna for carbon cycling in annual sea ice (northern Baffin Bay). Aquat. Microb. Ecol. 30, 57–68. doi: 10.3354/ame030057
Morris I. (1981). Photosynthetic products, physiological state, and phytoplankton growth. Can. Bull. Fish. Aquat. Sci. 210, 83–102.
Niemi A., Michel C. (2015). Temporal and spatial variability in sea-ice carbon:nitrogen ratios on canadian arctic shelvestemporal and spatial variability in sea-ice carbon: Nitrogen ratios. Elementa 3, 1–12. doi: 10.12952/journal.elementa.000078
Nymark M., Valle K. C., Hancke K., Winge P., Andresen K., Johnsen G., et al. (2013). Molecular and photosynthetic responses to prolonged darkness and subsequent acclimation to re-illumination in the diatom phaeodactylum tricornutum. PloS One 8, e058722. doi: 10.1371/journal.pone.0058722
Oku O., Kamatani A. (1999). Resting spore formation and biochemical composition of the marine planktonic diatom Chaetoceros pseudocurvisetus in culture: Ecological significance of decreased nucleotide content and activation of the xanthophyll cycle by resting spore formation. Mar. Biol 135, 425–436. doi: 10.1007/s002270050643
Olsen L. M., Laney S. R., Duarte P., Kauko H. M., Fernández-Méndez M., Mundy C. J., et al. (2017). The seeding of ice algal blooms in Arctic pack ice: The multiyear ice seed repository hypothesis. J. Geophys. Res. Biogeosciences 122, 1529–1548. doi: 10.1002/2016JG003668
Park S., Park J., Yoo K. C., Yoo J., Kim K., Jo N., et al. (2021). Seasonal variations in the biochemical compositions of phytoplankton and transparent exopolymer particles (Teps) at jang bogo station (terra nova bay, ross sea), 2017–2018. Water (Switzerland) 13. doi: 10.3390/w13162173
Parsons T. R., Maita Y., Lalli C. M. (1984). A manual of chemical and biological methods for seawater analysis. (New York, NY: Pergamon Press).
Petrich C., Eicken H. (2010). Growth, structure and properties of sea ice. Sea Ice Second Ed. (Oxford, United Kingdom: Blackwell Publishing Ltd) 2, 23–77. doi: 10.1002/9781444317145.ch2
Pogorzelec N. M., Mundy C. J., Findlay C. R., Campbell K., Diaz A., Ehn J. K., et al. (2017). FTIR imaging analysis of cell content in sea-ice diatom taxa during a spring bloom in the lower Northwest Passage of the Canadian Arctic. Mar. Ecol. Prog. Ser. 569, 77–88. doi: 10.3354/meps12088
Pusceddu A., Serra E., Sanna O., Fabiano M. (1996). Seasonal fluctuations in the nutritional value of particulate organic matter in a lagoon. Chem. Ecol 13, 21–37. doi: 10.1080/02757549608039099
Ratkova T. N., Wassmann P. (2005). Sea ice algae in the White and Barents seas: composition and origin. Polar Res. 24, 95–110. doi: 10.3402/polar.v24i1.6256
Redfield A. C., Ketchum B. H., Richards F. A. (1963). “The influence of organisms on the composition of sea-water,” in The sea. Ideas and observations on progress in the study of the seas, The Composition of Sea-Water Comparative and Descriptive Oceanography, vol. 2 . Ed. Hill M. N. (New York, NY: Interscience Publishers), 26–77.
Riedel A., Michel C., Gosselin M., LeBlanc B. (2007). Enrichment of nutrients, exopolymeric substances and microorganisms in newly formed sea ice on the Mackenzie shelf. Mar. Ecol. Prog. Ser. 342, 55–67. doi: 10.3354/meps342055
Runge J. A., Ingram R. G. (1988). Underice grazing by planktonic, calanoid copepods in relation to a bloom of ice microalgae in southeastern Hudson Bay. Limnol. Oceanogr. 33, 280–286. doi: 10.4319/lo.1988.33.2.0280
Rysgaard S., Kühl M., Glud R. N., Hansen J. W. (2001). Biomass, production and horizontal patchiness. Mar. Ecol. Prog. Ser. 223, 15–26. doi: 10.3354/meps223015
Schubert C. J., Calvert S. E. (2001). Nitrogen and carbon isotopic composition of marine and terrestrial organic matter in Arctic Ocean sediments:implications for nutrient utilization and organic matter composition. Deep Sea Res. Part I Oceanogr. Res. Pap. 48, 789–810. doi: 10.1016/s0967-0637(00)00069-8
Shen X. Y., Zhang Y., Chen C. S., Hu S., Xu D. Y., Shao W. Z., et al. (2021). Arctic sea ice variation in the Northwest Passage in 1979–2017 and its response to surface thermodynamics factors. Adv. Clim. Change Res. 12, 563–580. doi: 10.1016/j.accre.2021.08.004
Song H. J., Lee J. H., Kim G. W., Ahn S. H., Joo H. M., Jeong J. Y., et al. (2016). In-situ measured primary productivity of ice algae in Arctic sea ice floes using a new inCubation method. Ocean Sci. J. 51, 387–396. doi: 10.1007/s12601-016-0035-7
Søreide J. E., Leu E. V. A., Berge J., Graeve M., Falk-Petersen S. (2010). Timing of blooms, algal food quality and Calanus glacialis reproduction and growth in a changing Arctic. Glob. Change Biol. 16, 3154–3163. doi: 10.1111/j.1365-2486.2010.02175.x
Stedmon C. A., Thomas D. N., Granskog M., Kaartokallio H., Papadimitriou S., Kuosa H. (2007). Characteristics of dissolved organic matter in baltic coastal sea ice: Allochthonous or autochthonous origins? Environ. Sci. Technol. 41, 7273–7279. doi: 10.1021/es071210f
Stroeve J. C., Kattsov V., Barrett A., Serreze M., Pavlova T., Holland M., et al. (2012). Trends in Arctic sea ice extent from CMIP5, CMIP3 and observations. Geophys. Res. Lett. 39, 1–7. doi: 10.1029/2012GL052676
Sturm M., Massom R. A. (2009). “Snow and sea ice,” in Sea ice. Eds. Thomas D. N., Dieckmann G. S. (Chichester: Wiley-Blackwell).
Thomas D. N., Papadimitriou S., Michel C. (2010). “Chapter 12: biogeochemistry of sea ice,” in Sea ice. Eds. Thomas D. N., Dieckmann G. S. (Hoboken, NJ: Wiley-Blackwell), 425–468.
Vancoppenolle M., Meiners K. M., Michel C., Bopp L., Brabant F., Carnat G., et al. (2013). Role of sea ice in global biogeochemical cycles: Emerging views and challenges. Quat. Sci. Rev. 79, 207–230. doi: 10.1016/j.quascirev.2013.04.011
Van Leeuwe M. A., Tedesco L., Arrigo K. R., Assmy P., Campbell K., Meiners K. M., et al. (2018). Microalgal community structure and primary production in Arctic and Antarctic sea ice: A synthesis. Elementa 6, 1–25. doi: 10.1525/elementa.267
Von Quillfeldt C. H., Ambrose W. G., Clough L. M. (2003). High number of diatom species in first-year ice from the Chukchi Sea. Polar Biol. 26, 806–818. doi: 10.1007/s00300-003-0549-1
Werner I., Ikävalko J., Schünemann H. (2007). Sea-ice algae in Arctic pack ice during late winter. Polar Biol. 30, 1493–1504. doi: 10.1007/s00300-007-0310-2
Widell K., Fer I., Haugan P. M. (2006). Salt release from warming sea ice. Geophys. Res. Lett. 33, 1–5. doi: 10.1029/2006GL026262
Wulff A., Roleda M. Y., Zacher K., Wiencke C. (2008). Exposure to sudden light burst after prolonged darkness—a case study on benthic diatoms in Antarctica. Diatom Res. 23, 519–532. doi: 10.1080/0269249X.2008.9705774
Keywords: sea ice, organic matters, Chl-a (chlorophyll a), biopolymeric carbon (BPC), Cambridge Bay
Citation: Kim K, Ha S-Y, Shin K-H, Kim J-H, Mundy CJ, Dalman LA, Kim BK, Lee D, Jang HK, Kim Y, Park S and Lee SH (2023) Vertical distributions of organic matter components in sea ice near Cambridge Bay, Dease Strait, Canadian Archipelago. Front. Mar. Sci. 10:1231083. doi: 10.3389/fmars.2023.1231083
Received: 30 May 2023; Accepted: 21 August 2023;
Published: 06 September 2023.
Edited by:
Huixiang Xie, Université du Québec à Rimouski, CanadaCopyright © 2023 Kim, Ha, Shin, Kim, Mundy, Dalman, Kim, Lee, Jang, Kim, Park and Lee. This is an open-access article distributed under the terms of the Creative Commons Attribution License (CC BY). The use, distribution or reproduction in other forums is permitted, provided the original author(s) and the copyright owner(s) are credited and that the original publication in this journal is cited, in accordance with accepted academic practice. No use, distribution or reproduction is permitted which does not comply with these terms.
*Correspondence: Sang Heon Lee, c2FuZ2xlZUBwdXNhbi5hYy5rcg==