
94% of researchers rate our articles as excellent or good
Learn more about the work of our research integrity team to safeguard the quality of each article we publish.
Find out more
ORIGINAL RESEARCH article
Front. Mar. Sci., 03 November 2023
Sec. Ocean Observation
Volume 10 - 2023 | https://doi.org/10.3389/fmars.2023.1229692
This article is part of the Research TopicThe Atlantic Meridional Transect Programme (1995-2023)View all 12 articles
 Vanda Brotas1*
 Afonso Ferreira1
 Vera Veloso1
 Andreia Tracana1
 Catarina V. Guerreiro1
 Glen Adam Tarran2
 E. Malcolm S. Woodward2
 Lourenço Ribeiro1Jane Netting2Daniel Clewley2
 Steve B. Groom2
The Atlantic Meridional Transect (AMT) program (www.amt-uk.org) provides the perfect opportunity to observe the phytoplankton community size structure over a long latitudinal transect 50oN to 50oS, thereby covering the most important latitude-related basin-scale environmental gradients of the Atlantic Ocean. This work presents cell abundance data of phytoplankton taxa recently collected during cruises AMT28 and 29 (in 2018 and 2019, respectively) using flow cytometer and microscope observations, as well as the pigment composition of the community, to assess the abundance and spatial distribution of taxonomic groups across the Atlantic. The community size structure showed a clear consistency between cruises at large spatial scale, with a dominance of picoplanktonic Cyanobacteria in oceanic gyres, an increase in all groups in the equatorial upwelling region, and high biomass of microplankton size class at higher latitudes. Phytoplankton carbon biomass for oceanographic provinces, ranged from median values of 10 to 47 mg Carbon m-3, for the oligotrophic gyres, and South Atlantic (45°S-50oS), respectively. Satellite images of total chlorophyll a (as a proxy for phytoplankton biomass) as well as the relative contribution of the three phytoplankton size classes were produced for both cruises, and despite the small number of matchups, statistically agreed well with in situ size classes estimated as carbon biomass, constituting the first attempt in the literature to match satellite size classes with in situ data derived from cell abundance. The comparison of community structure between recent cruises (2019, 2018, 2015) and earlier ones (1995-1998) indicates a decrease in the number of diatom-bloom forming species, and an increase in Dinoflagellates, whereas nitrogen-fixing Trichodesmium abundance in tropical Atlantic remains constant. Within the recent period, a relative increase in the median values of picoplankton fraction was seen in SATL region, counterbalanced by a decrease in both nano- and microplankton fractions. Additionally, this study includes a database of species identified by microscopy, which had been interrupted for 20 years, providing a basis for long-term series of phytoplankton species.
The effect of climate change on the environment and biota should no longer be denied. The scientific community is thus strongly committed to evaluating the consequences of global warming on the interaction between atmospheric drivers and the fate and diversity of biological communities. In the ocean, phytoplankton is the basis of most trophic chains; it is responsible for sequestering as much atmospheric CO2 as the terrestrial vegetation by photosynthesis, hence, playing a major role in the carbon cycle (Field et al., 1998). Phytoplankton comprises microscopic organisms from diverse phylogenetic evolutionary lines, with different cell sizes (cell biovolume spanning along seven orders of magnitude), different nutrient and light requirements (Reynolds, 2006), and yet not completely understood diverse trophic strategies (Glibert and Mitra, 2022). Phytoplankton communities respond rapidly to environmental changes due to fast turnover rates, often with a shift between species, due to inter-specific competition for resources. Changes in the community composition may have drastic cascading consequences for the other levels of the marine trophic chain (e.g. Reynolds, 2006). Hence, it is essential, yet complex, to understand whether such community shifts and diversity changes are due to natural response to environmental drivers or due to changes arising from climate change. Databases of long temporal series are vital to address these questions, as multiple sets of observations of species variability over a range of different time and space scales could contribute to our better understanding of species dynamics and characterisation of deviations.
The scientific knowledge on phytoplankton communities in the open ocean is considerably lower than in coastal and high-productivity zones (Buitenhuis et al., 2013) not least due to the practicality and cost of sampling away from the coast. Assessing phytoplankton diversity, studying taxonomic composition, cell size, or trophic strategy is mandatory to comprehend the ocean and the response of biological communities to climate change. Moreover, a better knowledge of phytoplankton functional types (PFTs) is key to understanding biogeochemical cycles (Le Quéré et al., 2005). PFTs were defined to link phytoplankton taxonomic classes with specific biogeochemical functions, enabling the development of ocean-ecosystem biogeochemistry models (Nair et al., 2008). The PFT concept originally evolved from a vegetation recognition approach, based on the functional associations of species in plankton (Reynolds et al, 2002). The number of defined PFT varies according to the scientific question being addressed; in the present work, we considered the same PFTs as in Brotas et al. (2022), ie picoautotrophs, calcifiers (coccolithophores), silicifiers (diatoms), diazotrophs (filamentous Cyanobacteria and symbiontic diatoms), autotrophic dinoflagellates, heterotrophic dinoflagellates and mixed nanoeukaryotes.
Satellite observations of near-surface Chl-a concentration, the proxy for phytoplankton biomass, has been defined by the Global Climate Observing System (GCOS) as an Essential Climate Variable and has been widely used in the literature addressing the response of oceanic phytoplankton to climate indicators (e.g., Brewin et al., 2012); hence, within this context, the terms remote sensing or Earth Observation (EO) are used in the literature to describe this technique (Sathyendranath et al., 2019a). Algorithms to assess phytoplankton functional types (PFTs) from space have also been developed (e.g., Xi et al., 2023), and the need to have complementary approaches to study phytoplankton dynamics has been stressed by IOCCG (2014) and acknowledged by the scientific community (Bracher et al., 2017). Hence, for effective understanding of changes at a global scale, spatio-temporal observations provided by satellites, including Chla , size structure, and carbon dynamics (Sathyendranath et al., 2020), coupled with in situ observations are essential.
Phytoplankton size classification (Sieburth et al., 1978) considers three size classes: microplankton (Equivalent Spheric Diameter, ESD > 20 µm), nanoplankton (2 to 20 µm) and picoplankton (<2 µm). The phytoplankton size classes (PSC) can be assessed from pigment concentration using the method proposed by Vidussi et al. (2001), and further developed by Uitz et al. (2006), which differentiates the fractions of the three size classes in relation to total Chla (TChla), using the concentration of seven diagnostic pigments, belonging to the major marine taxonomic groups. The sum of these seven pigments is weighted by specific coefficients derived from extensive in situ databases. The fraction of each size class is then determined by the sum of its diagnostic pigments divided by the sum of all seven pigments, and the value of Chla attributed to each size class fraction can be then computed by multiplying it by the total Chla value. This methodology, in spite of the lack of a one-to-one correspondence between diagnostic pigments and most microalgal taxonomic classes, has proven to be adequate to represent phytoplankton size classes composition over large spatial scales, and it is widely used with remote sensing studies of phytoplankton (Nair et al., 2008, IOCCG, 2014; Bracher et al., 2017; Sun et al., 2023, amongst others).
The Atlantic Meridional Transect (AMT) is a multi-disciplinary research program that sampled the Atlantic Ocean on a transect from 50oN to 50oS, biannually from 1995 to 2000, and annually from 2000 onwards. Phytoplankton has been a major focus, along with the carbon biogeochemical cycle. The breadth and quality of scientific investigation which has resulted from AMT is impressive (see Rees et al., 2017), and has already shown changes which occurred probably due to climate change, e.g., Aiken et al. (2017), who found that the area of the north and south Atlantic gyres are expanding.
Species composition by microscope of the phytoplankton community was thoroughly assessed during AMTs 1 to 10 (from 1995-2000), but was discontinued in subsequent cruises with the exception of a short-term coccolithophore study covering the period 2003-2005 (Poulton et al., 2017). Hence, this paper presents a resumption of species composition by microscopy, continuing our previous work on AMT25 (Brotas et al., 2022) and provides the database as supplementary material.
This work aims to contribute to the following main goals of the AMT programme (stated in Rees et al., 2017): i) “building multi-decadal ocean time series” and ii) “quantifying the nature of ecological and biological variability in planktonic systems”. The specific objectives of this paper are: 1) to characterise spatial patterns of biomass and community composition variability on a ~50°N to ~50°S transect on the Atlantic in two recent cruises, applying complementary in situ and satellite observations, focusing on biomass estimation (converted into carbon) of the phytoplankton taxonomic groups; and 2) to investigate and compare the most abundant phytoplankton species (within diatoms, dinoflagellates, filamentous Cyanobacteria) in earlier AMT cruises from the late 1990s with those from recent years (2015, 2018 and 2019).
This work comprises data collected on two AMT cruises: AMT28, on board RRS James Clark Ross, which took place from 23rd September to 30th October 2018, and AMT29 onboard RRS Discovery, from 13th October to 25th November 2019. The full reports of the cruises are available at https://www.amt-uk.org/Cruises.
Seawater samples were taken from 24 x 20 litre OTE (Ocean Test Equipment) CTD bottles mounted on a stainless steel rosette frame and a Seabird CTD system. The samples were taken from the predawn and noon CTD casts. Chla-Fluorescence was obtained from the CTD sensor Wet Labs ECO-AFL/FL Fluorometer. Samples for Flow Cytometer analyses of phytoplankton groups and HPLC analyses of the concentration of photosynthetic pigments were taken at the surface for 63 stations in AMT28 and 52 in AMT29. Nutrient samples were collected at every depth from each CTD cast according to GO-SHIP protocols. For microscopic enumeration of phytoplankton, surface samples were taken from a water depth between 2-7m for both cruises at all sampling stations. Additionally, Deep Chlorophyll Maximum (DCM) samples for microscopy were also taken at 19 stations for AMT28, and 18 for AMT29, located in northern latitudes in the North and South, and in the area of the Equatorial upwelling. The DCM was assessed during sampling by observing the profile of Chla Fluorescence obtained through the CTD.
To measure the concentration of nutrients, water samples taken at each CTD cast were sub-sampled into clean (acid-washed) 60 mL HDPE (Nalgene) sample bottles, which were rinsed three times with sample seawater prior to filling and capping.
For AMT28, samples were analysed on the ship as soon as possible after sampling and were not stored or preserved, whereas for AMT29, samples were analysed at Plymouth Marine Laboratory (PML). Samples were kept at -20o C during the cruise. For both cruises Micro-molar nutrient analysis was carried out using a four-channel SEAL analytical AAIII segmented flow nutrient auto-analyser.
The colourimetric analysis methods used were: Nitrate (Brewer and Riley, 1965, modified), Nitrite (Grasshoff, 1976), and Phosphate and Silicate (Kirkwood, 1989). The detection limit for Silicate was 0.02 μm and for the three others was 0.01μm. Sample handling and protocols were carried out where possible according to GO-SHIP protocols (Becker et al., 2020).
For each site, a sample of 200 mL was put in amber glass bottles and fixed with acid Lugol’s iodine solution (2% final concentration). In the laboratory, observations were carried out with a Zeiss Axiovert 200 inverted microscope with 10x40 magnification. Cells > 10 µm were counted in a 50 mL chamber, following the Utermöhl method (Utermöhl, 1958), aiming to count at least a total number of 400 cells; when this value was not reached, a second chamber was counted. Species from the following divisions/classes were identified and counted: Bacillariophyceae (diatoms), Dinophyceae, separated into Autotrophic (ADinos) and Heterotrophic dinoflagellates (HDinos), Prasinophyceae, filamentous Cyanobacteria, and the genus Phaeocystis. For Trichodesmium spp (filamentous Cyanobacteria), the number of cells was estimated for each filament, giving an average number of 100 cells per filament.
These groups were defined according to work carried out on AMTs 1 to 10, from which a database of taxa identified by microscopy was published (Sal et al., 2013), and restarted in AMT25 by Brotas et al. (2022).
Coccolithophore species > 10 µm were not assessed by microscopy, as this community was the object of another paper in this special issue (Guerreiro et al., 2023). Hence in this work, coccolithophore species were only assessed by Flow Cytometry. Taxonomic names were checked against the World Register of Marine Species (WoRMS).
Sea water samples were collected in clean 250 mL polycarbonate bottles from the CTD system, stored in a refrigerator and analysed within 2 hours of collection. Fresh samples were analysed using a Becton Dickinson FACSort flow cytometer. Within the analysis window, six different groups were enumerated: Prochlorococcus, Synechococcus, pico-eukaryotes (PEUK), coccolithophores within 5-10 µm (COCCOS), Cryptophytes (CRYPTO) and other nanophytoplankton (NEUK), following the methodology described in Tarran et al. (2006).
Flow cytometery targets the smaller component of phytoplankton cells, from ESD of < 1 µm up to ca 10 µm, whereas microscopy may identify cells with ESD ≥ 10 µm.
Cell numbers of each taxon were converted into carbon concentration (mg Carbon m-3). For phytoplankton cells counted by microscopy, the Cell Carbon content was obtained either from the AMT database published by Sal et al. (2013) or from species biovolume, which was then converted into carbon using the conversion factors of Menden-Deuer and Lessard (2000), as detailed in Brotas et al., 2022 (see Table S1 in Supplementary Material, which has the values of pg Carbon per cell for all microplanktonic species identified).
For taxa measured by flow cytometry, cell numbers of Prochlorococcus and Synechococcus were converted to Cell Carbon by applying conversion factors of 32 and 110 fg Carbon Cell-1, respectively, following Tarran et al. (2001). Cell Carbon content factors for PEUK, NEUK, CRYPTO, and COCCOS were 0.44, 3.53, 23.66 and 33.37 pg Carbon Cell-1, respectively (Tarran et al., 2006).
In order to analyse the concentration in photosynthetic pigments, a volume of 2 to 6 L of seawater was vacuum-filtered through 25 mm diameter GF/F filters onboard, immediately after sampling. Filters were folded into 2 mL cryovials and stored immediately in the -80oC freezer.
Phytoplankton pigments were determined later in the laboratory using High Performance Liquid Chromatography (HPLC). The chromatographic separation of pigments is based on the C8 method developed by Zapata et al. (2000), and adapted by Mendes et al. (2007). This method is based on a reverse-phase and a pyridine-containing mobile phase. Filters are extracted with 3 ml of 95% cold-buffered methanol (2% ammonium acetate) in a polypropylene test tube. An internal standard, trans-β-apo-8’-carotenal at a concentration of 0.005 mg L-1, is included in the extraction solvent, for posterior correction of pigment concentrations. The equipment used is a Shimadzu Prominence – I Plus® Lc 2030C 3D Plus, with a monomeric octysilica (OS) C8 column Symmetry® (150mm x 4.6mm dimensions, 100 Å pore size, 3.5 µm particle size, 335 m2 g-1 surface area and 12% carbon load). The solvent gradient has a flow rate of 1 mL min-1 and a run of 40 min; the sample injection volume is 100 µL. The composition of the solvents is the following: A – Methanol: Aqueous pyridine: Acetonitrile (50:25:25 v/v/v) and B - Methanol: Acetonitrile: Acetone (20:60:20v/v/v).
The HPLC was calibrated using a suite of standards purchased from DHI (Denmark). Pigments were identified based on retention time and spectral match using a photo-diode array.
The three size classes’ abundance was estimated according to Uitz et al. (2006). The weight of each diagnostic pigment followed Brewin et al. (2017), who investigated the pigment ratios and the influence of ambient light on a vast in situ dataset in the Atlantic, updating the initial coefficients proposed by Uitz et al. (2006). Hence, the weighted sum of all diagnostic pigments, equivalent to total Chlorophyll a was computed from the expression C= ∑ WiPi, where W (weight) = {1.65, 1.04, 0.78, 1.19, 3.14 1.27, 1.02}, and P, (pigments) = {fucoxanthin, peridinin, 19’hexanoyloxyfucoxanthin, 19’butonoyloxyfucoxanthin, alloxanthin, chlorophyll b + divinyl chlorophyll b and zeaxanthin}.
Microplankton class was determined by the sum of fucoxanthin and peridinin (diagnostic pigments diatoms and dinoflagellates, respectively), nanoplankton encompassed coccolithophores, Cryptophytes, and a non-differentiated assemblage of nano-eukaryotes (represented by 19’hexanoyloxyfucoxanthin, 19’butonoyloxyfucoxanthin, alloxanthin), and chlorophyll b + divinyl chlorophyll b and zeaxanthin were used to estimate picoplankton fraction (dominated by the small Cyanobacteria Prochlorococcus and Synechoccocus).
The filamentous Cyanobacteria (which contain the cyanobacteria diagnostic pigments) did not fit into the size class approach, as according to their size, they should be considered microplankton and not picoplankton.
Satellite data analysis was undertaken by the UK NERC Earth Observation Data Acquisition and Analysis Service (NEODAAS). For sea-surface temperature (SST), the UK Met Office reprocessed OSTIA global foundation SST was used, obtained from the Copernicus Marine Environment Monitoring Service (https://data.marine.copernicus.eu/product/SST_GLO_SST_L4_REP_OBSERVATIONS_010_011/description). The OSTIA level 4 product uses a combination of satellite data, from both infrared and microwave radiometers, and in situ data, to provide daily, global, 0.05 x 0.05 degree resolution, gap-filled images (Good et al., 2020). Chla data were obtained from the ESA ocean colour climate change initiative (OC-CCI portal: www.oceancolour.org/portal) at daily, 4km resolution and comprised version 6. The OC CCI dataset is a multi-sensor product with inter-sensor bias correction. Each pixel is classified in terms of fuzzy (or partial) membership of optical water types (OWT) and the Chla is computed as a function of the memberships and the best performing algorithm per OWT (Sathyendranath et al., 2019a). Aerosol optical thickness (AOT) at 550nm was obtained from the NOAA Suomi VIIRS sensor at daily, 4 km resolution. Composite images were produced as simple averages of all daily data for the duration of each cruise.
In order to obtain the Chla contribution of each size class as well as, separately, of diatoms and dinoflagellates, to total satellite-derived Chla, the model of Brewin et al. (2017) was used, which incorporates SST-dependency of the model parameters. This is a development of the three-component model of PSC of Brewin et al., (2010) which assumes that TChla derives from the sum of Chla from each size-class (Micro-, nano- and picoplankton), and uses two exponential functions to calculate Chla of nano+picoplankton, and Chla from picoplankton as a function of TChla. The parameters of these functions are from the statistical correlation of pigment ratios in extensive in situ databases. Linking model parameters to SST in addition to Chla resulted in only slight improvement to regression statistics (RMSE and bias) but incorporated variations in model parameters that are not captured in the Chla-only fixed-parameter model (Brewin et al., 2017). Size class specific Chla was computed using the daily Chla and SST data.
Daily matchups were obtained between the satellite results and contemporaneous in situ sampling of biomass for AMT28 and AMT29.
A comparison of diatom and dinoflagellate and filamentous Cyanobacteria species from AMT1, 3, 5, 7 (which occurred in boreal autumn in 1995, 1996, 1997 and 1998, respectively), AMT25 and the present AMT28 and 29 was undertaken. The routes of the seven AMTs are shown in Figure 1, whereas Table 1 specifies the dates and number of stations for each cruise. Data from earlier AMTs were gathered from Sal et al. (2013), and AMT25 data were published in the BODC database (Brotas and Veloso, 2022) and analysed by the same person as the samples for AMT28 and AMT29. Only results from surface samples were considered (2 to 7 m).
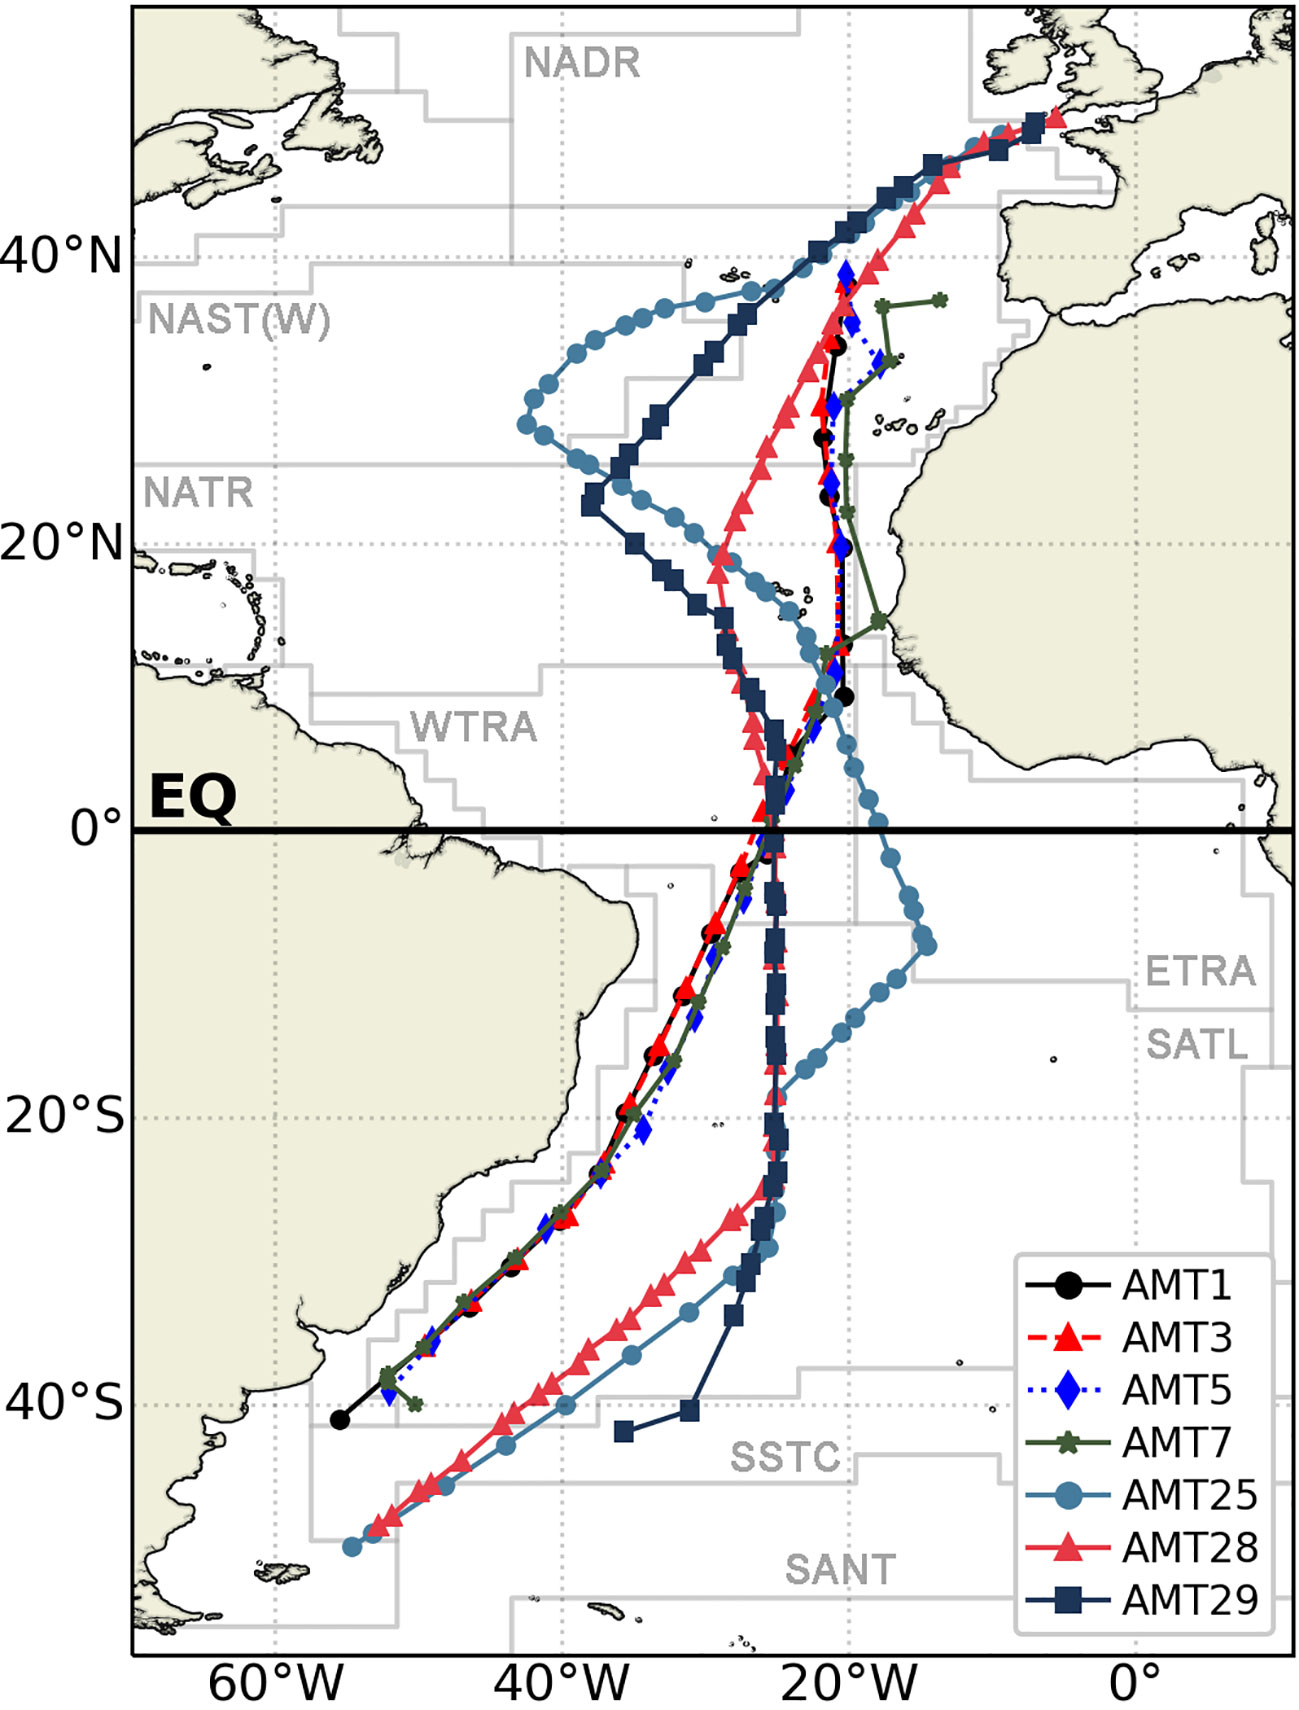
Figure 1 Map of AMTs tracks. AMT1,3,5,7, 25, 28, 29, superimposed on the Longhurst provinces.
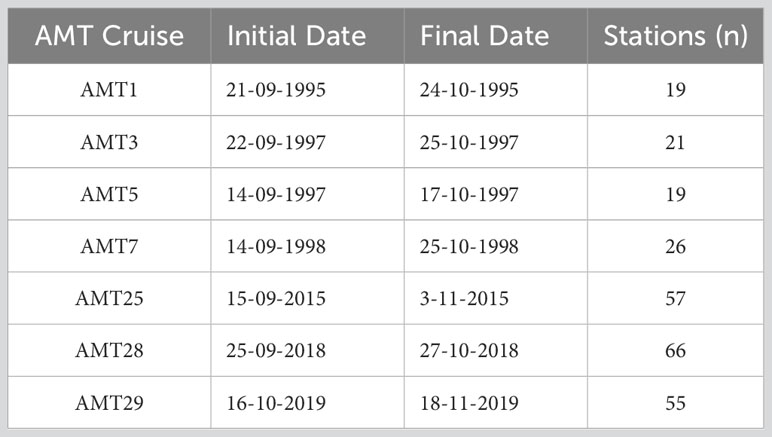
Table 1 Dates for the AMT cruises considered for comparison of species, number of stations with microscopy observations.
Regression analyses were performed of the matchups of satellite-derived size class Chla and the in situ carbon biomass of the three size classes, estimated from the cellular carbon content described above. A matchup was between the in situ data and the satellite retrievals for the same location and the same day; obviously, these were limited by cloud cover masking the sea-surface from the satellite sensor. Microplankton was computed as the sum of diatoms and dinoflagellates, nanoplankton as the sum of coccolithophores, Cryptophyte and other NEUK, and picoplankton the sum of Prochlorococcus, Synechococcus and PEUK. There were a total of 15 matchups for AMT28 and 17 for AMT29. All Chla data were logarithm 10 transformed prior to analysis.
A Bray-Curtis analysis (Bray and Curtis, 1957) was performed to determine the similarity/dissimilarity between regions sampled in all AMTs. Data on species from AMTs 1, 3, 5, 7, 25, 28 and 29 with concentrations higher than 1x10⁴ cells L-1 were gathered; the Bray-Curtis analysis was performed on non-transformed data. To better visualise these relationships, a classification analysis was made using hierarchical agglomerative clustering of the samples and group-average linking (Field et al., 1982). During the construction of the dendrogram, the significant difference of every group of samples was tested by the similarity profile routine (SIMPROF, Clarke et al., 2008). Calculated for every node, the SIMPROF analysis is a permutation test of the null hypothesis that the set of samples below any given node of the dendrogram does not differ from each other or show any significant multivariate structure. For each test, 1000 permutations were applied to calculate a mean similarity profile, with a chosen significance level of 5%. The taxa mainly responsible for the average Bray-Curtis dissimilarity between the a posteriori significantly different clusters of samples, as well as intra-group similarity, were selected and sorted by SIMPER analysis (Clarke, 1993). All these analyses and routines were performed using tools found in PRIMER® 6 software package (PRIMER-E, Plymouth, UK).
A principal component analysis (PCA) was performed to understand how environmental patterns (Chla, SST, salinity, macronutrients, depth of the nutricline) shaped the surface distribution of taxonomic groups, using data from both cruises (n=111). Data were standardized (value-average divided by standard deviation) prior to running the analysis. The PCA was run using the sklearn module in python 3.8.8 (Pedregosa et al., 2011).
The tracks of AMT28 and AMT29 across the Atlantic Ocean, plotted over cruise-averaged images of Chla, SST and AOT) are shown in Figure 2. SST showed the expected latitudinal distribution and was very similar between cruises, in fact, the one-month lag difference is only noticeable around 40oN. The Chla showed similar patterns for AMT 28 and 29 with low Chla in the oligotrophic gyres in the north and south Atlantic, though with a larger extent on AMT29 reflecting the later timing of this cruise (and, hence, later in austral Spring). Higher Chla values appeared at higher northerly or southerly latitudes while enhanced values north of the equator are probably associated with equatorial upwelling and the extension offshore to the west of Africa due to eastern boundary upwelling. The AOT 550nm cruise composite data were markedly different between the cruises, with Saharan dust plumes extending offshore between 10°N and 22oN during AMT28 and lower values on AMT29.
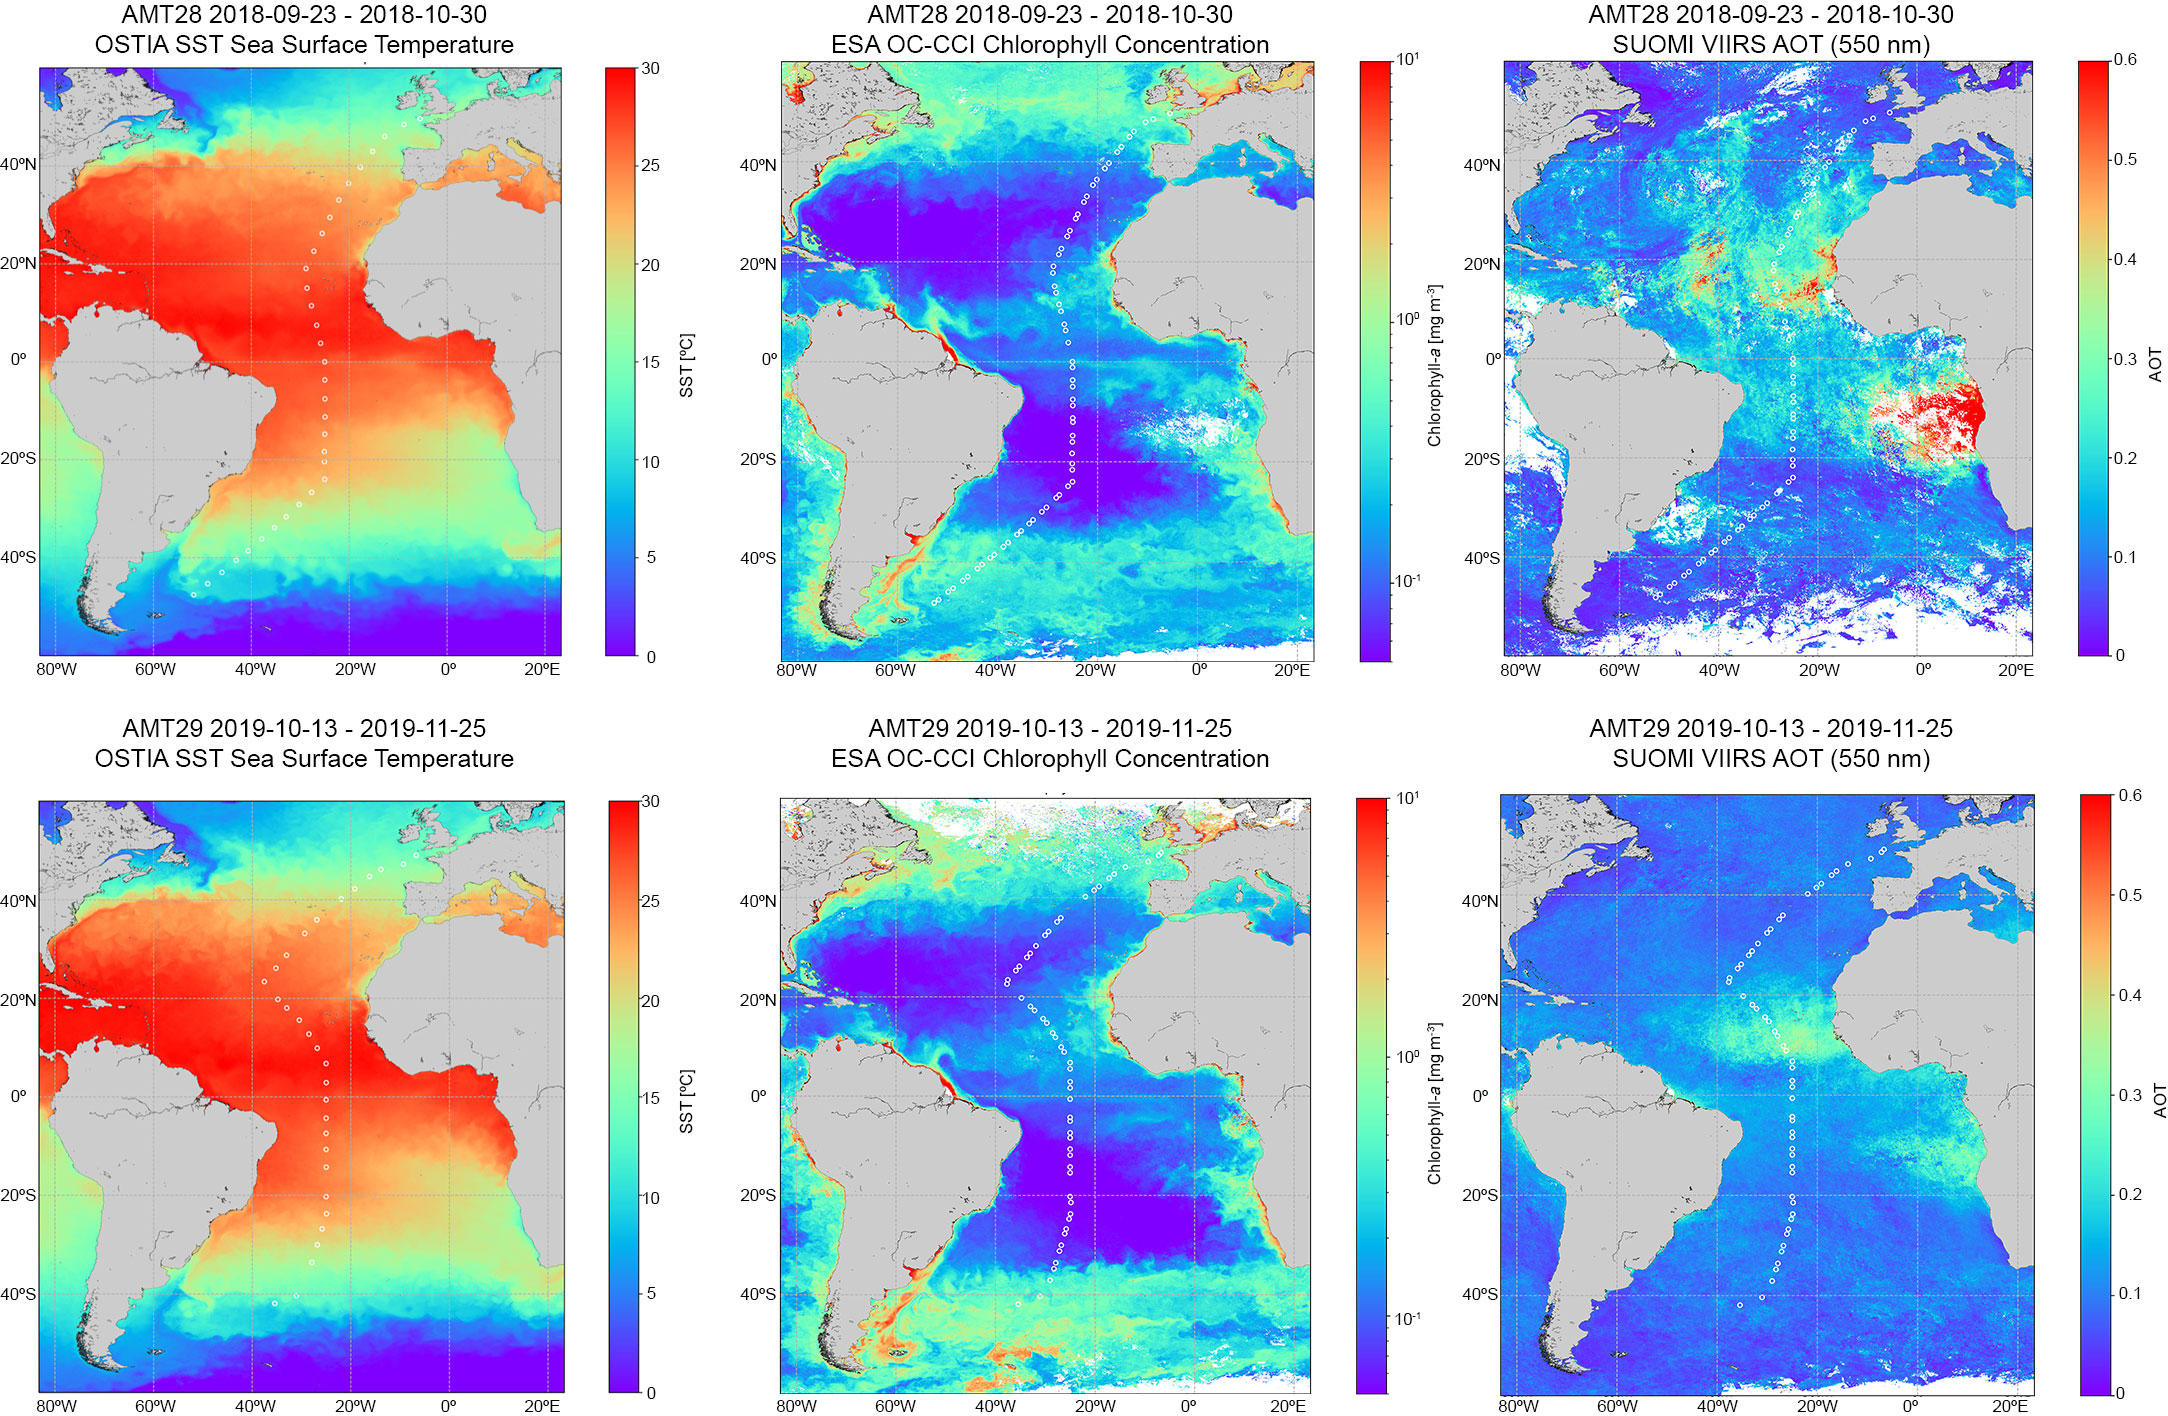
Figure 2 Composite images of Sea Surface Temperature (SST), (left): Chla mg m-3 (middle): Aerosol Optical Thickness (AOT), (right) for AMT28 (top) and AMT29 (bottom), for the entire cruise period.
Figure 3 shows the nutrient concentration between the surface and 200m depth along the transects. The Nutricline was plotted as the isoline of NOx = 1μmol L-1, following Moore et al. (2009). The North-South nutrient distribution followed the same general pattern in both cruises, with higher concentrations reaching the surface at the higher latitude regions of both hemispheres (from 40°-50°N and 40°-50°S) but more notably in the South Atlantic. The highest concentrations of all macronutrients were observed at greater water depths between 18°N-10°S, where the nutricline was shallower (reaching its shallowest position to the north of the equator ~40 m water depth at 5-15°N) and at the equator (70-80 m water depth). At the higher-latitude regions during both AMTs, enhanced mixing-induced nutrient supply to the surface was more notable in the southern hemisphere, possibly linked to the Malvinas Current.
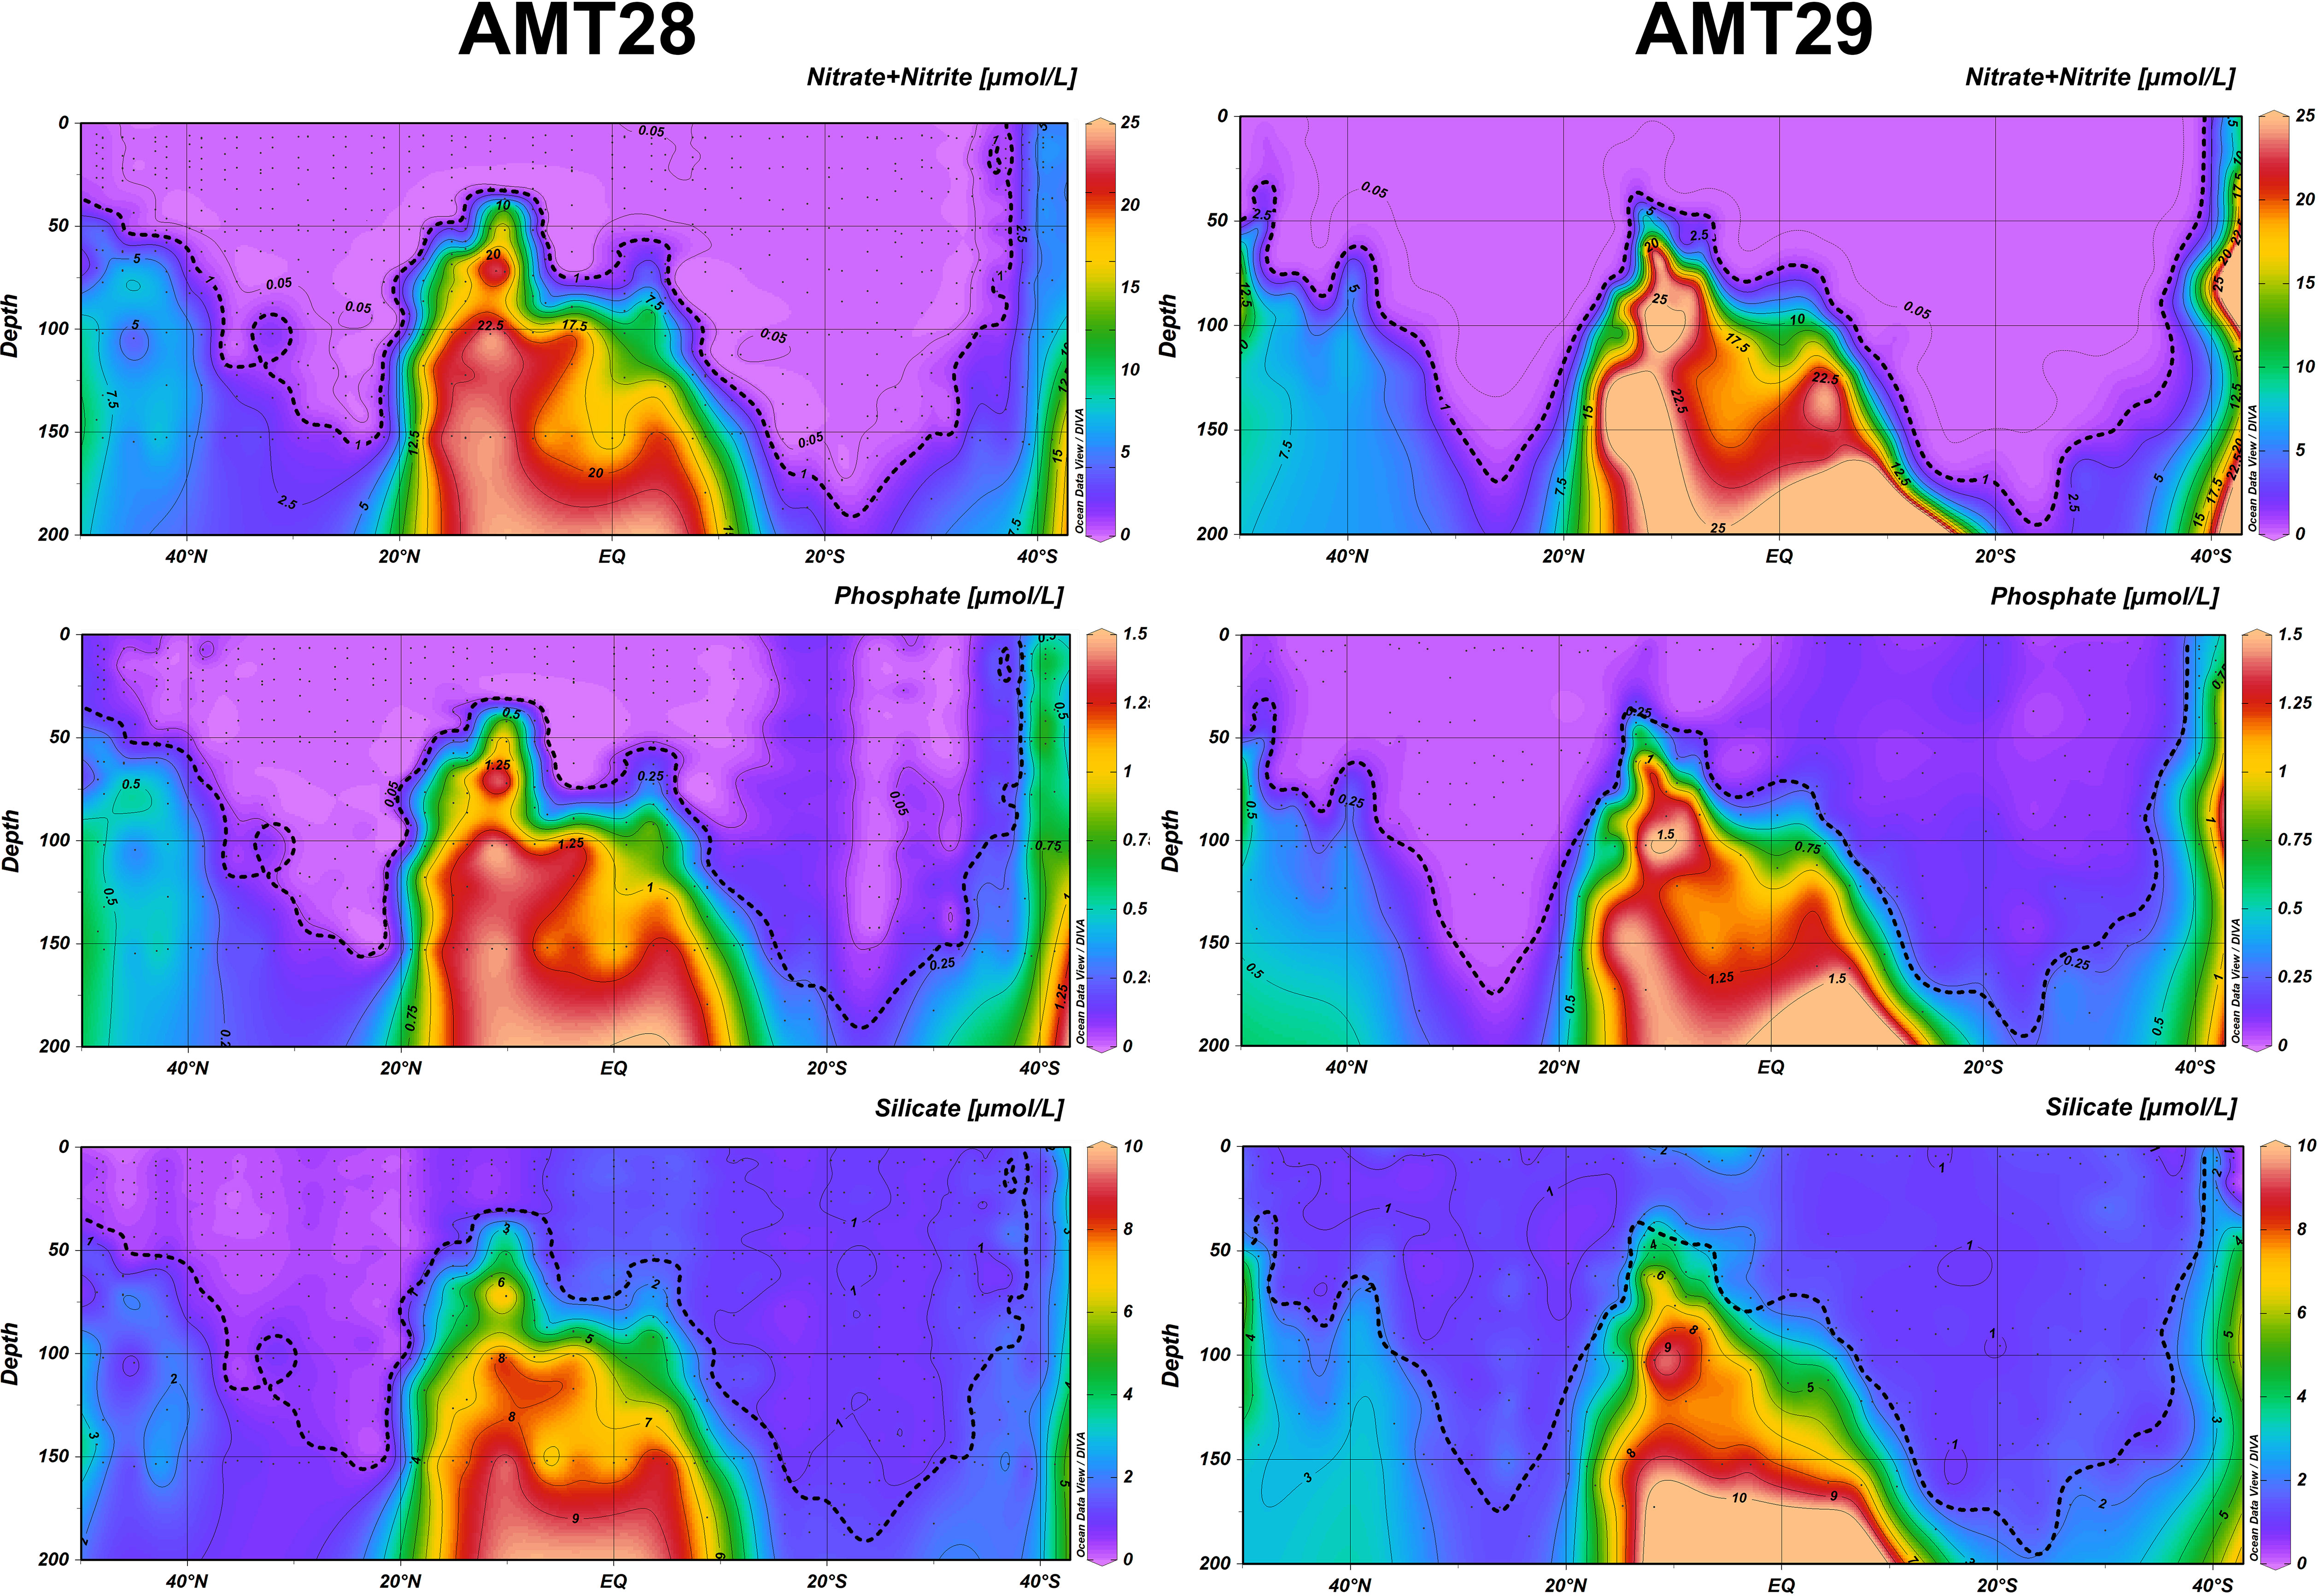
Figure 3 Concentration of nitrate+nitrite, phosphate and silicate for AMT28 (Left) and AMT29 (Right). The isoline of 1 µmol L-1 NOx is plotted in all graphs.
Phytoplankton relative composition for AMT28 and AMT29 for ten groups, along with the concentration of Chla is illustrated in Figure 4. Biomass (derived from cell concentration) was expressed as mg Carbon m-3, to allow for a comparison of the various groups, hence, it should be highlighted here that values of carbon content per cell are strongly dependent on the cell biovolume. Cell biovolume ranged from 0.11 (Prochlorococcus) to 1.23 x 106 μm3 (the large diatom Rhizosolenia styliformis) hence, spanning 7 orders of magnitude. For diatoms, ADinos, HDinos, and filamentous Cyanobacteria, cell abundance was determined by microscopy, whereas for coccolithophores < 10 μm, NEUK, Cryptophytes, PEUK, Prochlorococcus and Synechococcus it was determined by Flow Cytometry. It should be noted that AMT29, due to bad weather conditions, had fewer sampling stations in the South Atlantic Gyre (SATL) province and none in South Atlantic Subtropical Convergence (SSTC).
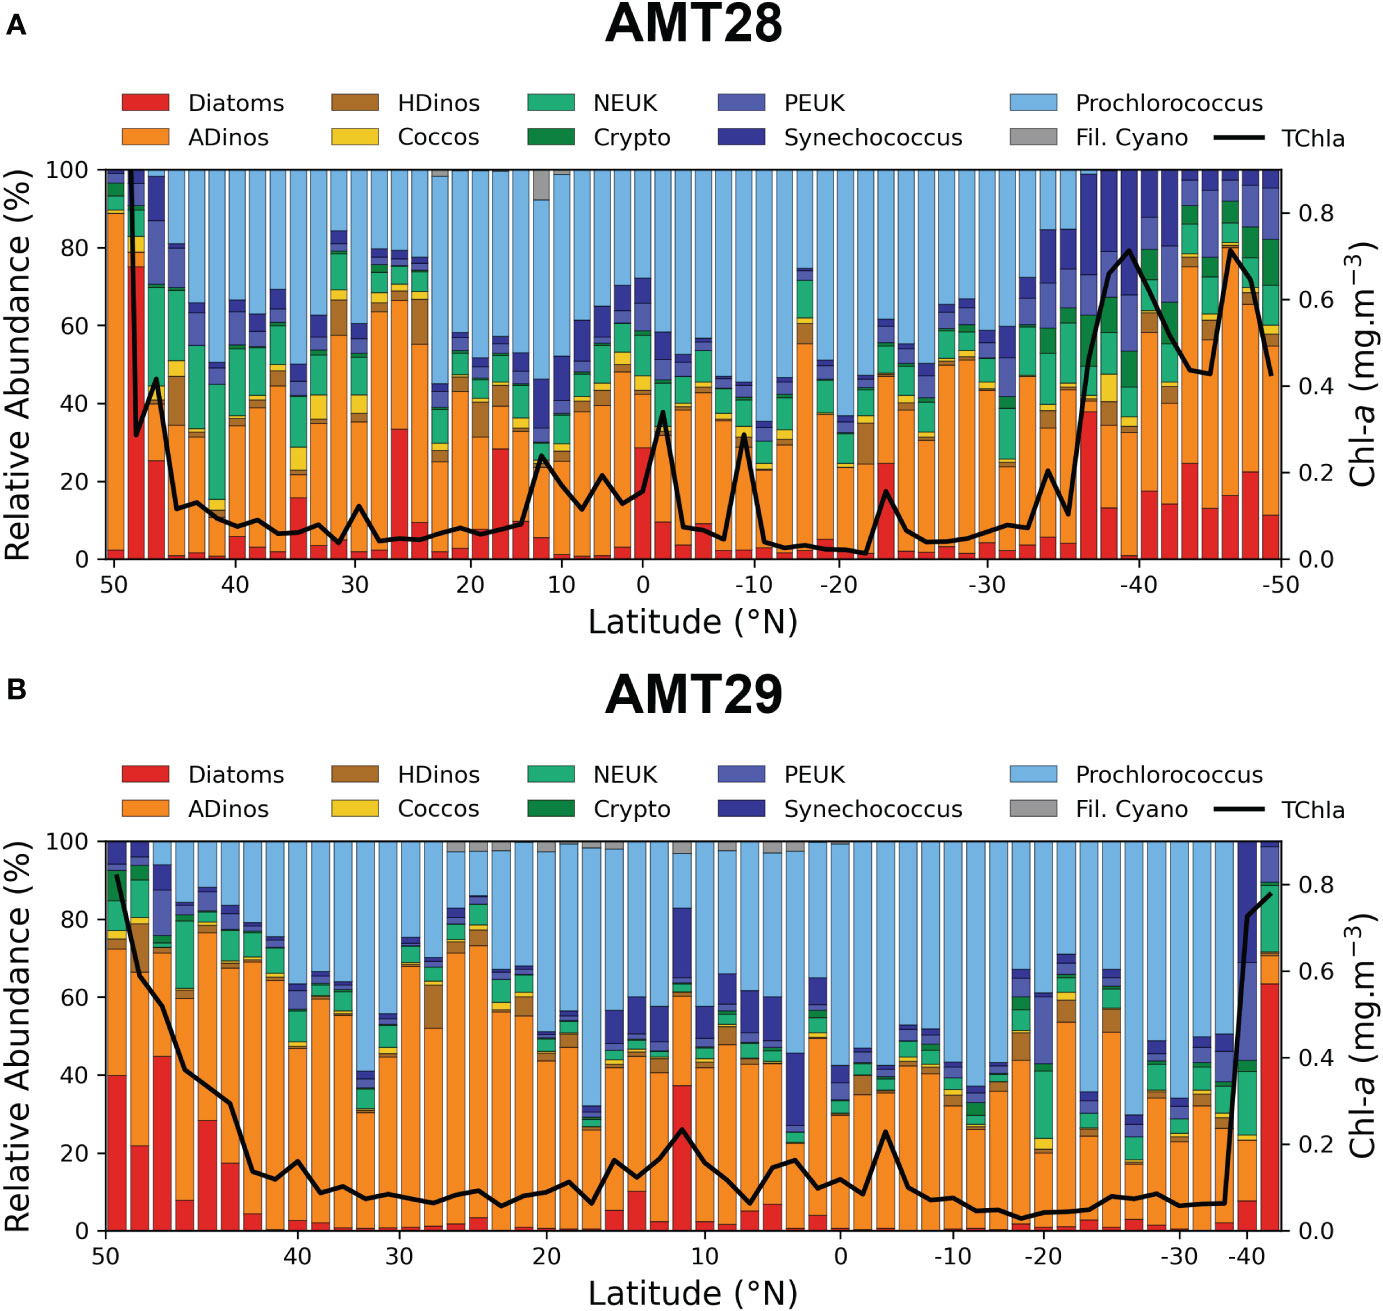
Figure 4 Relative abundance of major phytoplankton groups in surface samples, enumerated by FC (Prochlorococcus, Synecoccocus, PEUK, NEUK, Cryptophytes, or microscopy (diatoms, dinoflagellates and filamentous Cyanobacteria) and estimated in mg Carbon m-3, along the AMT transect (N-S), Chla mg m-3 value is also plotted. The correspondence between groups and size classes is given by the colour code: Picoplankton – blue tones, Nanoplankton – yellow and green, Microplankton – Red and Brown. Note that Chla in the 1st station of AMT28 is not plotted as the value was 2.89 mg m-3. Note that AMT29 was sampled only until 35oS. AMT28 (top), AMT29 (bottom).
Other taxa were counted by microscope, namely the Haptophyte Phaeocystis, and species from the classes Prasinophyceae and Euglenophyceae, but with very low biomass values across the transect, (always less than 1% of total biomass), and were excluded from the plots. Coccolithophores abundance only accounted for the cells enumerated by flow cytometry; hence, the biomass contribution of this group in the figure is underestimated.
The spatial distribution of the different phytoplankton groups in AMT28 and AMT29 presented the same general pattern with high abundance of diatoms and dinoflagellates (higher than 103 cells L-1) in higher latitudes, and picoplankton carbon biomass (comprising PEUK, Synechococcus and Prochlorococcus) over 40% of total biomass from 20oN to 40oS on both cruises. Also, in both cruises, a clear increase in Chla was noticeable in the region around the Equator (where nutrient concentrations increased within the photic zone, and above the nutricline). The dominance of picoplankton is clear in the ocean gyres, where Prochlorococcus is the most abundant taxa in the majority of the stations, and it was replaced by Synechococcus when the NOx values were above ~0.1 μmol L-1; PEUK had similar distribution and abundance to Synecoccocus. COCCOS, HDinos and NEUK were the least important groups in terms of carbon contributions, and did not show a clear meridional distribution, i.e., occurring both in the oligotrophic gyres where Prochlorococcus dominated, but also in the more productive regions where diatoms and ADinos were more abundant.
There are differences in the relative abundance between the two AMTs, regarding diatoms and dinoflagellates, as whilst diatoms are more abundant in AMT28, both ADinos and HDinos presented clearly higher biomass in AMT29, with ADinos being the dominant taxa north of 20oN. Another major difference was the occurrence of the bloom of the autotrophic dinoflagellate Prorocentrum cordatum, with 1.9 x10⁶ cells L-1, contributing to a Chla value of 2.83 mg m-3, located in the northern station of AMT28 (49.63oN), and absent in AMT29.
Non-heterocystous filamentous Cyanobacteria included two species: Trichodesmium erythraeum and Oscillatoria limosa, the former was largely more abundant, appearing in both cruises in the Tropical region north of the Equator, on AMT28, from 22°N to 7oN, and on AMT29, from 5°N to 25oN, in the surface samples, but also at the DCM (Figure 5), although in low quantities.
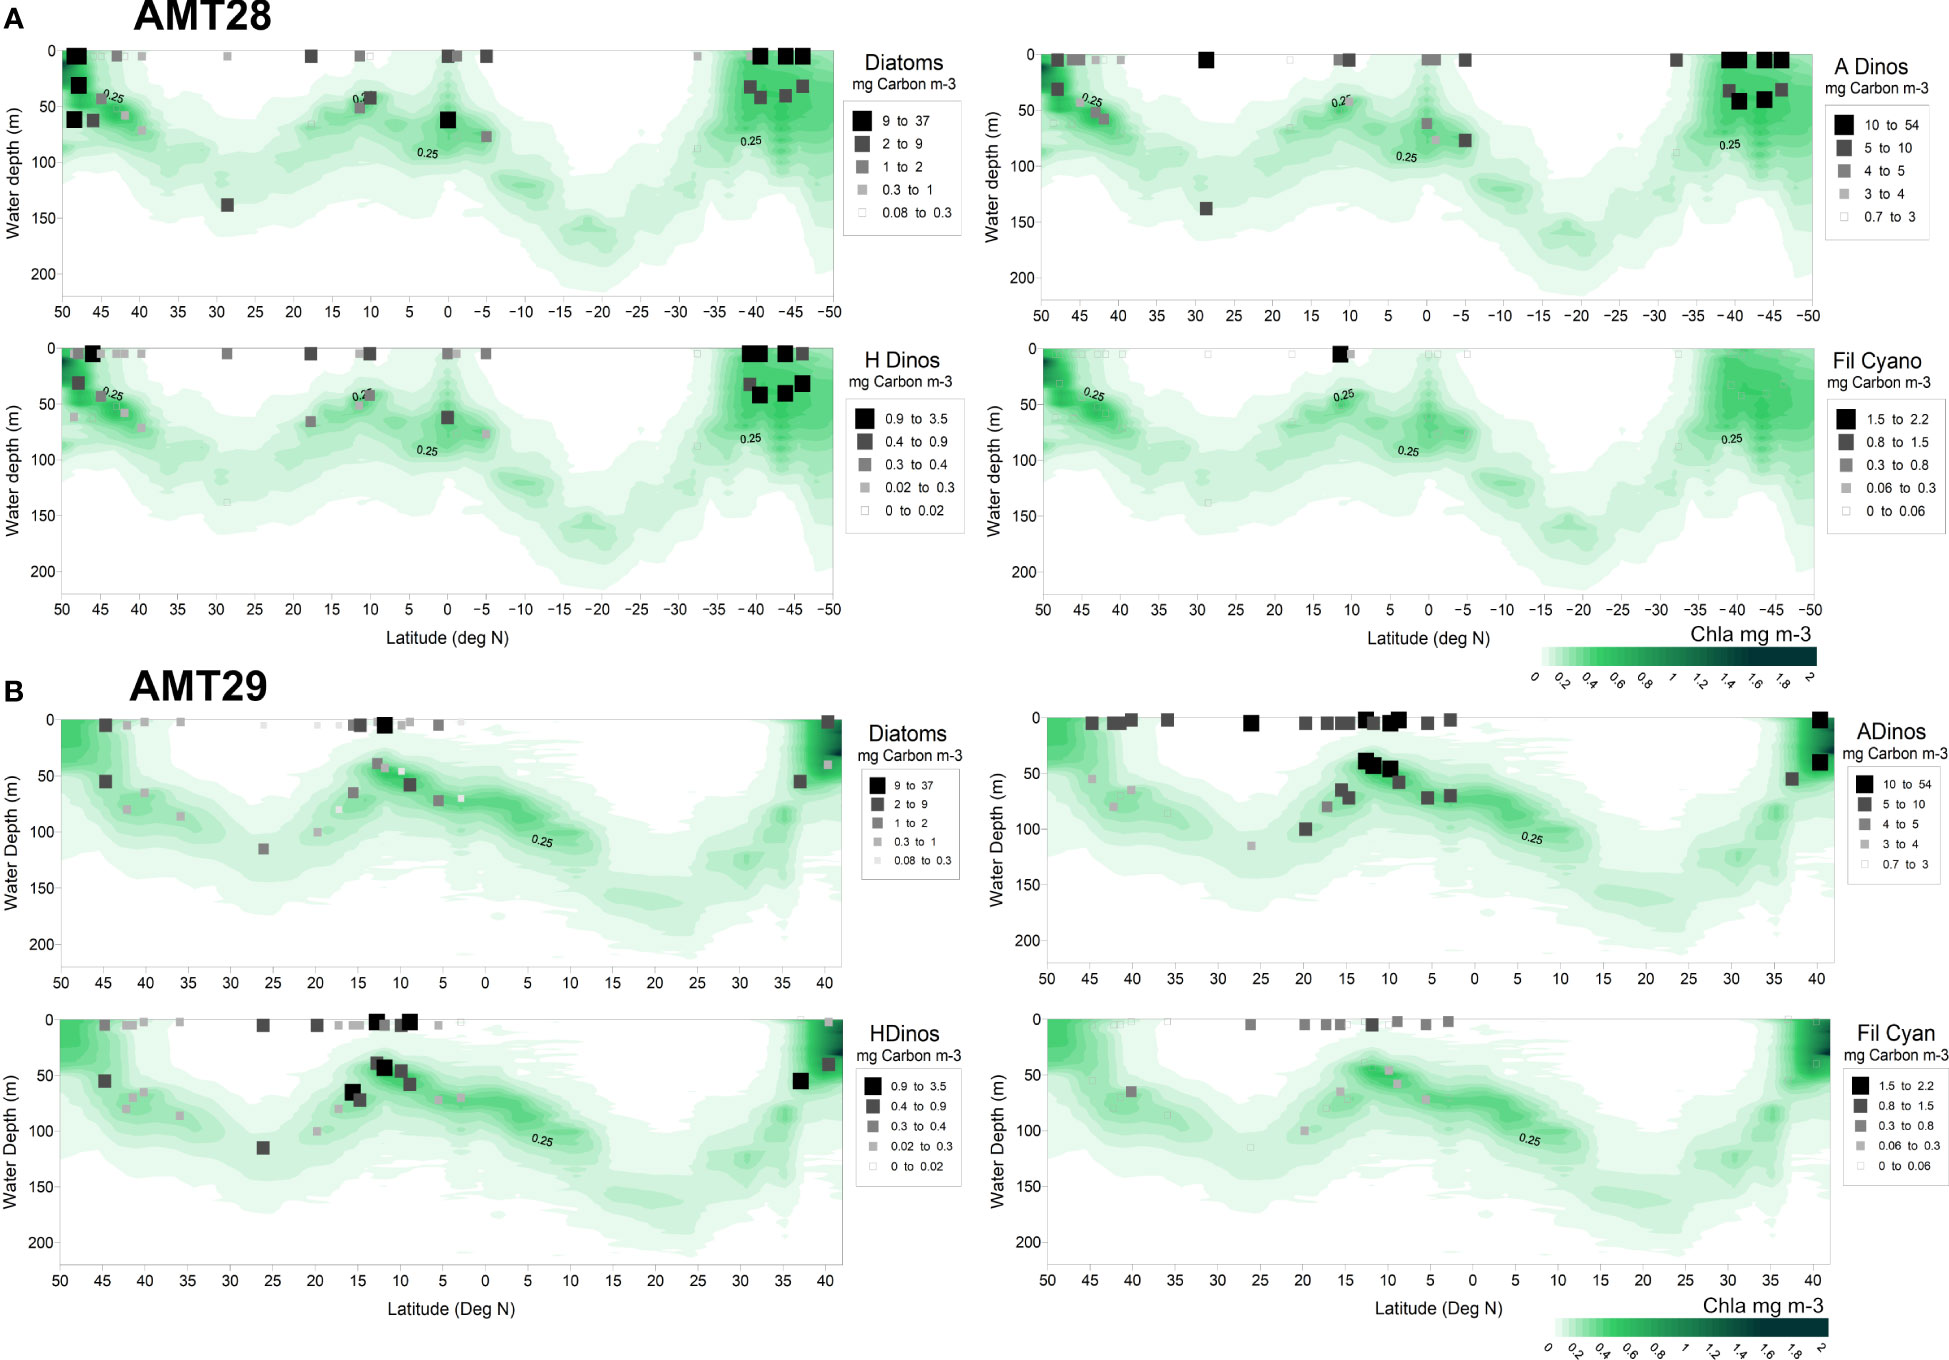
Figure 5 Surface and DCM carbon biomass (mg Carbon m-3) of microplankton taxa plotted over Chla values (measured with CTD fluorometer). AMT28 (A), AMT29 (B).
The biomass results (in mg Carbon m-3) obtained for diatoms, ADinos, HDinos and filamentous Cyanobacteria, for the stations sampled in surface and DCM, are plotted in Figure 5, superimposed on the integrated Chla profile (measured by CTD fluorescence) down to 200m depth, and showed that biomass of each group was higher at the surface than at the DCM, in most stations, which allowed for a more detailed analysis of the more abundant species in surface samples only.
The pigment approach to derive phytoplankton size classes has been extensively used in oceanographic studies, and it is presented here as a complementary analysis to the cell enumeration data presented in Figures 4 and 5. Figures 6A, B show the community composition in terms of size classes, for surface samples, for both AMT28 and AMT29. All size classes (pico-, nano-, microplankton) increased in the higher-latitude regions during both expeditions. Picoplankton was the group increasing the most between 10°N and 10°S, whilst micro- and nanoplankton were more important at higher latitudes (i.e., > 40°N and > 30°S). Whereas the values for TChla and TCarbon for AMT 28 and AMT29 surface samples are displayed in Figures 6C, D. The common patterns between the two cruises were: i) the overall distribution of Chla, with highest values in higher Northern and Southern latitudes, very low values in oceanic gyres, and an increase in the equatorial region (10oN to 10oS): ii) in higher latitudes, both micro-and nanoplankton contributed to the high Chla values, whereas, within the region between 15°N to 10°S, the several small peaks observed are mostly due to an increase in the nanoplankton fraction, iii) the median values in both cruises were almost the same: 0.092 and 0.091 mg Chla m-3 for AMT28 and AMT29, respectively.
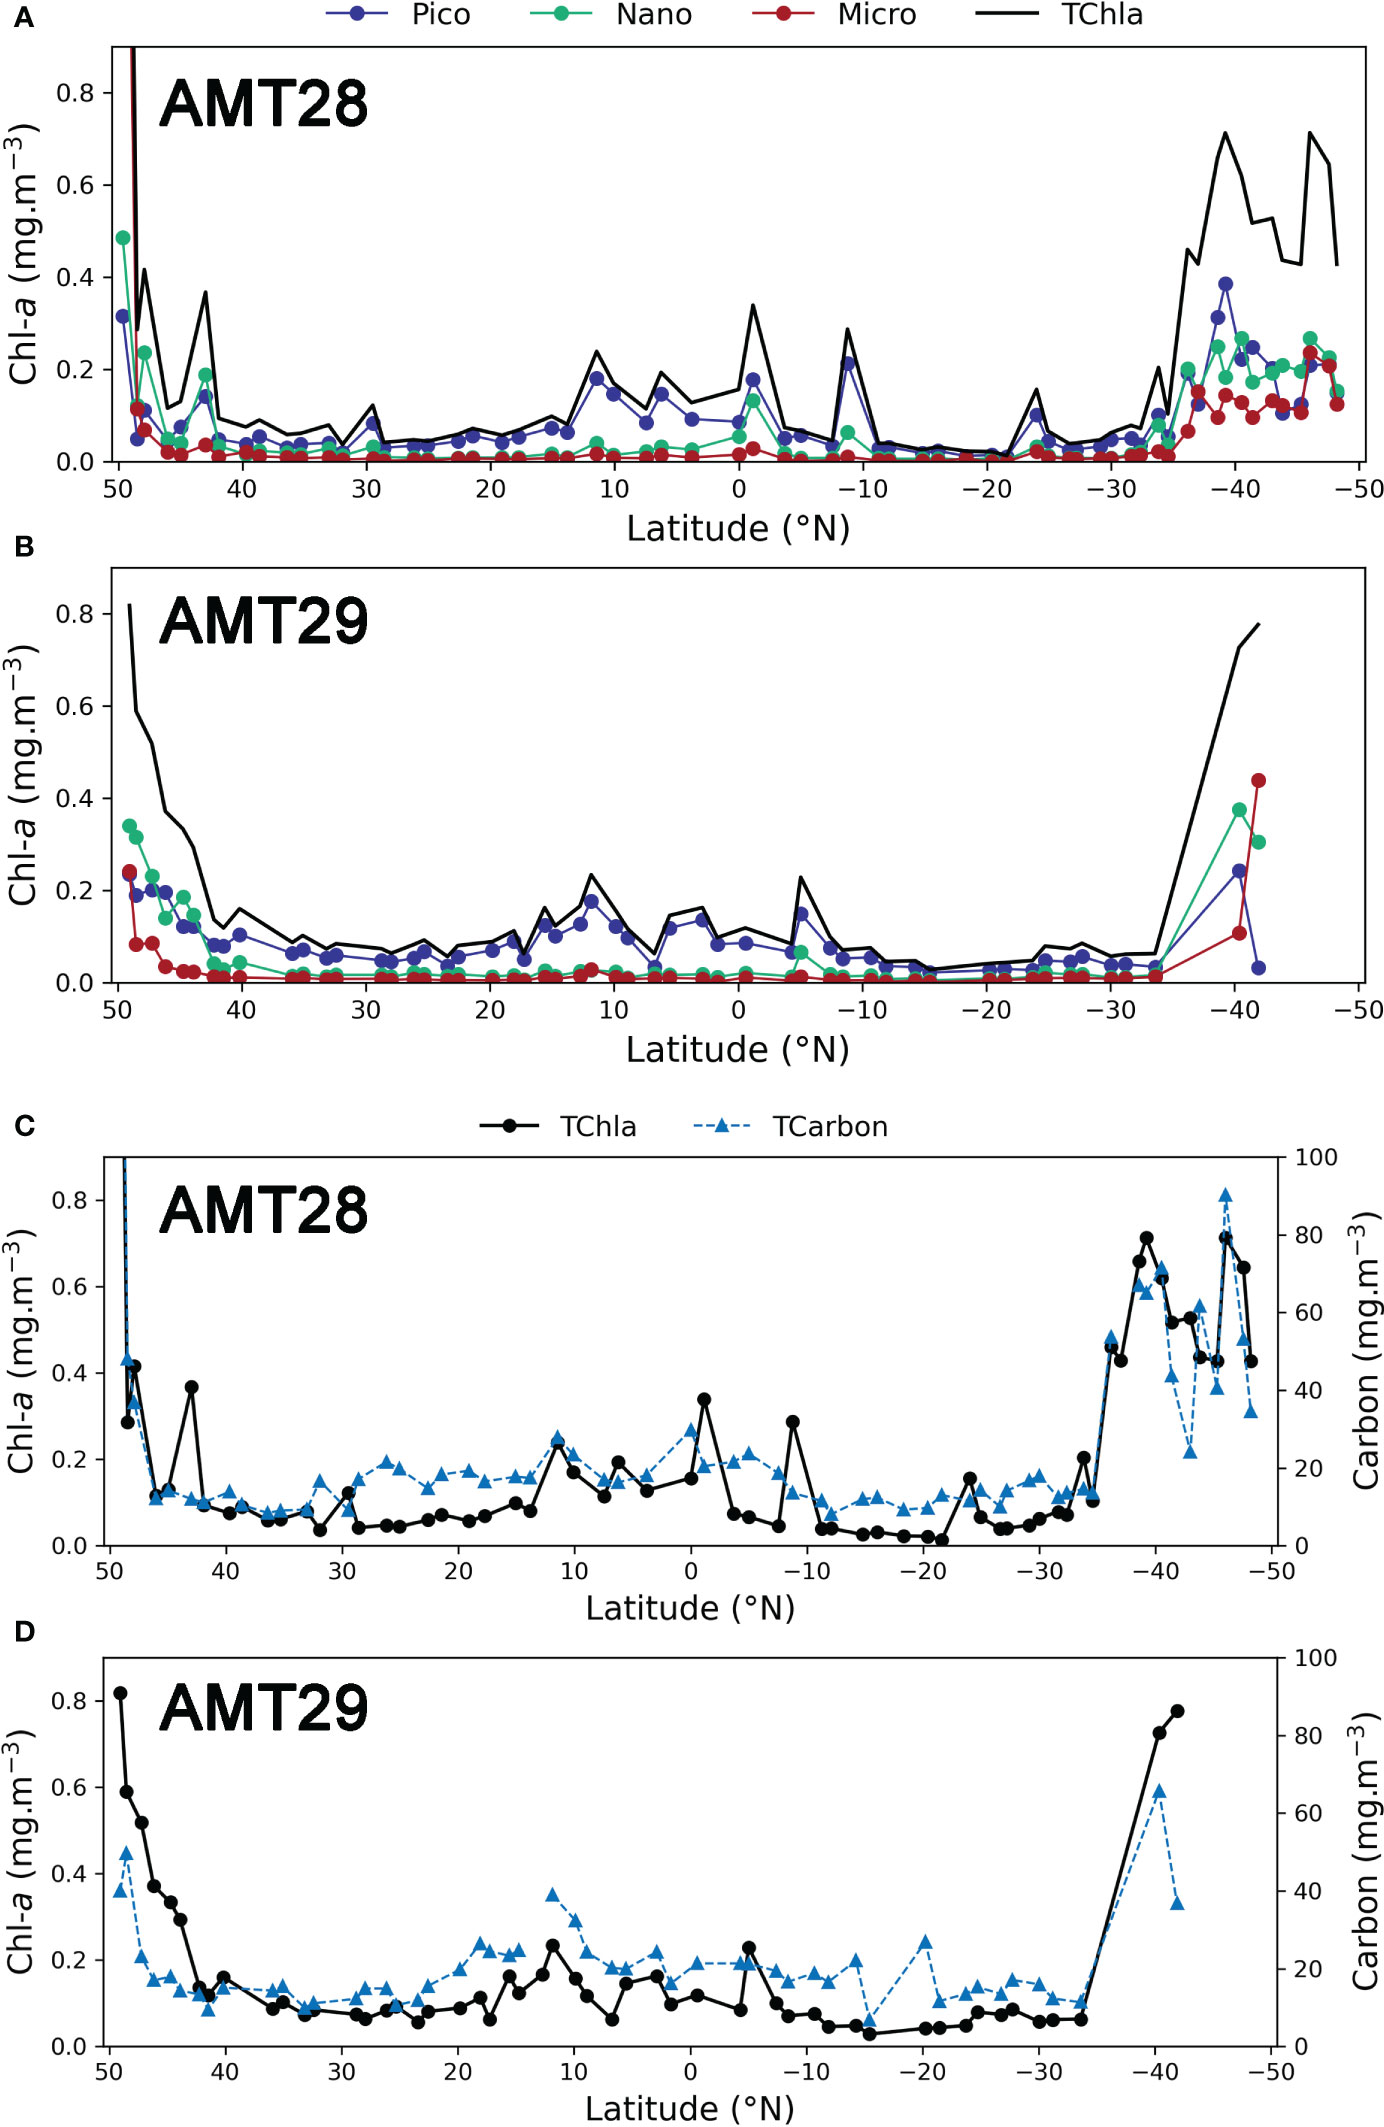
Figure 6 Distribution of TChla (mg m-3) and Chla for each size class: pico-, nano- and microplankton determined by pigment’s concentration for surface stations. AMT28 (A) and AMT29 (B). TChla and TCarbon (mg m-3), determined by cell enumeration. AMT28 (C), AMT29 (D).
The main difference was the high Chla value in AMT28 at 49oN, due to the Prorocentrum cordatum bloom in the English Channel, which reached of 326 mg Carbon m-3.
The taxonomical structure of the community determined by cell enumeration and expressed as carbon biomass was fitted into the three size-class classification as described above. Table 2 discriminates the median values for TCarbon, and the relative distribution of the total community by size classes through the oceanic provinces determined as above. Interestingly, the overall median for both cruises gave the same result: 17 mg Carbon m-3. The results evidence the spatial distribution of phytoplankton community along the North-South track in the Atlantic, with values of 10-15 in the oceanic gyres, and above 18 in North Atlantic Drift (NADR). The highest median value of 47 mg Carbon m-3 was observed for the SATL region in AMT28, where microplankton carbon biomass fraction reached almost 70%; we split the vast SATL region into two areas, at latitude 27oS, separating the gyre from the more productive southern SATL. The minimum values observed in both cruises were similar: 8 mg Carbon m-3 for AMT28 at 12°S and 7 mg Carbon m-3 for AMT29 at 15°S.
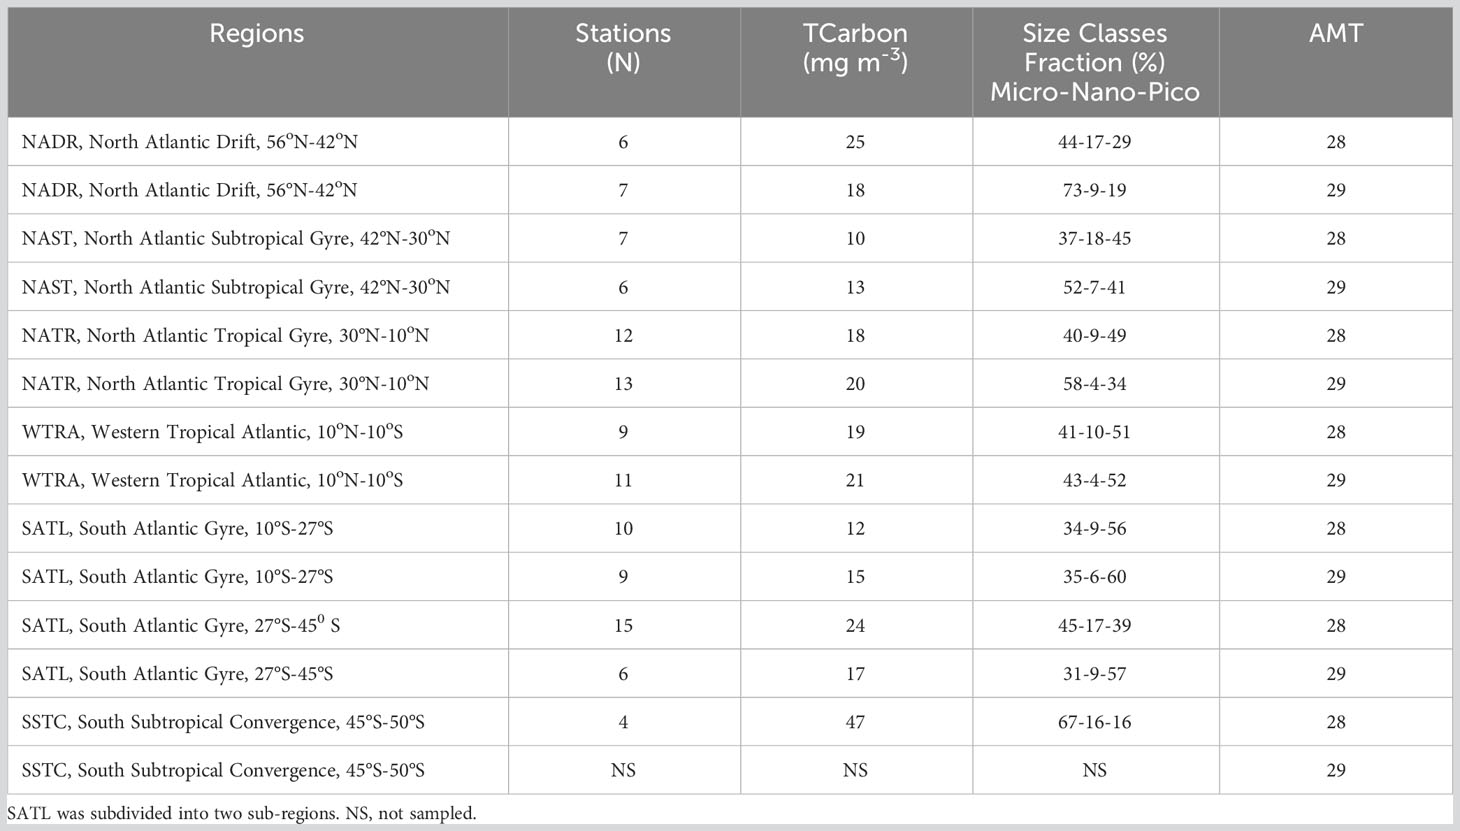
Table 2 Median values of TCarbon, in mg m-3, and median values of the percentage of micro- nano- and pico-plankton for each biogeographic oceanic province, for AMT28 and AMT29.
Using satellite imagery, the following products were derived: the relative contribution of micro-, nano- and picoplankton, as well the contribution of diatoms and dinoflagellates, according to Brewin et al. (2017). Cruise composite images of Chla (mg m-3) for each size class, for the total period of the cruises are displayed in Figure 7. The large-scale nutrient distribution affects all three size classes, as all classes present higher abundance in high-latitude regions and lower in oligotrophic gyres. However, the response of cells to nutrient enrichment scales up according to cell size. Picoplankton was present in all latitudinal regions, becoming dominant in low-nutrient gyres, where micro- and nanoplankton attain minimum values. Nanoplankton taxa biomass increased in tropical Atlantic and higher latitudes, whereas Microplankton fraction presented high values only in high northern and southern latitudes.
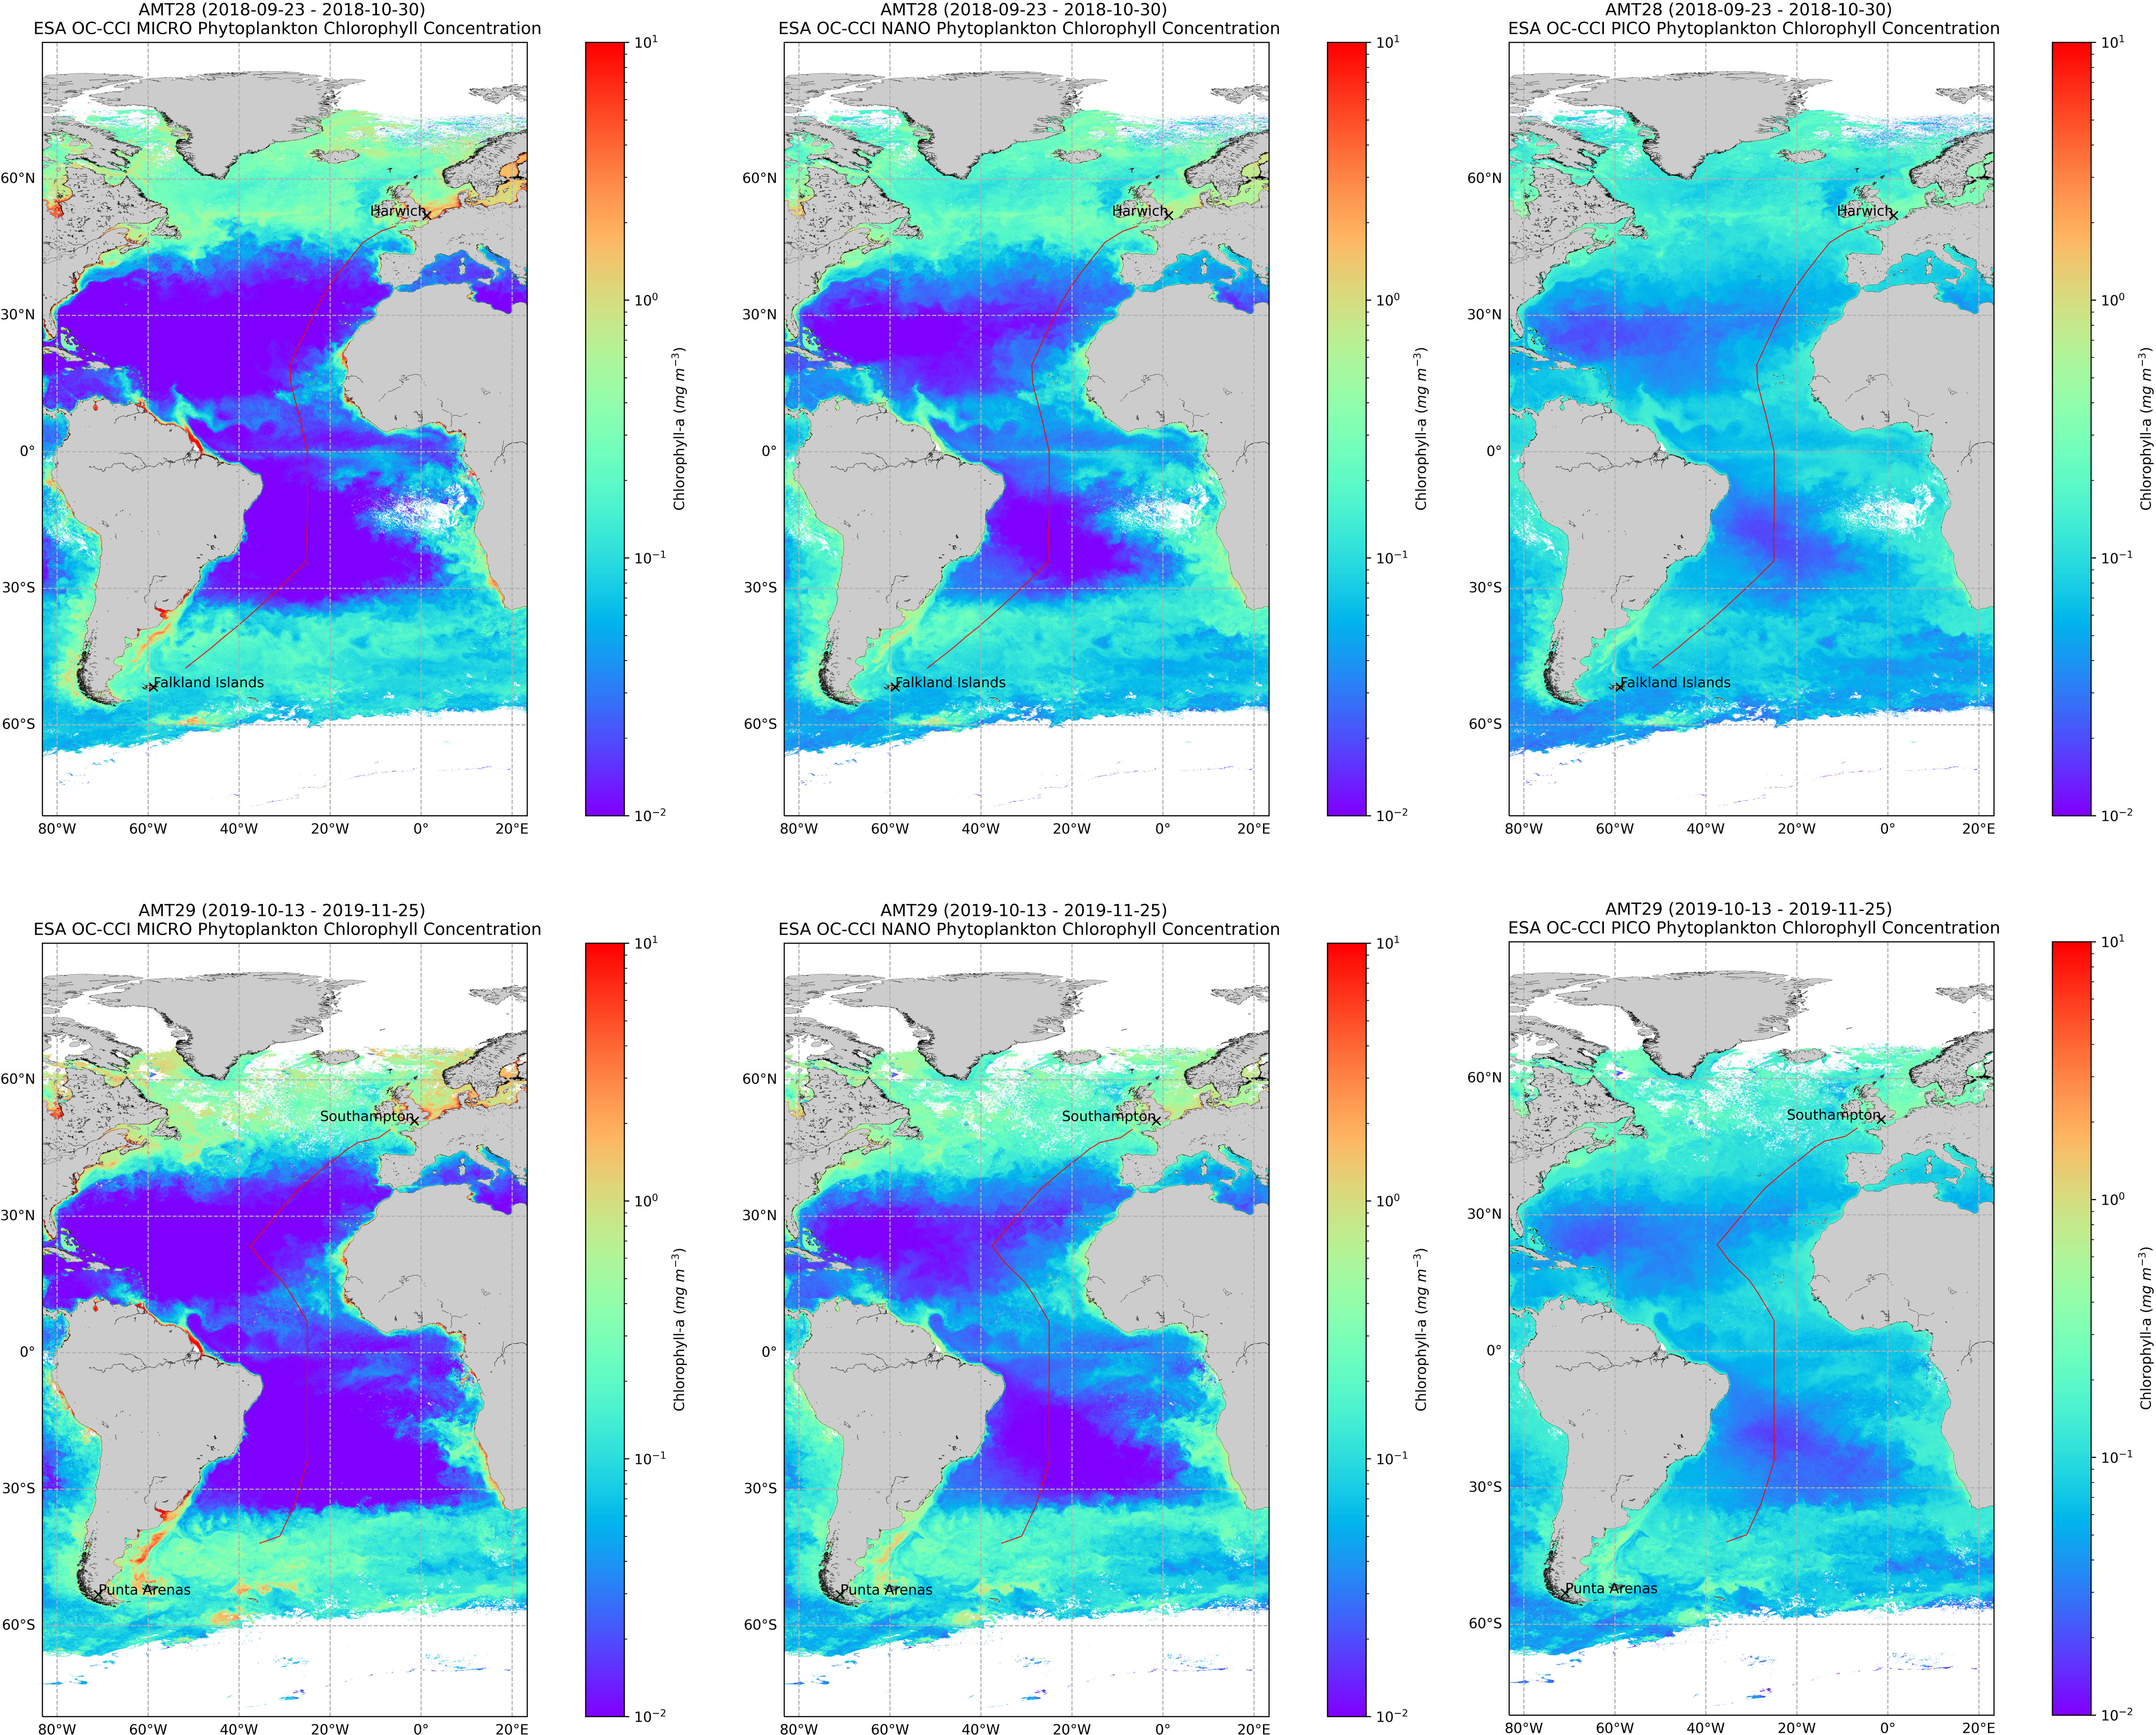
Figure 7 Concentration of phytoplankton size classes, obtained from OCCCI 1 km version 6, average for the cruise period. Composite image of Chla (mg m-3) for each size class, for AMT28 (top) and AMT29 (bottom).
The number of daily matchups between satellite and in situ data found was 15 for AMT28 and 17 for AMT29, so the comparison analysis was made on samples of the two cruises together. For the in situ, the total carbon of the three size classes was computed as described above. The results in Table 3 showed significant correlation values (r2) for the three size classes, as well as when considering diatoms and dinoflagellates separated.
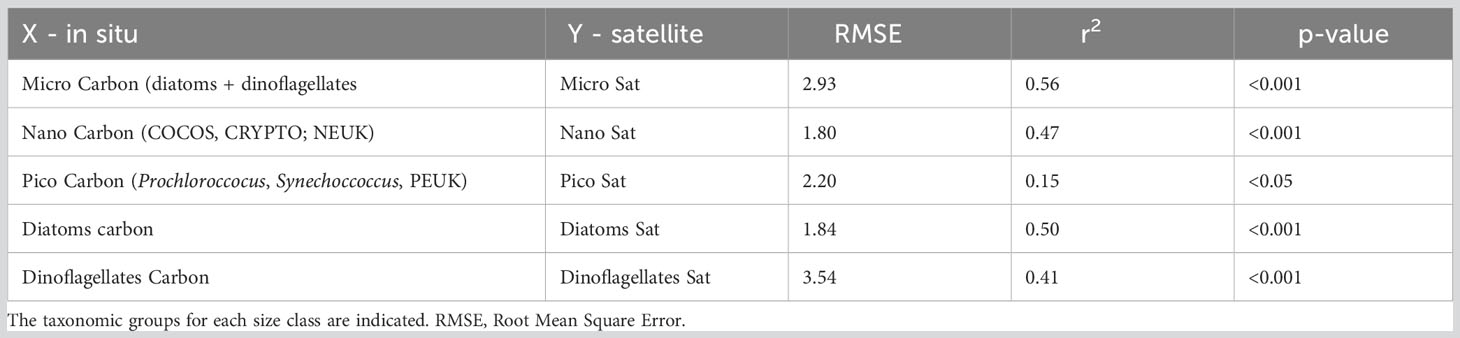
Table 3 Results of linear regression Type II in log-transformed data of satellite products (Brewin et al., 2017) and in situ carbon, in 31 match-ups for AMT28 and AMT29, for size classes Micro-, Nano- and Picoplankton and for the diatoms and dinoflagellates.
A total of 30 diatom taxa, 156 dinoflagellate taxa and three filamentous Cyanobacteria taxa were identified during AMT28 and AMT29 (see Supplementary Material, Table 1). Our taxonomic criteria followed as much as possible those presented by Sal et al. (2013), in order to compare phytoplankton species occurrence and abundance with previous AMT studies.
Data from diatoms, dinoflagellates and filamentous Cyanobacteria obtained during AMT28, AMT29 presented here were compared to data from AMT25 (Brotas et al., 2022) and from the earlier AMT1, 3, 5, 7, all of which also took place during boreal Autumn. While all cruises followed the same general meridional latitudinal track, AMT25 and AMT28 extended further south compared to the other cruises (Figure 1). In terms of longitude, significant track differences occurred in the northern part of NATR, with AMT25 and AMT29 being ca 20o displaced to the east compared to the other track cruises, and thereby following a more open-ocean route, AMT29 being the furthest east.
The present analysis is focused only on the most abundant species in these seven cruises, i.e., only species which “bloomed” (where a bloom was considered when the cell concentration was higher than 104 cells L-1); it should be noted that for Trichodesmium spp. the bloom was defined not by the number of filaments, but by the number of cells L-1.
These species are enumerated in Table 4 and were used in the cluster analysis. The table classified each diatom and dinoflagellate species according to two simple criteria, namely size (greater or lesser than 17.5 μm ESD, thus separating species belonging to nano or microplankton size fraction, respectively), and colonial versus unicellular/short chains. For diatoms, species were also classified as centric or pennate (thus belonging to the order Centrales or Pennales, respectively). Categories such as Pennate group (10-30 μm), or Athecate dinoflagellates, where the genus is not discriminated, are present in Sal et al. (2013), and were also frequently observed in our samples.
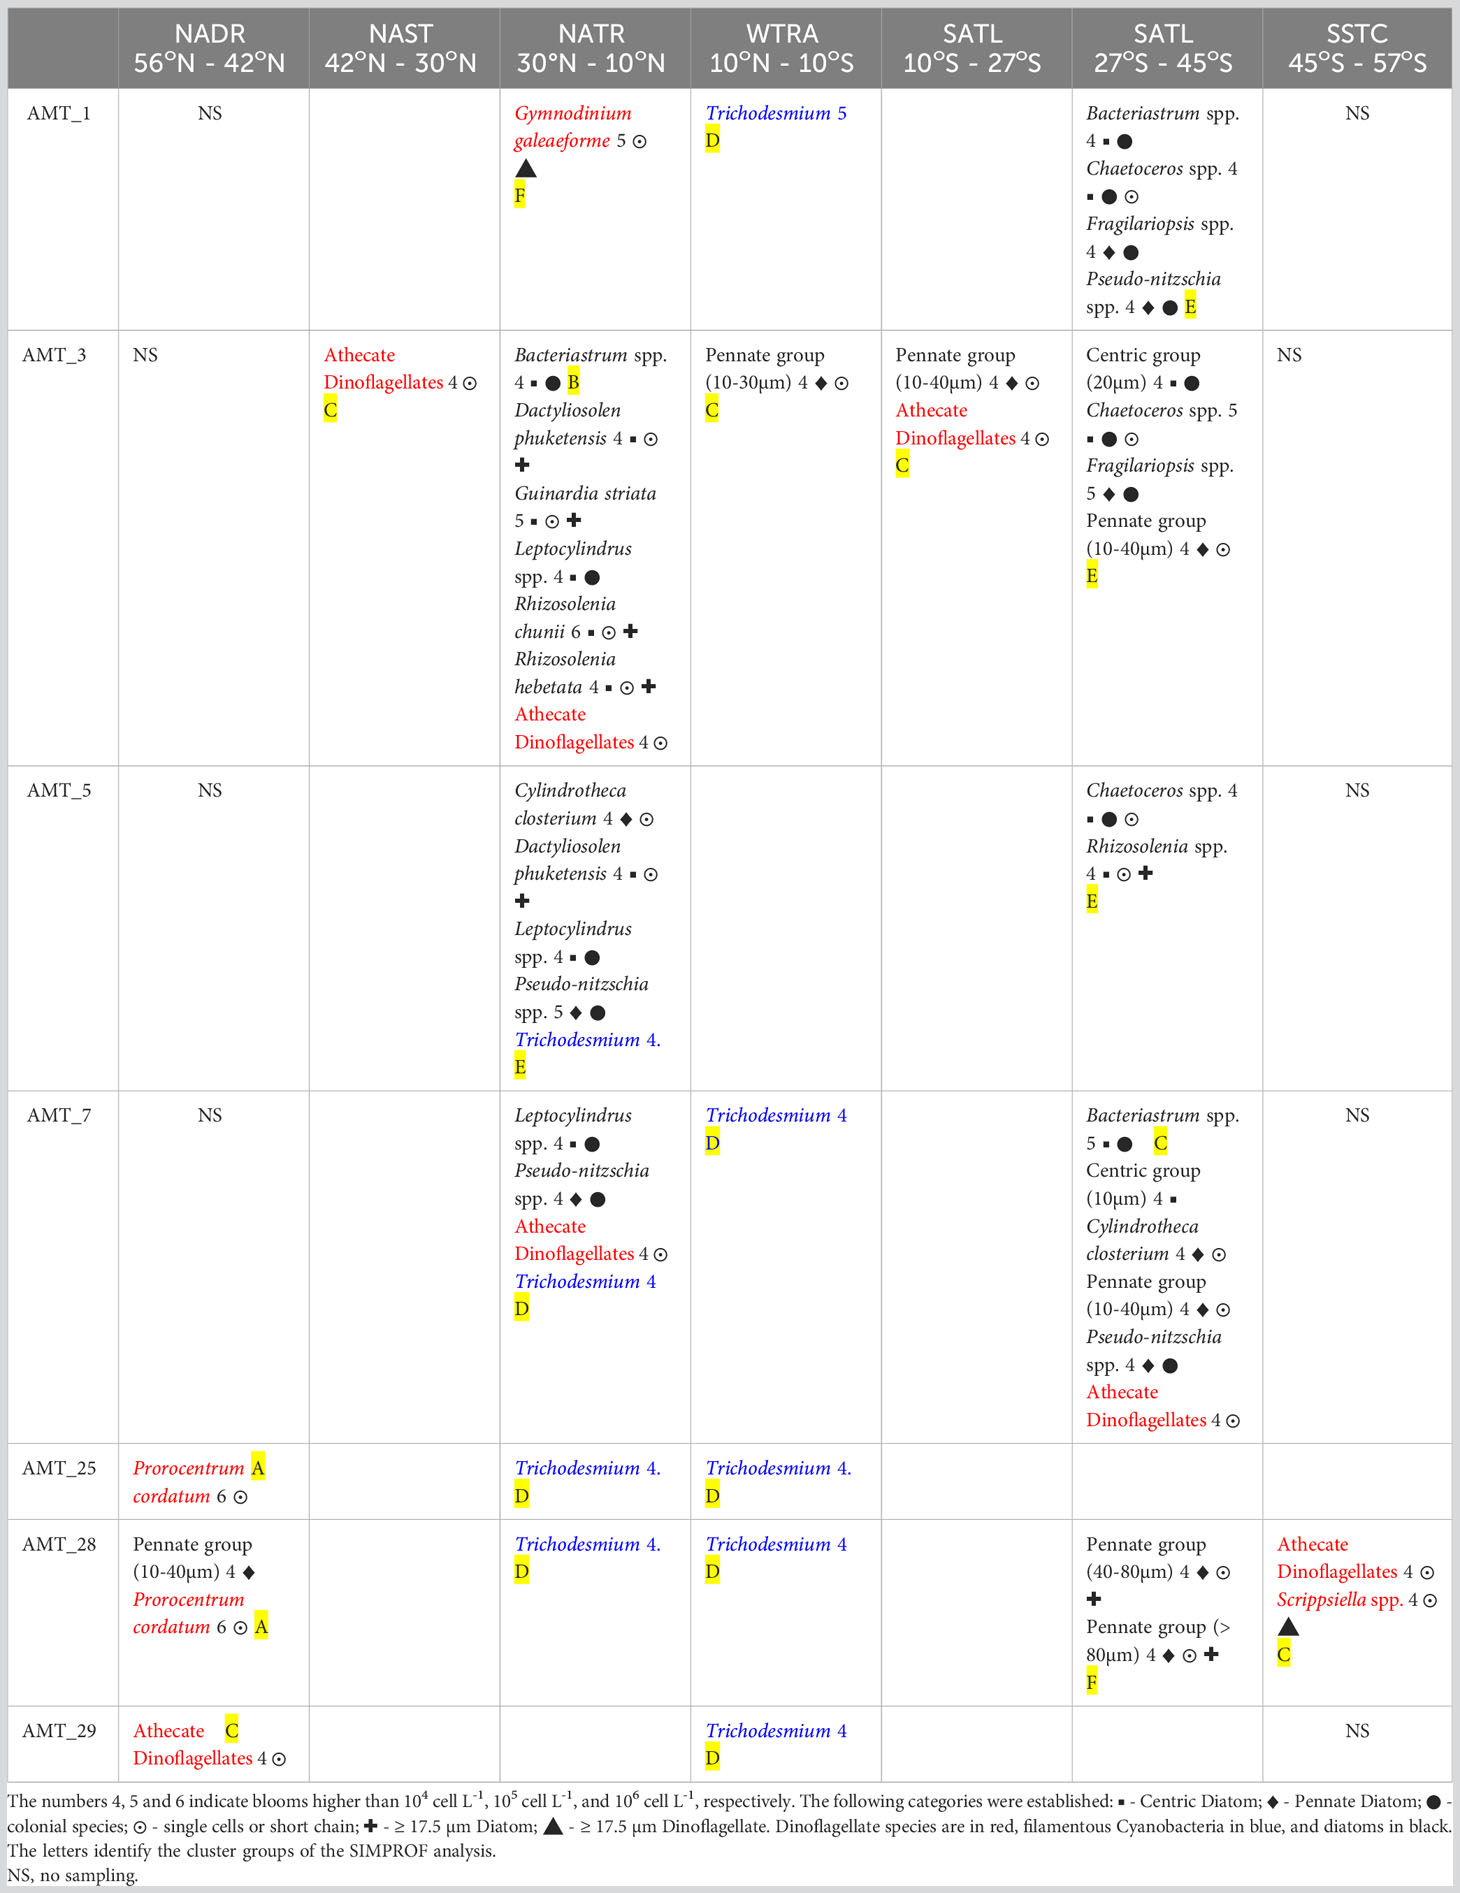
Table 4 Species/Taxa which presented abundances > 104 cell L-1, in the different Longhurst regions, in AMT 1, 3, 5, 7, 25, 28 and 29.
Cluster analysis, with the SIMPROF test (Figure 8), identified six groups of samples, which were statistically distinct (at the 5% level). SIMPER analysis determined the taxon or group of taxa that mostly contributed to each group’s average similarity. The largest group (D) clustered the tropical Atlantic (NATR and WTRA) from AMT1, 7, 25, 28 and 29, being defined by the presence of Trichodesmium blooms. Spanning also from earlier to recent AMTs, Group C’s average similarity was mainly due to Athecate dinoflagellates. Groups B and E, were exclusive of earlier AMTs, and cluster latitudinal regions where up to 6 different species of diatoms were observed. Group A was defined by the Prorocentrum cordatum blooms that occurred twice in the NADR region in AMT28, and at an ad-hoc station of AMT25; both blooms occurred in the English Channel, in September, with this species attaining 99 % of the total cell abundance of the microplankton fraction. Finally, group F contained two blooms that share no similarities with other assemblages, namely Gymnodinium galeaeforme (AMT1) and Pennate diatoms (> 40µm), in AMT28.
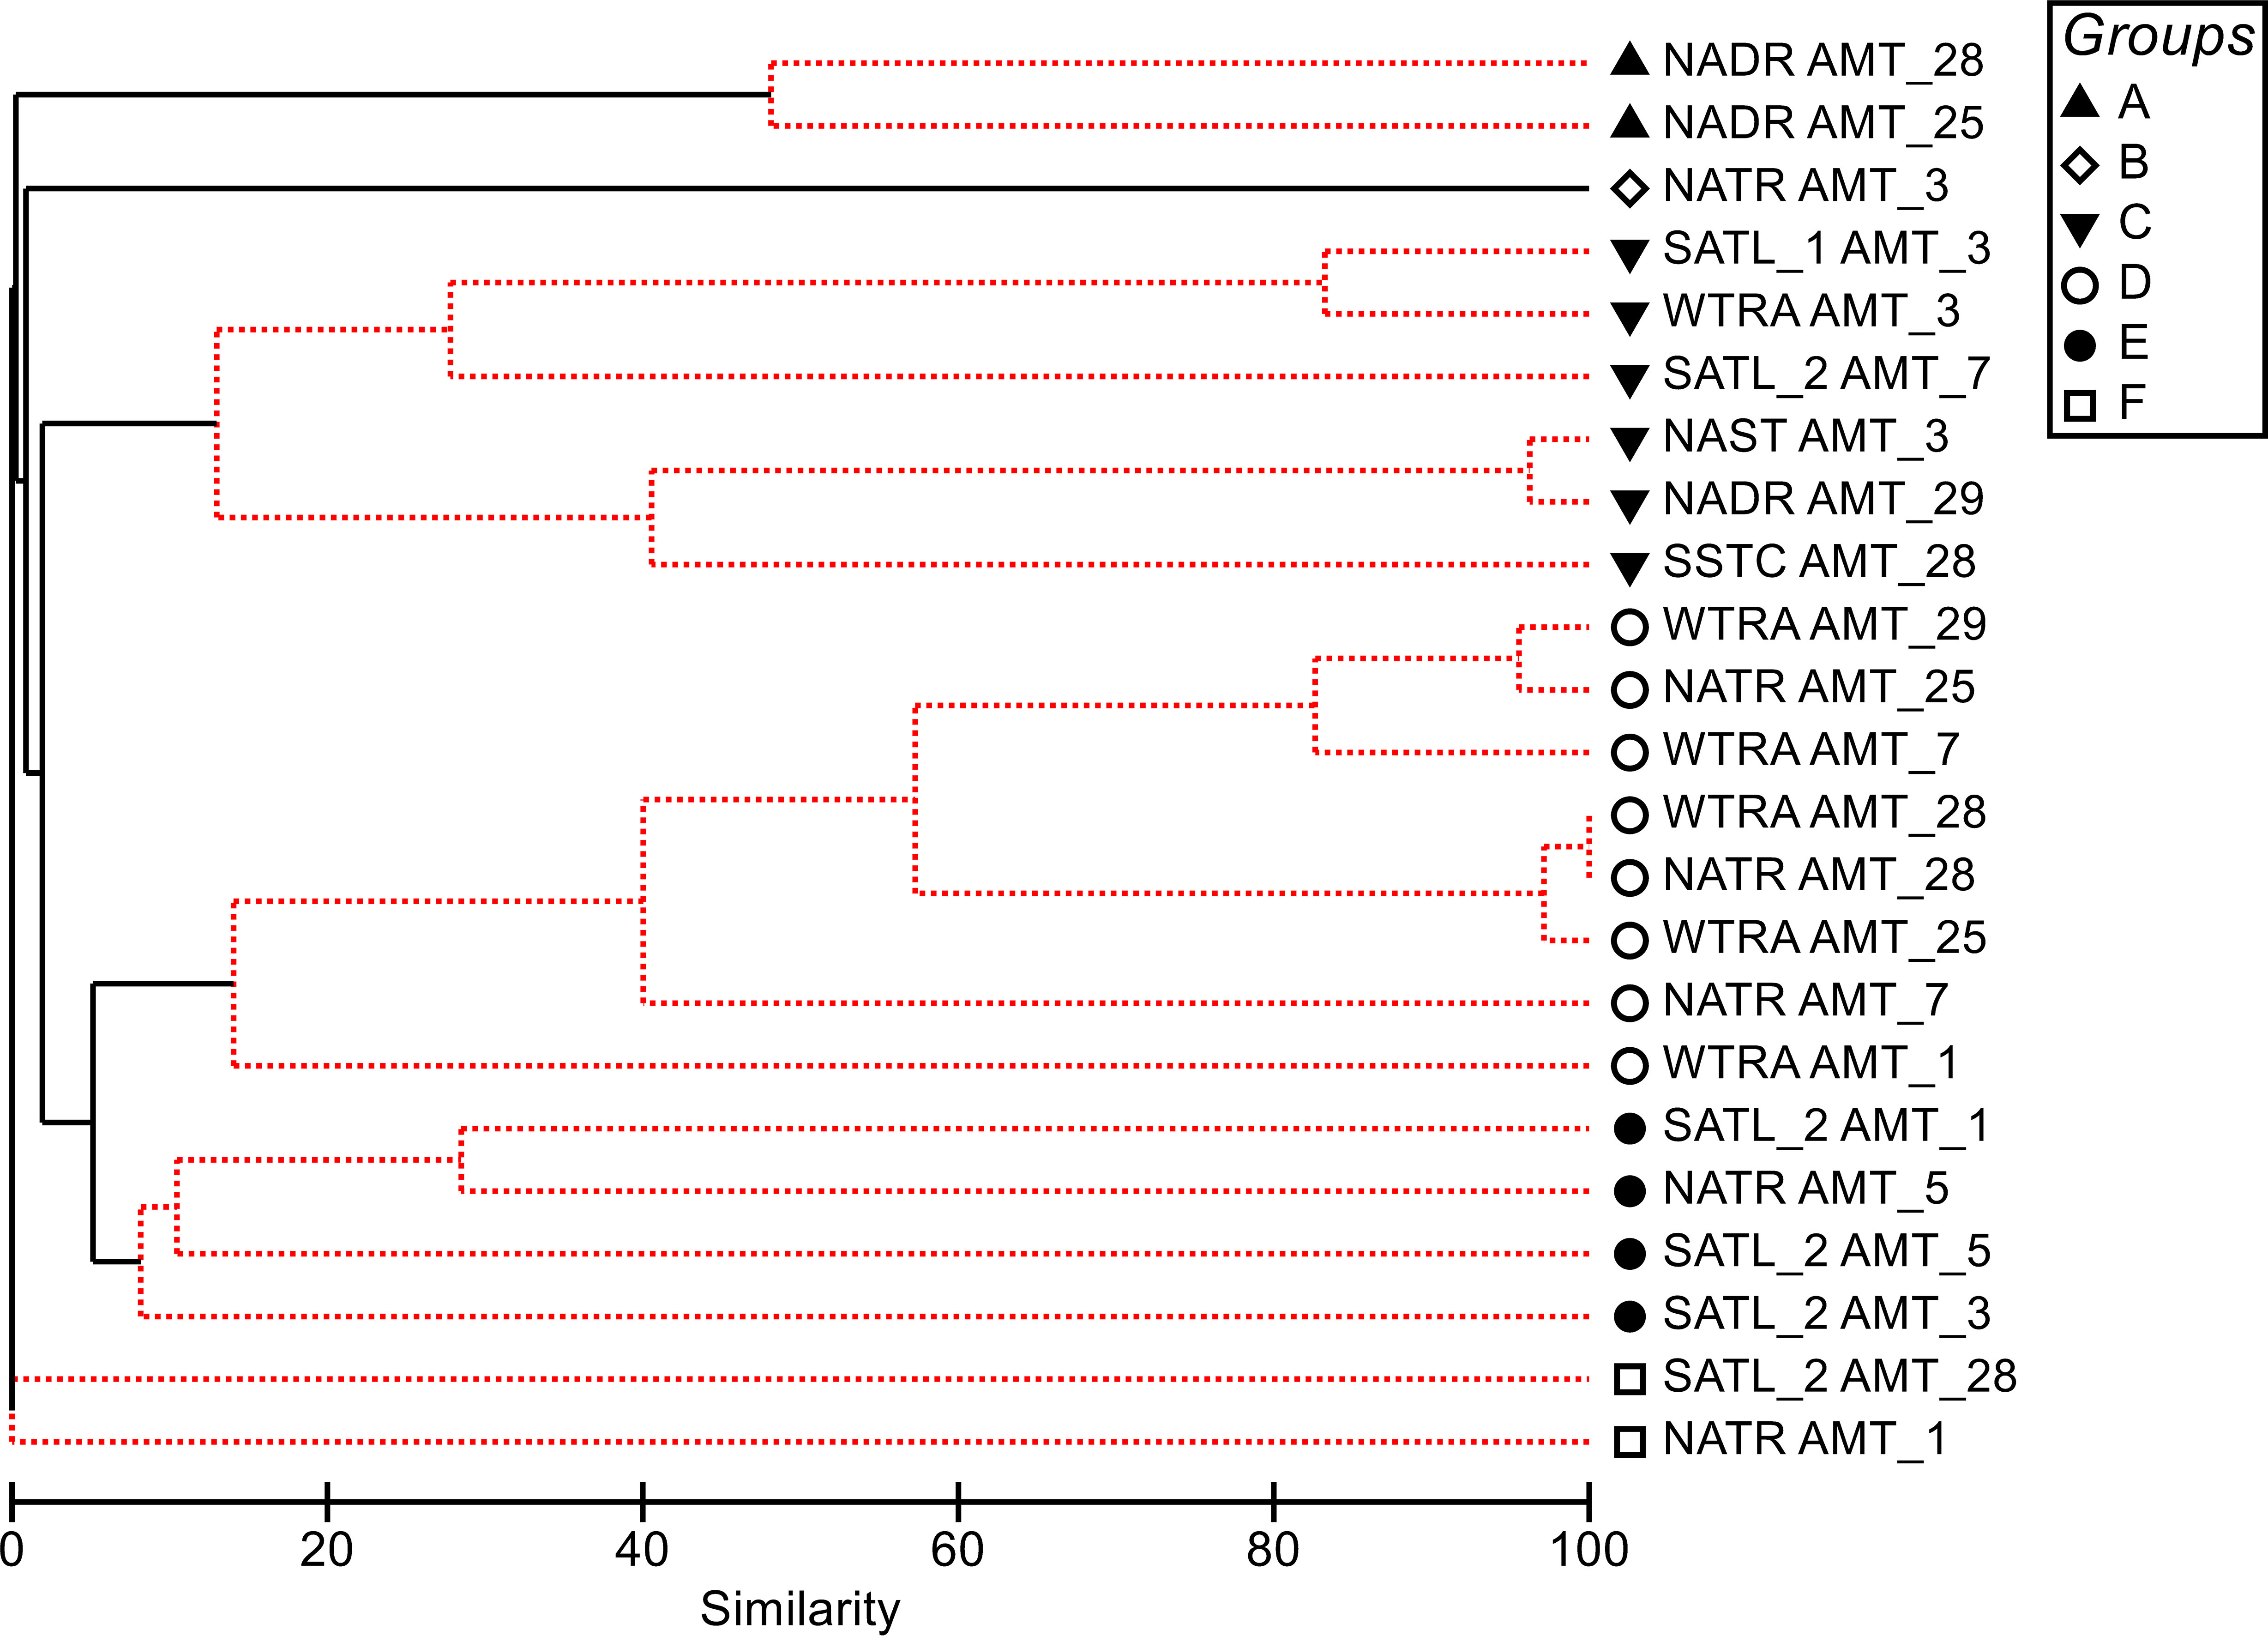
Figure 8 Dendrogram for hierarchical clustering of phytoplankton abundance samples using group-average linking of Bray–Curtis similarities. Only samples which presented abundances > 104 cell L-1, in the different Longhurst regions were included and data. Red dotted lines indicate nonsignificant clustering (SIMPROF test; significance level: P < 5%).
Furthermore, a common feature between all AMTs, in the North Atlantic Subtropical Gyre (NAST), and SATL North regions, which comprise a significant part of the North and South Atlantic oligotrophic gyres, respectively, was that no blooms were observed, except for Athecate dinoflagellates and “Pennate group (10-30 μm)” in AMT3.
The large-scale relative abundance of phytoplankton groups in Longhurst biogeographic provinces, was comparable, in terms of the dominant groups for each region. The comparison of the median values of TCarbon over the provinces gave very similar results for AMT28, AMT29, and AMT25 (Brotas et al., 2022, their Table 3). Ocean gyres presented median values of 10-15 mg Carbon m-3, whereas higher latitudes registered higher variability, and median values between 25-47 mg Carbon m-3.
We used three complementary methodological approaches to study phytoplankton composition, two of them based on in situ data, photosynthetic pigments and cell enumeration, and the third using satellite observations. All three approaches showed a similar pattern for the spatial distribution of phytoplankton community composition in the Atlantic regions for the two cruises, suggesting that environmental conditions of each region play a major role in shaping the relative composition of phytoplankton communities.
With the goal of strengthening this observation, and in order to identify the main drivers for the observed spatial distribution of the taxonomic groups, a Principal Component Analysis was performed on AMT28 and AMT29 data. The environmental factors considered were the surface concentration of nutrients (nitrates+nitrites, phosphates and silicates), depth of the nutricline, Temperature, Salinity and TChla, versus the ten taxonomic groups considered in this study. The resulting PCA, shown in Figure 9, plots the dominant taxa in the two components, which explain 79% of the total variability. Prochlorococcus was clearly linked with low nutrients and low Chla values, and the diatoms were located in the opposite situation. Synecchoccoccus appeared only twice as the dominant group, linked with high Chla and high nutrients, as indeed, all regions with high values of picoplankton (Figure 6) were dominated by Prochlorococcus. The group ADinos appeared scattered throughout the space defined by both axes, with values on the right end of axis 1 linked with high Chla and high nutrient values. Furthermore, the Bray-Curtis analysis focused only on microplankton species, clustering the same regions from all the AMT cruises, rather than clustering the earlier AMTs versus the recent ones, reinforcing the above conclusions, i.e., the phytoplankton community composition is shaped by the strong gradients of the environmental conditions.
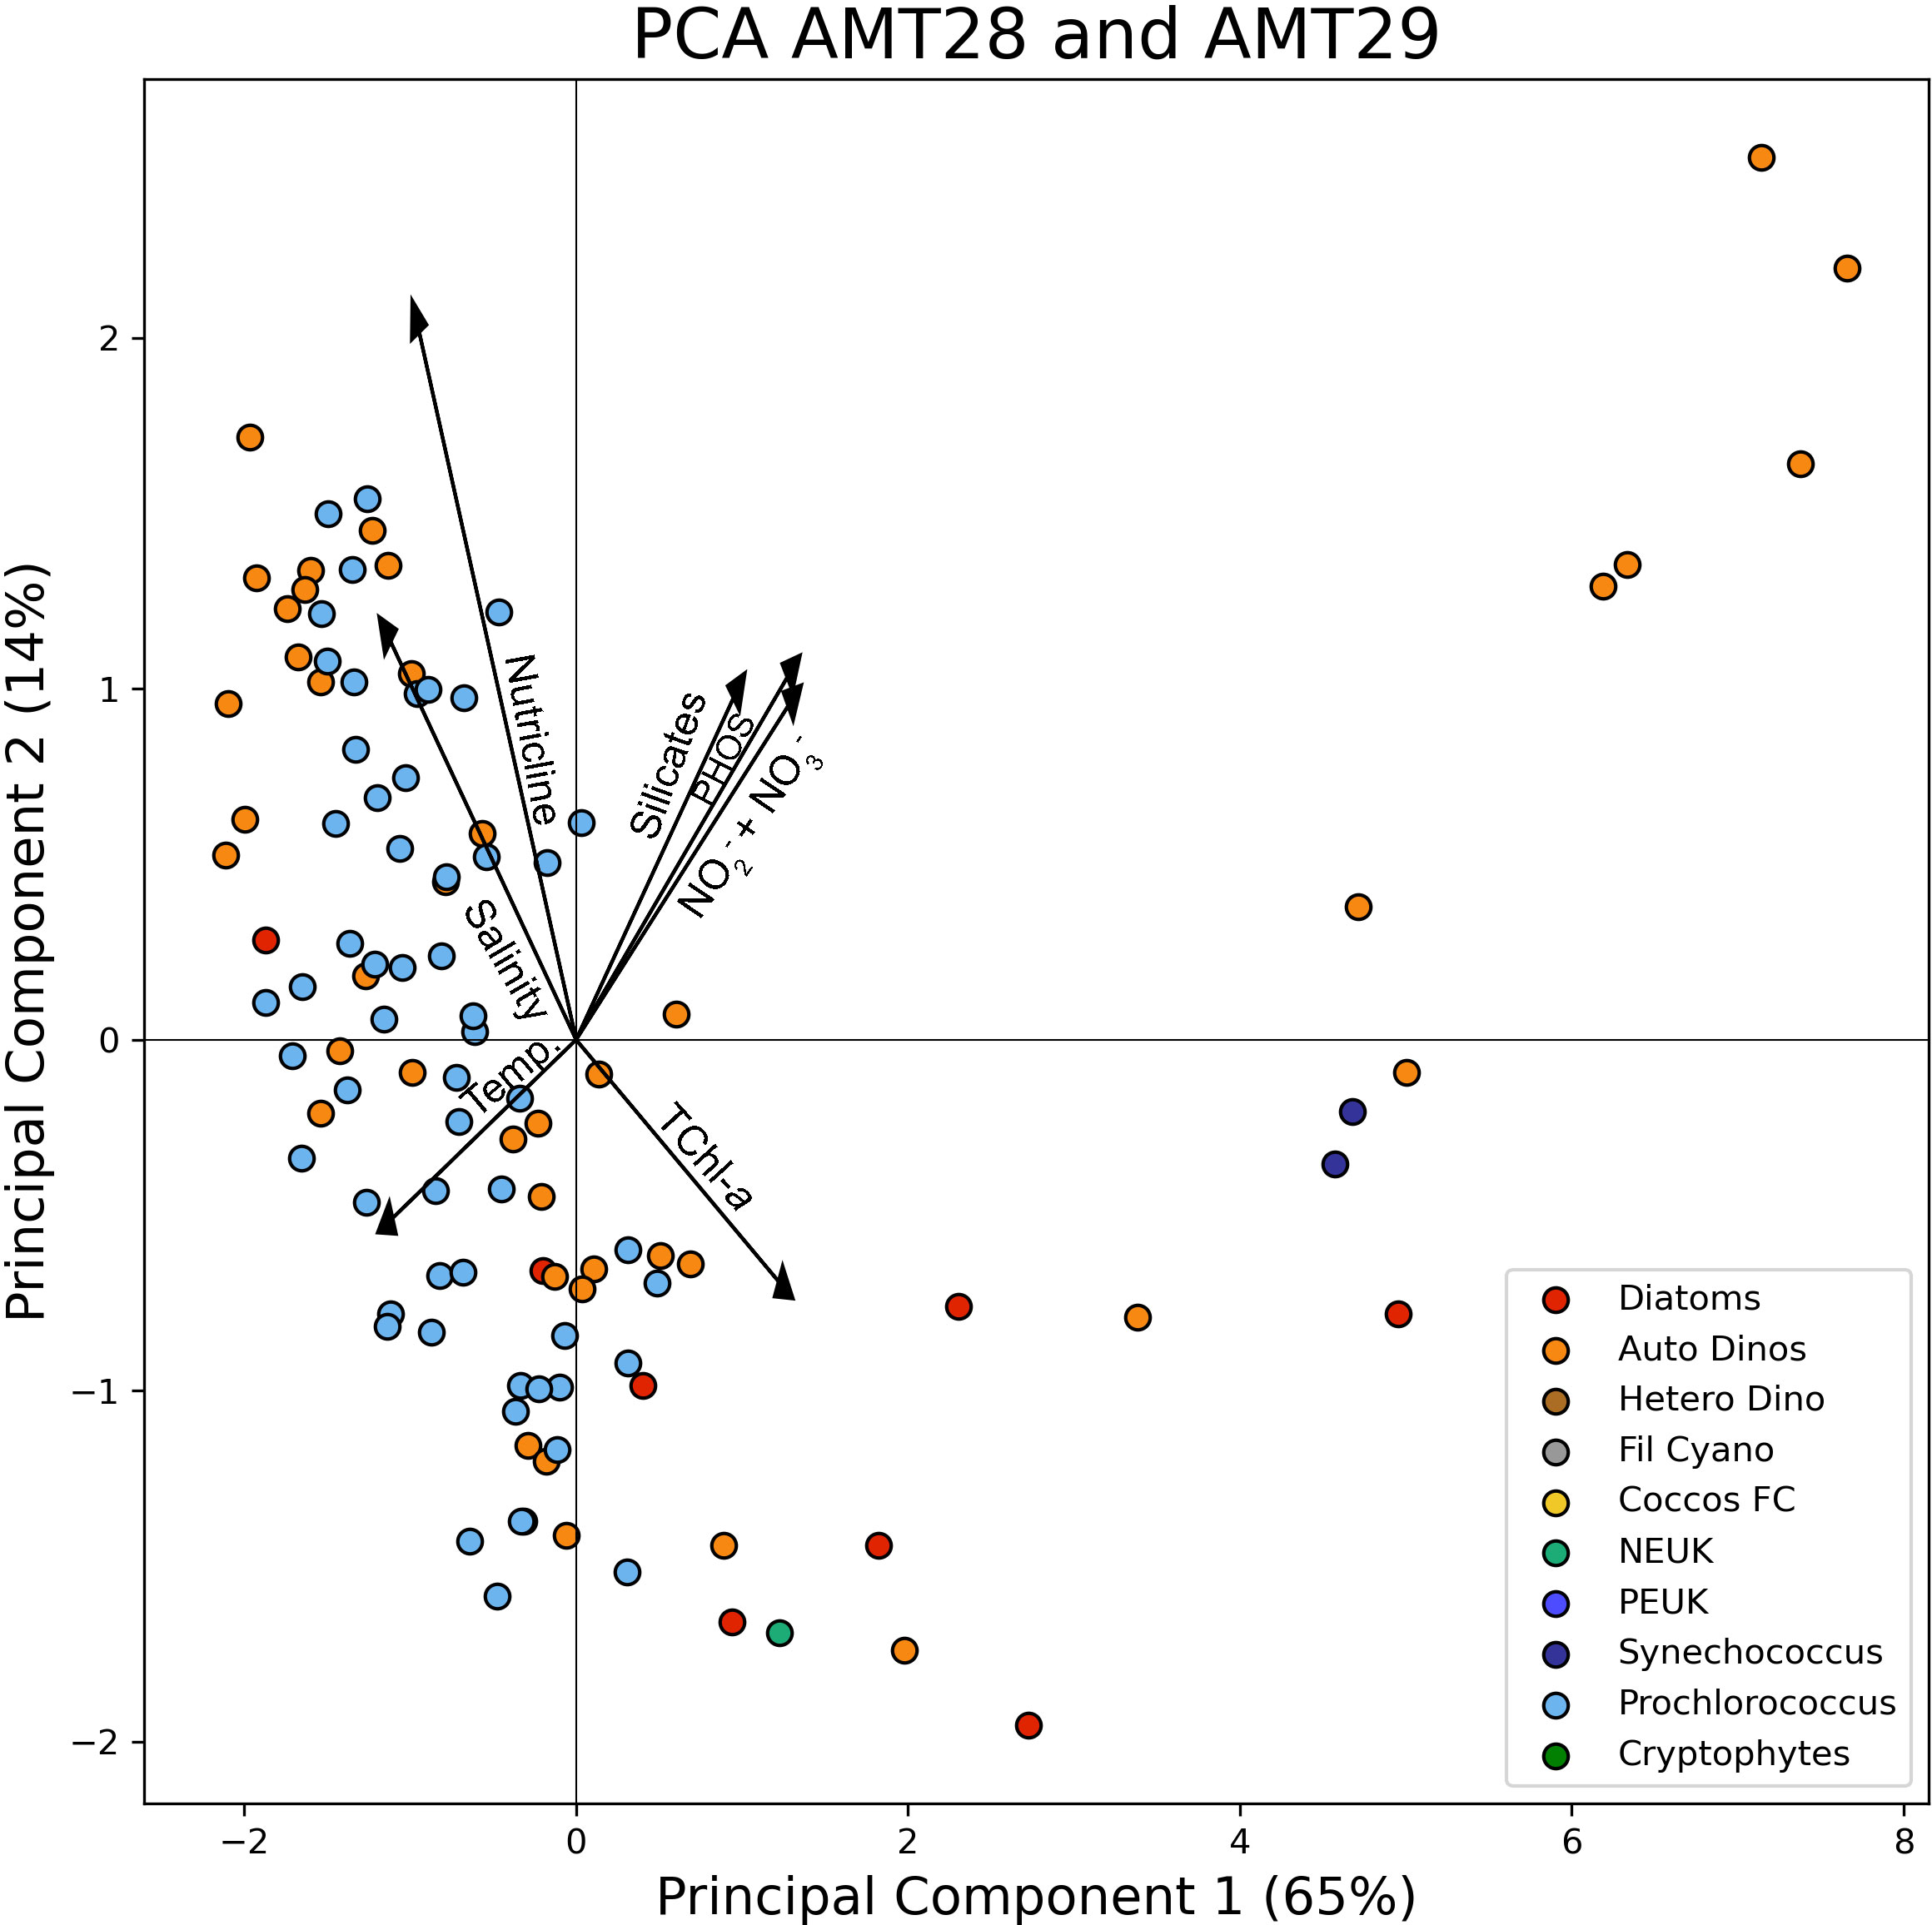
Figure 9 Principal Component Analysis performed on the phytoplankton taxonomic over the environmental data. The colour code represents the dominant phytoplankton taxon by carbon biomass.
The presence of diazotrophic Cyanobacteria within the same latitudinal range in both AMT28 and 29, was probably related to iron and phosphate supplied by Saharan dust deposition in the region, and would lead to enhanced N2-fixation rates (Smyth et al., 2017; Guerreiro et al., 2023, this issue). AOT data from AMT29 (Oct-Nov 2019) showed lower averaged values than AMT28 (Sep-Oct 2018) (Figure 2C). However, a broader latitudinal range of N2-fixing Trichodesmium was observed in AMT29, in comparison to AMT28 (Figure 5). This may be related to the fact that dust deposition was occasionally slightly higher during AMT29 compared to AMT28, as indicated by in-situ measurements of Mn concentrations (pmol m-3) measured from dust samples collected in situ during the cruises (data not shown, personal commun. published)."
The effect of Saharan dust input of nutrients such as iron, promotes the growth of not only the filamentous Cyanobacteria, but also the diazotrophic diatom, Hemiaulus hauckii species (Nair et al., 2008), which was observed in this region, in both cruises (as well in AMT25, Brotas et al., 2022). Although the total biomass of nitrogen-fixing species did not attain high values (Figure 5), the ubiquitous presence of diazotrophic species in the North Atlantic gyre in response to dust deposition has been reported to contribute to an increase in carbon sequestration in the region (Pabortsava et al., 2017).
The increase of Autotrophic dinoflagellates carbon biomass in AMT29, in comparison to AMT28, can have two possible interpretations. It can be due to the natural community seasonal evolution, from an earlier stage, with diatoms dominating, to a later stage, with a higher abundance of dinoflagellates, as AMT29 was one month later than AMT28, or it could be an indicator of an effective shift in the community occurring independent of the seasonality. In fact, when we compare the overall median values of dinoflagellates in AMT25, AMT28 and AMT29 (which were 1.57, 5.66 and 8.04 mg Carbon m-3, respectively), a trend in biomass increase appeared. Hence, this aspect should be investigated in future AMTs, as more data are needed to evaluate whether there is a consistent shift or not.
It should also be pointed out that we applied the distinction of Autotrophic and Heterotrophic, following Sal et al. (2013). However, dinoflagellates species can have a variety of trophic strategies; other authors, such as Barton et al. (2013), categorised as either mixotrophic or heterotrophic the dinoflagellates species observed in North Atlantic, implying that there are not pure autotrophic species. Also, the relevance of mixotrophic or predator protists in marine microbial cycles has been highlighted (Worden et al., 2015; Glibert and Mitra, 2022), specifying that dinoflagellates can be major grazers of diatoms.
Coccolithophores span a wide range of ESD and can be observed in light microscopy, as well as counted in flow cytometry, but in the present work, we only considered the enumeration by flow cytometry. Therefore, the contribution of this group to the total biomass was underestimated. Coccolithophores constitute the functional type calcifiers which play a key role in biogeochemical cycles, presenting higher biomass in higher oceanic Northern and Southern latitudes (Le Quéré et al., 2005). The average contribution to total biomass was 2% and 1% for AMT28 and AMT29, respectively; whereas in our previous AMT25 work, where coccolithophores were enumerated both by Flow cytometer and light microscopy, the average was 3.6%, and it was estimated that at least 40% of the total coccolithophores carbon biomass was due to species with ESD > 10 μm (Brotas et al., 2022). A detailed study on the coccolithophores community in AMT28 Northern Hemisphere is presented by Guerreiro et al. (2023, this issue), where the maximum cell number (3.5 x 10⁴ cells L-1) was observed in NADR.
The correspondence of size classes based on pigment chemotaxonomy and taxonomic groups may have flaws and uncertainties, however, as pointed out by Aiken et al. (2008), in spite of the reductionist approach of PSC, biological oceanography has shown that phytoplankton size classes are aligned with the environmental niches they live in, justifying the retrieval of PSC from Earth Observation. Also, the relationship between size classes and functional types using concentration of diagnostic pigments has been considered at a global scale (Hirata et al., 2011), aiming at establishing links which would allow the identification of PFTs from space, and these findings have been widely used by the ocean-colour community (Sun et al., 2023; Xi et al., 2023, amongst others). Moreover, as pointed out by Sathyendranath et al. (2020), the estimation of phytoplankton carbon size structure is crucial for our understanding of phytoplankton dynamics, but there is a lack of information regarding phytoplankton carbon content which should be addressed by the scientific community. The comparison of in situ PSC with cell enumeration expressed as carbon biomass had already been addressed for AMT25 in Brotas et al. (2022), who found a good agreement between both methodological approaches, although with an overestimation of the chemotaxonomic method regarding the nanoplankton fraction. In this work, to our knowledge for the first time, the comparison of in situ carbon measurements with satellite estimation of size classes was investigated. The validation of EO products is performed with fiducial ground truth measurements, which are limited by the cloud cover conditions. For our study, a limited number of matchups was available (31), nevertheless, the correlations obtained between the in situ carbon biomass and the satellite products derived from Brewin et al. (2017) model were significant, including the differentiation, within the microplankton fraction, of diatoms and dinoflagellates. It should be noted that the dinoflagellates satellite product relies on the assumption that peridinin is the diagnostic pigment for this taxonomic class, and although peridinin is only present in dinoflagellate species, not all species have this pigment.
The global warming effect on oceanic phytoplankton biomass will affect bloom phenology (Kahru et al., 2011; Racault et al., 2014, amongst others), likely with cascade effects on the trophic chain; moreover, warming is expected (Doney, 2006) to enhance stratification of the surface water layer, thus probably causing a reduction in cell growth in tropical latitudes (due to nutrient limitation) and an increase of biomass in higher latitudes, due to a shallower MLD, thus reducing light limitation (Doney, 2006; Cermeño et al., 2008). In order to properly evaluate global biomass trends in response to climate change, long-term, synoptic scale observations are crucial. For example, using the EO OCCCI Chla product, Sathyendranath et al. (2019b) reported a global Chla analysis showing an increasing trend in high latitudes and a decreasing trend in tropical areas.
Previous literature dealing with AMT, such as Racault et al. (2014), showed that Chla concentration assessed by remote sensing did not change during the period 2003-2010, but a shift in the relative proportion of the three size classes was detected when chemotaxonomic in situ data was used, showing the relevance of using complementarity between EO and in situ approaches. Focusing only on the in situ data of the same period, Agirbas et al. (2015) concluded that microplankton fraction decreased in North Atlantic Tropical Gyre and SATL, with a counterbalanced increase of picoplankton fraction. Our results also showed that an increase in picoplankton fraction in SATL can be spotted, from 36% (AMT25), 50% (AMT28) and 59% (AMT29), compensated by a decrease in nano- and microplankton fractions. The average Chla values for the three size classes assessed by satellite imagery for AMT28 and 29 cruises evidenced a widespread picoplankton community in all regions (Figure 7), whereas the abundance of nano- and microplankton fractions is strongly dependent on the nutrient availability, as demonstrated also by the PCA results.
Variability of phytoplankton species is an inherent and well-known characteristic of marine ecosystems, however assessing phytoplankton variability patterns and the way communities respond to changes, in terms of shift between taxa, cell size, or trophic strategy, is still a challenging research subject. As pointed out by Behrenfeld and Boss (2014), factors controlling phytoplankton blooms remain controversial despite a century of investigation.
The spatial and in-depth distribution of small cells belonging to nano- and picoplankton was characterised in previous AMTs (Tarran et al., 2006) and discussed in Phongphattarawat et al. (2023, this issue). Hence, our study is focused on microplanktonic species counted by microscopy, namely diatoms, dinoflagellates and filamentous Cyanobacteria. The comparison was focused on earlier boreal AMT cruises (1995-1998) and recent ones, namely 2015 (Brotas et al., 2022) and the cruises studied in this work, AMT28 and AMT29, thus encompassing a 25-year period.
Overall, results showed that blooms were mainly produced by diatom species, and that blooms of 105 or 106 cells L-1 were only observed in earlier AMTs, suggesting conditions which would favour diversity. In fact, from the total of 20 diatom species producing a bloom identified for the seven AMT cruises, only three taxa were observed in the recent ones (2015-2019), belonging to the pennate-colonial species type, (hence, constituting as well a decrease in shape diversity in relation to the earlier AMT cruises species).
The higher diversity in diatom bloom-forming species, namely in the NATR and SATL regions (up to 6 different species) registered in earlier AMTs might be due to the difference in in cruise tracks (from coastal in early years to more oceanic recently), however, the hypothesis of a decrease in the number and diversity of diatoms should be investigated in future studies. Regarding dinoflagellates, the blooms observed for Prorocentrum cordatum, constituting more than 90% of the total carbon biomass (Figure 4), occurred only in recent cruises (AMT25 and AMT28). This finding is in agreement with Khanaychenko et al. (2019), who stated that the toxic species Prorocentrum cordatum has been reported to become more widespread in recent years; hence these results constitute an alert for future studies in the English Channel.
Concerning filamentous Cyanobacteria, the abundances of Trichodesmium spp seem to be remarkably similar. The maxima values of Trichodesmium spp were 960 filaments in AMT 28 (11.45oN; -27.71oW), and 720 in AMT29 (11.85oN, 27.96oW). Tyrrell et al. (2003), in AMTs 1,3, 5 and 7 reported high filament abundances in the region between 0° and ~15oN, with a maximum value of 1040 filaments of Trichodesmium spp. for AMT 5. In AMT25, Brotas et al. (2022), reported a maximum of 700 filaments, and the presence of filamentous Cyanobacteria from 23°N to 2oN. Hence, not only the presence but also the abundance levels of filamentous Cyanobacteria seem to be a common feature in this area, as shown in this work, as well as in the earlier Boreal Autumn AMTs (1, 3, 5, and 7) and AMT25.
This work provides observations on the abundance and diversity of phytoplankton taxa on a gradient of trophic conditions in the North and South Atlantic. Our data contribute to the main goal of the AMT program, regarding the regular and long-term acquisition of a series of observations, crucial to understand the response of biological communities to ongoing climate change, whilst providing data for the development and testing of more accurate prediction models for future climatic scenarios.
The results obtained showed a common pattern from both cruises of phytoplankton biomass distribution and relative dominance of groups, across the Atlantic: the biomass values for the different biogeographic oceanic provinces were similar in both cruises, and comparable to those found in AMT25. Interannual major differences were found in high latitudes, where blooms of diatoms and dinoflagellates appeared.
This work explored complementary approaches to study phytoplankton size classes, namely in situ determination of size classes by chemotaxonomy, in situ enumeration of cell abundance of all taxonomic groups, and remote sensing of the relative contribution of the three size classes to Chla. We found a good relationship between satellite determination of phytoplankton size classes with in situ size classes estimated as carbon biomass, albeit with a relatively small number of available matchups.
An increase in the picoplankton fraction was detected in southern Atlantic, along AMT25, 28 and 29, consistent with earlier reports (Racault et al., 2014; Agirbas et al., 2015).
In spite of the differences in route tracks between the different AMTs, the analysis of the more abundant microplankton species of diatoms, dinoflagellates and filamentous Cyanobacteria between AMT cruises from the 1990s and more recent expeditions, highlights key observations, which might be considered for future studies, namely i) Trichodesmium blooms are a common feature in earlier and recent AMTs, with remarkably similar abundance values, ii) the small Athecate Dinoflagellate category is also a common taxa throughout the different AMTs, iii) there is a possible indication for a shift in most abundant diatom species, as their blooms have clearly decreased, including in Southern SATL, where the nutrient concentrations are high, iv) the Prorocentrum cordatum dinoflagellate blooms in recent cruises may be in line with the widespread of toxic species.
Additionally, we produced a database of cell carbon content per species, and its abundance in the sampled Atlantic regions, extending the database from the late 1990s, published by Sal et al. (2013), leaving a record for future research on biodiversity.
The original contributions presented in the study are included in the article/Supplementary Material. Further inquiries can be directed to the corresponding author.
All authors contributed to the conceptual development of the paper. Authors contributed differently to the following aspects: cruise participation (GT, AT, AF), HPLC pigment analysis (AT), microscope identification and enumeration (VV), flow cytometry analysis (GT), satellite imagery (SG, DC, JN) nutrient analysis (EW), figures and statistics (AF, LR, CG), English correction (SG). All authors contributed to manuscript revision, read, and approved the submitted version.
The Atlantic Meridional Transect is funded by the UK Natural Environment Research Council through its National Capability Long-term Single Centre Science Programme, Climate Linked Atlantic Sector Science (grant number NE/R015953/1). This study contributes to the international IMBeR project and is contribution number 393 of the AMT programme. This work received funding from the European Union’s Horizon 2020 research and innovation programme under grant agreement n° 810139 Project Portugal Twinning for Innovation and Excellence in Marine Science and Earth Observation – PORTWIMS”, and Interreg project Innovation in the Framework of the Atlantic Deep Ocean (iFADO). This study had the support of FCT through the strategic project UIDB/04292/2020 awarded to MARE and through project LA/P/0069/2020 granted to the Associate Laboratory ARNET. CG benefited from a Marie Sklodowska-Curie European Fellowship supported by the EU H2020-MSCA-IF-2017 (grant no. 796802) linked to project DUSTCO, and currently benefits from a research grant funded by FCT (contract CEECIND/00752/ 2018/CP1534/CT0011) linked to project CHASE (www.chase-dust.com). CG currently benefits from a research grant funded by FCT (contract CEECIND/00752/ 2018/CP1534/CT0011) linked to project CHASE (www.chase-dust.com). AT benefited a grant from European Union’s (EU) Horizon 2020 CERTO (Copernicus Evolution: Research for harmonised Transitional water Observation) project (No. 870349).
We thank the officers and crew of the British Antarctic Survey vessel RRS James Clark Ross and RRS Discovery. We are indebted to NEODAAS for processing the satellite imagery. We thank Carolina Sá and Giulia Sent for their help in AMT29. We thank the three reviewers for valuable suggestions.
The authors declare that the research was conducted in the absence of any commercial or financial relationships that could be construed as a potential conflict of interest.
All claims expressed in this article are solely those of the authors and do not necessarily represent those of their affiliated organizations, or those of the publisher, the editors and the reviewers. Any product that may be evaluated in this article, or claim that may be made by its manufacturer, is not guaranteed or endorsed by the publisher.
The Supplementary Material for this article can be found online at: https://www.frontiersin.org/articles/10.3389/fmars.2023.1229692/full#supplementary-material
Supplementary Table 1 | Supplementary material. List of species found in AMT28 and AMT29, with AphiaID from Worms (site), the cell biovolume (µm3) and cell carbon content (pg Carbon Cell-1).
Supplementary Table 2 | Supplementary material. Species abundances, in mg Carbon m-3 for AMT28.
Supplementary Table 3 | Supplementary material. Species abundances, in mg Carbon m-3 for AMT29.
Agirbas E., Martinez-Vincente V., Brewin R. J. W., Racault M. F., Airs R. L., Llewellyn C. A. (2015). Temporal changes in total and size-fractioned chlorophyll-a in surface waters of three provinces in the Atlantic Ocean (September to November) between 2003 and 2010. J. Mar. Syst. 150, 56–65. doi: 10.1016/j.jmarsys.2015.05.008
Aiken J., Brewin R. J. W., Dufois F., Polimene L., Hardman-Mountford N. J., Jackson T., et al. (2017). A synthesis of the environmental response of the North and South Atlantic Sub-Tropical Gyres during two decades of AMT. Prog. Oceanography 158, 236–254. doi: 10.1016/j.pocean.2016.08.004
Barton A. D., Finkel Z. V., Ward B. A., Johns D. G. J., Follows M. J. (2013). On the roles of cell size and trophic strategy in North Atlantic diatom and dinoflagellate communities Limnol. Oceanogr. 58, (1) 254–266. doi: 10.4319/lo.2013.58.1.0254
Becker S., Aoyama M., Woodward E. M. S., Bakker K., Coverly S., Mahaffey C., et al. (2020). GO-SHIP repeat hydrography nutrient manual: the precise and accurate determination of dissolved inorganic nutrients in seawater, using continuous flow analysis methods. Front. Mar. Sci. 7. doi: 10.3389/fmars.2020.581790
Behrenfeld M. J., Boss E. S. (2014). Resurrecting the ecological underpinnings of ocean plankton blooms. Annu. Rev. Mar. Sci. 6, 1, 167–194. doi: 10.1146/annurev-marine-052913-021325
Bracher A., Bouman H., Brewin R. J. W., Bricaud A., Brotas V., Ciotti A. M., et al. (2017). Obtaining phytoplankton diversity from ocean color: A scientific roadmap for future development. Front. Mar. Sci. 4. doi: 10.3389/fmars.2017.00055
Bray J. R., Curtis J. T. (1957). An ordination of the upland forest communities of Southern Wisconsin. Ecol. Monogr. 27, 326–349.
Brewer P. G., Riley J. P. (1965). The automatic determination of nitrate in seawater. Deep Sea Res. 12, 765–772. doi: 10.1016/0011-7471(65)90797-7
Brewin R. J. W., Ciavatta S., Sathyendranth S., Jackson T., Tilstone G., Curran K., et al. (2017). Uncertainty in ocean-colour estimates of chlorophyll for phytoplankton groups. Front. Mar. Sci. 4, 104. doi: 10.3389/fmars.2017.00104
Brewin R. J. W., Hirata T., Hardman-Mountford N. J., Lavender S. J., Sathyendranath S., Barlow S. R. (2012). The influence of the Indian Ocean Dipole on interannual variations in phytoplankton size structure as revealed by Earth Observation. Deep Sea Res. Part II: Topical Stud. Oceanography 77–80, 117–127. doi: 10.1016/j.dsr2.2012.04.009
Brewin R. J.W., Sathyendranath S., Hirata T., Lavender S., Barciela R. M., Hardman-Mountford N. J. (2010). A three-component model of phytoplankton size class for the Atlantic Ocean. Ecol. Model., 1472–1483. doi: 10.1016/j.ecolmodel.2010.02.014
Brotas V., Tarran G., Veloso V., Brewin R. J. W., Woodward E. M. S., Airs R., et al. (2022). Complementary approaches to assess phytoplankton groups and size classes on a long transect in the Atlantic Ocean. Front. Mar. Sci. 11. doi: 10.3389/fmars.2021.682621
Brotas V., Veloso V. (2022). Phytoplankton species counts from Atlantic Ocean surface water samples collected during JR15001 (AMT25) in September-November 2015. NERC EDS Br. Oceanographic Data Centre NOC. doi: 10.5285/eb752e17-cd14-3889-e053-6c86abc0ec59
Buitenhuis E. T., Vogt M., Moriarty R., Bednarsek N., Doney S. C., Leblanc K., et al. (2013). MAREDAT: towards a world atlas of MARine Ecosystem DATa. Earth Syst. Sci. Data 5, 227–239. doi: 10.5194/essd-5-227-2013
Cermeño P., Dutkiewicz S., Harris R. P., Follows M., Schofield O., Falkowski P. G. (2008). The role of nutricile depth in regulating the ocean carbon cycle. PNAS 105, (51). doi: 10.1073/pnas.0811302106
Clarke K. R. (1993). Non-parametric multivariate analyses of changes in community structure. Aust. J. Ecol. 18, 117–143. doi: 10.1111/j.1442-9993.1993.tb00438.x
Clarke K. R., Somerfield P. J., Gorley R. N. (2008). Testing of null hypotheses in exploratory community analyses: similarity profiles and biota-environment linkage. J. Exp. Mar. Biol. Ecol. 366, 56–69. doi: 10.1016/j.jembe.2008.07.009
Field C. B., Behrenfeld M. J., Randerson J. T., Falkowski P. (1998). Primary production of the biosphere: integrating terrestrial and oceanic components. Science 281 (5374), 237–240. doi: 10.1126/science.281.5374.237
Field J. G., Clarke K. R., Warwick R. M. (1982). A practical strategy for analysing multispecies distribution patterns. Mar. Ecol. Prog. Ser. 8, 37–52.
Glibert P. M., Mitra A. (2022). From webs, loops, shunts, and pumps to microbial multitasking: Evolving concepts of marine microbial ecology, the mixoplankton paradigm, and implications for a future ocean. Limnol. Oceanogr. 67, 585–597. doi: 10.1002/lno.12018
Good S., Fiedler E., Mao C., Martin M. J., Maycock A., Reid R., et al. (2020). The current configuration of the OSTIA system for operational production of foundation sea surface temperature and ice concentration analyses. Remote Sens. 12, 720. doi: 10.3390/rs12040720
Guerreiro C. V., Ferreira A., Cros L., Stuut J.-B., Baker A. R., Tracana A., et al. (2023). Response of coccolithophore communities to oceanographic and atmospheric processes across the North- and Equatorial Atlantic. Front. Mar. Sci. 10. doi: 10.3389/fmars.2023.1119488
Hirata T., Hardman-Mountford N. J., Brewin R. J. W., Aiken J., Barlow R., Suzuki K., et al. (2011). Synoptic relationships between surface Chlorophyll-a and diagnostic pigments specific to phytoplankton functional types. Biogeosciences 8, 311–327. doi: 10.5194/bg-8-311-2011
IOCCG (2014). “Phytoplankton functional types from space,” in Reports of the International Ocean Color Coordinating Group No. 15. Eds. Sathyendranath S., Stuart V. (Dartmouth, NS: IOCCG).
Kahru M., Brotas V., Manzano-Sarabia M., Mitchell B. G. (2011). Are phytoplankton blooms occurring earlier in the Arctic? Global Change Biol. 17 (4), 1733–1739. doi: 10.1111/j.1365-2486.2010.02312.x
Khanaychenko A. N., Skarlato S. O., Telesh I. (2019). Bloom-forming potentially toxic dinoflagellates Prorocentrum cordatum in marine plankton food webs. Protistology 13 (3), 95–125. doi: 10.21685/1680-0826-2019-13-3-1
Kirkwood D. S. (1989). Simultaneous determination of selected nutrients in seawater, ICES CM 1989/C:29.
Le Quéré C., Harrison S. P., Prentice I. C., Buitenhuis E. T., Aumont O., Bopp L., et al. (2005). Ecosystem dynamics based on plankton functional types for global ocean biogeochemistry models. Global Change Biol. 11, 2016–2040. doi: 10.1111/j.1365-2486.2005.1004.x
Menden-Deuer S., Lessard E. J. (2000). Carbon to volume relationships for dinoflagellates, diatoms, and other protist plankton. Limnol. Oceanogr. 45 (3), 569–579. doi: 10.4319/lo.2000.45.3.0569
Mendes C. R., Cartaxana P., Brotas V. (2007). HPLC determination of microalgae pigments: comparing resolution and sensitivity of a C18 and a C8 method. Limnol. Oceanog. 5, 363–370. doi: 10.4319/lom.2007.5.363
Moore C. M., Mills M. M., Achterberg E. P., Geider R. J., La Roche J., Lucas M. I., et al. (2009). Large-scale distribution of Atlantic nitrogen fixation controlled by iron availability. Nat. Geosci. 2 (12), 867–871. doi: 10.1038/NGEO667
Nair A., Sathyendranath S., Platt T., Morales J., Stuart V., Forget M.-H., Devred E., et al (2008). Remote sensing of phytoplankton functional types. Remote Sens. Environ. 112, 3366–3375.
Pabortsava K., Lampitt R., Benson J., Crowe C., McLachlan R., Le Moigne F. A. C., et al. (2017). Carbon sequestration in the deep Atlantic enhanced by Saharan dust. Nat. Geosciences 10 (3), 189–194. doi: 10.1038/ngeo2899
Pedregosa F., Varoquaux G., Gramfort A., Michel V., Thirion B., Grisel O., et al. (2011). Scikit-learn: machine learning in python. J. Mach. Learn. Res. 12, 2825–2830.
Phongphattarawat S., Bouman H. A., Lomas M. W., Sathyendranath S., Tarran G. A., Ulloa O., et al. (2023). Ecophysiological basis of spatiotemporal patterns in picophytoplankton pigments in the global ocean. Front. Mar. Sci. doi: 10.3389/fmars.2023.1112177
Poulton A. J., Holligan P. M., Charalampopoulou A., Adey T. R. (2017). Coccolithophore ecology in the tropical and subtropical Atlantic Ocean: New perspectives from the Atlantic meridional transect (AMT). Prog. Oceanography 158, 150–170. doi: 10.1016/j.pocean.2017.01.003
Racault M-F., Platt T., Sathyendranath S., Agirbas E., Martinez Vicente V., Brewin R. J. W. (2014). Plankton indicators and ocean observing systems: support to the marine ecosystem state assessment. J. Plankton Res. 36 (3), 621–629. doi: 10.1093/plankt/fbu016
Rees A. P., Nightingale P. D., Poulton A. J., Smyth T. J., Tarran G. A., Tilstone G. H. (2017). The atlantic meridional transect programme, (1995-2016). Prog. Oceanography 158, 3–18. doi: 10.1016/j.pocean.2017.05.004
Reynolds C. S., Huszar V., Kruk C., Naselli-Flores L., Melo S. (2002). Towards a functional classification of the freshwater phytoplankton. J. Plankton Res. 24, 417–428. doi: 10.1093/plankt/24.5.417
Sal S., López-Urrutia Á., Irigoien X., Harbour D. S., Harris R. P. (2013). Marine microplankton diversity database. Ecology 94 (7), 1658. doi: 10.1890/13-0236.1
Sathyendranath S., Brewin R.J.W., Brockmann C., Brotas V., Calton B., Chuprin A., et al. (2019a). An ocean-colour time series for use in climate studies: the experience of the ocean-colour climate change initiative (OC-CCI). Sensors 19 (19), 4285. doi: 10.3390/s19194285
Sathyendranath S., Pardo S., Benincasa M., Brando V., Brewin R. J.W., Mélin F., et al. (2019b). Copernicus marine service ocean state report. J. Operational Oceanography 11 (sup1), S1–S142. doi: 10.1080/1755876X.2018.1489208
Sathyendranath S., Platt T., Kovač Ž., Dingle J., Jackson T., Brewin R. J. W., et al. (2020). Reconciling models of primary production and photoacclimation. Appl. Opt 59, C100–C114. doi: 10.1364/AO.386252
Sieburth J. M., Smetacek V., Lenz J. (1978). Pelagic ecosystem structure: heterotrophic compartments of the plankton and their relationship to plankton size fractions. Limnol Oceanogr 23, 1256–1263.
Smyth T., Quartly G., Jackson T., Tarran G., Woodward M., Harris C., et al. (2017). Determining Atlantic Ocean province contrasts and variations. Prog. Oceanography 158, 19–40. doi: 10.1016/j.pocean.2016.12.004
Sun X., Brewin R. J. W., Sathyendranath S., Dall’Olmo G., Airs R., Barlow R., et al. (2023). Coupling ecological concepts with an ocean-colour model: Phytoplankton size structure. Remote Sens. Environ. 285, 113415. doi: 10.1016/j.rse.2022.113415
Tarran G. A., Heywood J. L., Zubkov M. V. (2006). Latitudinal changes in the standing stocks of nano- and picoeukaryotic phytoplankton in the Atlantic Ocean. Deep-Sea Res. Part II: Topical Stud. Oceanography 53, 1516–1529. doi: 10.1016/j.dsr2.2006.05.004
Tarran G. A., Zubkov M. V., Sleigh M. A., Burkill P. H., Yallop M. (2001). Microbial community structure and standing stocks in the NE Atlantic in June and July of 1996. Deep-Sea Res. Part II: Topical Stud. Oceanography 48 (4–5), 963–985. doi: 10.1016/s0967-0645(00)00104-1
Tyrrell T., Maranon E., Poulton A. J., Bowie A. R., Harbour D. S., Woodward E. M. S. (2003). Large-scale latitudinal distribution of Trichodesmium spp. Atlantic Ocean. J. Plankton Res. 25, 405–416. doi: 10.1093/plankt/25.4.405
Uitz J., Claustre H., Morel A., Hooker S. B. (2006). Vertical distribution of phytoplankton communities in open ocean: An assessment based on surface chlorophyll. J. Geophysical Res. 111, CO8005. doi: 10.1029/2005jc003207
Utermöhl H. (1958). Zur Vervolkommung der quantitativen Phytoplankton: methodik. Mitteilungen Internationale Vereinigung f̈r Theoretische und Angewandte. Limnologie 9, 1–39.
Vidussi F., Claustre H., Manca B. B., Luchetta A., Marty J. (2001). Phytoplankton pigment distribution in relation to upper thermocline in the eastern Mediterranean Sea during winter. J. Geophysical Res. 106, 19939–19956. doi: 10.1029/1999JC000308
Worden A. Z., Follows M. J., Giovannoni S. J., Wilken S., Zimmerman A. E., Keeling P. J. (2015). Environmental science. Rethinking the marine carbon cycle: factoring in the multifarious lifestyles of microbes. Science 347 (6223), 1257594. doi: 10.1126/science.1257594
Xi H., Bretagnon M., Losa S. N., Brotas V., Gomes M., Peeken I., et al. (2023). Satellite monitoring of surface phytoplankton functional types in the Atlantic Ocean over 20 years (2002–2021). State Planet 1-osr7, 5. doi: 10.5194/sp-1-osr7-5-2023
Keywords: phytoplankton taxonomic groups, Atlantic Meridional Transect, carbon, ocean colour, size classes
Citation: Brotas V, Ferreira A, Veloso V, Tracana A, Guerreiro CV, Tarran GA, Woodward EMS, Ribeiro L, Netting J, Clewley D and Groom SB (2023) Assessing phytoplankton community composition in the Atlantic Ocean from in situ and satellite observations. Front. Mar. Sci. 10:1229692. doi: 10.3389/fmars.2023.1229692
Received: 26 May 2023; Accepted: 16 October 2023;
Published: 03 November 2023.
Edited by:
Takafumi Hirata, Hokkaido University, JapanReviewed by:
Jesús M. Mercado, Spanish Institute of Oceanography (IEO), SpainCopyright © 2023 Brotas, Ferreira, Veloso, Tracana, Guerreiro, Tarran, Woodward, Ribeiro, Netting, Clewley and Groom. This is an open-access article distributed under the terms of the Creative Commons Attribution License (CC BY). The use, distribution or reproduction in other forums is permitted, provided the original author(s) and the copyright owner(s) are credited and that the original publication in this journal is cited, in accordance with accepted academic practice. No use, distribution or reproduction is permitted which does not comply with these terms.
*Correspondence: Vanda Brotas, dmJyb3Rhc0BmYy51bC5wdA==
Disclaimer: All claims expressed in this article are solely those of the authors and do not necessarily represent those of their affiliated organizations, or those of the publisher, the editors and the reviewers. Any product that may be evaluated in this article or claim that may be made by its manufacturer is not guaranteed or endorsed by the publisher.
Research integrity at Frontiers
Learn more about the work of our research integrity team to safeguard the quality of each article we publish.