
94% of researchers rate our articles as excellent or good
Learn more about the work of our research integrity team to safeguard the quality of each article we publish.
Find out more
ORIGINAL RESEARCH article
Front. Mar. Sci., 09 October 2023
Sec. Physical Oceanography
Volume 10 - 2023 | https://doi.org/10.3389/fmars.2023.1227894
 Natasha A. Ridenour1,2*†
 Liam Buchart1
 Eddy Carmack3Inge Deschepper4Eric Galbraith5Geoff Green6Juliana M. Marson2
 Clark Pennelly1Tahya Weiss-Gibbons1
 Paul G. Myers1
Over the last two decades, in an effort to engage youth in polar science, the Students On Ice (SOI; https://studentsonice.com/) project has become a platform for youth to partake in scientific expeditions around the globe. Among the various activities offered, youth are able to join cruises in the North Atlantic or Arctic, and drop sealed glass bottles into the ocean. Of the thousands that have been deployed, 5% of bottles have been recovered and reported back to SOI with details on when and where they were found. Here, we compare the observational bottle data with virtual particle trajectories from a high resolution regional ocean model. Although modelling results indicate a higher likelihood of bottles reaching the shores of the western Atlantic, the majority of recovered bottles were found on the eastern side of the Atlantic. We attribute this disparity to differences in population density in Canada and Europe, biasing the recovery rates. Despite this bias, we find that changes in recovery locations over time are consistent with changes in the main ocean currents associated with the contraction and expansion of the North Atlantic Subpolar Gyre, as simulated in our ocean model. In 2007, a large number of bottles were found in Norway, coinciding with a contracted North Atlantic Subpolar Gyre during 2004-2008. While between 2012-2016, the majority of bottles were recovered on the British Isles, during a time of gyre expansion. These results underline the importance of large scale oceanic cycles for tracking marine debris and pollution, and show how even simple data collection methods, such as drift bottles, can provide clues to the changes in the large scale ocean circulation.
In the early days of oceanography, a widely used method to track ocean currents was through drifting bottles. A bottle containing an SOS, love letter, or scientific message, and possibly contact information and an identification number, would be thrown into the ocean, and, in the case of a scientific study, the time and location were recorded. If the bottle was found (weeks, months, or years later), the finder can send the date and coordinates of where they had found the bottle to the sender, or in the case of an SOS, can send help. This method has been used by Hachey (1935) in Hudson Bay; by Trites and Banks (1958) on the Scotian shelf; by Brucks (1971) for the Caribbean Sea; as well as by large marine institutes, such as The Scottish Association for Marine Science (Brown, 1916; Adams et al., 1991), Woods Hole Oceanographic Institute (WHOI; www.whoi.edu/what-we-do/explore/instruments/instruments-floats-drifters/), and both the Canadian and American governments (https://www.dfo-mpo.gc.ca/science/data-donnees/driftbottlesbouteillesflottantes/index-eng.html; Day, 1958), which has resulted in furthering our understanding of oceanic current patterns in various regions around the globe. However, research institutes are not the only ones releasing bottles. In 1959, Guinness released 150,000 bottles in the North Atlantic Ocean (one being found by one of the authors of this paper!), while the Norwegian beverage company, Solo, deployed an 8m tall bottle in 2013, equipped with various sensors and instruments to track ocean currents. Both releases were large scale promotional events. Accidental spills off of cargo ships have also provided information on how objects float in the ocean. Ebbesmeyer and Scigliano (2009) discuss how even right or left handed hockey gloves (or right or left sneakers) influence where these items wash ashore. More recently, during a fundraising event in Alberta (a land locked province in Canada), thousands of rubber ducks were released in a river and collected later on, but one went missing. The lone rubber duck was found two years later on the Rybachy Peninsula in northern Russia (Harrap, 2021).
This method of collecting data has the benefit of engaging citizen scientists around the world, whether it be students deploying bottles or rubber ducks, or capturing media attention and inspiring future scientists by the discovery of a message in a bottle that has been washed ashore. Recent approaches to using ocean drifters limit the citizen engagement, as they are usually expensive pieces of scientific equipment requiring specialized knowledge compared to inexpensive glass bottles that are used for this type of research. Modern day oceanography also benefits from realistic high resolution models that estimate circulation pathways, yet these are rarely compared with drifter data, since these have fallen into disuse.
Our study provides a method to compare drift bottle data with high resolution model output, using traditional drift bottle data from the Students On Ice project (SOI; https://studentsonice.com/), which deployed bottles in the Canadian Arctic and western Atlantic. The SOI program provides students the opportunity to participate in educational expeditions around the globe. The goal of SOI is to provide youth and educators with learning and teaching opportunities in polar regions, to foster new understanding and respect for the global environment. Since 2000, over 3,500 students from 57 different countries have participated in the program, with most students personally launching the drift bottles while underway. Here, we compare the SOI bottle data with virtual particles that are driven by ocean currents from a high resolution regional ocean model.
The circulation in the Northern hemisphere Atlantic Ocean is largely influenced by two wind-driven gyres (Figure 1); the SubTropical Gyre (hereafter referred to as STG) situated between the equator and 45°N, and the SubPolar Gyre (SPG), between 45°N and the Canadian, Greenlandic, and Icelandic coastlines. The STG flows clockwise, bringing tropical waters northward along eastern North America, and cooler waters southward along western Europe and Africa. The boundary between the two gyres is known as the subarctic front (SAF; Kenigson and Timmermans, 2021) and is linked to the North Atlantic Current (NAC). The NAC is fed by the northeastward flowing waters from the eastern coast of North America, and is responsible for bringing these warmer waters across the Atlantic to western Europe, contributing to a mild climate even at high latitudes (Rossby, 1996). The NAC flows northeastwards, between Iceland and the British Isles into the Nordic Seas (Hátún et al., 2005; Daniault et al., 2016; Houpert et al., 2018). It also forms the southern branch of the SPG, a counter clockwise flow confined by eastern Canada, southern Greenland, and Iceland. Polar waters from the Arctic flow southwards from Fram Strait and feed the gyre in the northeastern corner. A portion of the waters in the SPG flow northwards into Baffin Bay, where they also circulate counter clockwise along the Greenlandic and Canadian Arctic coastlines, before rejoining the southward flowing branch of the SPG on the eastern Canadian coast. The combination of different water masses with strong storms and buoyancy loss in this area promote the formation of dense waters that feed part of the large scale overturning circulation which plays a role in regulating global temperatures as well as transporting oxygen and carbon dioxide into the deep ocean (McCartney and Talley, 1982; McCartney, 1992; Körtzinger et al., 2004; Kieke and Yashayaev, 2015).
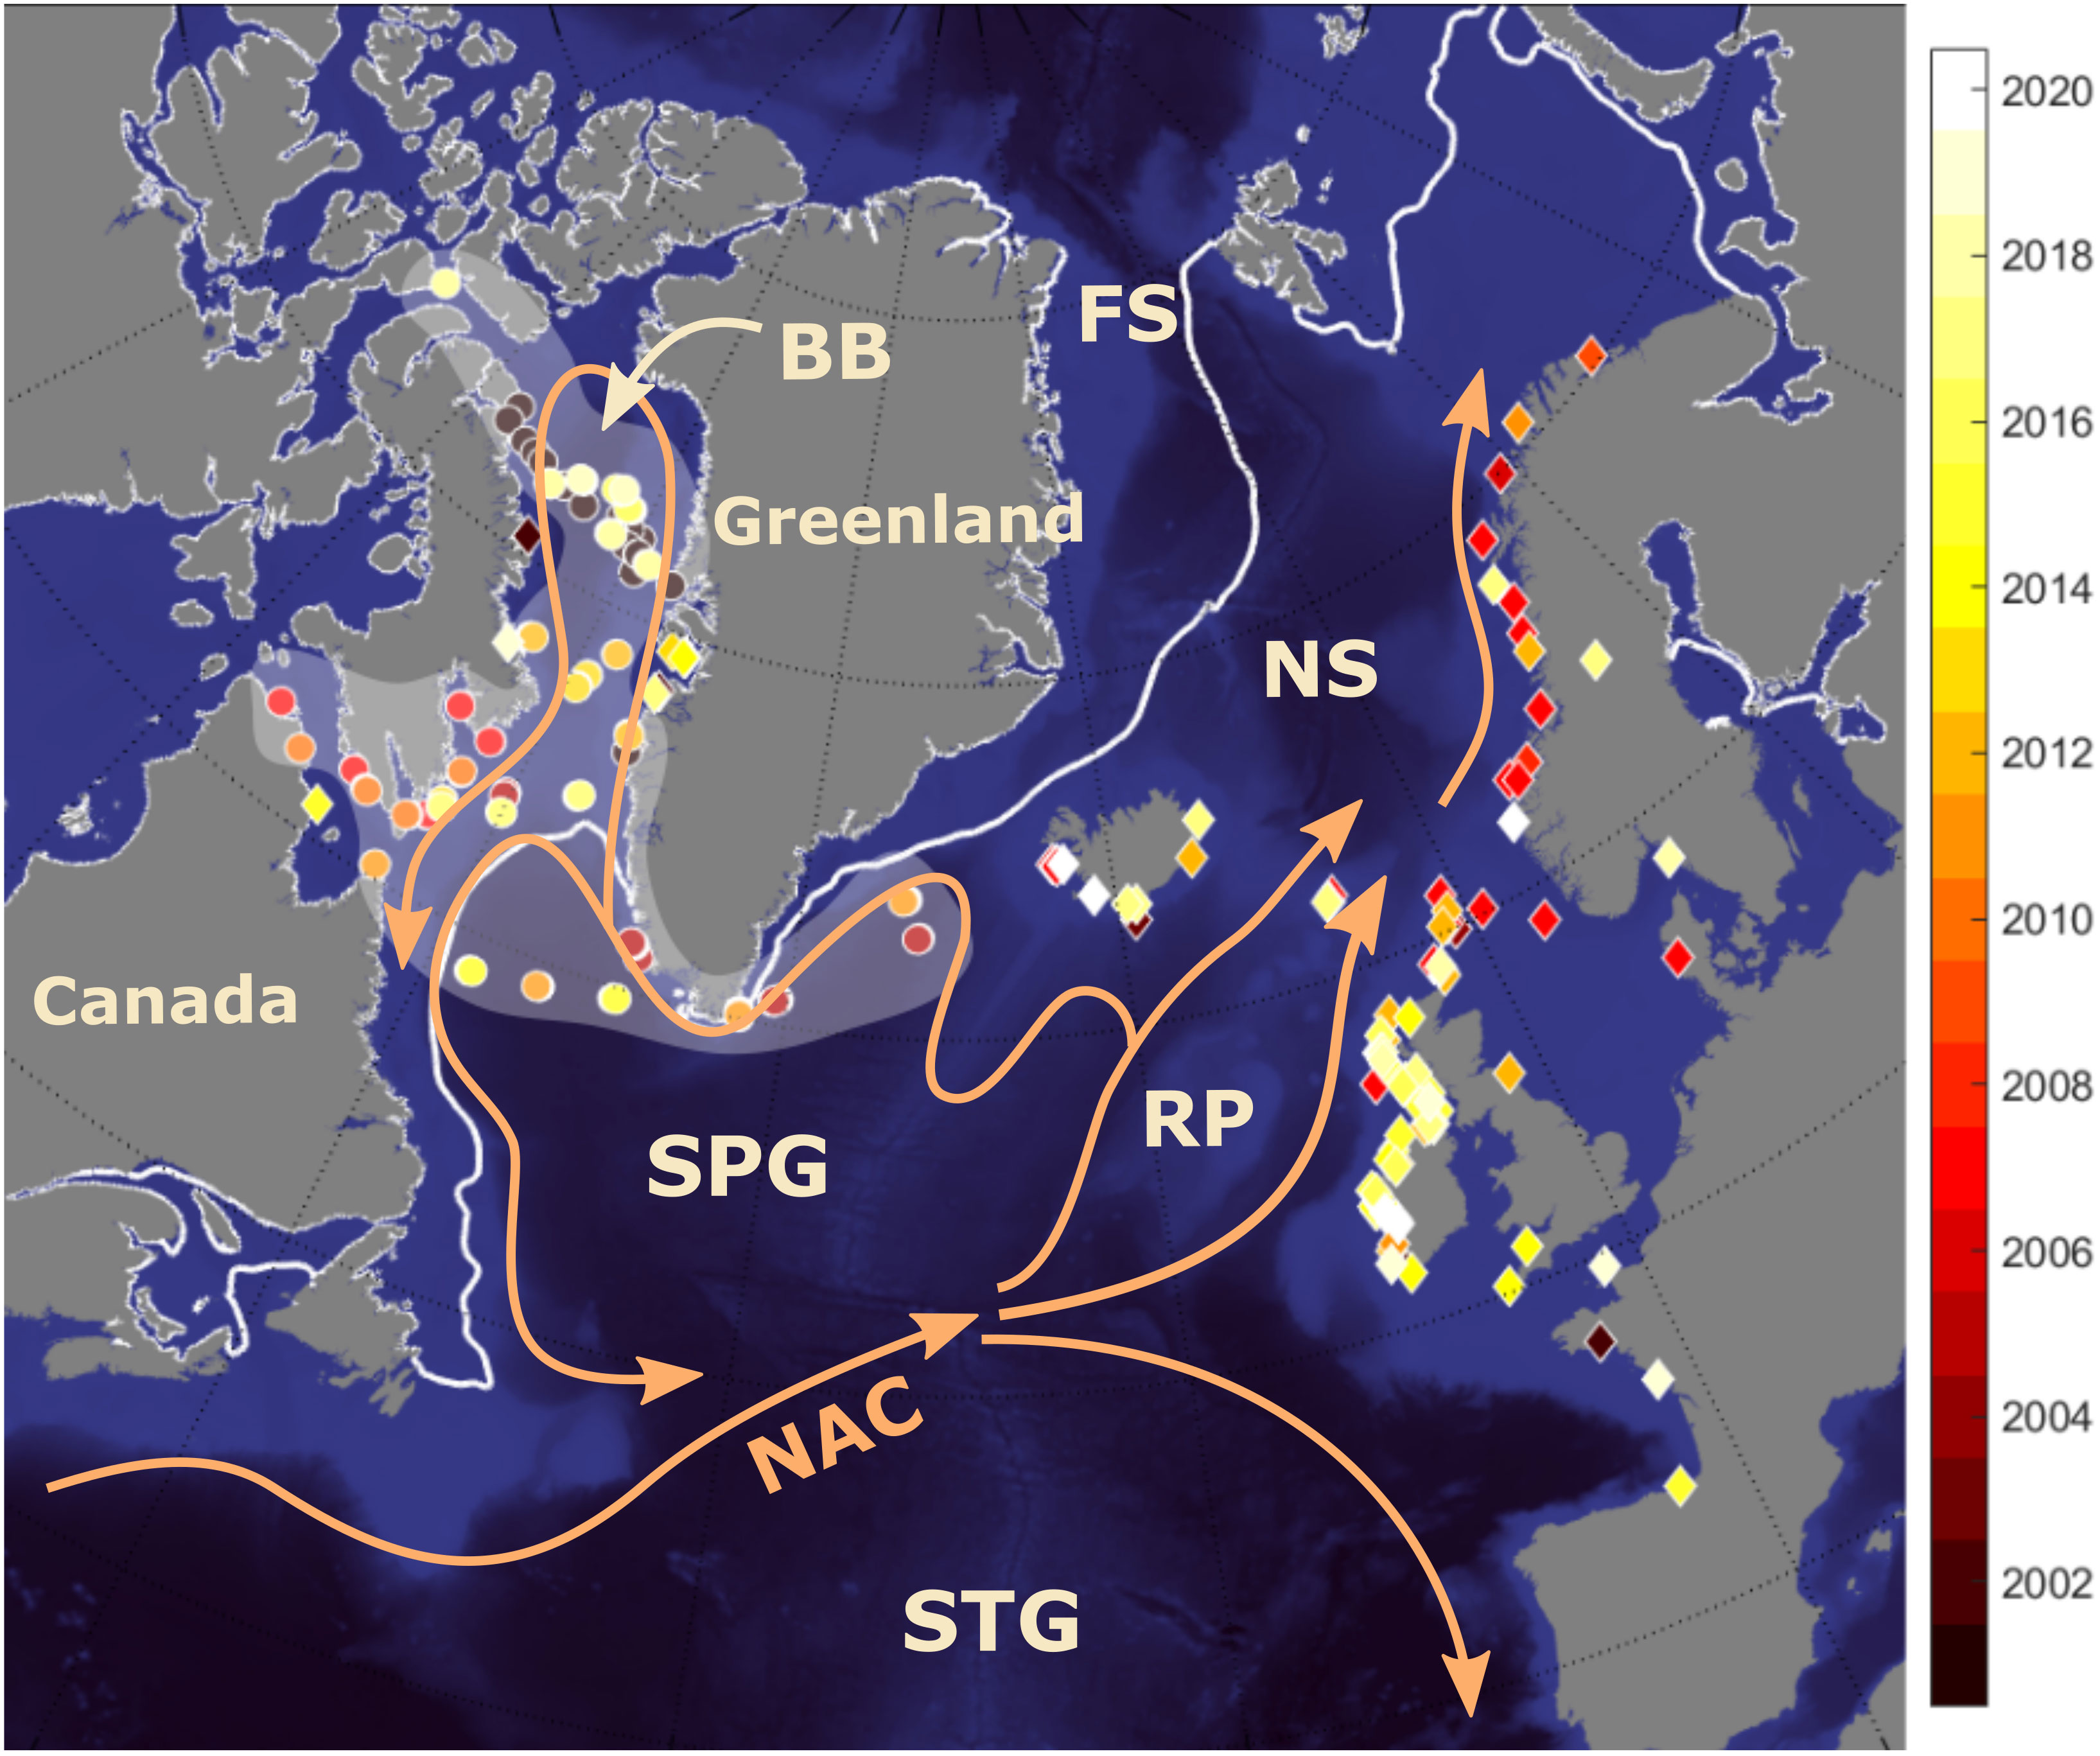
Figure 1 SOI bottle distribution. Glass bottle deployment locations are indicated by the circles, with the deployment region shown by the shading. Diamonds indicate locations where bottles were found. The color of the circles and diamonds show the year of deployment or discovery respectively. Main ocean currents are indicated by the orange arrows. The locations of the North Atlantic Subpolar Gyre (SPG), Subtropical Gyre (STG), North Atlantic Current (NAC), Fram Strait (FS), Nordic Seas (NS), Baffin Bay (BB), and Rockall Plateau (RP) are also indicated. Mean March sea ice extent (15% concentration) from our numerical model is indicated by the white line.
Our region of focus is the North Atlantic, specifically the SPG. The SPG is not a stationary flow pattern; rather, it varies in size and strength seasonally and interannually, which also impacts the direction and strength of the NAC (McCartney and Mauritzen, 2001; Häkkinen and Rhines, 2004; Häkkinen and Rhines, 2009). Earlier work has indicated two factors that influence the size and strength of the SPG (Foukal and Lozier, 2017). The first is the North Atlantic Oscillation (NAO), a regional climate oscillation based on the sea level pressure between the Azores (a subtropical high pressure region) and Iceland (a subpolar low pressure region; Wanner et al., 2001). During a positive NAO phase, the Icelandic low is lower than normal and the Azores high is higher than normal, leading to increased wind speeds over the North Atlantic and a more northward storm track. Conversely, during the negative phase of the NAO, the pressure gradient between the two regions is smaller, leading to weaker wind speeds and a storm track that has shifted to lower latitudes. This oscillation indicates the strength of the westerlies (Foukal and Lozier, 2017) and has been linked to the strength of the Nordic seas inflow (Pingree, 2005; Asbjørnsen et al., 2021). Thus we expect with stronger westerlies (positive NAO), there would be stronger flow into the Nordic Seas and a stronger SPG.
The second factor is wind stress curl, which has increasingly been suggested as the factor determining the size of the SPG (Häkkinen et al., 2011; Foukal and Lozier, 2017; Piecuch et al., 2017; Josey et al., 2018). An example would be the Eastern Atlantic Pattern (EAP; Josey et al., 2018), which is linked to the wind stress curl, and determines the direction of the westerlies (Foukal and Lozier, 2017). During the positive phase of the EAP, the positive wind stress curl region expands southwards, from the Irminger Sea into the Iceland Basin and acts to lower the sea surface height, expanding the gyre. While during the negative phase of the EAP, the negative wind stress curl region located near the Azores expands northwards over the Iceland basin, and acts to increase the sea surface height, contracting the gyre (Häkkinen et al., 2011; Foukal and Lozier, 2017; Piecuch et al., 2017). This switch of the wind stress curl over the Iceland basin would impact the direction of the NAC and the size of the SPG. It might also influence the proportion of tropical or polar water entering the Nordic Seas. Earlier work has noted that an expanded SPG leads to more polar water and less tropical water (resulting in a lower salinity anomaly) entering the Nordic seas, while a contracted SPG results in a higher proportion of tropical water (with higher salinities) entering the Nordic Seas (Bersch et al., 1999; Hátún et al., 2005; Piecuch et al., 2017; Houpert et al., 2020; Asbjørnsen et al., 2021; Desbruyères et al., 2021; Kenigson and Timmermans, 2021).
We use nearly 20 years of bottle data combined with a particle tracking tool using high resolution model output to evaluate variations in the North Atlantic surface currents from a particle perspective. A description of the bottle data as well as the model output and particle tracking tool is in Section 2. We present statistics of the data, model evaluation, and probabilities of bottle locations in Section 3. We also delve into the spatial and temporal variability of the bottle data and link these observations back to variability of the SPG. A summary of our findings in Section 4 concludes our study.
From 2001 to 2018, 2225 glass bottles were deployed in the North Atlantic Ocean by students taking part in the Arctic SOI cruises, primarily in the Canadian Arctic, Baffin Bay, Labrador Sea, and along southern and western Greenland (Figure 1). Coordinates of bottle deployments were recorded along with the date. Each bottle, a brown, short neck beer bottle, contained a note from the student, and instructions to contact SOI if found and was sealed with a crimped metal bottle cap. An earlier study of this dataset was completed by Ebbesmeyer et al. (2011). The majority of bottle deployments occurred in August (48%) and July (46%), while a few were deployed in January (6%). Of the 2225 deployed bottles, 112 (5%) were recovered, similar to earlier drift bottle recovery percentages (Hachey, 1935; Trites and Banks, 1958; Brucks, 1971). The majority of the SOI bottles were found in Europe (92%; Figure 2), with the remaining 8% recovered in Greenland and the Canadian Arctic.
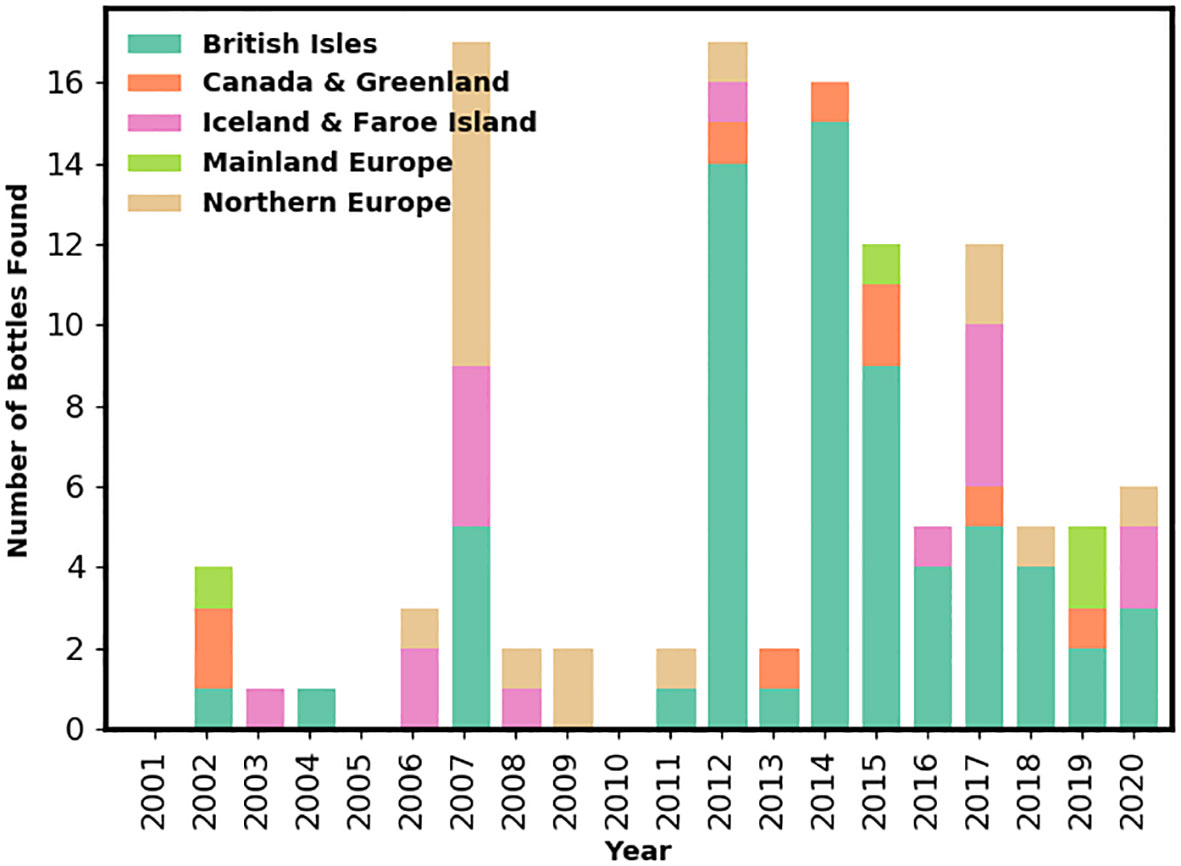
Figure 2 Bottles recovered from 2001 to 2020, separated into five regions; British Isles (UK, Scotland, Ireland, Northern Ireland), Canadian Arctic and Greenland, Iceland and the Faroe Islands, Mainland Europe (bottles found on the coasts of France and Spain), and Northern Europe (Norway, Sweden, Denmark).
Bottle recovery times ranged from 12 days to 8 years, with an average recovery time of 1.5 years. More bottles were found in later years as the program progressed. Of the 112 recovered bottles, 5% were found between 2001-2005, 21% between 2006–2010, 44% between 2011–2015, and 30% between 2015-2020 (Figure 2). The quality of bottle sealing may have varied from one expedition to another, which may have affected the bottle’s ability to remain at the surface and reach the coastline where they could be recovered, potentially contributing to recovery rate variations.
Here we used a Arctic and Northern Hemispheric Atlantic (ANHA12) configuration based on the Nucleus of European Modelling of the Ocean version 3.4 (NEMO v3.4; Madec et al., 2017). The spatial resolution of our study area, the North Atlantic and Canadian Arctic, in this model configuration ranges from 4-7.5 km. ANHA12 was forced with a high resolution atmospheric forcing dataset for ice–ocean models derived from the Canadian Meteorological Centre’s global deterministic prediction system (CGRF; Smith et al., 2014). This simulation uses river discharge forcing from Dai et al. (2009), which provides global estimates of major river runoff from 925 largest ocean draining rivers globally, and Greenland melt estimates from Bamber et al. (2012). Initial conditions were from GLobal Ocean ReanalYsis and Simulations (GLORYS2v3) produced by Mercator Ocean (Masina et al., 2017) providing three dimensional ocean fields, such as temperature, salinity, zonal and meridional velocities, as well as two dimensional fields such as sea surface height and sea ice fields. GLORYS was also used to provide monthly fields as boundary conditions for the two open boundaries, located in Bering Strait and at 20°S in the Atlantic. This simulation (Hu, 2020), as well as similar configurations, has been evaluated in previous work and has been found to simulate the North Atlantic and surrounding regions well (Hu et al., 2018; Feucher et al., 2019; Müller et al., 2019; Ridenour et al., 2019; Garcia-Quintana et al., 2021; Golla, 2023).
We used the model 5-day averaged velocity (U, V, and W), temperature, and salinity fields as input to the Lagrangian tracking tool Ariane (Blanke and Raynaud, 1997; Blanke et al., 1999). We released 10,000 particles for each bottle released in a model grid cell (approximately 4x4 km to 5.5x5.5 km in size), since multiple bottles were usually deployed at the same time, in the top 10 m, and tracked the particles forward in time for two years. We did not apply diffusion to our Lagrangian simulations. The effects of windage and Stokes Drift were also not included in our particle trajectories. Recently, windage has been shown to improve trajectories of seaweed in the tropical Atlantic, while both windage and Stokes Drift are important to include for drift trajectories of floating marine debris (Putman et al., 2018; Putman et al., 2020; van Sebille et al., 2020; Marsh et al., 2021; van Sebille et al., 2021). However, earlier work found that drifting glass bottles orient themselves horizontally in the water, such that windage is negligible (Ebbesmeyer et al., 2007; Dodimead and Hollister, 1958). An avenue for future work could be to evaluate the effects these two forces have on bottle trajectories.
Note that we also include the effects of the vertical velocity component in Ariane, which resulted in 91% of particles remaining in the top 10 m. Ariane has been used successfully in the North Atlantic and surrounding areas to track pathways of river discharge, Greenland melt, or oil spill pathways as well as to determine sources and pathways of various water masses within the North Atlantic (de Boisséson et al., 2012; Gillard et al., 2016; Grist et al., 2016; Ridenour et al., 2019; Asbjørnsen et al., 2021; Tao and Myers, 2022).
We use the GlobCurrent geostrophic velocity satellite data (Rio et al., 2014, date accessed: Dec 9, 2016) version 3.0 for the 2004-2008 time period to evaluate our ANHA12 model simulation (Figure 3). We note that due to ice cover in the northern regions, the observed geostrophic velocities are less reliable, thus we focus our comparison on the areas between approximately 36-60°N. Our model simulation produces stronger and narrower boundary currents, which is likely a result of the higher resolution of our model simulation compared to the coarser observations. Our model simulation captures the flow around the Grand Banks (east of Newfoundland) where the Labrador Current and Gulf Stream join to form the NAC. We find that the northern route of the NAC is generally captured with the direction of the flow being simulated by our model. The southern route is also captured in our model simulation, however, observations show this flow to be located slightly to the west of where our model simulates it. We also note that there are more offshoots from the Gulf Stream and North Atlantic Current flowing to the east in the observations compared to our model simulation. However, given that this current system creates a barrier to the bottles and prevents them from travelling southward (Ebbesmeyer et al., 2011), differences between the model and observations in the southern regions (such as the STG) are less important.
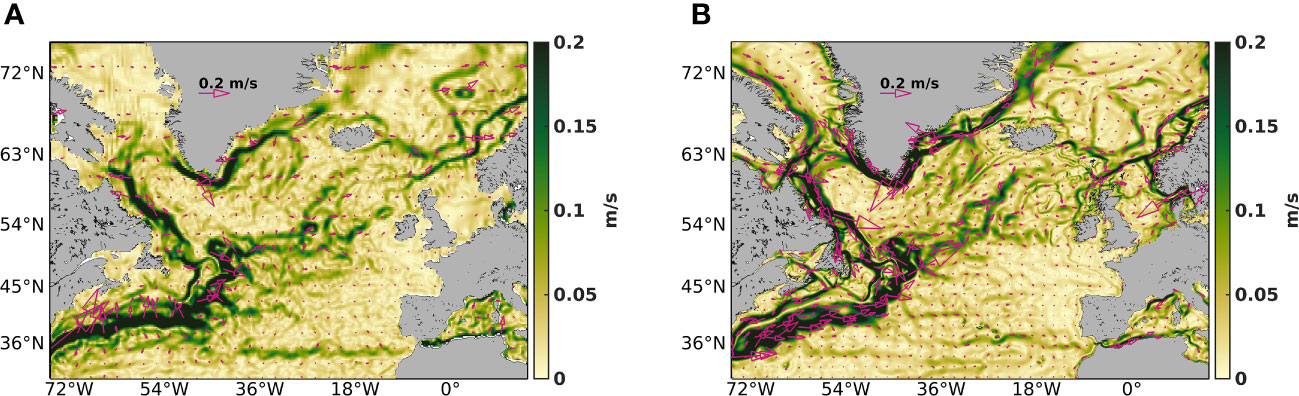
Figure 3 Mean geostrophic velocities for the years 2004-2008 for (A) GlobCurrent satellite observations and (B) our ANHA12 model simulation. Speed of the geostrophic velocities are shown by the yellow to green shading, while velocity vectors are indicated by the pink arrows.
We used the data from the recovered bottles (date and location of deployment and recovery) to evaluate the lagrangian pathways from Ariane and assess the performance of the model. This evaluation uses virtual particles that travelled within 15 km of the bottle recovery location, hereby referred to as the recovery area.
Of the 112 recovered bottles, only 18 recovery locations had particles drift within the recovery area. The median of the minimum distance between the virtual particles and the bottle recovery location was about 1830 km for the whole dataset. For bottles recovered on the western side of the Atlantic (Greenland and the Canadian Arctic), 58% of the particles released drifted within 15 km of 4 recovered bottle locations. Comparatively, for the bottles found on the eastern side of the Atlantic, 0.00006% of particles drifted within 15 km of 14 bottle recovery locations.
We see a higher number of particles drifting close to the bottle recovery locations that are close to the bottle deployment location, such as Baffin Bay and northeastern Canada, compared with those recovery locations that are farther away from the deployment location (Europe). There are fewer opportunities for particles to diverge to alternative pathways on the western side of the Atlantic as the travel time is short and particles are confined by land and drift with the strong coastal currents. For particles that drift into the NAC, the flow is not confined by land as is the case in Baffin Bay, and the flow is highly variable. This means there is a lower chance that the particles will reach the bottle recovery location, and explains why such a high percentage of particles drift near the recovery locations in the western Atlantic, while on the eastern side of the Atlantic, the percentage is very small.
Using the recovery area defined above to calculate the following averages, drift bottles found on the western side of the Atlantic had an average deployment time period of 1005 days (4 bottles; Table 1), while virtual particles had an average time period of 55 days. On the eastern side of the Atlantic, drift bottles took an average of 459 days (based on 14 bottles), while virtual particles took an average 648 days.
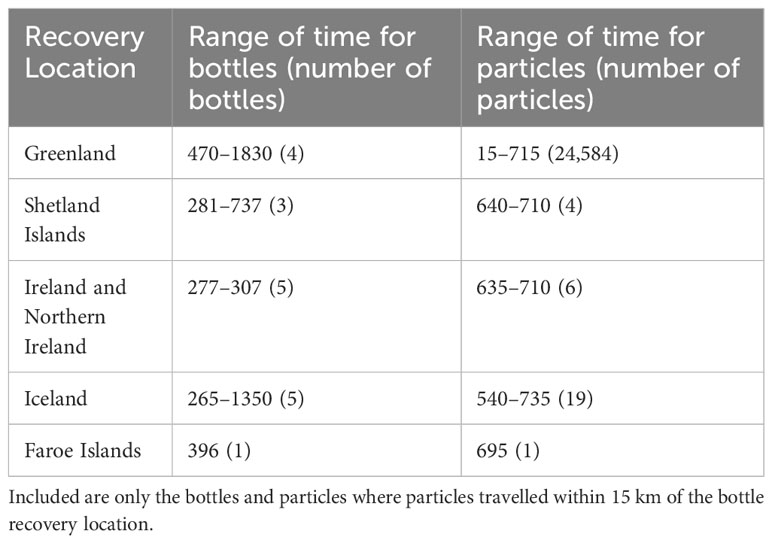
Table 1 Range of travel time in units of days for SOI bottles and Ariane particles to the bottle recovery location.
Model drift times are generally faster than bottle drift times for closer locations and slower for bottles recovered farther away. It is possible that some bottles are washed ashore and are not found for many years, especially in sparsely populated regions such as Greenland and eastern Canada, which can impact the results. However, there are some processes that may speed up or slow down particle drift. We use 5 day averages, which remove short term accelerations in the flow due to storms and strong winds. Small scale flows are parameterized in the ocean model, which may not only explain the speed of the particles, but also impact how close to the coast the particles drift. As stated above, windage and Stokes Drift are also not included. These two processes would act to increase bottle speeds, and could lower the travel time of the particles.
We note that onshore winds are likely important for getting bottles to the shore in certain areas. An example from one of the recovered bottles, the founder noted that the bottle was likely brought to the shore during a storm that passed by a few days earlier.
Using the Ariane particle data, we calculated the probability of a particle being present in a coastal grid cell (within ∼5 km; Figure 4). Low probabilities are noted around Iceland, the British Isles, the Faroe Islands, Azores, and Madeira. On the other hand, relatively high probabilities (>0.5%) are located along the east coast of Canada, the eastern Canadian Arctic, and the west coast of Greenland.
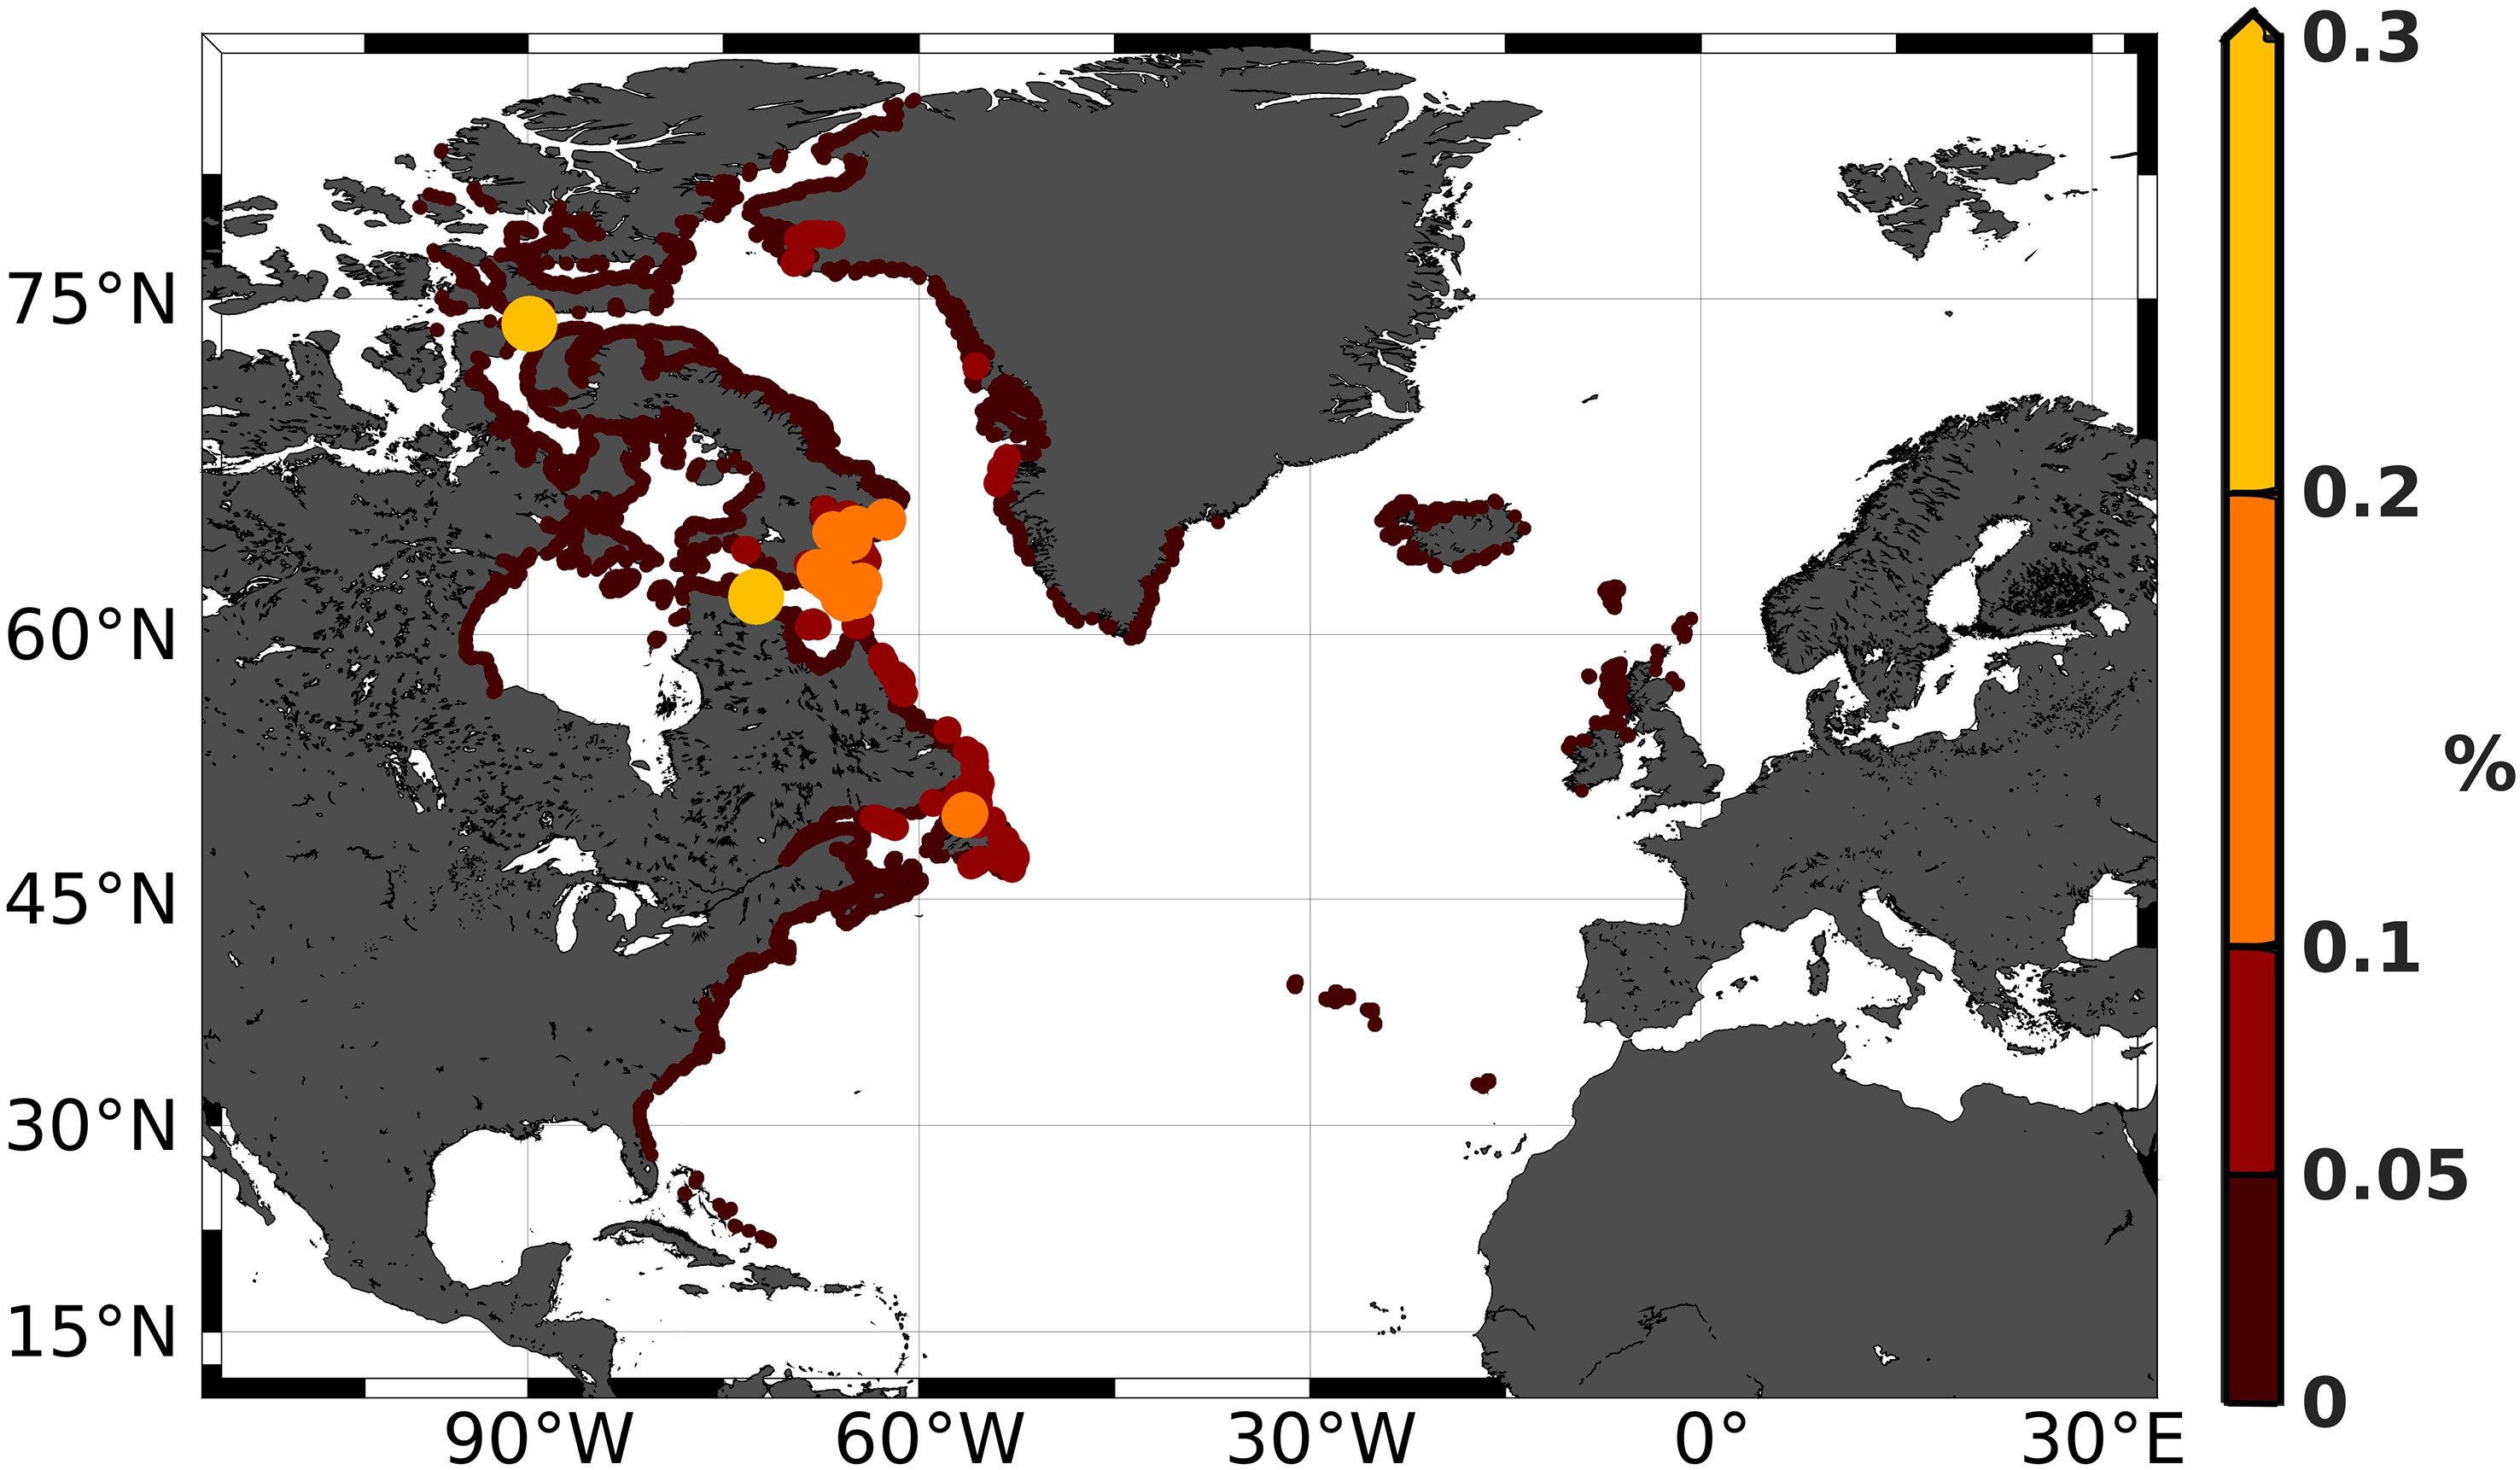
Figure 4 Probability of locating virtual particles in coastal grid cells. Higher probabilities are indicated by larger circles and lighter colors, while lower probabilities are indicated by smaller circles and darker colors.
The ocean circulation in this region, as well as where the particles were deployed, provide some explanation to this distribution. Virtual particles deployed close to the coast in southwestern Greenland, can be swept northwards by the West Greenland Current, explaining the higher probabilities along the west Greenland coast. The cyclonic flow in Baffin Bay carries the particles to the southward flowing Baffin Island Current along the eastern coast of Baffin Island, which transitions to the Labrador Current south of Hudson Strait. The two locations with the highest probabilities occur in Lancaster Sound and Hudson Strait (yellow circles in Figure 4), where the flow is constrained spatially and changes direction. In Hudson Strait (located under the southern yellow circle in Figure 4), the higher probability is likely due to the southward cross strait flow that occurs in the middle of the strait, which recirculates the westward flowing waters on the northern side of the strait to the eastward flowing current on the southern side of the strait (Straneo and Saucier, 2008; Ridenour et al., 2021). This would concentrate particles along the southern coast. In Lancaster Sound, waters flow westward (Wang et al., 2012; Grivault et al., 2018), and are deflected southward between Somerset and Baffin Islands, and flow into the Gulf of Boothia. The higher probability is noted near Prince Leopold Island (northern yellow circle in Figure 4), a small island off the coast of Somerset Island, which partly blocks the diverted waters.
Interestingly, the locations of highest probability do not coincide with the locations where most bottles were found. The SOI bottle data shows most bottles (92%) were found on the eastern side of the Atlantic Ocean. We suspect that this discrepancy is related to the population density in these regions. In the European nations, the population density ranges from 3.5 people/km2 in Iceland to 274.7 people/km2 in the United Kingdom (as of 2018; https://data.worldbank.org/indicator/EN.POP.DNST). Comparatively, Greenland has a population density of 0.14 people/km2 (2018), Nunavut with 0.02 people/km2, Nunavik at 0.03 people/km2, and Newfoundland and Labrador at 1.4 people/km2 (as of 2016; Statistics Canada, 2017). Thus, the overall population density on the western side of the Atlantic is at least one to two orders of magnitude lower than on the eastern side of the Atlantic. We also want to note that there are likely lifestyle differences between the European nations on the east side of the Atlantic compared to those on the west side of the Atlantic. An example would be the differing number of beachcombers in the different regions. This aspect, however, is beyond the scope of this study.
Additionally, the accessibility of the coastline would also play a role in a person’s ability to find bottles that have washed ashore. The Canadian Arctic and Greenlandic coastlines are made up of numerous fjords, which not only make the coastline significantly longer, but many of these fjords have steep sides or sheer cliffs, making it accessible only by boat. If bottles were washed to a coastline of this type, there is a higher chance that the bottles could be destroyed by these cliff faces during times of rough weather as well.
Lastly, the presence of sea ice would impact bottle survivability and lower its chances of being found (Figure 1). Many fjords in the north have ocean terminating glaciers or contain landfast sea ice (Cook et al., 2019; Cooley et al., 2020), both which make the coast inaccessible. The northwestern side of the Atlantic, as well as Baffin Bay and the Canadian Arctic, has significant seasonal to year round sea ice coverage (Parkinson, 2022). Comparatively, the eastern side of the North Atlantic is ice free throughout the year.
Figure 5 shows the total probability of finding a virtual particle in a particular location in the ocean. This highlights the main pathways which correspond to some of the main ocean currents and bathymetric features in the western North Atlantic. The probability decreases the farther east the particles travel and where main pathways are less clear due to particle dispersion. Thus the possible locations of where the missing bottles could be are numerous.
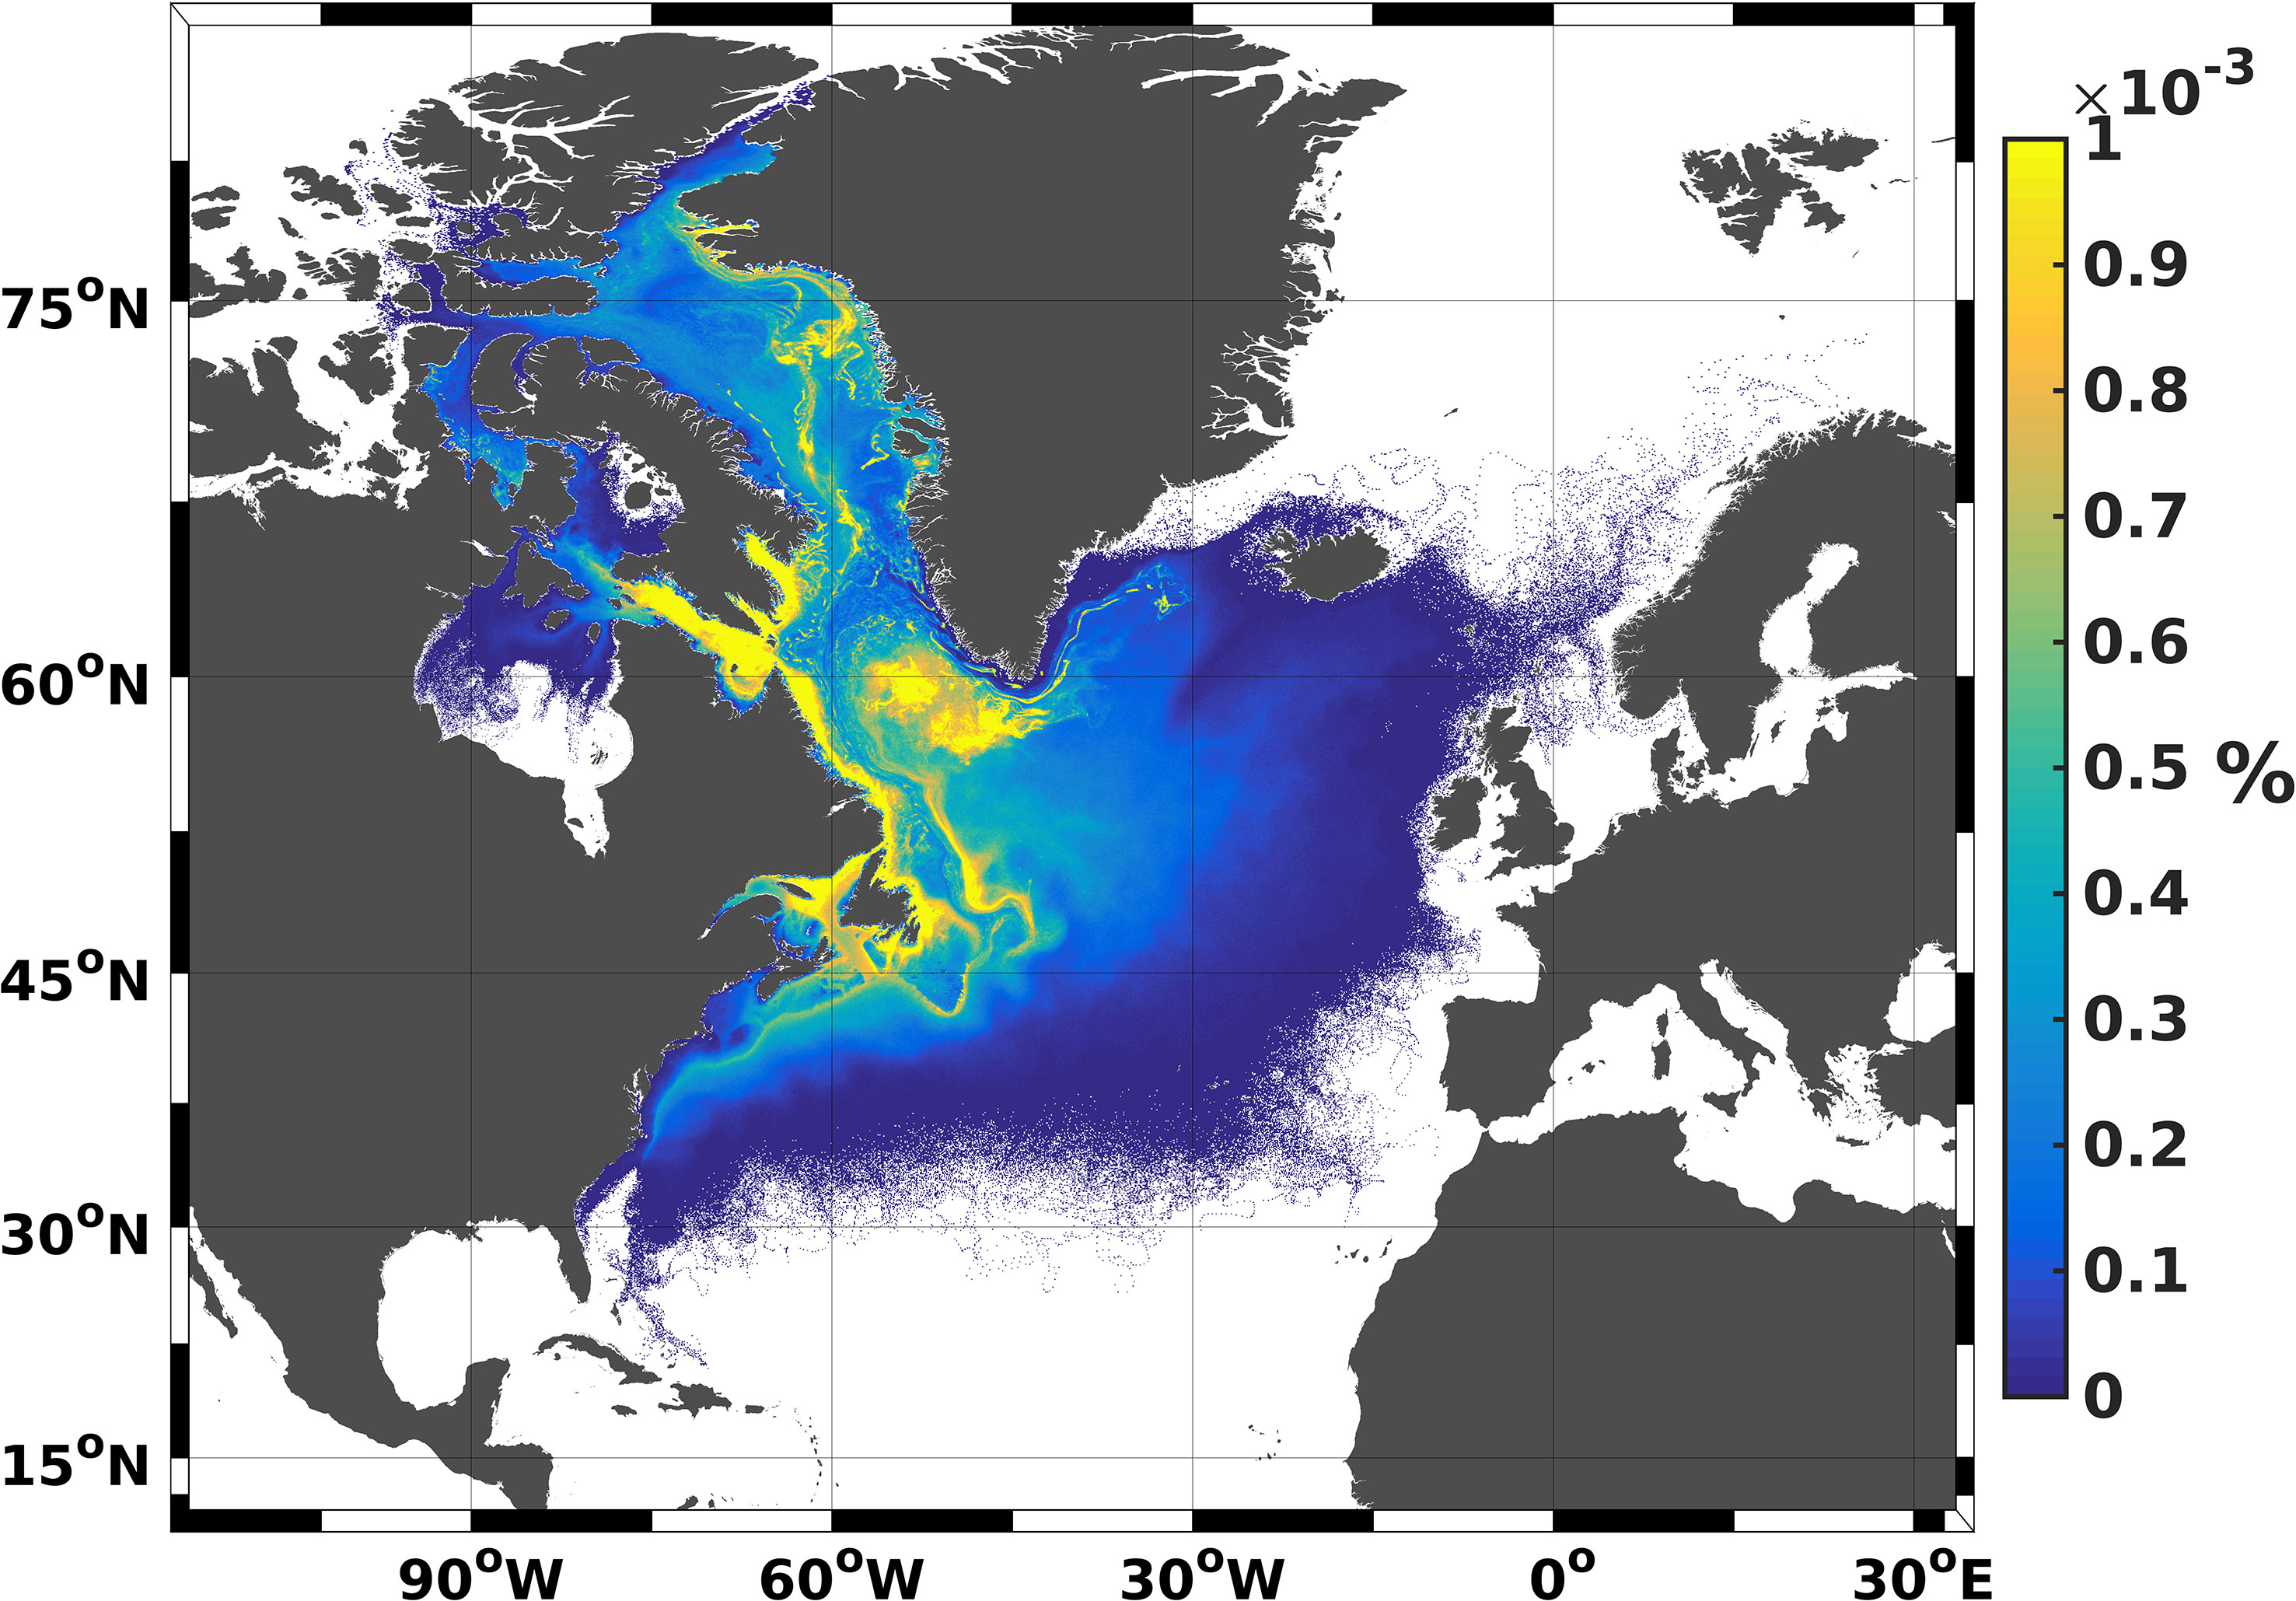
Figure 5 Probability of locating a virtual particle in a particular ocean model grid cell.
Combining the bottle data with the model output we find the virtual particles tend to follow the main ocean currents (Figures 5, 6). On the western side of the Atlantic, virtual particles deployed in eastern Davis Strait or northwards in eastern Baffin Bay, travel counter clockwise around the bay (Figure 6A). Some particles enter the Canadian Arctic Archipelago while many particles are swept up in the freshwater outflow from Lancaster Sound, and flow southwards, to join the inner Labrador Current or flow into Hudson Strait.
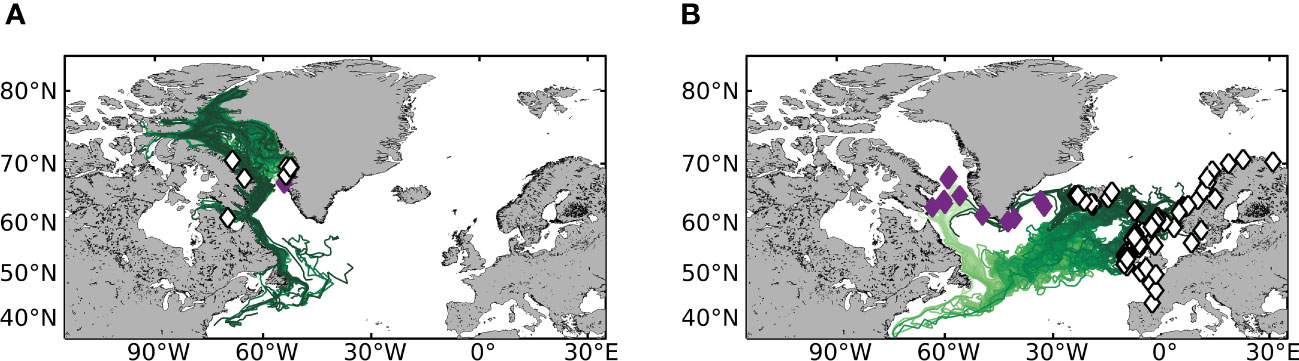
Figure 6 Virtual particle trajectories for recovered bottle locations. For both panels, lighter colors indicate the start of the pathway, while darker colors indicate the end. Purple diamonds indicate where particles/bottles were dropped, while white and black diamond show where drift bottles were found. (A) Main particle pathways for bottles found on the western side of the Atlantic that travelled within the recovery area (15 km). (B) Main particle pathways for bottles found on the eastern side of the Atlantic with a distance threshold of 50 km.
Virtual particles deployed south of Davis Strait, western Baffin Bay, or south of Greenland, tend to travel counterclockwise around the North Atlantic (Figure 6B), and drift eastwards over to Europe. Particles taking this route, enter the outer Labrador Current and drift into the NAC. In general, we find that the virtual particles follow the main ocean currents, and thus their trajectories have the potential to be impacted by the large scale ocean circulation and changes within.
To illustrate this more clearly, we focus on two time periods in the recent past, the first, 2004–2008, and the second, 2012–2016. From 2004–2008, the SPG was transitioning from a warm phase (contracted) to a cold phase (expanded; Robson et al., 2016; Piecuch et al., 2017; Asbjørnsen et al., 2021; Kenigson and Timmermans, 2021). The wind stress curl during 2005–2007 was weak (negative anomaly) over the SPG (at 46°N) with an increase in northward heat transport to the eastern North Atlantic (Figure 10 in Piecuch et al., 2017). Additionally, the SAF (and related NAC) was directed northwards, towards Iceland, at this time (Kenigson and Timmermans, 2021, Figure 5). During these years, there was an increase in the number of bottles found at higher latitudes (Figure 2). Figure 7A shows a strong, unbroken flow across the Atlantic directed towards Iceland. Particle trajectories (Figure 7C) show particles take one of two routes at this time. The northern route is directed towards Iceland in the strong northward flow indicated by darker shades of green in Figure 7A. The second pathway is to the south, bringing particles to the northern coastline of the British Isles and into the Norwegian and North Seas. During this time more drift bottles are found in these northern locations, which is consistent with a northwestward shift in the NAC due to a contracted SPG (Robson et al., 2016; Piecuch et al., 2017; Asbjørnsen et al., 2021; Kenigson and Timmermans, 2021).
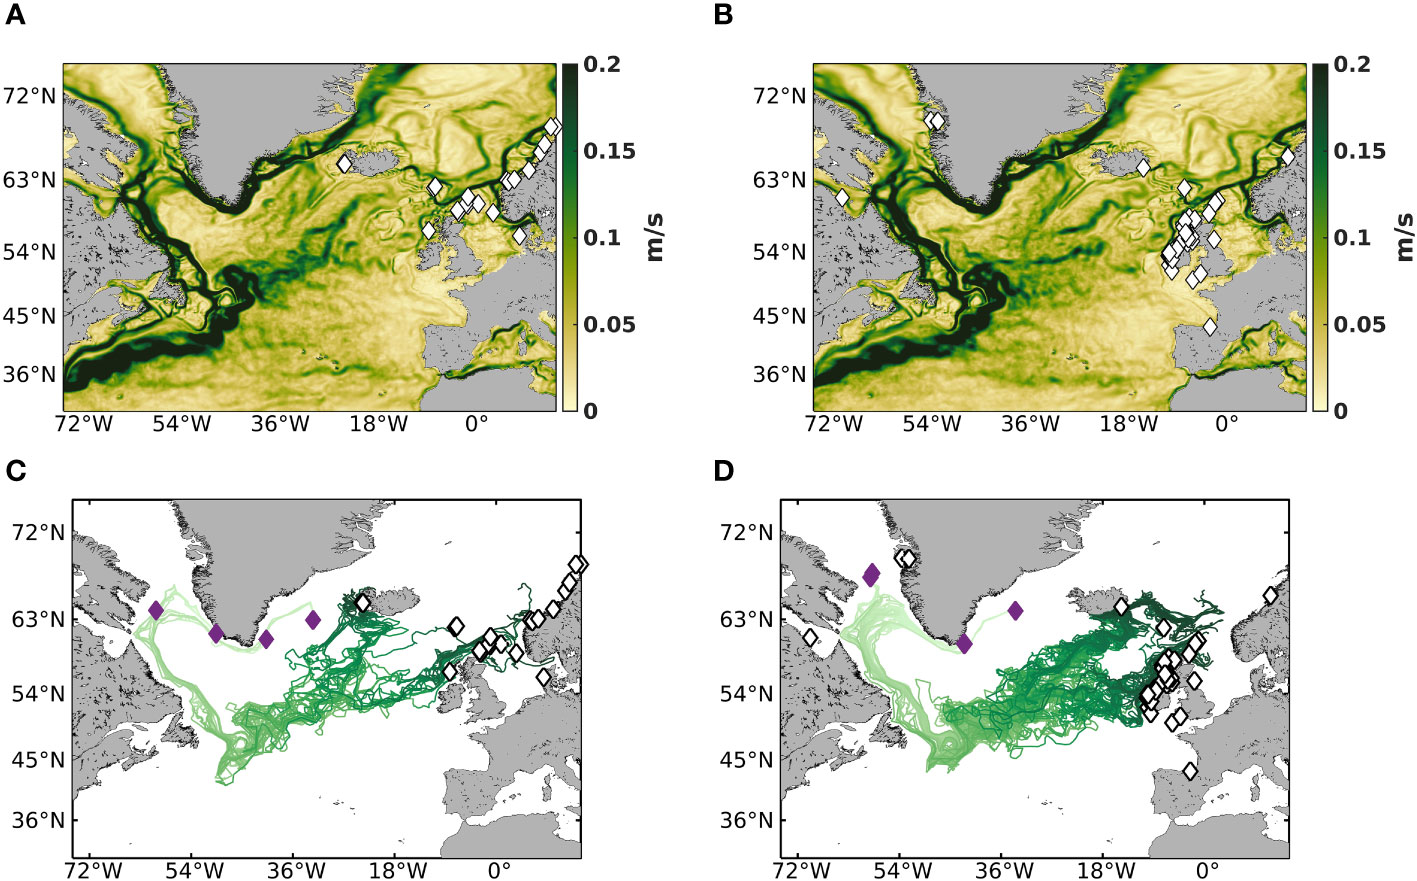
Figure 7 (A) Mean top 10 m current speed for the years 2004–2008 and (B) 2012-2016. Black and white diamonds show the locations of bottles found during the respective time periods. Lower panels show simulated particle trajectories that drifted within 50 km of the drift bottle recovery location for the years (C) 2004–2008 and (D) 2012–2016. Purple diamonds show where bottles/particles were deployed.
Conversely, during 2012–2016, the SPG was expanding (Holliday et al., 2020; Desbruyères et al., 2021; Kenigson and Timmermans, 2021). The wind stress curl over the SPG was increasing while the transport of warm water to the north was decreasing (Figure 10 in Piecuch et al., 2017). The SAF (and NAC) was moving to the west (Kenigson and Timmermans, 2021, Figure 5), while record high NAO and EAP indices were recorded (Josey et al., 2018; Kenigson and Timmermans, 2021). It is at this time that more bottles are found on the British Isles (Figures 2, 7B, D). The flow path across the Atlantic is broad, fragmented, with lower velocities (Figure 7B). The two routes mentioned previously have both shifted to the southeast, with the northern route directed towards eastern Iceland, while the southern route brings particles to southern Ireland before flowing northwards along the Irish and Scottish coastlines. This suggests that the bottles are drifting with the large scale ocean currents, such as the NAC, and bottle distributions are consistent with changes in the NAC direction due to the expansion and contraction of the SPG.
We highlight some limitations of our modelling study. We do not include the effects of Stokes Drift in our Lagrangian simulations. Waves are not simulated in our ocean model, thus the virtual particles do not have a drift component in the direction of wave propagation. As noted earlier, we assume windage is negligible on the glass bottles and do not include it in our Lagrangian simulations, however including windage could increase the drift speed of the virtual particles, allowing them to travel further or ‘beach’ sooner.
Our ocean model has a resolution of meaning oceanographic features on similar scales or smaller than the horizontal resolution of the model are not well resolved and will affect the drift of the virtual particles less than if these features were resolved. An example of this are the eddies (Irminger Rings) that shed off the west Greenland coast and propagate into the Labrador Sea, which are not well resolved at , but are at (Gou et al., 2023).
Finally, the number of recovered bottles is small and contains bias from a number of factors. These include, but are not limited to, the coastal population density, shape and accessibility of the coastline, and the local climate.
This study presents observational drift bottle data in combination with passive particle trajectories from a high resolution regional ocean model. The majority of recovered bottles were found on the eastern side of the Atlantic, even though the modelled probability of finding a bottle on the western side of the Atlantic is much higher. We attribute the majority of this model-data discrepancy to observer bias, given the low population densities in Canada and Greenland, though other factors such as on-shore winds, shoreline topography, and model bias may also contribute. The spatial and temporal variability of the bottle recovery locations on the eastern side of the Atlantic are consistent with changes in the large scale ocean circulation, in this case, the expansion and contraction of the SPG.
The temporal and spatial variability of the bottle data depends not only on the large scale ocean circulation, which determines where the bottles go, but also environmental conditions such as sea ice, in addition to population density and accessibility of the coastlines.
The SOI bottle data shows that even the simplest form of collecting data is useful and, when combined with other data, can help provide clues about circulation changes in our oceans. Programs such as SOI should continue to be supported, not only as an educational and citizen engagement tool, but the data that comes out of these programs can improve our understanding of lagrangian drift issues. As it is these large scale ocean currents that determine the distribution and concentration of marine pollution, such as plastic or oil, biological tracers, such as fish larvae, or, in this case bottles!
The original contributions presented in the study are publicly available. This data can be found here: https://zenodo.org/record/7799549 and https://zenodo.org/record/7931438.
EG had initial idea for the study. NR, CP, and TW-G ran ariane experiments. NR, CP, TW-G, and JM conducted analysis. NR wrote the majority of the manuscript with feedback from all coauthors. EG and GG provided details about the SOI expeditions, knowledge of the Arctic, as well as details on recovered bottles. PM was the principal investigator and provided supervision and feedback on all aspects of the study. All authors contributed to the article and approved the submitted version.
Funding for this manuscript is from ArcticNet.
We would like to acknowledge all students, educators, organizers, and crews of the SOI expeditions, as well as the citizen scientists around the globe who reported their bottles back to SOI. We would also like to acknowledge the University of Manitoba, Clayton H. Riddell Faculty, and the Centre for Earth Observation Science (CEOS). We would like to thank two reviewers who provided valuable feedback which improved this paper.
The authors declare that the research was conducted in the absence of any commercial or financial relationships that could be construed as a potential conflict of interest.
All claims expressed in this article are solely those of the authors and do not necessarily represent those of their affiliated organizations, or those of the publisher, the editors and the reviewers. Any product that may be evaluated in this article, or claim that may be made by its manufacturer, is not guaranteed or endorsed by the publisher.
Adams J., Hendderson B., Turrell B. (1991). Drift bottles from the past. Ocean Challenge (Marine Scotland Science) 2 (3), 25–30. doi: 10.13140/RG.2.2.15572.22408
Asbjørnsen H., Johnson H. L., Årthun M. (2021). Variable nordic seas inflow linked to shifts in north atlantic circulation. J. Climate 34, 7057–7071. doi: 10.1175/JCLI-D-20-0917.1
Bamber J., Van Den Broeke M., Ettema J., Lenaerts J., Rignot E. (2012). Recent large increases in freshwater fluxes from Greenland into the North Atlantic. Geophysical Res. Lett. 39, 1–4. doi: 10.1029/2012GL052552
Bersch M., Meincke J., Sy A. (1999). Interannual thermohaline changes in the northern North Atlantic 1991–1996. Deep Sea Res. Part II: Topical. Stud. Oceanography 46, 55–75. doi: 10.1016/S0967-0645(98)00114-3
Blanke B., Arhan M., Madec G., Roche S. (1999). Warm water paths in the equatorial atlantic as diagnosed with a general circulation model. J. Phys. Oceanography 29, 2753–2768. doi: 10.1175/1520-0485(1999)029(2753:WWPITE)2.0.CO;2
Blanke B., Raynaud S. (1997). Kinematics of the pacific equatorial undercurrent: an eulerian and lagrangian approach from GCM results. J. Phys. Oceanography 27, 1038–1053. doi: 10.1175/1520-0485(1997)027(1038:KOTPEU)2.0.CO;2
Brown C. (1916). Additional notes on the deep currents of the North Sea as ascertained by drift bottles. Fishery Board Scotland Sci. Investigations 11.
Brucks J. T. (1971). Currents of the caribbean and adjacent regions as deduced from drift-bottle studies. Bull. Mar. Sci. 21, 455–465.
Cook A. J., Copland L., Noël B. P. Y., Stokes C. R., Bentley M. J., Sharp M. J., et al. (2019). Atmospheric forcing of rapid marine-terminating glacier retreat in the Canadian Arctic Archipelago. Sci. Adv. 5, eaau8507. doi: 10.1126/sciadv.aau8507
Cooley S. W., Ryan J. C., Smith L. C., Horvat C., Brodie P., Dale B., et al. (2020). Coldest Canadian Arctic communities face greatest reductions in shorefast sea ice. Nat. Climate Change 10, 533–538. doi: 10.1038/s41558-020-0757-5
Dai A., Qian T., Trenberth K. E., Milliman J. D. (2009). Changes in continental freshwater discharge from 1948 to 2004. J. Climate 22, 2773–2792. doi: 10.1175/2008JCLI2592.1
Daniault N., Mercier H., Lherminier P., Sarafanov A., Falina A., Zunino P., et al. (2016). The northern North Atlantic Ocean mean circulation in the early 21st century. Prog. Oceanography 146, 142–158. doi: 10.1016/j.pocean.2016.06.007
Day C. G. (1958). Surface circulation in the gulf of maine as deduced from drift bottles. Fishery Bull. Fish. Wildlfe Service 58, 443–472.
de Boisséson E., Thierry V., Mercier H., Caniaux G., Desbruyères D. (2012). Origin, formation and variability of the Subpolar Mode Water located over the Reykjanes Ridge. J. Geophysical Res.: Oceans 117, 1-14. doi: 10.1029/2011JC007519
Desbruyères D., Chafik L., Maze G. (2021). A shift in the ocean circulation has warmed the subpolar North Atlantic Ocean since 2016. Commun. Earth Environ. 2, 1–9. doi: 10.1038/s43247-021-00120-y
Dodimead A. J., Hollister H. J. (1958). Progress report of drift bottle releases in the northeast pacific ocean. J. Fisheries Res. Board Canada 15, 851–865. doi: 10.1139/f58-048
Ebbesmeyer C. C., Belkin I. M., Drost H. E., Zimmermann S., Carmack E. C. (2011). Wall across the atlantic: drift bottles released by students confirm that the gulf stream prevents subarctic surface drifters from escaping south. Oceanography 24, 172–174. doi: 10.5670/oceanog.2011.15
Ebbesmeyer C. C., Ingraham W. J., Royer T. C., Grosch C. E. (2007). Tub toys orbit the Pacific subarctic gyre. Eos Trans. Am. Geophysical Union 88, 1–4. doi: 10.1029/2007EO010001
Ebbesmeyer C., Scigliano E. (2009). Flotsametrics and the Floating World; How one man’s obsession with runaway sneakers and rubber ducks revolutionized ocean science (New York: Smithsonian Books, Harper Collins).
Feucher C., Garcia-Quintana Y., Yashayaev I., Hu X., Myers P. G. (2019). Labrador sea water formation rate and its impact on the local meridional overturning circulation. J. Geophysical Res.: Oceans 124, 5654–5670. doi: 10.1029/2019JC015065
Foukal N. P., Lozier M. S. (2017). Assessing variability in the size and strength of the North Atlantic subpolar gyre. J. Geophysical Res.: Oceans 122, 6295–6308. doi: 10.1002/2017JC012798
Garcia-Quintana Y., Grivault N., Hu X., Myers P. G. (2021). Dense water formation on the Icelandic shelf and its contribution to the north Icelandic jet. J. Geophysical Res.: Oceans 126, e2020JC016951. doi: 10.1029/2020JC016951
Gillard L. C., Hu X., Myers P. G., Bamber J. L. (2016). Meltwater pathways from marine terminating glaciers of the Greenland ice sheet. Geophysical Res. Lett. 43, 10,873–10,882. doi: 10.1002/2016GL070969
Golla S. (2023). Western boundary currents: Representation in high-resolution ogcms and their relationship with climate modes.
Gou R., Li P., Wiegand K. N., Pennelly C., Kieke D., Myers P. G. (2023). Variability of eddy formation off the west Greenland coast from a 1/60° model. J. Phys. Oceanography. doi: 10.1175/JPO-D-23-0004.1
Grist J. P., Josey S. A., Jacobs Z. L., Marsh R., Sinha B., Van Sebille E. (2016). Extreme air–sea interaction over the North Atlantic subpolar gyre during the winter of 2013–2014 and its sub-surface legacy. Climate Dynamics 46, 4027–4045. doi: 10.1007/s00382-015-2819-3
Grivault N., Hu X., Myers P. G. (2018). Impact of the surface stress on the volume and freshwater transport through the canadian arctic archipelago from a high-resolution numerical simulation. J. Geophysical Res.: Oceans 123, 9038–9060. doi: 10.1029/2018JC013984
Hachey H. B. (1935). Circulation of Hudson Bay water as indicated by drift bottles. Science 82, 276–275. doi: 10.1126/science.82.2125.275
Häkkinen S., Rhines P. B. (2004). Decline of subpolar north atlantic circulation during the 1990s. Science 304, 555–559. doi: 10.1126/science.1094917
Häkkinen S., Rhines P. B. (2009). Shifting surface currents in the northern North Atlantic Ocean. J. Geophysical Res.: Oceans 114, 1–12. doi: 10.1029/2008JC004883
Häkkinen S., Rhines P. B., Worthen D. L. (2011). Warm and saline events embedded in the meridional circulation of the northern North Atlantic. J. Geophysical Res.: Oceans 116, 1–13. doi: 10.1029/2010JC006275
Harrap L. (2021). This rubber duck started a river race in Alberta and washed ashore in Russia (Edmonton, Alberta, Canada: CBC News).
Hátún H., Sandø A. B., Drange H., Hansen B., Valdimarsson H. (2005). Influence of the atlantic subpolar gyre on the thermohaline circulation. Science 309, 1841–1844. doi: 10.1126/science.1114777
Holliday N. P., Bersch M., Berx B., Chafik L., Cunningham S., Florindo-López C., et al. (2020). Ocean circulation causes the largest freshening event for 120 years in eastern subpolar North Atlantic. Nat. Commun. 11, 1–15. doi: 10.1038/s41467-020-14474-y
Houpert L., Cunningham S., Fraser N., Johnson C., Holliday N. P., Jones S., et al. (2020). Observed variability of the north atlantic current in the rockall trough from 4 years of mooring measurements. J. Geophysical Res.: Oceans 125, e2020JC016403. doi: 10.1029/2020JC016403
Houpert L., Inall M. E., Dumont E., Gary S., Johnson C., Porter M., et al. (2018). Structure and transport of the north atlantic current in the eastern subpolar gyre from sustained glider observations. J. Geophysical Res.: Oceans 123, 6019–6038. doi: 10.1029/2018JC014162
Hu X., Sun J., Chan T. O., Myers P. G. (2018). Thermodynamic and dynamic ice thickness contributions in the Canadian Arctic Archipelago in NEMO-LIM2 numerical simulations. Cryosphere 12, 1233–1247. doi: 10.5194/tc-12-1233-2018
Josey S. A., Hirschi J. J.-M., Sinha B., Duchez A., Grist J. P., Marsh R. (2018). The recent atlantic cold anomaly: causes, consequences, and related phenomena. Annu. Rev. Mar. Sci. 10, 475–501. doi: 10.1146/annurev-marine-121916-063102
Kenigson J. S., Timmermans M.-L. (2021). Nordic seas hydrography in the context of arctic and north atlantic ocean dynamics. J. Phys. Oceanography 51, 101–114. doi: 10.1175/JPO-D-20-0071.1
Kieke D., Yashayaev I. (2015). Studies of Labrador Sea Water formation and variability in the subpolar North Atlantic in the light of international partnership and collaboration. Prog. Oceanography 132, 220–232. doi: 10.1016/j.pocean.2014.12.010
Körtzinger A., Schimanski J., Send U., Wallace D. (2004). The ocean takes a deep breath. Science 306, 1337–1337. doi: 10.1126/science.1102557
Madec G., Bourdallé-Badie R., Bouttier P.-A., Bricaud C., Bruciaferri D., Calvert D., et al. (2017). NEMO ocean engine.
Marsh R., Addo K. A., Jayson-Quashigah P.-N., Oxenford H. A., Maxam A., Anderson R., et al. (2021). Seasonal predictions of holopelagic sargassum across the tropical atlantic accounting for uncertainty in drivers and processes: The sartrac ensemble forecast system. Front. Mar. Sci. 8. doi: 10.3389/fmars.2021.722524
Masina S., Storto A., Ferry N., Valdivieso M., Haines K., Balmaseda M., et al. (2017). An ensemble of eddy-permitting global ocean reanalyses from the MyOcean project. Climate Dynamics 49, 813–841. doi: 10.1007/s00382-015-2728-5
McCartney M. (1992). Recirculating components to the deep boundary current of the northern North Atlantic. Prog. Oceanography 29, 283–383. doi: 10.1016/0079-6611(92)90006-L
McCartney M. S., Mauritzen C. (2001). On the origin of the warm inflow to the Nordic Seas. Prog. Oceanography 51, 125–214. doi: 10.1016/S0079-6611(01)00084-2
McCartney M. S., Talley L. D. (1982). The subpolar mode water of the North Atlantic Ocean. J. Phys. Oceanography 12, 1169–1188. doi: 10.1175/1520-0485(1982)012<1169:TSMWOT>2.0.CO;2
Müller V., Kieke D., Myers P. G., Pennelly C., Steinfeldt R., Stendardo I. (2019). Heat and freshwater transport by mesoscale eddies in the southern subpolar north atlantic. J. Geophysical Res.: Oceans 124, 5565–5585. doi: 10.1029/2018JC014697
Parkinson C. L. (2022). Arctic sea ice coverage from 43 years of satellite passive-microwave observations. Front. Remote Sens. 3. doi: 10.3389/frsen.2022.1021781
Piecuch C. G., Ponte R. M., Little C. M., Buckley M. W., Fukumori I. (2017). Mechanisms underlying recent decadal changes in subpolar North Atlantic Ocean heat content. J. Geophysical Res.: Oceans 122, 7181–7197. doi: 10.1002/2017JC012845
Pingree R. (2005). North Atlantic and North Sea Climate Change: curl up, shut down, NAO and Ocean Colour. J. Mar. Biol. Assoc. United Kingdom 85, 1301–1315. doi: 10.1017/S0025315405012488
Putman N. F., Goni G. J., Gramer L. J., Hu C., Johns E. M., Trinanes J., et al. (2018). Simulating transport pathways of pelagic Sargassum from the Equatorial Atlantic into the Caribbean Sea. Prog. Oceanography 165, 205–214. doi: 10.1016/j.pocean.2018.06.009
Putman N. F., Lumpkin R., Olascoaga M. J., Trinanes J., Goni G. J. (2020). Improving transport predictions of pelagic Sargassum. J. Exp. Mar. Biol. Ecol. 529, 151398. doi: 10.1016/j.jembe.2020.151398
Ridenour N. A., Hu X., Jafarikhasragh S., Landy J. C., Lukovich J. V., Stadnyk T. A., et al. (2019). Sensitivity of freshwater dynamics to ocean model resolution and river discharge forcing in the Hudson Bay Complex. J. Mar. Syst. 196, 48–64. doi: 10.1016/j.jmarsys.2019.04.002
Ridenour N. A., Straneo F., Holte J., Gratton Y., Myers P. G., Barber D. G. (2021). Hudson strait inflow: structure and variability. J. Geophysical Res.: Oceans 126, e2020JC017089. doi: 10.1029/2020JC017089
Rio M.-H., Mulet S., Picot N. (2014). Beyond goce for the ocean circulation estimate: Synergetic use of altimetry, gravimetry, and in situ data provides new insight into geostrophic and ekman currents. Geophysical Res. Lett. 41, 8918–8925. doi: 10.1002/2014GL061773
Robson J., Ortega P., Sutton R. (2016). A reversal of climatic trends in the North Atlantic since 2005. Nat. Geosci. 9, 513–517. doi: 10.1038/ngeo2727
Rossby T. (1996). The North Atlantic Current and surrounding waters: At the crossroads. Rev. Geophysics 34, 463–481. doi: 10.1029/96RG02214
Smith G. C., Roy F., Mann P., Dupont F., Brasnett B., Lemieux J.-F., et al. (2014). A new atmospheric dataset for forcing ice–ocean models: Evaluation of reforecasts using the Canadian global deterministic prediction system. Q. J. R. Meteorol. Soc. 140, 881–894. doi: 10.1002/qj.2194
Statistics Canada. (2017). Focus on Geography Series 2016 Census. Statistics Canada Catalogue no. 98-404-X2016001. Ottawa, Ontario. Data products 2016 Census (Ottawa: Statistocs Canada).
Straneo F., Saucier F. (2008). The outflow from Hudson Strait and its contribution to the Labrador Current. Deep Sea Res. Part I.: Oceanographic Res. Papers 55, 926–946. doi: 10.1016/j.dsr.2008.03.012
Tao R., Myers P. G. (2022). Modelling the oceanic advection of pollutants spilt along with the northwest passage. Atmosphere-Ocean 60, 88–101. doi: 10.1080/07055900.2022.2065965
Trites R. W., Banks R. E. (1958). Circulation on the scotian shelf as indicated by drift bottles. J. Fisheries Res. Board Canada 15, 79–89. doi: 10.1139/f58-006
van Sebille E., Aliani S., Law K. L., Maximenko N., Alsina J. M., Bagaev A., et al. (2020). The physical oceanography of the transport of floating marine debris. Environ. Res. Lett. 15, 023003. doi: 10.1088/1748-9326/ab6d7d
van Sebille E., Zettler E., Wienders N., Amaral-Zettler L., Elipot S., Lumpkin R. (2021). Dispersion of surface drifters in the tropical atlantic. Front. Mar. Sci. 7. doi: 10.3389/fmars.2020.607426
Wang Q., Myers P. G., Hu X., Bush A. B. (2012). Flow constraints on pathways through the canadian arctic archipelago. Atmosphere-Ocean 50, 373–385. doi: 10.1080/07055900.2012.704348
Keywords: ocean modelling, drift bottles, North Atlantic, citizen science, subpolar gyre
Citation: Ridenour NA, Buchart L, Carmack E, Deschepper I, Galbraith E, Green G, Marson JM, Pennelly C, Weiss-Gibbons T and Myers PG (2023) Drift bottle data hint at large-scale ocean circulation changes. Front. Mar. Sci. 10:1227894. doi: 10.3389/fmars.2023.1227894
Received: 23 May 2023; Accepted: 20 September 2023;
Published: 09 October 2023.
Edited by:
Baptiste Mourre, Balearic Islands Coastal Ocean Observing and Forecasting System (SOCIB), SpainReviewed by:
Xiaobiao Xu, Florida State University, United StatesCopyright © 2023 Ridenour, Buchart, Carmack, Deschepper, Galbraith, Green, Marson, Pennelly, Weiss-Gibbons and Myers. This is an open-access article distributed under the terms of the Creative Commons Attribution License (CC BY). The use, distribution or reproduction in other forums is permitted, provided the original author(s) and the copyright owner(s) are credited and that the original publication in this journal is cited, in accordance with accepted academic practice. No use, distribution or reproduction is permitted which does not comply with these terms.
*Correspondence: Natasha A. Ridenour, cmlkZW5vdXJAdWFsYmVydGEuY2E=
†Present address: Natasha A. Ridenour, Institute of Ocean Sciences, Fisheries and Oceans Canada, Sidney, BC, Canada
Disclaimer: All claims expressed in this article are solely those of the authors and do not necessarily represent those of their affiliated organizations, or those of the publisher, the editors and the reviewers. Any product that may be evaluated in this article or claim that may be made by its manufacturer is not guaranteed or endorsed by the publisher.
Research integrity at Frontiers
Learn more about the work of our research integrity team to safeguard the quality of each article we publish.