 Zeinab Safar
 Zhirui Deng
 Claire Chassagne
- 1Section of Environmental Fluid Mechanics, Department of Hydraulic Engineering, Delft University of Technology, Delft, Netherlands
- 2Guangdong Research Institute of Water Resources and Hydropower, Guangdong Engineering Laboratory of Estuary Hydropower, Guangzhou, China
In the present study, we aim to parameterize a flocculation model, based on a logistic growth equation, by conducting laboratory experiments. The flocculation experiments are performed using two types of natural sediments and different flocculating agents: salt (monovalent and divalent), extracellular polymeric substances, and living and dead microalgae Skeletonema costatum. It was found that the median size of flocs (D50) did not exceed the Kolmogorov microscale when salt-induced flocculation was performed (in the absence of organic matter), which is in line with previous studies. Flocs with organic matter reach sizes that are larger than the Kolmogorov microscale, and both their growth and steady-state size are salinity-dependent. In particular, divalent salts are shown to promote flocculation of sediment to organic matter. The logistic growth model can be used to study either the evolution of a class volume concentration as function of time or the change in size of a given class as function of time. The fine particle volume concentration decreases in time, whereas the coarse particle volume concentration increases, during the flocculation process. The mass balance between the two classes as defined by Chassagne and Safar (Modelling flocculation: Towards an integration in large-scale sediment transport models. Marine Geology. 2020 Dec 1;430:106361) is estimated.
1 Introduction
It has been shown that flocs in estuaries are composed of mineral sediment and organic matter. This organic matter can be either “dead” organic matter that includes exopolymers and organic debris or “living” organic matter, i.e., microorganisms such as microalgae (Alldredge et al., 1993; Logan et al., 1995; Passow et al., 2001; Passow, 2002; Lai et al., 2018). Organic matter such as polysaccharides and proteins fall under generic name of extracellular polymeric substances (EPSs) that are complex high–molecular weight mixtures of polymers. These particles can be 1 m up to 100 m in size. As these substances are mostly excreted by diatoms and phytoplanktons, their concentrations and abundance are seasonally dependent. Because of their large size and high stickiness, they promote flocculation of solids. The size evolution and effective density of flocs are depending on these constituents and on the dissolved salts that are naturally present in seawater and on the local shear stresses. This is why flocculation plays an important role in coastal regions where fresh and saline water meet and ought, therefore, to be included in sediment transport models. Many studies have been conducted to model flocculation using population balance equation (PBE) models in view of their implementation in large-scale sediment transport models (Jackson, 1990; Winterwerp, 1998; Winterwerp, 2002; Lee et al., 2011; Mietta et al., 2011a; Cuthbertson et al., 2018; Zhang et al., 2019).
The earliest and simplest PBE originates from the work of Smoluchowski (around 1917) and has been improved ever since (Elimelech et al., 2013). PBE models describe the flocculation rate of suspensions using a growth () and a breakup () rate. The generic form of a PBE is given by
where represents the number of particles in a given size class and is the time. Most models assume that the particles are hard spheres and that the flocs keep their shape during the flocculation process. Some studies considered time varying floc size, which introduces new parameters in the PBE model (Selomulya et al., 2003). The general breakup term in PBE usually accounts for binary breakup by shear, which results in the “birth” of two small particles by the “death” of a large one (Winterwerp, 1998; Winterwerp, 2002; Jeldres et al., 2015; Jeldres et al., 2018).
PBE models have been successfully applied to salt-induced flocculation (Selomulya et al., 2003; Maggi, 2005; Mietta et al., 2009). However, when polymers are involved in the flocculation process, the decrease in size is predominantly caused by the coiling of polymers, leading to aggregate restructuring and densification (Jeldres et al., 2018) rather than breakage, due to the elasticity of the polymers. Modifying the PBE to account for this effect would introduce new variables that cannot properly be measured, and, therefore, this step would not add to the system understanding. Modifying the PBE to account for organic matter–induced flocculation requires, for instance, the inclusion of parameters such as the sticking probability of a specific EPS or its reconformation under shear.
In addition, there is a problem in defining the properties of a particle within a given size class, as each particle in a size class may have a different composition (Chassagne et al., 2021). This implies that particles of same size can have (very) different settling velocities as they have different effective densities. For this reason, an open research question remains, which is whether a given size class can be associated with a specific (average) settling velocity.
In view of simplification, some researchers model flocculation using a single equation that represents the change in size of the average particle size (the D50) (Winterwerp, 1998; Winterwerp, 2002; Maggi, 2009; Chen et al., 2018). This approach has the advantage to be easy to implement in large-scale models but the disadvantage to not properly account for the sediment (mineral) mass conservation, as discussed in (Chassagne and Safar, 2020). The model introduced by Chassagne and Safar in (Chassagne and Safar, 2020) makes use of logistic growth equations and enables to account for mass conservation. It could be implemented in large-scale sediment transport models as detailed in (Chassagne et al., 2021). The new model, however, needs to be parameterized, and this can be done by laboratory experiments, where the mass of clay during flocculation is constant over time, as the flocculation is performed in a jar. It is the aim of the present article to report such parameterization. Using the model, insight in flocculation characteristic timescales can be obtained.
After briefly describing the logistic growth model and the mass transfer between classes, the materials and methods used in the study will be presented. The time evolution of floc sizes is studied under controlled laboratory conditions by using different natural organic matter (living and dead) at different salinity concentrations. The experiments are subsequently analyzed using the model, and the kinetics of mass transfer between classes are discussed.
2 Theory
2.1 Logistic growth theory for flocculation
The analytical model introduced by Chassagne and Safar in (Chassagne and Safar, 2020) is derived from the logistic growth theory. Logistic growth equations are used to describe the time evolution of a living population (Lambert, 2005; Chen et al., 2018; De Boer, 2018; Jin et al., 2018), with “birth” and “decay” parameters.
Every size class in a flocculating suspension can be seen as a “living” population that is growing or decaying in time depending on other classes and external parameters. Standard logistic growth models account for either growth of population, until a steady state is reached, or decay of a population, until a steady state is reached. For populations that experience first a growth and then a decay, specific growth and decay functions should be given. We here present the model introduced in (Chassagne and Safar, 2020). During flocculation, each class has a number of particles (), which is changing in time (). The decrease of number of particles with time is associated to the decay function , and their increase is associated to the birth function . The change in time of is given by
The production (birth) rate and the decay rate are given by
where , , , and are parameters to be fitted. The analytical solution for the differential equation is
where represents the number of particles at very long times, when equilibrium is reached. In this study, the logistic growth model is used to fit either the time evolution of the volume concentration (rather than particle concentration) of a size class or the time evolution of a specific particle size, for any size class. These functions are measured by static light scattering experiments and can be shown to obey the same logistic growth model (Chassagne and Safar, 2020). The birth and decay functions are depending on parameters that, in our case, should be found by modeling the results of flocculation experiments as function of suspension composition and environmental conditions. This will be done by analyzing experiments performed in the laboratory, where conservation of the total clay mass concentration as function of time is ensured. From these experiments, the order of magnitude of the different parameters and their dependence on relevant variables will be presented.
2.2 Mass conservation
As the mass concentration of clay ( , where is the mass of clay in the experiment and is the volume in which the clay particles are dispersed) remains constant in the system (the experiments are performed in a jar), the mass concentration of clay in each size class decreases and increases depending on the availability of other classes. From static light scattering experiments, the volume concentration of each size classes is obtained. By converting the volume into mass, a mass balance between the classes can be established. To set up the mass balance, we make use of the two classes: Class 1, which represents unflocculated (mineral) clay or Port of Rotterdam (PoR) sediment particles, and Class 2, which represents flocculated particles.
The mass transfer between Class 1 and Class 2 corresponds to the mass of clay (inorganic sediment) transferred and is expressed as
where and are the masses of clay within Class 1 and Class 2 per unit of total volume, respectively. As the clay concentration is constant, the mass concentrations are related by the following equations:
from which follows that
Using the clay density and the volumes obtained from the static light scattering measurements, an estimation for can be done using
where is the absolute density of clay (about 2,600 kg/m3) and is the volume occupied by Class 1 particles. The static light scattering experiment results are given in percentage volume occupied by a given class. This implies that one can define
where is the percentage volume occupied by Class 1 and is the volume occupied by all classes. The quantity is linked to the obscuration measured by the laser. The estimation of is extremely difficult to make considering the fact that the particles in Class 2 are composed of clay and organic material and that the density of the Class 2 particles (flocs) not only depend on the type and concentration of organic matter but also on external parameters such as shear and salinity. From the flocculation rate , an estimation of as function of time can be given. For the estimation of , which requires the estimation of , i.e., the density of Class 2 particles (flocs) over time, it was decided to use
A of 2,600 (clay mineral) was used. This is probably higher than the average density of Class 2 particles.
3 Materials and methods
3.1 Materials
A table summarizing the experiments presented in the article is given in Table 1.
3.1.1 Sediment
Two different sediments were used in the experiments. One is a clay referenced K-10.000, which was purchased from the company VE-KA (The Netherlands). The original clay lump has a water content of 35.7% and a sand content of 21%. The clay was dispersed in demineralized water, and the obtained suspension has conductivity of less than 0.005 mS/cm. The other one was a natural sediment that was obtained from PoR, which was used as such. Two samples of these sediments were analyzed with a Phillips XL30 Environmental Scanning Electron Microscope (ESEM), from Microlab in the Faculty of Civil Engineering and Geosciences, TU Delft. During the ESEM measurement, the sample was under vacuum, with a beam acceleration volt age of 20 kV, with backscattered electrons imaging mode and a spot size of 4 (Figure 1, left panel). Further clay characterization was done for the work presented in (Ibanez Sanz, 2018) using the same clay and was not repeated for this study.
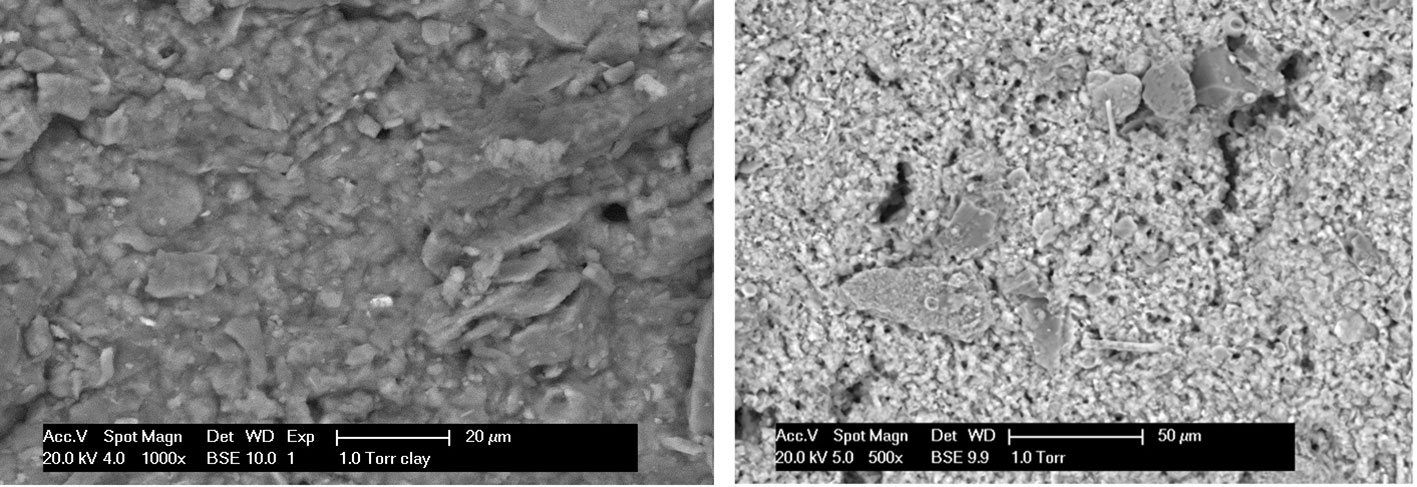
Figure 1 ESEM pictures of clay (left panel) and PoR sediment (right panel).
3.1.2 Suspending medium
Demineralized water and filtered seawater were used separately as suspending medium. For salt flocculation, monovalent NaCl and divalent and were used in different concentrations in demineralized water.
3.1.3 Dead organic matter
EPSs and frozen-dried algae (FDA) were used as dead organic matter. The EPS was obtained from the municipal waste water extractions. It contained proteins (200 mg/L), humic acids (40 mg/L), and polysaccharides (110 mg/L). It is worthwhile to note that the proteins and humic substances are negatively charged, whereas the polysaccharides are positively charged (Zhang et al., 2013). The FDA was obtained from NIOZ (Royal Netherlands Institute for Sea Research). This FDA was analyzed by ESEM to identify its composition. The ESEM analysis is shown in Figure 2.
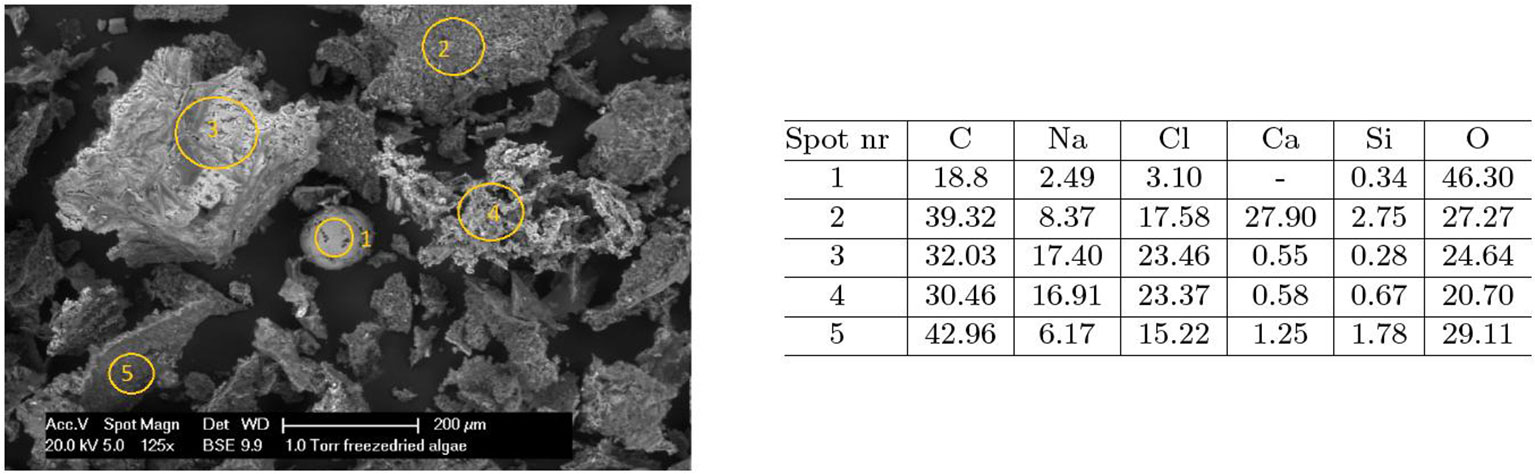
Figure 2 FDA ESEM analysis: The elemental concentration in weight % in the table corresponds to the circled spots in the FDA image.
3.1.4 Living organic matter
Living algae Skeletonema Costatum was used in this experiments in combination with either clay or Port of Rotterdam (PoR) sediment. This algae species was chosen because it is a common algae species in coastal waters. The living algae was obtained from the company Roem van Yerseke (The Netherlands) for algae and oysters cultivation. The algae samples were taken directly from the incubation tank and stored in culture medium in a dark environment at room temperature. The algae bulk concentrations was 5 × 10⁵ cells/L. Every two weeks a fresh batch of this algae was obtained. Experiments were completed within 24 hours after the batch was brought to the lab to minimize changes in bulk concentration. The suspending medium in the experiments was filtered seawater, to keep the living algae in good condition. Additional experiments were performed using algae alone (without any clay or PoR sediment) to check their flocculation ability.
3.2 Experimental setup
Flocculation experiments were carried out in a jar that was connected with tubes to a static light scattering device (Malvern MasterSizer 2000) for measuring particle size distributions (PSDs). Shear rate and clay concentration were kept constant for all of the experiments. The shear rate was optimized and chosen as the best shear rate for optimal flocculation with this setup. It was found to be a pump rate at 10 rpm, which corresponds to about 12 The clay concentration was 0.7 g/L, and the PoR sediment concentration was 0.2 g/L. The flocculation experiments were performed in a JLT6 jar test setup from VELP Scientific. The dimensions of the jar are 95 mm for the inner diameter and 110 mm for the height of the fluid. The suspension was stirred using a single rectangular paddle at 30 rpm. The paddle was 25 mm high and 75 mm in diameter. It was placed 10 mm above the bottom of the jar. The suspensions were pumped through the Malvern MasterSizer 2000, in which the static light scattering measurements are performed, with the help of aperistaltic pump from the mixing jar to the MasterSizer and back again to the mixing jar. This setup allowed us to control independently the speed of the pump and the paddle of the mixing jar. The internal diameter of the connecting tubes is 6 mm and the shortest total length allowed by the geometry of the setup (2,400 mm from the jar back to the jar). A general overview of the concentrations is given in Table 1.
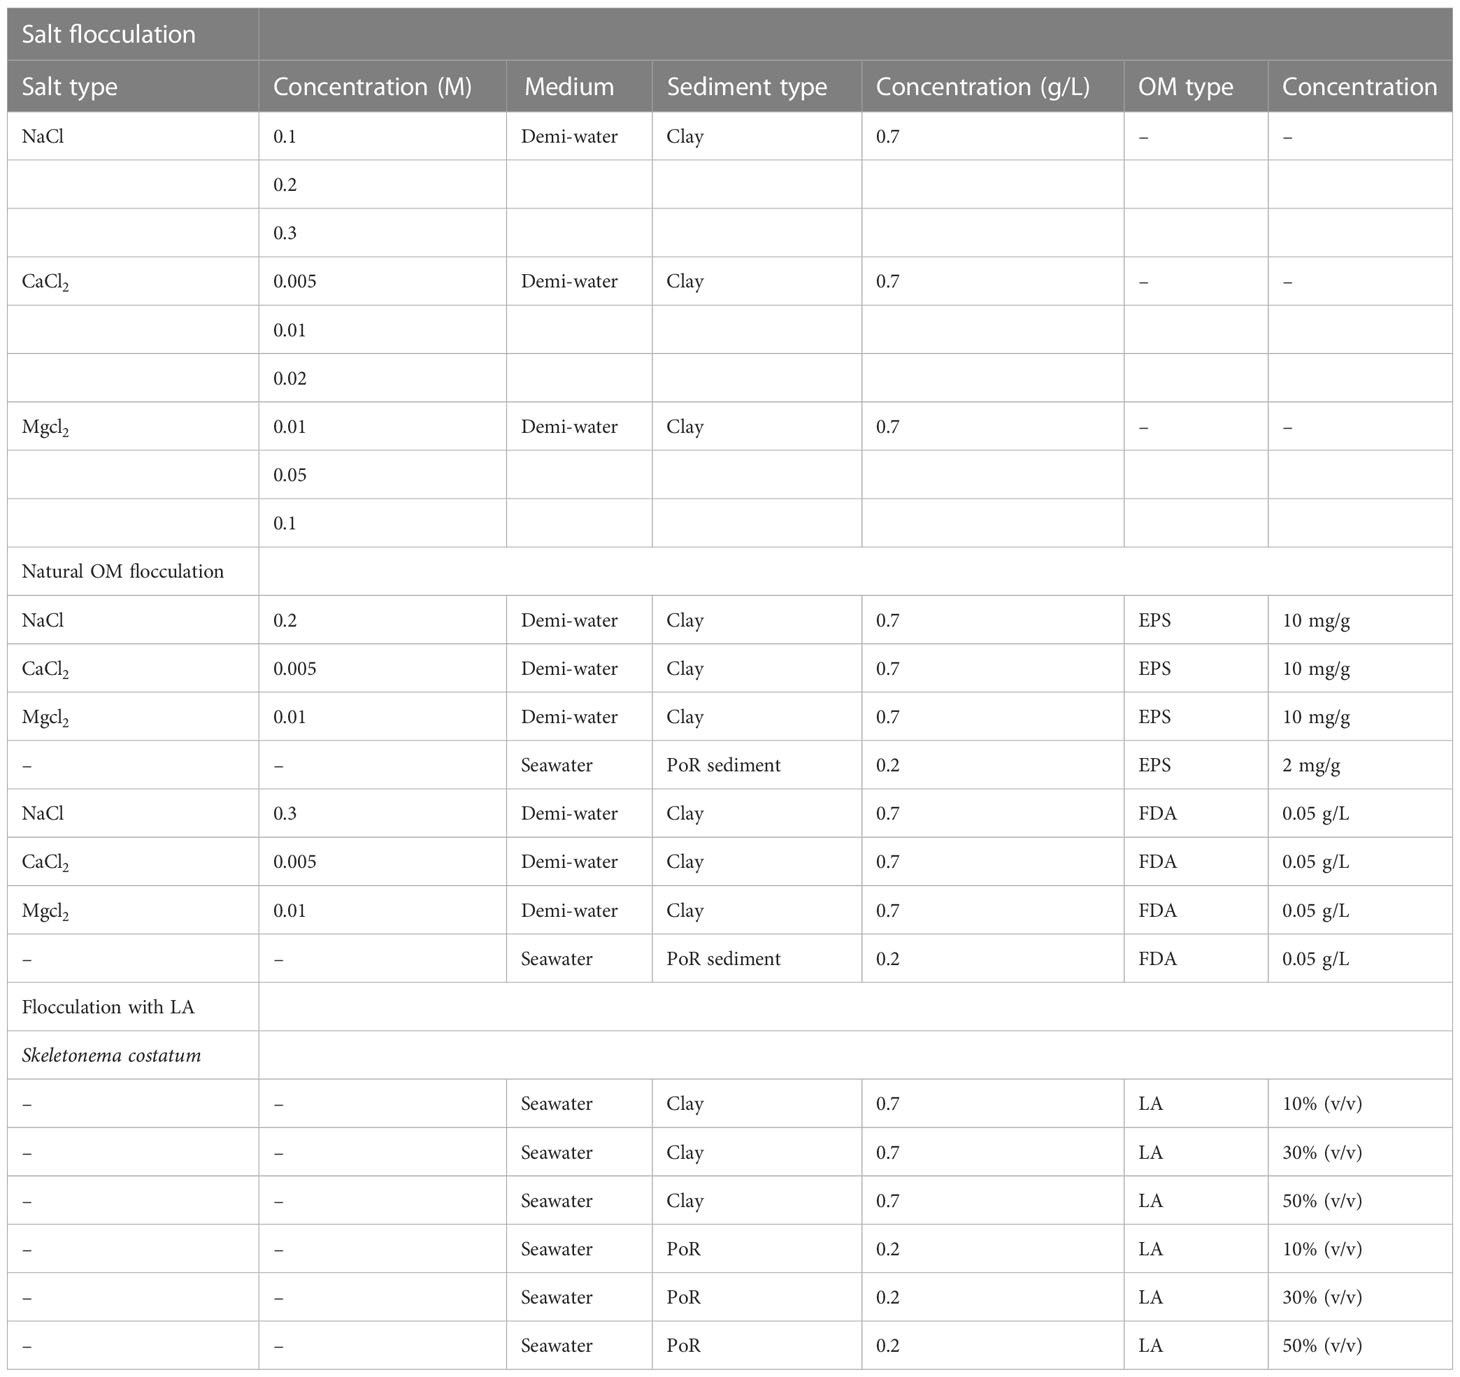
Table 1 Experimental setup: Constituents and their concentrations.
4 Results
For each experiment, the flocculating agent (salt and/or organic matter) was added at the time defined arbitrary to be 1 s (as at t = t-start, the curve represents the unflocculated clay or PoR sediment, except stated otherwise).
4.1 Clay suspensions
4.1.1 Salt flocculation
The PSD of the experiments performed with three different salts at different salt concentrations is shown in Figure 3. In the first panel, flocculation by the monovalent salt NaCl is presented, and, in the middle and last panels, the flocculation by the divalent salts and is presented. This equilibrium size is in agreement with study of Mietta (Mietta et al., 2009) who showed that the equilibrium particle size obtained by salt flocculation cannot exceed the Kolmogorov length scale. The Kolmogorov microscale was calculated to be between 8 and 23 m for the conditions used in the experiments.
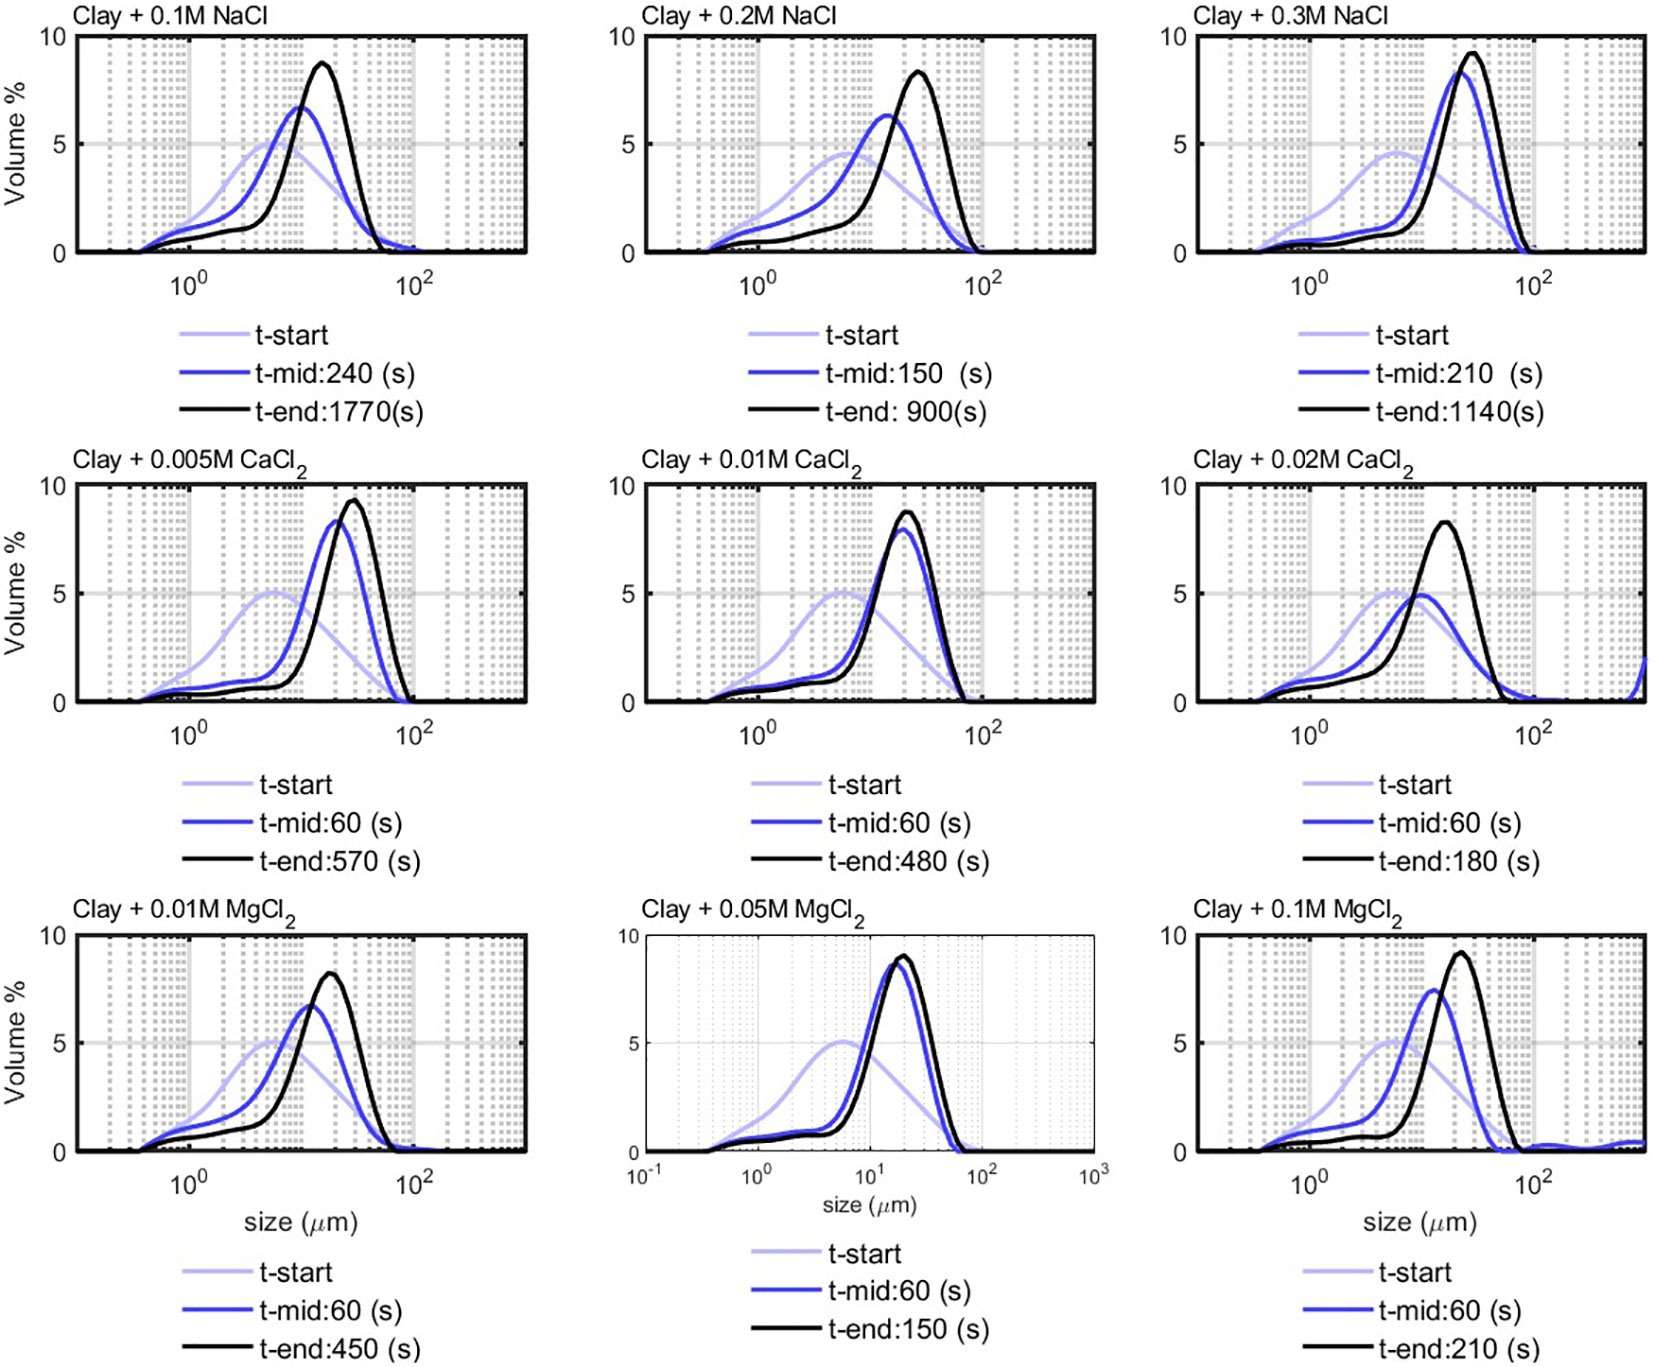
Figure 3 Flocculation of clay (0.7 g/L) with salt; t-start corresponds to the start of experiment, and t-end corresponds to the time at which the peak in PSD reached equilibrium.
The difference, however, is in the time needed to reach an equilibrium size. The characteristic time t-eq is defined as the time for which the full PSD reach equilibrium. Flocculation with NaCl takes much more time than with and . This confirms the efficiency of divalent salt in the flocculation of clay (Mietta et al., 2011b). The t-eq was in the range of 150–400 s for divalent salts and of 600–1,000 s for monovalent salt, for the concentrations used. The way that t-eq is linked to the “birth” and “decay” times and will be shown in the modeling section.
4.1.2 Dead organic matter flocculation
The experiments with clay and added EPS and FDA (both “dead organic matter”) in demi-water are displayed in Figure 4. After injecting EPS, no change in the PSD was observed up to 240 s after injection, indicating that there was no flocculation between the EPS and the clay. Clay in the presence of FDA displays a similar behavior (see the lower panel of Figure 4), where the bimodal distribution is caused by the elongated shape of the strains made by the algae cells. The absence of flocculation in both cases is expected as both EPS and FDA are negatively charged and electrostatic repulsion forces prevent flocculation.
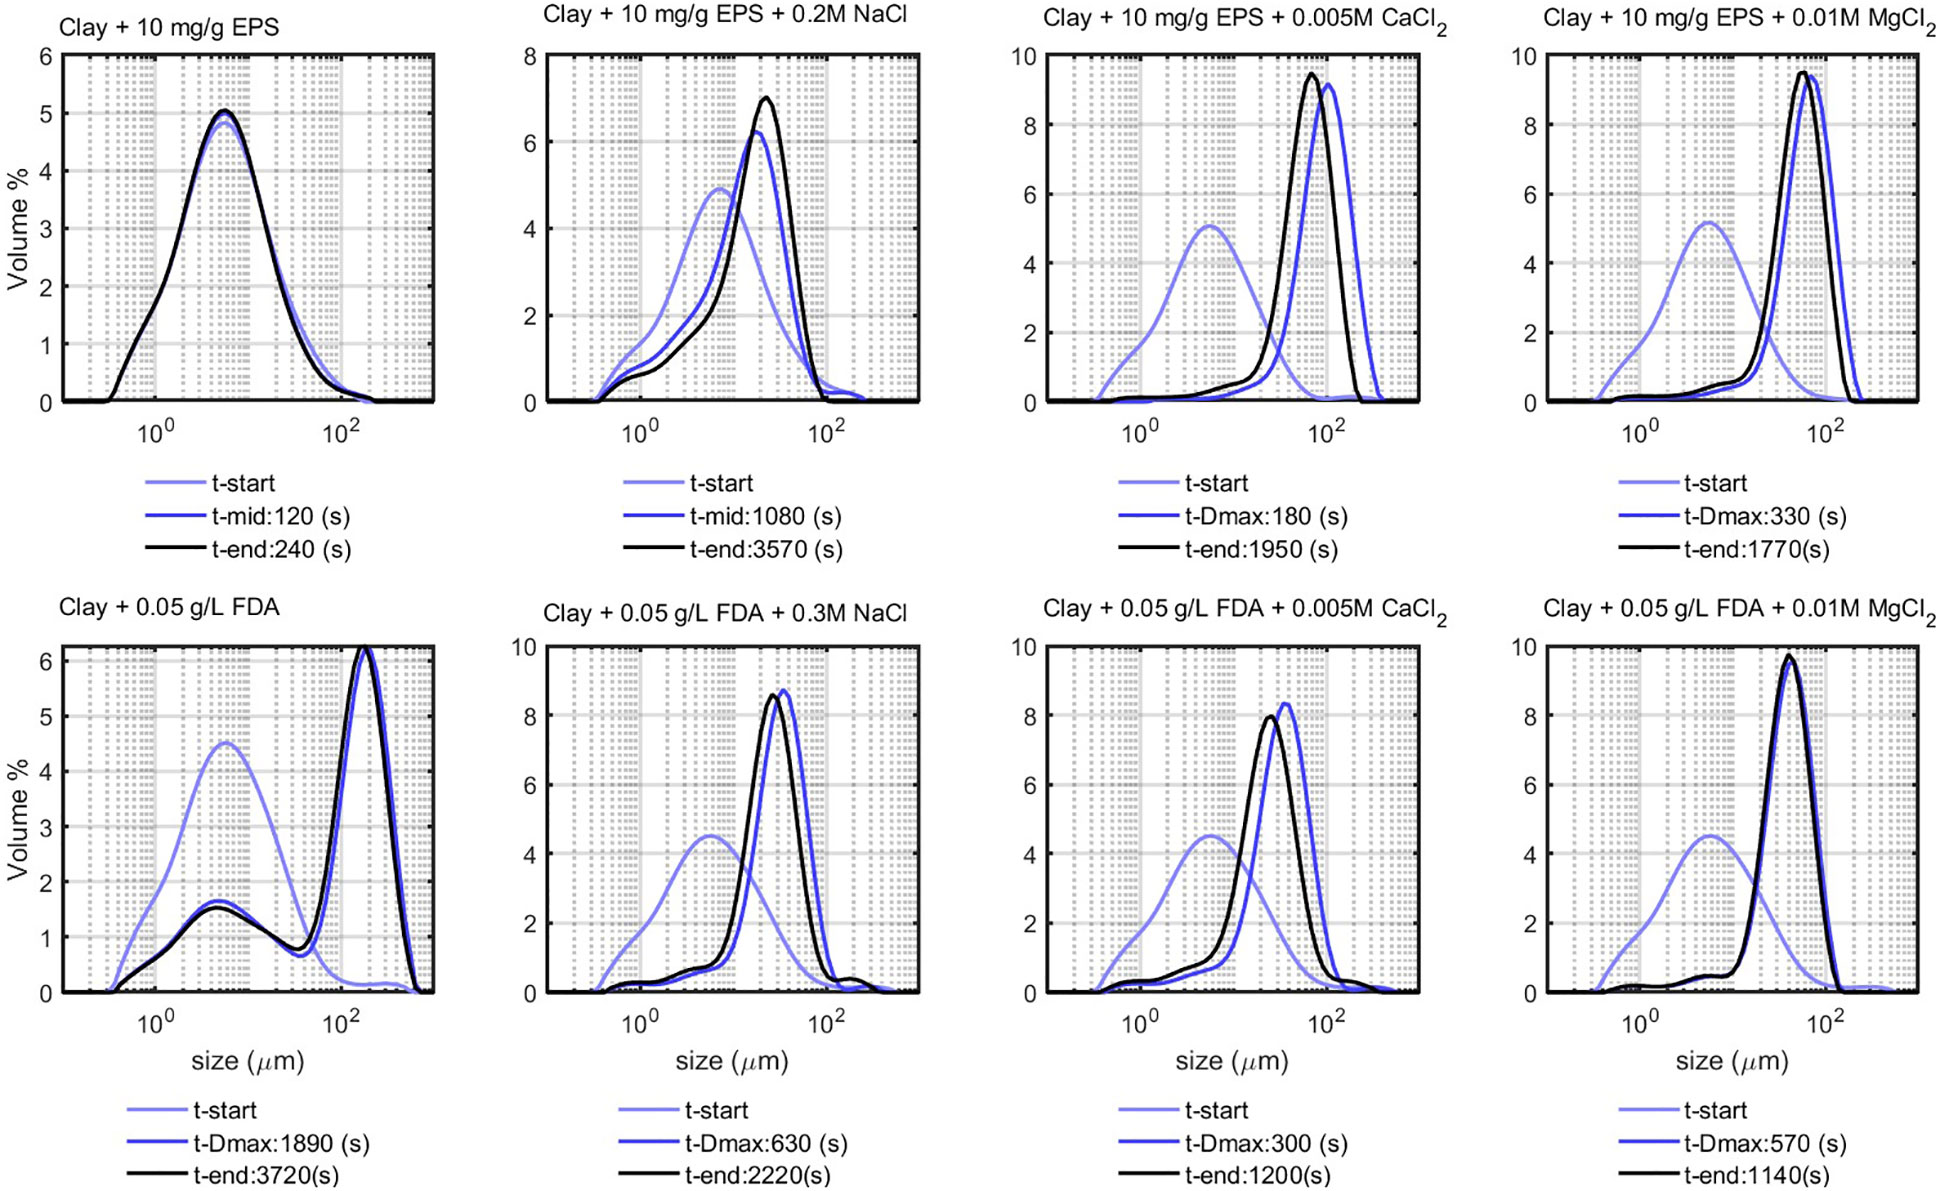
Figure 4 Flocculation of clay (0.7 g/L) with EPS and FDA (natural organic matter) in demi-water, t-start and t-end represent start and end time of the experiment respectively, t-Dmax represents the time at which peak in PSD reached its maximum value, after which the peak value decreases. This does not apply for the ’Clay + EPS + 0.2M NaCl’ sample where the peak value grows very slowly in time until the end of experiment. Note that the FDA (in the lower panel) was added to the sample when it was already flocculated with salt, therefore the t-start is not the pure clay PSD.
Flocculation with anionic (negatively charged) polymers is possible in case cations can act as bridging agents (Shakeel et al., 2020). After addition of salt to the clay and organic matter suspensions, flocculation takes place (see Figure 4), and the peak in PSD increases eventually exceeding the Kolmogorov microscale of the system. The divalent salts (and ) produce larger flocs in shorter times, compared with NaCl. The peak in PSD decreases after reaching its maximum size . At this stage, the flocs coil under shear and become denser, hereby decreasing in size. At the end of the experiment (t-end), the peak in PSD is, therefore, lower than that in t- , which is the time at which the peak value is highest.
4.1.3 Living algae flocculation
LA in seawater at different volume percentages were studied to check whether the algae cells would flocculate over time. The corresponding PSDs are shown in the first panel of Figure 5. The PSDs are multimodal for every algae concentration and do not vary significantly over time, which indicates that the algae kept their elongated structure over time. After addition of clay to the suspensions (see lower panel of Figure 5), flocculation takes place gradually and the PSDs reached an equilibrium. The flocculation time (time to reach t-eq) was observed to increase with algae concentration.
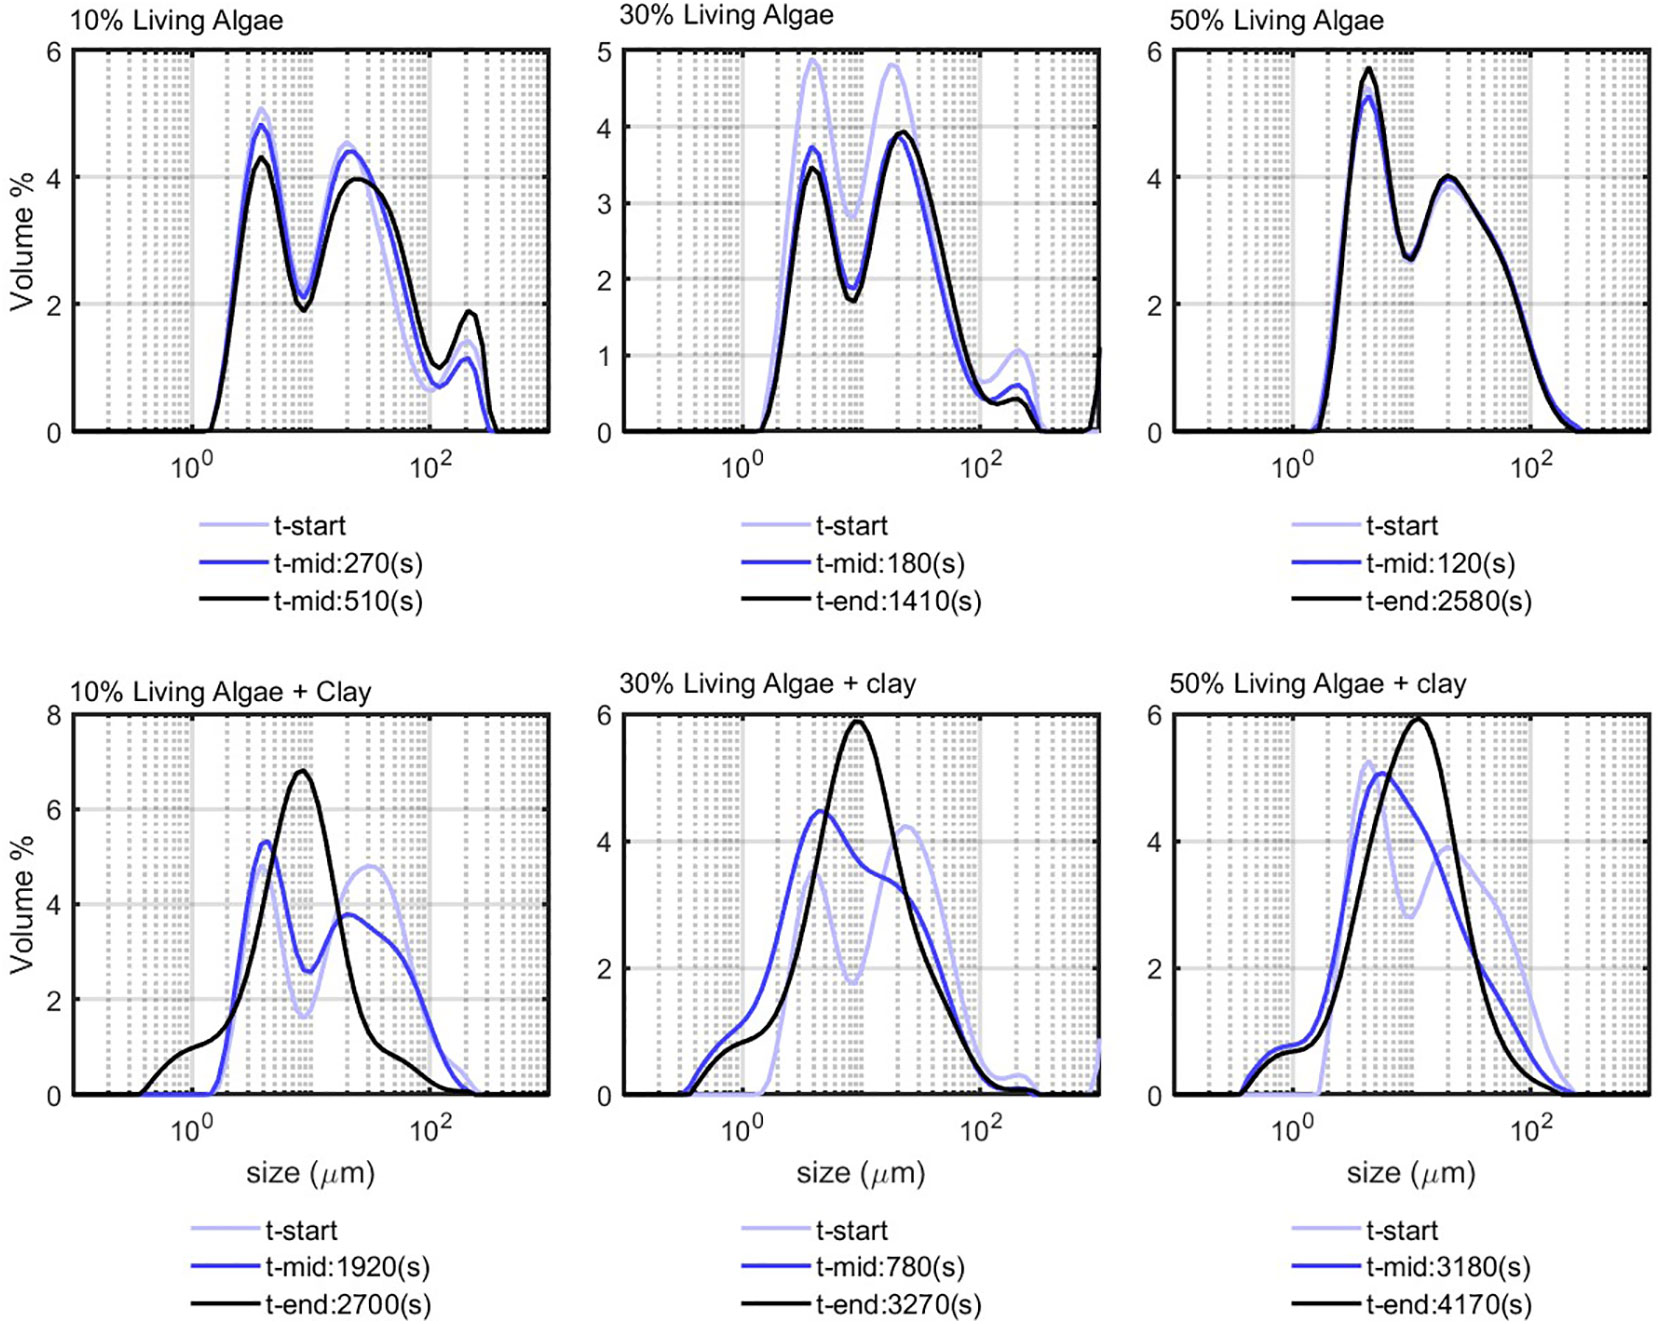
Figure 5 Living algae flocculation; top panel, living algae in sea water; bottom panel, living algae in sea water in the presence of clay of 0.7 g/L.
4.2 Natural sediment from Port of Rotterdam
Natural sediment obtained from PoR was suspended in filtered seawater and left to flocculate without addition of any flocculating agent. The left panel of Figure 6 shows the PSD of PoR sediment that reaches an equilibrium PSD, with a peak value of about 30 m after 2,040 s under constant shear. This peak equilibrium size is larger than the Kolmogorov microscale of the system, which indicates that the natural PoR sediment might contain some organic matter or large silt particles.
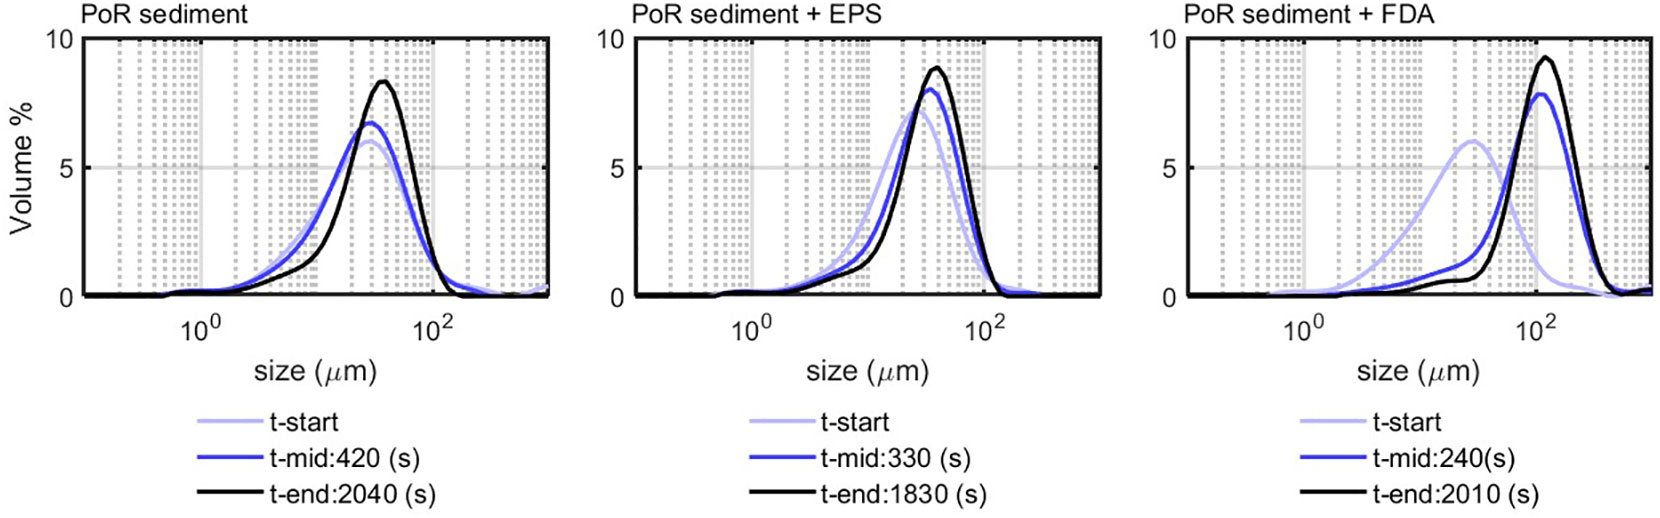
Figure 6 PSD of PoR sediment (0.2 g/L) without and with dead organic matter.
PoR samples in combination with EPS and FDA are displayed in the middle and right panels of Figure 6. With EPS, a peak equilibrium size value of about 31 m is achieved in 1,830 s, which is virtually the same as when no EPS was added. With FDA, the achieved equilibrium peak size is about 107 m at 2,010 s.
PoR sediment was also mixed with a LA suspension in seawater (see Figure 7). For the 10% LA suspension, the initially bimodal distribution became rather monomodal at the end of experiment. This suggests that, while the algae particles flocculate with the sediment particles, the floc structure changes from elongated cell strains into rather spherical particles, due to the continuously shearing in the jar. This is also was could be observed in situ, where algae-rich flocs were rather spherical (Safar et al., 2022). For the 30% and 50% algae suspensions, however, the PSDs remain more bimodal after flocculation with the PoR sediment, indicating that quite an amount of elongated and unflocculated algae particles remain in suspension.
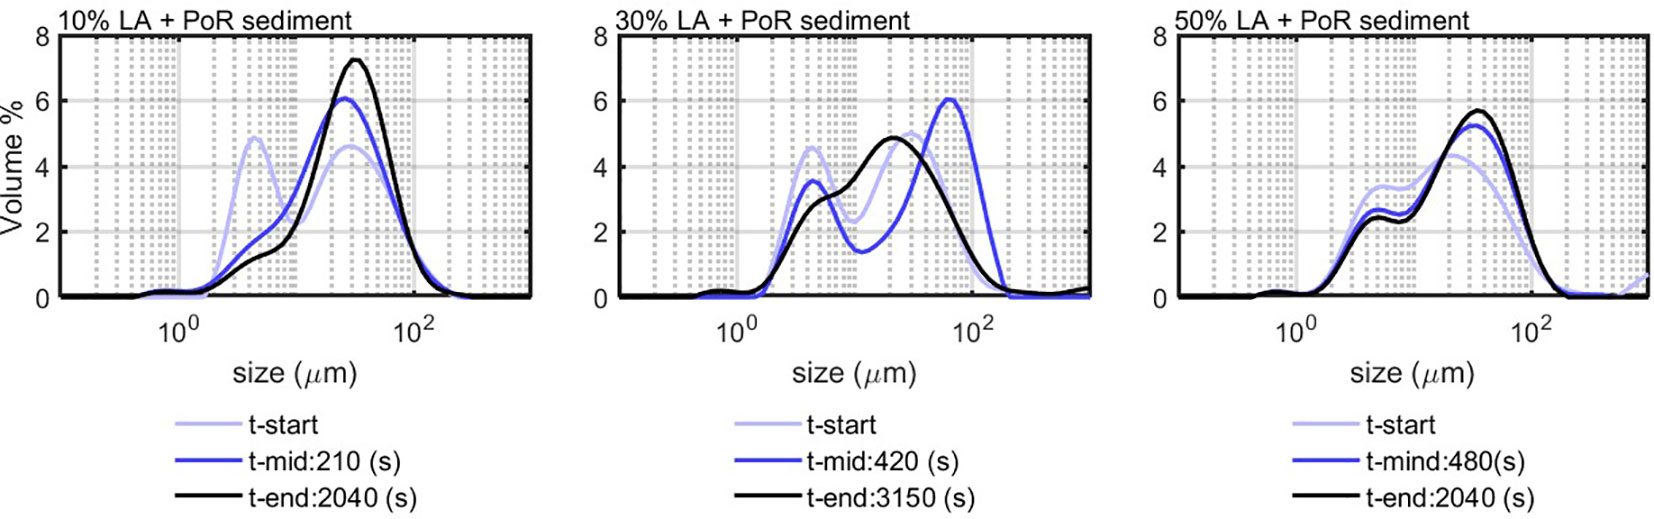
Figure 7 PSD of PoR sediment (0.2 g/L) without and with living algae.
4.3 Model results
The flocculation results obtained from the experiments were used to parameterize the flocculation model given by Equation (5). The model enables to fit both the concentration (in % volume) of a given size class and the evolution of D10, D50, and D90 sizes as function of time. The concentrations of 7, 15, 45, and 60 m as the function of time and the size evolution of the D10, D50, and D90 are displayed in Figure 8. The class of 7 m was chosen because it is representative for the D50 of the unflocculated clay. In addition to this class, the class of 15 m was chosen to represent the first flocculated class, which can occur by aggregation of two 7- m particles. The classes of 45 and 60 m represent the coarse classes that are formed during the flocculation process by consumption of the fines. The class of 45 m can be compared with the D50, as it shows a similar behavior in most of the experiments. The D10, however, does not represent the fines, as it displays a behavior that is different from the classes of 7 and 15 m.
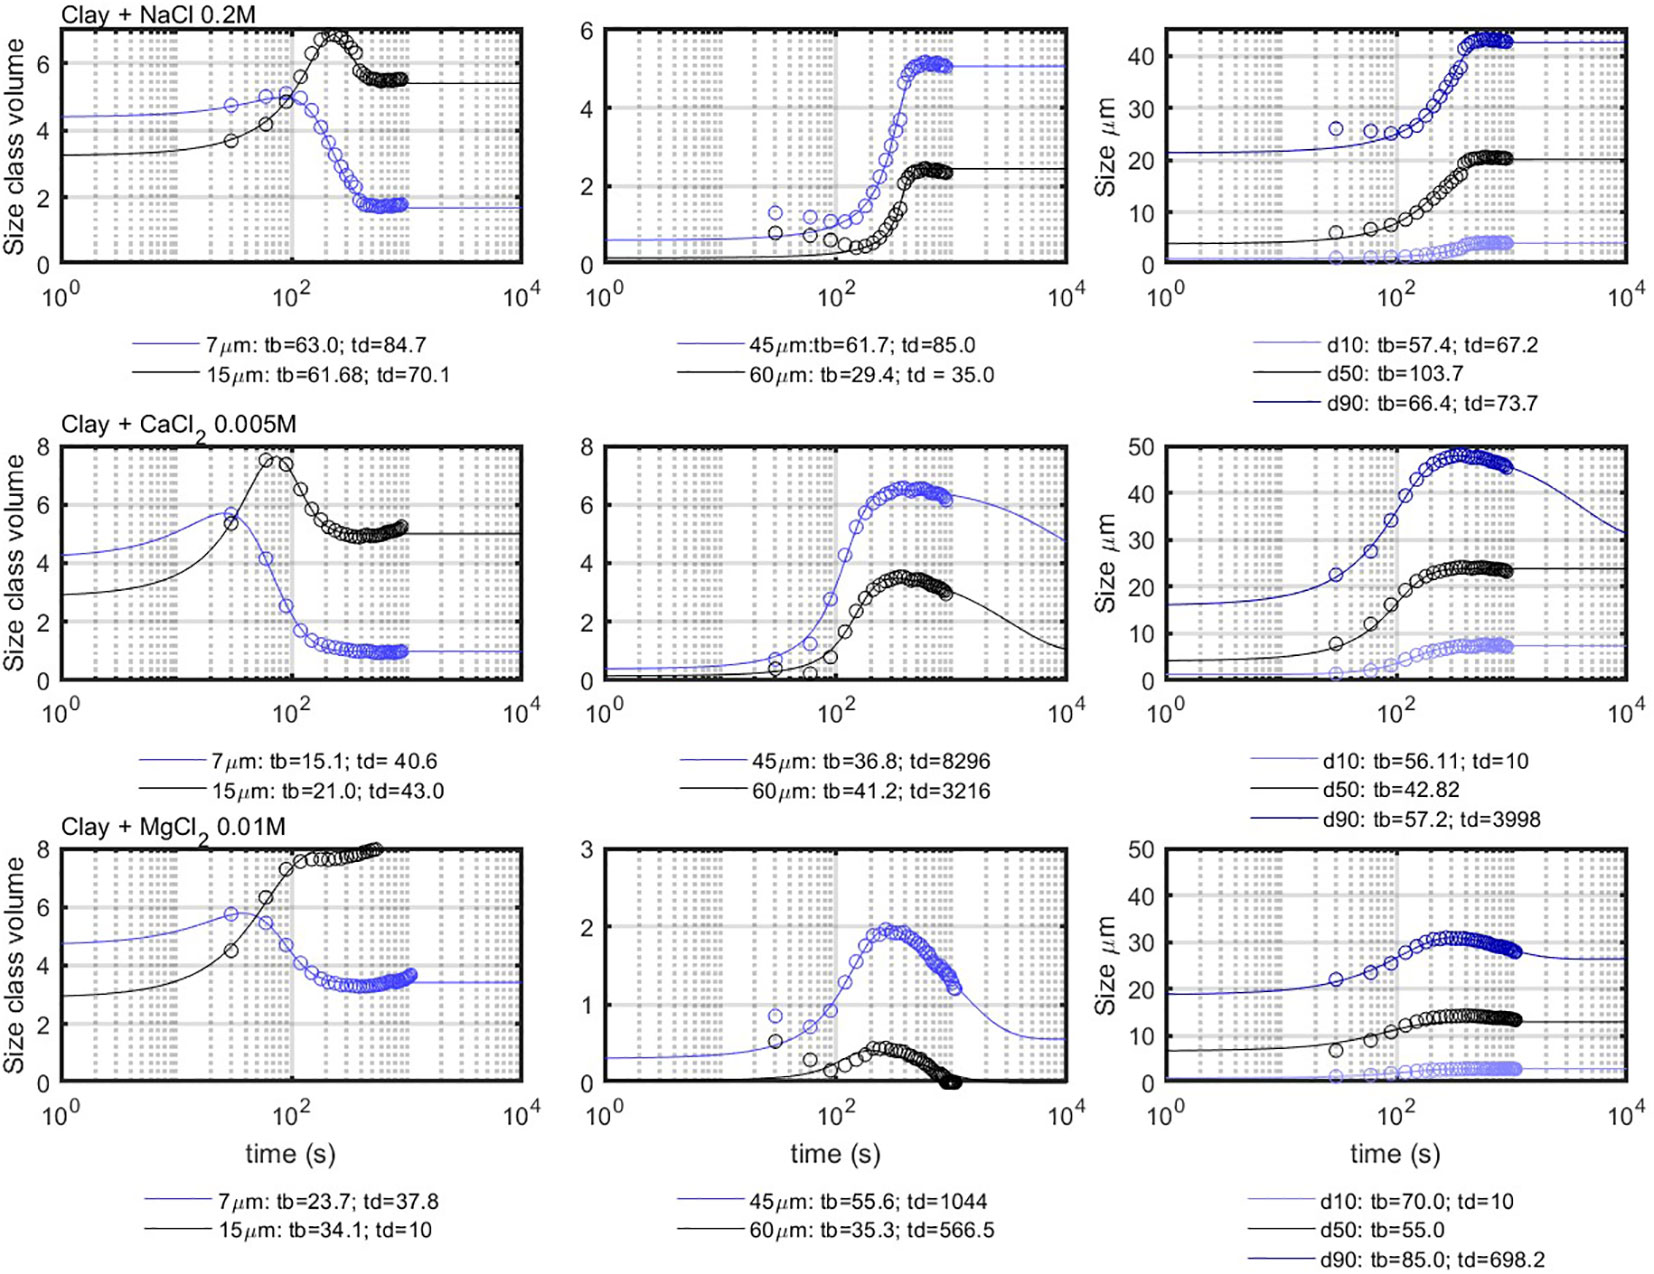
Figure 8 Comparison between the model results (full lines) and the experimental results (circles). The times indicated under the figures are in seconds.
4.4 Salt flocculation
From the fits of the curves obtained by salt-induced flocculation, it can be seen that salt type influences the flocculation timescales ( and ), as indicated in the legend. The model can be used to fit the experimental results quite accurately. Most of the D50 size classes can be fitted with values of and , which are very close to each other.
It has been demonstrated (Chassagne and Safar, 2020) that having is mathematically equivalent to set [equivalently ] and, hence, to consider only a birth term. Let us define . Equation (5) then results in
Setting (and using ) in Equation (5) gives
Both Equations (12) and (13) are sigmoidal functions and will display the same time-dependent behavior.
The reason why the term is not necessary here is due to the fact that the flocs do not grow larger than the Kolmogorov microscale and are, therefore, not prone to coil, which would lead to a size decrease in time. As the shear is constant, neither do the flocs break. The behavior of the smaller classes in Figure 8 reveals pair-wise aggregation, as when the 7- m concentration starts to decrease, the 15- m concentration starts to rise. Salt-induced flocculation can also well be described by PBE models (Chassagne, 2021). The characteristic time t-eq is the largest of the times and found from fitting the size class concentrations.
4.5 Flocculation with natural organic matter (EPS)
For organic matter mediated flocculation, becomes relevant even at constant shear, because the flocs grow first larger than Kolmogorov microscale and then decrease in size (see Figure 9). This decrease is due to the densification of the flocs over time due to shear. This implies that two different timescales, and , are found from fitting the data. The 7- m class does not show decay as this size class is only consumed (particles of that class aggregate to form flocs of larger size).
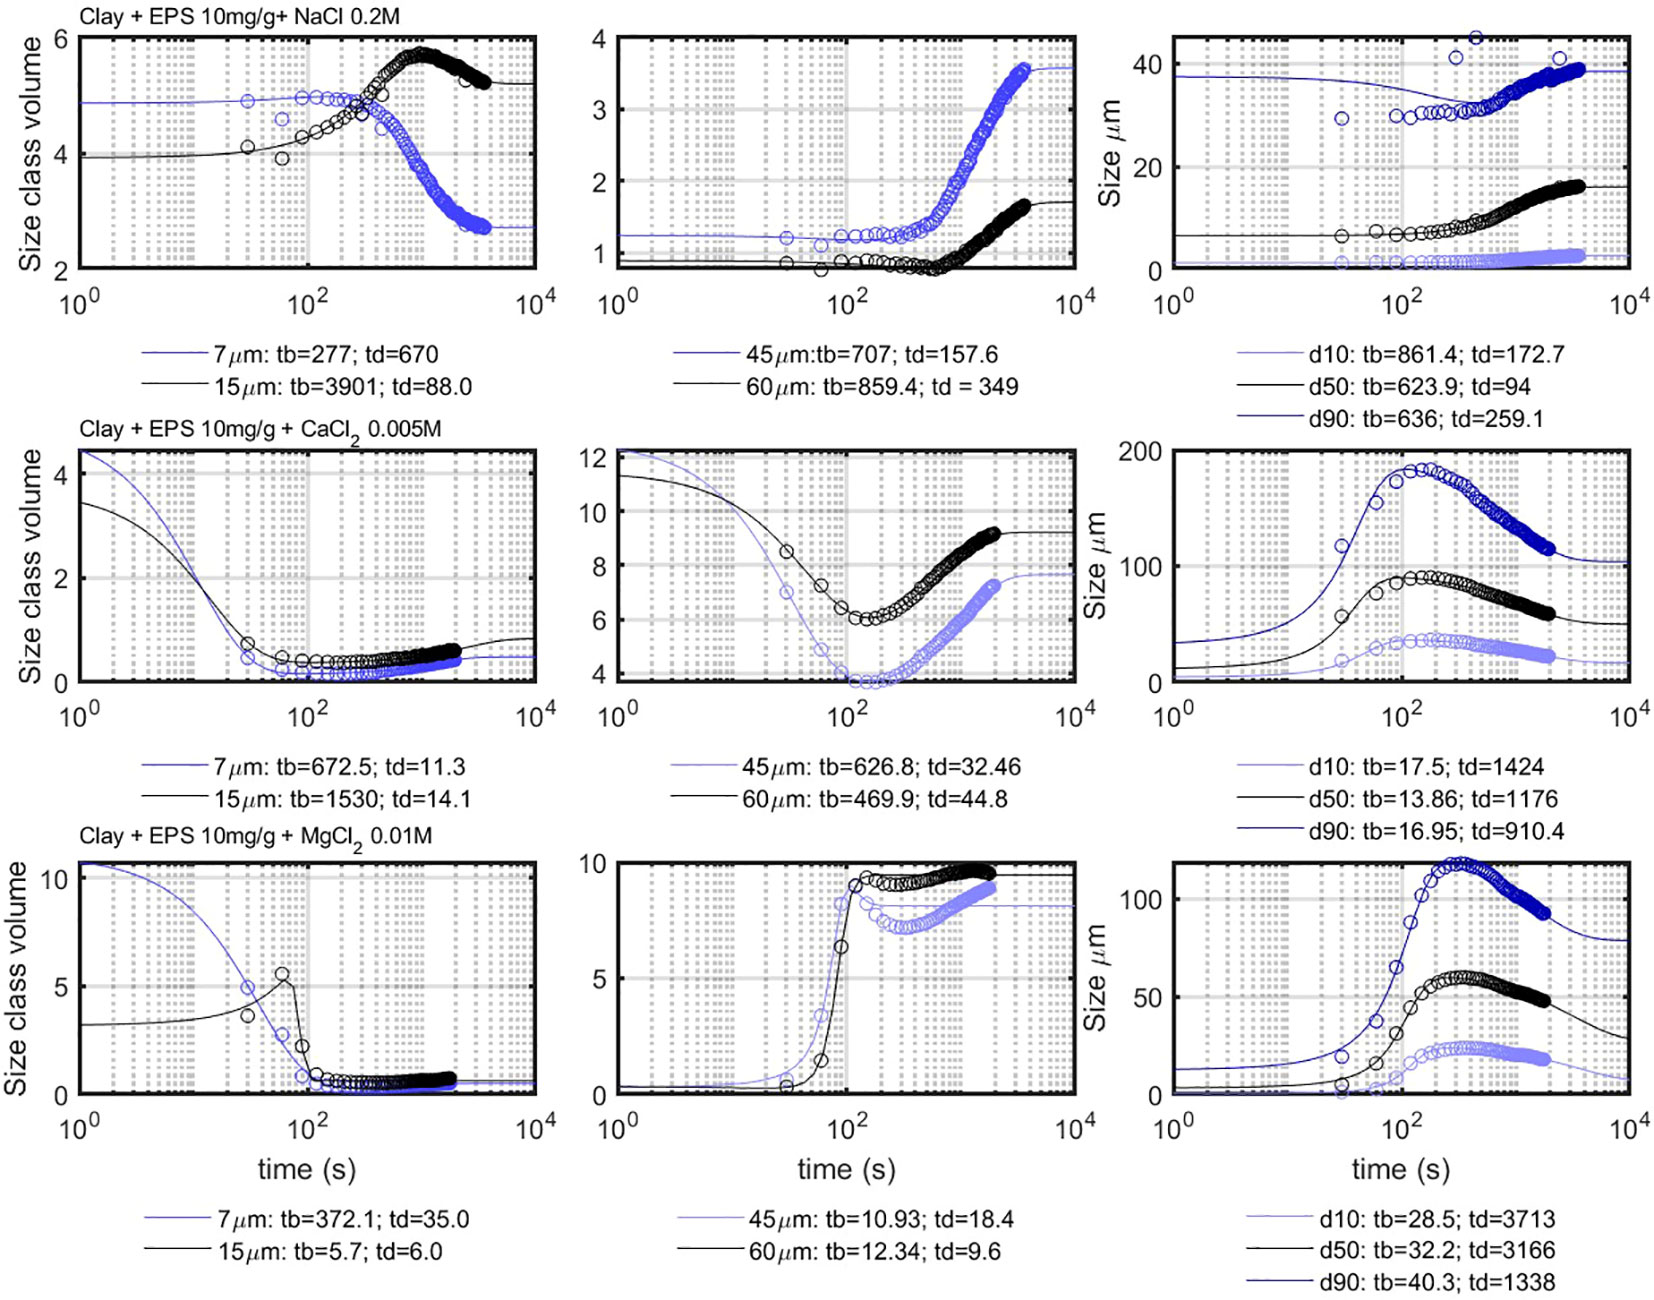
Figure 9 Comparison between the model results (full lines) and the experimental results (circles), for the fines (left panel), coarse (mid panel) and d10-d90 (right panel). The indicated times are in seconds.
The coarse particle classes display a growth (“birth”) and decay phase. In the case of , this growth is so fast that it could not be recorded within the experiment time (see Figure 9, middle panel, 45 and 60 m). The growth is, however, captured in the experiment (Figure 9, last row, middle panel, 45 and 60 m), as the flocculation with is slightly slower. After reaching their maximum volume concentration, the volume concentration decreases again experiencing “decay.” After several hundreds of seconds, the concentration increases again, which can be seen as a second “birth,” which is slower than the first one. This second birth is only fitted for the case, as an example. Both births can be simultaneously fitted without problem by adding a second b(t) function to the equation. Although the birth is related to the aggregation of organic matter with clay, this second birth is related to the coiling of particles of large size into smaller sizes (Ibanez Sanz, 2018). Breakage and new aggregation are excluded in this case as the shear is kept constant.
The experimental data of the PoR experiment were also fitted with the model, and PoR with EPS was chosen to be compared with the PoR sediment, as EPS represents the organic matter excreted by microorganisms. The model data are compared with the corresponding experimental data in Figure 10. The obtained characteristic time for the coarse particles does not differ significantly for the PoR sediment and PoR with EPS. It was found that different values can be used to fit the data (whether the decay at long times is or not accounted for). This had a small influence of the values found for , but always remained within the same order of magnitude. For the fine particles (which mainly experience decay), is the characteristic time, and it was found that could be varied (to account or not for the initial growth) without changing significantly.
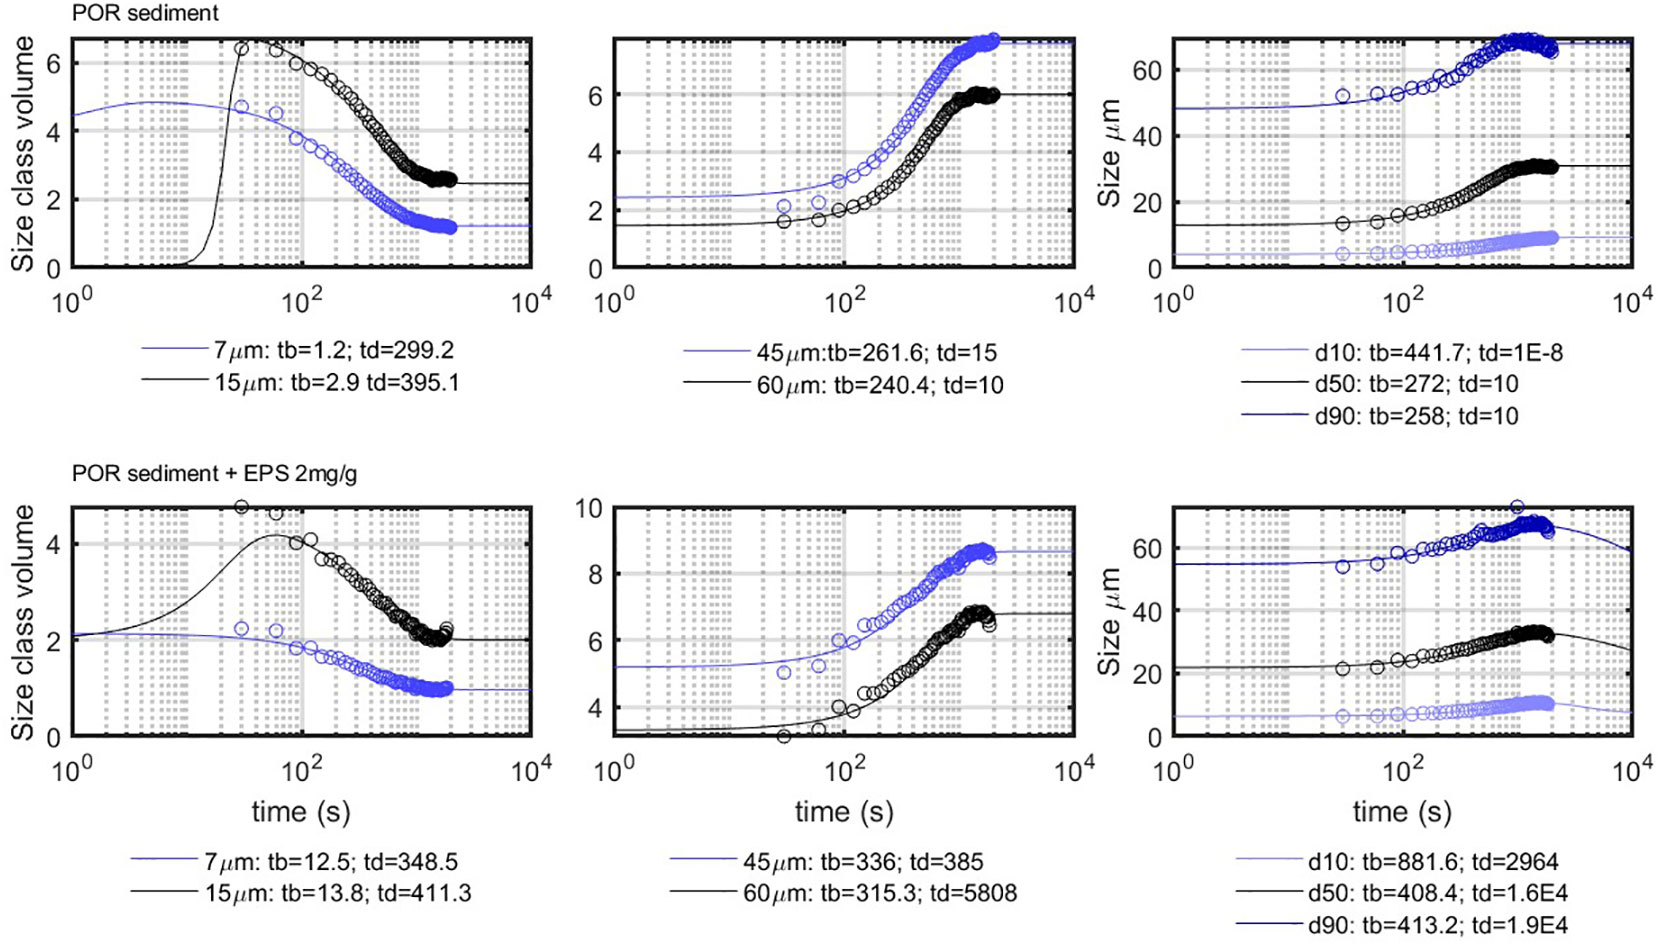
Figure 10 Comparison between the model results (full lines) and the experimental results (circles), for the fines (left panel), coarse (mid panel) and d10-d90 (right panel). The indicated times are in seconds.
4.6 Flocculation with living algae
LA flocculation with clay or PoR sediment was fitted, although the PSDs were bimodal. The fitted classes for the 30% LA suspension with PoR and clay are shown in Figure 11. The discontinuities in the class volume concentrations are artifacts due to the overlap of two size peaks (because the PSDs are bimodal). The D90 curves are excluded from the figures as the D90 class is associated with extremely high sizes caused by the fact that the algae particles are highly anisotropic. In contrast to the behavior of the same classes in the case of salt flocculation, both 7- and 15- m classes display decay at origin. This shows that the flocculation mechanism is different as particles do not flocculate in pairs at the onset of flocculation, as was the case with salt flocculation. During algae-induced flocculation, all the fine particles aggregate with the large algae particles at the same time, resulting in the production of large particles.
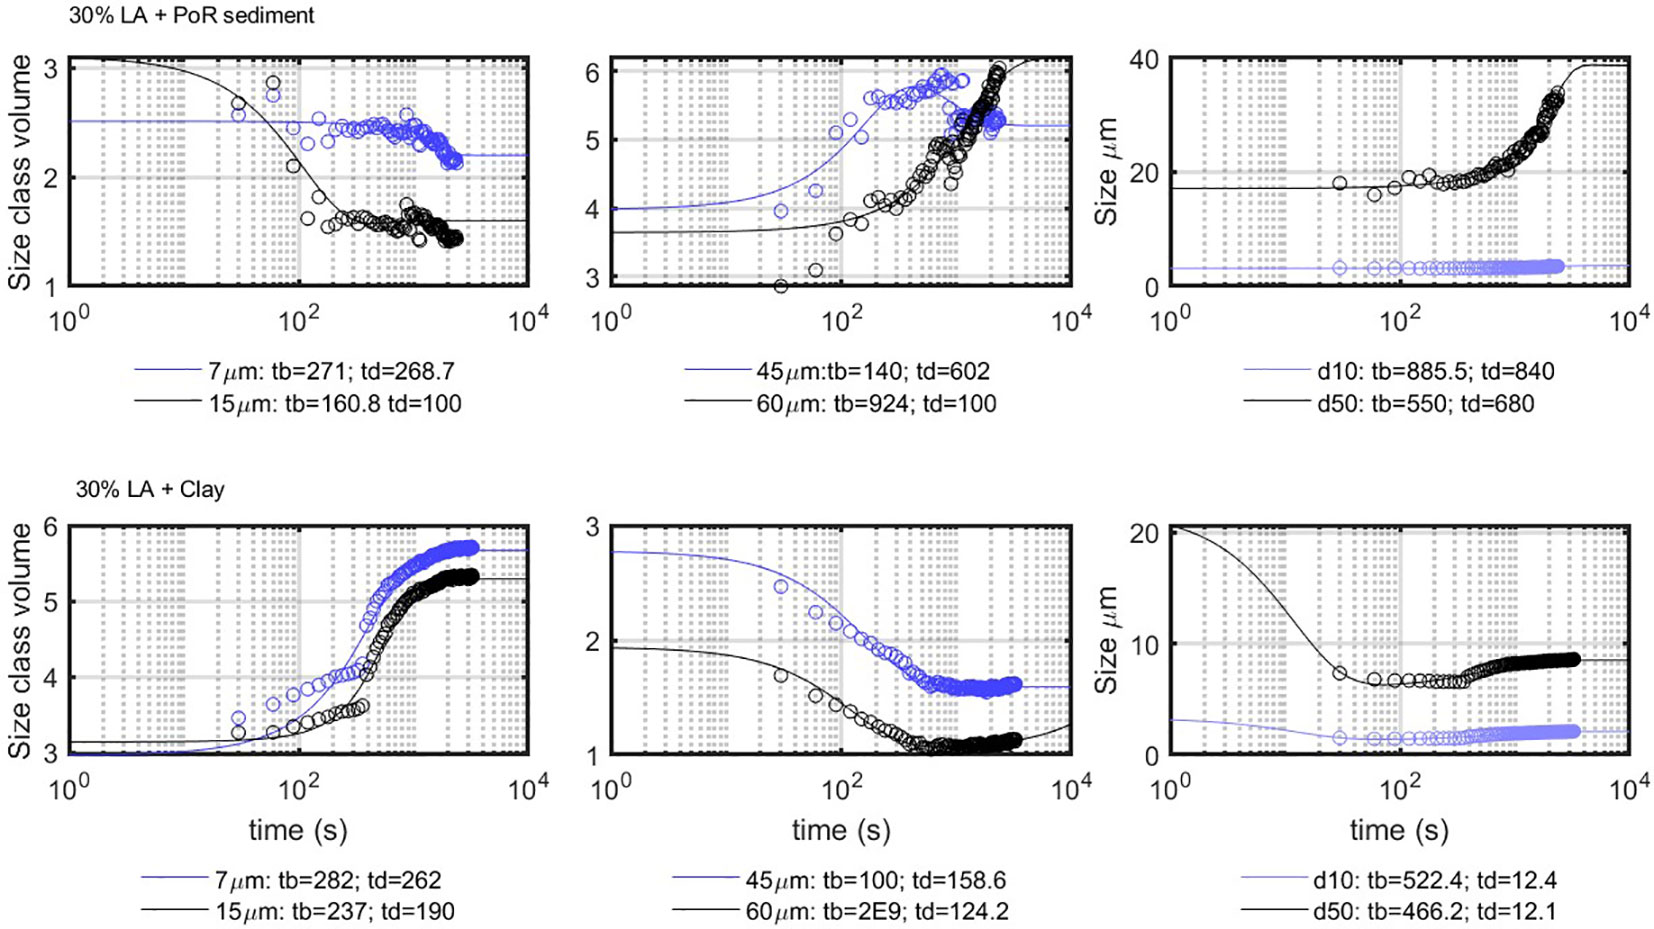
Figure 11 Comparison between the model results (full lines) and the experimental results (circles). The indicated times are in seconds.
4.7 Mass transfer between classes
From the static light scattering results, the mass transfer between classes is estimated. To illustrate the differences between salt-induced and EPS-induced flocculation, the mass decay rate for the finer fractions is plotted in Figure 12. The curves indicated by 5 m, 7 m, and 15 m represent the masses evaluated using Equation (9), where represents the sum of all the detected volumes smaller than 5 m, 7 m, and 15 µm, respectively. The difference in decay behavior of salt-induced and organic matter-induced flocculation is clear. In the clay + 0.2 M NaCl sample, the 5- m particles are mainly consumed, leading to 0 for all times. The 7- m and 15- m classes start with an increase at onset of the experiment and then decrease in time. This behavior reflects the well-known fact that salt-induced flocculation can be described by the Smoluchowski equation, using pair-wise aggregation.
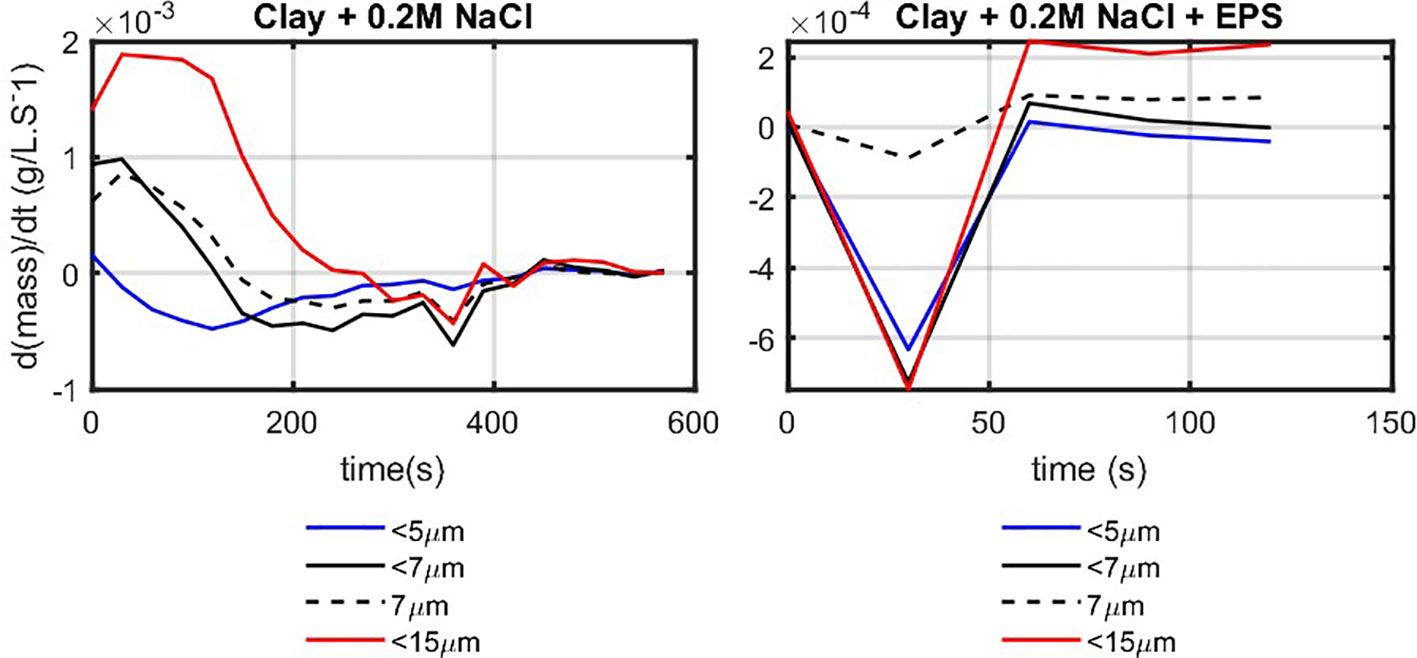
Figure 12 Decay rate of the fine classes () as function of time for salt-induced (0.7 g/L clay + 0.2 M NaCl; left panel) and organic matter–induced (with EPS; the right panel).
In the sample with EPS in contrast, the flocculation mechanism is completely different. At onset of the experiment (t = 30 s), all of the fine classes are depleted, and the larger ones are filled. This behavior is characteristic for bridging flocculation, where large polymer molecules capture simultaneously several (mineral) particles. The changes occurring over time, after 50 s, are due to the restructuring of flocs under shear.
Figure 13 shows the (mass of the fines), (represented by the mass of the D50), and the total mass, which is obtained by as function of time for both clay + 0.2 M Nacl and with EPS samples.
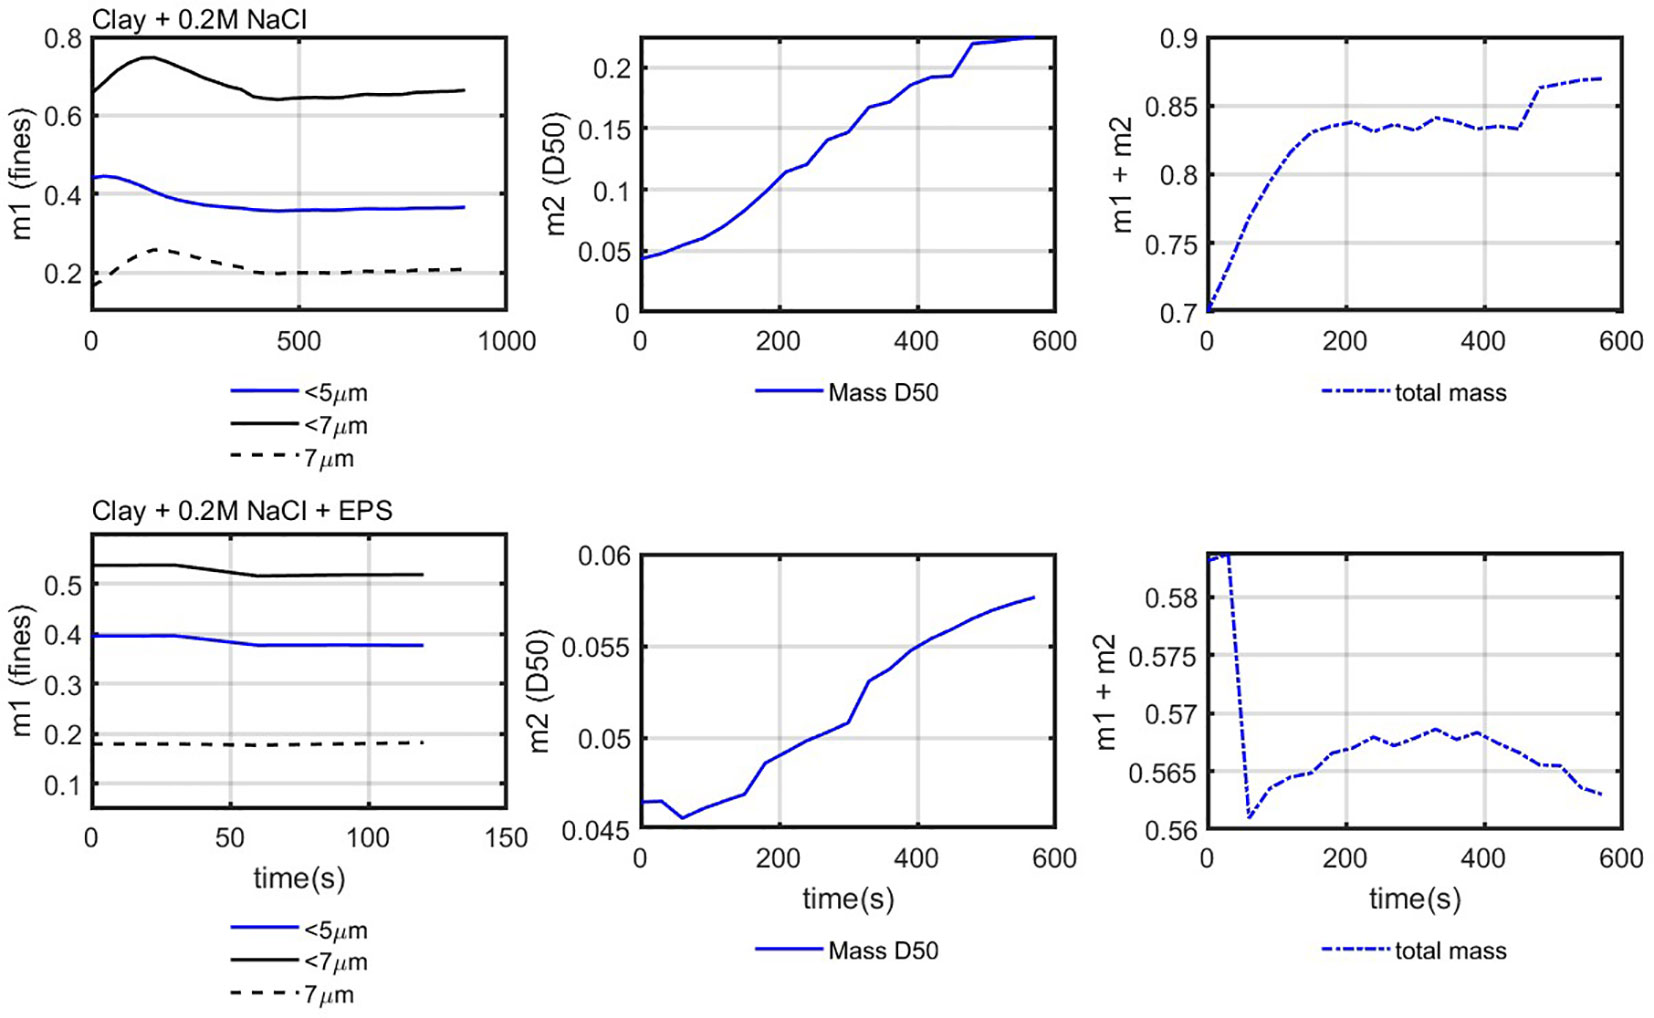
Figure 13 Mass balance for two samples: 0.7 g/L clay + 0.2 M NaCl (upper panel) and clay 0.7 g/L + 0.2 M NaCl + EPS (10 mg/L; lower panel). The total mass is calculated using the 7-µm particles.
The total mass should remain constant as the clay concentration does not change in the system. It can be seen that defining the 7- m class as “Class 1” and the D50 as “Class 2” leads to a relatively constant ( ) over time. The difference with the expected value ( ) is attributed to the uncertainty about the value for the density of Class 2 particles (flocs) over time and (especially for the case with EPS) the technical issues linked to the measurements of particle sizes by static light scattering (Safar et al., 2022).
4.8 Toward in situ flocculation modeling
To calibrate a sediment transport model that includes flocculation with in situ data, the following parameters, related to sediment properties, are required (Chassagne et al., 2021).
1. The concentration of inorganic (clay) particles in the system: This mass can be assessed by removing the organic matter within a sample taken in situ and weighting. This experiment is also used to calibrate the OBS (optical backscatter device used to measure concentrations in situ).
2. The relative volume concentration of Classes 1 and 2 and the total volume of measured particles per unit of volume: These can be obtained from the LISST (Laser In situ Scattering and Transmissometry device) and OBS data (Chassagne and Safar, 2020).
3. The average settling velocities associated to unflocculated inorganic clay particles (Class 1) and flocs (Class 2) particles: The settling velocity of Class 1 particles can easily be estimated. The settling velocity of Class 2 particles can only be measured by video microscopy measurements on samples taken in situ (Safar et al., 2022).
One important process in flocculation is the mass transfer between Class 1 and Class 2. As shown in this article, this transfer occurs at timescales that are short compared with the numerical time scales in sediment transport models (which are in the range of 1–5 min). In the case of organic matter based flocculation that is the most important flocculation in situ, it is found that the flocculation time scales are in order of seconds. It would, however, not be correct to assume that flocculation occurs on the same timescales in situ, as the sediment concentrations and shear rates are lower. Moreover, it was also recently discussed that differential settling plays an important role in estuarine regions (Deng et al., 2019; Chassagne et al., 2021). The present laboratory experiments only demonstrate that, in the presence of organic matter and salt, the collision efficiency (leading to aggregation) is very high. In particular, this was shown for the aggregation between mineral clay and a living microorganism (Skeletonema costatum), whereas most studies concentrate on the aggregation between mineral clay and dead organic matter.
5 Conclusion
In this study, flocculation experiments were presented and modeled. Two classes of particles were defined: a class containing unflocculated mineral clay (Class 1) and the class corresponding to flocs (Class 2). Laboratory experiments were performed using salt, natural “dead” organic matter (EPS and FDA), and LA Skeletonema costatum.
The D50 did not exceed the Kolmogorov microscale, in salt-induced flocculation experiments in agreement with other studies (Winterwerp, 2002; Mietta et al., 2011a). Divalent salts flocculated the clay more efficiently than monovalent salts at short timescales. There was no breakage as the shear was kept constant, and this enabled the system to achieve an equilibrium condition.
The flocs with natural organic matter reached higher sizes than the Kolmogorov microscale also in agreement with other studies (Cross et al., 2013). Flocculation experiments with EPS and FDA resulted in high D50 of about 70–100 m, and it was demonstrated that the floc size is strongly composition-dependent. Therefore, for modeling flocculation in situ, the availability of organic matter has to be known. This can be done by analyzing samples from the water column in the laboratory as constituents such as EPS and FDA cannot be visualized using in situ techniques.
The natural EPS and FDA, however, do not flocculate easily with the clay, despite their high stickiness and large sizes (Passow, 2002). This is due to the fact that these polymers are mostly negatively charged particles and, hence, experience an electrostatic repulsion with the negatively charged clay. For this reason, the presence of salts and, in particular, cations is crucial, as these cations will help bridging the polymer and clay (Palomino et al., 2012). These cations usually become available in the transition zone between fresh water from rivers and sea water from the coast. This is why studying floc formation in this transition zone is important in terms of sediment transport modeling. The nutrient-rich freshwater is suitable for microorganisms to grow, and the shallowness of coastal waters provides suitable conditions for microorganisms to have seasonal blooms and to enrich the water with organic matter. It was demonstrated that both dead and living microalgae (Skeletonema costatum) aggregate with mineral sediment and that different combinations of organic matter and salt strongly influence the flocculation timescales.
Knowing the source and concentration of the primary particles (Class 1) in the system, and flocculation agents such as organic matter and/or algae species and salts, a mass balance can be established, whereby the mass concentration of Class 1 decreases in time by flocculation, and the mass concentration of Class 2 [often represented in good approximation by the median size (D50)] increases as function of time.
The model parameterization showed that the flocculation timescales found by performing laboratory experiments are too short (in order of seconds to minutes), to be relevant in large-scale sediment transport models. These timescales are, however, found in jar test experiments where sediment concentration and shear rates are different from in situ, due to technical constrains. Moreover, the residence time of particles in the jar is infinite, and the mixing is homogeneous. Therefore, these types of experiments do not correspond to in situ conditions, where differential settling can play a role (Chassagne et al., 2021). To bridge the gap between jar scale and in situ, an intermediate scale has to be investigated, which is the topic of our current research.
Data availability statement
The datasets presented in this study can be found in online repositories. The names of the repository/repositories and accession number(s) can be found below: https://repository.tudelft.nl/islandora/object/uuid%3A17d027d9-9667-4afa-89b9-aacd557a41ac?collection=research.
Author contributions
All authors listed have made a substantial, direct, and intellectual contribution to the work, and approved it for publication.
Funding
This work is part of the research program The New Delta, with project number NWO 869.15.011, financed by the Dutch Research Council (NWO). The project is entitled “Flocs and fluff in the Delta” and has been performed in the frame of the MUDNET academic network (https://www.tudelft.nl/mudnet/).
Acknowledgments
Saskia Huisman from Deltares (Rotterdamsweg) is gratefully acknowledged for facilitating the measurements.
Conflict of interest
The authors declare that the research was conducted in the absence of any commercial or financial relationships that could be construed as a potential conflict of interest.
Publisher’s note
All claims expressed in this article are solely those of the authors and do not necessarily represent those of their affiliated organizations, or those of the publisher, the editors and the reviewers. Any product that may be evaluated in this article, or claim that may be made by its manufacturer, is not guaranteed or endorsed by the publisher.
References
Alldredge A. L., Passow U., Logan B. E. (1993). The abundance and significance of a class of large, transparent organic particles in the ocean. Deep Sea Res. Part I: Oceanographic Res. Papers. 40 (6), 1131–1140. doi: 10.1016/0967-0637(93)90129-Q
Chassagne C. (2021). A simple model to study the flocculation of suspensions over time. Chem. Eng. Res. Design. 172, 302–311. doi: 10.1016/j.cherd.2021.06.006
Chassagne C., Safar Z. (2020). Modelling flocculation: Towards an integration in large-scale sediment transport models. Mar. Geology 430, 106361. doi: 10.1016/j.margeo.2020.106361
Chassagne C., Safar Z., Deng Z., He Q., Manning A. (2021). Flocculation in estuaries: modeling, laboratory and in-situ studies. In: Sediment Transport-Recent Advances. (IntechOpen). doi: 10.5772/intechopen.100404
Chen P., Yu J. C., Fettweis M. (2018). Modeling storm-influenced suspended particulate matter flocculation using a tide-wave-combined biomineral model. Water Environ. Res. 90 (3), 244–257. doi: 10.2175/106143017X15131012152799
Cross J., Nimmo-smith W., Torres A. M., Hosegood R., Philip J. (2013). Biological controls on resuspension and the relationship between particle size and the Kolmogorov length scale in a shallow coastal sea. Mar. Geology 343, 29–38. doi: 10.1016/j.margeo.2013.06.014
Cuthbertson A. J., Samsami F., Dong P. (2018). Model studies for flocculation of sand-clay mixtures. Coast. Engineering. 132, 13–32. doi: 10.1016/j.coastaleng.2017.11.006
De Boer R. J. (2018). Modeling population dynamics: A graphical approach (Utrecht University). Available at: http://tbb.bio.uu.nl/rdb/books/.
Deng Z., He Q., Safar Z., Chassagne C. (2019). The role of algae in fine sediment flocculation: In-situ and laboratory measurements. Mar. Geology. 413, 71–84. doi: 10.1016/j.margeo.2019.02.003
Elimelech M., Gregory J., Jia X. (2013). Particle deposition and aggregation: measurement, modelling and simulation. Butterworth-Heinemann.
Ibanez Sanz M. E. (2018). Flocculation and consolidation of cohesive sediments under the influence of coagulant and flocculant Doctoral dissertation. (Delft University of Technology).
Jackson G. A. (1990). A model of the formation of marine algal flocs by physical coagulation processes. Deep Sea Res. Part A. Oceanographic Res. Papers 37 (8), 1197–1211. doi: 10.1016/0198-0149(90)90038-W
Jeldres R. I., Concha F., Toledo P. G. (2015). Population balance modelling of particle flocculation with attention to aggregate restructuring and permeability. Adv. colloid Interface science. 224, 62–71. doi: 10.1016/j.cis.2015.07.009
Jeldres R. I., Fawell P. D., Florio B. J. (2018). Population balance modelling to describe the particle aggregation process: A review. Powder Technology. 326, 190–207. doi: 10.1016/j.powtec.2017.12.033
Jin W., McCue S. W., Simpson M. J. (2018). Extended logistic growth model for heterogeneous populations. J. Theor. Biol. 445, 51–61. doi: 10.1016/j.jtbi.2018.02.027
Lai H., Fang H., Huang L., He G., Reible D. (2018). A review on sediment bioflocculation: Dynamics, influencing factors and modeling. Sci. total Environ. 642, 1184–1200. doi: 10.1016/j.scitotenv.2018.06.101
Lambert A. (2005). The branching process with logistic growth. Ann. Appl. Probability 15 (2), 1506–1535. doi: 10.1214/105051605000000098
Lee B. J., Toorman E., Molz F. J., Wang J. (2011). A two-class population balance equation yielding bimodal flocculation of marine or estuarine sediments. Water Res. 45 (5), 2131–2145. doi: 10.1016/j.watres.2010.12.028
Logan B. E., Passow U., Alldredge A. L., Grossartt H. P., Simont M. (1995). Rapid formation and sedimentation of large aggregates is predictable from coagulation rates (half-lives) of transparent exopolymer particles (TEP). Deep Sea Res. Part II: Topical Stud. Oceanography 42 (1), 203–214. doi: 10.1016/0967-0645(95)00012-F
Maggi F. (2005). Flocculation dynamics of cohesive sediment. PhD thesis (Delft University of Technology).
Maggi F. (2009). Biological flocculation of suspended particles in nutrient-rich aqueous ecosystems. J. Hydrology 376 (1-2), 116–125. doi: 10.1016/j.jhydrol.2009.07.040
Mietta F., Chassagne C., Manning A. J., Winterwerp J. C. (2009). Influence of shear rate, organic matter content, pH and salinity on mud flocculation. Ocean Dynamics. 59 (5), 751–763. doi: 10.1007/s10236-009-0231-4
Mietta F., Chassagne C., Verney R., Winterwerp J. C. (2011a). On the behavior of mud floc size distribution: model calibration and model behavior. Ocean Dynamics 61 (2), 257–271. doi: 10.1007/s10236-010-0330-2
Mietta F., Chassagne C., Verney R., Winterwerp J. C. (2011b). On the behavior of mud floc size distribution: model calibration and model behavior. Ocean Dynamics. 61 (2), 257–271. doi: 10.1007/s10236-010-0330-2
Palomino D., Hunkeler D., Stoll S. (2012). Salt concentration influence on the efficiency of two cationic polymeric flocculants. Colloid Polymer Sci. 290, 1301–1308. doi: 10.1007/s00396-012-2653-7
Passow U. (2002). Transparent exopolymer particles (TEP) in aquatic environments. Prog. oceanography 55 (3-4), 287–333. doi: 10.1016/S0079-6611(02)00138-6
Passow U., Shipe R. F., Murray A., Pak D. K., Brzezinski M. A., Alldredge A. L. (2001). The origin of transparent exopolymer particles (TEP) and their role in the sedimentation of particulate matter. Continental Shelf Res. 21 (4), 327–346. doi: 10.1016/S0278-4343(00)00101-1
Safar Z., Chassagne C., Rijnsburger S., Sanz M. I., Manning A. J., Souza A. J., Pietrzak J. D. (2022). Characterization and classification of estuarine suspended particles based on their inorganic/organic matter composition. Front. Mar. Sci. 9, 896163. doi: 10.3389/fmars.2022.896163
Selomulya C., Bushell G. R., Amal R. O., Waite T. D. (2003). Understanding the role of restructuring in flocculation: The application of a population balance model. Chem. Eng. Science. 58 (2), 327–338. doi: 10.1016/S0009-2509(02)00523-7
Shakeel A., Safar Z., Ibanez M., van Paassen L., Chassagne C. (2020). Flocculation of clay suspensions by anionic and cationic polyelectrolytes: A systematic analysis. Minerals 10 (11), 999. doi: 10.3390/min10110999
Winterwerp J. C. (1998). A simple model for turbulence induced flocculation of cohesive sediment. J. hydraulic Res. 36 (3), 309–326. doi: 10.1080/00221689809498621
Winterwerp J. C. (2002). On the flocculation and settling velocity of estuarine mud. Continental shelf Res. 22 (9), 1339–1360. doi: 10.1016/S0278-4343(02)00010-9
Zhang J., Shen X., Zhang Q., Maa J. P., Qiao G. (2019). Bimodal particle size distributions of fine-grained cohesive sediments in a settling column with oscillating grids. Continental Shelf Res. 174, 85–94. doi: 10.1016/j.csr.2019.01.005
Keywords: logistic growth, flocculation, population balance equation, clay, EPS, microalgae
Citation: Safar Z, Deng Z and Chassagne C (2023) Applying a logistic growth equation to model flocculation of sediment in the presence of living and dead organic matter. Front. Mar. Sci. 10:1227849. doi: 10.3389/fmars.2023.1227849
Received: 23 May 2023; Accepted: 10 July 2023;
Published: 24 August 2023.
Edited by:
Liyang Yang, Fuzhou University, ChinaCopyright © 2023 Safar, Deng and Chassagne. This is an open-access article distributed under the terms of the Creative Commons Attribution License (CC BY). The use, distribution or reproduction in other forums is permitted, provided the original author(s) and the copyright owner(s) are credited and that the original publication in this journal is cited, in accordance with accepted academic practice. No use, distribution or reproduction is permitted which does not comply with these terms.
*Correspondence: Zeinab Safar, ei5zYWZhckB0dWRlbGZ0Lm5s; Claire Chassagne, Qy5DaGFzc2FnbmVAdHVkZWxmdC5ubA==