 Jinyu Chen
 Daixi Liu2
 Yafei Wang
 Ranran Huang
- 1Institute of Marine Science and Technology, Shandong University, Qingdao, China
- 2School of Pharmaceutical Sciences, Shandong University, Jinan, China
Synechococcus is one of the most abundant prokaryotic photosynthetic organisms on Earth and plays a key role in oceanic carbon fixation and transformation. To improve the photosynthetic efficiency of synechococcus, a post-transcriptional regulatory mechanism - Selective RNA Processing and Stabilization (SRPS) was considered. We inactivated the SRPS-enzymes, executor of the SRPS mechanism, to explore their regulation rule of photosynthetic carbon fixation efficiency in Synechococcus. The results showed that the inactivation of SRPS-enzymes mainly affected the growth rate or growth phase. It significantly alters the photosynthetic oxygen evolution rate, pigment content, chlorophyll fluorescence, carbon and nitrogen content, as well as the composition and biological activity of the dissolved organic matter derived from Synechococcus (SOM). Inactivating SRPS-enzymes results in an increase in the expression level of most subunits of the Cytochrome b6-f complex, while the expression levels of most subunits of PSI, PSII, RuBisCO, and NDH decrease. All SRPS-enzymes are involved in the expression regulation of basilic protein complexes in photosynthesis, such as PSI, PSII, Cytochrome b6-f complex, ATP synthase, and RuBisCO. Our results indicate that the inactivation of SRPS-enzymes have a significant influence on carbon sequestration by photosynthesis of Synechococcus sp. PCC7002.
1 Introduction
Excessive emissions of greenhouse gases have increased the atmosphere’s ability to trap heat, resulting in a strengthening of the greenhouse effect and adverse changes to global climate. CO2 is the most significant component of greenhouse gases, with concentrations in the atmosphere surpassing 400 ppm and emissions continuing to break records. To address climate issues and achieve carbon peaking and carbon neutrality, there is a need to increase efforts to reduce and store carbon. Part of the CO2 generated by human activity remains in the atmosphere, while another portion is absorbed by the ocean and terrestrial ecosystems. The majority of the absorbed CO2 enters the carbon cycle through autotrophic and heterotrophic processes.
The total area of the ocean accounts for about 70.8% of the Earth’s surface area, and it is the foundation of all life. It absorbs approximately 1/4 of the CO2 generated by human activities (Le Quéré et al., 2018). The ocean stores carbon through mechanisms such as the biological pump (BP), carbonate counter pump (CCP), microbial carbon pump (MCP), and solubility pump (Li et al., 2022), and the stored forms of carbon mainly include carbonate ions (eg, dissolved inorganic carbon, DIC), dissolved organic carbon (DOC), particulate organic carbon (POC), and biogenic organic carbon (BOC) (Jiao et al., 2014). More than 95% of the organic matter in the ocean exists in dissolved form, known as dissolved organic matter (DOM), and the carbon storage of ocean DOM accounts for about 93% of the total carbon on Earth (Swallow, 1963). It plays an important regulatory role in global climate change and CO2 concentration changes, and is an important part of the carbon cycle on Earth and the world’s largest carbon sink. DOC is a component of DOM, and the inert dissolved organic carbon (RDOC) pool accounts for more than 90% of the total DOC storage, making the CO2 equivalent absorbed by marine and terrestrial ecosystems similar (Häder et al., 2007).
In the ocean, phytoplankton absorb DIC through photosynthesis and convert it into organic matter within their cells (Geider and La Roche, 2002). DOM is then released through active excretion, passive diffusion, or cell lysis and is transferred up the food chain in the form of POC. Ultimately, this POC is exported to the deep sea and plays a crucial role in the ocean’s biological carbon sequestration/storage function (Falkowski, 2012). Marine microalgae, which are important representatives of phytoplankton, form the basis of the BP that sequesters carbon. Compared to land-based photosynthetic organisms, microalgae have a fast cell reproduction rate and high biomass production, with less than 1% of the biomass of land-based photosynthetic organisms being able to fix half of the annual CO2 emissions into organic matter. In summary, marine microalgae can use CO2 as a carbon source and convert it into organic matter through photosynthesis using sunlight as an energy source (Ibrahim et al., 2020), thus aiding in carbon sequestration.
Photosynthesis is the unique and important characteristic of autotrophic organisms that use light as their energy source. Cyanobacteria are the most abundant group of photosynthetic microorganisms on Earth (Hoover et al., 2005), with a simple structure and a cell wall structure and composition similar to Gram-negative bacteria. However, they have photosynthetic units similar to eukaryotic chloroplast (Carr and Whitton, 1982), which are almost directly or indirectly affected by photosynthesis. The cytoplasm contains carboxysomes and genetic material, the former is an organelle formed by polyhedral proteins to contain RuBisCO and participate in efficient carbon concentrating mechanism (CCM), which enrich CO2 around RuBisCO and thus increase the photosynthetic carbon fixation efficiency of cyanobacteria (Ducat et al., 2011; Durall and Lindblad, 2015). Photosynthesis is achieved through the participation of two photosynthetic systems (Photosystem I, PS I; Photosystem II, PS II), using light energy to convert inorganic matter such as CO2 and water into organic matter while producing oxygen. Key players in this process include PS I, PS II, the Cytochrome b6-f complex, ATP synthase, RuBisCO, and NADH dehydrogenase.
The PSII is a photosynthetic membrane protein that functions as the primary reaction center in light reactions. It consists of: (1) Core antenna proteins: A core antenna protein composed of two pigment protein complexes, chlorophyll protein 47 (CP47) and chlorophyll protein 43 (CP43), which surround P680 chlorophyll. These complexes are encoded by the psbB and psbC. (2) Light harvesting pigment protein complex II (LHCII): A complex of light-harvesting pigment proteins known as LHCII. (3) PSII reaction center: composed of D1 and D2 proteins (encoded by the psbA and psbD) and cytochrome b559. This reaction center is responsible for receiving light energy and facilitating electron transfer (Barber et al., 1997). (4) Oxygen-evolving complex peripheral proteins (Buchanan et al., 2015).
The Cytochrome b6-f complex is composed of 8 subunits, 13 transmembrane helices, and 7 tightly bound cofactors per monomer. Among these cofactors, three are involved in electron transfer: cytochrome f (Cyt f): encoded by the petA. 2Fe-2S iron-sulfur protein. Cytochrome b6 (CytB6): encoded by the petB. The presence of the cytochrome b6-f complex allows for the transfer of electrons between reduced plastoquinone (PQ) and oxidized plastocyanin (PC) (Wollman et al., 1999).
PSI is a pigment-protein complex that consists of the primary electron donor P700, primary electron acceptors A0 and A1, and three iron-sulfur proteins (ferredoxins, Fd) encoded by the psaA, psaB, and psaC. It catalyzes the transfer of electrons through a series of electron carriers, including PC (plastocyanin), from the cytochrome b6-f complex to Fd, ultimately leading to the generation of NADPH, which provides reducing power for the subsequent dark reactions. Simultaneously, the oxidized form of P700 (P700+) receives electrons from the cytochrome b6-f complex and PC, completing the electron flow between PSII and PSI.
ATP synthase is involved in both cellular respiration and cellular photosynthesis. It is composed of a membrane-embedded hydrophobic portion called CF0 and a membrane-exposed hydrophilic portion called CF1. CF1 is responsible for driving the phosphorylation of ADP to ATP. It contains two crucial subunits, CF1-α and CF1-β, which are encoded by the atpA and atpB, respectively.
Cyanobacteria, perform a process called photophosphorylation, where they utilize light energy to synthesize ATP through photosynthesis. The respiratory chain in cyanobacteria consists of four enzyme complexes and two mobile electron carriers. The final enzyme complex in this chain is the cytochromeC oxidase complex (COX), which is responsible for transferring electrons from cytochrome C to molecular oxygen. The COX complex is composed of multiple subunits, including ndhA, ndhB, ndhC, ndhD, ndhD1, ndhD2, and ndhE, among others.
In prokaryotes, genes encoding translation protein complexes and related functions are often organized in the form of operons (Koonin, 2009). When encoding protein complexes in operon form, a certain proportion of protein subunits are expressed, but there is a conflict between the equimolar transcription abundance required for each gene in the protein complex under the operon structure and the non-equimolar protein abundance required for functional performance. Selective RNA processing and stabilization (SRPS) (Rochat et al., 2013), a post-transcriptional regulatory mechanism in prokaryotes, can solve this conflict. Previously, our laboratory has depicted the stoichiometric regulatory model of SRPS in Escherichia coli. The effectiveness of several SRPS elements was validated by using a dual-fluorescence reporter system. At the same time, analysis of published dRNA-seq data from pure-cultured marine microbes revealed that multiple operons may be potentially regulated by SRPS. Taking the Prochlorococcus marinus strMIT9313 (Voigt et al., 2014) as an example, a total of 32 protein complexes were found to be regulated by SRPS, including photosystems, plastocyanin, and photoinhibitory proteins, providing a strong signal that SRPS is widely present in known cultured marine microbes.
Given the important role of Synechococcus in marine biogeochemical cycles and synthetic biology, this study focuses on the SRPS enzyme (Table S1) from the model Synechococcus sp. PCC7002 (hereinafter referred to as PCC7002) to explore how it affects the growth rate, chlorophyll fluorescence, carbon and nitrogen decomposition, and expression of key protein complex subunits involved in photosynthesis (Table S2) through a series of pure-culture experiments after inactivating SRPS-enzymes.
2 Materials and methods
2.1 Strains and culture conditions
Single colony was picked from the ultra-clean bench and inoculated into a small conical flask containing fresh culture medium that had been preheated at 450°C in a muffle furnace for 5 hours to remove carbon. Kanamycin (Kan) antibiotic was added as required, with a final concentration of 50 μg mL-1. The cultivation conditions were set at an average light intensity of 200 μmol m-2 s-1, a temperature of 30°C, and a rotational speed of 200 rpm. The culture was shaken on a shaker for approximately three weeks until it reached the exponential phase with an OD730 of 4 ± 0.2, and then it was used as the seed liquid. The initial inoculum concentration was OD730 = 0.05. The seed liquid was transferred to sterile centrifuge tubes and centrifuged at 4000 rpm for 20 minutes to collect the algal cells. The cells were then resuspended in fresh A+ liquid medium (Sevens and Porter, 1980) and inoculated into conical flasks that had been preheated at 450°C in a muffle furnace for 5 hours to remove carbon. Each mutant strain was supplemented with a fixed amount of kanamycin (50 μg mL-1).
2.2 Construction of PCC7002 mutants
The plasmid pJET1.2/blunt and the kanamycin fragment were kindly provided by a senior colleague in the laboratory. The gene fragment of SRPS-enzymes was obtained by PCR using the extracted PCC7002 genomic DNA as a template. Fragments of 1000 bp upstream and downstream of the gene segment of SRPS-enzymes in PCC7002 were selected and copied into the Snap Gene software. The target gene segment and regions suitable for primer design were marked. Using Snap Gene software, the SRPS-enzymes gene segment was replaced with the kanamycin segment. Then, it was combined with the pJET1.2/blunt vector, and suitable primers (Table S4) were designed for the connecting region. Obtaining gene fragments through PCR and plasmid reconstruction. When the OD730 of WT reaches around 5.0, 5 mL of algal culture is collected and centrifuged at 4000 rpm for 10 minutes. Then, 1 mL of fresh culture medium is added and concentrated fivefold. The mixture is combined with 300 ng of plasmid, sealed with a membrane and tightly closed with a lid. It is then placed in a conical flask on a light shaker and cultured for 24 hours. The next day, a sterile microporous membrane is placed on A+ solid medium without kanamycin (Kan). Spread 200 μL of a ten-fold diluted culture evenly on the microporous membrane and incubate for 48 hours. Transfer the microporous membrane to A+ solid medium containing kanamycin (50 μg mL-1). Keep it in a light incubator for approximately two weeks, and single colonies will start to appear. Verify through PCR and send the products of PCR for sequencing.
2.3 Growth curve determination
The cell density in the culture of PCC7002 was monitored by a UV-visible spectrophotometer (UV-1800, Shimadzu, Japan). 1 mL of culture was taken from all culture bottles and the OD730 (Perez et al., 2016) was measured. The growth curve was determined by pre-experiments and recorded. μmax was calculated by equation (Mou et al., 2018):
Where OD730t and OD730to are the cell densities at time t and t0, respectively.
2.4 Photosynthetic oxygen evolution rate determination
2 mL of algal solution was taken from exponential stage (OD730 = 4.0 ± 0.2) and dark-treated for 30 min. During the experiment, the light intensity was set to 0, 50, 100, 200, 400, and 600 μmol m-2 s-1, with corresponding processing times were 3, 2, 2, 2, 2, and 2 min, respectively. The change in oxygen concentration during the light-dark period was observed, and a section with a stable slope (around 1 min) was selected to obtain the oxygen evolution rate.
2.5 Measurement of pigment content
2 mL of algal culture was taken from lag phase (OD730 = 0.5 ± 0.2), exponential phase (OD730 = 4.0 ± 0.2), and decline phase (OD730 = 10.0 ± 0.2), which were collected by GF/F filter membranes (Whatman, diameter 25 mm). Then, 5 mL of 90% (v/v) acetone solution prepared with Milli-Q water was added, and the mixture was thoroughly mixed and immediately stored in the dark at 4°C for 12 h to extract the pigments. The next day, the sample was centrifuged at 4000 rpm for 10 min, and the supernatant was carefully pipetted into a quartz cuvette with a path length of 1 cm. The pigment content was determined by using 90% acetone solution as a blank reference and conducting baseline calibration. The mass concentrations of Chlα and Car were calculated using the Jeffrey spectrophotometric method (Parsons et al., 1984) based on Equations:
Where unit is μg mL-1, A480, A510, A630, A647, A664, and A750 represent the absorbance at 480, 510, 652, 665, and 750 nm, respectively.
2.6 Chlorophyll fluorescence measurement
2 mL of algal solution from each sample was taken at the exponential phase, and the algae were dark-treated for 30 min so that the fluorescence yield was at its lowest. The samples were then exposed to a series of light intensities of 0, 36, 82, 142, 220, 321, 452, 622, and 843 μmol m-2 s-1 for 18 s, 63 s, 152 s, 197 s, 242 s, 302 s, 391 s, 481 s, and 571 s, respectively, and rapid light curves (RLC) were measured. Using the method of Demmig-Adams (Demmig-Adams and Adams, 1994) and the formula (Webb et al., 1974) Y=Pm*[1-exp(-x/Ek)], a series of parameters including rETR, Ek, α and Fv/FM (Genty et al., 1989) were determined by fitting the RLC. To ensure the accuracy of the data, the OD730 of the algae should be controlled at ≤ 2, and if necessary, all samples should be diluted proportionally with medium A+.
2.7 Carbon and nitrogen contents measurement
For carbon and nitrogen content measurement, GF/F filter membranes were used to filter the sample and then left in concentrated hydrochloric acid for 12 hours to remove inorganic carbon in the sample. Then, the sample was dried at 60°C for 24 hours, weighed, wrapped in cut tinfoil (burned at 450°C in a Muffle furnace for 5 hours), and the POC and PON content of algal cells were measured using an elemental analyzer (EA3000, ECA classic, NC Tecnologes, Italy).
2.8 DOM absorption and fluorescence measurements
Collect 5 mL of algal liquid at lag phase, exponential phase, and decline phase in a brown bottle. Dilute the collected algal liquid and filter it using a glass fiber filter membrane (Martínez-Pérez et al., 2017) under vacuum filtration (pressure< 0.04 MPa) into a new brown bottle. The dilution factor is 18-fold, and store it at -20°C.
Use Milli-Q water as a blank reference and place it in the sample compartment to perform the zero and baseline initialization operations. The default excitation (Ex) and emission (Em) slit widths are set to 1.0 nm, and the scanning range is set from 250 to 700 nm. Take a small amount of the test sample and rinse it twice in a quartz cuvette with an optical path length of 1 cm. After discarding the rinse solution, add the sample for measurement (each sample is measured three times, and the average value is taken). By peak detection and calculation, roughly compare the peak data present in all samples, and correct using the average absorbance coefficient between 575 and 600 nm. The formula for calculating the absorption coefficient of CDOM is as follows (Bricaud et al., 1981):
In the formulas provided, λ represents the actual wavelength, aCDOM(λ) and ACDOM(λ) represent the CDOM absorption coefficient and sample optical density at the wavelength λ, respectively. L represents the optical path length, and the unit is unified as meters (m). The value of the absorption coefficient is influenced by the dilution factor of the sample. In this study, the final calculated result needs to be multiplied by the dilution factor of the sample, which is 18. The spectral slope (S) is obtained by fitting a nonlinear least squares program within the ranges of 275 to 295 nm (S275-295) and 350 to 400 nm (S350-400). The formula (Blough, 2002) for calculating the spectral slope is as follows:
where λ0 is a reference wavelength.
The instrument is equipped with a 150 W xenon lamp, and the photomultiplier tube voltage is set to 600 V. The excitation and emission slit widths are both set to 10 nm. The excitation wavelength is set to 250-550 nm, and the emission wavelength is set to 250-600 nm. The scanning speed is set to 1200 nm min-1. The data is processed using the drEEM 0.6.3 toolbox in MATLAB 2021a, utilizing the PARAFAC method for component analysis (Murphy et al., 2013). The dilution procedure of the samples includes the corresponding toolbox processing. Prior to analysis, the Raman correction program in the drEEM toolbox is used to remove the fluorescence data corresponding to Rayleigh scattering and Raman scattering. All fluorescence data is expressed in Raman Units (RU) for the calculation of HIX (Ohno, 2002) and BIX (Huguet et al., 2009).
2.9 Quantitative real-time PCR
10mL of algae cells were collected in the exponential phase and quickly frozen in liquid nitrogen. Grind the cells and use Trizol to rupture the cells. Use the EZ-10 Total RNA Mini-Preps Kit to obtain high-quality RNA. Measure the concentration of RNA using Nanodrop and Qubit 4 instruments (Thermo Fisher) and check the integrity of the extracted RNA. The Prime ScriptTM RT reagent Kit with gDNA Eraser (TaKaRa, China) was used to remove genomic DNA, and the SYBR® Premix Ex Taq™ II kit (TaKaRa, China) was used for reverse transcription and cDNA synthesis.
2.10 Data analysis
All data were derived from three biological duplicate samples from the same batch in the same growing environment. Two-way ANOVA was used to compare the significant differences between samples, and Pearson correlation coefficients were used to characterize the correlations between different indicators. The mean and standard deviation were partially displayed, and the significance level was set to p ≤ 0.05.
3 Results
3.1 Effects of SRPS-enzymes on the growth
3.1.1 Growth curve
The mutant strains PCC7002Δrnj and PCC7002ΔIII-2,3, showed a delay of about 2 days in the lag phase compared to the wild-type (WT) (Figure 1). It was predicted that the inactivation of SRPS-enzymes caused changes in part of the metabolic pathway, which is not conducive for algae cells to adapt to the environment and slows down cell division. These three mutant strains showed similar growth trends in exponential and stable phases, all of which were significantly lower than those of WT. After the mutation of SRPS-enzymes expression gene, the growth curve in the exponential phase was more gentle than that of WT. WT reached the growth peak after being cultured for 44 days and the final OD730 was 8.83 ± 0.05. The cumulative cell density reached the maximum, and the number of algae cells began to decrease after 46 days, entering the decline phase. PCC7002Δrnj and PCC7002ΔIII-2,3 entered the stable phase at day 40, and the final OD730 was 7.11 ± 0.02, 6.63 ± 0.01, and 7.19 ± 0.12, respectively, which were significantly lower than that of WT (paired test, P< 0.05). PCC7002ΔIII-1 was the only strain that outperforms WT throughout the entire growth stage. The duration of the three phases was similar to that of WT, but the final OD730 was 10.69 ± 0.23, which was 21% higher than that of WT. RppH was speculated to have pyrophosphohy drolase activity. The lag phase of PCC7002Δrpph mutant strain was delayed by about 2 days compared to WT, and the growth state throughout the exponential phase was also relatively smooth. The time to enter the decline phase was delayed by 6 days compared to WT, but the duration was shortened by almost half.
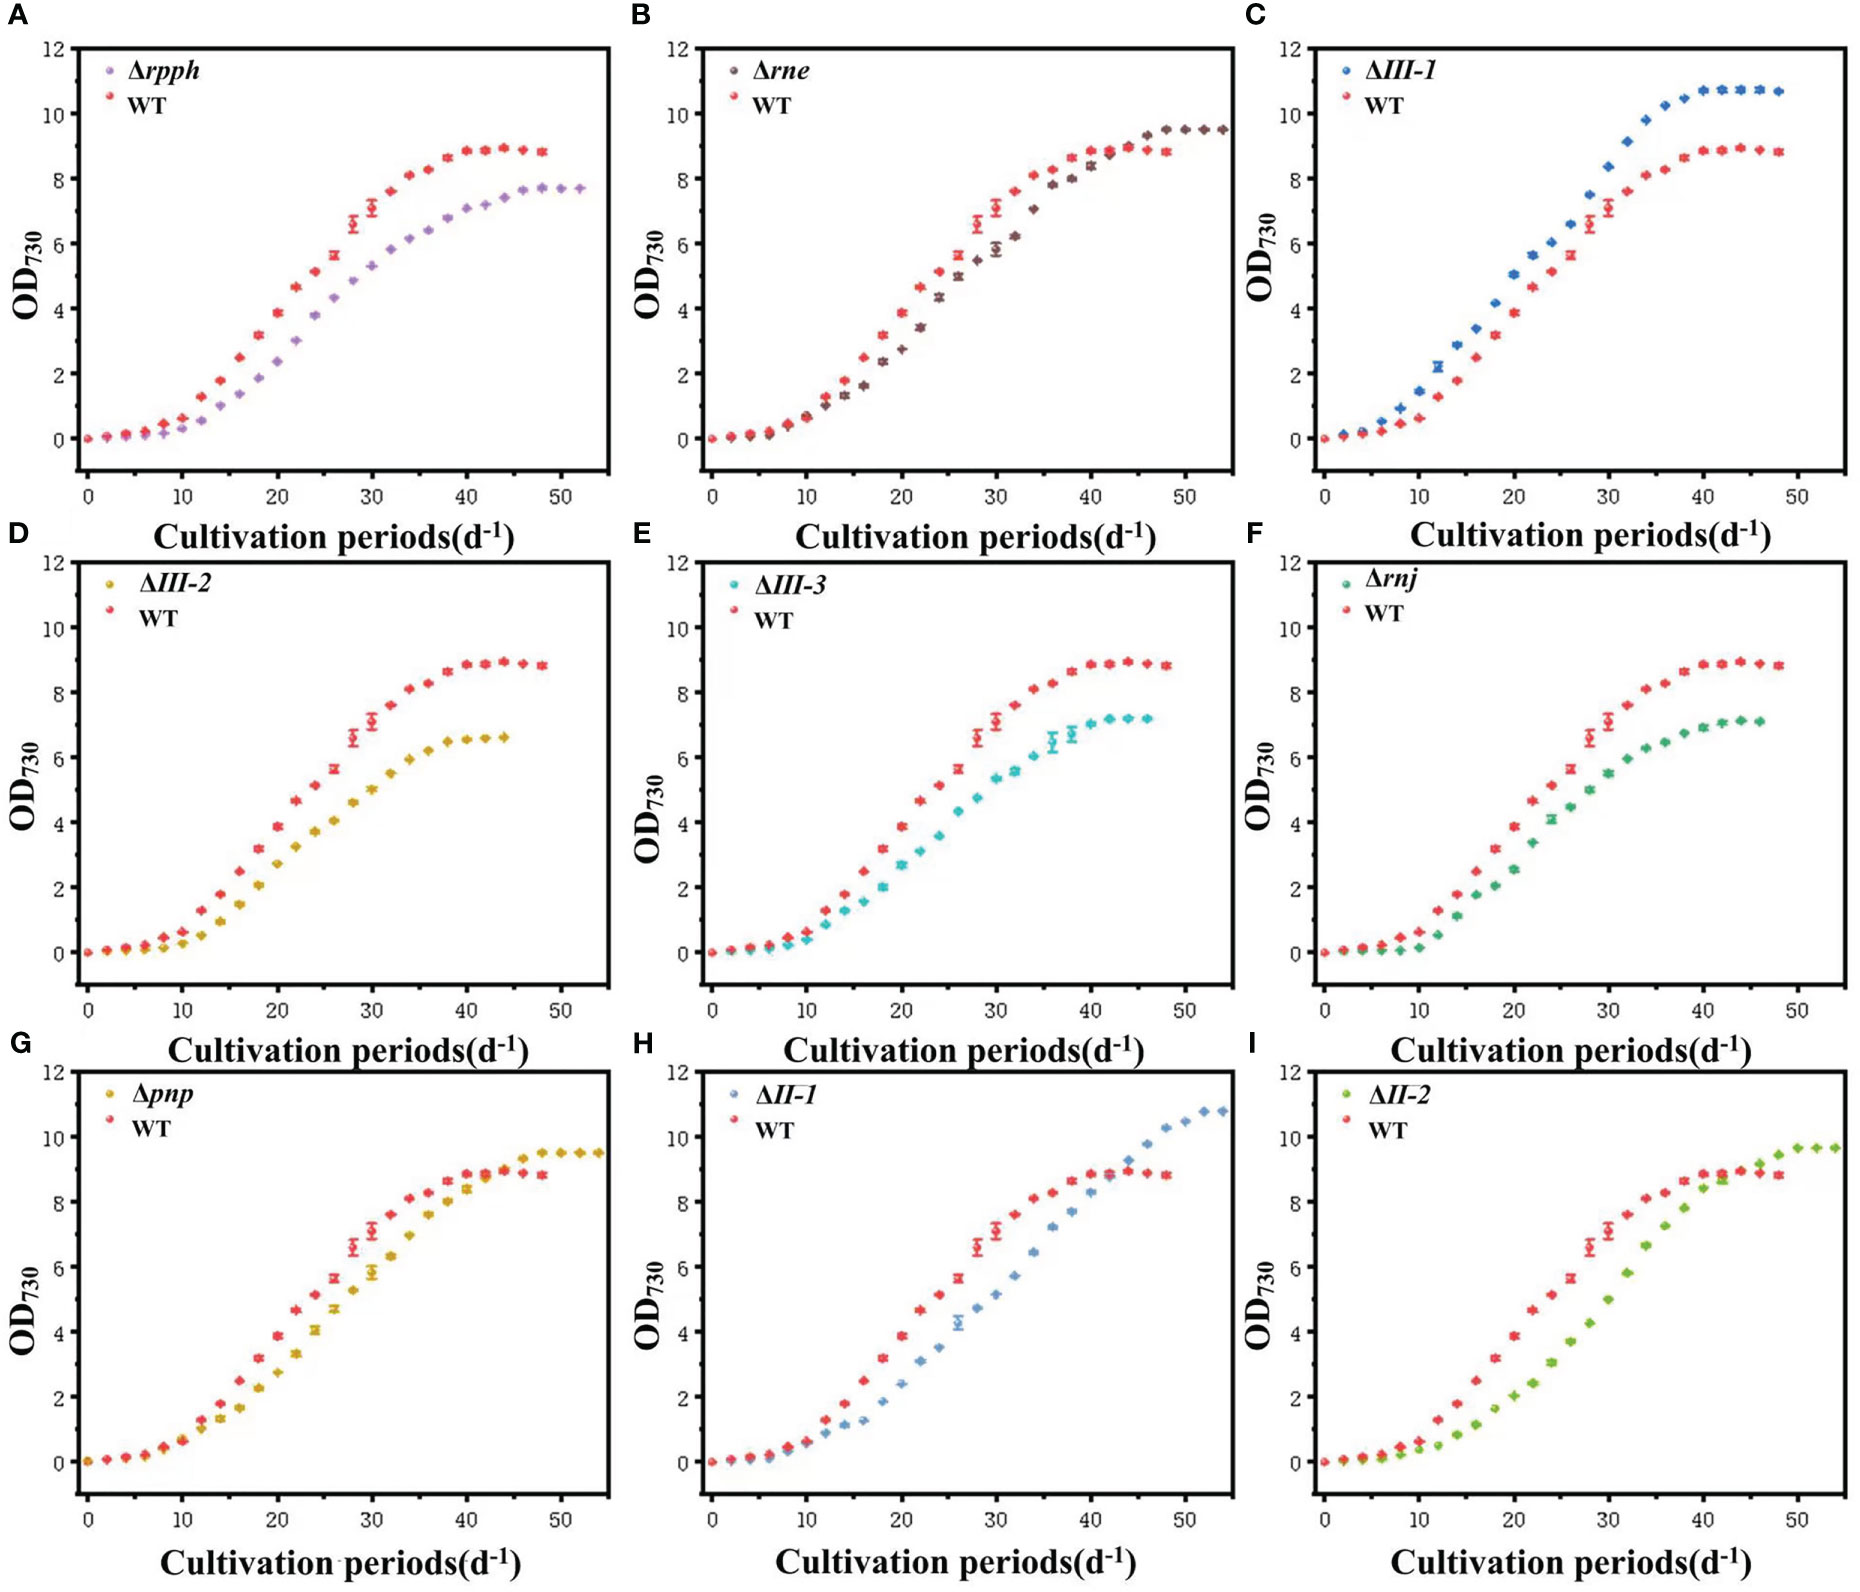
Figure 1 Changes of cell density of SRPS-enzymes mutants in PCC7002 relative to WT. (A) PCC7002Δrpph; (B) PCC7002Δrne; (C) PCC7002ΔIII-1; (D) PCC7002ΔIII-2; (E) PCC7002ΔIII-3; (F) PCC7002Δrnj; (G) PCC7002Δpnp; (H) PCC7002ΔII-1; (I) PCC7002ΔII-2.
As shown in Figure 1, mutants of the endonuclease RNaseE and the exonucleases RNaseII and PNPase showed similar growth trends, with no significant difference in growth rates during the lag phase compared to WT, except for a significantly shortened delay period in PCC7002ΔII-2. After entering the exponential phase, the growth rate of PCC7002ΔII-1 was relatively stable and close to that of WT, while the growth curve of PCC7002ΔII-2 showed a dramatic increase in the middle of the exponential phase, with a growth rate significantly higher than that of WT, followed by a slowdown in the late stage. It was speculated that the inactivation of RNaseII-2 reduces the efficiency of assembly of the protein complex involved in photosynthesis, which slows down or temporarily blocks the transfer rate of products (such as electrons, H+ and ATP) between continuous biochemical reactions. When the accumulation of substrate was sufficient, efficient photosynthesis occurs, thus increasing the growth rate. After the substrate was exhausted, the growth rate slows down. When the substrates were consumed, the growth rate slows down. The duration of the exponential phase of the four mutant strains was extended by about 8 days, and the final OD730 of the three mutant strains except PCC7002ΔII-1 was about 9.52, significantly different from that of WT (Paired test, P< 0.05).
3.2 Chlorophyll fluorescence
3.2.1 Relative electron transfer rate (rETR)
rETR of PSII varied with the change of light intensity during the exponential phase (Figure 2). In the measurement range of 0-600 μmol m-2 s-1, compared with WT, the variation trend of rETR and photosynthetic oxygen evolution rate was basically consistent in PCC7002Δrnj, PCC7002Δrpph, PCC7002ΔII-2, PCC7002ΔIII-2,3, and PCC7002Δpnp. However, in PCC7002ΔIII-1 and PCC7002ΔII-1, this change was completely opposite. At the same time, PSII of algal cells has strong regulatory ability to weak light because when the light intensity was less than or equal to 100 μmol m-2 s-1, most photosynthetic electron gates were in an open state, and rETR increases rapidly with the change of light intensity. However, rETR in PCC7002Δrne and PCC7002Δpnp does not change or decrease under weak light conditions. These data once again prove that inactivating SRPS-enzymes may affect the overall expression of carbon assimilation process-related protein complexes in the photosynthetic system, thereby cutting off the connection between the light reaction and the dark reaction.
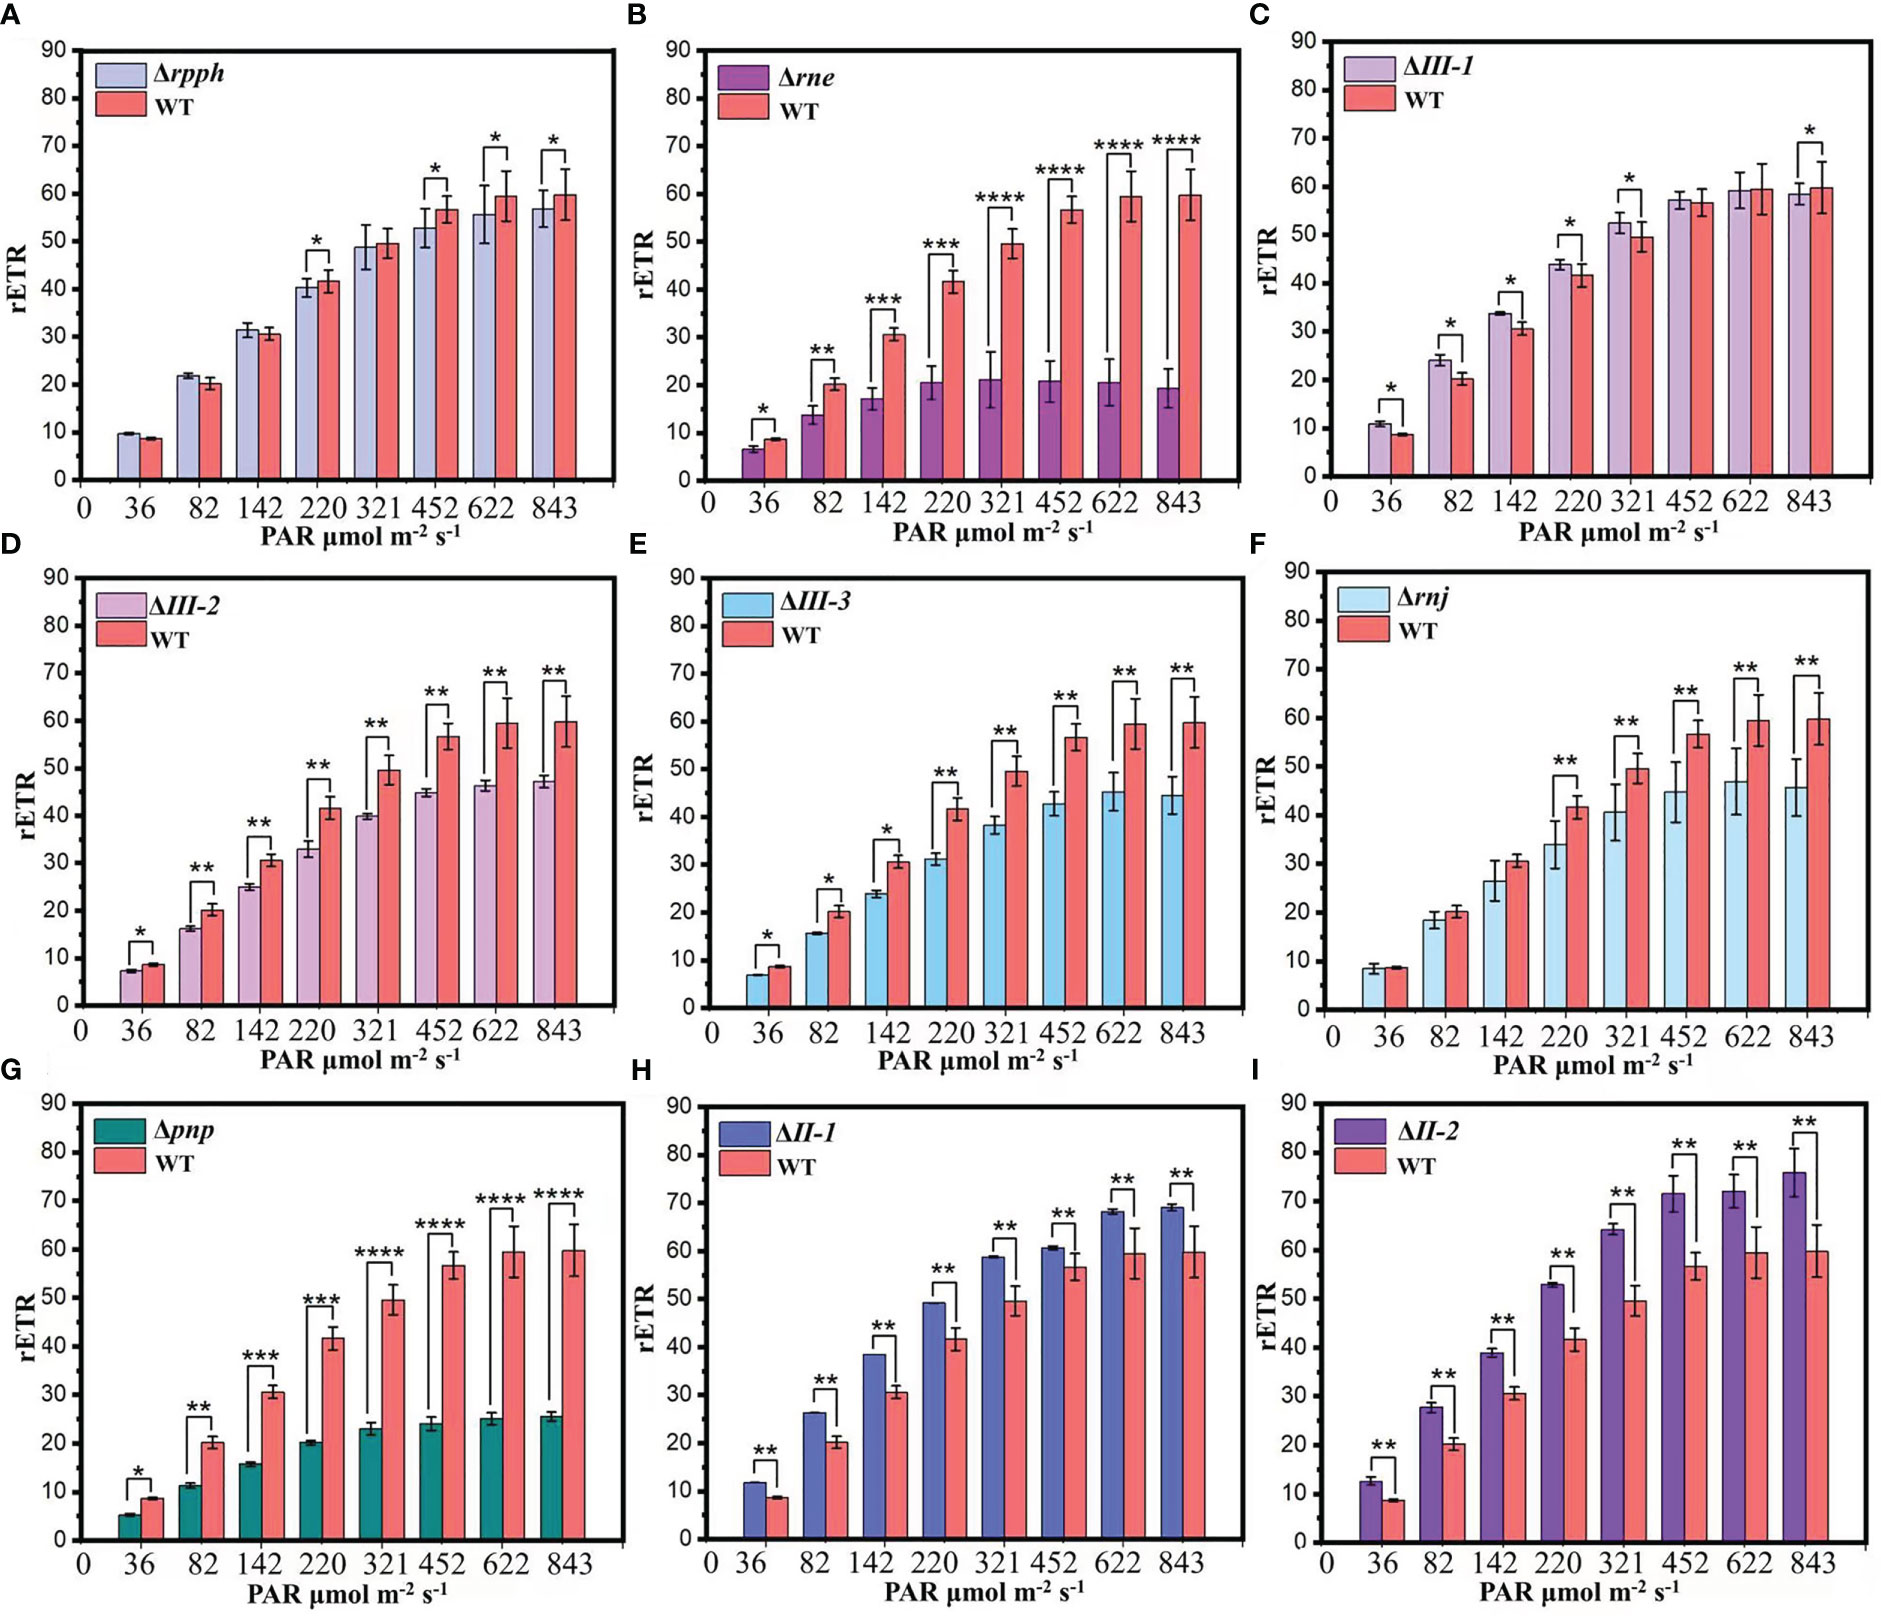
Figure 2 rETR in SRPS-enzymes mutants and WT at the exponential phase. (A) PCC7002Δrpph; (B) PCC7002Δrne; (C) PCC7002ΔIII-1; (D) PCC7002ΔIII-2; (E) PCC7002ΔIII-3; (F) PCC7002Δrnj; (G) PCC7002Δpnp; (H) PCC7002ΔII-1; (I) PCC7002ΔII-2. *, p< 0.05 (two-way ANOVA); **, p< 0.01 (two-way ANOVA); ***, p< 0.001 (two-way ANOVA); ****, p< 0.0001 (two-way ANOVA).
3.2.2 Light saturation point (EK)
EK is an important manifestation of algal cell photosynthetic capacity. Its numerical value reflects the maximum demand for assimilation force of carbon assimilation process-related protein complexes in the photosynthetic system. The stronger the carbon assimilation capacity, the more assimilation force is needed, and the higher the light saturation point is (Yang and Zou, 2005). Meanwhile, a larger EK value corresponds to stronger resistance of algal cells to strong light, indicating broad adaptability to light intensity. The EK value of WT was 208.63 ± 1.36 μmol m-2s-1. Except for PCC7002ΔIII-1 (226.27 ± 2.01 μmol m-2s-1) and PCC7002Δrne (183.22 ± 0.92 μmol m-2s-1) (Figure 3A), the EK values were consistent with the photosynthetic oxygen evolution rate (Figure S3), PCC7002ΔII-2 (219.77 ± 1.13 μmol m-2s-1) > WT > PCC7002Δrpph (180.97 ± 1.13 μmol m-2s-1) > PCC7002ΔII-1 (179.91 ± 0.51 μmol m-2s-1) > PCC7002Δrnj (159.73 ± 1.68 μmol m-2s-1) > PCC7002ΔIII-3 (153.43 ± 1.37 μmol m-2s-1) > PCC7002ΔIII-3 (140.51 ± 2.73μmol m-2s-1) > PCC7002Δpnp (64.67 ± 1.71 μmol m-2s-1).
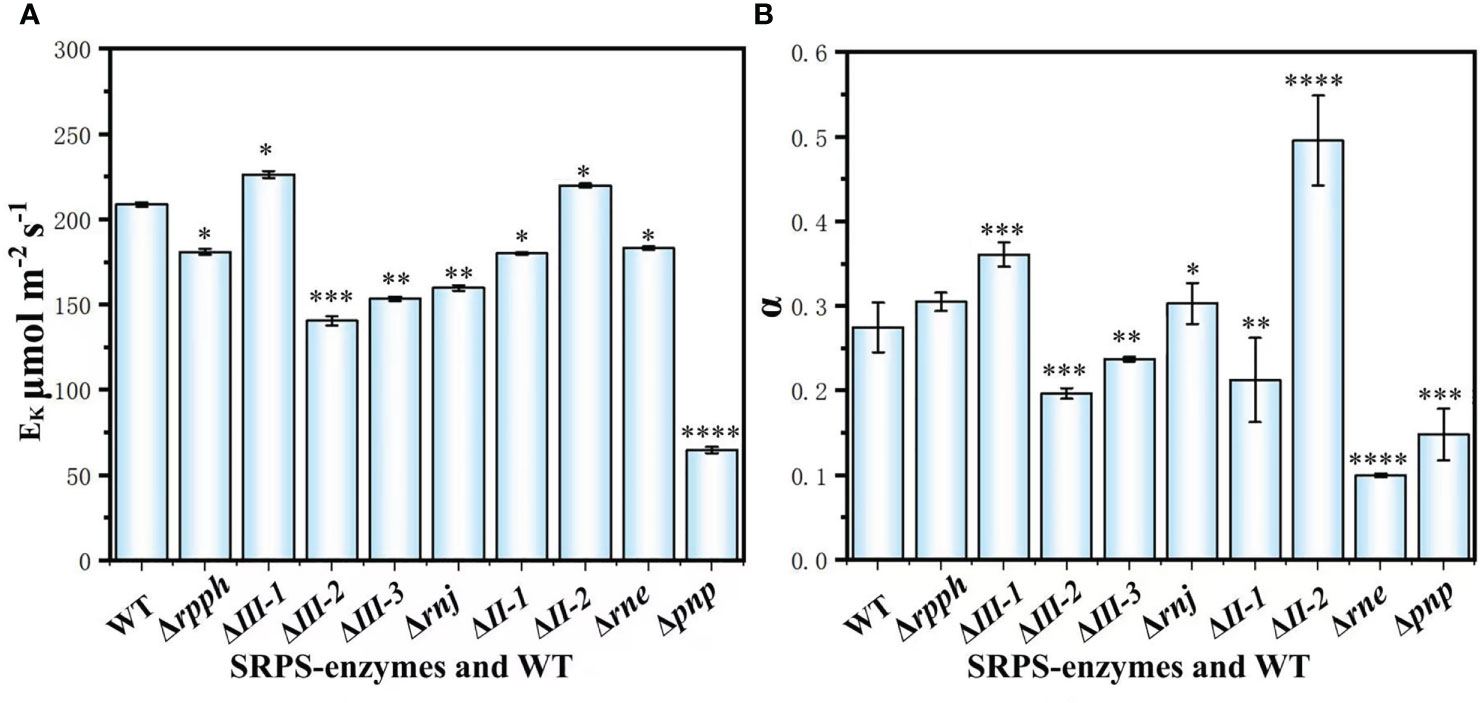
Figure 3 Chlorophyll fluorescence parameters in SRPS-enzymes mutants and WT during the exponential phase. (A) EK; (B) α. *, p< 0.05 (two-way ANOVA); **, p< 0.01 (two-way ANOVA); ***, p< 0.001 (two-way ANOVA); ****, p< 0.0001 (two-way ANOVA).
3.2.3 Efficiency of electron transport (α)
The α represents the rate at which algae cells transfer electrons down the electron transport chain under actual light intensity, and its numerical value reflects the light tolerance and adaptability of algal cells (Figure 3B) (YE and Zhao, 2009). Therefore, the efficiency of photosynthetic electron transfer was consistent with the efficiency of photosynthesis of algal cells. The α of PCC7002ΔII-2 and PCC7002ΔIII-1 was significantly improved compared to WT (Figures 2, 3, S4).PCC7002Δrpph (0.0999 ± 0.0022) and PCC7002Δrne (0.1479 ± 0.0305) were significantly lower than WT (Paired test, P.< 0.05), which was consistent with rETR and photosynthetic oxygen evolution rate (Figure S4).
3.2.4 Maximum photochemical efficiency of photosystem II (Fv/FM)
FV/FM, reflecting the photosynthetic yield of PS II. By analyzing the FV/FM of different SRPS-enzymes mutant strains in three different periods (Figure 4), it can be found that the inactivation of the exonuclease RNaseII-1 has the greatest impact on FV/FM in algal cells, especially during the exponential phase, which should increase the values of PCC7002ΔII-1 in terms of photosynthetic oxygen evolution rate, α, and even growth rate. However, all results were contrary to expectations (Figures 2, S1, S4).
Figure 4 Changes in FV/FM in all algal solutions during the lag, exponential and decline phase. All mutants show a significant difference in FV/FV compared to WT: ****, p< 0.0001 (two-way ANOVA).
3.3 Carbon and nitrogen content
3.3.1 Carbon content
Knockout of the endonuclease RNase III-1 and the exonuclease RNase II-1 significantly increased POC (Figure 5A). Compared to WT (6.04 × 10⁴ ± 286 μmol L-1), PCC7002ΔIII-1 and PCC7002ΔII-1 exhibited POC degradation of 8.83 × 10⁴ ± 686 μmol L-1 and 7.08 × 10⁴ ± 294 μmol L-1, respectively, representing a 46% and 17% increase. Among the other five mutants excluding PCC7002Δrne, POC showed varying degrees of reduction compared to WT, particularly PCC7002ΔIII-2, which decreased by 17% to 5.03 × 10⁴ ± 1254 μmol L-1. These results are consistent with the μmax values shown in Supplementary Figure 1. In PCC7002Δrne, there is no correlation observed between POC and several common chlorophyll fluorescence parameters. This provides further validation for the hypothesis regarding the regulation of photosynthetic protein complex expression by the SRPS-enzymes.
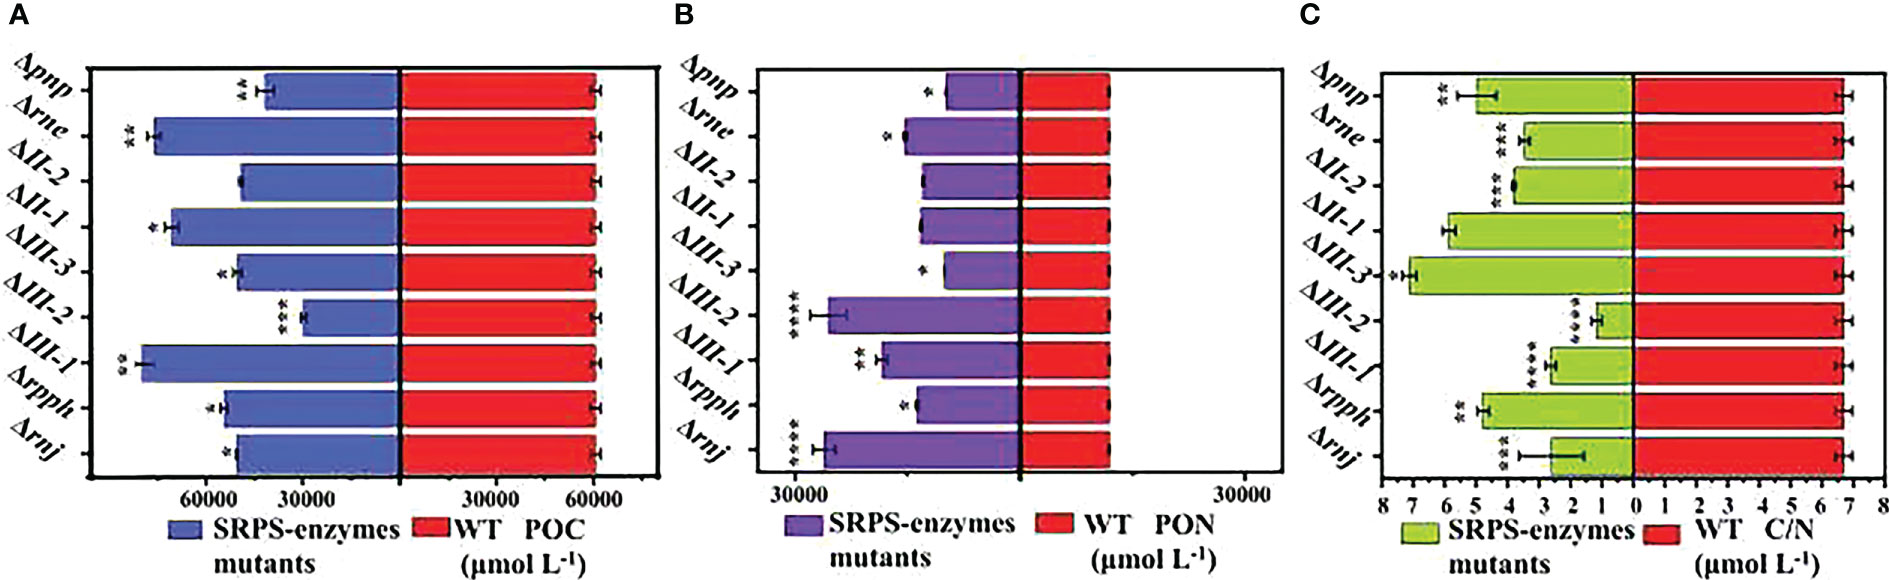
Figure 5 (A) Changes in POC in SRPS-enzymes mutants and WT during the exponential phase. (B) Changes in PON in SRPS-enzymes mutants and WT during the exponential phase; (C) Changes in C/N in SRPS-enzymes mutants and WT during the exponential phase. *, p< 0.05 (two-way ANOVA); **, p< 0.01 (two-way ANOVA); ***, p< 0.001 (two-way ANOVA); ****, p< 0.0001 (two-way ANOVA).
3.3.2 Nitrogen content
Nitrogen is an important macroelement for the growth and primary production of marine phytoplankton. Limitation or deficiency of nitrogen can affect the growth and intracellular physiological metabolism of phytoplankton (Ying and Weiwei, 2020). Regarding PON (Figures 5B, C), the majority of enzyme knockouts have a promoting effect on PON compared to WT, although the magnitude of the changes is not significant. For example, the most significant increase in PON degradation is observed in PCC7002Δrnj (2.61 × 10⁴ ± 1486 μmol L-1), which is only a 21% increase compared to WT (1.18 × 10⁴ ± 49 μmol L-1). Conversely, the most pronounced inhibition is seen in PCC7002ΔIII-3 (0.98 × 10⁴ ± 79 μmol L-1), resulting in a 17% decrease. In cyanobacterial cells, nitrogen assimilation metabolism is connected to photosynthetic carbon metabolism through 2-oxoglutarate (2-OG), which serves as a central node in the TCA cycle (Muro-Pastor et al., 2005). Therefore, the differential changes in POC and PON suggest the involvement of the SRPS-enzymes in the internal regulatory mechanisms.
3.4 Quantitative real-time PCR
Using RnpA as the reference gene (Szekeres et al., 2014), the ΔΔCt method was used to calculate the relative expression level of the target gene: relative expression level of the target gene = 2-ΔΔCt (Livak and Schmittgen, 2001), where ΔΔCt = ΔCtGene - ΔCtControl, and ΔCtGene = Ct value of the target gene - Ct value of the internal reference gene in the same sample, ΔCtControl = Ct value of the target gene in the control group - Ct value of the internal reference gene.
From the comprehensive analysis of Figure 6, it can be found that mutations in all SRPS-enzymes regulate the expression of subunits of the key protein complex involved in photosynthetic carbon fixation. (1) It was known that ndhD1 was responsible for coding the crucial subunit of the last protein complex (COX) in the respiratory chain, and its expression was decreased in all SRPS-enzymes mutant strains, which was consistent with the results of varying degrees of μmax increase in most strains. (2) The inactivation of SRPS-enzymes promotes the expression of the subunit encoding gene petA in the Cytochrome b6-f complex, which differs from the changes in rETR and α. (3) In the expression of the remaining subunits, the vast majority showed a decrease, and only the expression levels of psaB and psaC in PCC7002ΔIII-1, PCC7002ΔII-1, PCC7002ΔII-2, PCC7002Δrne and PCC7002Δpnp, atpA in PCC7002ΔIII-1, PCC7002ΔII-2, PCC7002Δrne, and PCC7002ΔIII-3, PCC7002ΔII-2 were significantly higher than in WT (paired test, P< 0.05).
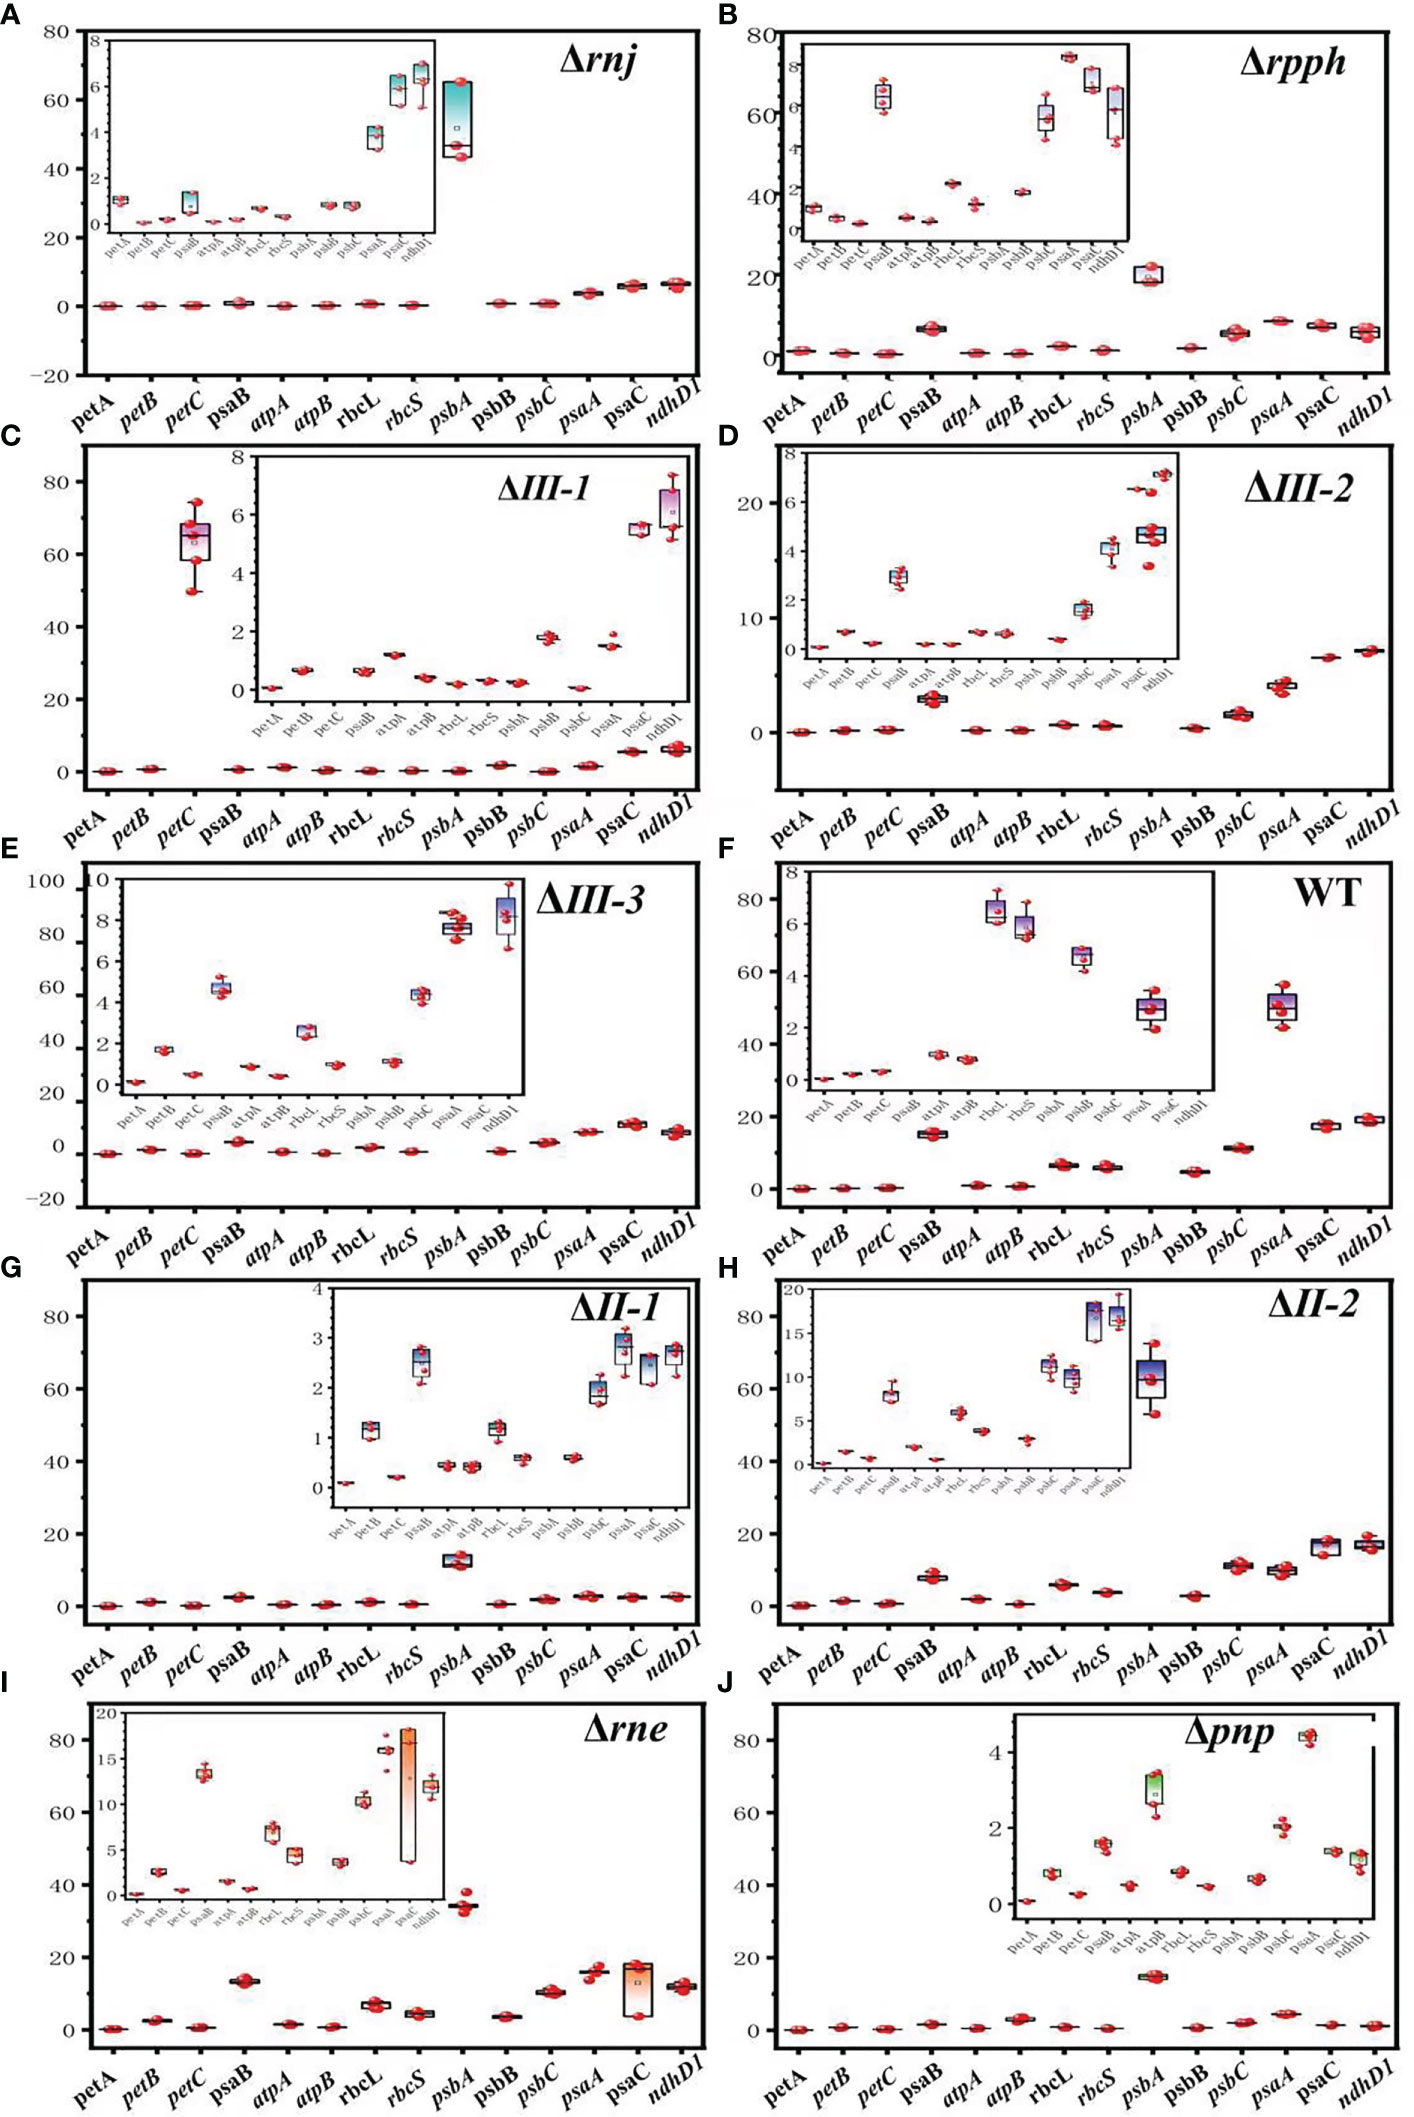
Figure 6 Expression of key protein complex subunits in SRPS-enzymes mutants and wild strain at the exponential phase. (A) PCC7002Δrnj; (B) PCC7002Δrpph; (C) PCC7002ΔIII-1; (D) PCC7002ΔIII-2; (E) PCC7002ΔIII-3; (F) WT; (G) PCC7002ΔII-1; (H) PCC7002ΔII-2; (I) PCC7002Δrne; (J) PCC7002Δpnp.
4 Discussion
The SRPS mechanism is an important post-transcriptional regulatory mechanism in prokaryotes, and the SRPS-enzymes that play a major role mainly participates in regulating the expression of protein complexes or catalyzing consecutive biochemical reactions. Through a series of experiments, this study proves that the SRPS-enzymes in PCC7002 had a significant impact on the efficiency of photosynthetic carbon fixation and the expression of subunits of key photosynthetic protein complexes. However, there was no unified rule found from the comprehensive analysis of all parameter, and some experimental results were inconsistent with existing research conclusions. Based on this, we speculate on the regulation mechanism of SRPS-enzymes, which also lays the foundation for the precise analysis of SRPS molecular mechanisms in PCC7002.
The inactivation of SRPS-enzymes mainly affects the growth rate or changes the growth phase, and most of the nine mutant strains (except PCC7002ΔII-1) exhibit decrease in μmax, while only PCC7002ΔII-2 and PCC7002ΔIII-1 exhibit increase (Figure S1). Inactivting endonuclease genes mostly reduces the content of photosynthetic pigments (Figures S2, S3), mainly by shortening the growth phase, while the mutations of exonuclease genes mainly promote the content of photosynthetic pigments, prolonging their growth phase. Regarding changes in Ek, inactivating SRPS-enzymes mainly exhibits inhibitory effects, which were consistent with the changes in photosynthetic oxygen evolution rate and rETR after inactivating SRPS-enzymes under strong light conditions (PAR ≥ 100 μmol m-2 s-1).
Knockout of the endonuclease RNase III-1 and the exonuclease RNase II-1 significantly increased POC (Figure 5). Compared to WT (6.04 × 10⁴ ± 286 μmol L-1), PCC7002ΔIII-1 and PCC7002ΔII-1 exhibited POC degradation of 8.83 × 10⁴ ± 686 μmol L-1 and 7.08 × 10⁴ ± 294 μmol L-1, respectively, representing a 46% and 17% increase. Among the other five mutants excluding PCC7002Δrne, POC showed varying degrees of reduction compared to WT, particularly PCC7002ΔIII-2, which decreased by 17% to 5.03 × 10⁴ ± 1254 μmol L-1. These results are consistent with the μmax values shown in Supplementary Figure 1. In PCC7002Δrne, there is no correlation observed between POC and several common chlorophyll fluorescence parameters. This provides further validation for the hypothesis regarding the regulation of photosynthetic protein complex expression by the SRPS-enzymes.
Regarding PON (Figures 5B, C), the majority of enzyme knockouts have a promoting effect on PON compared to WT, although the magnitude of the changes is not significant. For example, the most significant increase in PON degradation is observed in PCC7002Δrnj (2.61 × 10⁴ ± 1486 μmol L-1), which is only a 21% increase compared to WT (1.18 × 10⁴ ± 49 μmol L-1). Conversely, the most pronounced inhibition is seen in PCC7002ΔIII-3 (0.98 × 10⁴ ± 79 μmol L-1), resulting in a 17% decrease. In cyanobacterial cells, nitrogen assimilation metabolism is connected to photosynthetic carbon metabolism through 2-oxoglutarate (2-OG), which serves as a central node in the TCA cycle (Muro-Pastor et al., 2005). Therefore, the differential changes in POC and PON suggest the involvement of the SRPS-enzymes in the internal regulatory mechanisms.
Mutations in the exonucleases (RNaseII and PNPase) led to a significant increase in SR value, while the effect of mutations in endonucleases on SR value is not consistent (Figure S5). Specifically, the knockdown of RNaseE led to an increase in SR value, while the SR values of PCC7002ΔIII-1, PCC7002ΔIII-2, and PCC7002ΔIII-3 all showed a decrease. Inactivation of all exonucleases, including RNaseJ, significantly increased the biological activity of SOM, while the three homologues of the endonuclease RNaseIII showed a consistent trend of significantly decreasing SOM biological activity, opposite to the effect of PCC7002Δpnp. A higher HIX value indicates a higher degree of FDOM humification. BIX is generally used to indicate biological activity, FDOM sources, etc (Huguet et al., 2009). and can characterize the relative content of humic-like and protein-like components in FDOM. A higher BIX value means a higher relative content of humic-like components and higher biological activity of DOM (Zhang et al., 2022). HIX of PCC7002ΔIII-2 was consistently higher than that of other algal strains (Figure S6), possibly because the inactivation of RNaseIII-2 caused the onset of the decline phase to come earlier, and more SOM was released. In contrast, PCC7002ΔIII-1, which had the highest μmax, has always been in a vigorous growth state, so the humification degree of SOM has always been at its lowest. PCC7002Δrne, which had a significantly increased μmax, had a significantly higher BIX value than WT, consistent with SR (Figures S1, S5, S7), indicating that the growth rate can have a significant impact on the biological activity of SOM.
Inactivating SRPS-enzymes results in an increase in the expression level of most subunits of the Cytochrome b6-f complex, while the expression levels of most subunits of PSI, PSII, RuBisCO, and NDH decrease. Only the mutation of RNaseE did not change the expression levels of psaA, B, psbB, C, atpB, and rbcL. Additionally, inactivating SRPS-enzymes mainly had a promoting effect on FV/FM, which was inconsistent with changes in chlorophyll fluorescence, growth rate, and gene expression levels. We speculate that (1) the splite sites of SRPS-enzymes are mainly located in several expressed genes of the Cytochrome b6-f complex, such as petA, petB, and petC. Similarly, RNaseIII-1, RNaseE, and RNaseII-2 also had splite sites in atpA, while RNaseIII-2 and RNaseII-2 had splite sites in psbA. In several subunits of PSI and PSII transcription, there are higher minimal folding free energy (MFE) near the splite sites of SRPS-enzymes, which was more conducive to SRPS-enzymes recognition and cleavage. (2) There are stable stem-loops near the splite sites of rppH in petC and psbA, near the splite site of RNaseII-2 in psbC and psaC, near the splite sites of RNaseE in psaB, C, psbB, C, rbcL, and atpB transcripts.
5 Conclusion
SRPS-enzymes in PCC7002 had a significant impact on the efficiency of photosynthesis and the expression of subunits of key photosynthetic protein complexes. The inactivation of SRPS-enzymes mainly affects the growth rate or changes the growth phase. In Ek, photosynthetic oxygen evolution rate and rETR, inactivating SRPS-enzymes mainly exhibits inhibitory effects (PAR ≥ 100 μmol m-2 s-1). Additionally, inactivating SRPS-enzymes mainly had a promoting effect on FV/FM. The expression levels of ndhD1 decreased in all mutant strains. The knockout of SRPS-enzymes had a promoting effect on the expression of the subunit encoding gene petA in the cytochrome b6-f complex. For the expression of the remaining protein subunits, the majority decreased, with only psaB and psaC in PCC7002ΔIII-1, PCC7002ΔII-1, PCC7002ΔII-2, PCC7002Δrne, and PCC7002Δpnp, and the expression of atpA in PCC7002ΔIII-1, PCC7002ΔII-2, and PCC7002Δrne significantly higher than WT (Paired test, p< 0.05).
Author contributions
JC and DL performed the experiments, analyzed the data, and wrote the manuscript. YW and SW contributed to the investigation and data curation. RH designed the experiments and analyzed the data. All authors contributed to the article and approved the submitted version.
Funding
This work was supported by the National Natural Science Foundation of China [grant numbers 32170065, 31970113], the Key Research and Development Program of Shandong Province (2020ZLYS04).
Acknowledgments
The authors thank Yunhong Zhang, Xin Guo, Wei Zhao, Yue Meng, and Yueyue Li from Shandong University for sampling assistance and equipment assistance.
Conflict of interest
The authors declare that the research was conducted in the absence of any commercial or financial relationships that could be construed as a potential conflict of interest.
Publisher’s note
All claims expressed in this article are solely those of the authors and do not necessarily represent those of their affiliated organizations, or those of the publisher, the editors and the reviewers. Any product that may be evaluated in this article, or claim that may be made by its manufacturer, is not guaranteed or endorsed by the publisher.
Supplementary material
The Supplementary Material for this article can be found online at: https://www.frontiersin.org/articles/10.3389/fmars.2023.1223060/full#supplementary-material
References
Barber J., Nield J., Morris E., Zheleva D., Hankamer B. (1997). The structure, function and dynamics of photosystem two. Physiologia Plantarum 100 (4), 817–827. doi: 10.1111/j.1399-3054.1997.tb00008.x
Blough N. V. (2002). Chromophoric DOM in the coastal environment. Biogeochem. Mar. Dissolved Organic Matter 509–546. doi: 10.1016/B978-012323841-2/50012-9
Bricaud A., Morel A., Prieur L. (1981). Absorption by dissolved organic matter of the sea (yellow substance) in the UV and visible domains. Limnol. Oceanogr. 26 (1), 43–53. doi: 10.4319/lo.1981.26.1.0043
Buchanan B. B., Gruissem W., Jones R. L. (2015). Biochemistry and molecular biology of plants (Hoboken: John Wiley & Sons Inc.).
Carr N. G., Whitton B. A. (1982). Cyanobacteria: Current perspectives. The Biology of Cyanobacteria 19, 1–8.
Demmig-Adams B., Adams W. I. (1994). Capacity for energy dissipation in the pigment bed in leaves with different xanthophyll cycle pools. Funct. Plant Biol. 21 (5), 575–588. doi: 10.1071/PP9940575
Ducat D. C., Way J. C., Silver P. A. (2011). Engineering cyanobacteria to generate high-value products. Trends Biotechnol. 29 (2), 95–103. doi: 10.1016/j.tibtech.2010.12.003
Durall C., Lindblad P. (2015). Mechanisms of carbon fixation and engineering for increased carbon fixation in cyanobacteria. Algal. Res. 11, 263–270. doi: 10.1016/j.algal.2015.07.002
Falkowski P. (2012). Ocean science: the power of plankton. Nature 483 (7387), S17–S20. doi: 10.1038/483S17a
Geider R. J., La Roche J. (2002). Redfield revisited: variability of c [ratio] n [ratio] p in marine microalgae and its biochemical basis. Eur. J. Phycol. 37 (1), 1–17. doi: 10.1017/S0967026201003456
Genty B., Briantais J.-M., Baker N. R. (1989). The relationship between the quantum yield of photosynthetic electron transport and quenching of chlorophyll fluorescence. Biochim. Biophys. Acta (BBA)-General Subj. 990 (1), 87–92. doi: 10.1016/S0304-4165(89)80016-9
Häder D.-P., Kumar H., Smith R., Worrest R. (2007). Effects of solar UV radiation on aquatic ecosystems and interactions with climate change. Photochem. Photobiol. Sci. 6 (3), 267–285. doi: 10.1039/b700020k
Hoover R. B., St. Amand A., Levin G. V., Hoover R. B., Jerman G. A., Rozanov A. Y., et al. (2005). Morphology and elemental composition of recent and fossil cyanobacteria. Astrobiology and Planetary Missions 590603, 1–10. doi: 10.1117/12.624854
Huguet A., Vacher L., Relexans S., Saubusse S., Froidefond J.-M., Parlanti E. (2009). Properties of fluorescent dissolved organic matter in the gironde estuary. Organic Geochem. 40 (6), 706–719. doi: 10.1016/j.orggeochem.2009.03.002
Ibrahim F. G., Torre R. M., Moya B. L., de Godos Crespo I. (2020). “Carbon dioxide capture from carbon dioxide–rich gases by microalgae,” in From biofiltration to promising options in gaseous fluxes biotreatment (Elsevier), 373–396. doi: 10.1016/B978-0-12-819064-7.00018-2
Jiao N., Robinson C., Azam F., Thomas H., Baltar F., Dang H., et al. (2014). Mechanisms of microbial carbon sequestration in the ocean–future research directions. Biogeosciences 11 (19), 5285–5306. doi: 10.5194/bg-11-5285-2014
Koonin E. V. (2009). Evolution of genome architecture. Int. J. Biochem. Cell Biol. 41 (2), 298–306. doi: 10.1016/j.biocel.2008.09.015
Le Quéré C., Andrew R. M., Friedlingstein P., Sitch S., Pongratz J., Manning A. C., et al. (2018). Global carbon budget 2017. Earth System Sci. Data 10 (1), 405–448. doi: 10.5194/essd-10-405-2018
Li J., Gong P. H., Guan C. T. (2022). Research progress on fishery carbon sinking associated with marine ranching. Prog. Fishery Sci. 43 (05), 142–150. doi: 10.19663/j.issn2095-9869.20220118002. L.M.D.
Livak K. J., Schmittgen T. D. (2001). Analysis of relative gene expression data using real-time quantitative PCR and the 2(-delta delta C(T)) method. Methods 25 (4), 402–408. doi: 10.1006/meth.2001.1262
Martínez-Pérez A. M., Nieto-Cid M., Osterholz H., Catalá T. S., Reche I., Dittmar T., et al. (2017). Linking optical and molecular signatures of dissolved organic matter in the Mediterranean Sea. Sci. Rep. 7 (1), 3436. doi: 10.1038/s41598-017-03735-4
Mou S., Li G., Li H., Li F., Shao Z., Li J., et al. (2018). Differential physiological responses of the coastal cyanobacterium synechococcus sp. PCC7002 to elevated p CO 2 at lag, exponential, and stationary growth phases. Sci. China Earth Sci. 61, 1397–1405. doi: 10.1007/s11430-017-9206-5
Muro-Pastor M. I., Reyes J. C., Florencio F. J. (2005). Ammonium assimilation in cyanobacteria. Photosynthesis Res. 83, 135–150. doi: 10.1007/s11120-004-2082-7
Murphy K. R., Stedmon C. A., Graeber D., Bro R. (2013). Fluorescence spectroscopy and multi-way techniques. PARAFAC. Anal. Methods 5 (23), 6557–6566. doi: 10.1039/c3ay41160e
Ohno T. (2002). Fluorescence inner-filtering correction for determining the humification index of dissolved organic matter. Environ. Sci. Technol. 36 (4), 742–746. doi: 10.1021/es0155276
Parsons T. R., Maita Y., Lalli C. M. (1984). A manual of chemical and biological methods for seawater analysis. Oxford: Pergamon Press (1984). 173 p.
Perez A. A., Liu Z., Rodionov D. A., Li Z., Bryant D. A. (2016). Complementation of cobalamin auxotrophy in synechococcus sp. strain PCC 7002 and validation of a putative cobalamin riboswitch In vivo. J. Bacteriol. 198 (19), 2743–2752. doi: 10.1128/JB.00475-16
Rochat T., Bouloc P., Repoila F. (2013). Gene expression control by selective RNA processing and stabilization in bacteria. FEMS Microbiol. Lett. 344 (2), 104–113. doi: 10.1111/1574-6968.12162
Sevens S. E., Porter R. (1980). Transformation in agmenellum quadruplicatum. Proc. Natl. Acad. Sci. USA 77 (1), 6052–6056. doi: 10.1073/pnas.77.10.6052
Swallow M. (1963). The Sea: ideas and observations on progress in the study of the seas. Interscience Publishers 90 (14), 554.
Szekeres E., Sicora C., Dragos N., Druga B. (2014). Selection of proper reference genes for the cyanobacterium synechococcus PCC 7002 using real-time quantitative PCR. FEMS Microbiol. Lett. 359 (1), 102–109. doi: 10.1111/1574-6968.12574
Voigt K., Sharma C. M., Mitschke J., Joke Lambrecht S., Voss B., Hess W. R., et al. (2014). Comparative transcriptomics of two environmentally relevant cyanobacteria reveals unexpected transcriptome diversity. ISME J. 8 (10), 2056–2068. doi: 10.1038/ismej.2014.57
Webb W. L., Newton M., Starr D. (1974). Carbon dioxide exchange of alnus rubra: a mathematical model. Oecologia 17, 281–291. doi: 1007.00345747/bf28308943
Wollman F.-A., Minai L., Nechushtai R. (1999). The biogenesis and assembly of photosynthetic proteins in thylakoid membranes. Biochim. Biophys. Acta (BBA)-Bioenergetics 1411 (1), 21–85. doi: 10.1016/S0005-2728(99)00043-2
Yang X.-H., Zou Q. (2005). Photosynthetic characteristics and chlorophyll fluorescence in level of cotton plants grown in full light and 40% dunlight. Acta Phytoecologica Sin. 29 (1), 8–15. doi: 10.17521/cjpe.2005.0002
YE Z.-p., Zhao Z.-h. (2009). Effects of shading on the photosynthesis and chlorophyll content of bidens pilosa. Chin. J. Ecol. 28 (01), 19.
Ying L., Weiwei J. (2020). Effects of nitrogen limitation time on growth, total lipid content, and fatty acid composition of halochlorococcum sarcotum and nannochloris oculata. Mar. Sci. 44 (2), 45–55. doi: 10.3389/fmars.2019.00095
Keywords: Synechococcus sp. PCC 7002, selective RNA processing and stabilization (SRPS), photosynthetic carbon fixation, dissolved organic matter derived from Synechococcus (SOM), splice site
Citation: Chen J, Liu D, Wang Y, Wang S and Huang R (2023) Effects of selective RNA processing and stabilization enzymes on carbon sequestration by photosynthesis of Synechococcus sp. PCC7002. Front. Mar. Sci. 10:1223060. doi: 10.3389/fmars.2023.1223060
Received: 16 May 2023; Accepted: 14 June 2023;
Published: 03 July 2023.
Edited by:
Junfu Dong, College of Life Sciences, Shandong University, ChinaReviewed by:
Jianhua Fan, East China University of Science and Technology, ChinaYi Xin, Hainan University, China
Copyright © 2023 Chen, Liu, Wang, Wang and Huang. This is an open-access article distributed under the terms of the Creative Commons Attribution License (CC BY). The use, distribution or reproduction in other forums is permitted, provided the original author(s) and the copyright owner(s) are credited and that the original publication in this journal is cited, in accordance with accepted academic practice. No use, distribution or reproduction is permitted which does not comply with these terms.
*Correspondence: Ranran Huang, aHVhbmdyckBzZHUuZWR1LmNu