 Maja Billman
 Isaac R. Santos1,2†
 Marlene Jahnke
94% of researchers rate our articles as excellent or good
Learn more about the work of our research integrity team to safeguard the quality of each article we publish.
Find out more
ORIGINAL RESEARCH article
Front. Mar. Sci., 16 August 2023
Sec. Marine Biogeochemistry
Volume 10 - 2023 | https://doi.org/10.3389/fmars.2023.1219708
Seagrass meadows act as an effective carbon sink and store carbon in the sediments for substantial periods of time. The drivers of carbon sequestration are complex, and global and regional estimates of carbon stocks have large uncertainties. Here, we report new carbon stock estimates from 14 sites along the Swedish coast and compile existing literature to estimate the magnitude of carbon stocks of Zostera marina (eelgrass) meadows in the Baltic Sea. Eelgrass meadows in the Baltic Sea have considerably lower carbon content and lower stocks (0.25 ± 0.21% DW, 635 ± 321 g C m-2) than in the Kattegat-Skagerrak region (3.25 ± 2.78% DW, 3457 ± 3382 g C m-2) and the average for temperate regions in general (1.4 ± 0.4% DW, 2721 ± 989 g C m-2). Unfavorable growing conditions for eelgrass in the Baltic Sea often lead to meadows occurring in areas of high hydrodynamics, preventing significant carbon accumulation. Stable isotopes revealed that the dominating source of organic carbon in the meadows was planktonic, further highlighting that Baltic Sea eelgrass meadows are not major carbon reservoirs in comparison to unvegetated sediments and other seagrass areas. The results also highlight that environmental conditions drive intraspecific variation of carbon sequestration on large spatial scales. Overall, the carbon stocks and sequestration potential in eelgrass meadows of the Baltic Sea are small compared to other temperate regions.
Atmospheric carbon dioxide (CO2) is on a steady increase, and natural carbon sinks have been getting attention as a means of mitigating the increasing levels of CO2 (Jacquemont et al., 2022). Global budgets describing the pathways, sinks and sources of carbon are important tools for future research and conservation efforts, but are difficult to obtain and remain with large uncertainties (Friedlingstein et al., 2022). The global oceans act as a natural sink of CO2, and have sequestered about 26% of anthropogenic emissions since the 1850’s (Friedlingstein et al., 2022). CO2 enters the ocean via physical, chemical, and biological pathways where it is stored in biomass and sediments, or remineralized to re-enter the atmosphere. The term Blue Carbon refers to the carbon sequestered in the ocean and is usually associated with vegetated coastal ecosystems (Santos et al., 2022).
Vegetated coastal ecosystems, i.e., seagrass meadows, mangroves, and saltmarshes, provide a range of ecosystem services such as increased biodiversity and productivity, water purification, protection of the coastline, mitigation of sea level rise, and sustaining livelihood and economies through fisheries and tourism (Nellemann et al., 2009; Barbier et al., 2011). They are also efficient in carbon capture and long-term storage. Blue carbon ecosystems account for about half of the carbon buried in the ocean although they cover less than 0.2% of the ocean floor (Duarte et al., 2005; Nellemann et al., 2009). Despite their importance, about a third of the global areas of vegetated coastal ecosystems have been lost at accelerating rates (Macreadie et al., 2019).
Seagrasses are estimated to account for ~20% of the organic carbon burial in marine sediments (Duarte et al., 2013). With the main carbon stock residing in the sediments trapped below seagrass rather than the seagrass itself, the effect of sediment properties on the carbon storage potential have been studied to identify correlations that can be used to upscale estimates of carbon stocks (Dahl et al., 2016; Serrano et al., 2016). The efficiency of seagrass ecosystems to bury carbon has however proven highly variable and complex. A range of drivers besides sediment properties such as species composition (Lavery et al., 2013), bioregion (Mazarrasa et al., 2021) and hydrodynamic exposure (Dahl et al., 2020) interact to determine the fate of the carbon produced within the meadow and accumulated through input of external sources. Besides understanding the drivers of carbon burial, mapping the areal coverage of seagrasses is an obstacle in obtaining robust global estimates (Macreadie et al., 2019; McKenzie et al., 2020).
In the northern temperate region, Zostera is the most widespread genus of seagrass along coasts and estuaries (Short et al., 2007). Zostera marina (eelgrass) tolerates a wide range of salinities (5-35 psu) and forms continuous, often monospecific meadows in the saline waters of the eastern Atlantic, while growing in a patchier distribution with other aquatic macrophytes such as Zostera noltii, Potamogeton pectinatus, Ruppia spp. and Zannichellia palustris in the brackish Baltic Sea (Baden and Boström, 2001; Boström et al., 2003; Short et al., 2007).
Although more recent studies have provided carbon stock data from eelgrass meadows in the Baltic Sea (Dahl et al., 2016; Jankowska et al., 2016; Röhr et al., 2016; Stevenson et al., 2022), regional data is still lacking for large portions of the Swedish east and south coast (Krause-Jensen et al., 2022). When building global estimates by extrapolating data on certain regions and species, the loss of representation of local variabilities risks leading to large errors. Upscaling data deriving from other temperate regions to the Baltic Sea may not be appropriate since stocks show large variation even on regional scales (Röhr et al., 2018; Krause-Jensen et al., 2022). To constrain global uncertainties, data and mapping of seagrass cover on a regional and local scale are therefore required (Mazarrasa et al., 2021; Krause-Jensen et al., 2022).
Here, we quantify organic carbon stocks of the sediments in eelgrass meadows along the Baltic coastline of Sweden, filling a regional gap and contributing to understanding the potential of this region in terms of carbon sequestration. New observations from 14 sites are presented together with a compilation of previous observations from the Baltic Sea and the Kattegat-Skagerrak, where seagrass sediment carbon stocks have been quantified. We also use stable isotopes to assess the relative contribution of seagrass and phytoplankton to sediment carbon.
The Baltic Sea is one of the world’s largest brackish water bodies. Zostera marina meadows occur as far north as 61°37’N (~ 5 psu; Boström et al., 2003; Boström et al., 2014). The areal extent of Z. marina in the Baltic Sea (excluding Kattegat and the Belt Seas) is conservatively estimated to be 302 km2, comprising 0.05–0.1% of the global seagrass area (Boström et al., 2014; Duarte, 2017; McKenzie et al., 2020). As sheltered areas in the Baltic Sea are dominated by aquatic plants more tolerant to the lower salinity (Dahl et al., 2016), Z. marina is commonly found at exposed to moderately exposed sites, with substrates ranging from muddy to sandy and stony (Baden and Boström, 2001; Boström et al., 2003). Meadows in the Baltic Sea are characterized by denser, smaller shoots and lower rates of production than those in the Skagerrak, Kattegat, and the Belt Seas (Boström et al., 2004; Boström et al., 2014; Holmer et al., 2009). This may partly be explained by the hyposaline conditions having a negative impact on plant performance and productivity, and by the higher exposure of the Baltic sites relative to eelgrass meadows in the Kattegat-Skagerrak (Holmer et al., 2009; Salo et al., 2014).
A total of 43 cores from inside seagrass meadows and eleven cores from unvegetated nearby areas were obtained throughout June–August 2021 along the Swedish east and south coast (Figure 1, Table 1). The study area (55–59°N) covers a temperature and salinity gradient along the Z. marina distribution in the region. All meadows were dominated by Z. marina, except a very shallow site in the South of Sweden (Kurland; KU) where Ruppia spp. was the dominating species. At most sites a gradient was observed where the meadow/patches were mixed in the shallower parts, and more monospecific in the deeper parts.
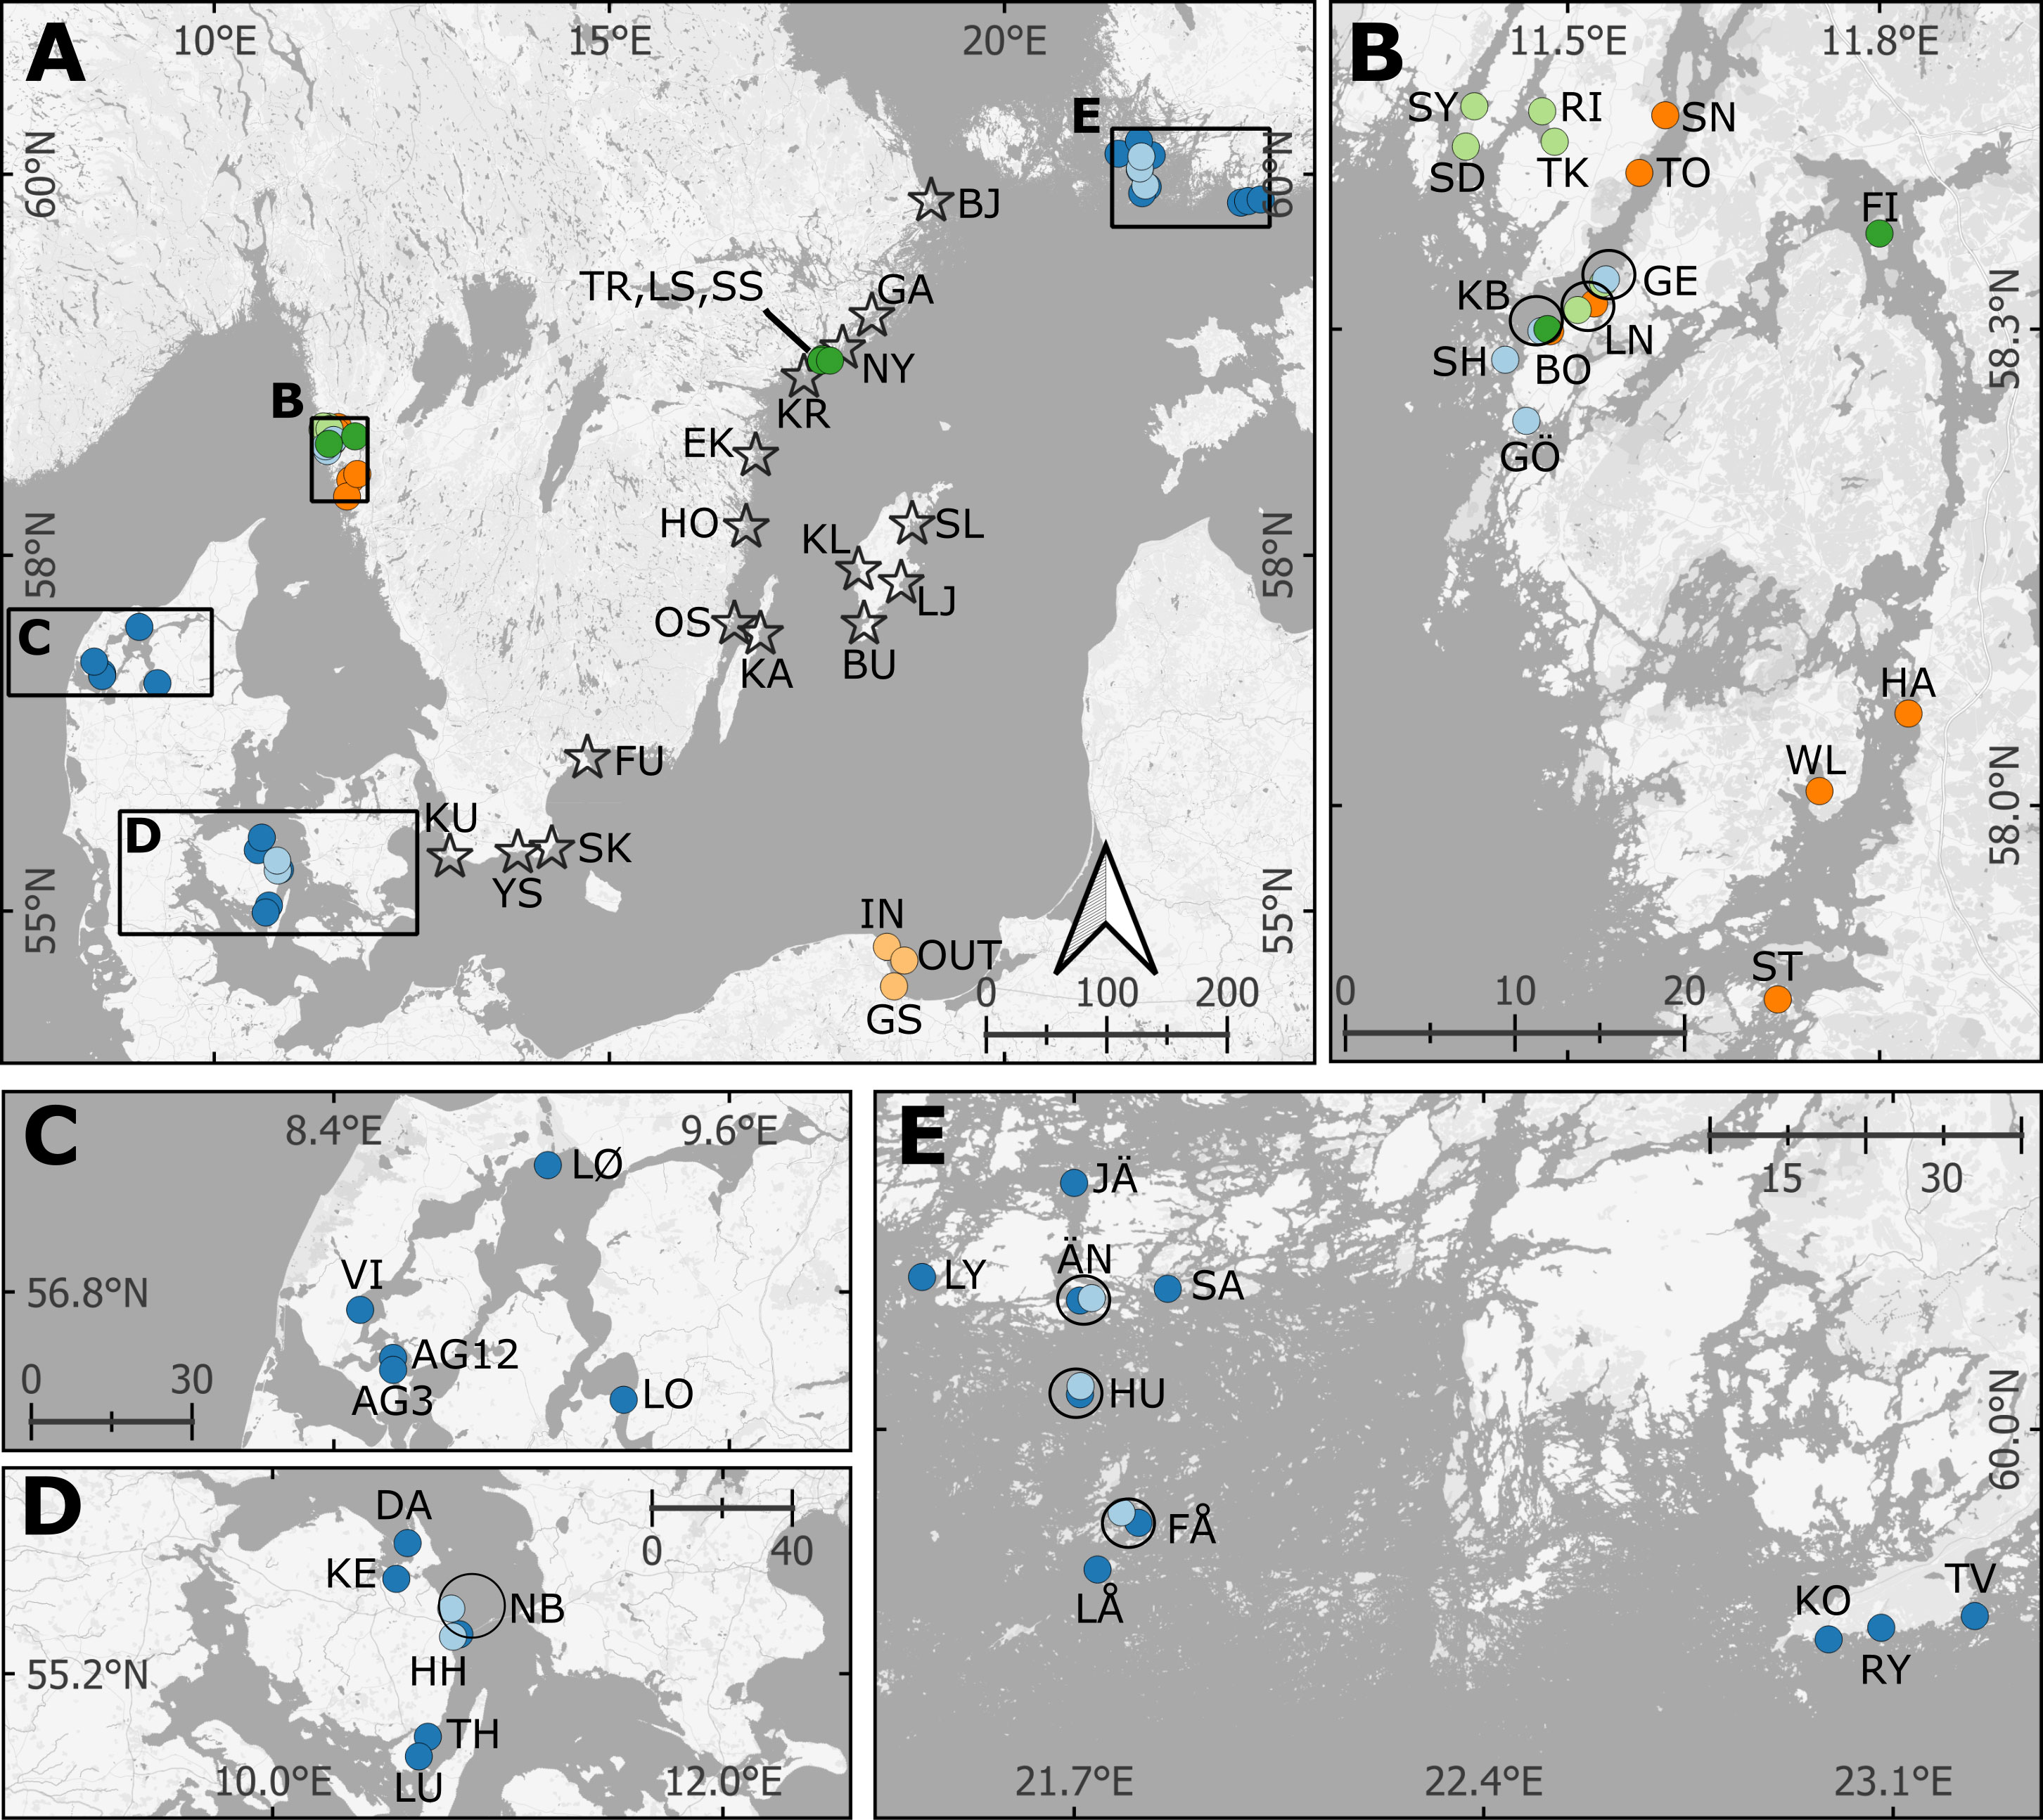
Figure 1 Map of eelgrass blue carbon assessments with site abbreviations and including previously reported data. For full station names, see Table 1 and online Supplementary File. (B–D) display the sites in the Kattegat-Skagerrak, and (A, E) are in the Baltic Sea. The black circles indicate sites recurring in multiple studies. Two sites from this study were excluded from part of the analysis; Klintehamn and Slite (KL and SL; see Results). The reference cores from unvegetated areas share coordinates with their respective vegetated cores and are not displayed in the map. Stars = New data presented here, Dark green = Dahl et al., 2016, Light green = Dahl et al., 2020, Dark blue = Röhr et al., 2016; Light blue = Asplund et al., 2022, Orange = Moksnes et al., 2021, Yellow = Jankowska et al., 2016. The coordinates for the sites reported by Jankowska et al., 2016 and Asplund et al., 2022 were not available, and are approximated from the maps in the original studies.
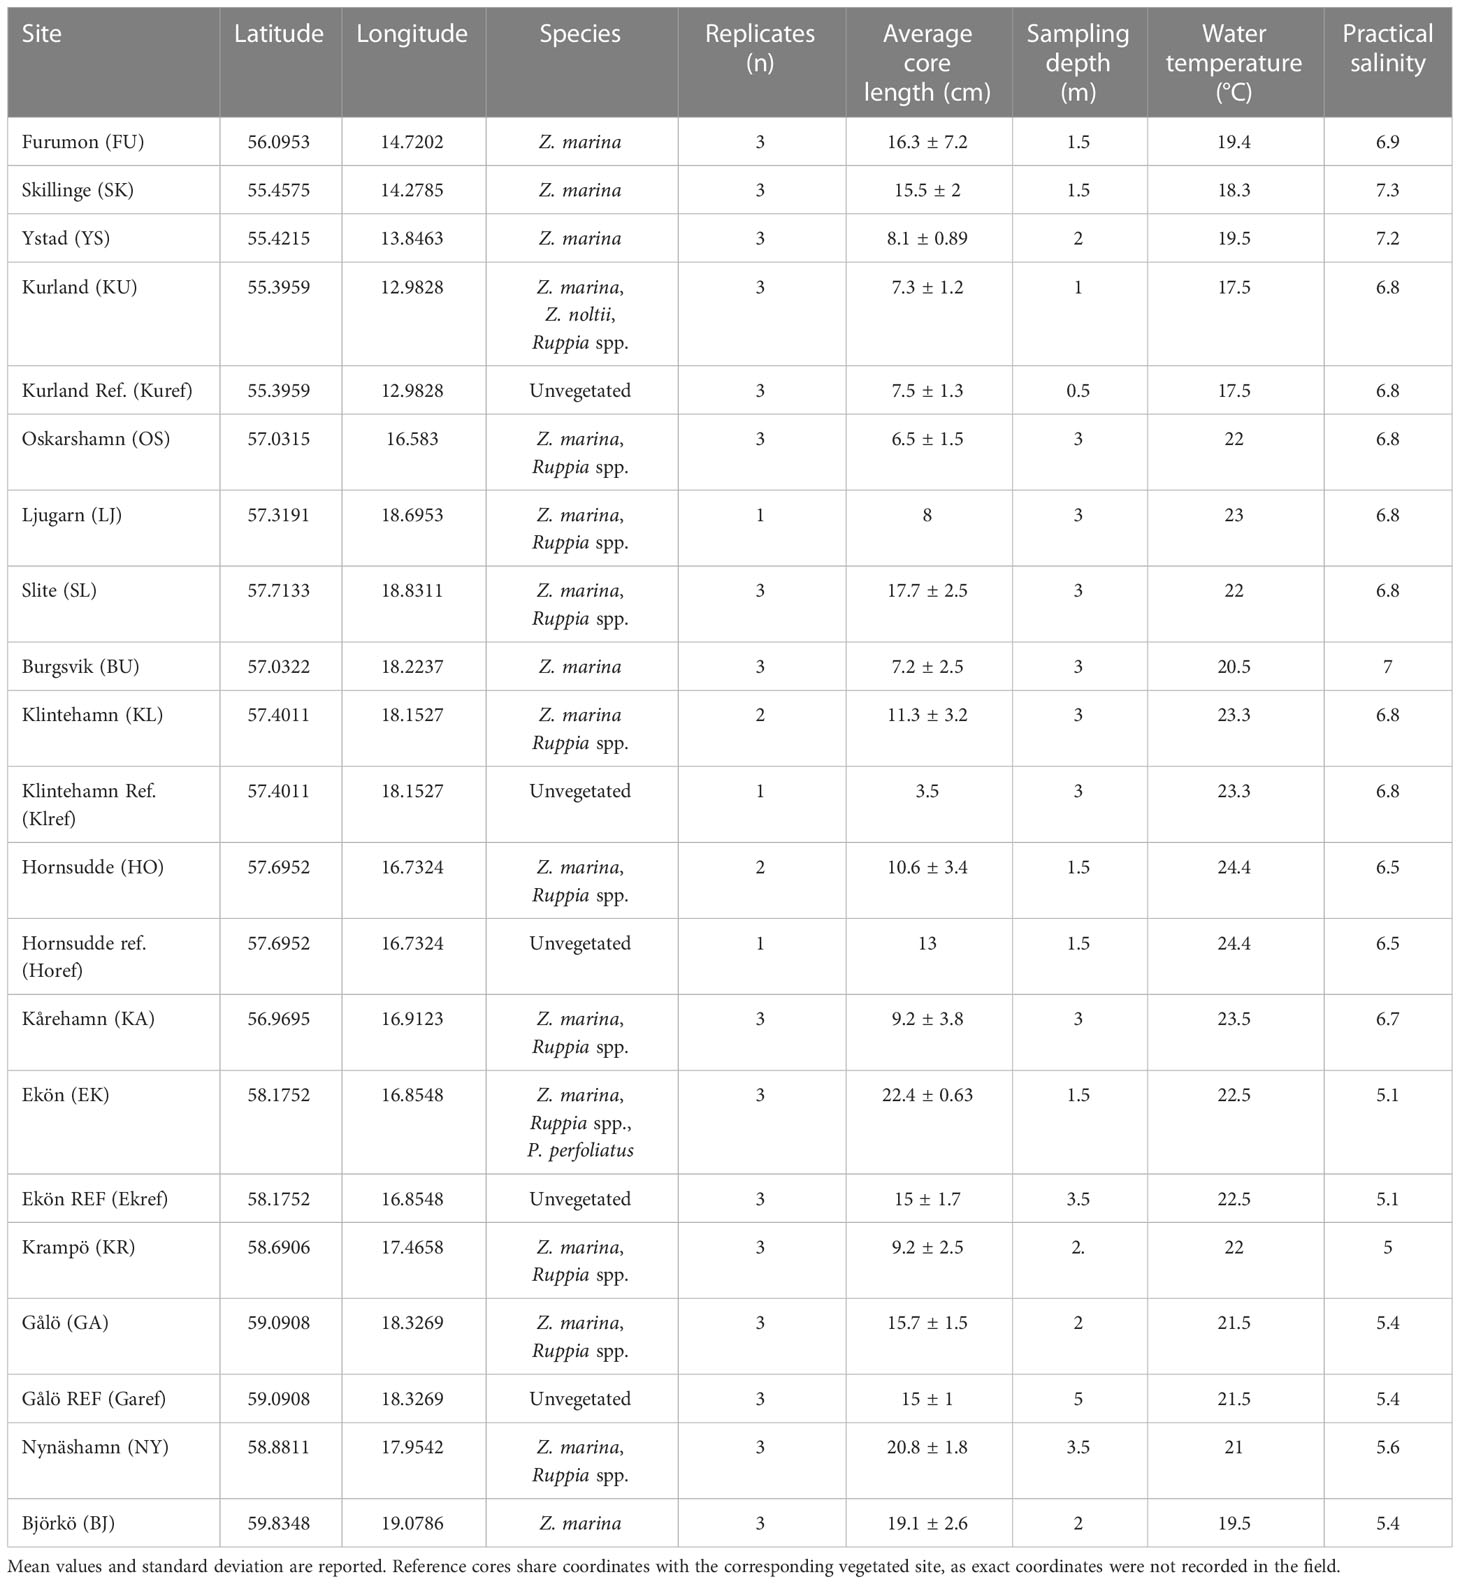
Table 1 Sampled Baltic eelgrass meadows with corresponding coordinates, most abundant species of macrophyte, the number of cores taken, the average length of the replicate sediment cores, estimated sampling depth, water temperature and practical salinity.
Cores were collected by snorkeling, using 30 cm long acrylic tubes (5 cm diameter). When meadows were not continuous, coring was performed within patches. Wherever possible, replicates were taken with a minimum distance of 10 m from one another. The same applied for reference cores sampled in unvegetated substrate, where all cores but one (Hornsudde; HOref) were sampled 10–70 meters outside the seagrass meadow/patches. The corers were pushed into the sediment, capped with rubber stoppers at both ends and transported vertically to shore or the boat for processing. The sediment at most locations consisted of sand or gravel, making it difficult to manually push the corers into the sediment. As a result, most of the cores were shorter than 15 cm (Table 1). Rather than slicing them into depth sections, all depths were pooled for each core before analysis, to obtain averages for the entire core length (three of the longer cores were sliced into 2–5 cm sections, see online Supplementary Material). Although sediment compaction is expected to be significant in soft, muddy sediments (Dahl et al., 2016; Moksnes et al., 2021), it was not accounted for in the analysis because of generally sandy substrate and short core lengths. At each site, eelgrass roots, rhizomes, and leaves were collected and stored in a portable freezer while in the field.
The depth layers for each core were homogenized to obtain an average for the entire core. Larger fragments of biological material, fauna, and rocks were removed to facilitate processing of the samples. Using a cut off syringe, the volume of sediment was recorded and measured into a plastic jar. The weight was noted before and after freeze drying to calculate the dry density. Samples from FU, SK, YS and KU were not freeze dried, but dried in an oven at 40°C until constant weight.
A small fraction of the dried samples was ground and homogenized with a pestle and mortar. A subsample was weighed into tin cups for analysis of total carbon, nitrogen, and isotopic composition of 13/12C and 15/14N using an Elemental Analyzer-Isotope Ratio Mass Spectrometer (EA-IRMS). The standards were calibrated to international isotopic references VPDB (Vienna Pee Dee Belemnite) for carbon and atmospheric air for nitrogen. Results are reported in permille (‰) using the δ-notation (e.g., Ricart et al., 2015). From each site, a second subsample was weighted into silver cups and acid treated with HCl fumes (10 mL, 37%) for 62 h in a desiccator, for determination of the organic carbon fraction (e.g., Hedges and Stern, 1984; Harris et al., 2001). After the acid treatment the samples were dried at ~40°C for 2 hours, packed into tin cups and analyzed by EA-IRMS. The dried, pooled samples were then weighed before wet sieving through two sieves (1 mm and 63 µm), using Na4P2O7 as a dispergent to dissolve accumulated organic particles. The fractions from each sieve were dried at 50°C until constant weight, and the percentage of each fraction was calculated. Results are reported as fine fraction (% <63 µm).
Eelgrass roots, rhizomes, and leaves were cleaned of any epiphytes (rarely observed) or sediment. The roots and rhizomes were separated from the leaves, and the samples were dried in an oven at 40°C for 48 h. Using a mortar and pestle they were homogenized into a fine powder and packed in tin capsules for isotopic analysis as described for the sediment. Eelgrass samples were pooled by region (Supplementary Online Material).
To put the data presented here into perspective, we conducted a brief literature survey using Google Scholar (search words: “Zostera marina” “sediment” “Baltic” “carbon”) of published Blue Carbon data from eelgrass meadows in the Baltic Sea and the Kattegat-Skagerrak. Six articles that either reported carbon stocks, or carbon content and dry bulk density so that carbon stocks could be estimated, were selected for comparisons. All literature data included in the estimates are available in the Supplementary Online Material.
The inorganic carbon content was obtained from the difference in total carbon content and the site-specific fraction of organic carbon (after acidification). Similarly, the δ13C signals were corrected based on the site-specific isotopic signal obtained after acidification. The carbon density (g C cm-3) was then calculated by multiplying the organic carbon content (% DW) by the dry density (g DW cm-3) of the pooled core. Carbon stocks (g C m-2) were estimated for the top 25 cm of the sediment, for comparison to previous reported stocks in the region.
Extrapolating the carbon stock from a shorter core assumes that the carbon density of the sampled core length is representative of the sediments to 25 cm depth. However, sites with overall low organic carbon content (<2% DW) tend to display mixed or decreasing carbon depth profiles (Kindeberg et al., 2019). A decreasing profile of carbon density would lead to overestimation of the carbon stocks by pooling and extrapolating carbon stocks from shorter cores. To correct for overestimation, published data of carbon stocks from depth integrated cores was used to derive a correction factor (Röhr et al., 2018). The carbon density of depth sections to 10 cm depth was averaged and multiplied by 25 cm, and compared to the results obtained by integrating each depth section separately. The median value of the differences between the carbon stock derived from the pooled and extended core and the one obtained by integrating each depth layer was selected as the correction factor.
To estimate the relative contribution of phytoplankton and seagrass to the sediment, the two-source mixing model IsoError (ver. 1.04; Phillips and Gregg, 2001) was used with δ13C as the tracer. Sediments with δ13C values outside those selected for the endmembers resulted in mean contributions outside the range 0–1. After calculation of the confidence intervals, those values were scaled so that contributions >1 was set to one, and <0 were set to zero. The mixing model was done for the Baltic Sea and the Kattegat-Skagerrak separately, as the isotopic values of the endmembers may vary between locations. The endmember δ13C value for Baltic macrophytes (-10.1 ± 1.29 ‰, n = 113) was derived from the sampled eelgrass, combined with published data on Baltic Zostera marina roots, rhizomes and leaves, Ruppia spp., and Pomatogedon pectinatus, two freshwater macrophytes which commonly co-occur with eelgrass in the brackish Baltic Sea (Röhr et al., 2016; Röhr et al., 2018). For the Kattegat-Skagerrak, only Z. marina (both above- and belowground) was included in the estimate for macrophytes (-10.46 ± 1.49 ‰, n = 89; Röhr et al., 2016; Röhr et al., 2018), as eelgrass meadows here tend to be monospecific (Boström et al., 2003). The δ13C values for phytoplankton was obtained from the same published dataset, selecting the estimates for the Baltic (-21.46 ± 3.02 ‰, n = 11) and the Kattegat-Skagerrak (-18.28 ± 2.18 ‰, n = 6; Röhr et al., 2018; Supplementary Online Material). The mixing model was run with both uncorrected sediment δ13C values, and with values corrected for the change in isotopic signal after acidification.
A Shapiro-Wilk normality test was used to check for normal distribution. Wilcoxon signed rank test was performed to determine if there was any statistical difference between the untreated and acidified samples. Two-tailed Mann-Whitney U tests were performed to compare independent two group samples, and Spearman rank was used for correlations. All statistical analysis were conducted in Python (ver. 3.10.8) using the Scipy package (ver. 1.9.3).
Two sites at Gotland (Klintehamn and Slite) displayed values enriched in 13C even after correction for inorganic carbon (corrected δ13C values of -2.17 ± 0.67 and -5.71 ± 0.85 ‰ respectively). As these two sites also had the highest carbon contents amongst the vegetated sites sampled in this study (0.71 ± 0.0035 and 1.19 ± 0.21% DW, after correction), as well as high C:N ratios (81.66 (n = 1) and 33.40 ± 7.94) compared to the average (Table 2), these results could indicate incomplete carbonate removal. These two sites were therefore excluded from further analysis, except for the average estimates of sediment properties (fine particle content and dry bulk density).
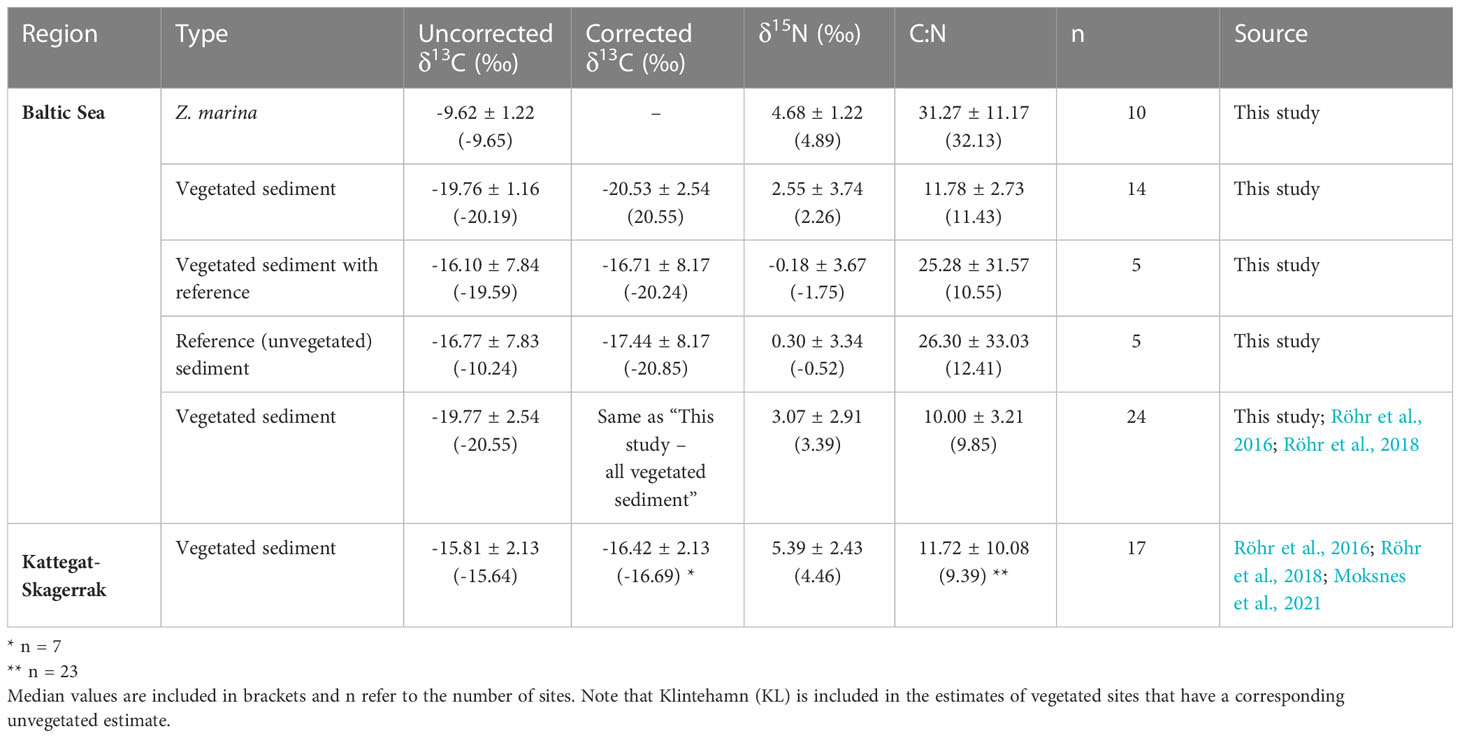
Table 2 Mean values and standard deviation of δ13C (uncorrected and corrected), δ15N, and C:N ratios of sediments and eelgrass roots, rhizomes and leaves (combined) reported in this study and including previously published data (see Figure 1 and Supplementary Online Material).
To estimate the organic fraction of the carbon pool and reduce bias in the isotopic analysis, acidification of a subsample from each site was done to remove carbonates. Five out of seventeen samples had higher carbon content after acidification than before, which could be due to the variability of the samples, but may also indicate addition of carbon contaminants during the acidification. This has previously been observed when the fumigation time has exceeded 24 h (Komada et al., 2008). There was some evidence of a significant difference in the carbon content (mean rank 34 and 119, for negative and positive differences respectively; n = 17, Wstat = 34, p = 0.045). δ13C values were more depleted in 13C after acidification than before (mean rank 10.4 and 2.3, respectively; n = 17, Wstat = 7, p = 0.0003), but did not display a linear decrease with increasing inorganic carbon content. Truncating the values of organic carbon >100% and inorganic carbon values <0% to 100% and 0% respectively, we obtained an estimate of the inorganic carbon present in the samples. This should be considered as a rough estimate, due to the limitations of the acidification procedure.
In the Swedish Baltic eelgrass meadows assessed here, the average fraction of inorganic carbon was 4.96 ± 5.39 (median: 3.24) % of the total carbon content (n = 17), comparable to previous findings (Röhr et al., 2016). As there was large variability between sites (0–18%), carbon content and stocks were corrected for the site-specific values of inorganic carbon content (Supplementary Online Material). Using available data from previous studies, we calculated that the Kattegat-Skagerrak region had an average inorganic fraction of 12.62 (11.44) ± 8.38% (n = 19). Data from previous studies were not corrected for inorganic carbon unless site-specific raw data were provided (Supplementary Online Material). We therefore refer to “carbon content” when discussing estimates compiled of both organic and total carbon data instead of “organic carbon content”.
The average organic carbon content of the vegetated sites sampled in this study was 0.28 (0.24) ± 0.15% DW (Figure 2A). All vegetated sites in the Baltic Sea had organic carbon contents <1% DW. The highest average was found in Skillinge (0.68 ± 0.048% DW), which was ~6 times larger than the lowest at Ljugarn (0.11% DW, n = 1) (Figure 3A). Including data from previous publications (Supplementary Online Material, Figure 1), the average carbon content in the Baltic Sea was 0.25 (0.21) ± 0.14% DW. In the Kattegat-Skagerrak, the average was >10 times larger (3.25 (2.62) ± 2.78% DW), and significantly different from the Baltic (Mann-Whitney U = 919.0, nKS = 32 nBaltic = 33, p = 3.92 * 10-8 two-tailed) (Figures 2A, 3A).
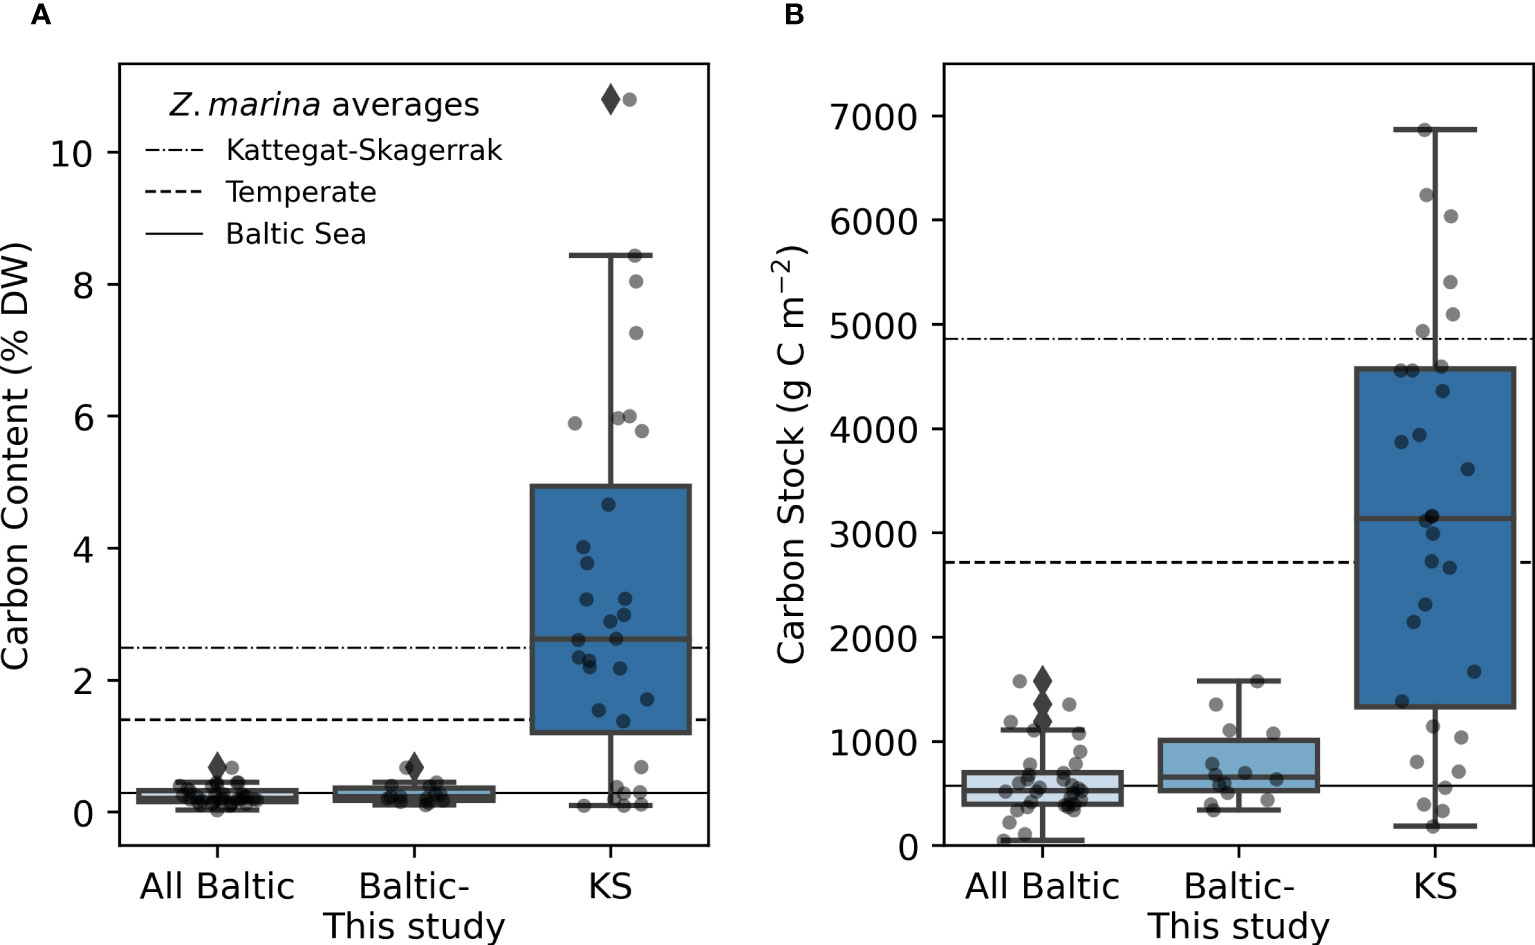
Figure 2 Carbon content (A), and carbon stocks (B) in the Baltic and Kattegat-Skagerrak (KS) regions. The line in the box displays the median, and boxes stretch to the interquartile range (Q3-Q1). Whiskers extend to 1.5 times the interquartile range and outliers are denoted by a diamond. The scattered points represent the average stock of each site. Sample sizes are 33, 14 and 32 for “All Baltic”, “Baltic- This study” (stations sampled in this study), and “KS” (Kattegat-Skagerrak), respectively. The station Thorøbund (TH;18932 g C m-2) was excluded from the plot (B) for better visualization of the remaining data. The horizontal lines represent average estimates for eelgrass sediments in the Baltic Sea, Temperate region and the Kattegat-Skagerrak as reported in Röhr et al., 2018.
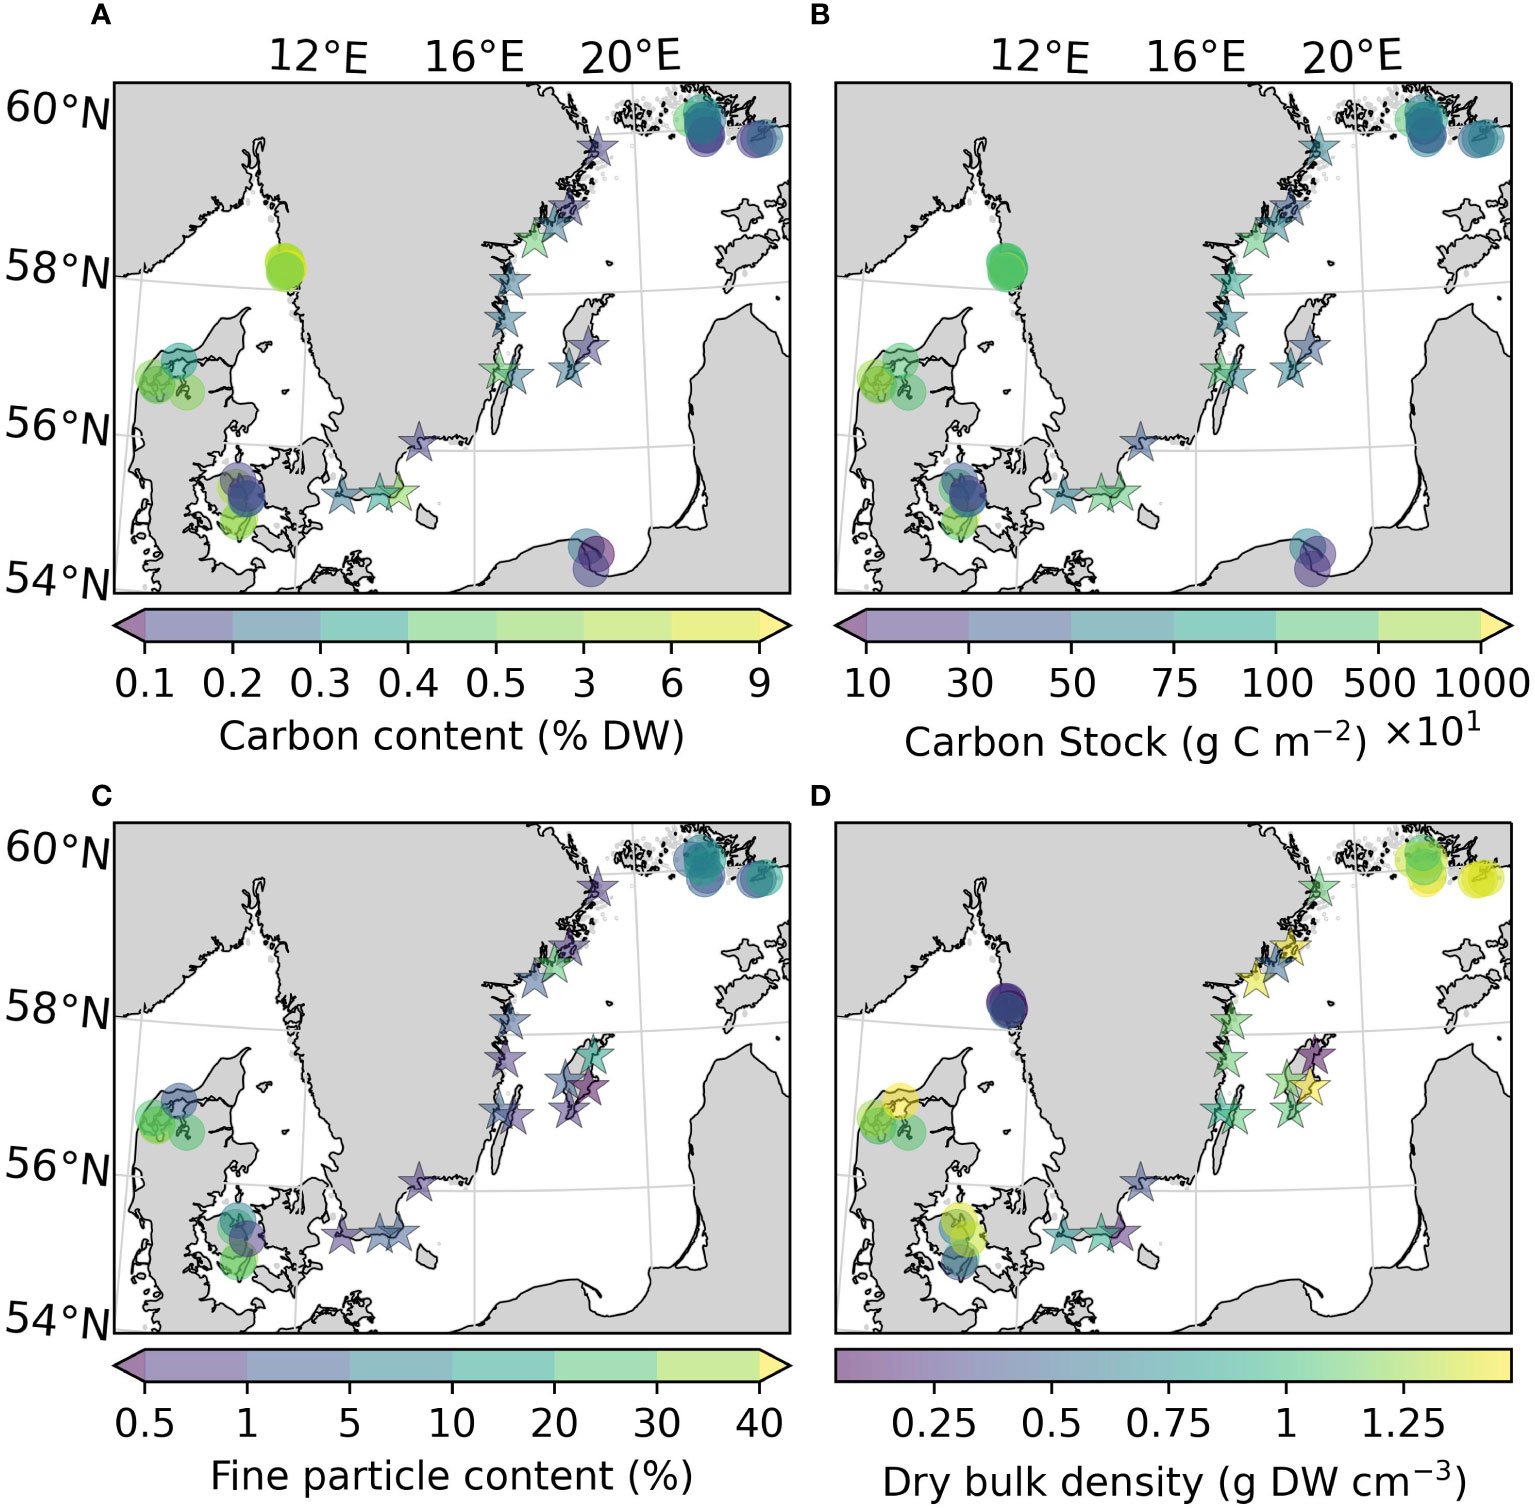
Figure 3 Carbon content (A), carbon stocks (ranging 100-10000 g C m-2) (B), fine particle content (C), and dry bulk density (D) of the sites sampled in this study, as well as previously reported for the area. Note that the scale on the colorbars is non-linear due to the large ranges of values. All variables were estimated for the top 25 cm of the sediment. Arrows on the colorbar indicate that there are values outside the displayed color range. The new sites sampled in this study are represented by stars.
To correct for over- or underestimation due to the pooling of the cores, they were divided into two groups based on the average carbon content; high (>2% DW) or low (<2% DW; Kindeberg et al., 2019). In the low-carbon samples the pooling method led to an overestimation of carbon stocks of ~25% compared to the depth-integrated estimate, with a large range (-34–115%, n = 45). In the high-carbon samples, there was an underestimation of ~15% (range: -53–18%, n = 22) (Supplementary Online Material). The correction factors applied to the pooled and extrapolated cores were thus 0.75 and 1.15, respectively. After correcting for inorganic carbon content and pooling, the average carbon stock of the new data reported in this study was 773 (660) ± 372 g C m-2. Including previously reported data, our estimate for the Baltic Sea was 635 (563) ± 321 g C m-2, which represents only 23% of the average for temperate eelgrass meadows (Figure 2B and Table 3). In the Kattegat-Skagerrak region, the carbon stock estimate was 3457 (3057) ± 3382 g C m-2, more than five times larger than the estimated Baltic stock and significantly different (Mann-Whitney U = 927.5, nKS = 32 nBaltic= 33, p = 1.79 * 10-8 two-tailed) (Figure 3B and Table 3).
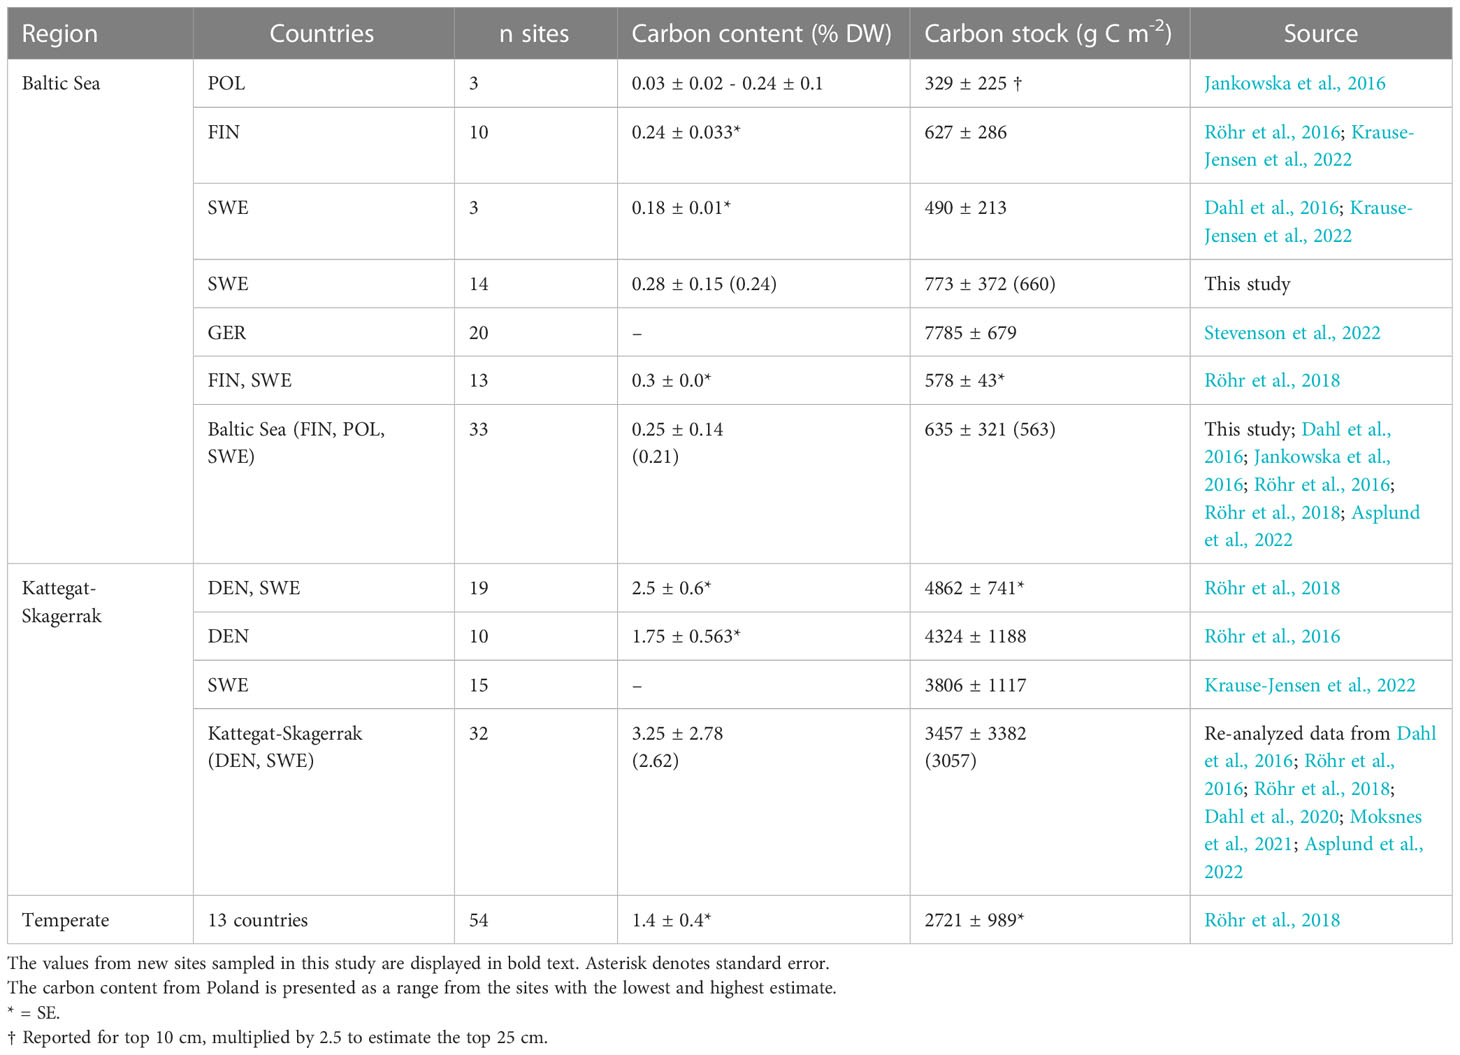
Table 3 Regional estimates (mean and standard deviation) of carbon content and carbon stocks in Z. marina meadows reported here and by previous studies.
Although Klintehamn (KL) was excluded from most analyses because the carbon content was likely not all organic, it is included in this section for comparisons of carbon content and carbon stocks with the unvegetated and their respective vegetated sites (n = 5). The unvegetated sites in this assessment had an average carbon content about three times larger than the vegetated ones (1.06 (0.25) ± 1.80 and 0.32 (0.24) ± 0.22% DW, respectively), but the mean is skewed due to the small sample size and one extreme value at Ekön (EKref, 4.28 ± 1.53% DW). Three unvegetated sites had lower carbon content than their respective vegetated sites, while two had higher. Carbon stocks were 1352 (787) ± 1372 and 920 (682) ± 644 g C m-2 in the unvegetated and vegetated sediments respectively.
The fine particle content in the here presented dataset displayed a large range (0.46–26.1%), with the highest value found at Nynäshamn (NY) and the lowest at Ljugarn (LJ; Figure 3C). The average fine particle content of this assessment was 4.06 (1.05) ± 7.55%. Sediment properties differed significantly between regions when also considering data collected from the literature (Figures 3C, D). The average fine particle content was ~6 times larger in the Kattegat-Skagerrak (29.76 (27.55) ± 17.78%) than in the Baltic Sea (5.01 (1.90) ± 6.50%; Mann-Whitney U = 400.5, nKS = 17 nBaltic= 26, p = 1.32 * 10-6 two-tailed), and the dry bulk density was 0.75 (0.64) ± 0.50 and 1.41 (1.42) ± 0.15 g DW cm-3 in the Kattegat-Skagerrak and Baltic respectively (Mann-Whitney U = 95.5, nKS = 26 nBaltic= 29, p = 4.02 * 10-7 two-tailed). The correlations between sediment properties and carbon content were stronger in the Kattegat-Skagerrak than in the Baltic (Figure 4). Fine particle content was positively correlated with carbon content, and dry bulk density displayed a negative correlation (Figure 4). Amongst the data compared here, the definition of the fine fraction of sediment differs slightly (Dahl et al., 2016; Röhr et al., 2016; Röhr et al., 2018), which is why the term “fine particles” is used over e.g., “mud” or “silt”.
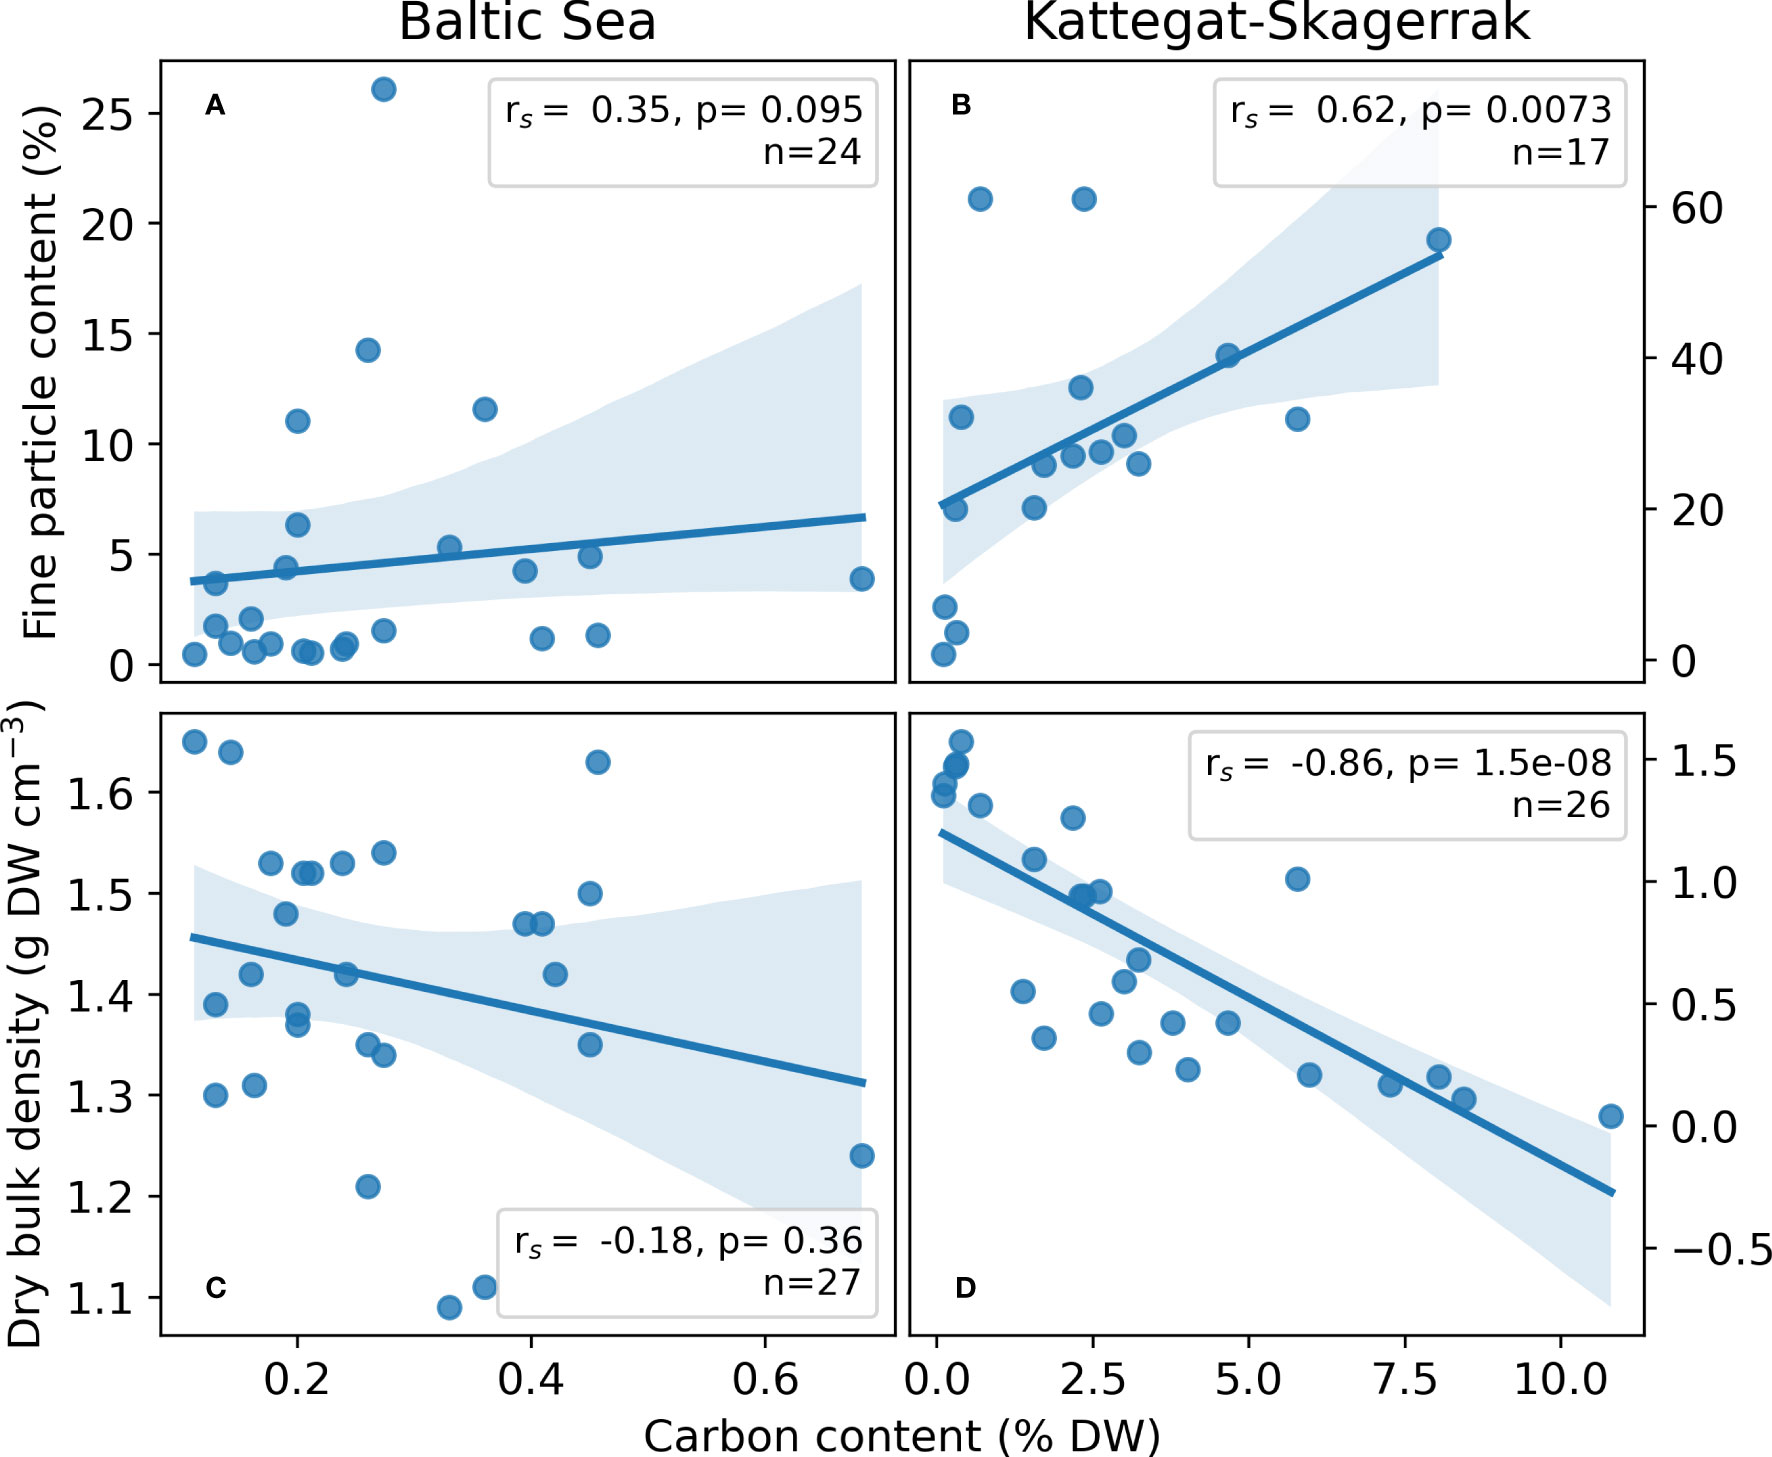
Figure 4 Regressions of site-averaged sediment variables; Fine particle content (A, B) and dry bulk density (C, D) versus carbon content in the Baltic Sea (A, C) and Kattegat-Skagerrak (B, C). Spearman r (rs) and p-values are presented. Shading represents the 95% confidence interval estimated using bootstrapping by resampling the distribution 10,000 times. The number of sites included in the regressions (n) vary, as availability for certain variables differed among sites.
To obtain insight on the sources of the carbon found in the sediment, the δ13C, δ15N and C:N ratios in vegetation and sediments were compared. The δ13C values obtained for Z. marina leaves, and combined roots and rhizomes in this study (-9.32 ± 1.62 and -9.94 ± 0.69 ‰) were comparable to those found in the literature (-10.1 ± 0.3 and -10.3 ± 0.32 ‰ in Finland, -9.8 ± 0.4 and -10.9 ± 0.33 ‰ in Denmark; Röhr et al., 2016). The δ13C of the sediments were corrected based on the site-specific change in isotope signal after acidification when data was available. There was no statistical difference between the δ13C values of unvegetated and their respective vegetated sediments, neither for the corrected nor the uncorrected values (Table 2). Including literature data, the sediment in the Kattegat-Skagerrak region displayed higher values in both uncorrected δ13C and δ15N than the Baltic sediments (Mann-Whitney U = 359 and 318, nKS = 17 nBaltic= 24, p = 1.17 * 10-5 and 0.002 two-tailed; Table 2 and Figures 5A, B). Using the corrected δ13C values, the difference between the regions was still significant, although the sample size was smaller (Mann-Whitney U = 89, nKS = 7 nBaltic= 14, p = 0.002 two-tailed). There was no evidence of a statistical difference in the C:N ratios between the two regions (Table 2 and Figure 5C).
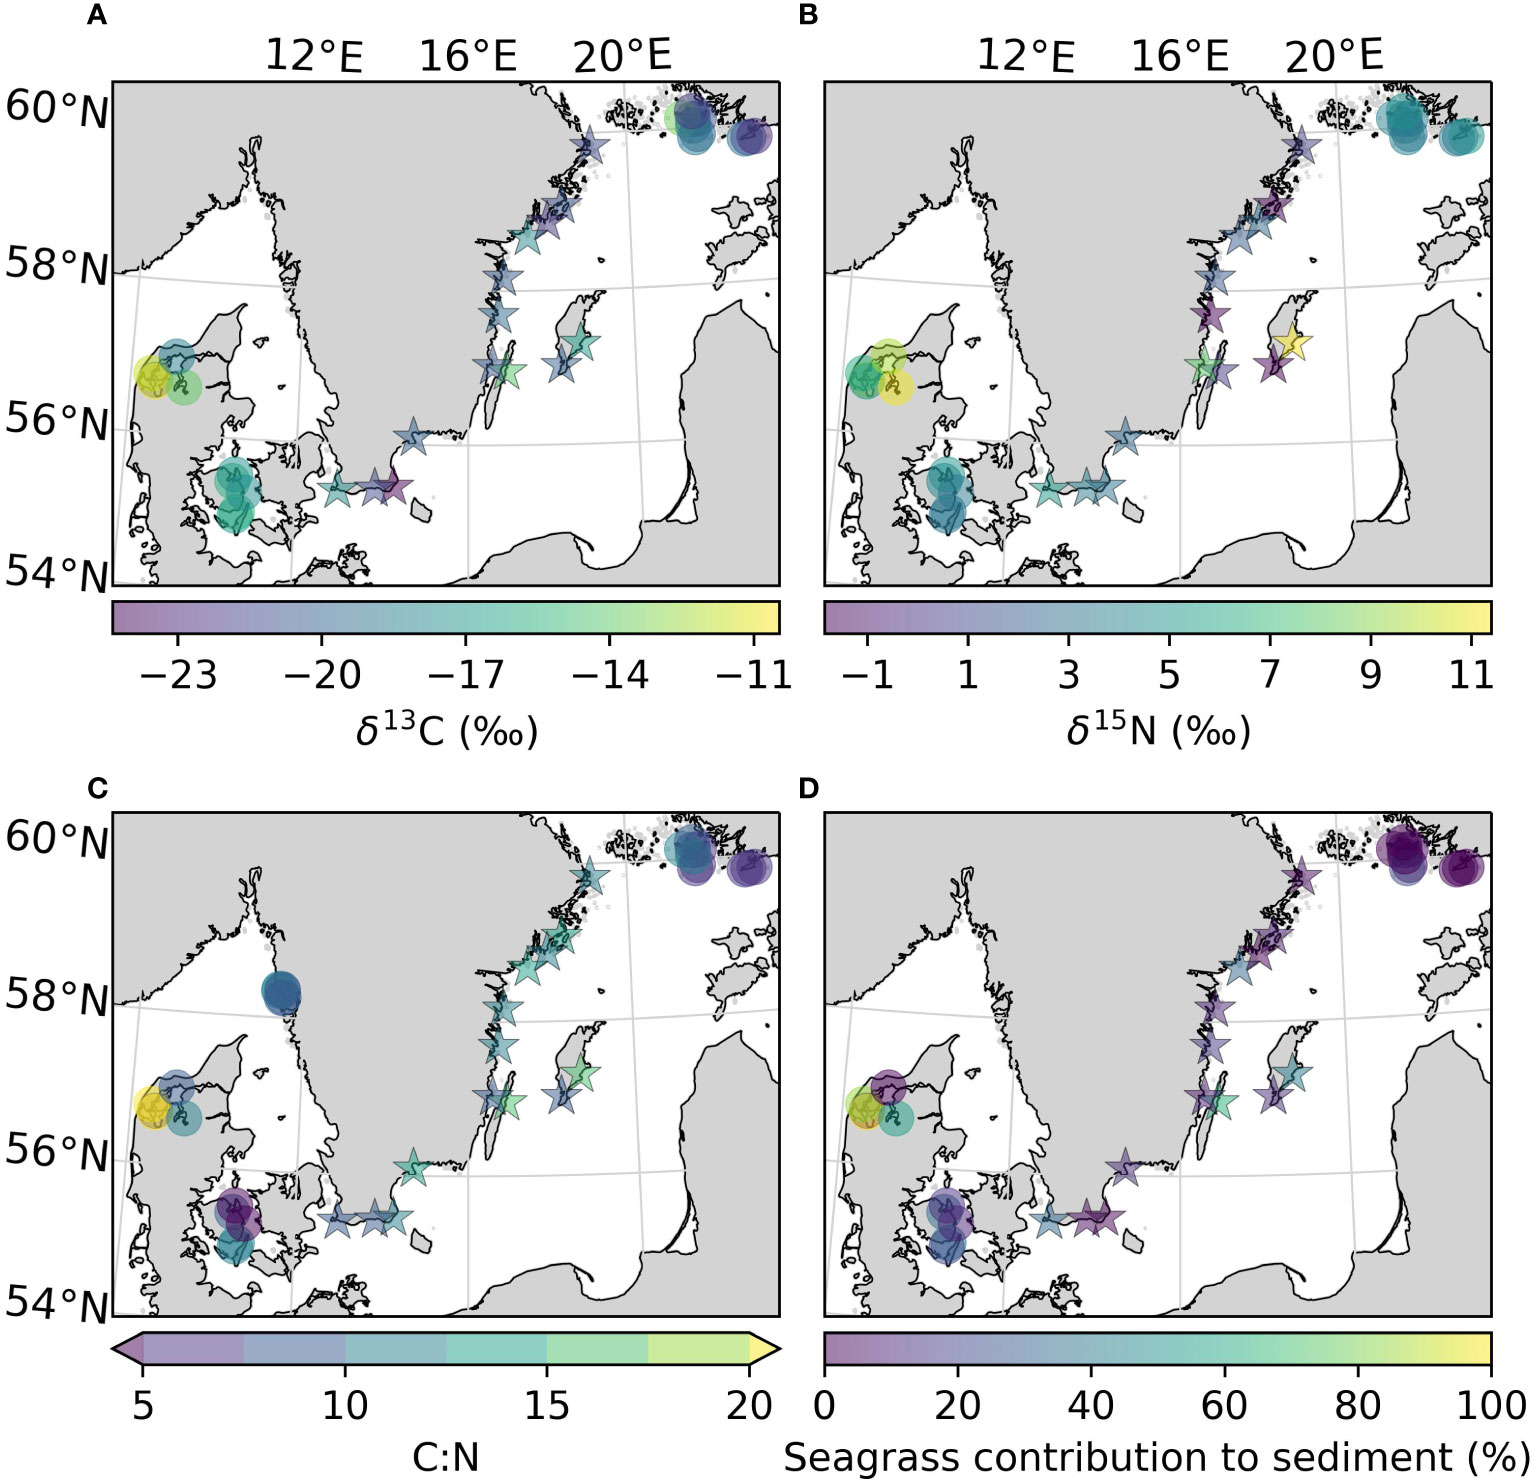
Figure 5 Uncorrected values of δ13C (A), δ15N (B), C:N ratio (C), and the mean contribution of seagrass derived carbon to the sediment carbon pool (D) of the sites sampled in this study, as well as previously reported for the area. All variables were estimated for the top 25 cm of the sediment. Arrows on the colorbar indicate that there are values outside the displayed color range. The new sites sampled in this study are represented by stars.
Applying a two-source (phytoplankton and seagrass) isotopic mixing model with δ13C as the tracer, we compared the relative contribution of macrophytes to sediment carbon (Figure 5D). Using the uncorrected mean values of δ13C for each region (Table 2), the contribution of macrophytes to the sediment was between 0–32% in the Baltic and 8–55% in the Kattegat-Skagerrak, with mean contributions and standard errors of 15 ± 8% and 32 ± 11% respectively (Table 4). When considering the mean contribution of each site, the two regions differed significantly (Mann-Whitney U = 99.5, nKS = 17 nBaltic= 24, p = 0.005 two-tailed). The range of the confidence intervals increased when using the corrected δ13C values, while the mean contributions decreased (Table 4), and the regions did not show evidence of a statistical difference.
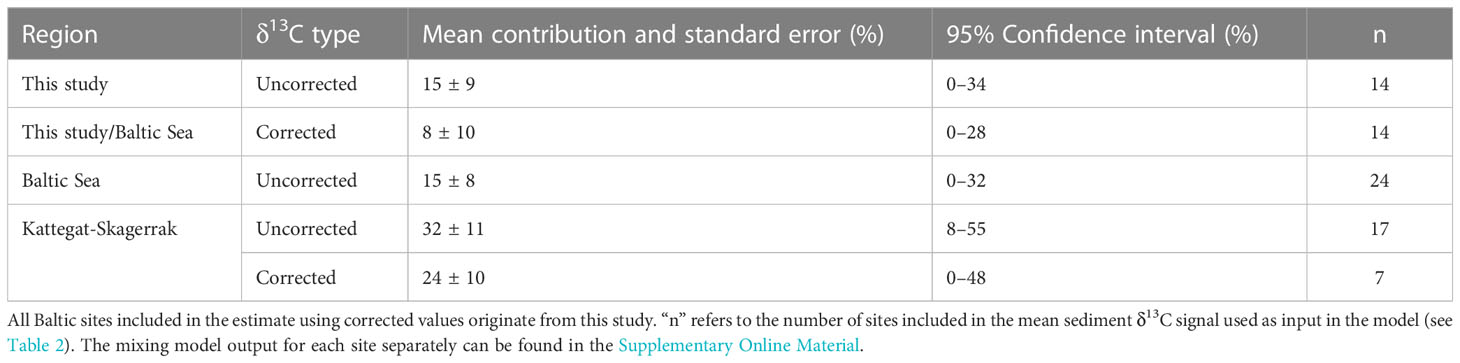
Table 4 Seagrass relative contribution to the sediment (%), obtained from the 2-source mixing model using uncorrected and corrected δ13C values as the tracer.
We here report new observations from 14 Baltic sites, which were also combined with previously published Blue Carbon data from the Baltic Sea and Kattegat-Skagerrak, to build a larger regional scale picture of eelgrass sediment carbon storage (Figures 3, 5). The short cores obtained were extended to 25 cm depth and corrected based on available depth profiles from sliced cores (Röhr et al., 2016; Röhr et al., 2018). This assumes that the sediment depth profiles sampled here are similar to those used for deriving the correction factor. The carbon content and carbon stocks in the vegetated sediments assessed here were comparable to previous reports for the Baltic Sea (Table 3). Overall, carbon content and stocks of Baltic seagrass meadows are considerably lower than other temperate regions such as the Kattegat-Skagerrak (Figure 2, Table 3).
The small organic carbon stocks in seagrass meadows of the Baltic Sea may be due to unfavorable growing conditions for Z. marina (Holmer et al., 2009; Salo et al., 2014). High angiosperm diversity in the Baltic leads to more competition in sheltered areas and Z. marina tends to grow at exposed sites in a patchy distribution (Baden and Boström, 2001; Boström et al., 2003; Dahl et al., 2016). Hydrodynamic conditions affect the substrate, and depositional conditions with a larger fraction of fine particles occur in sheltered areas of low hydrodynamic energy (Röhr et al., 2018; Dahl et al., 2020). Most sites sampled here appeared to have little sediment accumulation, and substrates were coarse with bare rock often encountered below the sampled sediment depth (see core lengths in Table 1).
The fine particle content and porosity of sediments often have a positive correlation to organic carbon content in meadows of smaller seagrass species such as Zostera spp. (Dahl et al., 2016; Röhr et al., 2016; Serrano et al., 2016). Small particles have a large surface area, thus containing more binding sites for organic material (Serrano et al., 2016 and sources therein). Layers of clay or small particles also reduce the permeability of the sediments (Wilson et al., 2008). Since they are less ventilated by the ambient water, anoxic conditions develop. Anoxic sediments have slower rates of remineralization and thus promote organic carbon burial (Rodger Harvey et al., 1995; Lehmann et al., 2002).
Seagrass meadows can trap and retain fine particles, indirectly by reducing the water flow and directly by physical interaction with particles, further promoting anoxic conditions and high organic material input (Hendriks et al., 2008; Fourqurean et al., 2012; Duarte et al., 2013). Here, we observed no clear trends separating the properties of unvegetated and vegetated sediments, possibly due to the limited sample size and large variability, or the short distance of the reference cores to the eelgrass meadows. It is possible that eelgrass has grown where the unvegetated sediment was sampled during recent years, as the spatial coverage of eelgrass patches is dynamic on relatively short time scales (Frederiksen et al., 2004; Nyqvist et al., 2009). A study spanning four European geographic areas revealed that the fraction of fine particles (<0.074 mm) was higher in vegetated than unvegetated sediment, while the organic carbon content was only significantly higher in vegetated meadows with relatively high organic carbon content (Gullmarsfjorden and Ria Formosa), but not where organic carbon was low (Baltic and Black Seas; Dahl et al., 2016). At low organic carbon sites in Poland, no difference occurred between the mean grain size in vegetated and unvegetated sediment, although the carbon content was higher in vegetated cores (Jankowska et al., 2016).
Plant morphology, growing patterns, and hydrodynamics are possible explanations for the contrasting trends in grain size and organic carbon content of Baltic Sea eelgrass meadows and bare sediments. The shoot density has a positive impact on the meadows’ ability to reduce flow and hinder resuspension of particles (Zhu et al., 2021), and continuous meadows have been suggested to contain more carbon than patchy ones due to the decrease in flow speed from meadows edge to center (Ricart et al., 2015; Oreska et al., 2017). If flow conditions are high, especially in wave-exposed areas, the sediment trapping may become ineffective as turbulence increases (Koch and Gust, 1999). On the Swedish west coast, differences between the vegetated and unvegetated sites were smaller at exposed sites that contained less carbon and nitrogen than sheltered sites (Moksnes et al., 2021). Similarly, the patchy and sparse distribution of Z. marina in the Baltic Sea, in combination with the high exposure of the meadows, could therefore limit the ability to trap and retain carbon and fine particles in the meadow. Here, we saw a stronger correlation of sediment variables and carbon content in the Kattegat-Skagerrak than in the Baltic Sea meadows (Figure 4), further suggesting that sediment variables play a larger role in sheltered, depositional sites with continuous meadows effectively trapping and sequestering particles, than at exposed sites where meadows are patchy. Baltic seagrass meadows seem to have low potential for sequestering substantial amounts of carbon but may instead be a significant source of exported organic material to deeper areas (Duarte and Cebrián, 1996; Röhr et al., 2018). The fate of carbon after export is not within the scope of this assessment but raises questions for future research.
Measurements of δ13C can elucidate the origin of organic carbon in the sediments, as plants with different photosynthetic pathways have different isotopic signals (C3 plants: -35–20 ‰, C4 plants: -17–9 ‰; Ramnarine et al., 2011). As inorganic carbon is isotopically heavier (δ13C ranging -10–0 ‰), a common approach is to acidify an aliquot of the sample prior to analysis to obtain the δ13C of the organic carbon. As acidification may alter the δ13C signal in unexpected ways (Brodie et al., 2011; Schlacher and Connolly, 2014), we ran the mixing model with both uncorrected and corrected values of δ13C to avoid confounding the results.
In a global synthesis, seagrass carbon was estimated to comprise about 50% of the organic carbon within seagrass meadows, the rest being accumulated through external input such as terrestrial run off or phytoplankton (Kennedy et al., 2010).
Here, we found that δ13C values of the sampled Baltic sediments were depleted in 13C relative to Z. marina (Table 2), more resembling the values of phytoplankton (-24.6–22.6 ‰; Röhr et al., 2016). The two-source isotopic mixing model indicated that planktonic sources dominated over seagrass derived carbon (68–100%). Only one of the meadows sampled in this study had a higher mean contribution from seagrass carbon (Kårehamn (KA), 56 ± 4.0 (SE) %) (Figure 5D). The dominance of planktonic sources is not surprising as algal blooms were observed in the Baltic Sea at the time of sampling. However, filamentous algae were often observed during sampling, and are also relatively depleted in δ13C (e.g., Pilayella littoralis; -21.6–24.8 ‰; Kahma et al., 2021). As Bayesian mixing models will output detailed results even if the input data is poorly constrained (Brett, 2014), we used a simpler model due to the limited sampling of endmembers. The drawback of using a 2-source mixing model is the inability to differentiate between sources with similar δ13C values. Epiphytes and filamentous algae have previously been identified as potentially large sources of carbon to Baltic Sea eelgrass sediment (Jankowska et al., 2016; Röhr et al., 2016). Fucus vesiculous (-15.78 ± 2.2 ‰) may also be a significant source to sedimentary organic carbon (Kahma et al., 2020), which would be overlooked in our estimate.
Surface sediments in Danish meadows consist of more seagrass derived material (13–81%) than Finnish meadows (1.5–32%; Röhr et al., 2016). This is supported by the compilation of previous and new data presented here, where the Baltic Sea meadows were estimated to contain less seagrass derived carbon than in the Kattegat-Skagerrak (0–32 and 8–55%, respectively) (Table 4). Further, no difference was found in the δ13C for vegetated and unvegetated surface sediments in this study. Moksnes et al., 2021 concluded that the carbon pool of surface sediments on the west coast of Sweden were more representative of seagrass carbon, while unvegetated sites had lower values of δ13C more resembling other sources. Hence, the Kattegat-Skagerrak may support more seagrass derived carbon within its meadows than in the Baltic Sea, more effectively retaining internally produced seagrass derived material. Larger plants contain less nutrients and more structural carbon than phytoplankton, therefore the seagrass derived carbon is more resilient to microbial decomposition i.e., more refractory, than the accumulated carbon from marine sources (Duarte, 1990; Enríquez et al., 1993; Fourqurean et al., 2012; Duarte et al., 2013). Refractory organic material and anoxic conditions result in slower rates of remineralization and promote higher burial rates (Rodger Harvey et al., 1995; Lehmann et al., 2002).
Although the average carbon stock of Baltic Sea eelgrass meadows presented here is larger than previously reported, they are small compared to other regions (Table 3). Eelgrass meadows of the Baltic Sea may be more important as nutrient than carbon sinks, as the area is experiencing high levels of eutrophication. Eelgrass on the Swedish west coast has been estimated to have very high burial rates of nitrogen, leading to great economic losses when meadows are lost (Cole and Moksnes, 2016; Moksnes et al., 2021).
Environmental conditions clearly affect the carbon stocks in seagrass meadows, as intraspecific variation is large (Dahl et al., 2016; Röhr et al., 2018; Figure 3B), reaching comparable scales as interspecific differences (Lavery et al., 2013). The environmental and regional variation in addition to that found between species provide convincing evidence that mapping efforts of both species’ composition and environmental factors, such as exposure and sediment properties, must be further investigated to refine the global estimates.
Carbon stocks reported from the northern hemisphere in Z. marina meadows are highly variable. The Kattegat-Skagerrak region is a potential hotspot for eelgrass sediment carbon, while Baltic stocks are low. This study found ~20% higher carbon stocks in the Baltic than the previously largest estimate based on ten sites from Finland (Röhr et al., 2016). Using our own data and re-analyzing previously published data confirms high variability in both organic carbon content and fine particle content on a regional scale, which were both significantly higher in eelgrass meadows in the Kattegat-Skagerrak than in the Baltic Sea. Based on the δ13C and a two-source mixing model, planktonic material was dominant over seagrass derived carbon in both regions.
The patchy distribution and high wave exposure of eelgrass meadows in the Baltic Sea likely results in fine particles and organic carbon being exported to adjacent areas instead of buried within the meadow. Environmental conditions add to species composition in terms of variation in carbon sequestration potential, and different proxies may need to be developed for different areas. The possibility of Baltic seagrass meadows acting as valuable nutrient sinks calls for more research.
The original contributions presented in the study are included in the article/Supplementary Material. Further inquiries can be directed to the corresponding author.
IS and MJ were responsible for funding and supervision. MB and MJ carried out the field work. MB carried out the lab work, data analysis, and wrote the first draft of the manuscript. All authors contributed to designing and planning the study, making revisions, and approved the final version of the manuscript.
MJ and the sampling were supported by a grant from the Swedish Research Council Formas (2020-0008). IS and MB and laboratory work were supported by grants from the Swedish Research Council (2020-00457).
We thank the following people for support during field work: Per-Olav Moksnes, Per Jonsson, Matilda Rasmussen, Henrik Möller, Ellika Faust, and Stefanie Ries. Elizabeth Robertson performed the EA-IRMS analysis, and Phoebe O’Brien supported sample preparation.
The authors declare that the research was conducted in the absence of any commercial or financial relationships that could be construed as a potential conflict of interest.
All claims expressed in this article are solely those of the authors and do not necessarily represent those of their affiliated organizations, or those of the publisher, the editors and the reviewers. Any product that may be evaluated in this article, or claim that may be made by its manufacturer, is not guaranteed or endorsed by the publisher.
The Supplementary Material for this article can be found online at: https://www.frontiersin.org/articles/10.3389/fmars.2023.1219708/full#supplementary-material
Asplund M. E., Bonaglia S., Boström C., Dahl M., Deyanova D., Gagnon K., et al. (2022). Methane emissions from nordic seagrass meadow sediments. Front. Mar. Sci. 8. doi: 10.3389/fmars.2021.811533
Baden S. P., Boström C. (2001). “The Leaf Canopy of Seagrass Beds: Faunal Community Structure and Function in a Salinity Gradient Along the Swedish Coast,” in Ecological Comparisons of Sedimentary Shores Ecological Studies. Ed. Reise K. (Berlin, Heidelberg: Springer Berlin Heidelberg), 213–236. doi: 10.1007/978-3-642-56557-1_11
Barbier E. B., Hacker S. D., Kennedy C., Koch E. W., Stier A. C., Silliman B. R. (2011). The value of estuarine and coastal ecosystem services. Ecol. Monogr. 81, 169–193. doi: 10.1890/10-1510.1
Boström C., Baden S., Bockelmann A., Dromph K., Fredriksen S., Gustafsson C., et al. (2014). Distribution, structure and function of Nordic eelgrass (Zostera marina) ecosystems: implications for coastal management and conservation. Aquat. Conserv: Mar. Freshw. Ecosyst. 24, 410–434. doi: 10.1002/aqc.2424
Boström C., Baden S. P., Krause-Jensen D. (2003). “The Seagrasses of Scandinavia and the Baltic Sea,” in World Atlas of Seagrasses. Eds. Green E. P., Short F. T. (Berkeley, USA: University of California Press), 27–37.
Boström C., Roos C., Rönnberg O. (2004). Shoot morphometry and production dynamics of eelgrass in the northern Baltic Sea. Aquat. Bot. 79, 145–161. doi: 10.1016/j.aquabot.2004.02.002
Brett M. (2014). Resource polygon geometry predicts Bayesian stable isotope mixing model bias. Mar. Ecol. Prog. Ser. 514, 1–12. doi: 10.3354/meps11017
Brodie C. R., Leng M. J., Casford J. S. L., Kendrick C. P., Lloyd J. M., Yongqiang Z., et al. (2011). Evidence for bias in C and N concentrations and δ13C composition of terrestrial and aquatic organic materials due to pre-analysis acid preparation methods. Chem. Geology 282, 67–83. doi: 10.1016/j.chemgeo.2011.01.007
Cole S. G., Moksnes P.-O. (2016). Valuing multiple eelgrass ecosystem services in Sweden: Fish production and uptake of carbon and nitrogen. Front. Mar. Sci. 2. doi: 10.3389/fmars.2015.00121
Dahl M., Asplund M. E., Björk M., Deyanova D., Infantes E., Isaeus M., et al. (2020). The influence of hydrodynamic exposure on carbon storage and nutrient retention in eelgrass (Zostera marina L.) meadows on the Swedish Skagerrak coast. Sci. Rep. 10, 13666. doi: 10.1038/s41598-020-70403-5
Dahl M., Deyanova D., Gütschow S., Asplund M. E., Lyimo L. D., Karamfilov V., et al. (2016). Sediment properties as important predictors of carbon storage in Zostera marina Meadows: A comparison of four European areas. PloS One 11, e0167493. doi: 10.1371/journal.pone.0167493
Duarte C. (1990). Seagrass nutrient content. Mar. Ecol. Prog. Ser. 67, 201–207. doi: 10.3354/meps067201
Duarte C. M. (2017). Reviews and syntheses: Hidden forests, the role of vegetated coastal habitats in the ocean carbon budget. Biogeosciences 14, 301–310. doi: 10.5194/bg-14-301-2017
Duarte C. M., Cebrián J. (1996). The fate of marine autotrophic production. Limnol. Oceanogr. 41, 1758–1766. doi: 10.4319/lo.1996.41.8.1758
Duarte C. M., Kennedy H., Marbà N., Hendriks I. (2013). Assessing the capacity of seagrass meadows for carbon burial: Current limitations and future strategies. Ocean Coast. Manage. 83, 32–38. doi: 10.1016/j.ocecoaman.2011.09.001
Duarte C. M., Middelburg J. J., Caraco N. (2005). Major role of marine vegetation on the oceanic carbon cycle. Biogeosciences 2, 1–8. doi: 10.5194/bg-2-1-2005
Enríquez S., Duarte C. M., Sand-Jensen K. (1993). Patterns in decomposition rates among photosynthetic organisms: the importance of detritus C:N:P content. Oecologia 94, 457–471. doi: 10.1007/BF00566960
Fourqurean J. W., Duarte C. M., Kennedy H., Marbà N., Holmer M., Mateo M. A., et al. (2012). Seagrass ecosystems as a globally significant carbon stock. Nat. Geosci 5, 505–509. doi: 10.1016/j.aquabot.2003.10.003
Frederiksen M., Krause-Jensen D., Holmer M., Laursen J. S. (2004). Spatial and temporal variation in eelgrass (Zostera marina) landscapes: influence of physical setting. Aquatic Botany 78, 147–165. doi: 10.1016/j.aquabot.2003.10.003
Friedlingstein P., O’Sullivan M., Jones M. W., Andrew R. M., Gregor L., Hauck J., et al. (2022). Global carbon budget 2022. Earth Syst. Sci. Data 14, 4811–4900. doi: 10.5194/essd-14-4811-2022
Harris D., Horwáth W. R., Van Kessel C. (2001). Acid fumigation of soils to remove carbonates prior to total organic carbon or CARBON-13 isotopic analysis. Soil Sci. Soc Am. J. 65, 1853–1856. doi: 10.2136/sssaj2001.1853
Hedges J. I., Stern J. H. (1984). Carbon and nitrogen determinations of carbonate-containing solids1. Limnol. Oceanogr. 29, 657–663. doi: 10.4319/lo.1984.29.3.0657
Hendriks I., Sintes T., Bouma T., Duarte C. (2008). Experimental assessment and modeling evaluation of the effects of the seagrass Posidonia oceanica on flow and particle trapping. Mar. Ecol. Prog. Ser. 356, 163–173. doi: 10.3354/meps07316
Holmer M., Baden S., Boström C., Moksnes P.-O. (2009). Regional variation in eelgrass (Zostera marina) morphology, production and stable sulfur isotopic composition along the Baltic Sea and Skagerrak coasts. Aquat. Bot. 91, 303–310. doi: 10.1016/j.aquabot.2009.08.004
Jacquemont J., Blasiak R., Le Cam C., Le Gouellec M., Claudet J. (2022). Ocean conservation boosts climate change mitigation and adaptation. One Earth 5, 1126–1138. doi: 10.1016/j.oneear.2022.09.002
Jankowska E., Michel L. N., Zaborska A., Włodarska-Kowalczuk M. (2016). Sediment carbon sink in low-density temperate eelgrass meadows (Baltic Sea). J. Geophys. Res. Biogeosci. 121, 2918–2934. doi: 10.1002/2016JG003424
Kahma T. I., Karlson A. M. L., Liénart C., Mörth C.-M., Humborg C., Norkko A., et al. (2021). Food-web comparisons between two shallow vegetated habitat types in the Baltic Sea. Mar. Environ. Res. 169, 105402. doi: 10.1016/j.marenvres.2021.105402
Kahma T. I., Karlson A. M. L., Sun X., Mörth C.-M., Humborg C., Norkko A., et al. (2020). Macroalgae fuels coastal soft-sediment macrofauna: A triple-isotope approach across spatial scales. Mar. Environ. Res. 162, 105163. doi: 10.1016/j.marenvres.2020.105163
Kennedy H., Beggins J., Duarte C. M., Fourqurean J. W., Holmer M., Marbà N., et al. (2010). Seagrass sediments as a global carbon sink: Isotopic constraints. Global Biogeochem. Cycles 24, n/a–n/a. doi: 10.1029/2010GB003848
Kindeberg T., Röhr E., Moksnes P.-O., Boström C., Holmer M. (2019). Variation of carbon contents in eelgrass (Zostera marina) sediments implied from depth profiles. Biol. Lett. 15, 20180831. doi: 10.1098/rsbl.2018.0831
Koch E., Gust G. (1999). Water flow in tide- and wave-dominated beds of the seagrass Thalassia testudinum. Mar. Ecol. Prog. Ser. 184, 63–72. doi: 10.3354/meps184063
Komada T., Anderson M. R., Dorfmeier C. L. (2008). Carbonate removal from coastal sediments for the determination of organic carbon and its isotopic signatures, δ 13 C and Δ 14 C: comparison of fumigation and direct acidification by hydrochloric acid: Carbonate removal from coastal sediments. Limnol. Oceanogr. Methods 6, 254–262. doi: 10.4319/lom.2008.6.254
Krause-Jensen D., Gundersen H., Björk M., Gullström M., Dahl M., Asplund M. E., et al. (2022). Nordic blue carbon ecosystems: Status and outlook. Front. Mar. Sci. 9. doi: 10.3389/fmars.2022.847544
Lavery P. S., Mateo M.-Á., Serrano O., Rozaimi M. (2013). Variability in the carbon storage of seagrass habitats and its implications for global estimates of blue carbon ecosystem service. PloS One 8, e73748. doi: 10.1371/journal.pone.0073748
Lehmann M. F., Bernasconi S. M., Barbieri A., McKenzie J. A. (2002). Preservation of organic matter and alteration of its carbon and nitrogen isotope composition during simulated and in situ early sedimentary diagenesis. Geochimica Cosmochimica Acta 66, 3573–3584. doi: 10.1016/S0016-7037(02)00968-7
Macreadie P. I., Anton A., Raven J. A., Beaumont N., Connolly R. M., Friess D. A., et al. (2019). The future of Blue Carbon science. Nat. Commun. 10, 3998. doi: 10.1038/s41467-019-11693-w
Mazarrasa I., Lavery P., Duarte C. M., Lafratta A., Lovelock C. E., Macreadie P. I., et al. (2021). Factors determining seagrass Blue Carbon across bioregions and geomorphologies. Glob. Biogeochem. Cycles 35 (6), e2021GB006935. doi: 10.1029/2021GB006935
McKenzie L. J., Nordlund L. M., Jones B. L., Cullen-Unsworth L. C., Roelfsema C., Unsworth R. K. F. (2020). The global distribution of seagrass meadows. Environ. Res. Lett. 15, 074041. doi: 10.1088/1748-9326/ab7d06
Moksnes P., Röhr M. E., Holmer M., Eklöf J. S., Eriander L., Infantes E., et al. (2021). Major impacts and societal costs of seagrass loss on sediment carbon and nitrogen stocks. Ecosphere 12(7):e03658. doi: 10.1002/ecs2.3658
Nellemann C., Corcoran E., Duarte C. M., Valdés L., DeYoung C., Fonseca L., et al. (2009). Blue Carbon: The Role of Healthy Oceans in Binding Carbon (Arendal, Norway: United Nations Environment Programme, GRID-Arendal). Available at: https://portals.iucn.org/library/sites/library/files/documents/2009-052.pdf.
Nyqvist A., André C., Gullström M., Baden S. P., Åberg P. (2009). Dynamics of seagrass meadows on the Swedish Skagerrak Coast. AMBIO: A J. Hum. Environ. 38, 85–88. doi: 10.1579/0044-7447-38.2.85
Oreska M. P. J., McGlathery K. J., Porter J. H. (2017). Seagrass blue carbon spatial patterns at the meadow-scale. PloS One 12, e0176630. doi: 10.1371/journal.pone.0176630
Phillips D. L., Gregg J. W. (2001). Uncertainty in source partitioning using stable isotopes. Oecologia 127, 171–179. doi: 10.1007/s004420000578
Ramnarine R., Voroney R. P., Wagner-Riddle C., Dunfield K. E. (2011). Carbonate removal by acid fumigation for measuring the δ 13 C of soil organic carbon. Can. J. Soil. Sci. 91, 247–250. doi: 10.4141/cjss10066
Ricart A., Dalmau A., Pérez M., Romero J. (2015). Effects of landscape configuration on the exchange of materials in seagrass ecosystems. Mar. Ecol. Prog. Ser. 532, 89–100. doi: 10.3354/meps11384
Rodger Harvey H., Tuttle J. H., Tyler Bell J. (1995). Kinetics of phytoplankton decay during simulated sedimentation: Changes in biochemical composition and microbial activity under oxic and anoxic conditions. Geochimica Cosmochimica Acta 59, 3367–3377. doi: 10.1016/0016-7037(95)00217-N
Röhr M. E., Boström C., Canal-Vergés P., Holmer M. (2016). Blue carbon stocks in Baltic Sea eelgrass (Zostera marina) meadows. Biogeosciences 13, 6139–6153. doi: 10.5194/bg-13-6139-2016
Röhr M. E., Holmer M., Baum J. K., Björk M., Boyer K., Chin D., et al. (2018). Blue carbon storage capacity of temperate eelgrass (Zostera marina) meadows. Global Biogeochem. Cycles 32, 1457–1475. doi: 10.1029/2018GB005941
Salo T., Pedersen M. F., Boström C. (2014). Population specific salinity tolerance in eelgrass (Zostera marina). J. Exp. Mar. Biol. Ecol. 461, 425–429. doi: 10.1016/j.jembe.2014.09.010
Santos I. R., Hatje V., Serrano O., Bastviken D., Krause-Jensen D. (2022). Carbon sequestration in aquatic ecosystems: Recent advances and challenges. Limnol Oceanogr 67: S1–S5. doi: 10.1002/lno.12268
Schlacher T. A., Connolly R. M. (2014). Effects of acid treatment on carbon and nitrogen stable isotope ratios in ecological samples: a review and synthesis. Methods Ecol. Evol. 5, 541–550. doi: 10.1111/2041-210X.12183
Serrano O., Lavery P. S., Duarte C. M., Kendrick G. A., Calafat A., York P. H., et al. (2016). Can mud (silt and clay) concentration be used to predict soil organic carbon content within seagrass ecosystems? Biogeosciences 13, 4915–4926. doi: 10.5194/bg-13-4915-2016
Short F., Carruthers T., Dennison W., Waycott M. (2007). Global seagrass distribution and diversity: A bioregional model. J. Exp. Mar. Biol. Ecol. 350, 3–20. doi: 10.1016/j.jembe.2007.06.012
Stevenson A., Corcora Ó, Hukriede W., Schubert P. R., Reusch T. B. H. (2022). Substantial seagrass blue carbon pools in the southwestern Baltic Sea include relics of terrestrial peatlands. Front. Mar. Sci. 9. doi: 10.3389/fmars.2022.949101
Wilson A. M., Huettel M., Klein S. (2008). Grain size and depositional environment as predictors of permeability in coastal marine sands. Estuarine Coast. Shelf Sci. 80, 193–199. doi: 10.1016/j.ecss.2008.06.011
Keywords: Blue carbon, coastal biogeochemistry, carbon sequestration, carbon stocks, Zostera marina, Baltic Sea
Citation: Billman M, Santos IR and Jahnke M (2023) Small carbon stocks in sediments of Baltic Sea eelgrass meadows. Front. Mar. Sci. 10:1219708. doi: 10.3389/fmars.2023.1219708
Received: 09 May 2023; Accepted: 14 July 2023;
Published: 16 August 2023.
Edited by:
Nicholas David Ward, Pacific Northwest National Laboratory (DOE), United StatesReviewed by:
Lijun Cui, South China Sea Institute of Oceanology (CAS), ChinaCopyright © 2023 Billman, Santos and Jahnke. This is an open-access article distributed under the terms of the Creative Commons Attribution License (CC BY). The use, distribution or reproduction in other forums is permitted, provided the original author(s) and the copyright owner(s) are credited and that the original publication in this journal is cited, in accordance with accepted academic practice. No use, distribution or reproduction is permitted which does not comply with these terms.
*Correspondence: Maja Billman, Z3VzbWFqYWJpQHN0dWRlbnQuZ3Uuc2U=; bWFqYWJpbGxtYW5AZ21haWwuY29t
†These authors share last authorship
Disclaimer: All claims expressed in this article are solely those of the authors and do not necessarily represent those of their affiliated organizations, or those of the publisher, the editors and the reviewers. Any product that may be evaluated in this article or claim that may be made by its manufacturer is not guaranteed or endorsed by the publisher.
Research integrity at Frontiers
Learn more about the work of our research integrity team to safeguard the quality of each article we publish.