
94% of researchers rate our articles as excellent or good
Learn more about the work of our research integrity team to safeguard the quality of each article we publish.
Find out more
ORIGINAL RESEARCH article
Front. Mar. Sci. , 05 July 2023
Sec. Marine Fisheries, Aquaculture and Living Resources
Volume 10 - 2023 | https://doi.org/10.3389/fmars.2023.1216488
 Gabriel R. A. Carneiro1Constanza Opazo2Gustavo Ramalho Cardoso Do Santos1
 Henrique Marcelo Gualberto Pereira1
 Gustavo Monnerat3,4
 Rafael Opazo2*
Introduction: The influence of intestinal microbiota, particularly lactic-acid bacteria, on digestion and nutrient metabolic activities has been extensively studied. In this research, we investigated the effects of supplementing the feed of rainbow trout (O. mykiss) with P. acidilactici or L. lactis probiotics. A Control group without probiotic supplementation was also included. The study aimed to evaluate growth, feed conversion indices, free amino acid levels in serum and feces, and the relative gene expression of amino acid solute carrier transporters (SLC).
Methods: Rainbow trout weighing 73.9±10 g were fed with a basal commercial diet supplemented with mono-strains of P. acidilactici or L. lactis at a dosage of 5 x 10⁸ CFU per gram of feed for 60 days. The trout were reared in 100-liter tanks with independent closed recirculation systems, with a water replacement rate of 80% of the total volume daily and a controlled temperature of 15 ± 0.3 °C. The proximate composition of the basal diet consisted of crude protein (49.8%), fat (32.1%), fiber (1.31%), ash (13%), and moisture (8.3%) on a dry matter basis. The diet was provided at a rate of 2% of bodyweight per day.
Results: No significant differences (p > 0.05) were observed in growth and feed conversion indices between the experimental groups. However, significant differences in free amino acid levels in feces and serum samples (p ≤ 0.05) were observed. The P. acidilactici group exhibited significantly higher levels of glutamate, lysine, proline, and tyrosine in feces samples, and higher levels of arginine, iso/leucine, phenylalanine, proline, serine, threonine, and valine in serum samples compared to the Control group. Additionally, the supplemented probiotic groups showed significant downregulation (p ≤ 0.05) of theslc6a19 and slc7a9 genes, which encode transporters for neutral and cationic amino acids.
Discussion: The autochthonous rainbow trout strain, P. acidilactici, demonstrated more pronounced effects on amino acid levels in feces and serum compared to the non-autochthonous L. lactis strain. However, the increased amino acid levels, particularly in the serum, resulting from P. acidilactici supplementation, did not lead to improved trout growth or feed conversion. Nonetheless, lactic-acid bacteria supplementation induced measurable metabolic effects, as evidenced by elevated levels of specific amino acids in the serum and feces.
Future research should focus on evaluating these probiotic effects using specialized diets and considering the observed metabolic effects in this study.
Cell proteins have structural, enzymatic, and signaling functions in organisms and represent 16–21% of the fish mass (Ahmed et al., 2022; Alberts et al., 2022). Given these critical functions, an exogenous supply of protein in animals is necessary. Aquaculture fish species have a specific protein requirement that must be supplied through aquafeeds (National Research, 2011a; Teles et al., 2020). Salmonid species in particular, such as rainbow trout (Oncorhynchus mykiss), require 35–50% wet matter protein in aquafeeds (National Research, 2011a; Teles et al., 2020), a much higher requirement compared to pigs and poultry (estimated at 19–24% wet matter) (Bowen, 1987).
Proteins are composed of chains of α-amino acids (α-AAs) linked by peptide bonds (Wu, 2013). α-AAs are organic molecules that contain an amino group and a carboxylic group attached to the same carbon; however, they have different side chains (R groups) that give different chemical properties and ionic states (Wu, 2013). α-AAs that have identification codons in nucleic acids (DNA-RNA) are classified as proteinogenic or primary (Ahluwalia et al., 2022; Alberts et al., 2022). There are 20 classic primary α-AAs (excluding selenocysteine and pyrrolysine), which in turn can be classified concerning their nutritional importance as essential or non-essential (Wu, 2013; Ahluwalia et al., 2022). Essential α-AAs cannot be synthesized de novo by fish or their synthesis rate is slower than the protein synthesis rate, thereby they have to supply by diet (National Research, 2011a; Mai et al., 2022). For rainbow trout, the essential α-AAs are arginine, lysine, leucine, isoleucine, valine, threonine, phenylalanine, tyrosine, methionine, cysteine, tryptophan, and histidine (Ogino, 1980). Thus, the non-essential α-AAs for rainbow trout are glycine, alanine, proline, serine, asparagine, glutamine, glutamic acid, and aspartic acid. Hence, animal protein requirements are α-AA requirements, not only in quantity but also proportion, especially to the essential α-AAs (National Research, 2011a).
A wide variety of protein ingredients of animal or vegetable origin are used in aquafeed formulations (Hardy and Brezas, 2022). In salmonid fish, these ingredients’ proteins must be digested into basic units (i.e., α-AAs or tri-di peptides) for enterocyte absorption mainly in the proximal intestine (Dabrowski and Dabrowska, 1981; Bakke et al., 2010; Debnath and Saikia, 2021). This digestion is mediated by a broad enzyme complex secreted in different segments of the digestive tract (Bakke et al., 2010).
The intestinal absorption of α-AAs or tri-di peptides itself is mediated by transporters belonging to the superfamily of genes that code for solute carrier proteins (SLCs) (Poncet and Taylor, 2013; Zhang et al., 2019; Pizzagalli et al., 2021). Currently, 458 SLCs classified into 65 gene families have been described in humans (Pizzagalli et al., 2021); successively, 338 SLCs classified into 50 families have been described in fish (Verri et al., 2012). Each SLC can transport different α-AAs but is generally associated with the same ionic state (neutral, cationic, or anionic). Nevertheless, each transporter has a different α-AA specificity within each ionic state (Bröer, 2008; Gauthier-Coles et al., 2021). Tri-di peptides also have specific transporters, the best-known being PepT1, which has been found in fish (Verri et al., 2010). After α-AAs and oligopeptides are absorbed, they pass through the blood capillaries of the intestinal villi, which later form the portal system that carries these nutrients to the liver (Karlsson et al., 2006).
The salmon industry has had to replace ingredients such as fishmeal, which is considered a “gold standard” ingredient for the formulation of aquafeeds (Turchini et al., 2019), with other ingredients, some of which are of vegetable origin, such as soybean meal. However, these alternative ingredients have lower nutrient digestibility, including proteins (Glencross et al., 2004; Sørensen et al., 2021). Considering the replacement of these ingredients, the apparent digestibility of dry matter in these diets is approximately 63% (Sørensen et al., 2021), with a significant amount of protein organic matter eliminated as waste in the water (Buschmann et al., 1996; Wang et al., 2013). Organic matter released into the water becomes a stressor in aquatic ecosystems, which increases the risk of aquatic ecosystem eutrophication (Streicher et al., 2021). In addition to the environmental impact, it is appropriate to consider that the organic matter wasted in the water are nutrients that represent a fish farming economic loss (Hua et al., 2019).
Among the factors that could contribute to nutrient digestion, absorption, and metabolization in mammals and fish, the microbiota has been frequently discussed (Ray et al., 2012; Portune et al., 2016; Chapagain et al., 2019; Debnath and Saikia, 2021). Researchers have especially described lactic-acid bacteria within the microbiota of salmonid fish (Ringø and Gatesoupe, 1998; Merrifield et al., 2010; Navarrete et al., 2010; Opazo et al., 2016; Villasante et al., 2019), this bacterial group has attractive qualities for probiotic use in aquaculture (Amenyogbe et al., 2020; Ringø et al., 2020; De Fátima Marques De Mesquita et al., 2021; Sumon et al., 2022). Probiotics in aquaculture have been proposed based on two main objectives: i) to stimulate the immune system or secretion of bacteriocins to prevent diseases (Pérez-Sánchez et al., 2011; Ramos et al., 2015; Araújo et al., 2016; Al-Hisnawi et al., 2019) and ii) to improve the growth or feed conversion performance in fish farming (Giannenas et al., 2015; Akbari Nargesi et al., 2020; Ali et al., 2020; Yeganeh et al., 2021).
The present study evaluated the effects of dietary supplementation with mono-strains of Pedicoccus acidilacticiti or Lactococcus lactis on rainbow trout (O. mykkis) for 60 days. This study examined various productive parameters including weight gain, length gain, specific growth rate (SGR), Fulton’s condition factor (K), feed conversion ratio (FCR), and protein efficiency ratio (PER). Additionally, the study analyzed the levels of free amino acids in both feces and serum. Furthermore, the expression of genes encoding amino acid transporters in the proximal intestinal tissue, such as slc6a19, slc7a9, slc15a1, and slc36a1, was evaluated at the intestinal level. It is noteworthy that the P. acilacticity strain was isolate from rainbow trout intestine, making it autochthonous, while the L. lactis strain had non-autochthonous origins.
Fifty-four rainbow trout (Oncorhynchus mykiss) with an average weight of 73.9 ± 10.3 g were obtained from a Rio Blanco trout farm located in the Andes district of Chile’s V region. The specimens were transported to the Instituto de Nutrición y Tecnología de los Alimentos (INTA) of the Universidad de Chile, as authorized by the Chilean National Fisheries and Aquaculture Service (Sernapesca) under movement health certificate no. 262119.
Initially, the trout were randomly distributed to nine 100-liter fiberglass experimental tanks (six fish per tank). The trout were acclimatized for 7 days to the experimental conditions without any manipulation. On day 8, an EM4305 microchip (Star, Shanghai, China) was implanted in each specimen in the subcutaneous area under the dorsal fin for tracking purposes. Subsequently, the trout were kept for another 7 days without any further manipulation. The tanks were divided into three experimental groups of 18 specimens each. Group 1 received a supplement of Pediococcus acidilactici (GenBank: OP806385) and Group 2 a supplement of Lactococcus lactis (GenBank: OP806386), each for 60 days. Both probiotic strains were mixed and administered with aquafeed at doses of 5 × 10⁸ CFU g-1. The study also included a control group that did not receive probiotic supplementation (Control Group). The study mortality was 5.5%, which corresponded to one fish from each experimental group; hence, the final number of trout per experimental group was 17 (n = 17).
Each tank featured an independent recirculation system containing one filter and heat exchanger to prevent the exchange of water, feces, and probiotic strains among the three groups’ water systems. The water was regulated at a temperature of 15 ± 0.3°C. Daily, 80% of the system water was changed to maintain an ammonium level below 1 ppm. The tank water’s pH, oxygen, and ammonia levels were evaluated three times per week. The tanks’ room provided a photoperiod of 14 h light/10 h dark.
The trout were fed a PW250_A80 aquafeed (Biomar, Chile) at a rate of 2% of the specimens’ average body weight. Supplementary Table 1 presents the chemical proximal analysis of the extruded commercial aquafeed. Aquafeed crude protein level of aquafeed was analyzed using the Kjeldahl method (AOAC Offical Method 976.05, 2023), to estimate the protein efficiency ratio (PER). The daily food rations were divided into three equivalent portions administered every 3 hours per day. In cases of trout from a specific tank showing lower appetite, the portion of feed was reduced, and this difference was subtracted from the total daily ration to record feed consumption per tank in detail. The weight and length of each trout were obtained before the start of probiotic supplementation (T0), after 30 days of probiotic supplementation (T30), and after 60 days of probiotic supplementation (T60). Due to the chip implanted in each fish, it was possible to assess these measurements individually throughout the study.
At the end of the supplementation period, six specimens from each experimental group were randomly selected, the euthanasia was performed using 30 mg L-1 tricaine methanesulfonate (Virbac, Chile) for 10 min. Blood, feces, and proximal intestine tissue samples were obtained from the trout, which had been fasting for 12 h prior. Approximately 1 mL of blood was collected via puncture of the caudal vein and incubated for 30 min at 25°C for clotting, then centrifuged (Thermo Scientific, USA) at 2,000 × g for 10 min. The resulting blood serum was collected and transferred to a clean 1.5-mL polypropylene tube. The proximal intestine samples were obtained via dissection; Supplementary Figure 1 shows the specific proximal intestinal segment used for feces and tissue sampling. Proximal intestine tissue was first cleaned with sterile saline serum (NaCl 8.0 g, KCl 0.2 g, Na2HPO4 1.44 g, KH2PO4 0.24 g, and water q.s. 1 L), then placed in polypropylene tubes with RNAlater™ (Thermo Scientific, USA). Each fecal sample for amino acid analysis was collected in a 1.5 mL sterile polypropylene tube. Additionally, approximately 800 mg of each fecal sample was placed in a sterile 2.0 mL polypropylene tube and weighed. Next, 800 µL of sterile saline solution (previously described) was added. The feces were resuspended by pipetting and serially diluted four times at a factor of 10 in saline solution. Dilutions of 10-2, 10-3, and 10-4 were plated in triplicate on MRS agar medium and incubated for 48 h at 20°C. The number of colony-forming units (CFU) per plate was counted. All samples of serum, tissue, or fecal for amino acid assessment were stored at -80°C until analysis.
The trout handling procedures and euthanasia were approved by the Comité Institucional de Cuidado y Uso de Animales of the Universidad de Chile (protocol certificate no. 19323-INT-UCH). All fish management procedures were carried out under the precepts and bioethical aspects associated with the management and care proposed by the Guide for the Care and Use of Laboratory Animals (National Research, 2011b).
Through the data collected during the experiment, the following growth and feed conversion indices were calculated:
Weight gain (g) = Wf (g) – Wi (g)
Standard length gain (cm) = Lf (cm) - Li (cm)
SGR = x 100 (Hopkins, 1992)
Fulton’s condition factor (K) = x 100 (Froese, 2006)
FCR = (Charles Bai et al., 2022)
PER = (Charles Bai et al., 2022)
where Wf is the final wet weight in grams, Wi is the initial wet weight in grams, Lf is the final standard length in centimeters, and Li is the initial standard length in centimeters.
The Pediococcus acidilactici probiotic strain (GenBank: OP806385) was previously isolated from the proximal intestine of rainbow trout (Oncorhynchus mykiss) while the Lactococcus lactis strain (GenBank: OP806386) was isolated from goat milk (Capra hircus). Both strains were isolated using an MRS agar medium (Merck, Germany) and incubated at 20°C (Memmert, USA). The strains were preserved in Cryobank™ cryovials (Copan innovation, USA) in a -80°C freezer.
The probiotic cultures were performed in a 250-mL Erlenmeyer flask containing 120 ml MRS broth medium (Merck, Germany) that was incubated at 20°C for 24 h in a shaking incubator (LabTech, Korea). The probiotic strain cultures were counted (number of bacteria cells/CFU per mL of culture medium) using an optical microscope (Motic, Xiamen China) and Neubauer improved chamber (Hirschmann, Germany).
Probiotics were supplemented in aquafeed at a rate of 5 × 10⁸ CFU g-1, a mixture that was prepared weekly during the study. The volume needed for each culture batch was calculated based on the count (explained previously) and in consideration of the total grams administered to each experimental group per week. Before mixing between feed and probiotics, each MRS batch was centrifuged (Thermo Scientific, USA) at 5000 × g for 10 min, and then the supernatant was resuspended in a volume of sterile physiological serum, which corresponded to approximately 4% (mL g-1). Probiotic strains were supplied to the experimental aquafeed via spraying with 3% vegetable oil added as a coating. The Control Group feed received 4% physiological serum (without lactic-acid bacteria) and 3% vegetable oil. During their period of use, probiotic-supplemented feeds and the control feed were kept refrigerated at 5°C.
Amino acids from 100-µL feces or serum samples (n = 6) were isolated using cold methanol (1:6 v/v aqueous/organic solvent) (Erben et al., 2021; Roper et al., 2022); this analysis was carried out on blind. The samples were then kept at -30°C for 15 min and centrifuged at 14,000 × g for 10 min at 4°C. The supernatants were collected and dried using a SpeedVac (Thermo Scientific, USA). The resulting metabolites were resuspended in a solution of labeled α-AAs (13C, 15N labeled at 1 nmol/mL; Cambridge Isotope Laboratories, USA) (Monnerat et al., 2019).
The α-AAs were analyzed in quadruplicate using a Thermo Q Exactive Plus mass spectrometer (Thermo Scientific, USA) via direct flow injection analysis. The mobile phase used was ACN/H2O/MeOH (2:1:1 v/v/v) at a flow rate of 50 µL min-1. The mass spectrometer was operated in Target-SIM data acquisition in positive mode. The spray voltage was set at 3.5 kV, capillary temperature at 280°C, and gas temperature at 150°C. The full scan was performed at a resolution of 70,000, AGC target of 5E5, isolation window of 1.0 m/z, maximum IT of 25 ms, and acquisition time of 2 min. The data obtained were processed using TraceFinder software (Thermo Scientific, USA). The intensity ratios of light to heavy α-AAs were calculated for each of their intensity value (L/H intensity) (Monnerat et al., 2019).
The total RNA from the trout proximal intestinal tissue samples (n = 6) was obtained using TRIzol™ (Invitrogen, USA) according to the manufacturer’s protocol. Quantification and quality of the total RNA were assessed via fluorometry using Qubit™ 4.0 (Thermo Scientific, USA) according to the manufacturer’s protocol.
Reverse transcription was performed with 1 µg total RNA using the ImProm-II™ Reverse Transcription System kit (Promega, USA) according to the manufacturer’s protocol. Four amino acids SLC transporter genes (slc6a19, slc709, slc15a1, and slc36a1) of rainbow trout were selected for relative gene expression (see Supplementary Table 2). Three genes eef1a1a (elongation factor 1 alpha 1a), rps20 (ribosomal protein S20), and ubb (ubiquitin B) were evaluated for use as reference genes, with eef1a1a ultimately selected as the reference gene.
Quantitative polymerase chain reaction was performed with 2 µL cDNA for each sample using the FastStart™ Essential DNA Green Master kit (Roche, USA) according to the manufacturer’s protocol in an AriaMx™ (Agilent, USA) Real-time PCR. The amplification program included 10 min of preincubation at 95°C, then 45 cycles of 10 s at 95°C, 15 s at 62°C, and 10 s at 72°C to finish with a melting analysis.
The relative gene expression ratio for each sample was calculated using the function proposed by Pfaffl (2001). The efficiency of the amplification curve was calculated using LinReg software (Brankatschk et al., 2012). Because Pfaffl’s formula uses the experimental control group (Cpref) as part of the calculation function, the Control Group samples were duplicated from the RNA isolation to include this group in the statistical analysis and establish instrumental variation in the relative gene expression analysis. For each relative gene expression ratio, the natural logarithm was calculated to better visualize the upregulation versus downregulation of the gene expression among the experimental groups.
Normal distributions associated with parameters, growth indices, and feed conversion performance (n = 17) were analyzed using the Shapiro–Wilk test (Mishra et al., 2019). As the indices of Fulton’s condition factor (K) and FCR did not fit a normal distribution, they were analyzed using the non-parametric Kruskal-Wallis (H) test; hence, the other indices were analyzed using one-way ANOVA (F) (Hoffman, 2019). A p-value of ≤ 0.05 was considered significant for both tests. The post hoc analysis for the parametric tests was Tukey’s HSD (HSD) and for the non-parametric tests, Dunn’s test (Z) (Kao and Green, 2008). In the post hoc test, the contrasts were considered significant with p adjusted to ≤ 0.1.
The Kruskal-Wallis (H) test was used to compare amino acid levels in the feces and blood serum samples among the experimental groups (n = 6) (Hoffman, 2019). In addition, the post hoc analysis featured Dunn’s test (Kao and Green, 2008) with significance levels of p ≤ 0.05 and p adjusted (p-adj.) to ≤ 0.1. The same statistical protocol was used to analyze the relative gene expression ratios among the experimental groups (n = 6). All statistical analyses were performed using the R statistical program (R. Core Team, 2021).
As a starting point for this study, it is appropriate to evaluate whether intervention with probiotics in the aquafeed could modulate the presence of lactic acid bacteria in the proximal intestine of trout. At the end of the supplementation period of 60 days, it was possible to isolate viable lactic-acid bacteria colonies only in the Petri dishes of experimental groups suplemented with P. acidilactici or L. lactis, which had an average count of 1.43 x 10⁵ CFU g-1, and 1.19 x 10⁴ CFU g-1, respectively. No colony forming units (CFU) were found in the dilutions analyzed in the Control group. The observed CFU per gram was approximately half the CFU per gram of the supplemented aquafeed. However, the administration method allowed viable lactic-acid bacteria colonies to be obtained from trout foregut feces.
The comparison of weight gain, length gain, and SGR distributions was not statistically significant between the experimental groups after 60 days of acid-lactic bacteria supplementation p > 0.05 (see Figures 1A–C). However, for the first 30 days of probiotic supplementation, significant differences in length gain distribution were observed between the experimental groups (F(2,48) = 4.33, p = 0.018). Post hoc analysis showed a significant group contrast between the Control Group and Group 2 (HSD = 0.61, p-adj. = 0.014); Figure 1B. The basic statistical analysis and ANOVA test analyses for these indices are shown in Supplementary Table 3.
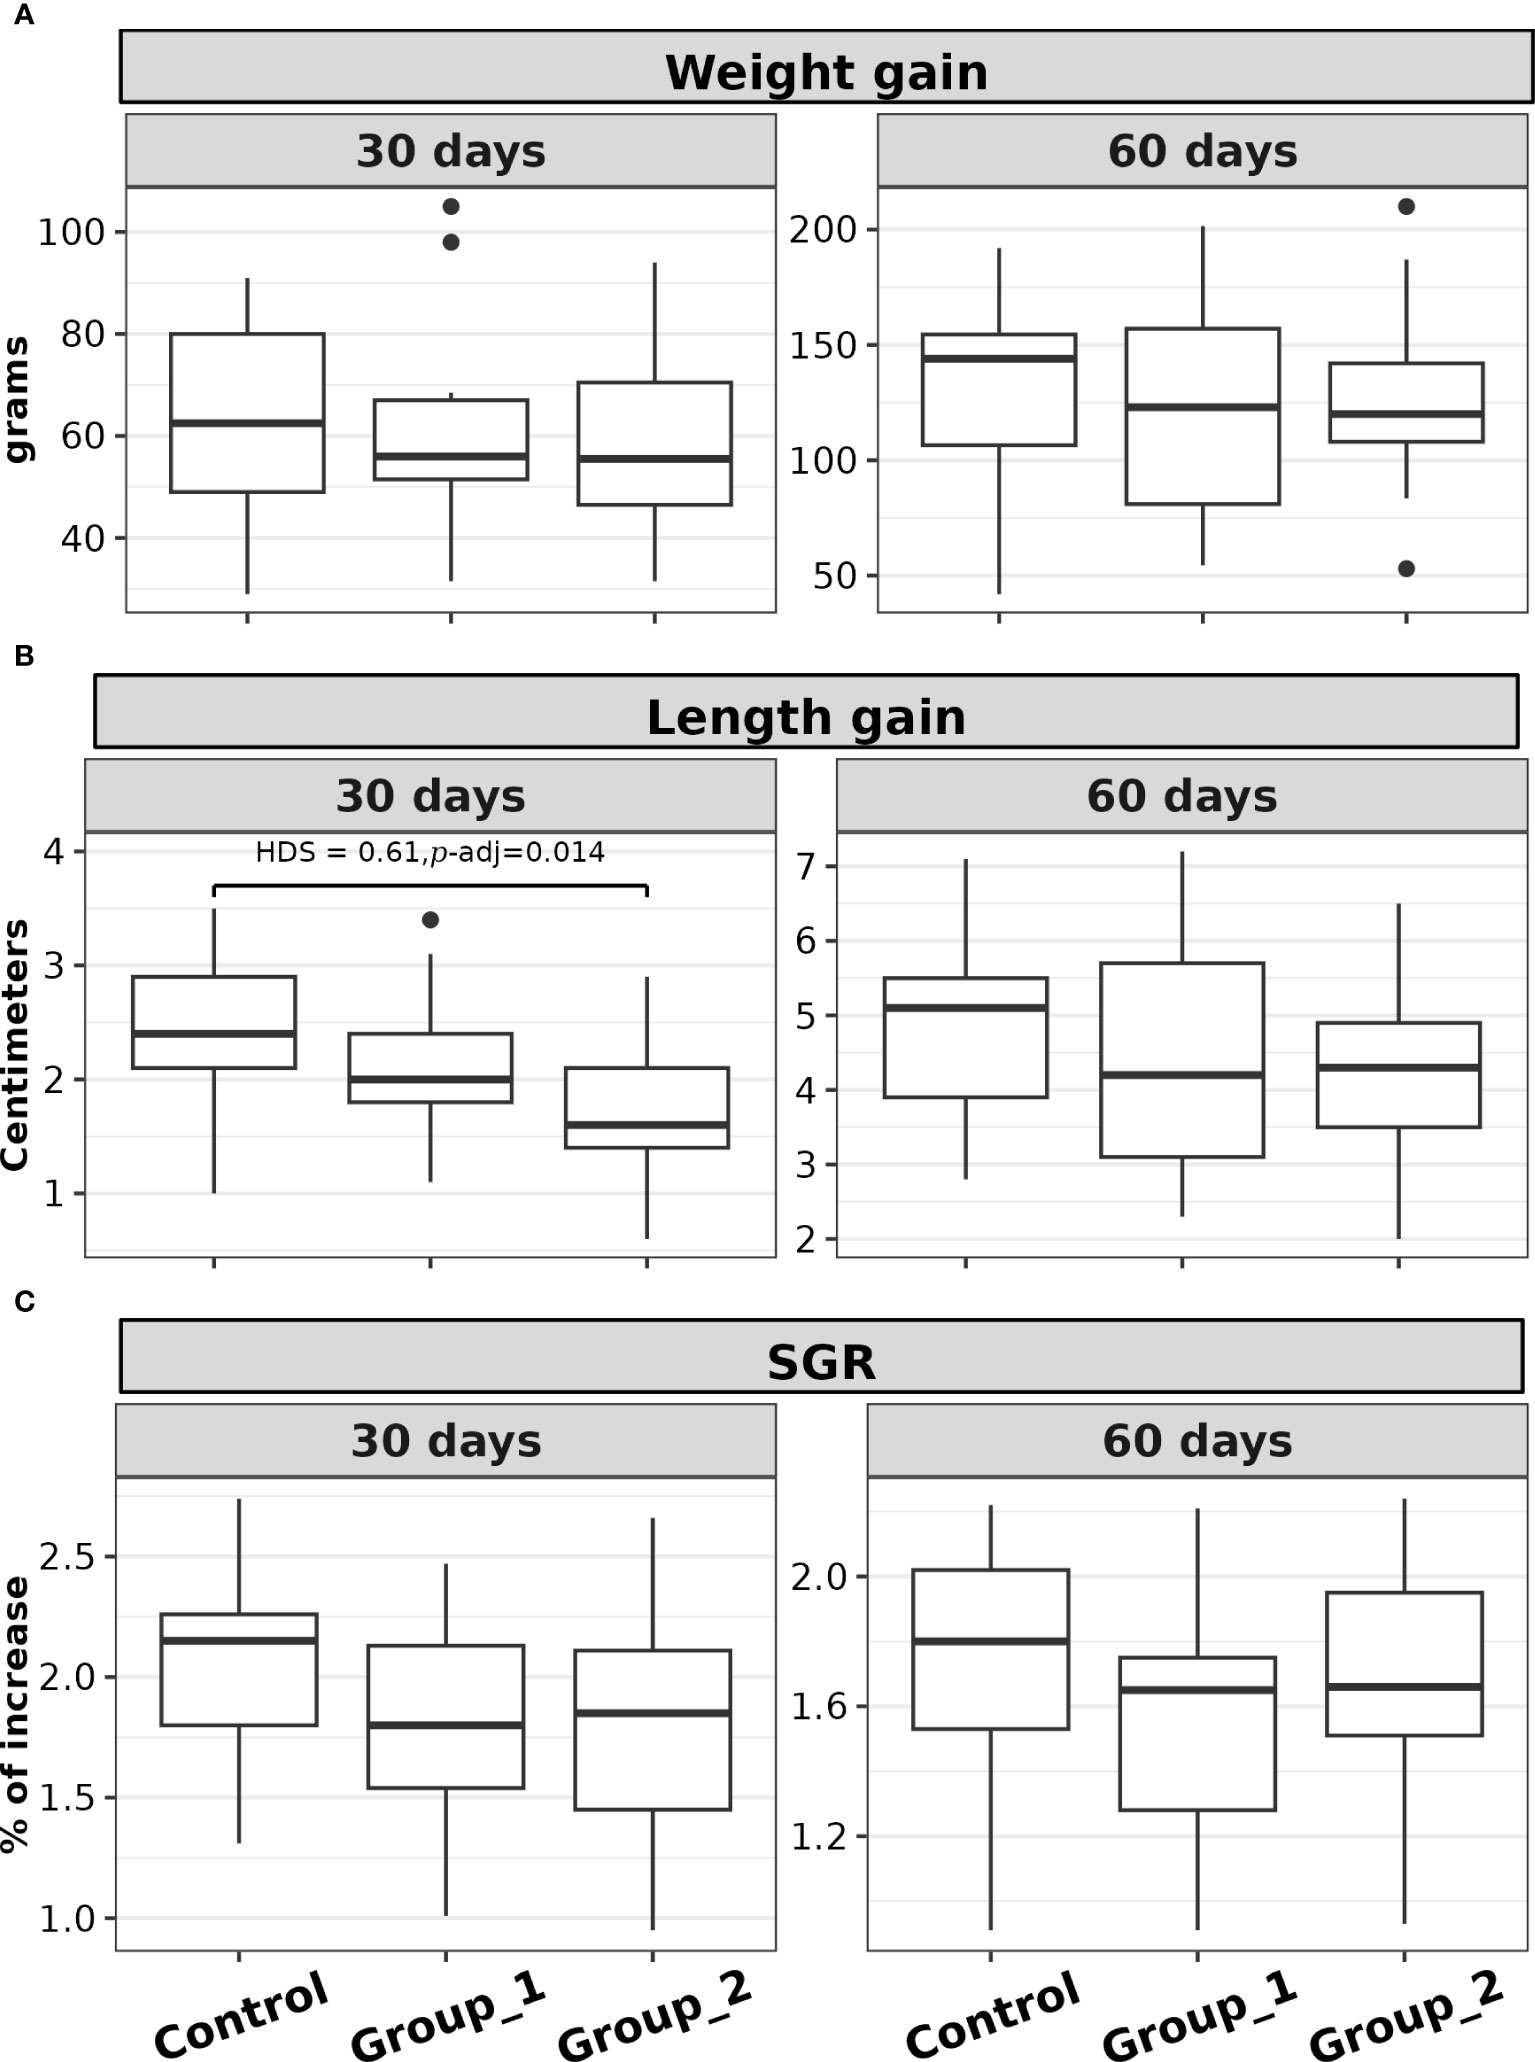
Figure 1 Box plots of the (A) weight gain, (B) length gain, and (C) SGR, of rainbow trout (O. mykiss) supplemented with P. acidilactici (Group 1) or L. lactis (Group 2) at a dosage of 5 x 10⁸ CFU g-1 for either 30 or 60 days. The Control Group did not receive any probiotic supplements. The lines indicate statistically significant differences between the experimental groups, as determined by Tukey test. The distribution differences were considered significant at p< 0.05 and p-adjusted ≤ 0.1.
The differences in the associated FCR and PER distributions were not statistically significant between the experimental groups p > 0.05. The comparison of K distributions between experimental groups was not statistically significant at any of the data collection times, p > 0.05. The basic statistical analysis and significant test analyses for these indices are shown in Supplementary Table 4.
Nevertheless, the K comparison between data collection times was statistically significant within each experimental group (Control: H(2) = 28.28, p = 7.23e-07; Group 1: H(2) = 29.53, p = 3.87e-07; Group 2: H(2) = 2.41, p = 2.41e-08). The post hoc analysis showed significant contrasts between T0 and T30 as well as T0 and T60, whereas that of T30 and T60 was not significant (see Supplementary Table 5).
The rainbow trout feces contained 17 α-AAs, of which eight are classified as essential (arginine, lysine, threonine, phenylalanine, iso/leucine, tryptophan, methionine, and valine) and nine as non-essential (asparagine, glutamine, serine, tyrosine, alanine, cystine, glycine, and proline). The basic statistical analysis of feces α-AA levels (nmol mL-1, wet basis) per experimental group are shown in Table 1. The α-AAs with the six highest concentrations in feces were phenylalanine (551 ± 500.0 nmol mL-1), iso/leucine (454.7 ± 176.2 nmol mL-1), tyrosine (348 ± 420.0 nmol mL-1), alanine (217.3 ± 90.4 nmol mL-1), glutamine (179.2 ± 78.6 nmol mL-1), and methionine (149.5 ± 54.2 nmol mL-1).
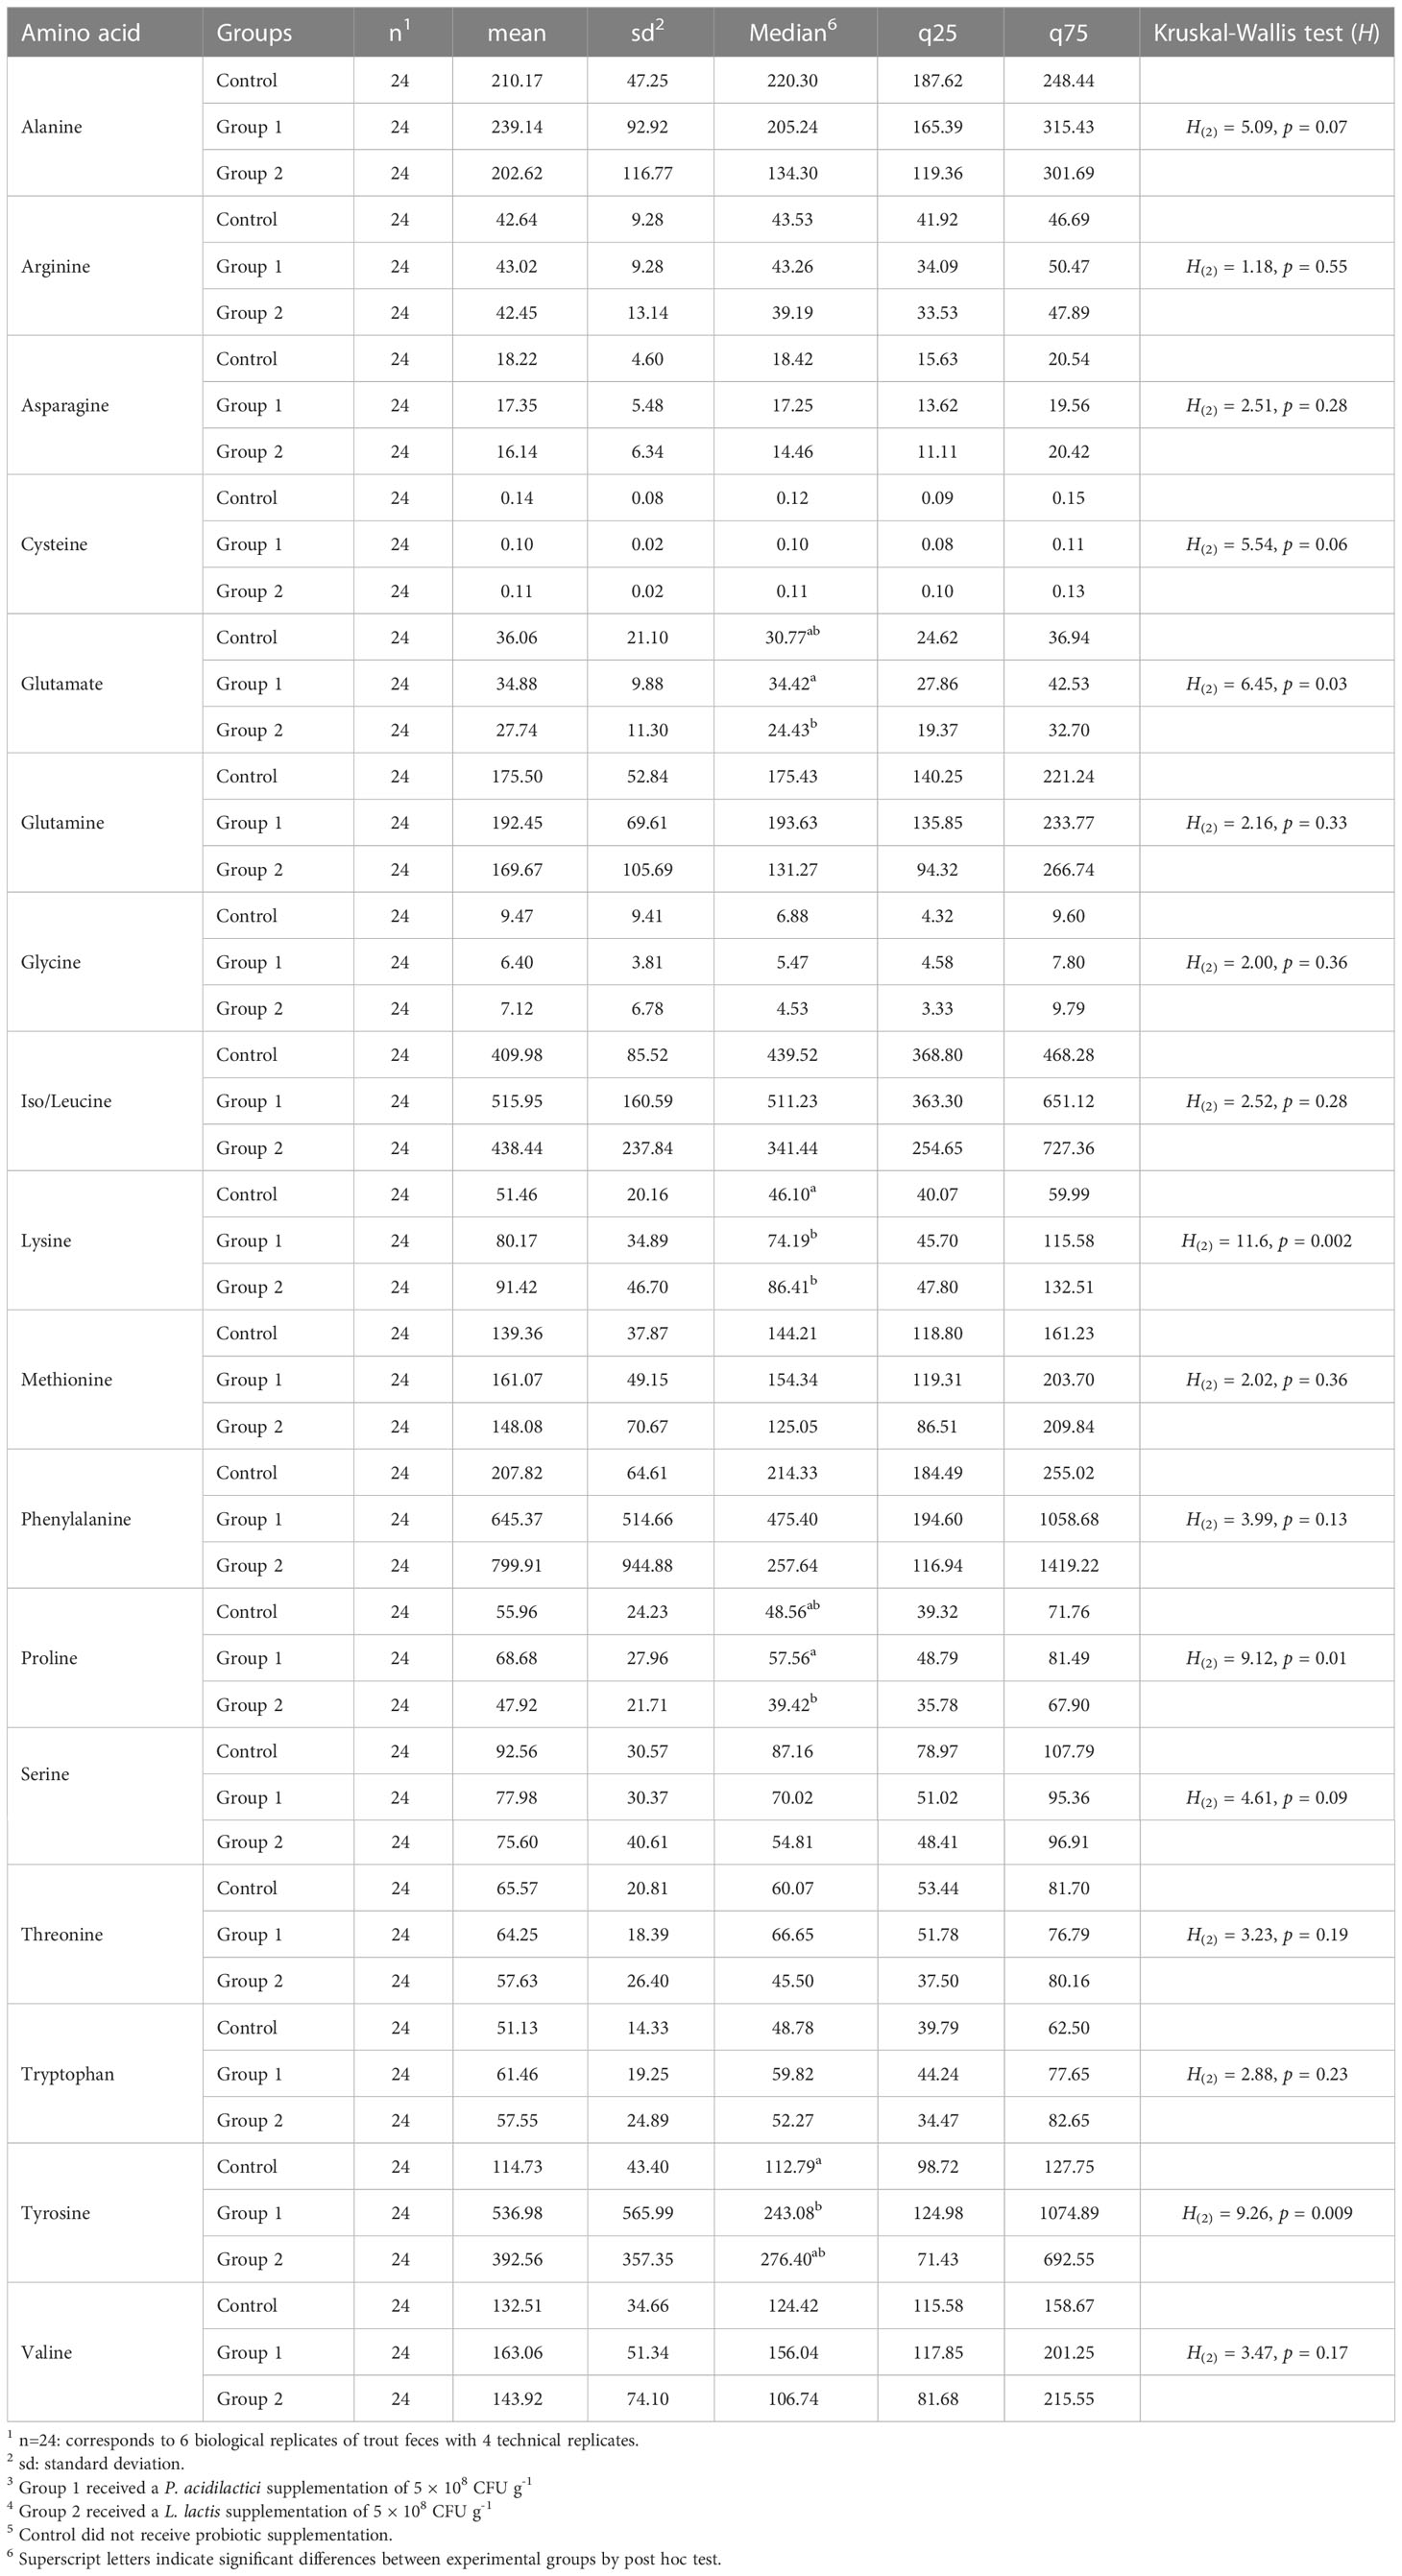
Table 1 Basic statistical analysis of free amino acid feces levels (nmol mL-1) of rainbow trout after receiving mono-strain probiotic supplementation for 60 days.
The comparison of the total sum of each amino acid level (nmol mL-1) in the feces samples did not show statistical significance between the experimental groups (H(2) = 0.36, p = 0.8). Among the 17 α-AAs identified in these samples, four exhibited statistically significant differences (p< 0.05) between the experimental groups: glutamate, lysine, proline, and tyrosine (see Table 1). Figure 2 depicts the post hoc analysis of α-AA levels in the feces samples. A significant contrast for glutamate emerged between Group 1 and Group 2 (Z = 2.51, p = 0.01, p-adj. = 0.035; Figure 2A); that for lysine was between Group 1 and the Control Group (Z = 2.55, p = 0.01, p-adj. = 0.02) and Group 2 and the Control Group (Z = 3.24, p = 0.001, p-adj. = 0.0035; Figure 2B); the significant contrast for proline was between Group 1 and Group 2 (Z = 2.99, p = 0.002, p-adj. = 0.008; Figure 2C); and the significant contrast for tyrosine emerged between Group 1 and the Control Group (Z = 3.0, p = 0.0027, p-adj. = 0.008; Figure 2D).
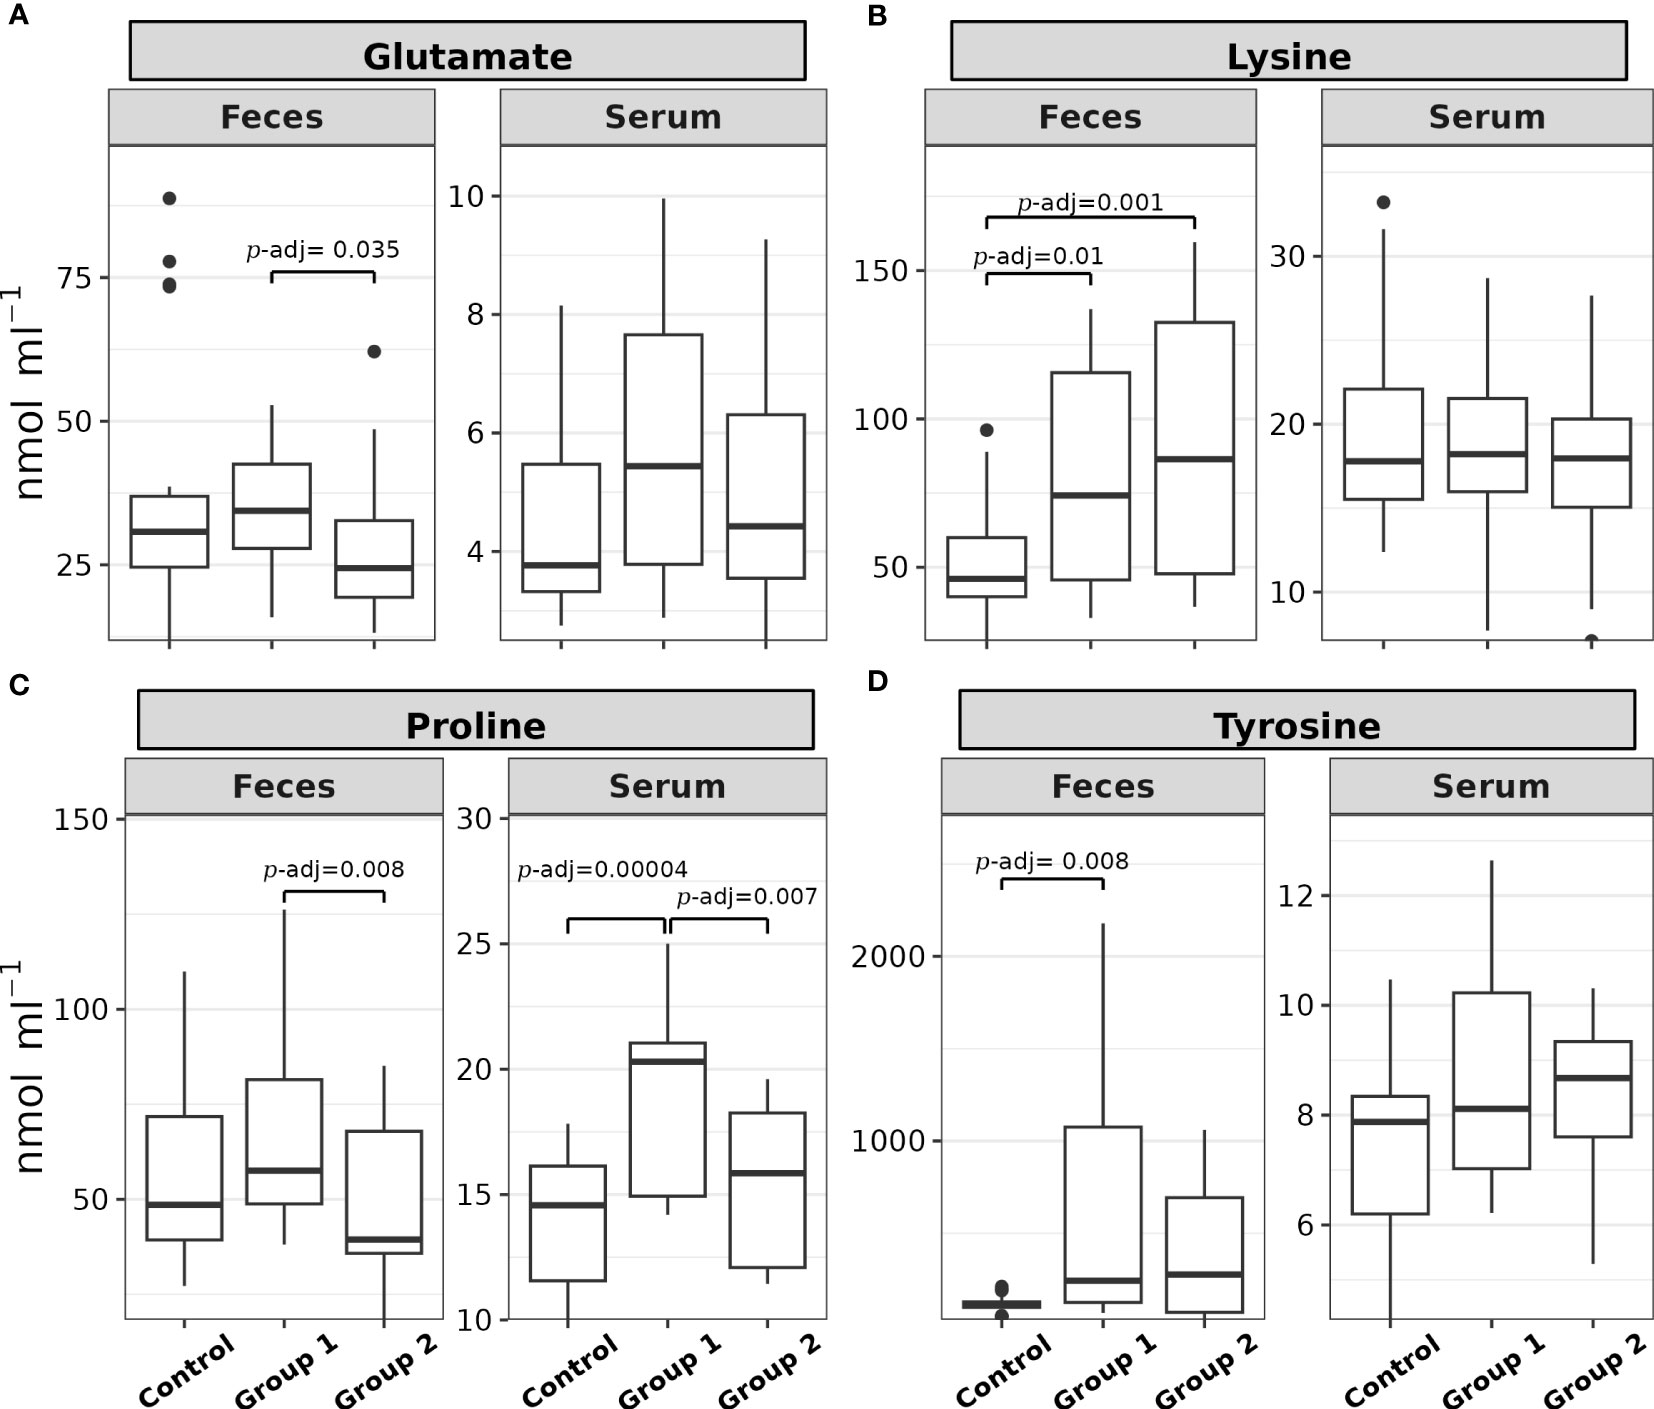
Figure 2 Box plots of the (A) glutamate, (B) lysine, (C) proline, and (D) tyrosine feces and serum levels (nmol mL-1) of rainbow trout (O. mykiss) after a P. acidilactici (Group 1) or L. lactis (Group 2) supplementation of 5x10⁸ CFU g-1 for 60 days. The Control Group did not receive a probiotic supplement. The lines show statistically significant differences between the experimental groups, as derived via Dunn’s test. The distribution differences were considered significant at p< 0.05 and p-adjusted ≤ 0.1.
The same 17 α-AAs identified in the feces samples were also identified in the rainbow trout blood serum samples. The basic statistical analysis of serum α-AA levels (nmol mL-1) for each experimental group is shown in Table 2. The α-AAs with the six highest concentrations in serum were phenylalanine (92.7 ± 21.4 nmol mL-1), valine (70.1 ± 18.7 nmol mL-1), methionine (57.9 ± 13.4 nmol mL-1), alanine (54.4 ± 10.9 nmol mL-1), iso/leucine (40.8 ± 9.1 nmol mL-1), and threonine (25.5 ± 7.5 nmol mL-1).
Comparison of the total sum of each amino acid level (nmol mL-1) in the serum was statistically significant between the experimental groups (H(2) = 6.35, p = 0.04). A significant contrast in the post hoc analysis emerged between Group 1 and the Control Group (Z = 2.43, p = 0.001, p-adj. = 0.04).
Of the 17 α-AAs identified in the serum, eight showed statistically significant differences between the experimental groups: proline, arginine, iso/leucine, phenylalanine, serine, threonine, and valine (see Table 2).
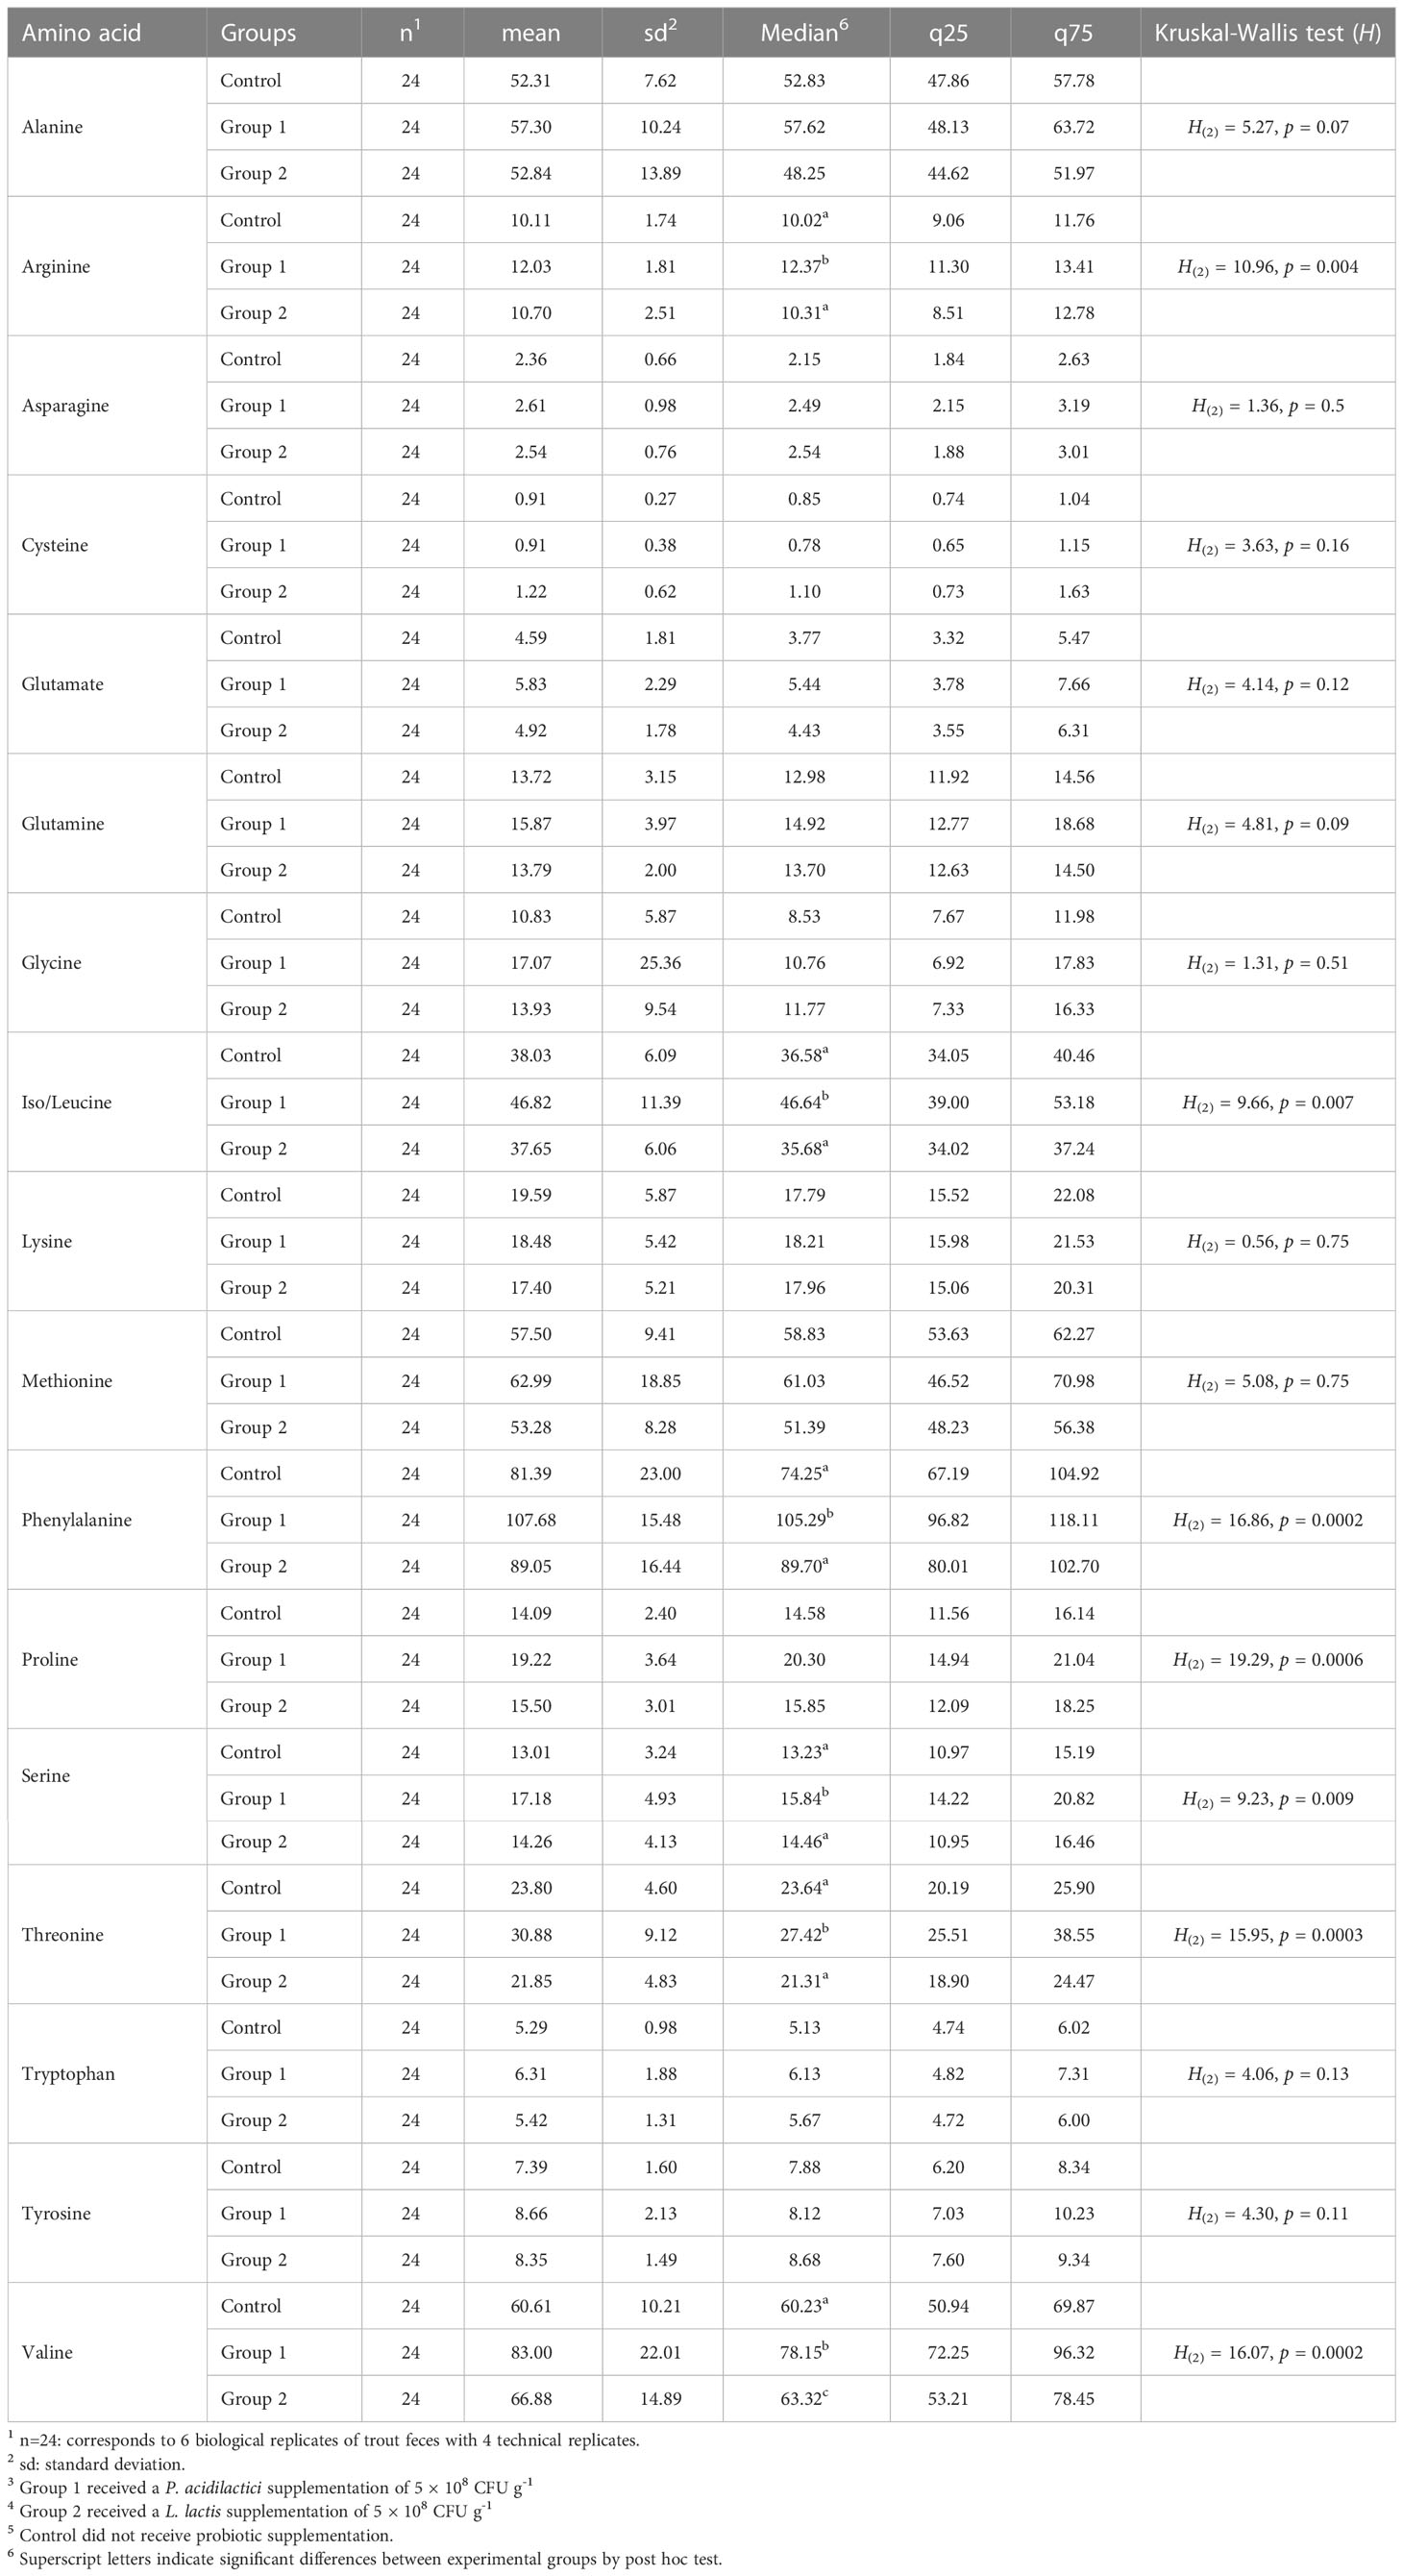
Table 2 Basic statistical analysis of free amino acid blood serum levels (nmol mL-1) of rainbow trout after receiving mono-strain probiotic supplementation for 60 days.
Proline was the only α-AA that showed statistically significant differences between the experimental groups in both the feces and blood serum matrices. Post hoc analysis of serum proline levels showed that the significant contrasts were between Group 1 and the Control Group (Z = 4.31, p = 0.0000016, p-adj. = 0.00004) and Group 1 and Group 2 (Z = 2.89, p = 0.0036, p-adj. = 0.007; Figure 2C).
Figure 3 shows the post hoc analysis of all serum α-AA levels between experimental groups, save proline. The significant contrasts for arginine were between Group 1 and the Control Group (Z = 3.23, p = 0.0012, p-adj. = 0.003) and Group 1 and Group 2 (Z = 2.24, p = 0.025, p-adj. = 0.05; Figure 3A); the significant contrasts for iso/leucine were between Group 1 and the Control Group (Z = 2.63, p = 0.008, p-adj. = 0.017) and Group 1 and Group 2 (Z = 2.75, p = 0.0059, p-adj. = 0.018; Figure 3B); the significant contrasts for phenylalanine were between Group 1 and the Control Group (Z = 3.91, p = 0.00009, p-adj. = 0.0003) and Group 1 and Group 2 (Z = 3.04, p = 0.0023, p-adj. = 0.005; Figure 3C); the significant contrasts for serine were between Group 1 and the Control Group (Z = 2.98, p = 0.0028, p-adj. = 0.008) and Group 1 and Group 2 (Z = 2.01, p = 0.044, p-adj. = 0.09; Figure 3D); the significant contrasts for threonine were between Group 1 and the Control Group (Z = 2.76, p = 0.0057, p-adj. = 0.01) and Group 1 and Group 2 (Z = 3.88, p = 0.0001, p-adj. = 0.0003; Figure 3E); and the significant contrasts for valine were between Group 1 and the Control Group (Z = 4.1, p = 0.00004, p-adj. = 0.0001), Group 2 and the Control Group (Z = 1.73, p = 0.08, p-adj. = 0.08), and Group 1 and Group 2 (Z = 2.37, p = 0.017, p-adj. = 0.035; Figure 3F).
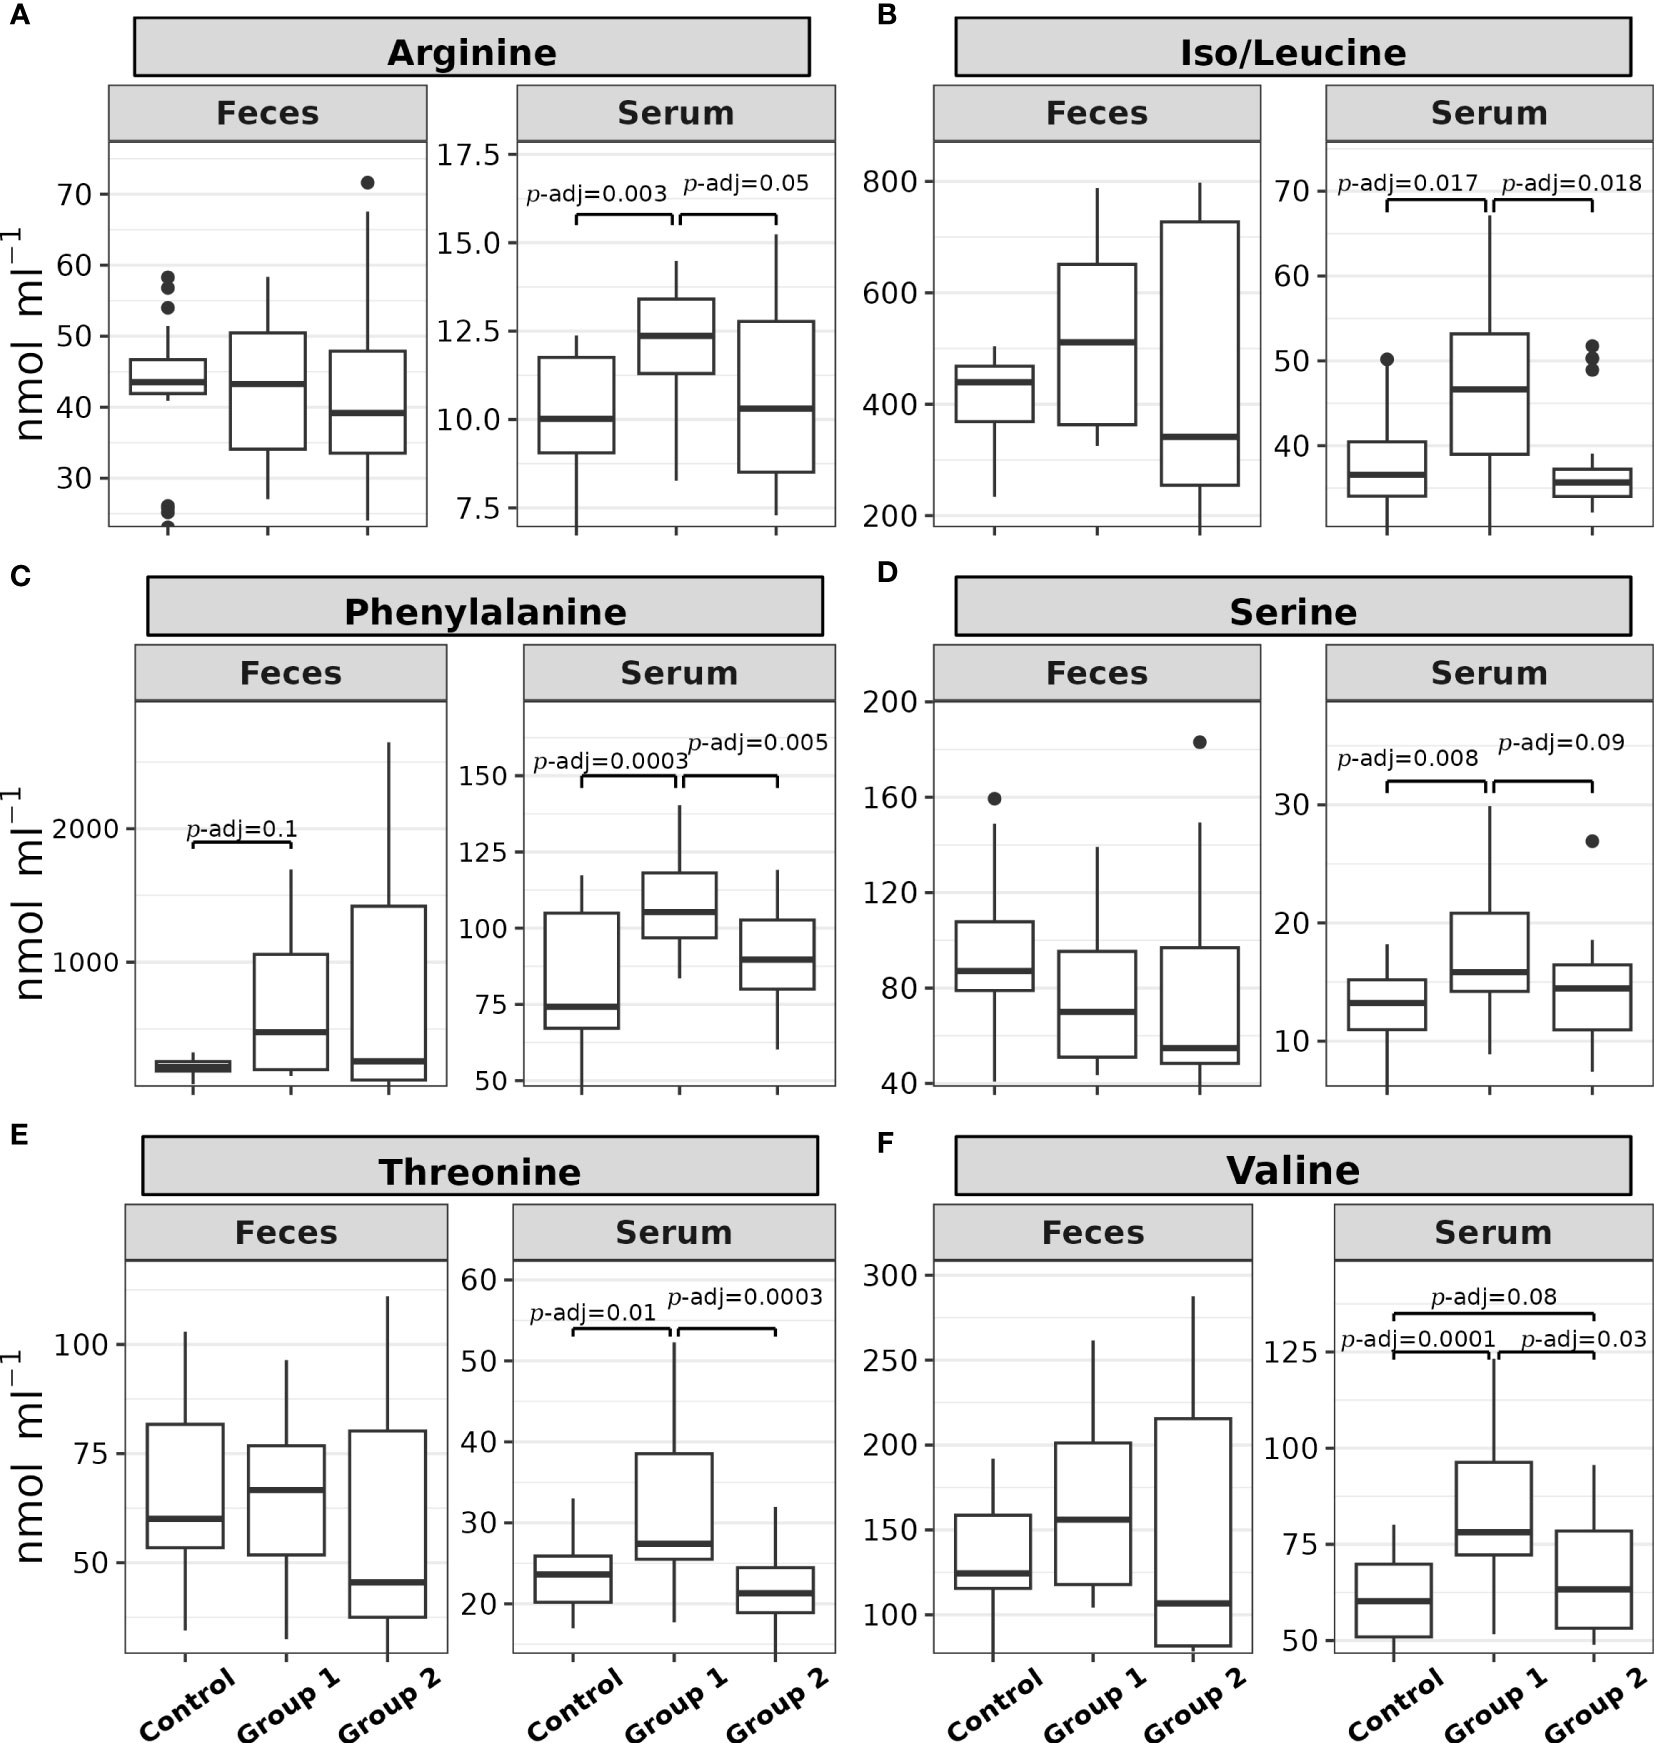
Figure 3 Box plots of the (A) arginine, (B) iso/leucine, (C) phenylalanine, (D) serine, (E) threonine, and (F) valine feces and serum levels (nmol mL-1) of rainbow trout (O. mykiss) after a P. acidilactici (Group 1) or L. lactis (Group 2) supplementation of 5x10⁸ CFU g-1 for 60 days. The Control Group did not receive probiotic supplementation. The lines show statistically significant differences between experimental groups, as derived via Dunn’s test. The distribution differences were considered significant at p< 0.05 and p-adjusted ≤ 0.1.
From the trout proximal intestine tissue samples, the relative expressions of the four genes that encode α-AA transporters (SLCs) were assessed. These were the slc6a19 gene that encodes B0AT1 transporter, the slc7a9 gene that encodes b0,+ transporter, the slc15a1 gene that encodes PepT1 transporter, and the slc36a1 gene that encodes PAT1 transporter.
Figure 4 shows the relative expressions of the α-AA SLC transporter genes. The relative gene expressions of slc6a19 (H(2) = 8.25, p = 0.016) and slc7a9 (H(2) = 8.4, p = 0.014) were statistically significant; however, the other two genes did not present statistically significant differences (slc15a1: H(2) = 2.4, p = 0.29; slc6a19: H(2) = 2.56, p = 0.27). Post hoc analysis showed that the contrasts with significant differences for slc6a19 were between the Control Group and Group 1 (Z = 2.0, p = 0.04, p-adj. = 0.09) and the Control Group and Group 2 (Z = 2.78, p = 0.005, p-adj. = 0.01; Figure 4A). To slc7a9, there were significant contrasts between the Control Group and Group 1 (Z = 1.95, p = 0.05, p-adj. = 0.1) and the Control Group and Group 2 (Z = 2.84, p = 0.0045, p-adj. = 0.01; Figure 4B).
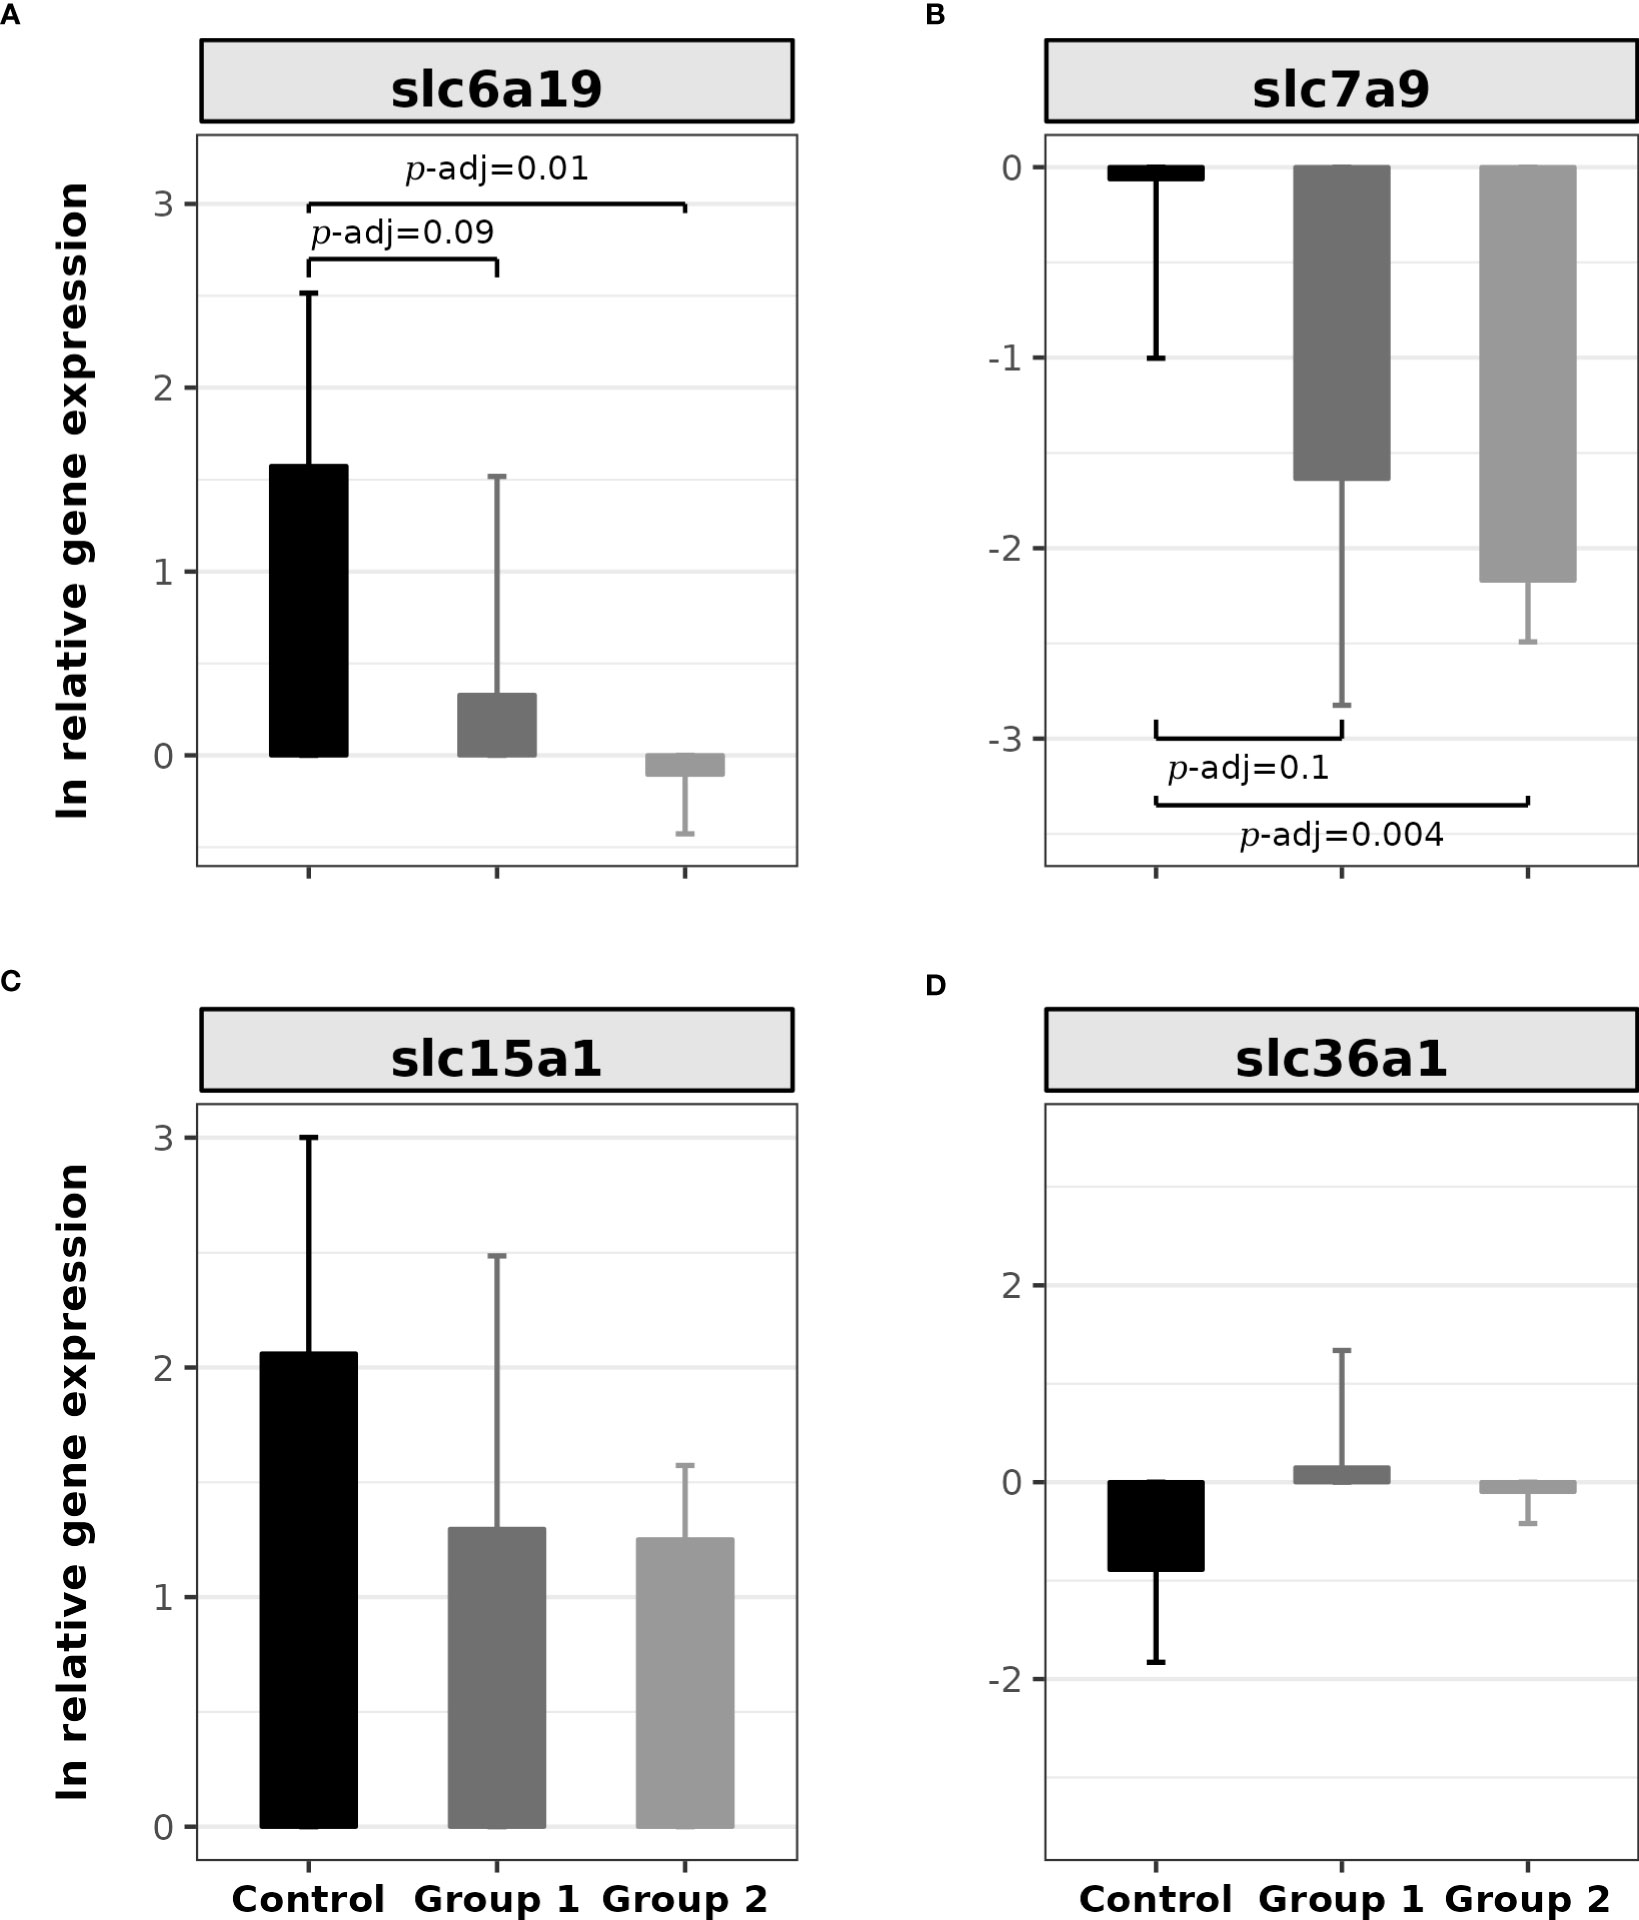
Figure 4 Bar plot of the relative gene expression of SLC transporters in the proximal intestine of rainbow trout (O. mykiss) after a P. acidilactici (Group 1) or L. lactis (Group 2) supplementation of 5x10⁸ CFU g-1 for 60 days. (A) slc6a19 gene (B0AT1), (B) slc7a9 gene (b0,+), (C) slc15a1 gene (Pept1), and (D) slc36a1 gene (PAT1) with bar expressed mean ± standard error of the mean (n = 6). The lines show statistically significant differences between experimental groups, as derived via Dunn’s test. The distribution differences were considered significant at p< 0.05 and p-adjusted ≤ 0.1.
Finally, the results obtained for the total sum of α-AA levels of the serum or feces samples were integrated with the relative expressions of slc6a19 and slc7a9 through correlation analysis. The relative expression of both SLC genes has a significant moderate negative correlation with the total sum of serum α-AA levels, -0.51 (p = 0.03) for slc6a19 and -0.47 (p = 0.04) for slc7a9. However, the relative expression of both SLC genes versus the total sum of feces α-AA levels correlation, was not significant (p > 0.05).
In the post hoc analysis contrast between the Control Group and Group 2 presented significant differences in length gain, but only in the first 30 days. This difference could be explained by the Control Group’s compensatory growth (Morgan and Metcalfe, 2001; Ali et al., 2003), as a lower average standard length was observed in this group at the beginning of the study. However, the comparison of length and length gain was not statistically significant between the experimental groups at the end of the study.
The comparison of Fulton’s condition factor (K) between data collection times was significant for the contrast between T0 and T30, but not for T30 and T60. Because the condition factor evaluates the relationship between weight and length (Froese, 2006), the observed increase in K indicates that the rainbow trout belonging to the three groups presented greater weight gain about length gain during the first 30 days.
Different studies have evaluated the potential of different bacterial strains as probiotic supplements for rainbow trout and other fish species (Amenyogbe et al., 2020; Ringø et al., 2020; De Fátima Marques De Mesquita et al., 2021). Mono-strain P. acidilactici supplementation has been assessed in a large number of studies, wherein researchers also found no significant differences between the experimental groups’ growth rates or feed conversions (Aubin et al., 2005; Hoseinifar et al., 2017; Villumsen et al., 2020; Rasmussen et al., 2022). However, Ali et al. (2020) reported a significant increase in SGR and a significant decrease in FCR in rainbow trout supplemented with 1 x 10¹⁰ CFU g-1 P. acidilactici for 45 days. Other studies have proposed the use of multi-strain probiotic supplements, including P. acidilactici, such as Akbari Nargesi et al. (2020), who reported no significant differences between the experimental groups for SGR; nevertheless, a significant decrease in FCR was associated with the highest probiotic supplementation of 3 x 10⁹ UFC g-1, though lower levels did not exhibit significant differences.
Although L. lactis has been described as a normal part of the rainbow trout microbiota (Navarrete et al., 2010), few studies have evaluated this bacterium as a probiotic supplement to improve trout farming performance. Although, Yeganeh et al. (2021) assessed L. lactis supplementation at a level of 1x10⁹ CFU g-1, but found no significant differences in SGR or FCR between the experimental groups.
The PER results associated with the supplementation of lactic-acid bacteria have been contradictory. Using diets with 52% or 57% crude protein, Rasmussen et al. (2022) described a significant decrease in PER in rainbow trout after supplementation with P. acidilactici. In contrast, Ali et al. (2020) used a diet with 40% crude protein and found a significant increase in PER in rainbow trout supplemented with P. acidilactici.
Amino acid levels in feces and serum of fish are mainly modulated by diet (Harper et al., 1970; Yamamoto et al., 1998; Mundheim et al., 2004; Larsen et al., 2012), nevertheless the intestinal microbiota also can influence the fecal metabolism of nutrients (Asakura et al., 2014; Lin et al., 2017). This situation presents a problem when comparing the results of different studies given the diversity of ingredients among diet formulations. Despite this problem, similar to Dabrowski and Dabrowska (1981), in this study, iso/leucine was one of the most prominent α-AAs in the feces samples. In blood serum samples, the influence of feed ingredients could be less direct because the liver and gut metabolism of amino acids can also influence their levels in the blood (Karlsson et al., 2006; Wu, 2013). In Schlisio and Nicolai (1978), four of the six highest concentrations of α-AAs in serum samples were consistent with our results (alanine, valine, threonine, and leucine); however, phenylalanine was one of the α-AAs with the lowest levels in this study.
Regarding the relative expression of the SLC genes, slc6a19 and slc7a9 genes showed downregulation in the groups supplemented with lactic-acid bacteria probiotics, besides that, the slc15a1 and slc36a1 gene did not present significant differences between the experimental groups. Although the slc6a19 gene encodes a sodium-dependent transporter, B0AT1 (symporter type), and the slc7a9 gene encodes a non-sodium transporter, b0,+ (antiporter type) (Gauthier-Coles et al., 2021), both present a similar specificity for transporting neutral and cationic α-AAs (Chairoungdua et al., 1999; Böhmer et al., 2005; Gauthier-Coles et al., 2021). Hence, considering that anionic α-AAs are generally only glutamic acid and aspartic acid (Bröer, 2008), it was observed that probiotic supplementation modulates serum levels of certain amino acids. This modulation was potentially linked to the downregulation of genes encoding SLC transporters with a wide range of substrate specificities, such as slc7a9 and slc6a19. In contrast, the expression of slc36a1, an SLC transporter with limited substrate specificity, did not exhibit any variations between the experimental groups.
The probiotic supplementation downregulated SLC genes that encoded transporters with wide substrate specificity. On the other hand, the slc36a1 gene encodes a proton-coupled amino acid transporter, PAT1, which transports only neutral α-AAs, specifically glycine, proline, hydroxyproline, and alanine (Thwaites et al., 1995; Anderson et al., 2004). Likewise, the slc15a1 gene encodes the proton-coupled amino acid transporter PepT1, which transports tri-di peptides (Verri et al., 2010). In concordance with our results slc15a1 gene did not show a relative expression difference between experimental groups in other dietary amino acid modulation studies (Jando et al., 2017; Wei et al., 2020).
In vitro and in vivo studies have established that starvation induces the upregulation of different α-AA SLC transporters in mammals and fish (Hatzoglou et al., 2004; Hellsten et al., 2017; Nitzan et al., 2017). Gazzola et al. (1981)has referred to this response as the “adaptive regulation of amino acid transporters transcription.” In this study, the specimens fasted for 12 h upon euthanasia; hence, it is feasible that the transcriptional regulation of the SLCs in the trout was more strongly associated with α-AA levels. However, the total sum of α-AAs in the feces samples was not significant among the experimental groups, whereas the total comparison between the serum samples was significant, but only for Group 1 and the Control Group. Nevertheless, increased serum α-AA levels were moderated negatively correlated with the relative intestinal expression of slc6a19 and slc7a9; hence, an increase of the serum α-AA levels could be associated with the downregulation of slc6a19 and slc7a9 in proximal intestinal tissue. Further research is necessary to confirm this relationship.
The present study compared the probiotic effects of an autochthonous P. acidilactici strain supplement with those of a non-autochthonous L. lactis strain supplement. When comparing the concentration of amino acids in feces and blood serum samples, the autochthonous strain yielded significantly positive differences, confirming that probiotics should ideally be isolated from the microbiota of the target species. This result could be associated with the fact that, despite both strains being administered at the same supplementation doses of 5 x 10⁸ CFU g-1, the P. acidilacticiti strain exhibited counts almost 10 times higher than the L. lactis strain in feces. Additionally, P. acidilactici induced positive effects mainly associated with the increase of serum α-AA levels in Group 1 as compared to the Control Group that did not receive probiotic supplementation. However, these effects did not create significant improvements in growth or feed conversions.
This outcome can be further understood by assessing other research that defines the crude protein requirement for rainbow trout, such as Oliva-Teles (1989); Kim et al. (1991); Zeitoun et al. (1973), and Mahmud et al. (1996). These studies’ researchers assessed diets formulated with increasing levels of wet or dry matter crude protein (approximately 25–60%. In general, the best PER performance was associated with diets containing 35–40% crude wet matter protein, also diets formulated with more than 40% crude protein did not have significant improvement in growth indices. The diet used in this study was formulated with 45% crude protein (as wet matter), which provided approximately 5% more crude protein than the rainbow trout requirements. This could explain the absence of improvement in growth or feed conversion indices as a result of the high availability of α-AA levels in feces or serum associated with P. acidilacticiti supplementation, due to a permanent higher amino acid dietary contribution, which could cancel the increased amino acid levels in the serum produced by probiotics.
Understanding the effects of lactic acid bacteria as a probiotic supplement to enhance rainbow trout breeding opens an opportunity for future studies associated with diets specifically formulated for probiotic supplementation. Such diets should be formulated with lower crude protein requirements and even reduce the proportion of some essential and non-essential α-AAs.
Unlike L. lactis, P. acidilactici supplementation for 60 days significantly increased serum total α-AA levels (nmol mL-1) and specific serum levels (nmol mL-1) of proline, arginine, iso/leucine, phenylalanine, serine, threonine, and valine in rainbow trout (Oncorhynchus mykiss). P. acidilactici supplementation for 60 days also significantly increased the levels (nmol mL-1) of glutamate, lysine, proline, and tyrosine in rainbow trout feces.
The autochthonous rainbow trout P. acidilactici showed better activity in improving certain α-AA levels (nmol mL-1) in the blood serum and feces trout samples compared to the non-autochthonous L. lactis. This improved activity could be associated with the fact that P. acidilactici maintains higher viable cell counts (UFC g-1) than the L. lactis strain in feces after diet supplementation. When considering whether probiotics are a viable alternative to nutritional additives that offer benefits to the salmon industry, this study demonstrates that probiotic supplementation does indeed have beneficial effects on the increase of certain amino acids in the serum (nmol mL-1), including four essential amino acids (iso/leucine, phenylalanine, threonine, and valine). However, our results did not allow us to quantify the actual productive and commercial impacts of probiotic supplementation, which is necessary for promoting their use in the salmon industry. Nonetheless, by comprehending the nutritional effects of probiotics, it is possible to propose new research that utilizes diets specifically formulated for probiotic supplementation with the aim of visualizing the productive impacts in the salmon industry.
The datasets presented in this study can be found in online repositories. The names of the repository/repositories and accession number(s) can be found below: GenBank: OP806385 and GenBank: OP806386.
The animal study was reviewed and approved by Comité Institucional de Cuidado y Uso de Animales of the Universidad de Chile (protocol certificate no. 19323-INT-UCH).
GC: Investigation, software, methodology. GS: Formal analysis, software, writing - original draft. CO: Investigation, methodology. HP: Conceptualization, project administration, methodology, resources, supervision. GM: Conceptualization, methodology, software, writing - review & editing. RO: Conceptualization, investigation, formal analysis, supervision, writing - original draft, writing - review & editing, funding acquisition. All authors contributed to the article and approved the submitted version.
This work was supported by the Comisión Nacional de Investigación Científica y Tecnológica (CONICYT) of Chile, through the Fondecyt iniciación program [grant number 11190532].
We thank Mr. Sergio Guzmán, manager of the Bicipunto SPA company, who gave strong support for this study during the most challenging of the Covid-19 pandemic.
The authors declare that the research was conducted in the absence of any commercial or financial relationships that could be construed as a potential conflict of interest.
All claims expressed in this article are solely those of the authors and do not necessarily represent those of their affiliated organizations, or those of the publisher, the editors and the reviewers. Any product that may be evaluated in this article, or claim that may be made by its manufacturer, is not guaranteed or endorsed by the publisher.
The Supplementary Material for this article can be found online at: https://www.frontiersin.org/articles/10.3389/fmars.2023.1216488/full#supplementary-material
Supplementary Figure 1 | Photograph of a rainbow trout (Oncorhynchus mykiss) proximal intestine, showing the intestine segment used to obtain feces and tissue samples.
Ahluwalia V. K., Kumar L. S., Kumar S. (2022). “Amino acids,” in Chemistry of natural products: amino acids, peptides, proteins and enzymes. Eds. Ahluwalia V. K., Kumar L. S., Kumar S. (Cham: Springer International Publishing), 1–65.
Ahmed I., Jan K., Fatma S., Dawood M. (2022). Muscle proximate composition of various food fish species and their nutritional significance: a review. J. Anim. Physiol. Anim. Nutr. 106, 690–719. doi: 10.1111/jpn.13711
Akbari Nargesi E., Falahatkar B., Sajjadi M. M. (2020). Dietary supplementation of probiotics and influence on feed efficiency, growth parameters and reproductive performance in female rainbow trout (Oncorhynchus mykiss) broodstock. Aquacult. Nutr. 26, 98–108. doi: 10.1111/anu.12970
Alberts B., Heald R., Johnson A., Morgan D., Raff M., Roberts K., et al. (2022). Molecular biology of the cell. Seventh Edition (New York: W. W. Norton & Company).
Al-Hisnawi A., Rodiles A., Rawling M. D., Castex M., Waines P., Gioacchini G., et al. (2019). Dietary probiotic pediococcus acidilactici MA18/5M modulates the intestinal microbiota and stimulates intestinal immunity in rainbow trout (Oncorhynchus mykiss). J. World Aquacult. Soc. 50, 1133–1151. doi: 10.1111/jwas.12642
Ali M., Nicieza A. G., Wootton R. J. (2003). Compensatory growth in fishes: a response to growth depression. Fish Fish. 4, 147–190. doi: 10.1046/j.1467-2979.2003.00120.x
Ali M., Soltanian S., Mirghaed A., Akhlaghi M., Hoseinifar S. H., Esmailnejad A. (2020). The effect of oral administration of lactic acid bacteria isolated from kefir on intestinal microbiota, growth performance and survival in juvenile rainbow trout, Oncorhynchus mykiss. Int. J. Aquat. Biol. 8, 35–49. doi: 10.22034/ijab.v8i1.697
Amenyogbe E., Chen G., Wang Z., Huang J., Huang B., Li H. (2020). The exploitation of probiotics, prebiotics and synbiotics in aquaculture: present study, limitations and future directions. : a review. Aquacult. Int. 28, 1017–1041. doi: 10.1007/s10499-020-00509-0
Anderson C. M. H., Grenade D. S., Boll M., Foltz M., Wake K. A., Kennedy D. J., et al. (2004). H+/amino acid transporter 1 (PAT1) is the imino acid carrier: an intestinal nutrient/drug transporter in human and rat. Gastroenterology 127, 1410–1422. doi: 10.1053/j.gastro.2004.08.017
AOAC Offical Method 976.05 (2023). Official methods of analysis of AOAC INTERNATIONAL. 22nd Edition (New York, USA: Oxford University Press).
Araújo C., Muñoz-Atienza E., Poeta P., Igrejas G., Hernández P. E., Herranz C., et al. (2016). Characterization of pediococcus acidilactici strains isolated from rainbow trout (Oncorhynchus mykiss) feed and larvae: safety, DNA fingerprinting, and bacteriocinogenicity. Dis. Aquat. Organisms 119, 129–114. doi: 10.3354/dao02992
Asakura T., Sakata K., Yoshida S., Date Y., Kikuchi J. (2014). Noninvasive analysis of metabolic changes following nutrient input into diverse fish species, as investigated by metabolic and microbial profiling approaches. PeerJ 2, e550. doi: 10.7717/peerj.550
Aubin J., Gatesoupe F.-J., Labbé L., Lebrun L. (2005). Trial of probiotics to prevent the vertebral column compression syndrome in rainbow trout (Oncorhynchus mykiss, walbaum 1792). Aquacult. Res. 36, 758–767. doi: 10.1111/j.1365-2109.2005.01280.x
Bakke A. M., Glover C., Krogdahl Å. (2010). “2 - feeding, digestion and absorption of nutrients,” in Fish physiology. Eds. Grosell M., Farrell A. P., Brauner C. J. (Burlington, San Diego: Academic Press), 57–110.
Böhmer C., Bröer A., Munzinger M., Kowalczuk S., Rasko J. e.J., Lang F., et al. (2005). Characterization of mouse amino acid transporter B0AT1 (slc6a19). Biochem. J. 389, 745–751. doi: 10.1042/BJ20050083
Bowen S. H. (1987). Dietary protein requirements of fishes [[/amp]]mdash; a reassessment. Can. J. Fish. Aquat. Sci. 44, 1995–2001. doi: 10.1139/f87-244
Brankatschk R., Bodenhausen N., Zeyer J., Bürgmann H. (2012). Simple absolute quantification method correcting for quantitative PCR efficiency variations for microbial community samples. Appl. Environ. Microbiol. 78, 4481–4489. doi: 10.1128/AEM.07878-11
Bröer S. (2008). Amino acid transport across mammalian intestinal and renal epithelia. Physiol. Rev. 88, 249–286. doi: 10.1152/physrev.00018.2006
Buschmann A. H., López D. A., Medina A. (1996). A review of the environmental effects and alternative production strategies of marine aquaculture in Chile. Aquacult. Eng. 15, 397–421. doi: 10.1016/S0144-8609(96)01006-0
Chairoungdua A., Segawa H., Kim J. Y., Miyamoto K.-I., Haga H., Fukui Y., et al. (1999). Identification of an amino acid transporter associated with the cystinuria-related type II membrane glycoprotein*. J. Biol. Chem. 274, 28845–28848. doi: 10.1074/jbc.274.41.28845
Chapagain P., Arivett B., Cleveland B. M., Walker D. M., Salem M. (2019). Analysis of the fecal microbiota of fast- and slow-growing rainbow trout (Oncorhynchus mykiss). BMC Genomics 20, 788. doi: 10.1186/s12864-019-6175-2
Charles Bai S., Hardy R. W., Hamidoghli A. (2022). “Chapter 10 - diet analysis and evaluation,” in Fish nutrition, 4th ed. Eds. Hardy R. W., Kaushik S. J. (Cambridge, Massachuset: Academic Press), 709–743.
Dabrowski K., Dabrowska H. (1981). Digestion of protein by rainbow trout (Salmo gairdneri rich.) and absorption of amino acids within the alimentary tract. Comp. Biochem. Physiol. Part A: Physiol. 69, 99–111. doi: 10.1016/0300-9629(81)90643-5
Debnath S., Saikia S. K. (2021). Absorption of protein in teleosts: a review. Fish Physiol. Biochem. 47, 313–326. doi: 10.1007/s10695-020-00913-6
De Fátima Marques De Mesquita E., Calixto F., Takata R. (2021). “Chapter 14 - probiotics and prebiotics in fish aquaculture,” in Probiotics and prebiotics in foods. Eds. Da Cruz A.G., Ranadheera C. S., Nazzaro F., Mortazavian A. (Cambridge, Massachuset: Academic Press), 263–281.
Erben V., Poschet G., Schrotz-King P., Brenner H. (2021). Evaluation of different stool extraction methods for metabolomics measurements in human faecal samples. BMJ Nutri. Prev. & Health 4, 374. doi: 10.1136/bmjnph-2020-000202
Froese R. (2006). Cube law, condition factor and weight–length relationships: history, meta-analysis and recommendations. J. Appl. Ichthyol. 22, 241–253. doi: 10.1111/j.1439-0426.2006.00805.x
Gauthier-Coles G., Vennitti J., Zhang Z., Comb W. C., Xing S., Javed K., et al. (2021). Quantitative modelling of amino acid transport and homeostasis in mammalian cells. Nat. Commun. 12, 5282. doi: 10.1038/s41467-021-25563-x
Gazzola G. C., Dall'asta V., Guidotti G. G. (1981). Adaptive regulation of amino acid transport in cultured human fibroblasts. sites and mechanism of action. J. Biol. Chem. 256, 3191–3198. doi: 10.1016/S0021-9258(19)69588-8
Giannenas I., Karamaligas I., Margaroni M., Pappas I., Mayer E., Encarnação P., et al. (2015). Effect of dietary incorporation of a multi-strain probiotic on growth performance and health status in rainbow trout (Oncorhynchus mykiss). Fish Physiol. Biochem. 41, 119–128. doi: 10.1007/s10695-014-0010-0
Glencross B. D., Carter C. G., Duijster N., Evans D. R., Dods K., Mccafferty P., et al. (2004). A comparison of the digestibility of a range of lupin and soybean protein products when fed to either Atlantic salmon (Salmo salar) or rainbow trout (Oncorhynchus mykiss). Aquaculture 237, 333–346. doi: 10.1016/j.aquaculture.2004.03.023
Hardy R. W., Brezas A. (2022). “Diets formulation and manufacture,” in Fish nutrition, 4th ed. Eds. Hardy R. W., Kaushik S. J. (London, UK: Elsevier Scientific Publishing Company), 181–302.
Harper A. E., Benevenga N. J., Wohlhueter R. M. (1970). Effects of ingestion of disproportionate amounts of amino acids. Physiol. Rev. 50, 428–558. doi: 10.1152/physrev.1970.50.3.428
Hatzoglou M., Fernandez J., Yaman I., Closs E. (2004). REGULATION OF CATIONIC AMINO ACID TRANSPORT: the story of the CAT-1 transporter. Annu. Rev. Nutr. 24, 377–399. doi: 10.1146/annurev.nutr.23.011702.073120
Hellsten S. V., Lekholm E., Ahmad T., Fredriksson R. (2017). The gene expression of numerous SLC transporters is altered in the immortalized hypothalamic cell line N25/2 following amino acid starvation. FEBS Open Bio 7, 249–264. doi: 10.1002/2211-5463.12181
Hoffman J. I. E. (2019). “Chapter 25 - analysis of variance. i. one-way,” in Basic biostatistics for medical and biomedical practitioners, 2nd ed. Ed. Hoffman J. I. E. (Cambridge, Massachuset: Academic Press), 391–417.
Hopkins K. D. (1992). Reporting fish growth: a review of the Basics1. J. World Aquacult. Soc. 23, 173–179. doi: 10.1111/j.1749-7345.1992.tb00766.x
Hoseinifar S. H., Mirvaghefi A., Amoozegar M. A., Merrifield D. L., Ringø E. (2017). In vitro selection of a synbiotic and in vivo evaluation on intestinal microbiota, performance and physiological response of rainbow trout (Oncorhynchus mykiss) fingerlings. Aquacult. Nutr. 23, 111–118. doi: 10.1111/anu.12373
Hua K., Cobcroft J. M., Cole A., Condon K., Jerry D. R., Mangott A., et al. (2019). The future of aquatic protein: implications for protein sources in aquaculture diets. One Earth 1, 316–329. doi: 10.1016/j.oneear.2019.10.018
Jando J., Camargo S. M. R., Herzog B., Verrey F. (2017). Expression and regulation of the neutral amino acid transporter B0AT1 in rat small intestine. PloS One 12, e0184845. doi: 10.1371/journal.pone.0184845
Kao L. S., Green C. E. (2008). Analysis of variance: is there a difference in means and what does it mean? J. Surg. Res. 144, 158–170. doi: 10.1016/j.jss.2007.02.053
Karlsson A., Eliason E. J., Mydland L. T., Farrell A. P., Kiessling A. (2006). Postprandial changes in plasma free amino acid levels obtained simultaneously from the hepatic portal vein and the dorsal aorta in rainbow trout (Oncorhynchus mykiss). J. Exp. Biol. 209, 4885–4894. doi: 10.1242/jeb.02597
Kim K.-I., Kayes T. B., Amundson C. H. (1991). Purified diet development and re-evaluation of the dietary protein requirement of fingerling rainbow trout (Oncorhynchus mykiss). Aquaculture 96, 57–67. doi: 10.1016/0044-8486(91)90139-X
Larsen B. K., Dalsgaard J., Pedersen P. B. (2012). Effects of plant proteins on postprandial, free plasma amino acid concentrations in rainbow trout (Oncorhynchus mykiss). Aquaculture 326-329, 90–98. doi: 10.1016/j.aquaculture.2011.11.028
Lin R., Liu W., Piao M., Zhu H. (2017). A review of the relationship between the gut microbiota and amino acid metabolism. Amino Acids 49, 2083–2090. doi: 10.1007/s00726-017-2493-3
Mahmud S., Chakraborty S. C., Das M. (1996). Performance of rainbow trout (Oncorhynchus mykiss) fed on different dietary protein with fixed energy ratio. Asian-Australas J. Anim. Sci. 9, 31–35. doi: 10.5713/ajas.1996.31
Mai K., Xue M., He G., Xie S. Q., Kaushik S. J. (2022). “Protein and amino acids,” in Fish nutrition, 4th ed. Eds. Hardy R. W., Kaushik S. J. (London, UK: Elsevier Scientific Publishing Company), 181–302.
Merrifield D. L., Dimitroglou A., Foey A., Davies S. J., Baker R. T. M., Bøgwald J., et al. (2010). The current status and future focus of probiotic and prebiotic applications for salmonids. Aquaculture 302, 1–18. doi: 10.1016/j.aquaculture.2010.02.007
Mishra P., Pandey C. M., Singh U., Gupta A., Sahu C., Keshri A. (2019). Descriptive statistics and normality tests for statistical data. Ann. Cardiac Anaesthesia 22, 67–72. doi: 10.4103/aca.ACA_157_18
Monnerat G., Evaristo G. P. C., Evaristo J., Dos Santos C. G. M., Carneiro G., Maciel L., et al. (2019). Metabolomic profiling suggests systemic signatures of premature aging induced by Hutchinson–gilford progeria syndrome. Metabolomics 15, 100. doi: 10.1007/s11306-019-1558-6
Morgan I. J., Metcalfe N. B. (2001). Deferred costs of compensatory growth after autumnal food shortage in juvenile salmon. Proc. R. Soc. London. Ser. B: Biol. Sci. 268, 295–301. doi: 10.1098/rspb.2000.1365
Mundheim H., Aksnes A., Hope B. (2004). Growth, feed efficiency and digestibility in salmon (Salmo salar l.) fed different dietary proportions of vegetable protein sources in combination with two fish meal qualities. Aquaculture 237, 315–331. doi: 10.1016/j.aquaculture.2004.03.011
National Research C. (2011a). Nutrient requirements of fish and shrimp (Washington, DC: The National Academies Press).
National Research C. (2011b). Guide for the care and use of laboratory animals (USA: Washington (DC).
Navarrete P., Magne F., Mardones P., Riveros M., Opazo R., Suau A., et al. (2010). Molecular analysis of intestinal microbiota of rainbow trout (Oncorhynchus mykiss). FEMS Microbiol. Ecol. 71, 148–156. doi: 10.1111/j.1574-6941.2009.00769.x
Nitzan T., Rozenberg P., Cnaani A. (2017). Differential expression of amino-acid transporters along the intestine of Mozambique tilapia (Oreochromis mossambicus) and the effect of water salinity and time after feeding. Aquaculture 472, 71–75. doi: 10.1016/j.aquaculture.2016.01.020
Ogino C. (1980). Requirements of carp and rainbow trout for essential amino acids. NIPPON SUISAN GAKKAISHI 46, 171–174. doi: 10.2331/suisan.46.171
Oliva-Teles A. (1989). The optimum protein / energy ratio of the diets for rainbow trout fry and juveniles. Lisboa, Portugal: Junta Nacional de Investigação Científica e Tecnológica.
Opazo R., Gajardo F., Ruiz M., Romero J. (2016). Genome sequence of a Lactococcus lactis strain isolated from salmonid intestinal microbiota. Genome Announcements 4, e00881–e00816. doi: 10.1128/genomeA.00881-16
Pérez-Sánchez T., Balcázar J. L., García Y., Halaihel N., Vendrell D., De Blas I., et al. (2011). Identification and characterization of lactic acid bacteria isolated from rainbow trout, Oncorhynchus mykiss (Walbaum), with inhibitory activity against lactococcus garvieae. J. Fish Dis. 34, 499–507. doi: 10.1111/j.1365-2761.2011.01260.x
Pfaffl M. W. (2001). A new mathematical model for relative quantification in real-time RT–PCR. Nucleic Acids Res. 29, e45–e45. doi: 10.1093/nar/29.9.e45
Pizzagalli M. D., Bensimon A., Superti-Furga G. (2021). A guide to plasma membrane solute carrier proteins. FEBS J. 288, 2784–2835. doi: 10.1111/febs.15531
Poncet N., Taylor P. M. (2013). The role of amino acid transporters in nutrition. Curr. Opin. Clin. Nutr. Metab. Care 16, 57–65. doi: 10.1097/MCO.0b013e32835a885c
Portune K. J., Beaumont M., Davila A.-M., Tomé D., Blachier F., Sanz Y. (2016). Gut microbiota role in dietary protein metabolism and health-related outcomes: the two sides of the coin. Trends Food Sci. Technol. 57, 213–232. doi: 10.1016/j.tifs.2016.08.011
Ramos M. A., Gonçalves J. F. M., Batista S., Costas B., Pires M. A., Rema P., et al. (2015). Growth, immune responses and intestinal morphology of rainbow trout (Oncorhynchus mykiss) supplemented with commercial probiotics. Fish Shell. Immunol. 45, 19–26. doi: 10.1016/j.fsi.2015.04.001
Rasmussen J. A., Villumsen K. R., Ernst M., Hansen M., Forberg T., Gopalakrishnan S., et al. (2022). A multi-omics approach unravels metagenomic and metabolic alterations of a probiotic and synbiotic additive in rainbow trout (Oncorhynchus mykiss). Microbiome 10, 21. doi: 10.1186/s40168-021-01221-8
Ray A. K., Ghosh K., Ringø E. (2012). Enzyme-producing bacteria isolated from fish gut: a review. Aquacult. Nutr. 18, 465–492. doi: 10.1111/j.1365-2095.2012.00943.x
R. Core Team (2021). R: a language and environment for statistical computing (Vienna, Austria: R Foundation for Statistical Computing).
Ringø E., Gatesoupe F.-J. (1998). Lactic acid bacteria in fish: a review. Aquaculture 160, 177–203. doi: 10.1016/S0044-8486(97)00299-8
Ringø E., Van Doan H., Lee S. H., Soltani M., Hoseinifar S. H., Harikrishnan R., et al. (2020). Probiotics, lactic acid bacteria and bacilli: interesting supplementation for aquaculture. J. Appl. Microbiol. 129, 116–136. doi: 10.1111/jam.14628
Roper S. M., Weindel A. L., Dietzen D. J. (2022). “Comprehensive determination of amino acids for diagnosis of inborn errors of metabolism,” in Clinical applications of mass spectrometry in biomolecular analysis: methods and protocols. Ed. Garg U. (New York, NY: Springer US), 55–64.
Schlisio W., Nicolai B. (1978). Kinetic investigations on the behaviour of free amino acids in the plasma and of two aminotransferases in the liver of rainbow trout (Salmo gairdnerii Richardson) after feeding on a synthetic composition containing pure amino acids. Comp. Biochem. Physiol. Part B: Comp. Biochem. 59, 373–379. doi: 10.1016/0305-0491(78)90016-0
Sørensen S. L., Park Y., Gong Y., Vasanth G. K., Dahle D., Korsnes K., et al. (2021). Nutrient digestibility, growth, mucosal barrier status, and activity of leucocytes from head kidney of Atlantic salmon fed marine- or plant-derived protein and lipid sources. Front. Immunol. 11. doi: 10.3389/fimmu.2020.623726
Streicher M. D., Reiss H., Reiss K. (2021). Impact of aquaculture and agriculture nutrient sources on macroalgae in a bioassay study. Mar. pollut. Bull. 173, 113025. doi: 10.1016/j.marpolbul.2021.113025
Sumon M., Sumon T. A., Hussain M. A., Lee S.-J., Jang W. J., Sharifuzzaman S. M., et al. (2022). Single and multi-strain probiotics supplementation in commercially prominent finfish aquaculture: review of the current knowledge. J. Microbiol. Biotechnol. 32, 681–698. doi: 10.4014/jmb.2202.02032
Teles A. O., Couto A., Enes P., Peres H. (2020). Dietary protein requirements of fish – a meta-analysis. Rev. Aquacult. 12, 1445–1477. doi: 10.1111/raq.12391
Thwaites D. T., Mcewan G. T. A., Simmons N. L. (1995). The role of the proton electrochemical gradient in the transepithelial absorption of amino acids by human intestinal caco-2 cell monolayers. J. Membrane Biol. 145, 245–256. doi: 10.1007/BF00232716
Turchini G. M., Trushenski J. T., Glencross B. D. (2019). Thoughts for the future of aquaculture nutrition: realigning perspectives to reflect contemporary issues related to judicious use of marine resources in aquafeeds. North Am. J. Aquacult. 81, 13–39. doi: 10.1002/naaq.10067
Verri T., Romano A., Barca A., Kottra G., Daniel H., Storelli C. (2010). Transport of di- and tripeptides in teleost fish intestine. Aquacult. Res. 41, 641–653. doi: 10.1111/j.1365-2109.2009.02270.x
Verri T., Terova G., Romano A., Barca A., Pisani P., Storelli C., et al. (2012). “The SoLute carrier (SLC) family series in teleost fish,” in Functional genomics in aquaculture. Oxford, UK: Wiley-Blackwell, 219–320.
Villasante A., Ramírez C., Catalán N., Opazo R., Dantagnan P., Romero J. (2019). Effect of dietary carbohydrate-to-Protein ratio on gut microbiota in Atlantic salmon (Salmo salar). Animals 9, 1–16. doi: 10.3390/ani9030089
Villumsen K. R., Ohtani M., Forberg T., Aasum E., Tinsley J., Bojesen A. M. (2020). Synbiotic feed supplementation significantly improves lipid utilization and shows discrete effects on disease resistance in rainbow trout (Oncorhynchus mykiss). Sci. Rep. 10, 16993. doi: 10.1038/s41598-020-73812-8
Wang X., Andresen K., Handå A., Jensen B., Reitan K., Olsen Y. (2013). Chemical composition and release rate of waste discharge from an Atlantic salmon farm with an evaluation of IMTA feasibility. Aquacult. Environ. Interact. 4, 147–162. doi: 10.3354/aei00079
Wei Y., Li B., Xu H., Liang M. (2020). Effects of lysine and leucine in free and different dipeptide forms on the growth, amino acid profile and transcription of intestinal peptide, and amino acid transporters in turbot (Scophthalmus maximus). Fish Physiol. Biochem. 46, 1795–1807. doi: 10.1007/s10695-020-00828-2
Yamamoto T., Akimoto A., Kishi S., Unuma T., Akiyama T. (1998). Apparent and true availabilities of amino acids from several protein sources for fingerling rainbow trout, common carp, and red Sea bream. Fish. Sci. 64, 448–458. doi: 10.2331/fishsci.64.448
Yeganeh S., Adel M., Nosratimovafagh A., Dawood M. (2021). The effect of lactococcus lactis subsp. lactis PTCC 1403 on the growth performance, digestive enzymes activity, antioxidative status, immune response, and disease resistance of rainbow trout (Oncorhynchus mykiss). Probio. Antimicrobial. Proteins 13, 1723–1733. doi: 10.1007/s12602-021-09787-3
Zeitoun I. H., Halver J. E., Ullrey D. E., Tack P. I. (1973). Influence of salinity on protein requirements of rainbow trout (Salmo gairdneri) fingerlings. J. Fish. Res. Board Canada 30, 1867–1873. doi: 10.1139/f73-298
Keywords: probiotics, amino acids, Pediococcus acidilactici, Lactococcus lactis, SLC genes, Oncorhynchus mykiss
Citation: Carneiro GRA, Opazo C, Do Santos GRC, Pereira HMG, Monnerat G and Opazo R (2023) Influence of lactic-acid bacteria feed supplementation on free amino acid levels in serum and feces of rainbow trout (Oncorhynchus mykiss, Walbaum 1792). Front. Mar. Sci. 10:1216488. doi: 10.3389/fmars.2023.1216488
Received: 04 May 2023; Accepted: 16 June 2023;
Published: 05 July 2023.
Edited by:
Benjamin Costas, University of Porto, PortugalReviewed by:
Marina Machado, University of Porto, PortugalCopyright © 2023 Carneiro, Opazo, Do Santos, Pereira, Monnerat and Opazo. This is an open-access article distributed under the terms of the Creative Commons Attribution License (CC BY). The use, distribution or reproduction in other forums is permitted, provided the original author(s) and the copyright owner(s) are credited and that the original publication in this journal is cited, in accordance with accepted academic practice. No use, distribution or reproduction is permitted which does not comply with these terms.
*Correspondence: Rafael Opazo, cm9wYXpvQGludGEudWNoaWxlLmNs
Disclaimer: All claims expressed in this article are solely those of the authors and do not necessarily represent those of their affiliated organizations, or those of the publisher, the editors and the reviewers. Any product that may be evaluated in this article or claim that may be made by its manufacturer is not guaranteed or endorsed by the publisher.
Research integrity at Frontiers
Learn more about the work of our research integrity team to safeguard the quality of each article we publish.