 Hugo E. Lazcano-Hernandez
 Javier Arellano-Verdejo
 Rosa E. Rodríguez-Martínez
- 1Department of Observation and Study of the Land, the Atmosphere and the Ocean, Consejo Nacional de Humanidades Ciencias y Tecnologías-El Colegio de la Frontera Sur (CONAHCYT-ECOSUR), Chetumal, Quintana Roo, Mexico
- 2Department of Observation and Study of the Land, the Atmosphere and the Ocean, El Colegio de la Frontera Sur, Chetumal, Quintana Roo, Mexico
- 3Unidad Académica de Sistemas Arrecifales-Puerto Morelos, Instituto de Ciencias del Mar y Limnología, Universidad Nacional Autónoma de México, Puerto Morelos, Quintana Roo, Mexico
Massive arrivals of pelagic Sargassum to the coasts of several countries in the Atlantic Ocean began in 2011. Monitoring the abundance and distribution of Sargassum in the ocean and along the coasts is necessary to understand the phenomena better and develop forecasting products and management protocols. Most Sargassum monitoring has been conducted in the open ocean through traditional remote sensing techniques. However, since the most significant ecologic and socioeconomic impacts occur on the coasts, it is necessary to monitor these macroalgae on nearshore waters and beaches. This manuscript reviews the remote sensing algorithms used in Sargassum observation reported in the last 17 years in more than sixty high-impact scientific publications. The discussion regarding the evolution of the methodologies used for monitoring these macroalgae allowed us to conclude that the synergy generated by incorporating new disciplines like artificial intelligence and citizen science has positively impacted the development of this field. Additionally, the current state-of-the-art methods, the fundamental challenges, and the directions for future research are also discussed.
1 Introduction
Since the 1970s, the coastal waters of various regions of the planet have experienced the arrival of large volumes of macroalgae. Some examples include the Green Tides of Ulva spp. that affected the North American, Asian, and French coasts (Charlier et al., 2007; Hu et al., 2010a; Xiao et al., 2021) and Cladophora sp. as well as Enteromorpha in Europe (Charlier et al., 2008). Brown tides of Sargassum horneri have also affected various regions of Asia since the 2000s (Wang and Hu, 2016; Qi et al., 2017). More recently, those composed of two holopelagic Sargassum species (S. fluitans morphotype III and S. natans morphotypes I and VIII) began affecting several nations in the tropical Atlantic (Gower et al., 2013; Smetacek and Zingone, 2013; Johns et al., 2020). These two holopelagic species reproduce asexually by fragmentation and float through their lifecycle (Ortega-Flores et al., 2022). Their distribution and abundance in the Sargasso Sea have been known since the 15th century. Nevertheless, in recent decades they had only occasionally arrived in relatively large numbers along the coasts and beaches of the Caribbean Sea (CS). However, since 2011, pelagic Sargassum spp. (herein referred to as Sargassum) landings in the Caribbean increased due to the formation of a recurrent Great Atlantic Sargassum Belt (GASB), often extending from West Africa to the Gulf of Mexico (Wang et al., 2019). In the open ocean, Sargassum constitutes a habitat for more than a hundred species (Anderson, 2007; Rodríguez-Martínez et al., 2019; Uribe-Martínez et al., 2020). Still, its accumulation and decomposition on beaches and in coastal waters result in severe ecologic (Rodríguez-Martínez et al., 2019), economic (Martínez-González, 2019), and human-health related (Resiere et al., 2018) impacts. Despite significant scientific and technological advances in Sargassum monitoring, questions such as: What is the extent of Sargassum cover along the coast? What is its volume? What is the amount of biomass reaching the beaches? are still being studied. This information is needed to generate better strategies for the appropriate collection, handling, use, and disposal of Sargassum. To develop such strategies, we need to know Sargassum’s origin, biomass, physiology, biochemical composition, and spatiotemporal dynamics at different scales. Additionally, the legal framework for managing Sargassum locally, regionally, and internationally is required.
The first observation of Sargassum from space was conducted in 2005 using algorithms developed to detect Chlorophyll-a (Chl-a) because it can be found in Sargassum (Gower et al., 2006). Since then, several remote sensors and algorithms have been developed and evaluated under different conditions to determine the distribution and abundance of Sargassum in the ocean (Blondeau-Patissier et al., 2014; Cuevas et al., 2018; Wang and Hu, 2020; Wang and Hu, 2021). Currently, several early warning platforms provide information regarding the presence of Sargassum in the open ocean (e.g., SaWS, FIU-NOAA, SAMTOOL). However, these satellite remote sensing methods have certain limitations. For instance, several factors can affect macroalgae measurements from satellite images, including atmospheric moisture, clouds, intense sunglint, water depth and turbidity, and African dust (Wang and Hu, 2016). Satellite imagery pixel sizes also limit the accurate measurement of accumulated Sargassum cover area. For example, MODIS imagery may underestimate Sargassum coverage by 50%, as small mats (< 2m wide), are not captured (Hu et al., 2021). These limitations can result in disparities between satellite and beach-cast estimated biomass (Rodríguez-Martínez et al., 2022). To date, in situ monitoring of Sargassum has been limited to relatively small coastal areas due to limited resources to cover larger areas (Garcıa-Sanchez et al., 2020; Torres-Conde and Martínez-Daranas, 2020; Rodríguez-Martínez et al., 2022; Torres-Conde, 2022).
The scientific work related to Sargassum observation and monitoring has recently increased to study aspects of its biology, ecology, and impact. Nevertheless, it is still necessary to design methodologies that support automatic and scalable quantification of its coverage and biomass (wet and dry) on coasts and beaches. This information will help elaborate early warnings and decision-making for Sargassum management, use, and disposal to reduce ecology and socioeconomic impacts. Due to the adverse effects of Sargassum in several countries of the Caribbean, Central America, West Africa, Florida, and Brazil, diverse scientific-based international forums have been created to integrate the existing studies around the areas of knowledge required for studying this phenomenon.
The present review analyzed how Sargassum monitoring through satellite remote sensing is being addressed at different spatial-temporal scales. The manuscript is structured in different parts. First, based on information from the Scopus database, a set of manuscripts related to monitoring pelagic Sargassum between 1991 and 2023 is presented. Subsequently, we discuss the physical limitations that the Earth’s atmosphere imposes on spatial observations and the spectral characteristics of Sargassum. In the following sections, we comment on the traditional methods for mapping vegetation, which served as the foundation for designing new, more specific algorithms for observing floating algae. Later, we address reflectance band-ratio, spectral band difference, and bio-optical algorithms, focusing on the algorithms used to identify Sargassum in the ocean through satellite imagery. Later we address studies that have applied Machine Learning (ML) algorithms to improve ocean Sargassum monitoring. Following, we discuss how Sargassum monitoring along the coastline is approached. Finally, we present the discussion section and the conclusions.
2 Materials and methods
The bibliography used in this manuscript was found traditionally, that is, by searching in bibliographic databases. Additionally, specific searches were conducted using Scopus to review existing literature regarding the algorithms used in pelagic Sargassum monitoring, which we describe in more detail below.
2.1 Peer-reviewed articles
We reviewed the existing literature on monitoring pelagic Sargassum through remote sensing techniques, using Boolean search in the Scopus database, for the period 1991 to date (March 23rd, 2023). We used the keywords “remote sensing” and “pelagic Sargassum” ((TITLE-ABS-KEY (remote AND sensing) AND TITLE-ABS-KEY (pelagic AND Sargassum). The search results provided 22 documents (20 research articles, 1 conference paper, and 1 note). Twenty of these documents were published between 2015 and 2023. We repeated the search, replacing the keywords “pelagic Sargassum” with “floating Sargassum”. In this case, we obtained 37 documents (35 research articles and 2 conference papers). Thirty-one of these documents were published between 2015 and 2023. The second search contains 29 documents that are different from those in the first search. A third search used the keywords “Sargassum” and “Deep Learning” yielded 16 documents (13 research articles, 1 conference paper, and 2 conference reviews). Eleven of these documents were new and had not been part of the first two searches. The outcome of these three searches is shown in Figure 1. Peer-review publications related to monitoring Sargassum through remote sensing (RS) and deep learning (DL) techniques have increased significantly in the last five years.
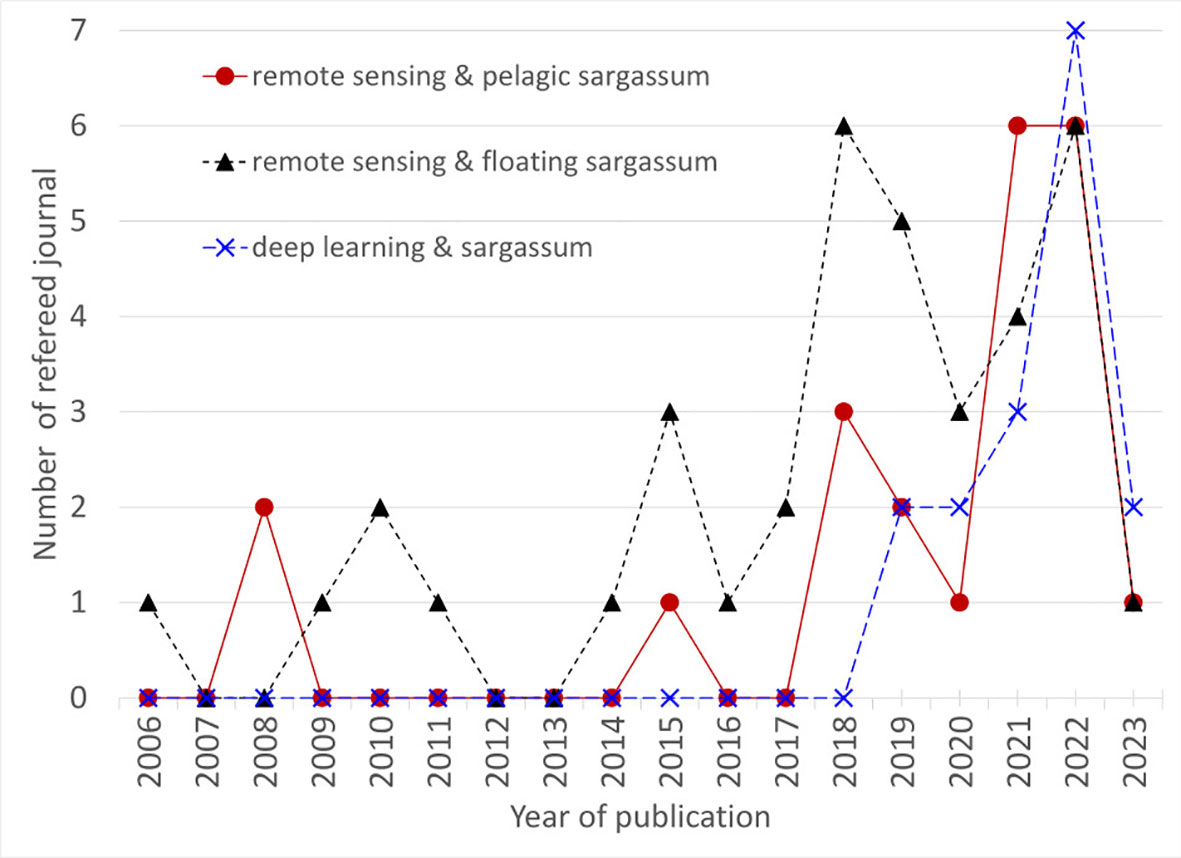
Figure 1 Contrasting the findings obtained from 3 peer-reviewed journal searches conducted in Scopus, using the terms ‘‘remote sensing’’ and ‘‘pelagic Sargassum’’; ‘‘remote sensing’’ and ‘‘floating Sargassum’’ and “deep learning” and “Sargassum” as of March 23rd, 2023. Prior to 2006, no publications were found in the searches.
The searches yielded a total of 62 different documents, which were analyzed using the VosViewer software (Van Eck and Waltman, 2010). The papers with more than 30 citations were chosen for display in Figure 2, which shows the 16 documents, represented by circles and an abbreviated citation of each article for identification purposes. The diameters of the circles demonstrate the normalized number of citations of a document, which is equal to the number of citations the paper has divided by the average number of citations of all the documents published in the same year. The normalization accounts for the fact that older documents have had more time to receive citations than more recent documents. The distance between the two papers in the image indicates the closeness of the papers in terms of co-citation links. Generally, the closer two papers are to each other, the stronger their relatedness. The most robust co-citation links between papers are represented by lines (Van Eck and Waltman, 2010).
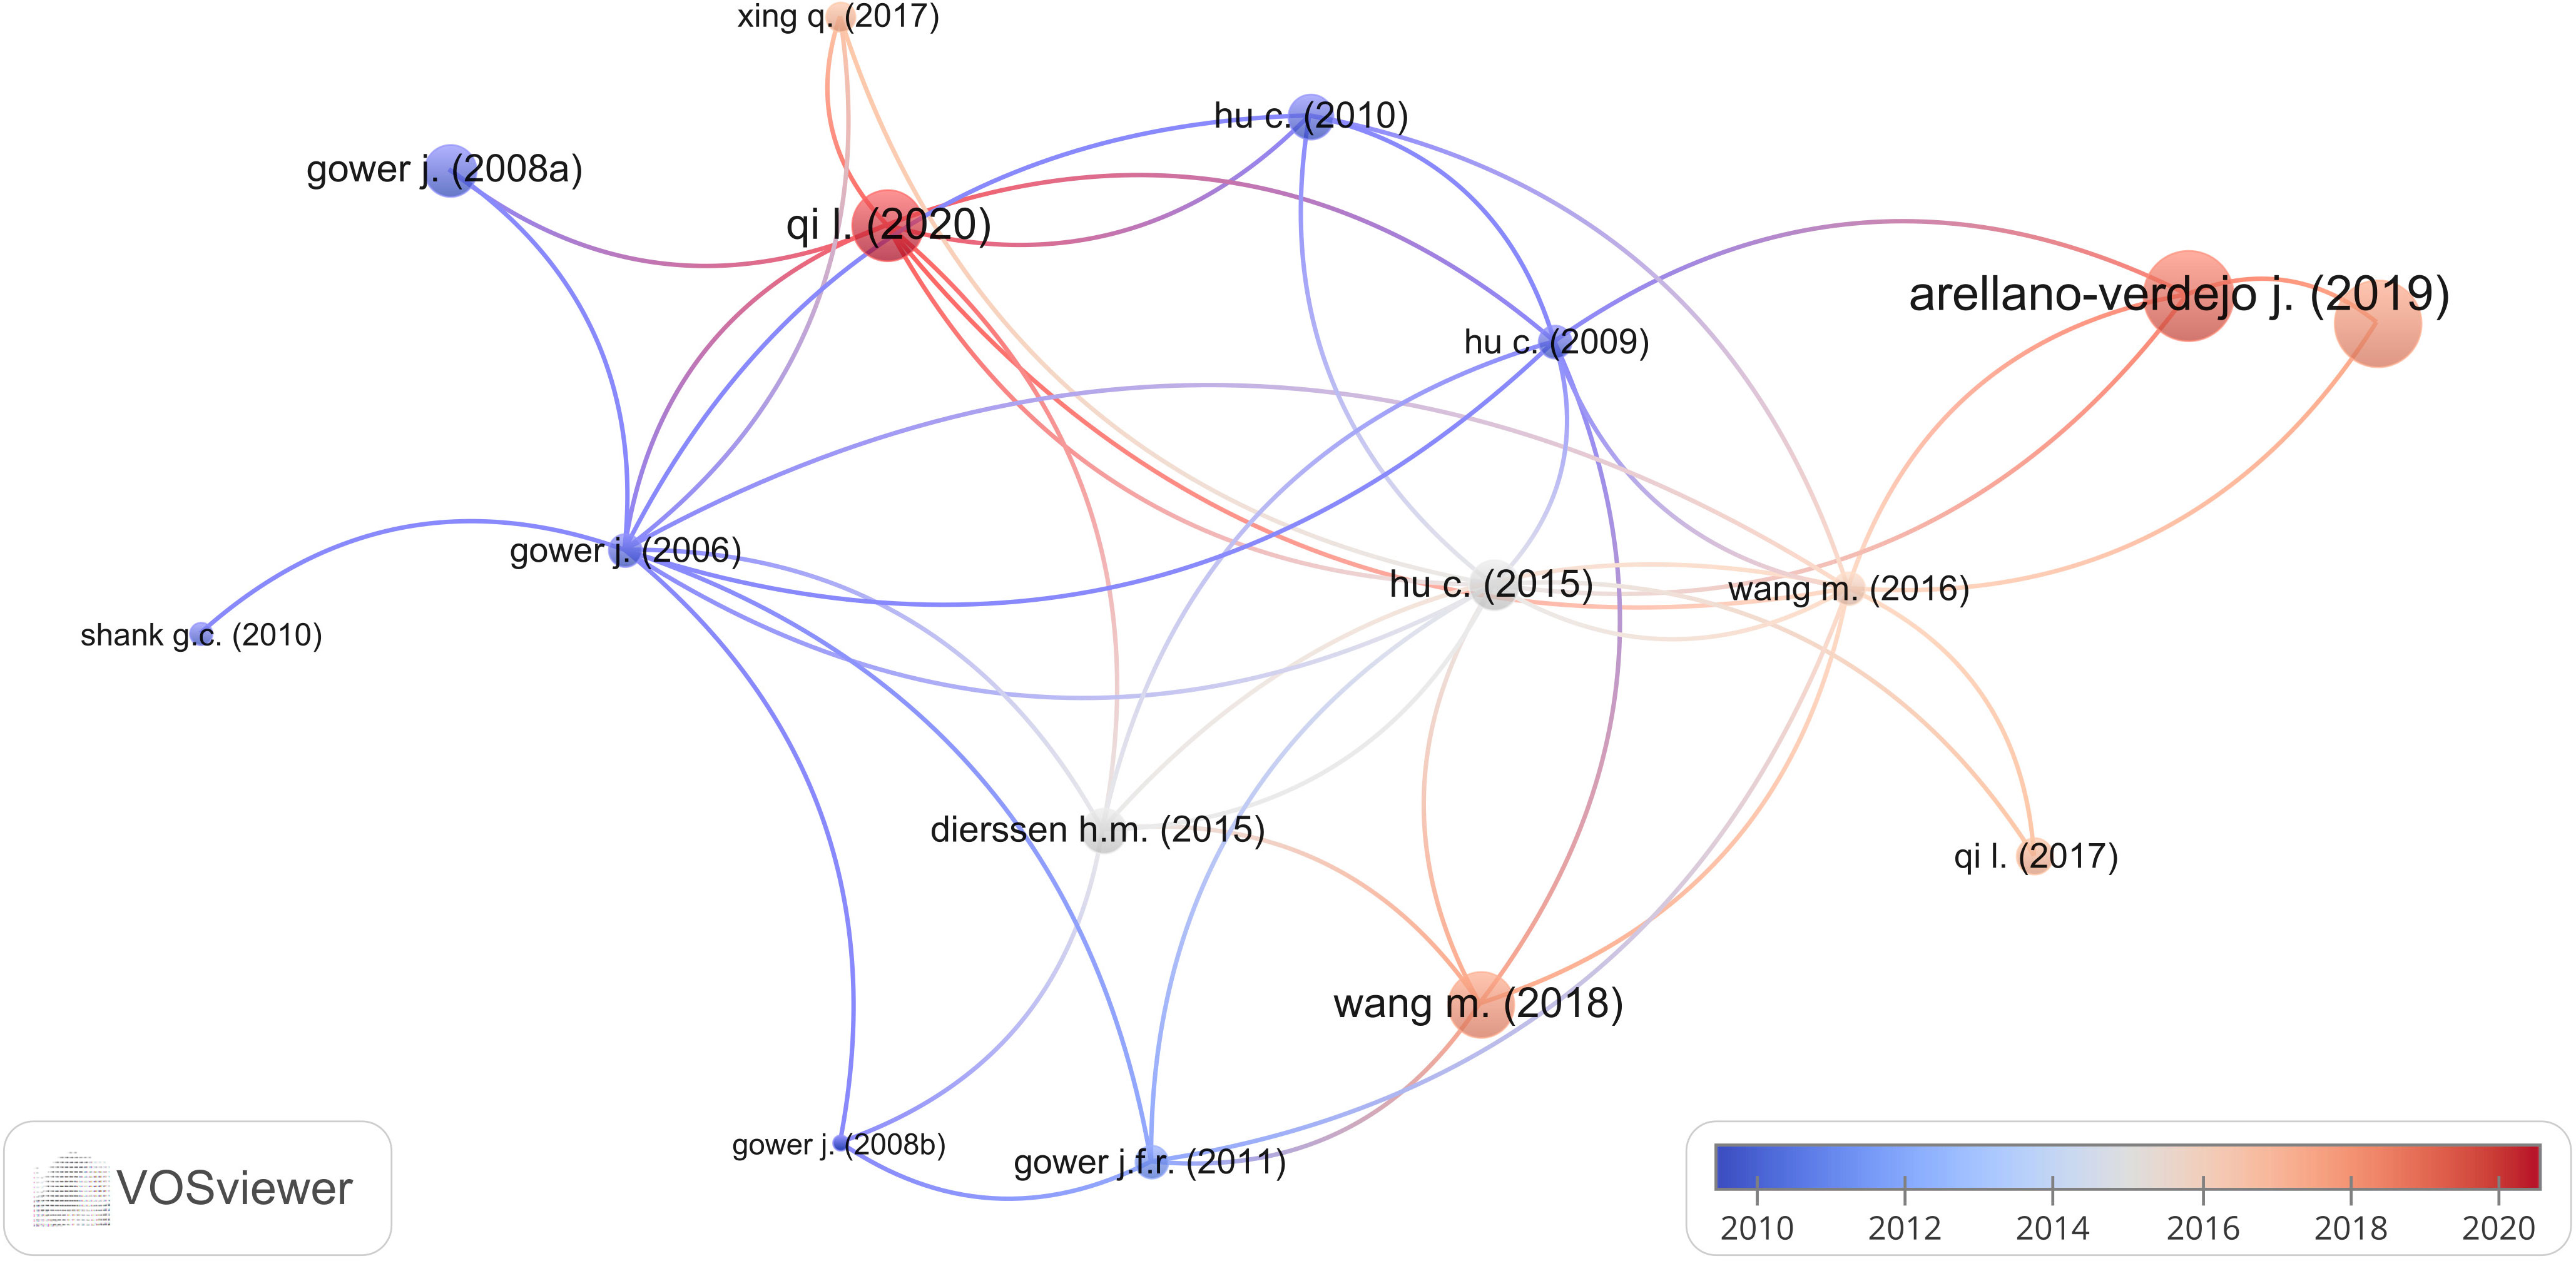
Figure 2 Overlay visualization of the most cited peer-reviewed journal publications (16), based on the 62 paper searches in the Scopus database as of March 23, 2023. The circle’s diameters are given by the normalized number of citations of a document (the number of citations of the paper divided by the average number of citations of all documents published in the same year provided by scopus and not only the cites of the documents consulted for the elaboration of the present study). The color scale indicates the time range in years from when the manuscript was published.
Without being exclusive and to provide a panorama of the benchmark studies related to the remote sensing of Sargassum, Table 1 lists the five papers with the highest values in the number of citations, number of links, and normalized number of citations.
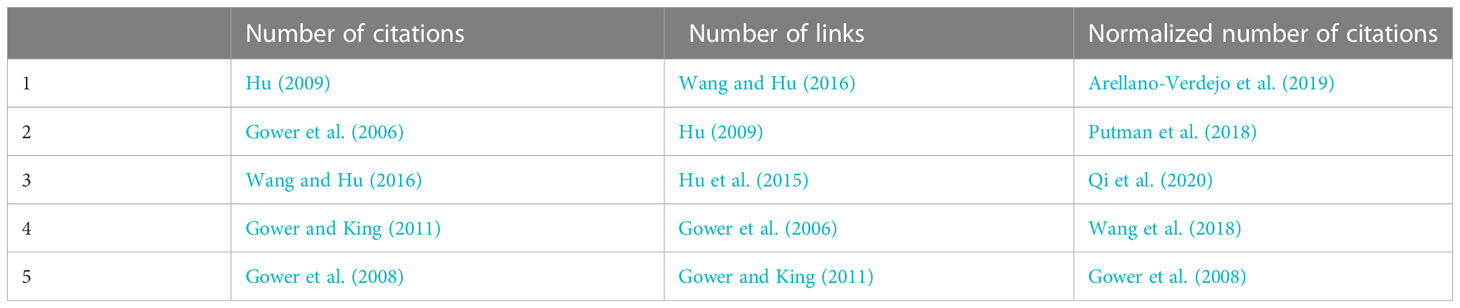
Table 1 Top five papers according to the highest values in the number of citations, number of links, and normalized number of citations (based on the search conducted in the Scopus database as of March 23, 2023).
The seminal studies of Gower et al. (2006); Hu (2009); Wang and Hu (2016) appear in the first two categories (number of citations and number of links). In contrast, more recent studies appear in the normalized number of citations criterion. The highest number of normalized citations corresponds to Arellano-Verdejo et al. (2019). This study applied DL methods to Sargassum monitoring for the first time.
Among the papers found in the Scopus database, we have discussed those that have been a significant reference in the observation, monitoring, or quantification of Sargassum and have served as an inspiration for the development of new methodologies. We also recognize that, within the limitations of this study, this selection of papers can be debatable, and some relevant studies may not have been considered. However, this study includes the most representative research findings regarding the algorithms used in pelagic Sargassum monitoring.
3 Algorithms for Sargassum observation
One of the common challenges in satellite remote sensing is overcoming the physical limitations the Earth’s atmosphere imposes on electromagnetic radiation. The radiance of the Earth’s surface undergoes several modifications before it reaches the sensor. There is the addition of reflected sun and skylight from the sea surface and scattered light from the intervening atmosphere. Additionally, there is absorption by gasses in the atmosphere. The absorption bands are primarily associated with water vapor (730 nm) and carbon dioxide. Additionally, there is an oxygen absorption band at 687 and 760 nm (Abbott and Letelier, 1999). Figure 3 shows the transmittance in the top atmosphere between 0.4 and 1.8 micrometers, some wavelengths of the electromagnetic spectrum are almost entirely filtered out; this is an example of the radiation detected by satellite sensors. The graph was produced with specific atmospheric parameters using the modeling program MODTRAN (Berk et al., 2014; Berk et al., 2015). In conclusion, the solar energy that reaches the Earth’s surface is only a fraction of the original incident energy. In the same way, the energy that reaches the satellite sensors is a fraction of that reflected or emitted by the study surface.
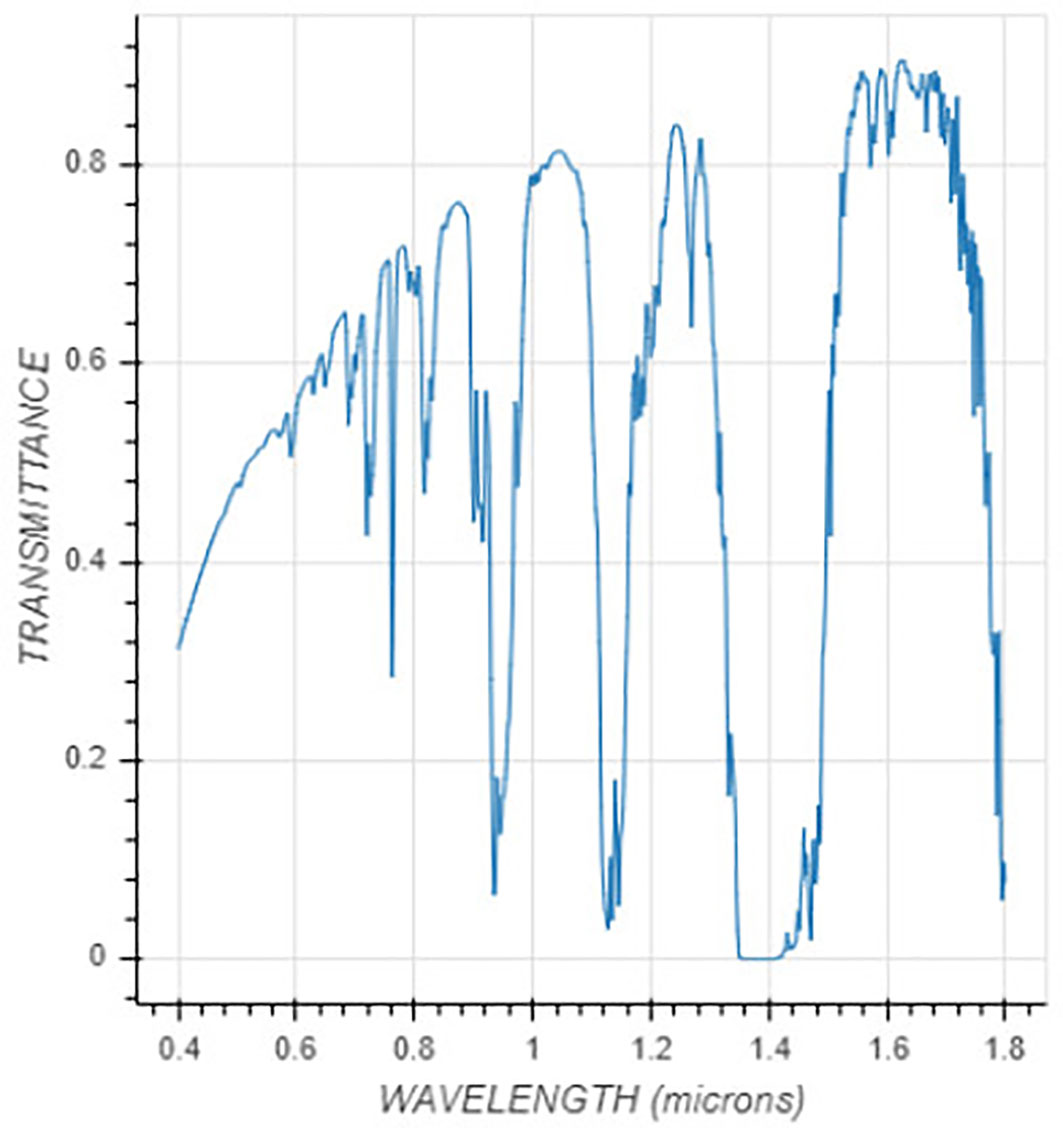
Figure 3 The transmittance of the atmosphere, between the sun and the Earth’s surface, is calculated using the program MODTRAN. The atmospheric model is “Tropical,” and the aerosol model is “Rural,” with a visibility of 23km, sensor altitude of 99km, and azimuth of 135°.
Aquatic photosynthetic organisms (i.e., phytoplankton, cyanobacteria, micro and macroalgae) contain different combinations of photosensitive pigments (e.g., chlorophylls, carotenoids, and biliproteins) to produce their food by transforming a fraction of solar energy to biochemical energy (Lazcano-Hernandez et al., 2019). Sargassum exhibits unique spectral characteristics between 600 and 650 nm due to the presence of the photopigment Chlorophyll c (Chl_c) (Hu et al., 2015). Field reflectance measurements suggest that Sargassum exhibits a local minimum at approximately 632 nm due to Chl_c absorption, generating a unique spectral signature (Figure 4). However, to our knowledge, the sensors used for ocean observation do not discriminate such wavelengths in this spectral range, making analysis of this feature difficult. The observation of pelagic Sargassum from space is based on the fact that Sargassum when floating on the sea surface, favors the increase of reflectance in the near-infrared (NIR), especially in the red edge (700 to 740 nm), as can be seen in Figure 4. However, monitoring Sargassum remains a challenge for several reasons: First, it is constantly moving at the mercy of ocean currents and winds; second, there is a constant presence of clouds in the Caribbean that make it difficult to observe the sea surface; third, Sargassum is not the only marine organism that can cause an increase in reflectance in the red edge, organisms such as Trichodesmium, Syringodium, as well as debris and emulsified oil can also generate this increase. Therefore, from a spectral point of view, the detection of Sargassum in the sea is challenging because although the spectral signatures of the different organisms and objects that could be floating in the ocean are different, the spectral resolution of the sensors available for their study does not always allow to distinguish Sargassum from other types of organisms or objects (Hu et al., 2015). The study by Hu et al. (2015) also shows typical reflectances for Sargassum, Trichodesmium, Ulva prolifera, emulsified oil, various garbage materials, and the seagrass Syringodium. Another challenge in monitoring Sargassum is that the rafts of this macroalgae tend to vary in size, from individual clusters of the order of cm2 to rafts of hundreds of m2 (Ody et al., 2019). For this reason, the detection of a raft also depends on the spatial resolution of the sensor used. A study by Hu et al. (2015) suggests that to discriminate Sargassum in a pixel of an image, the minimum coverage of Sargassum in that pixel must be between 20 and 30% of the pixel (Hu et al., 2015). The phytoplankton absorption coefficient is an essential parameter in ocean color algorithms and is increasingly used to parameterize algal bloom algorithms (Goela et al., 2013). The current challenge is to develop bio-optical algorithms that can take advantage of each organism’s particular spectral characteristics to identify its spectral response under actual observation conditions.
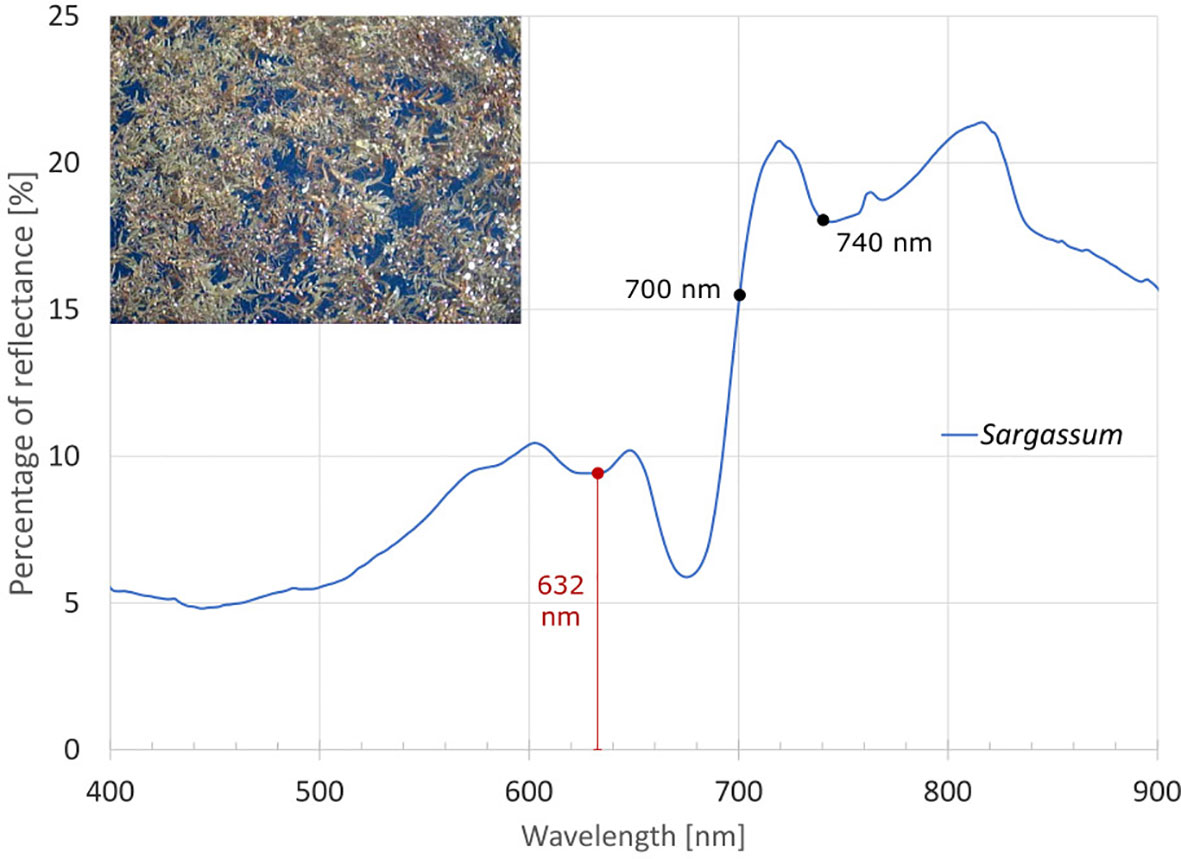
Figure 4 Average of several surface reflectance measurements of Sargassum floating on the sea surface under natural lighting conditions. Measurements were performed with a field portable spectroradiometer (SVC HR-5112i).
The algorithms developed to observe and assess vegetation on land or Chl_c/phytoplankton in deep ocean waters provided the basis for designing new algorithms for monitoring Sargassum and other macroalgae. This study will address those used to observe massive Sargassum blooms. According to Blondeau-Patissier et al. (2014), RS algorithms for ocean observation can be categorized into four major groups: 1) Reflectance classification algorithms, 2) Reflectance band-ratio algorithms, 3) Spectral band-difference algorithms, and 4) Bio-optical models.
3.1 Traditional methods for vegetation mapping
The Vegetation Indices (VI) are mathematical expressions that have an input of radiometric measurements of the vegetation used to evaluate the temporal and spatial variations of many vegetal biophysical parameters (Liu and Huete, 1995). These indices have been widely applied in RS applications using aerial and satellite platforms (Xue and Su, 2017). VI are effective algorithms for quantitative and qualitative evaluations of vegetation coverage, vigor, and growth dynamics, among other applications. VI were initially used for land-based observations and provided the basis for marine observations. This study addressed those used to observe massive Sargassum blooms.
Between 1972 and 1973, the United States of America developed an experiment to map regional vegetation conditions during the Great Plains growing season (Rouse et al., 1974). Vegetation conditions were measured in vast regions using Multispectral Scanner (MSS) data from the Earth Resources Technology Satellite 1 (ERTS-1, later renamed Landsat-1). The radiance values recorded in ERTS-1 spectral bands 5 (0.6-0.7μm) and 7 (0.8-1.1μm), corrected for the angle of the sun, were used to calculate the band ratio parameter (BRP), defined as the difference in the ERTS radiance value measured in Bands 5 and 7, divided by their sum, which shows a correlation with the green aboveground biomass in the grasslands (Rouse et al., 1974). The BRP parameter also contributed to the Normalized Difference Vegetation Index (NDVI), which is defined as (Eq. 1):
Where RNIR and RRED are the reflectance in the near-infrared (NIR) and red bands, respectively. Many applications have utilized NDVI for land coverage/land usage. Several scholars have reported applications of the NDVI concept in studying massive algal blooms (Prangsma and Roozekrans, 1989; Kahru et al., 1993; Hu and He, 2008). The NDVI can be used when there is a high contrast between Sargassum and the background in the images, and their values can be used as input to other indices to discriminate between Sargassum and emulsified oil, garbage, and different types of seaweeds (e.g., Trichodesmium, Syringodium, and Ulva) (Hu et al., 2015). On the other hand Hu (2009) used it as a reference method to compare against a Floating Algae Index (FAI) that he developed to estimate the abundance of Sargassum (Hu, 2009). However, it is sensitive to environmental variables and observing conditions (e.g., atmospheric influences, solar/viewing geometry, and sun glint) (Hu, 2009), which makes it difficult for quantitative analyses, because the absolute NDVI values can be changed, manual adjustments are necessary, limiting automation and large spatial-scale applications (Hu and He, 2008; Hu, 2009). Several indexes have been proposed to overcome these issues (Huete et al., 1999), including the Enhanced Vegetation Index (EVI) (Liu and Huete, 1995), which is a feedback-based index that corrects for the interactive canopy background and atmospheric influences by incorporating background adjustment and atmospheric resistance concepts. This enhanced soil and atmosphere-resistant vegetation index is defined in Eq. 2 (Huete et al., 1999):
Where RNIR, RRED, and RBLUE are the reflectance in the NIR, RED, and BLUE bands, respectively. G is the gain factor to compensate for the aerosol effects, and C1, C2, and C3 are the independent coefficients of the pixels to compensate for the impact of the vegetation background.
Despite efforts, EVI remains sensitive to environmental variables and observation conditions. Therefore, developing more stable algorithms for these conditions is necessary. Also, given the dynamics of the marine environment, the monitoring of Sargassum in the sea and its accumulation on beaches requires periodic information to know the moment-to-moment status of the phenomenon, which is often unavailable, making the data provided by algorithms challenging to validate for marine coastal zones.
3.2 Reflectance band-ratio algorithms
Reflectance band-ratio algorithms use spectral bands in the blue and green regions of the visible spectrum to estimate Chl_a concentrations in open oceans (Blondeau-Patissier et al., 2014). Examples include NASA’s ocean color algorithms, such as the the SeaWiFS OC4 (O’Reilly et al., 1998; O’Reilly et al., 2000) and MODIS OC3M (Campbell and Feng, 2005). Most reflectance band-ratio algorithms were designed for global applications in deep ocean waters (Odermatt et al., 2012). Therefore, it is inappropriate to generalize the parameterization of some algorithms to all ocean regions (e.g., Dierssen and Smith (2000); Sathyendranath et al. (2001); Claustre and Maritorena (2003); Volpe et al. (2007)). On the other hand, the use of blue-green spectral bands for specific detection of Chl-a in coastal waters is affected by the absorption signal of CDOM and Total Suspended Matter (TSM). Therefore, in coastal waters, the quality of Chl-a detection is significantly reduced and is often considered unreliable. A more detailed performance analysis of these algorithms can be found in Blondeau-Patissier et al. (2014).
On the other hand, if appropriate spectral bands are available, it is possible to use the Sargassum Index (SI) and the red/green band ratio to identify the presence of Sargassum among other species of algae and seagrasses, in which the color green prevails (Dierssen et al., 2015). Hence, the SI is defined as Eq.3:
Where “r3” is the wavelength of a local reflectance peak, and “r2” is the wavelength of a local reflectance trough. Using Portable Remote Imaging Spectrometer (PRISM) images at 1 m resolution, the Sargassum Index was used to effectively discriminate Sargassum from Syringodium seagrass (Dierssen et al., 2015).
The red/green band ratio is defined as Eq.4:
Where “green” has a wavelength near 555 nm. The reason to define this index is to differentiate Sargassum from Trichodesmium (Cyanobacteria) because they have opposite red/green ratios (Dierssen et al., 2015).
A simple NDVI index can effectively discriminate Sargassum from the background in an image with high contrast. However, line depth (LD) and SI are required to enhance NDVI output to differentiate Sargassum from Syringodium blooms, oil, or garbage. SI can also differentiate Sargassum from other floating materials in environments free of emulsified oil and debris (Dierssen et al., 2015). Table 2 shows the steps to discriminate Sargassum from other algae and seagrasses or floating materials using PRISM imagery.
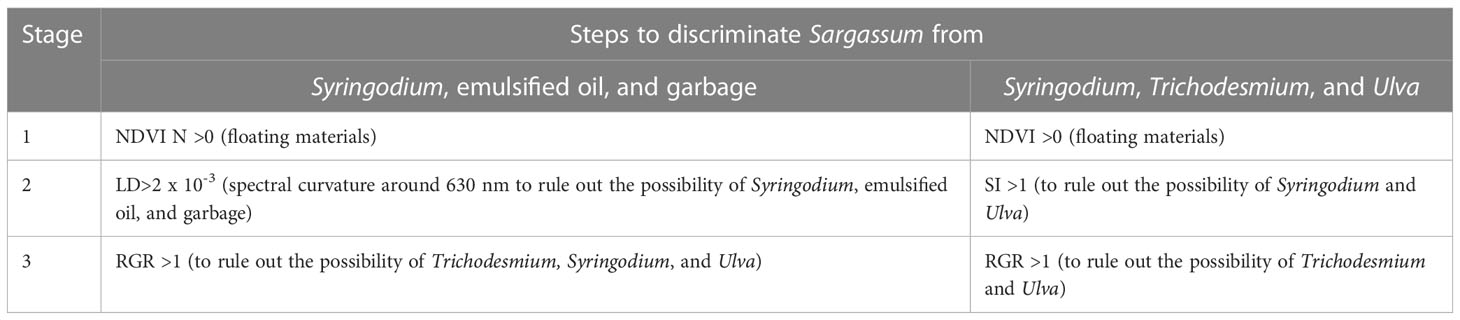
Table 2 Steps to discriminate Sargassum from other floating materials and algae using PRISM imagery.
3.3 Spectral band-difference algorithms (Baseline algorithms)
A methodology that has inspired several studies to avoid oxygen absorption at 687 and 760 nm and water vapor absorption at 730 nm is known as the baseline algorithm (Abbott and Letelier, 1999). Gower and co-workers used aircraft-based sensors to test several channels as a baseline for calculating the Fluorescence Line Height algorithm (FLH). They varied the bandwidth and position and eventually developed a simple linear model using three bands (Borstad, 1985), the general form is presented in Eq. 5. The mathematical expression of this algorithm is also known as Spectral Band Difference Algorithm (SBDA).
Whereby R2 is the radiance or reflectance depending on the use of the input data, measured in the peak of λ2, R1 and R3 are the radiance or reflectance of the baseline wavelengths, λ1 and λ3. Finally, K is a constant (Palmer et al., 2015). The subscripts can be rewritten with the reflectance used according to the study (Eq. 6). Note that the subscripts are generic, and the associated wavelength depends on the index used. For details, see Table 3.
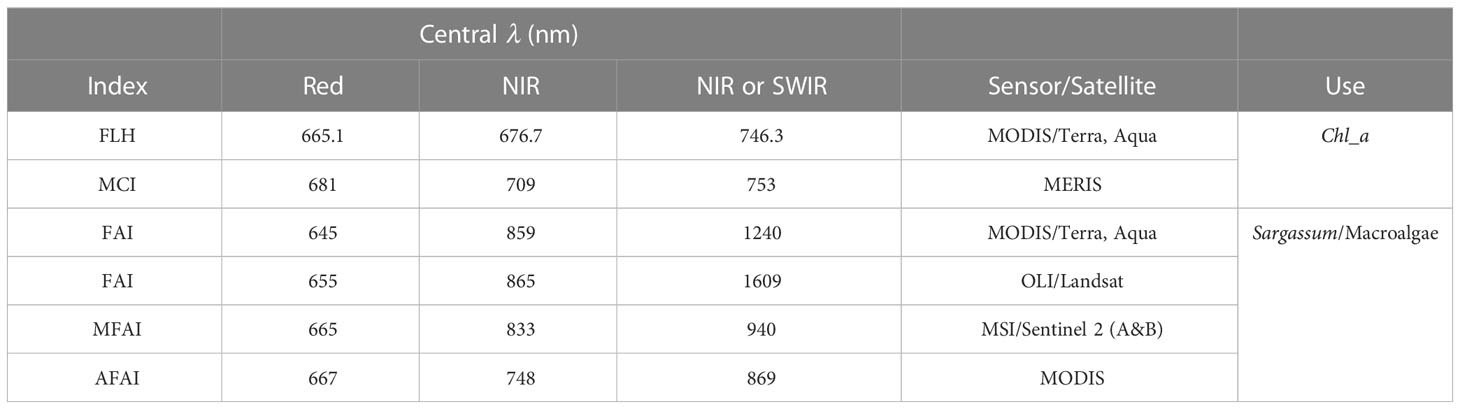
Table 3 Wavelengths of spectral band difference algorithms used to monitor Chl-a fluorescence, Chl-a concentration, or surface flowering.
To make the expression shorter, it is usually rewritten, as shown in Eq. 7 and 8.
Where:
All SBDA algorithms discussed in this study are defined as the difference between the reflectance or radiance (R) in the central waveband (λ2) - which corresponds to the maximum of the red-edge effect -and a linear baseline, drawn between surrounding bands (λ1 and λ3, respectively) (Gower et al., 2005; Hu, 2009; Wang and Hu, 2016). SBDA algorithms take advantage of the fact that absorption tends to vary more rapidly with wavelength than dispersion; two adjacent reflectance spectral bands may have similar backscatter properties but will differ significantly in absorption. Therefore, this absorption can be quantified by spectral difference, which these algorithms seek to take advantage of (Blondeau-Patissier et al., 2014).
The first observation of Sargassum from space in 2005 (Gower et al., 2006) was achieved using imagery from the Medium Resolution Imaging Spectrometer (MERIS), on the Envisat satellite launched by the European Space Agency (ESA), and from the Moderate Resolution Imaging Spectroradiometer (MODIS), launched on both the Terra and Aqua satellites by the National Aeronautics and Space Administration (NASA). MERIS imagery was used as input for the Maximum Chlorophyll Index (MCI), and MODIS imagery for the Fluorescence Line Height (FLH) MODIS product. FLH and MCI belong to SBDA algorithms and were the inspiration for the Floating Algae Index (FAI) (Hu, 2009) and the Alternative Floating Algae Index (AFAl) (Wang and Hu, 2016). The SBDA algorithms use band triplets from the visible (VIS), infra-red (IR), near infra-red (NIR) and shortwave infra-red (SWIR) spectral regions (Table 3). The wavelengths are selected depending on the phenomenon monitored to set the index, so the algorithm is sensitive to Chl-a fluorescence, Chl-a concentration, or surface flowering (Blondeau-Patissier et al., 2014). The features of these algorithms are detailed below.
3.3.1 Fluorescence line height
The Fluorescence Line Height algorithm (FLH) measures the relative amount of radiance leaving the sea surface, presumably resulting from chlorophyll fluorescence (Abbott and Letelier, 1999). It is one of the most widely used ocean color SBDA algorithms to quantify solar-induced chlorophyll fluorescence. FLH estimates the deviation from the radiance expected for pure water resulting from chlorophyll fluorescence through a baseline composed of bands on either side of the high fluorescence wavelength. This increase in radiance (centered at 683 nm for chlorophyll) has been observed for decades in light-field ocean measurements. However, the signal is generally weak, even in regions of high chlorophyll concentrations. Thus, to measure fluorescence, the signal-to-noise ratio (SNR) was increased for the fluorescence band and the adjacent “baseline” bands at 665.1 nm (band 13) and 746.3 nm (band 15). In the case of MODIS imagery, the fluorescence measurement was adjusted at 676.7 nm (band 14) as a compromise between measuring the fluorescence peak (683 nm) and the presence of an oxygen absorption band at 687 nm (Abbott and Letelier, 1999).
3.3.2 Maximum Chlorophyll Index
The Maximum Chlorophyll Index (MCI) monitors algal blooms in inland waters and in ocean, ranging from low chlorophyll and oligotrophic to optically complex, turbid, and eutrophic conditions (Gower et al., 2006; Binding et al., 2013). The MCI index is used for MERIS imagery at 709 nm to detect a signature of dense surface phytoplankton in bloom conditions. However, in shallow waters, a peak near this wavelength can also indicate the presence of benthic vegetation (Gower et al., 2003). Even though MCI is a versatile tool for monitoring intense surface algal blooms, with chlorophyll concentrations in the 10-300 mg m-3 range, this index has limited application when algae biomass is low, as in the case of Lake Ontario (Binding et al., 2013). Thus, the MCI can only be applied to MERIS in the 708.75 nm band because it responds best to strong reflectance in the NIR but not in MODIS and VIIRS, which lack similar bands.
3.3.3 Floating Algae Index
The Floating Algae Index (FAI) is based on the difference between the reflectance at 859 nm (vegetation “red edge”) and a linear baseline between the red band (645 nm) and the short-wave infrared band (1240 or 1640 nm) (Hu, 2009). The wavelengths of these reflectance bands are present in the MODIS sensor. However, the FAI concept can be extended to other satellite platforms because its equation is the same as MODIS FLH (Letelier and Abbott, 1996) and MERIS MCI (Gower et al., 2005), both of which are effective in estimating solar-stimulated chlorophyll-a fluorescence (FLH) and to detect intense phytoplankton blooms (MCI). FAI is more tolerant to environmental changes and robust to the influence of CDOM, aerosols, and sun glint because of the use of NIR bands. Nevertheless, similarly to MCI, the FAI is sensitive to turbid waters and shallow depths and is still susceptible to false positives. Since its release in 2009, the FAI algorithm has been used to study several algae blooms in the ocean. Examples include the monitoring of Sargassum in the North Atlantic Ocean and the Gulf of Mexico, Ulva (Enteromorpha) prolifera in the Yellow Sea (Hu et al., 2010a; Hu et al., 2010b), and Trichodesmium spp. on the west Florida shelf (Hu et al., 2010a), with support of a multi-sensor hydrocarbon tracking technique (Zhao et al., 2014). Unfortunately, the FAI can confuse clouds, ocean waves, and sun-glint pixels with floating algae (Hu, 2009).
3.3.4 MSI-Modify Floating Algae Index
The spectral bands that the theory indicates are ideal for observing pelagic Sargassum from space are not available in all satellite sensors, or technical aspects limit their implementation. This has led to the creation of indexes that use alternative spectral bands. This selection depends on the data sensor (Table 3). Implementing an index is sometimes impossible since the necessary spectral band is unavailable. For instance, the MCI uses a λ2 centered at 709nm and can be implemented only with data from the MERIS and OLCI sensors (Blondeau-Patissier et al., 2014). Another example is the MSI sensor onboard the Sentinel 2 A&B platforms, which presents parallax effects due to the staggered configuration of the 12 individual detectors concerning the focal plane, resulting in odd or even different angles on the ground. These effects can result in differences in radiometry measured on non-Lambertian surfaces, for example, in the sun’s brightness on sea surfaces (Clerc, 2016). On the other hand, the processing algorithm ensures the co-registration of images acquired by all spectral bands and the ground-level feature detectors. However, objects at higher altitudes, such as airplanes and clouds, cannot be registered correctly, leading to incorrect spectral registration (“rainbow” effect) and discontinuities between the detectors, which causes misalignment of the detector for objects at high altitudes. Considering the effects mentioned above, Ody et al. (2019) proposed using the 940nm band instead of the 1610 nm to calculate the FAI using data from the MSI sensor. This adaptation originated the MSI-Modified Floating Algae Index (MSI-MFAI), which benefits the 10m resolution of the bands at 833 and 665nm. The 940 nm MSI spectral band must be up-sampled to a 10m resolution because it has a native spatial resolution of 60m (Ody et al., 2019).
3.3.5 Alternative Floating Algae Index
The Alternative Floating Algae Index (AFAI) was inspired by the same mathematical expression used in the FAI. To eliminate false positives caused by clouds, the AFAI proposes masking the clouds using a new combination of spectral bands (λRED=667 nm, λNIR=748 nm, and λSWIR=869 nm) (Wang and Hu, 2016). Although the 869nm band is in the NIR spectral range, it is still called “SWIR” for consistency (Table 3). In addition to eliminating false positives due to the presence of clouds and solar flares, this proposal improves visual contrast and allows simple interpretation by a wider audience (Wang and Hu, 2016). Although AFAI has a lower spatial resolution (1km) than FAI (250m), the bands used to calculate AFAI have much higher signal-to-noise ratios (SNRs) than those for FAI (Table 3), thus, compensating for the reduction in resolution when detecting small Sargassum mats (Hu et al., 2012; Wang and Hu, 2016). The AFAI was applied to MODIS data to generate the first-time distribution and area coverage maps of Sargassum in the western central Atlantic region from 2000 to 2015 (Wang and Hu, 2016), obtaining results consistent with those previously reported using MERIS observations up to 2011 (Gower et al., 2013).
Spectral band-difference algorithms have provided the most significant findings in observing these algae and are currently a reference in ocean monitoring. However, their performance in the coastal zone decreases considerably. The FAI is the current benchmark index for Sargassum monitoring in the ocean and is used to compute the Satellite-based Sargassum Watch System bulletins (SaWS, https://optics.marine.usf.edu/projects/saws.htmlhttps://optics.marine.usf.edu/projects/saws.html). Nevertheless, several studies seek to improve the results provided by this index, as discussed in the following section.
3.4 Bio-optical algorithms
Bio-optical modeling is an essential tool for understanding the effects of dense algal concentrations on light absorption and backscatter coefficients (Blondeau-Patissier et al., 2014). To bio-optical models have meaningful applications, it is necessary to calibrate them with values from in situ measurements of the variables used in the model so that the coefficients used are the most adequate to represent the phenomena under study as accurately as possible. To our knowledge, only the study of Schamberger et al. (2022) sheds light on a bio-optical algorithm specifically designed to detect Sargassum. This study adapted the semi-analytical radiative transfer model (Lee et al., 1998), proposed by Descloitres et al. (2021), which included the submerged Sargassum in rafts. This model is called Sargassum Radiative Transfer (SRT). Like Lee’s et al. (1998) model, SRT can simulate surface reflectance using the bio-optical properties of the water column, bottom depth, and bottom composition as inputs (forward model). The model uses the following variables as inputs: Chl-a, the concentration of Non-Algal Particles (NAP), the Colored Dissolved Organic Matter (CDOM) absorption coefficient, the seabed reflectance, and the depth (z) (Schamberger et al., 2022). These parameters determine the Inherent Optical Properties (IOP) of the water, such as the absorption (a(λ)) and backscattering (bb(λ)) coefficients that are used to model the deep-water reflectance prsdp(λ).
4 Machine learning and Sargassum observation
The atmosphere imposes limitations on the Earth’s observation from space that are challenging to avoid. Several actions have been conducted to overcome these limitations, including developing sensors with better spectral and radiometric characteristics and indices with features that highlight the study object from the background of the images. Concerning Sargassum monitoring, filters or masks have been designed to eliminate clouds, cloud shadows, intense reflections of the sun, and others. However, false positives and false negatives persist in most images. In recent years, the development of hardware and software has supported the democratization of ML. Since a decade ago, ML has been employed successfully in various Earth observation studies (Camps-Valls et al., 2021). The first published work that used ML to improve Sargassum monitoring using Landsat images was published in 2018 (Cuevas et al., 2018), and the first one using DL in 2019 (Arellano-Verdejo et al., 2019). In 2020, ML steps were incorporated to improve extracting Sargassum-associated features in imagery obtained from AFAI (Wang and Hu, 2021). The following section discusses ML and relevant studies where ML has been implemented to improve Sargassum observations from satellite imagery.
4.1 Brief presentation of machine learning
In the context of Computer Science, ML is a branch of Artificial Intelligence (AI) (Minsky, 1961) that allows machines to learn without being expressly programmed for it. An ML algorithm can learn from the data (Goodfellow et al., 2016), which is an essential skill for making systems capable of identifying patterns to be able to make predictions. This technology is present in several applications (e.g., content recommendation on streaming platforms, speech recognition from virtual assistants, autonomous cars, search engines, medical diagnoses, or fraud detection). The contribution of ML is the paradigm shift from rule-based programming to autonomous learning from data (Goodfellow et al., 2016). Additionally, ML methods are widely used to extract patterns and insights from the ever-increasing data streams in sensory systems (Camps-Valls et al., 2021). In general terms, ML helps to make a prediction or data grouping based on input data. Prediction problems can be divided into two broad categories: Regression problems, where the variable to be predicted is numerical, and Classification problems, where the variable to be predicted is part of a predefined set of categories. For the training of an algorithm, ideally, a balanced dataset is required, i.e., with homogeneous values of the different elements or variables included in the study case.
A characteristic of ML is that there are metrics for evaluating models and their performance quantitatively, allowing us to know the confidence level of the algorithm in different scenarios. A fraction of the dataset (generally 80%) is used as the training dataset, and the remainder is the test dataset, used to evaluate the algorithm’s performance. The ML evaluation metrics depend on the model type (regression or classification). Classification models are applied in Sargassum monitoring, and their most straightforward evaluation metric is accuracy, which is the percentage of observations correctly predicted by the model. However, it must be interpreted cautiously, especially if the classes to be predicted are out of balance (Hossin and Sulaiman, 2015).
The confusion matrix is another tool to evaluate and compare models. It compares the actual values of the target variable against the predicted values. The matrix number of rows and columns depends on the number of possible outcomes. There are only two possible outcomes for binary classification, so only two columns and two rows exist. The labels that make up a confusion matrix are true positive (TP), false negative (FN), false positive (FP), and true negative (TN). Additionally, the information from the confusion matrix makes it possible to calculate the following metrics: Precision Eq.9 and Recall Eq.10, as defined below (Hossin and Sulaiman, 2015).
Precision and Recall are used to define the metric F1 score as shown in Eq.11
4.2 Classical ML algorithms
The metrics above allow us to quantitatively determine the performance of the algorithm used for a particular study and compare different algorithms with each other (Hossin and Sulaiman, 2015). Then, we will describe innovative study cases that use ML techniques to improve the Sargassum monitoring in the ocean, the coast, and the beach.
4.2.1 Tree-based models
The study conducted by Cuevas et al. (2018) had two main objectives. First, to understand the spatio-temporal dynamics of pelagic Sargassum in the waters of the northern Yucatan Peninsula, Mexico. Second, to extend existing methodological approaches by implementing a low-cost proposal with relatively low computational demand. A Random-Forest type algorithm was designed with inputs defined from the combination of five vegetation indices and two Landsat spectral bands with the potential to contribute to detecting Sargassum under supervised classification: NDVI, EVI, FAI, Atmospherically Resistant Vegetation Index (ARVI), Soil Adjusted Vegetation Index (SAVI), B2 (blue, 0.452–0.512 μm), and B5 (SWIR, 0.851–0.879 μm) were used as inputs of the algorithm.
The classification input was a dataset built with 91 Landsat-8 imagery of the northern Yucatan Peninsula from the years 2014 and 2015. For all classifications, the number of variables in the random subset at each node (m) was set at 3, and the number of trees in the forest (k) at 1,000, with the replacement of samples at each step. Five training zones were included for the other more representative objects present in the scene to provide the classifier with a broader spectral context of each analyzed image and increase the possibilities of correctly classifying Sargassum. The results showed that combining vegetation indices in a classification process is a more robust way to detect Sargassum in Landsat-8 imagery, improving even those using a single index.
4.2.2 Support vector machine classification
The study conducted by Shin et al. (2021) aimed to detect Sargassum distribution along the coast of Jeju Island using the Geostationary Ocean Color Imager-II (GOCI-II) images and a ML model-based on a Support Vector Machine (SVM) and Gentle Adaptive Boosting. The model was trained using the Rayleigh-corrected reflectance image (RhoC) from GOCI-II as input and a “ground truth” of the ground extracted from high-resolution images as output. A Sargassum ground truth map was generated from Landsat OLI and Sentinel-2 MSI imagery.
4.3 Algorithms based on deep learning
The democratization of DL has been possible thanks to the availability of large datasets, the advances in hardware and parallelization, computational resources, and community efforts to develop and share codes. This has resulted in an increasing number of people using DL to solve different challenges. Nowadays, DL seems to be consolidating as a widely used scientific research paradigm (Camps-Valls et al., 2021). The vast amount of data about the Earth and its environments, generated by satellite observation platforms and other remote sensors has enabled Earth observation to join the data revolution. The use of DL in Earth Sciences has grown exponentially in recent years because the datasets available offer enormous potential to study terrestrial ecosystems and to address major societal challenges related to emerging issues (e.g., food, water, energy security, and climate change) (Camps-Valls et al., 2021). DL allows the analysis of RS data from another perspective. Below we describe some of the most recent studies incorporating DL to improve Sargassum observation.
4.3.1 Artificial Neural Networks approach
The study conducted by Arellano-Verdejo et al. (2019), presented ERISNet, a convolutional and recurrent ANN, to classify pixels into two classes: with and without Sargassum. Aqua-MODIS imagery of the coast of Quintana Roo in Mexico was used to build the training, testing, and validation datasets. After the learning process, the designed algorithm achieved 90% probability in its classification capabilities. ERISNet was the first ANN developed to classify pixels for Sargassum observation and provides a novel view to detect the arrival of algal blooms accurately. This study also made the first dataset with MODIS pixels classified as with or without Sargassum available.
4.3.2 Denoising model filtering
A significant challenge for automatically extracting pelagic Sargassum information from satellite images is the background noise. Traditionally, noise in VIIRS images is removed using methods such as Gaussian smoothing. However, this methodology cannot be applied in MSI images because the noise patterns are highly variable and attenuate the features, even after local adjustments for optimal performance. MSI images also present relatively large-scale variations in the background, which can result from the image fringe patterns and changes in the optical properties of the water. The study by Wang and Hu (2020) aimed to develop a reliable and fully automatic method for extracting pelagic Sargassum features from MSI images using the FAI. The proposal relied on applying a DL model called Trainable Nonlinear Reaction-Diffusion (TNRD) for noise removal. The results show that the proposed model is adequate for image preprocessing and reduces the underlying problems when applying the AFAI index.
4.3.3 UNET image segmentation
The study conducted by Wang and Hu (2021) addressed two main questions. First, how much Sargassum had gone undetected in coarse-resolution observations such as MODIS. Second, how would it be possible to fill data gaps in nearshore waters? The authors used a deep convolutional neural network (DCNN) of U-net type to answer these questions and to develop a unified approach to extract Sargassum features and quantify its abundance using high-resolution images from multiple sensors (MSI,OLI, WV-2, and PlanetScope/Dove). Sargassum biomass density or coverage areas were quantified, while other confounding features (i.e., waves, currents, phytoplankton blooms, clouds, shadows of clouds, or streak noise) were discarded. To design the model, the authors took the feature extraction section of a VGG network to build a U-Net named VGGUnet.
The dataset generated in the study served to train the proposed model. As a result, satisfactory performance was achieved as no apparent noise signal was misidentified as Sargassum (false positives), while pixels containing Sargassum were mainly detected (few false negatives). Most detection errors (either false positives or false negatives) came from pixels with relatively low biomass densities. Accuracy and recovery rates were high (85%), suggesting that most pixels containing Sargassum were detected successfully. The accuracy of Sargassum biomass estimated from OLI images was ~92%; from MSI images 90%; from WV-2 images ~98%; and from PlanetScope/Dove images 82%. The study presents beneficial results and statistics; however, the authors omitted to incorporate metrics to evaluate the training performance of their proposed algorithm.
The VGGUnet model showed robust performance even with limited spectral bands, high background variations, and several confounding targets. Another critical advantage of the proposed method was its flexibility. The VGGUnet model can easily adapt to different types of satellite data or features by adjusting the input layer and optimizing the model parameters.
The study conducted by Zhang et al. (2022) demonstrated the potential of 3m resolution imagery to monitor Sargassum on the beaches of Miami and Cancun by employing a U-net-based DL model using Dove images. The model was trained with a dataset of four-band TOA reflectance images and labeled Sargassum images. Pixels were roughly delineated to create the labeled Sargassum images using NDVI values. The model was applied to the images after local cloud masking of the TOA reflectance. The authors admit that future work is required to improve cloud masking and apply an appropriate atmospheric correction for global applications. The Sargassum demonstration clearly shows how valuable high-resolution and high-frequency Dove data are for monitoring dynamic events, such as Sargassum inundation. The results show how the Sargassum coverage changed quickly, although the results were encouraging, in this case, like in others where ML and DL techniques are employed, the methodologies applied in the datasets used to train the models were not described in depth. It is not clear how the results were evaluated and interpreted since, in most cases, there is no mention of how the authors avoid overtraining and overfitting.
5 Beach monitoring
Monitoring Sargassum along the coasts presents challenges to traditional remote sensing because of the heterogeneous characteristics of the shores, which are not evident in the images from most of the sensors that offer open data. An alternative is using very high spatial and temporal resolution data. However, conducting large-scale studies with these inputs is computationally and economically expensive. However, it offers the advantage of monitoring areas of interest with images that provide finer detail. Below is a review of studies that propose alternatives for monitoring Sargassum on beaches, what they do, how they do it, their contributions to the state-of-the-art, and their areas of opportunity.
5.1 Network camera systems
In 2021, Rutten et al. (2021) characterized the temporal variation in Sargassum found in the reef lagoon in Puerto Morelos, Quintana Roo, Mexico. The study analyzes images taken every hour for approximately 5.2 years (September 2015 to November 2022) to observe the relationship between landings with wave energy, water level, and wind speed. With this information, the authors proposed a model to explain how the natural cleaning process of the Sargassum accumulated on the beach occurs. This study used a SVM to classify the images automatically. However, it is necessary to know more details of the algorithm adjustment process to reproduce the experiment; for example, the kernel used, the implication of training the algorithm with an unbalanced dataset, and confusion matrices for different cases. This study contributes to the knowledge about Sargassum dynamics and the capacity of the coastal system to remove Sargassum naturally on beaches.
5.2 Crowdsourcing and citizen science
Sargassum monitoring on beaches using photographs and videos has also been carried out through various citizen science initiatives, including Crowdsourcing. The increasing use of mobile devices, such as smartphones and tablets, and the infrastructure that interconnects them with the Internet, have made collective participation a vital source for photographs of the presence of Sargassum on beaches. Citizen science has recently been used as a methodology to collect field information for the validation and calibration of supervised algorithms for identifying Sargassum on the beaches (Arellano-Verdejo and Lazcano-Hernandez, 2020; Iporac et al., 2020). In addition, the study by Putman et al. (2023) suggests the inclusion of wind speed and citizen science data to improve Sargassum inundation reports along beaches. This study constructed its dataset by vertically cropping each photograph to remove the sky and then superimposing 50 random points on the image using the Coral Point Count with Excel extensions (CPCe) software (Kohler and Gill, 2006). Each point was classified into six classes (Sargassum, sand, sky, water, vegetation, or ‘other’). To estimate the relative amount of Sargassum present in the photo, a ratio was calculated between the number of Sargassum pixels and the sum of sand, water, vegetation, and Sargassum points.
The study conducted by Arellano-Verdejo and Lazcano-Hernandez (2021) proposed a methodology for monitoring Sargassum on beaches based on Crowdsourcing for capturing geotagged photographs. An application for mobile devices (e.g., smartphones, tablets) was developed so that volunteers could capture and send the photographs to the cloud for storage. A dataset of 2400 photographs (1200 with Sargassum and 1200 without) was built to train, test, and validate the classification algorithms. DL algorithms classified the images automatically into two classes (with and without Sargassum), and maps were created with GIS to visualize the presence or absence of Sargassum on beaches. To accomplish this task, three state-of-the-art CNNs (LeNet-5, AlexNet, and VGG16) were chosen for image classification and compared on their performance to find the most suitable architecture. Each CNNS was adjusted for the classification process to use the new dataset. LeNet-5 was modified to work with RGB images. The last layer of 1,000 categories in the AlexNet and the VGG16 architectures was replaced by a fully-connected layer for two classes (Sargassum and non-Sargassum images). AlexNet and VGG used augmented data and transferred learning to maximize the generalization capacity of the network for the given dataset. The architecture with the best performance in this study was AlexNet, with an f1 score of 92%. This is a significant result considering that the training was performed with a relatively small set of images (2400). The main contribution of this study is the building of the first dataset of segmented and geotagged images that can be used in other studies. This is important since there is a lack of datasets for studying natural phenomena. Additionally, this study uses the results of the proposed methodology to develop presence/absence maps of Sargassum along the beaches.
The study conducted by Santos-Romero et al. (2022) proposed a method to classify images automatically to build adequate datasets for studies that highlight the presence of Sargassum along the beaches. The images were classified into two classes, in-depth linear perspective and no linear perspective. The Transfer Learning technique on three Artificial Neural Networks (ANN’s) from the literature (ResNet50, MobileNetv2, and VGG16) was implemented to find the optimal architecture. The study also used the Collective View dataset as input for constructing its training dataset. From that collection, 5,000 pictures were manually selected and classified into two balance classes: 2,500 images with a linear beach perspective and 2,500 images without this perspective. The dataset was divided into two subsets using an 80-20 hold-out scheme (Chollet, 2021). 80% of the data were used for training the model and 20% for its testing. The ANN’s performance was assessed with the Accuracy, Precision, and F1 score metrics. A resampling analysis of the F1-Score metric was performed with the Bootstrapping technique, concluding that VGG16 and MobileNetV2 obtained similar results with a confidence interval of 95% between 0.88 and 0.92. Finally, considering both architectures’ spatial and temporal complexity, MobileNetV2 was proposed as the most appropriate for classifying images with and without linear perspective in depth. One of the main contributions of this study is the implementation of resampling to analyze the algorithm’s performance. Resampling is a statistical technique that allows computing estimates of the variance, bias, and confidence intervals of an estimator, using random subsets of the dataset.
5.3 Beach image processing approach
The study by Valentini and Balouin (2020) used a SOLARCAM system for beach monitoring, to compute the semantic segmentation of the imagery, the following was carried out: 1) the image was partitioned in superpixels using the sticky-edge adhesive algorithm; 2) the pre-trained CNN MobileNet-V2 classified the superpixels; and 3) semantic image segmentation was performed through fully connected Conditional Random Field (CRF). The segmented classes were algae, anthropic structure, seafoam and swash, sand, sky, vegetation, and seawater. According to the F1 score metric, the performance of the proposed methodology related to the presence of Sargassum reached a maximum of 90%. At publication, this study was the first to apply the semantic segmentation technique to beach monitoring. The proposal is scalable and would only need to integrate the results into a map for visualization.
Balado et al. (2021) applied a semantic segmentation technique to classify imagery of five macroalgal species (Bifurcaria bifurcata Linnaeus, Cystoseira tamariscifolia (Hudson) Papenfuss, Sargassum muticum (Yendo) Fensholt, Sacchoriza polyschides (Lightfoot) Batters, and Codium spp). The study used data augmentation to build the high-resolution dataset to retrain three CNNs and compare their performance (Mobilnet-V2, Resnet 18, and Xception). The framework used in this study was DeepLabV3 in Matlab. In total, 130 images were labeled and distributed: 90 images for training, 10 for validation, and 30 for testing. This paper shares the hyperparameters used in the learning process of the algorithm (optimization method, learning rate, momentum, L2 regularization, max epochs, and batch size), which are useful for conducting a replica of the study and is information that has usually been omitted in papers. This is one of the pioneering applications of semantic segmentation to differentiate five species of macroalgae.
To improve the results of this type of study, many ground images are required, as well as a good segmentation of the training dataset. On the other hand, geospatial metadata is required to apply the algorithm in the elaboration of maps or other useable products in decision-making. To implement this proposal in aerial images, new datasets are needed to train, test, and validate the algorithm. Additionally, the number of classes required for segmentation needs to be analyzed since UAV-acquired imagery includes information that does not appear in ground images.
In 2022, Arellano-Verdejo et al. (2022), used the collection of geotagged photographs of Arellano-Verdejo and Lazcano-Hernandez (2021) to apply a semantic segmentation technique to propose a new mapping methodology for estimating Sargassum coverage on beaches. Implementing the semantic segmentation image technique requires several steps, one of which is to build a dataset consisting of pairs of pictures (source and segmented). To achieve image segmentation, two stages are required: image translation and subsequent segmentation. Image translation was carried out using the Pix2Pix architecture, and segmentation was performed using the k-means algorithm. All images in the dataset were segmented into three classes (Sargassum, sand, and others). If all the Sargassum observed in the photographs lies on the beach, the total beach area was confirmed by Sargassum and beach pixels. With this criterion, the Sargassum coverage percentage over the beach on every picture was calculated for each segmented photograph. The number of photographs available for the study zone allowed statistically reliable mapping of the percentage of Sargassum coverage from the segmented images. As an element of validation of the proposed methodology, an orthophoto generated by a UAV flight of the study area was used for one of the photographic sampling dates. The main contributions of this study were the generation of the first geotagged and segmented image dataset for Sargassum monitoring for the study area (Mahahual, Quintana Roo, Mexico), and the design of a methodology to generate maps of Sargassum coverage on beaches, which provides more information than maps of the presence/absence of Sargassum. One challenge of the methodology is the need for a constant flow of images for map creation. This situation is generally not possible since society’s participation rate is overall low.
6 Discussion
The observation and monitoring of pelagic Sargassum landings poses several challenges. Regarding remote sensing capabilities, it requires information at the synoptic scale for oceanic observations, and at the human scale for coastal and beach monitoring, i.e. scale that can be directly visible, touchable and appreciable by the human body and its environment (Long and Ye, 2016). Understanding the dynamics of this phenomenon requires daily fine spatial resolution data and short revisit times. Nevertheless, satellite images have several limitations, because of the nature of the interaction of light with the earth’s atmosphere (e.g., absorption, refraction, reflection); the elements and biodiversity in the observation areas (e.g., clouds, cloud remnants, reflections, waves, other species of algae and sea grasses, and floating objects); and the technical limitations of the satellites’ platform and sensors. Although several platforms have a resolution of less than one meter at present, it is not economically feasible for most academic groups to carry out long-term monitoring with this type of image. Therefore, exploring the possibility of complementing observations with images from citizen science, and geostationary platforms such as GOES is relevant. Another challenge is that AQUA and TERRA platforms are at the end of their useful life. These platforms are important for the observation of the Sargassum as they provide daily information at a synoptic scale through MODIS sensor.
The challenges presented by in situ beach monitoring are also diverse due to the extensive areas with Sargassum which are not always feasible to visit; there is a lack of infrastructure and electricity services needed for the installation of a monitoring network and greater and better internet connectivity; the data capture through citizen science is minimal; and there is a need for the consolidation of platforms for the exchange of beach-level information, as well as those that exist for satellite imagery. Legislation is also an issue to consider in the design of monitoring systems on beaches. If they are located within protected areas, the construction of infrastructure can be prohibited or must follow a rigorous process to be authorized. Additionally, in the case of installing a camera system for monitoring Sargassum on the beach, we must consider the costs of maintenance and surveillance to maximize the useful life of the equipment and avoid looting.
The current academic challenge is generating methodologies that allow obtaining as much information as possible from freely available satellite images or under other information-gathering schemes (e.g., to create low-cost solutions from the most affordable inputs).
6.1 Brief evolution of Sargassum observation
The evolution of Sargassum observation and study approaches can be summarized chronologically, methodologically, by area, and by scale.
6.1.1 Chronological approach
Sargassum observations in the CS can be classified into two stages: before and after 2018. Before 2018, Sargassum oceanic observations were carried out using ocean color sensors (i.e. MODIS, MERIS) and algorithms (i.e. FLH, MCI). After 2018, monitoring Sargassum on coasts and beaches became necessary due to the environmental and socioeconomic impacts it provokes. False positives (FP) were minimized with FAI and AFAI indices since the first observations of Sargassum in images were obtained with MERIS and MODIS sensors. However, this did not solve the problem entirely because FPs are more accentuated in coastal areas due to the diversity of elements compared to those in the open sea, where the surface is homogeneous. To overcome this challenge, ML algorithms were incorporated to remove the background noise from the satellite images and make Sargassum identification easier.
The challenges caused by Sargassum landings in 2018, coincided with the democratization of ML, which refers to the accessibility of software, libraries, and computing resources needed for its implementation. For example, in 2015, Google made the Open-Source Neural Networks library – Keras – available to any user, which can run on Tensor Flow, Microsoft Cognitive Toolkit, or Theano. Keras was designed to experiment DL networks relatively easily, being user-friendly, modular, and extensible extensible (Chollet, 2021). In this context, ERISNet was published in 2019 (Arellano-Verdejo et al., 2019). At that time, the state-of-the-art indicated that observing Sargassum in coastal areas with MODIS imagery was impossible due to the difficulty of discriminating it from other near-shore elements.
6.1.2 Methodological approach
Since 2005, Sargassum observation in the open ocean has been conducted using several baseline-type indices (MCI, FLH, FAI, AFAI) that share the same mathematical expression but different suits of spectral bands to set the image background to improve the observation of floating algae. From a methodological point of view, there has been no real innovation in applying these indices to observe Sargassum. From 2018 onwards, studies began to be published where they implemented image processing and ML techniques to improve the images before applying ocean color indexes. Incorporating these techniques suggests a new stage in the observation and monitoring of Sargassum; however, the process is still in the initial phase. In this context, Sargassum’s observation can be classified into the two methodological approaches described below.
The initial observations of Sargassum from space employed indices designed to observe Chl a in the open sea. MCI and FLH indices were first used in 2005. Later, in 2009, the FAI was published and became the benchmark until the AFAI was published in 2016. These techniques share the same mathematical expression; the difference lies in the bands selected to calculate the index. Due to the nature of the indices, no methodologies or statistical metrics have been used to assess their performance, except for in situ validation. The second methodological stage incorporated ML techniques to improve the results provided by the indices. The first study incorporating ML for Sargassum detection in the sea was published in 2018 (Cuevas et al., 2018). ML had already been used to analyze satellite data and images with excellent results (Camps-Valls et al., 2021). ML techniques were either incorporated at some stage of the methodology to improve the discrimination of Sargassum offered by the existent indices or used from scratch to design new techniques. The first study incorporating DL for Sargassum detection in the sea was published in 2019 (Arellano-Verdejo et al., 2019).
6.1.3 Study area approach
Sargassum monitoring can be conducted in oceanic, coastal, and beach environments. Oceanic monitoring began in 2005 using traditional indices and algorithms and was improved using ML techniques from 2018 onwards. Coastal monitoring was improved using high-resolution satellite imagery and ML to minimize false positives and improve the generation of value-added products from satellite inputs. Although field data collection has always been carried out to validate satellite data, Sargassum monitoring on beaches began improving in 2018 by installing cameras along the coast and through Citizen Science. Data becomes in inputs for computer vision techniques (Álvarez-Carranza and Lazcano-Hernandez, 2019; Arellano-Verdejo and Lazcano-Hernandez, 2020). This information allowed to train ANNs to be capable of classifying photographs with/without Sargassum (Arellano-Verdejo and Lazcano-Hernandez, 2021), segmenting Sargassum in snapshots (Arellano-Verdejo et al., 2022) and classifying beach perspective in photographs (Santos-Romero et al., 2022), allowing the creation of Sargassum coverage maps using photographs at the beach level.
6.1.4 Study scale approach
MERIS, MODIS, and VIIRS have been the most widely used sensors for Sargassum studies and monitoring at the synoptic and mesoscale space scales. In 2012, the Envisat mission ended, making MODIS and VIIRS the only sensors available when writing this manuscript. The MODIS sensor obtains 250-1000 meter resolution images with an average of a 2-day revisit period. By combining data from both satellites, daily images can be obtained. Unlike MODIS, the LANDSAT platform obtains images with a better spatial scale (15-30 m), but the revisit period is 16 days. On the other hand, the Sentinel 2A (launched June 2015) and Sentinel 2B (March 2017) satellites provide images with a spatial resolution of 10-60 m and a revisit period of 10 days (or five days if images from both satellites are used). The platforms mentioned above offer free access to several databases collections highly used by the scientific community. However, the databases of images with higher spatial and temporal resolutions considered the ideal input for Sargassum monitoring are costly1. For those who cannot afford them, the alternative has been using aerial and ground photographs and videos.
6.2 Research gaps
Different platforms provide information on Sargassum biomass in the ocean, coastal waters, and beaches. However, ideally, they should provide consolidated information for all environments. The only source of periodic reports on the distribution and abundance of Sargassum in the Atlantic Ocean is the Satellite-based Sargassum Watch System (SaWS) from the Optical Oceanography Laboratory of the University of South Florida2. Most countries affected by Sargassum in the Greater Caribbean rely on this information to estimate landing volumes and develop management strategies. Nevertheless, adequate measurements of Sargassum coverage and biomass in coastal waters and on beaches are needed to understand spatial and temporal variability in landings, both within and between countries, and to feed numerical prediction models. Thus, to improve Sargassum’s understanding and management, the current geoportals and information sources must evolve into hybrid Sargassum monitoring observation and survey systems.
Sargassum monitoring in coastal waters faces several challenges. In the CS, the shallow oligotrophic waters and enormous ecological diversity result in a wide variety of colors, making it difficult to correctly identify the elements in a scene. Thus, monitoring coastal areas requires images with a sharp spatial resolution (1 m) and high revisit periods, preferably once a day. Although satellite platforms that offer very high spatial resolution images do exist3, they are economically inaccessible for most researchers in the region.
A significant research gap has been quantifying Sargassum landing volumes because in situ measurements are difficult and time-consuming (Rodríguez-Martínez et al., 2022). The computer vision algorithms for the classification and semantic segmentation of Sargassum in photographs collected by citizen science are a step towards developing beach monitoring scalable techniques. Nevertheless, methods to discriminate Sargassum from other types of macroalgae or seagrasses are still needed to reduce false positives and avoid overestimating Sargassum landing volumes. The main challenge of monitoring techniques based on citizen science is for society to adopt them. The platforms based on data and images captured by the voluntary participation of citizens depend on a constant flow of data to produce value-added products. Also, for these platforms to be successful and use their total capacity, they should be run and promoted by the institutions in charge of Sargassum management. To date, most of the information available consists of photographs and isolated data records in different formats and with little or no knowledge of metadata.
Incorporating ML methodologies in the Sargassum observation process has contributed to minimizing the background noise in the satellite images, thereby reducing the number of false positives and negatives (Wang and Hu, 2020; Wang and Hu, 2021). However, it requires being more rigorous in its implementation, and evaluation. There are well-defined steps in ML that must be followed to successfully implement an algorithm. However, they have either not been followed or have not been discussed in the studies. For example, the supervised classification algorithms applied for Sargassum monitoring, requires balanced datasets with thousands of images for training stage (training, testing, and validation). However, most of the studies that employ ML algorithms, lack a detailed explanation about the characteristics of the dataset and about the hyperparameters settings. There is also a need to implement confusion matrices to analyses algorithm performance and implement metrics (F1 score, IoU), to assess with more detail the algorithm performance. Table 4 shows the general aspects expected to be described in any study using supervised classification algorithms.
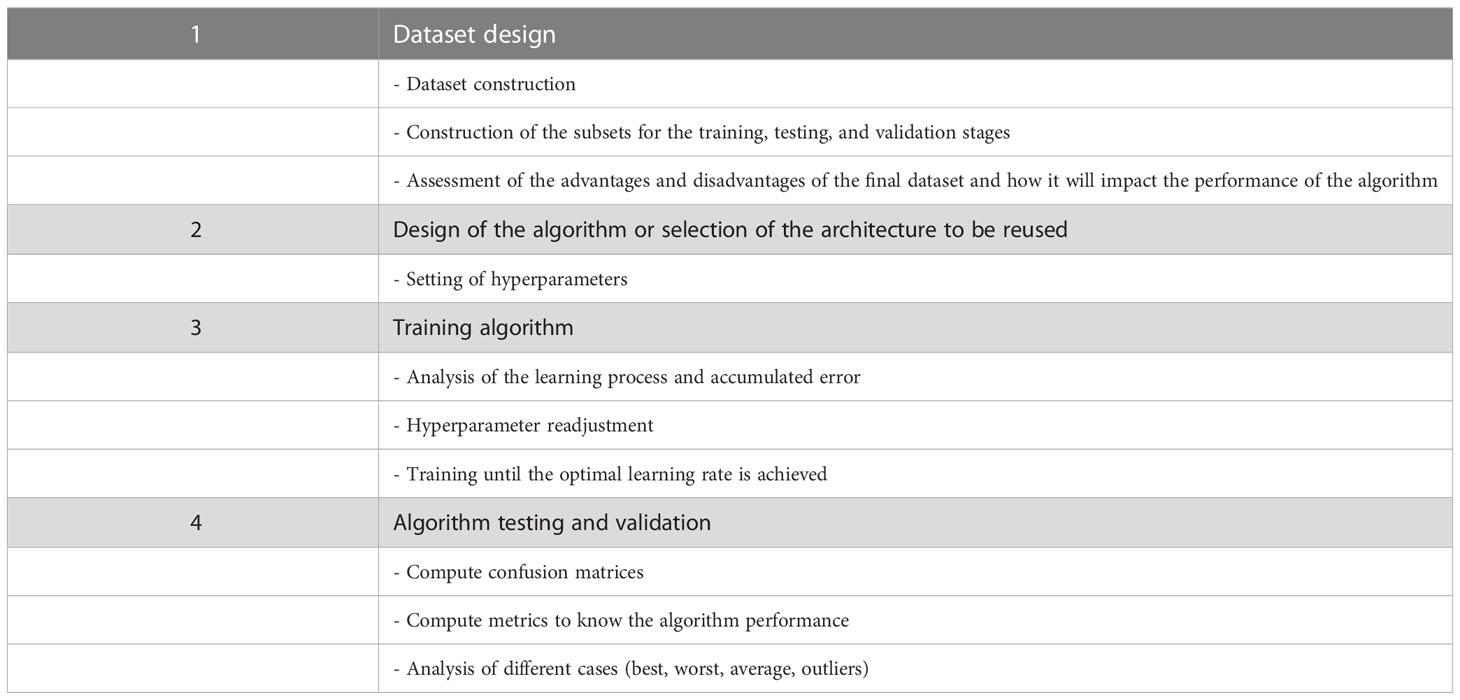
Table 4 Steps for the implementation of supervised classification algorithms.
6.3 Potential developments in the field
Regarding the application of high-resolution satellite imagery for monitoring Sargassum on the coast and beaches also has potential. Although its implementation may be economically costly, its application may be feasible for observing strategic study areas. On the other hand, the development of methodologies using inputs from geostationary satellite platforms is also pending.
Regarding citizen participation in monitoring proposals, an action that we consider essential for gathering data is the coordination and periodic participation of several sectors of the citizenry to serve their purpose.
Regarding the application of ML in the monitoring of Sargassum we consider is still in the initial stage, their potential has not been used yet, and improvements will help to obtain more information from satellite imagery. The current challenges are adequately implementing image processing and computer vision techniques to eliminate noise in the images regardless of their scale and to later ingest the image to the preferred index to detect Sargassum with the least possible error. We believe that designs from scratch are needed for Sargassum discrimination. On the other hand, DL are not always necessary, image processing and computer vision techniques in some cases may be sufficient for the Sargassum discrimination in an image.
A common feature in studies that use ML as a methodology to enhance Sargassum contrast in images is the use of the UNet architecture, which is a convolutional neural network developed for biomedical image segmentation at the Department of Informatics of the University of Freiburg (Ronneberger et al., 2015). One of the main features of this architecture is that it offers useful image translations from small training data sets (i.e., hundreds of images). This feature has allowed its application to address problems where data is scarce. Such is the case of Sargassum observation and monitoring, where the UNet has been used as an architecture base to improve Sargassum observations in oceans, coasts, and beaches.
Another challenge is the design of hybrid systems that incorporate information at different scales and environments to improve our understanding of the Sargassum phenomenon and the development of better strategies for its management, valorization, and disposal.
7 Conclusions
Ecological and social challenges caused by the enormous quantities of Sargassum arriving at beaches in most of the countries located in the CS, particularly since the year 2018 and to date, have generated the necessity of enhancing Sargassum monitoring onshore and nearshore to support the management and disposal of Sargassum. However, the methodologies used for monitoring Sargassum in the open sea are not useful on coasts and beaches due to various physical and biological factors. Thus, other areas of knowledge, such as computer science and citizen science, have been incorporated to contribute to the improvement of the results, at different scales, obtained using the traditional RS indices.
Currently, the benchmarks for Sargassum monitoring in the open ocean are the FAI and AFAI indexes inspired by the MCI and FLH indices. These four indices only differ in the input spectral bands that feed the equation. All the indices used for Sargassum monitoring, observe objects that contrast with the ocean surface. Therefore, what is observed could possibly be Sargassum or another type of algae (Syringodium, Trichodesmium, or Ulva) or object (garbage or emulsified oil). To address this challenge, the study conducted by Dierssen et al. (2015) proposes Sargassum discrimination in two different scenarios, the first step is to apply the NDVI index and then the LD, SI, or RGR indices, as appropriate. This methodology was implemented with high-resolution PRISM images.
From an image processing perspective, the main elements to be discriminated in an image to observe Sargassum can be grouped in two cases: 1) low-frequency elements, such as clouds and their shadows and even terra firma; and 2) high-frequency elements, such as wave crests and coastal zone heterogeneity. Buffers or masks can be used to overcome the drawbacks of low-frequency elements. To deal with high-frequency elements, various filtering techniques can be used. Despite advances in image processing, its application in the observation and monitoring of Sargassum is still at an early stage.
Computer vision techniques, implemented for several years in other areas of knowledge with excellent results, were incorporated in Sargassum monitoring until 2018. However, there are challenges to its proper implementation, for instance, there is a lack of information on the construction of the dataset and the criteria used to create the training, testing, and validation subsets; also, to evaluate the performance of algorithms, it is necessary to incorporate confusion matrices, performance evaluation metrics, and resampling techniques in case that the training dataset is a sample and not the whole population.
One of the main challenges in observing Sargassum in satellite images is background noise discrimination from the images to successfully apply a RS index. Recent proposals for Sargassum observation have focused on using various ML techniques to perform background noise removal. This means that ML has been applied only in the preprocessing of the images, therefore, ML designs implemented from scratch are needed.
Author contributions
HL-H and JA-V contributed to the conception and design of the study. HL-H performed the initial research and organized the peer-reviewed literature. HL-H performed the statistical analysis. HL-H and JA-V wrote the first draft of the manuscript. HL-H, JA-V, and RR-M evaluated and discussed sections of the manuscript for improvement. All authors contributed to the article and approved the submitted version.
Funding
We thank H L-H and ECOSUR for providing publication fees.
Acknowledgments
We would like to thank Deon Victoria Heffington for her help in the revisions and editions of this manuscript. We also thank MCs. José Antonio Quintero-Pérez (Academic Unit of Territorial Studies Yucatán - Institute of Geography, UNAM) for his technical assistance on Sargassum reflectance spectra.
Conflict of interest
The authors declare that the research was conducted in the absence of any commercial or financial relationships that could be construed as a potential conflict of interest.
Publisher’s note
All claims expressed in this article are solely those of the authors and do not necessarily represent those of their affiliated organizations, or those of the publisher, the editors and the reviewers. Any product that may be evaluated in this article, or claim that may be made by its manufacturer, is not guaranteed or endorsed by the publisher.
Footnotes
- ^ https://www.planet.com/our-constellations https://www.planet.com/our-constellations
- ^ https://optics.marine.usf.edu/projects/saws.htmlhttps://optics.marine.usf.edu/projects/saws.html
- ^ https://www.planet.com/our-constellationshttps://www.planet.com/our-constellations
References
Abbott M. R., Letelier R. M. (1999). Algorithm Theoretical Basis Document Chlorophyll Fluorescence (Modis Product Number 20) (Oregon State University, USA: NASA). Available at: http://www.modis.gsfc.nasa.gov/data/atbd.
Álvarez-Carranza G., Lazcano-Hernandez H. E. (2019). “Methodology to create geospatial modis dataset,” in Telematics and Computing. WITCOM 2019. Eds. Mata-Rivera M., Zagal-Flores R., Barría-Huidobro C.. Commun. Comput. Inf. Sci. (Springer, Cham), vol. 1053. doi: 10.1007/978-3-030-33229-7_3
Anderson D. M. (2007). The ecology and oceanography of harmful algal blooms: Multidisciplinary approaches to research and management. IOC Technical Series 74, UNESCO 2007. IOC/2007/TS/74. 39 p. Available at: http://hdl.handle.net/1834/42185.
Arellano-Verdejo J., Lazcano-Hernandez H. E. (2020). “Crowdsourcing for sargassum monitoring along the beaches in Quintana Roo,” in GIS LATAM. GIS LATAM 2020. Eds. Mata-Rivera M. F., Zagal-Flores R., Arellano Verdejo J., Lazcano Hernandez H. E.. Commun. Comput. Inf. Sci. (Springer, Cham), 1276. doi: 10.1007/978-3-030-59872-3_4
Arellano-Verdejo J., Lazcano-Hernandez H. E. (2021). Collective view: mapping sargassum distribution along beaches. PeerJ Comput. Sci. 7, e528. doi: 10.7717/peerj-cs.528
Arellano-Verdejo J., Lazcano-Hernandez H. E., Cabanillas-Terán N. (2019). Erisnet: deep neural network for sargassum detection along the coastline of the mexican caribbean. PeerJ 7, e6842. doi: 10.7717/peerj.6842
Arellano-Verdejo J., Santos-Romero M., Lazcano-Hernandez H. E. (2022). Use of semantic segmentation for mapping sargassum on beaches. PeerJ 10, e13537. doi: 10.7717/peerj.13537
Balado J., Olabarria C., Martínez-Sánchez J., Rodríguez-Perez J. R., Pedro A. (2021). Semantic segmentation of major macroalgae in coastal environments using high-resolution ground imagery and deep learning. Int. J. Remote Sens. 42, 1785–1800. doi: 10.1080/01431161.2020.1842543
Berk A., Conforti P., Hawes F. (2015). An accelerated line-by-line option for modtran combining on-the-fly generation of line center absorption within 0.1 cm-1 bins and pre-computed line tails. Proceedings Volume 9472, Algorithms and Technologies for Multispectral, Hyperspectral, and Ultraspectral Imagery XXI; 947217. doi: 10.1117/12.2177444
Berk A., Conforti P., Kennett R., Perkins T., Hawes F., Van Den Bosch J. (2014). “Modtran® 6: A major upgrade of the modtran® radiative transfer code,” in 2014 6th Workshop on Hyperspectral Image and Signal Processing: Evolution in Remote Sensing (WHISPERS). (Lausanne, Switzerland), pp. 1–4. doi: 10.1109/WHISPERS.2014.8077573
Binding C., Greenberg T., Bukata R. (2013). The meris maximum chlorophyll index; its merits and limitations for inland water algal bloom monitoring. J. Great Lakes Res. 39, 100–107. doi: 10.1016/j.jglr.2013.04.005
Blondeau-Patissier D., Gower J. F., Dekker A. G., Phinn S. R., Brando V. E. (2014). A review of ocean color remote sensing methods and statistical techniques for the detection, mapping and analysis of phytoplankton blooms in coastal and open oceans. Prog. Oceanography 123, 123–144. doi: 10.1016/j.pocean.2013.12.008
Borstad G. A. (1985). Analysis of Test and Flight Data From the Fluorescence Line Imager Vol. 83 (Canada: Fisheries and Oceans, Scientific Information and Publications Branch).
Campbell J. W., Feng H. (2005). “The empirical chlorophyll algorithm for modis: Testing the oc3m algorithm using nomad data,” in ocean color bio-optical algorithm mini-workshop (OCBAM). (Durham (USA): University of New Hampshire), 27–29. Available at: https://oceancolor.gsfc.nasa.gov/meetings/ocbam/Evaluation_of_OC3M.pdf.
Camps-Valls G., Tuia D., Zhu X. X., Reichstein M. (2021). Deep Learning for the Earth Sciences: A Comprehensive Approach to Remote Sensing, Climate Science and Geosciences (UK: John Wiley & Sons).
Charlier R. H., Morand P., Finkl C. W. (2008). How brittany and florida coasts cope with green tides. Int. J. Environ. Stud. 65, 191–208. doi: 10.1080/00207230701791448
Charlier R., Morand P., Finkl C., Thys A. (2007). “Green tides on the Brittany coasts,” 2006 IEEE US/EU Baltic International Symposium, Klaipeda, Lithuania, 1–13. doi: 10.1109/BALTIC.2006.7266128
Claustre H., Maritorena S. (2003). The many shades of ocean blue. Science 302, 1514–1515. doi: 10.1126/science.1092704
Clerc S. (2016). MPC-Team. S2 MPC—Data Quality Report, Technical Report 05, Online, Reference S2-PDGS-MPC-DQR. (Paris, France: European Space Agency). Available at: https://sentinel.esa.int/documents/247904/685211/Sentinel-2+Data+Quality+Report+(DQR)/ (accessed on 20 July 2023).
Cuevas E., Uribe-Martínez A., Liceaga-Correa M. Á. (2018). A satellite remote-sensing multi-index approach to discriminate pelagic Sargassum in the waters of the Yucatan Peninsula, Mexico. Int. J. Remote Sens. 39 (11), 3608–3627. doi: 10.1080/01431161.2018.1447162
Descloitres J., Minghelli A., Steinmetz F., Chevalier C., Chami M., Berline L. (2021). Revisited estimation of moderate resolution sargassum fractional coverage using decametric satellite data (s2-msi). Remote Sens. 13, 5106. doi: 10.3390/rs13245106
Dierssen H., Chlus A., Russell B. (2015). Hyperspectral discrimination of floating mats of seagrass wrack and the macroalgae sargassum in coastal waters of greater florida bay using airborne remote sensing. Remote Sens. Environ. 167, 247–258. doi: 10.1016/j.rse.2015.01.027
Dierssen H. M., Smith R. C. (2000). Bio-optical properties and remote sensing ocean color algorithms for antarctic peninsula waters. J. Geophysical Res: Oceans 105, 26301–26312. doi: 10.1029/1999JC000296
Garcıa-Sanchez M., Graham C., Vera E., Escalante-Mancera E., Alvarez-Filip L., van Tussenbroek B. I. (2020). Temporal changes in the composition and biomass of beached pelagic sargassum species in the mexican caribbean. Aquat. Bot. 167, 103275. doi: 10.1016/j.aquabot.2020.103275
Goela P. C., Icely J., Cristina S., Newton A., Moore G., Cordeiro C. (2013). Specific absorption coefficient of phytoplankton off the southwest coast of the iberian peninsula: A contribution to algorithm development for ocean colour remote sensing. Continental Shelf Res. 52, 119–132. doi: 10.1016/j.csr.2012.11.009
Goodfellow I., Bengio Y., Courville A. (2016). Deep Learning (Cambridge, Massachusetts, USA: MIT press).
Gower J., Hu C., Borstad G., King S. (2006). Ocean color satellites show extensive lines of floating sargassum in the gulf of mexico. IEEE Trans. Geosci. Remote Sens. 44, 3619–3625. doi: 10.1109/TGRS.2006.882258
Gower J. F., King S. A. (2011). Distribution of floating sargassum in the gulf of mexico and the atlantic ocean mapped using meris. Int. J. Remote Sens. 32, 1917–1929. doi: 10.1080/01431161003639660
Gower J., King S., Borstad G., Brown L. (2005). Detection of intense plankton blooms using the 709 nm band of the meris imaging spectrometer. Int. J. Remote Sens. 26, 2005–2012. doi: 10.1080/01431160500075857
Gower J., King S., Goncalves P. (2008). Global monitoring of plankton blooms using meris mci. Int. J. Remote Sens. 29, 6209–6216. doi: 10.1080/01431160802178110
Gower J., King S., Yan W., Borstad G., Brown L. (2003). “Use of the 709 nm band of meris to detect intense plankton blooms and other conditions in coastal waters.” Proc. of the 2004 Envisat & ERS Symposium, Salzburg, Austria. 6–10. September 2004 (ESA SP-572, April 2005).
Gower J., Young E., King S. (2013). Satellite images suggest a new sargassum source region in 2011. Remote Sens. Lett. 4, 764–773. doi: 10.1080/2150704X.2013.796433
Hossin M., Sulaiman M. N. (2015). A review on evaluation metrics for data classification evaluations. Int. J. Data Min. Knowledge Manage. Process 5, 1. doi: 10.5121/ijdkp.2015.5201
Hu C. (2009). A novel ocean color index to detect floating algae in the global oceans. Remote Sens. Environ. 113, 2118–2129. doi: 10.1016/j.rse.2009.05.012
Hu C., Cannizzaro J., Carder K. L., Muller-Karger F. E., Hardy R. (2010a). Remote detection of trichodesmium blooms in optically complex coastal waters: Examples with modis full-spectral data. Remote Sens. Environ. 114, 2048–2058. doi: 10.1016/j.rse.2010.04.011
Hu C., Feng L., Hardy R. F., Hochberg E. J. (2015). Spectral and spatial requirements of remote measurements of pelagic sargassum macroalgae. Remote Sens. Environ. 167, 229–246. doi: 10.1016/j.rse.2015.05.022
Hu C., Feng L., Lee Z., Davis C. O., Mannino A., McClain C. R., et al. (2012). Dynamic range and sensitivity requirements of satellite ocean color sensors: learning from the past. Appl. Optics 51, 6045–6062. doi: 10.1364/AO.51.006045
Hu C., He M.-X. (2008). Origin and offshore extent of floating algae in olympic sailing area. Eos Trans. Am. Geophysical Union 89, 302–303. doi: 10.1029/2008EO330002
Hu C., Li D., Chen C., Ge J., Muller-Karger F. E., Liu J., et al. (2010b). On the recurrent ulva prolifera blooms in the yellow sea and east china sea. J. Geophysical Res: Oceans 115, C05017. doi: 10.1029/2009JC005561
Hu C., Wang M., Lapointe B. E., Brewton R. A., Hernandez F. J. (2021). On the Atlantic pelagic Sargassum's role in carbon fixation and sequestration. Sci. Total Environ. 781, 146801. doi: 10.1016/j.scitotenv.2021.146801
Huete A., Justice C., Van Leeuwen W. (1999). Modis vegetation index (mod13). Algorithm Theor. Basis Doc. 3, 295–309.
Iporac L. A. R., Olszak S., Burkholder D., Collado-Vides L. (2020). Lessons and challenges in piloting “Sargassum watch,” a citizen science program to monitor pelagic Sargassum landings in South Florida. Proc. 72nd Gulf and Caribbean Fisheries Institute, Punta Cana, Dominican Republic., 246–252. November 2-8, 2019
Johns E. M., Lumpkin R., Putman N. F., Smith R. H., Muller-Karger F. E., Rueda-Roa D. T., et al. (2020). The establishment of a pelagic sargassum population in the tropical atlantic: biological consequences of a basin-scale long distance dispersal event. Prog. Oceanography 182, 102269. doi: 10.1016/j.pocean.2020.102269
Kahru M., Leppanen J.-M., Rud O. (1993). Cyanobacterial blooms cause heating of the sea surface. Mar. Ecol. Prog. Ser. 101, 1–7. doi: 10.3354/meps101001
Kohler K. E., Gill S. M. (2006). Coral point count with excel extensions (cpce): A visual basic program for the determination of coral and substrate coverage using random point count methodology. Comput. Geosci. 32, 1259–1269. doi: 10.1016/j.cageo.2005.11.009
Lazcano-Hernandez H.-E., Aguilar G., Dzul-Cetz G. A., Patino R., Arellano-Verdejo J. (2019). Off-line and on-line optical monitoring of microalgal growth. PeerJ 7, e7956. doi: 10.7717/peerj.7956
Lee Z., Carder K. L., Mobley C. D., Steward R. G., Patch J. S. (1998). Hyperspectral remote sensing for shallow waters. i. a semianalytical model. Appl. Optics 37, 6329–6338. doi: 10.1364/AO.37.006329
Letelier R. M., Abbott M. R. (1996). An analysis of chlorophyll fluorescence algorithms for the moderate resolution imaging spectrometer (modis). Remote Sens. Environ. 58, 215–223. doi: 10.1016/S0034-4257(96)00073-9
Liu H. Q., Huete A. (1995). A feedback based modification of the ndvi to minimize canopy background and atmospheric noise. IEEE Trans. Geosci. Remote Sens. 33, 457–465. doi: 10.1109/TGRS.1995.8746027
Long Y., Ye Y. (2016). Human-scale urban form: Measurements, performances, and urban planning & design interventions. South Archit. 36, 39–45.
Martínez-González G. (2019). Sargazo: la irrupción atípica de un ecosistema milenario. Salud. Pública México 61, 698–700. doi: 10.21149/10838
Minsky M. (1961). Steps toward artificial intelligence. Proc. IRE 49, 8–30. doi: 10.1109/JRPROC.1961.287775
Odermatt D., Gitelson A., Brando V. E., Schaepman M. (2012). Review of constituent retrieval in optically deep and complex waters from satellite imagery. Remote Sens. Environ. 118, 116–126. doi: 10.1016/j.rse.2011.11.013
Ody A., Thibaut T., Berline L., Changeux T., Andre J.-M., Chevalier C., et al. (2019). From in situ to satellite observations of pelagic sargassum distribution and aggregation in the tropical north atlantic ocean. PloS One 14 (9), e0222584. doi: 10.1371/journal.pone.0222584
O’Reilly J. E., Maritorena S., Mitchell B. G., Siegel D. A., Carder K. L., Garver S. A., et al. (1998). Ocean color chlorophyll algorithms for seawifs. J. Geophysical Res: Oceans 103, 24937–24953. doi: 10.1029/98JC02160
O’Reilly J. E., Maritorena S., Siegel D. A., O’Brien M. C., Toole D., Mitchell B. G., et al. (2000). Ocean color chlorophyll a algorithms for SeaWiFS, OC2, and OC4: Version 4. SeaWiFS Postlaunch Calibration Validation Analyses Part 3, 9–23.
Ortega-Flores P. A., Serviere-Zaragoza E., De Anda-Montanez J. A., Freile-Pelegrın Y., Robledo D., Mendez-Rodríguez L. C. (2022). Trace elements in pelagic sargassum species in the mexican caribbean: Identification of key variables affecting arsenic accumulation in s. fluitans. Sci. Total Environ. 806, 150657. doi: 10.1016/j.scitotenv.2021.150657
Palmer S. C. J., Hunter P. D., Lankester T., Hubbard S., Spyrakos E., Tyler A. N., et al. (2015). Validation of Envisat MERIS algorithms for chlorophyll retrieval in a large, turbid and optically-complex shallow lake. Remote Sens. Environ. 157, 158–169. doi: 10.1016/j.rse.2014.07.024
Prangsma G., Roozekrans J. (1989). Using noaa avhrr imagery in assessing water quality parameters. Int. J. Remote Sens. 10, 811–818. doi: 10.1080/01431168908903921
Putman N. F., Beyea R. T., Iporac L. A. R., Trinanes J., Ackerman E. G., Olascoaga M. J., et al. (2023). Improving satellite monitoring of coastal inundations of pelagic sargassum algae with wind and citizen science data. Aquat. Bot. 188, 103672. doi: 10.1016/j.aquabot.2023.103672
Putman N. F., Goni G. J., Gramer L. J., Hu C., Johns E. M., Trinanes J., et al. (2018). Simulating transport pathways of pelagic sargassum from the equatorial atlantic into the caribbean sea. Prog. Oceanography 165, 205–214. doi: 10.1016/j.pocean.2018.06.009
Qi L., Hu C., Mikelsons K., Wang M., Lance V., Sun S., et al. (2020). In search of floating algae and other organisms in global oceans and lakes. Remote Sens. Environ. 239, 111659. doi: 10.1016/j.rse.2020.111659
Qi L., Hu C., Wang M., Shang S., Wilson C. (2017). Floating algae blooms in the east china sea. Geophysical Res. Lett. 44, 11–501. doi: 10.1002/2017GL075525
Resiere D., Valentino R., Neviere R., Banydeen R., Gueye P., Florentin J., et al. (2018). Sargassum seaweed on caribbean islands: an international public health concern. Lancet 392, 2691. doi: 10.1016/S0140-6736(18)32777-6
Rodríguez-Martínez R. E., Jordan-Dahlgren E., Hu C. (2022). Spatio-temporal variability of pelagic sargassum landings on the northern mexican caribbean. Remote Sens. Applications: Soc. Environ. 27, 100767. doi: 10.1016/j.rsase.2022.100767
Rodríguez-Martínez R., Medina-Valmaseda A., Blanchon P., Monroy-Velazquez L., Almazan- Becerril A., Delgado-Pech B., et al. (2019). Faunal mortality associated with massive beaching and decomposition of pelagic sargassum. Mar. pollut. Bull. 146, 201–205. doi: 10.1016/j.marpolbul.2019.06.015
Ronneberger O., Fischer P., Brox T. (2015). “U-net: Convolutional networks for biomedical image segmentation, ” in Medical Image Computing and Computer-Assisted Intervention – MICCAI 2015. MICCAI 2015. Eds. Navab N., Hornegger J., Wells W., Frangi A. Lect. Notes Comput. Sci. (Springer, Cham), vol 9351. doi: 10.1007/978-3-319-24574-4_28
Rouse J. W., Haas R. H., Schell J. A., Deering D. W.. (1974). Monitoring vegetation systems in the great plains with erts. NASA Spec. Publ. 351, 309.
Rutten J., Arriaga J., Montoya L. D., Marino-Tapia I. J., Escalante-Mancera E., Mendoza E. T., et al. (2021). Beaching and natural removal dynamics of pelagic sargassum in a fringing-reef lagoon. J. Geophysical Res: Oceans 126, e2021JC017636. doi: 10.1029/2021JC017636
Santos-Romero M., Arellano-Verdejo J., Lazcano-Hernandez H. E., Reyes P. D. (2022). “Automatic classification of images with beach linear perspective using convolutional neural networks,” in 2022 IEEE Mexican International Conference on Computer Science (ENC), Xalapa, Veracruz, Mexico, 2022, pp. 1–8. doi: 10.1109/ENC56672.2022.9882952
Sathyendranath S., Cota G., Stuart V., Maass H., Platt T. (2001). Remote sensing of phytoplankton pigments: a comparison of empirical and theoretical approaches. Int. J. Remote Sens. 22, 249–273. doi: 10.1080/014311601449925
Schamberger L., Minghelli A., Chami M. (2022). Quantification of underwater sargassum aggregations based on a semi-analytical approach applied to sentinel-3/olci (copernicus) data in the tropical atlantic ocean. Remote Sens. 14, 5230. doi: 10.3390/rs14205230
Shin J., Lee J.-S., Jang L.-H., Lim J., Khim B.-K., Jo Y.-H. (2021). Sargassum detection using machine learning models: a case study with the first 6 months of goci-ii imagery. Remote Sens. 13, 4844. doi: 10.3390/rs13234844
Smetacek V., Zingone A. (2013). Green and golden seaweed tides on the rise. Nature 504, 84–88. doi: 10.1038/nature12860
Torres-Conde E. G. (2022). Is simultaneous arrival of pelagic sargassum and physalia physalis a new threat to the atlantic coasts? Estuarine Coast. Shelf Sci. 275, 107971. doi: 10.1016/j.ecss.2022.107971
Torres-Conde E. G., Martínez-Daranas B. (2020). Análisis espacio-temporal y oceanográfico de las arribazones de Sargassum pelagico en las playas del este de la Habana, Cuba. Revista de Investigaciones Marinas 40, 22–41.
Uribe-Martínez A., Guzman-Ram´ırez A., Arregu´ın-Sanchez F., Cuevas E. (2020). El Sargazo En Elcaribe Mexicano, Revision De Una Historia Impensable (Campeche, México: Gobernanza y Manejo de las Costas y Mares ante la Incertidumbre), 743.
Valentini N., Balouin Y. (2020). Assessment of a smartphone-based camera system for coastal image segmentation and sargassum monitoring. J. Mar. Sci. Eng. 8, 23. doi: 10.3390/jmse8010023
Van Eck N., Waltman L. (2010). Software survey: Vosviewer, a computer program for bibliometric mapping. scientometrics 84, 523–538. doi: 10.1007/s11192-009-0146-3
Volpe G., Santoleri R., Vellucci V., Ribera d’Alcala M., Marullo S., D’Ortenzio F. (2007). The colour of the mediterranean sea: Global versus regional bio-optical algorithms evaluation and implication for satellite chlorophyll estimates. Remote Sens. Environ. 107, 625–638. doi: 10.1016/j.rse.2006.10.017
Wang M., Hu C. (2016). Mapping and quantifying sargassum distribution and coverage in the central west atlantic using modis observations. Remote Sens. Environ. 183, 350–367. doi: 10.1016/j.rse.2016.04.019
Wang M., Hu C. (2020). Automatic extraction of sargassum features from sentinel-2 msi images. IEEE Trans. Geosci. Remote Sens. 59, 2579–2597. doi: 10.1109/TGRS.2020.3002929
Wang M., Hu C. (2021). Satellite remote sensing of pelagic sargassum macroalgae: The power of 1000 high resolution and deep learning. Remote Sens. Environ. 264, 112631. doi: 10.1016/j.rse.2021.112631
Wang M., Hu C., Barnes B. B., Mitchum G., Lapointe B., Montoya J. P. (2019). The great atlantic sargassum belt. Science 365, 83–87. doi: 10.1126/science.aaw7912
Wang M., Hu C., Cannizzaro J., English D., Han X., Naar D., et al. (2018). Remote sensing of sargassum biomass, nutrients, and pigments. Geophysical Res. Lett. 45, 12–359. doi: 10.1029/2018GL078858
Xiao J., Wang Z., Liu D., Fu M., Yuan C., Yan T. (2021). Harmful macroalgal blooms (hmbs) in china’s coastal water: Green and golden tides. Harmful Algae 107, 102061. doi: 10.1016/j.hal.2021.102061
Xue J., Su B. (2017). Significant remote sensing vegetation indices: A review of developments and applications. J. Sens. 2017, 1353691. doi: 10.1155/2017/1353691
Zhang S., Hu C., Barnes B. B., Harrison T. N. (2022). Monitoring sargassum inundation on beaches and nearshore waters using planetscope/dove observations. IEEE Geosci. Remote Sens. Lett. 19, 1–5. doi: 10.1109/LGRS.2022.3148684
Keywords: remote sensing, machine learning, deep learning, citizen science, crowdsourcing
Citation: Lazcano-Hernandez HE, Arellano-Verdejo J and Rodríguez-Martínez RE (2023) Algorithms applied for monitoring pelagic Sargassum. Front. Mar. Sci. 10:1216426. doi: 10.3389/fmars.2023.1216426
Received: 03 May 2023; Accepted: 06 July 2023;
Published: 03 August 2023.
Edited by:
Padmanava Dash, Mississippi State University, United StatesReviewed by:
Jisun Shin, Pusan National University, Republic of KoreaRajendra Mohan Panda, Mississippi State University, United States
Eduardo Cuevas, Universidad Autónoma de Baja California, Mexico
Copyright © 2023 Lazcano-Hernandez, Arellano-Verdejo and Rodríguez-Martínez. This is an open-access article distributed under the terms of the Creative Commons Attribution License (CC BY). The use, distribution or reproduction in other forums is permitted, provided the original author(s) and the copyright owner(s) are credited and that the original publication in this journal is cited, in accordance with accepted academic practice. No use, distribution or reproduction is permitted which does not comply with these terms.
*Correspondence: Hugo E. Lazcano-Hernandez, aGxhemNhbm9oQGVjb3N1ci5teA==; Javier Arellano-Verdejo, amF2aWVyLmFyZWxsYW5vQGVjb3N1ci5teA==