 Jinmu Kim
 Seung Jae Lee
 Euna Jo
 Eunkyung Choi1
 Jeong-Hoon Kim
 Hyun Park
- 1Department of Biotechnology, College of Life Sciences and Biotechnology, Korea University, Seoul, Republic of Korea
- 2Division of Polar Life Science, Korea Polar Research Institute (KOPRI), Incheon, Republic of Korea
The Patagonian moray cod, Muraenolepis orangiensis, belongs to the family Muraenolepididae and is the sole order of Gadiformes that inhabits the temperate and cold waters of the southern hemisphere. One of the features of the Gadiformes order is that they have a remarkably unique immune gene repertoire that influences innate and adaptive immunity, and they lack major histocompatibility complex (MHC) class II, invariant chains (CD74), and CD4 genes. In this study, a high-quality chromosome-level genome assembly was constructed, resulting in a final assembled genome of 893.75 Mb, with an N50 scaffold length of 30.07 Mb and the longest scaffold being 39.77 Mb. Twenty-five high-quality pseudochromosomes were assembled, and the complete BUSCO rate was 93.4%. A total of 34,553 genes were structurally annotated, and 27,691 genes were functionally annotated. Among the 10 primary genes involved in MHC class II, only two ERAP1 genes and one AIRE gene were identified through the genome study. Although no specific reason for the MHC class II deficiency has been identified, it has been shown that the toll-like receptors (TLRs), which are significant to the innate immune response, are significantly expanded in M. orangiensis. A total of 44 TLRs have been identified, with 32 TLR13 genes distributed evenly on six different pseudochromosomes. This study is the first to reveal the whole genome of a Muraenolepididae family and provides valuable insights into the potential rationale for the MHC class II deficiency in a Gadiformes fish species.
1 Introduction
The Patagonian moray cod, Muraenolepis orangiensis, belongs to the Muraenolepididae family and lives in the moderate and frigid seas of the southern hemisphere (Balushkin and Prirodina, 2006). While the biological features and taxonomy of this species are not well studied, the family’s morphological characteristics include joined dorsal, anal, and caudal fins, and no teeth (Parkes, 1992). According to FishBase web data, M. orangiensis has a depth distribution of 135–860 m and a size range of 20 cm (https://www.fishbase.se/summary/7127). They live near the ocean’s bottom, at midwater depth, or near the surface. Muraenolepididae, the family of eel cods, comprises one genus, Muraenolepis Günther, 1880, and has five different species: M. marmorata Günther, 1880; M. microps (Lönnberg et al., 1905); M. orangiensis Vaillant, 1888; M. microcephala Norman, 1937; and M. andriashevi Balushkin and Prirodina, 2005. A research identified the mitochondrial 16S and COI sequences of Muraenolepis fishes, confirming that M. microps is a junior synonym of M. marmorata (Fitzcharles et al., 2021). Taxonomically, morphological traits are quite significant. However, it is very difficult to distinguish these species by morphological traits, therefore, genome information of this species will be of great help in distinguishing their characteristics. The Gadiformes family Muraenolepididae inhabits the continental ocean of Antarctica, remote islands (Prince Edward, Bouvet, Crozet, Kerguelen, Macquarie, and Heard) and banks of the Southern Ocean (Ob, Lena, and banks at the Discovery Seamounts), off islands of the Scotia Sea (from the South Shetland to South Georgia and Shag Rocks), off islands of the New Zealand plateau, on seamounts of the Pacific-Antarctic Ridge, and the southern shelves of South Africa and America, including the Agulhas Bank (Lönnberg et al., 1905; Balushkin and Prirodina, 2006). M. orangiensis inhabits the Southwest Atlantic (Strait of Magellan), the Patagonian region of Argentina, and the Southern Ocean, including the Kerguelen, Heard, and Crozet islands (Nakamura et al., 1986). Muraenolepis fish are prevalent near South Georgia, where they are taken in modest quantities in most demersal trawls on the shelf and upper slope, and they have been reported in the diet of Patagonian and Antarctic toothfish. Among the other Muraenolepis species, M. marmorata is certainly numerous on the South Georgia shelf, but its ecological importance is unclear. Despite the lack of knowledge on the Muraenolepis genus, it may be identified as a key fish in the food chain of numerous Antarctic species living in severe environments (Fitzcharles et al., 2021). Muraenolepis species are also known to live in the Ross Sea Marine Protected Area (MPA). The region is the world’s most protected maritime area and one of the primary study sites in the Antarctic environment. The Ross Sea MPA, located in the Southern Ocean off the coast of Antarctica, is distinguished by its unique and pristine environment, making it a key spot for scientific research and discovery. The Ross Sea MPA is known for its diverse biodiversity and acts as a haven for a variety of species, including marine mammals, seabirds, and fish (Brooks et al., 2021). It is known as a significant research region of the Antarctic ecology in this regard.
The increased use of high-throughput sequencing techniques has made genome resources of non-model species readily available, which has been followed by large efforts in comparative immunology (Palti, 2011; Malmstrom et al., 2016). Previous research has identified a few shared denominators of vertebrate immunity however, it has revealed significant gene loss and expansions, altering our knowledge of functional compartments and the organization of the immune system in vertebrates (Jin et al., 2020). This order of Gadiformes teleosts has a specific immune gene repertoire that affects innate and adaptive immunity and lacks the major histocompatibility complex (MHC) class II, invariant chains (CD74), and CD4 genes, according to the recently published genome of Gadus morhua and approximately 30 Gadiformes genomes. Additionally, the Atlantic cod genome has a substantial number of MHC I genes as well as a distinct repertoire of toll-like receptors (TLRs) (Sundaram et al., 2012; Malmstrom et al., 2016). The expanded teleost-specific TLR families in Atlantic cod differ from those found in other teleosts, providing an example of why and how so many duplicated genes have been maintained during vertebrate evolution (Sundaram et al., 2012).
The complex MHC pathways and their functionalities are well-defined as critical elements of vertebrate adaptive immune systems (Neefjes et al., 2011; Parham, 2015); nevertheless, the origins of MHC copy number variation are less known (Neefjes et al., 2011). This increase in MHC genes offers an immunological tradeoff where an increase in MHC genes improves pathogen detection but simultaneously reduces the number of circulating T cells (Reusch et al., 2001; Milinski, 2006; Klein et al., 2014). As a result of this tradeoff, the immune system can identify a high number of pathogens but is less effective at removing them. As seen by choosing five to ten copies reported in case studies of other fish, it is envisaged that MHC copy number evolution will be steered toward intermediate optima established by the tradeoff through finding and removing the pathogens (Aeschlimann et al., 2003; Kalbe et al., 2009). The optimal number of MHC copies changes depending on the environment due to differences in pathogen burden and associated selection pressures (Eizaguirre et al., 2012; Karvonen and Seehausen, 2012). As a result, MHC genes are thought to have a significant role in speciation, although this involvement has never been evaluated in a macroevolutionary context (Eizaguirre et al., 2009; Karvonen and Seehausen, 2012). Nevertheless, when, and how MHC class II was deficient in connection to MHC I extension, and if it was causally connected to these genetic modifications remains unsolved (Malmstrom et al., 2016).
In this study, we report the first high-quality whole genome and genomic information of the Muraenolepididae family. Furthermore, we aimed to understand the immune system of M. orangiensis, one of the driving forces enabling the species to survive in harsh environments, by confirming MHC class II immunodeficiency (Malmstrom et al., 2016). This study sheds light on the first evolutionary trajectory of some major life-history traits of the Muraenolepididae family, which may provide important clues for ecological and genomic studies addressing Antarctic biota, and it contributes a reference genome for future comparative studies of Antarctic adaptations and the species in Muraenolepididae family.
2 Materials and methods
2.1 Sample collection
The sample was captured from the Ross Sea (77◦050 S, 170◦300 E on CCAMLR Subarea 88.1), Antarctica, and then placed in a -80 ◦C freezer. The specimen was used for total RNA extraction and DNA isolation. The frozen muscle samples were anatomized, and the traditional phenol-chloroform method was used to produce high-quality and pure DNA for long-read sequencing on the PacBio Sequel platform (Pacific Biosciences, USA). The quality and quantity of genomic DNA were confirmed using a Qubit 2.0 Fluorometer (Life Technologies, Carlsbad, CA, USA), and a Fragment Analyzer (Agilent Technologies, Santa Clara, CA, USA), respectively. Following the manufacturer’s guidance, total RNA was extracted from muscle and skin samples using a RNeasy Mini Kit (Qiagen). The quality and quantity of the RNA were confirmed using a Qubit 2.0 Fluorometer (Life Technologies, Carlsbad, CA, USA) and a Fragment Analyzer (Agilent Technologies, Santa Clara, CA, USA).
2.2 Library construction and genome sequencing
The genomic DNA was used to construct the single-molecule real-time (SMRT) bell library and was sequenced using eight SMRT cells (Pacific Biosciences, Sequel™ SMRT Cell 1M v2) with a Sequel Sequencing Kit 2.1 (Pacific Biosciences, USA) and one 600-minute movie was captured for each SMRT cell.
The muscle tissue was used to construct the whole-genome sequencing (WGS) library via the TruSeq Nano DNA library kit (Illumina San Diego, CA, USA). We used 1 µg of DNA, which was sheared into 350–450 bp fragments using a Covaris E220. The end of each DNA fragment was repaired, and an ‘A’ base was added to the 3’ end to make a sticky end. After ligation, an Illumina adapter was ligated to both ends of the DNA fragments, and PCR amplification was performed on each sample. The constructed library was purified, and the final WGS library was sequenced on an Illumina NovaSeq 6000 platform (Illumina San Diego, CA, USA).
The Hi-C chromatin contact map was constructed using muscle tissues from the same individual for the high-quality chromosome-level assembly. The muscle was crosslinked with PBS and formaldehyde, and the chromatin was prepared. 800 ng of the chromatin were utilized to prepare the library after the chromatin sample had been normalized. The chromatin was collected and digested with a restriction enzyme. Using a Covaris system after the crosslink reversal, 200 ng of DNA was sheared. The sheared DNA fragments were end-repaired and ligated with an Illumina adaptor. The ligated DNA was verified using Streptavidin magnetic beads before being amplified via PCR to enrich the fragments. The insert size and the concentration of the constructed libraries were checked. Then they were sequenced using an Illumina NovaSeq 6000 platform (Illumina San Diego, CA, USA) with a 150 bp paired-end strategy.
Total RNA (1 µg) from the muscle and skin tissues was pooled for RNA sequencing. The pooled samples were sequenced using one SMRT cell v3 based on P6-C4 chemistry after the standard full-length cDNA (1–3 kb) library preparation. Three SMRT cells were sequenced on a PacBio Sequel system (Pacific Biosciences, USA). A SMRT Link version 6.0.0 was used for quality checking, filtering, and clustering of the Iso-Seq sequencing data.
2.3 Genome assembly
A Flye assembler v2.9.1 (Kolmogorov et al., 2019) was utilized with the default parameters to create the de novo genome assembly of M. orangiensis. The Illumina data were used for polishing errors and improving the assembled genome by a Pilon v1.24 with the default parameters (Walker et al., 2014). HiRise software was used to conduct the chromosome-level genome assembly of M. orangiensis (Putnam et al., 2016). The assembled genome and the raw reads from the Hi-C libraries were aligned to construct a probability model for the genomic distance between read pairs. The genomic linking information between the contigs was generated, and mis-joins were corrected to create a pseudo-molecule-level scaffold genome. The Hi-C file comprising the contact matrices with duplication removal linking information was created using Juicer v1.6 (Durand et al., 2016b), and the Hi-C raw sequence data were aligned using BWA-MEM (Li, 2013). The contact map plot was drawn and visualized using Juicebox v1.6 (Durand et al., 2016a). Although there was no karyotype data from the Muraenolepididae family, we estimated that the scaffolds larger than 10 Mb were pseudochromosomes. The genome’s completeness was confirmed using Benchmarking Universal Single-Copy Orthologs (BUSCO) v5.4.6 (Manni et al., 2021) with the Actinopterygii odb10 database. The statistics for contig-level genome assembly were estimated by assemblathon_stats.pl (https://github.com/ucdavisbioinformatics/assemblathon2-analysis).
2.4 Repeat analysis and annotation
RepeatModeler2 (Flynn et al., 2020) was used to build the de novo repeat library with the default parameters in RepeatScout and RECON software. The consensus sequences and categorization information for each repeat were predicted using the Tandem Repeats Finder (Benson, 1999). All the repeats gathered by RepeatModeler were confirmed using the UniProt/SwissProt database (Dimmer et al., 2012). The raw LTR data from LTRharvest (Ellinghaus et al., 2008) and LTR_FINDER (Xu and Wang, 2007) were combined to construct the LTR library using LTR_retriever (Ou and Jiang, 2017). The highly accurate identification of long terminal repeat retrotransposons (LTR-RTs) was made using the LTR library. The repeating elements were identified using a de novo repeat library and RepeatMasker v4.1.4. The repetition landscape was estimated for each alignment using the Kimura distance.
The gene prediction of M. orangiensis was conducted using EvidenceModeler (EVM) v2.0 (Haas et al., 2008). First, the repeat masked genome was used for ab initio gene prediction using Augustus v3.5.0 (Stanke et al., 2006) and GeneMark-ES v4.68 (Lomsadze et al., 2005). Then, the hints for protein and ab initio prediction were extracted along with extensive protein sequences from the Actinopterygii clade of bony fishes in the UniProt/SwissProt protein database (UniProt, 2019) using ProtHint v2.6.0 (Bruna et al., 2020). The ProtHints output file was used to conduct the gene prediction for protein. Next, using the PASA pipeline v2.5.2 (Haas et al., 2008) with the Iso-Seq data, evidence for the transcriptome was generated for more accurate gene predictions of M. orangiensis. The results from the ab initio, transcriptome, and protein with their weights of contribution were integrated by EVM for the final gene predictions. Finally, to update the gene predictions into changing exons and adding un-translated regions (UTRs), we reused the PASA pipeline with the Iso-Seq data. Genome Annotation Generator v2.0.1 (Geib et al., 2018) was used to add the start and stop codon information and generate the gff3 file.
The predicted genes were annotated using NCBI BLAST v2.9.0 (Altschul et al., 1990) with a maximum e-value of 1e-5 by aligning the sequences to the NCBI non-redundant protein (nr) databases (Marchler-Bauer et al., 2011). InterProScan v92.0 (Paysan-Lafosse et al., 2022) was used with the default parameters and the protein sequences to identify the protein domains. Trinotate v3.2.2 (Bryant et al., 2017) was used for broad annotation of the transcriptome sequences, TransDeocder v5.5.0 was used to decode the amino acid sequences, SignalP v6.0 (Teufel et al., 2022) was used for the protein signal peptides, and Pfam (Sonnhammer et al., 1997) was used for the protein family predictions. The protein signatures were aligned against the Kyoto Encyclopedia of Genes and Genomes (KEGG) database to fetch KEGG-relevant functional annotations (Kanehisa and Goto, 2000). Gene Ontology (GO) terms were assigned to the genes for the gene function predictions and classifications using Blast2GO v6.0 (Conesa et al., 2005).
2.5 Comparative analysis
Nucmer in the MUMmer software package v4.02b (Marcais et al., 2018) with the following parameter -c 1100 -g 10000 and add –mum for unique match avoid repeat region was used to compare the genome sequences at the chromosome level. The long sequences corresponding to pseudochromosomes were selected and compared, excluding the unarranged scaffolds and contigs sequences. Circos (Krzywinski et al., 2009) was used for the comparative genomics, and a custom script was employed to convert the coordinate information from Nucmer into a Circos-compatible format. G. morhua was used as a reference genome, and the results of the chromosome comparison between the two genomes were diagrammed using Circos.
M. orangiensis and 20 well-assembled and annotated teleost genomes were utilized to identify the gene families and build a phylogenetic tree. The longest coding sequences (CDS) for each species were extracted from the annotated gff3 file using AGAT v1.0 (Dainat, 2021). To fetch the longest isoform, the agat_sp_keep_longest_isoform.pl script was used, and to extract the data to a fasta file, the agat_sp_extract_sequences.pl script was used. The CDS were converted to amino acid sequences using the “transeq” function in EMBOSS v6.6.0 (Rice et al., 2000). The protein sequences were used to classify the orthologous gene cluster using the OrthoMCL pipeline (Li et al., 2003) and applied the Markov Clustering Algorithm with default options in all the steps.
A phylogenetic tree was built using single-copy orthologous gene clusters. They were aligned using a Probabilistic Alignment Kit (Löytynoja and Goldman, 2005) with the codon alignment option. For the ensuing steps Gblocks (Castresana, 2000) were utilized to filter out the erratically aligned and gapped regions. Molecular Evolutionary Genetics Analysis (MEGA) v11.0 (Tamura et al., 2021) was used to construct the phylogenetic tree of 21 teleost species. The maximum-likelihood tree method was applied using RAxML (Stamatakis, 2014) under 1,000 bootstrap replications of the Jones-Taylor-Thornton (JTT) model. The divergence times calibration was conducted using Timetree (Hedges et al., 2006), and four teleosts were used (the minimum and maximum divergence times for Acanthochromis polyacanthus and Amphiprion percula were 27.0 and 29.3 million years ago (Mya); the smallest and largest divergence periods for G. morhua and Danio rerio were 180.0 and 264.0 Mya.
The previously identified orthologous gene clusters were utilized in conjunction with the five well-assembled and annotated Antarctic fish species to identify unique orthologs that live in frigid environments. Among the orthologous gene clusters, the specific gene families included in M. orangiensis were selected, and the functional categories were identified using a Blast2GO enrichment test with a Fisher’s exact test cutoff of a p-value of less than or equal to 0.05. CAFÉ v5.0 (Mendes et al., 2020) was used to perform the statistical tests for gene family expansion and contraction to identify how the gene families have altered during the evolution of M. orangiensis. The default parameters were used and identified the likelihood of the gene family expansion and contraction with a p-value of less than or equal to 0.05. The expanded and contracted genes of M. orangiensis were sorted, and the GO categories were identified using a Blast2GO enrichment test with a Fisher’s exact test cutoff of a p-value of less than or equal to 0.05.
2.6 Identification of immune deficiency in MHC class II and the expansion of TLRs
M. orangiensis was classified as belonging to the Gadiformes order after comparing and analyzing the phylogenetic tree through the complete mitochondrial genome (Choi et al., 2020). Among the currently known teleosts in the Gadiformes order, it has been identified that there is a deficiency in MHC class II (Malmstrom et al., 2016). First, the presence of key genes in the cross-presentation pathway for the recognition of MHC class I, MHC class II, and pathogen-derived antigens was confirmed in the genome. Next, based on the analysis of the phylogenetic tree, the gene syntenies and chromosome locations of CD4 and CD74 genes, which are important MHC class II genes, were identified in Takifugu rubripes, G. morhua, and M. orangiensis. Although MHC class II is deficient in G. morhua, it has been specifically confirmed that the TLRs are repeatedly expanded (Sundaram et al., 2012). Based on the reference, the type and repetition of the TLRs in the genome were classified, and the location of the pseudochromosomes was identified. The TLRs in T. rubripes, G. morhua, D. mawsoni, and M. orangiensis were used for constructing the phylogenetic tree using MEGA-X based on the maximum-likelihood tree method with 1,000 bootstrap replicates. The TLR 8 gene from Homo sapiens was selected as an outgroup.
3 Results
3.1 Genome sequencing and assembly
The read number and data size for the PacBio Sequel data were 398.66 Mb and 94.89 Gb. The Hi-C library had 676.79 Mb and 102.19 Gb for the number of reads and sequences. The number of reads and sequences of the Iso-Seq data were 0.18 and 38.66 Mb, respectively (Supplementary Table 1).
This initial genome assembly was 890.95 Mb in length with a contig N50 of 0.73 Mb and the longest scaffold of 4.72 Mb, and the final chromosomal-level M. orangiensis genome assembly, which represented the first reference genome of family Muraenolepididae, has 893.75 Mb in length with a N50 scaffold length of 30.07 Mb and the longest scaffold of 39.77 Mb (Table 1). Twenty-five high-quality pseudochromosomes were assembled and were listed in order from the longest to the shortest length. The longest pseudochromosome length was 39.77 Mb, and the shortest pseudochromosome length was 11.90 Mb (Supplementary Table 2). The total length of the 25 pseudochromosomes was 83.5% of the total length of all genomic sequences, and the unassigned length was 147.62 Mb. The Hi-C interaction heat map was drawn and visualized using Juicebox (Figure 1A). BUSCO core genes were found as full BUSCO profiles in 3,398 (93.4%) of the 3,640 total BUSCO groups searched. Of these, 3,316 (91.1%) were single-copy, and 82 (2.3%) were duplicated BUSCOs. The fragmented and missing BUSCOs were 49 (1.3%) and 193 (5.3%), respectively (Table 2).
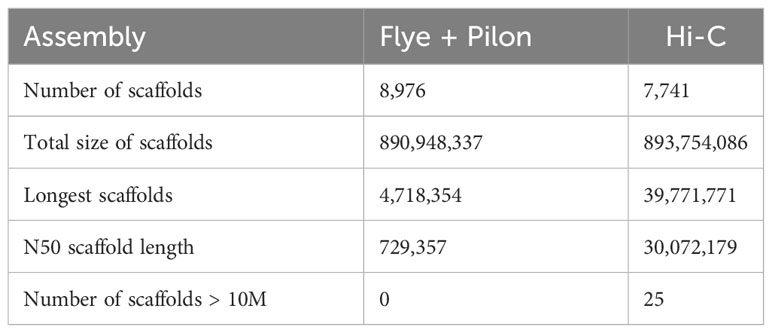
Table 1 M. orangiensis genome assembly statistics.
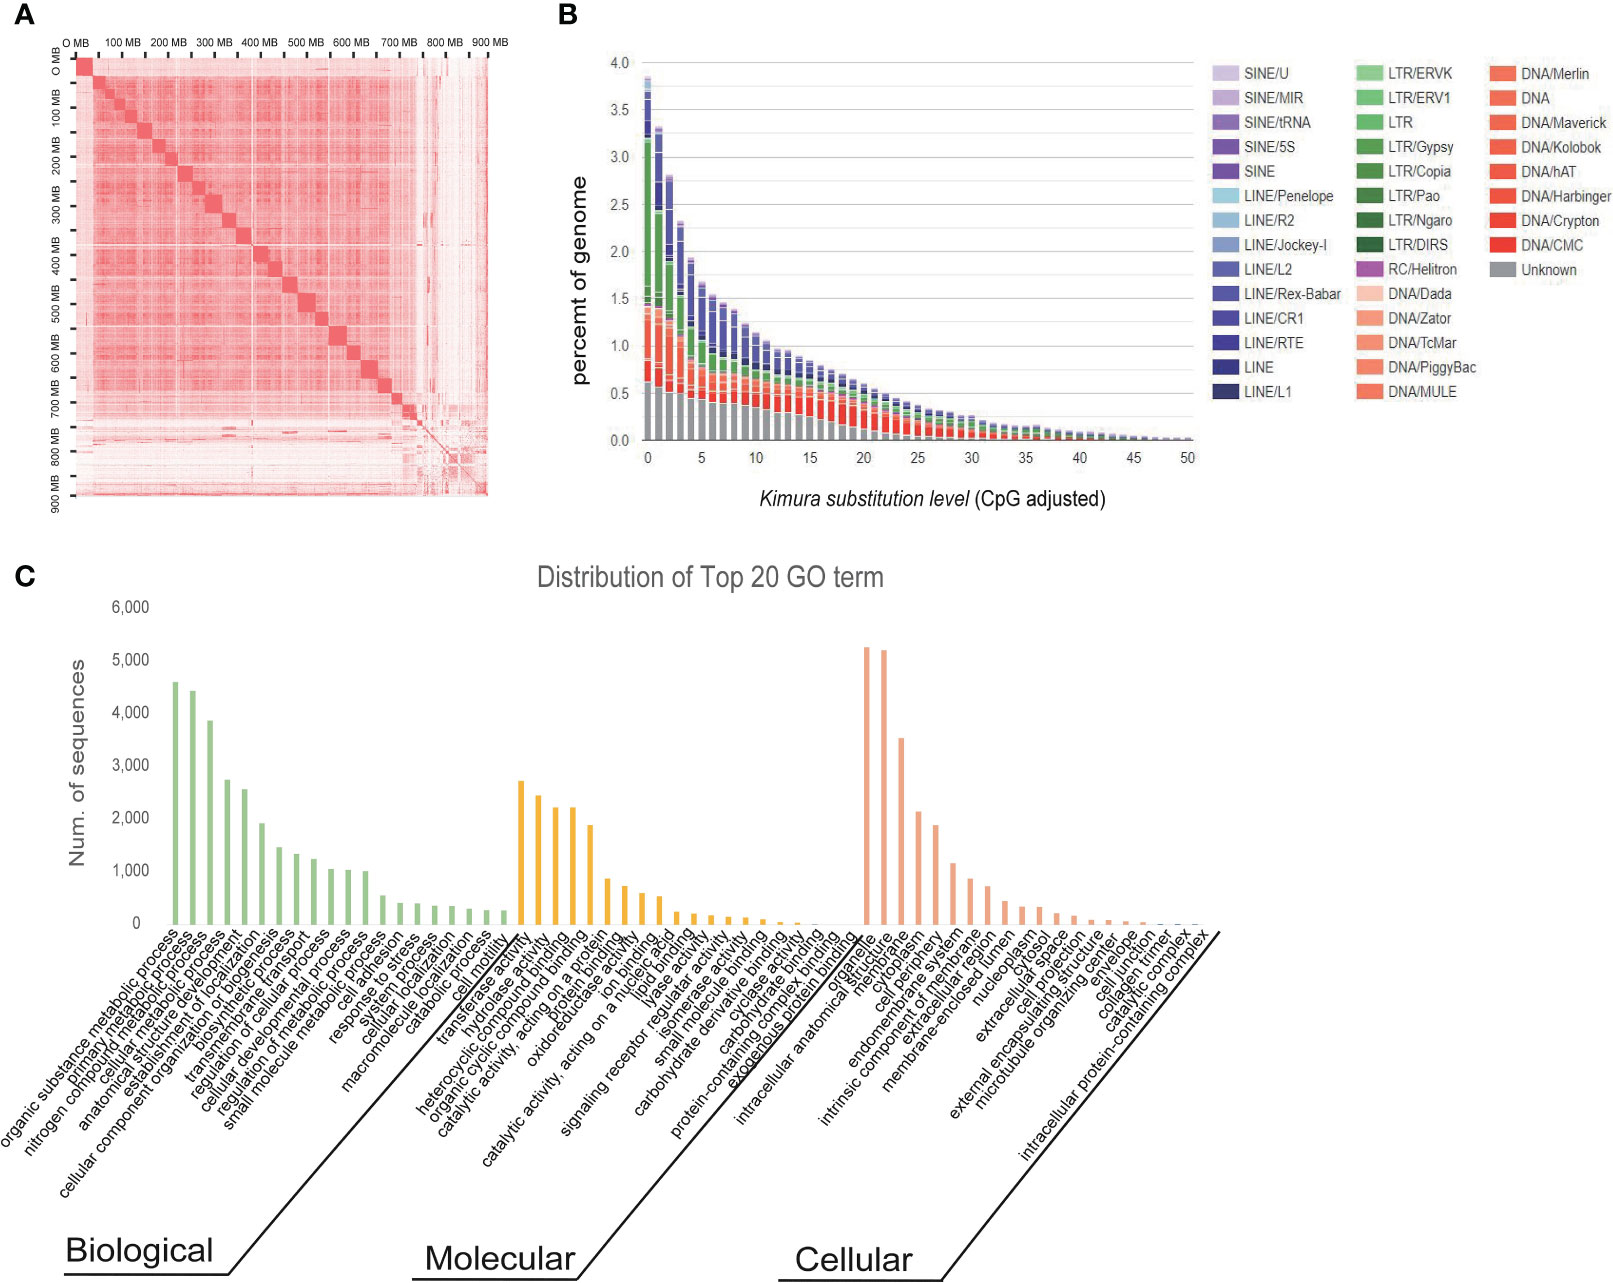
Figure 1 Hi-C analysis, repeat analysis, and functional annotation of M. orangiensis. (A) Hi-C interaction heat map for the M. orangiensis genome. The density of cross-linking information across the genomic segments is shown by the intensity of the red dots. Higher intensity was generated in the same scaffold, and the black bolded names represent the size of the scaffold. (B) Kimura distance-based copy divergence of M. orangiensis. The graph shows kimura substitution level (X-axis, K-value from 0 to 50) on the bottom and genome coverage (Y-axis) for each type of TE (DNA transposons, SINE, LINE, and LTR retrotransposons) in the genome. (C) Distribution of the top-20 GO terms in level 3. The X-axis represents the biological process (BP), molecular function (MF), and cellular component (CC) in different colors based on the number of sequences (Y-axis) in the genome.
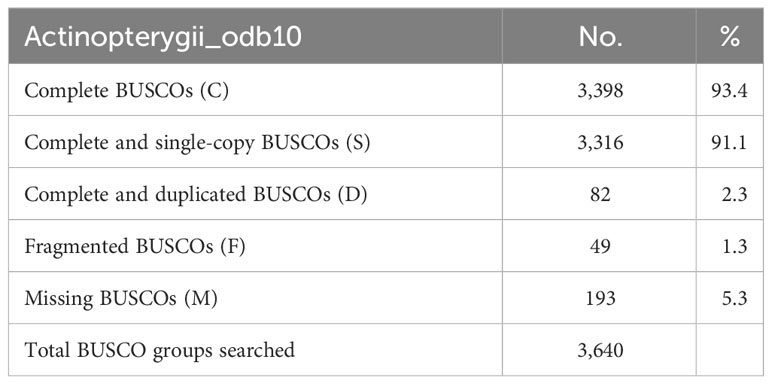
Table 2 Completeness of the M. orangiensis genome assembly estimated using BUSCO.
3.2 Gene prediction and annotation
The repetitive element sequences (REs) in the M. orangiensis genome were identified as tandem repeats and transposable elements (TEs). M. orangiensis have a variety of transposable elements subfamilies in the genome, and in total, the genome contained 51.28% transposable elements (Figure 1B, Supplementary Table 3). Among the REs, 14.93% were long terminal repeats (LTRs), 9.98% were DNA transposons, 8.50% were long interspersed elements (LINEs), and 0.72% were short interspersed elements (SINEs). Among the LTR elements, “gypsy” was the highest after “unknown” at 4.92%, and among the DNA transposons, “CMC-EnSpm” was the highest at 3.30%. Among the LINEs, “Rex-Babar” was the highest at 4.03%, while in the SINEs, “MIR” was the highest at 0.30%. The total interspersed repeats had 1,613,229 counts 39.7% were masked in the M. orangiensis genome, and 10.04% were masked for simple repeats (Supplementary Table 3). The Kimura distance was used to examine the TEs divergence distribution. The rates of the transitions and transversions were estimated on the alignment and converted to the Kimura distance to assess the age and transposition history of the Tes (Chalopin et al., 2015) with Kimura divergence values of 3 or below (Figure 1B).
A total of 34,553 genes in M. orangiensis were annotated, and the total length was 291.39 Mb. A total of 228,039 CDS and 229,440 exons were structurally annotated, and the lengths were 42.15 and 45.27 Mb, respectively (Supplementary Table 4). Consequently, 34,854 protein genes were functionally annotated using the NCBI BLAST. Of the 34,854 protein genes, 27,691 (79.45%) were annotated in the GO database, whereas 7,345 (21.07%) were annotated in the KEGG database (Supplementary Table 4, Supplementary Figure 1A). The Uniprot/Swiss-prot findings were recognized as 10,392 (29.81%), whereas Pfam and SignalP results were identified as 10,434 (29.94%) and 28,406 (81.5%), respectively (Supplementary Table 4). The distribution of the top 20 GO terms in level 3 was identified. Among the biological process (BP) GO terms, organic substance metabolic process (GO:0071704) was the highest, followed by primary metabolic process (GO:0044238), and in molecular functions (MF), transferase activity (GO:0016740) was the highest, followed by hydrolase activity (GO:0016787). Organelle (GO:0043226) was the most common cellular component (CC) GO term, followed by intracellular anatomical structure (GO:0005622; Supplementary Table 5, Figure 1C). The enzyme codes for the genes were evaluated based on the GO annotation results, and 2,733 genes were matched with the transferases enzyme, which was the highest, followed by 2,461 genes matched with the hydrolases enzyme (Supplementary Figure 1B). The top species for the blast hits were G. morhua and Myripristis murdjan (Supplementary Figure 2).
Utilizing 34,853 protein genes, the top 10 domains, families, sites, and repeats were analyzed using InterProScan. Among the top 10 domains, reverse transcriptase domain (IPR000477) was the highest, followed by NACHT nucleoside triphosphatase (IPR007111). The P-loop containing nucleoside triphosphate hydrolase (IPR027417) has the largest distribution in the top 10 family distribution, followed by immunoglobulin-like fold (IPR013783). In the top 10 repeats and site distribution, WD40 repeat (IPR001680) and protein kinase, ATP binding site (IPR017441) were the highest (Supplementary Figure 3).
3.3 Gene family identification, genome evolution, and comparison of orthologous gene clusters in Antarctic fish
No known chromosomal-level assembly genomes exist for any Muraenolepididae family species; the homology between chromosomes was identified and studied using G. morhua in the adjacent Gadiformes order. The 23 chromosomes of G. morhua and the 25 pseudochromosomes of M. orangiensis were compared for the similarity of each chromosome to confirm the chromosomal stability of the Hi-C assembly. It was found that the portion of M. orangiensis corresponding to scaffold 197 did not exactly match the chromosomes of G. morhua and partially matched other chromosomes. The scaffolds 196 and 76 were matched in the form of splitting and dispersing on the G. morhua chromosomes (Figure 2A). Except for scaffolds 76, 196, and 197, most of the scaffolds showed high homology between the two species.
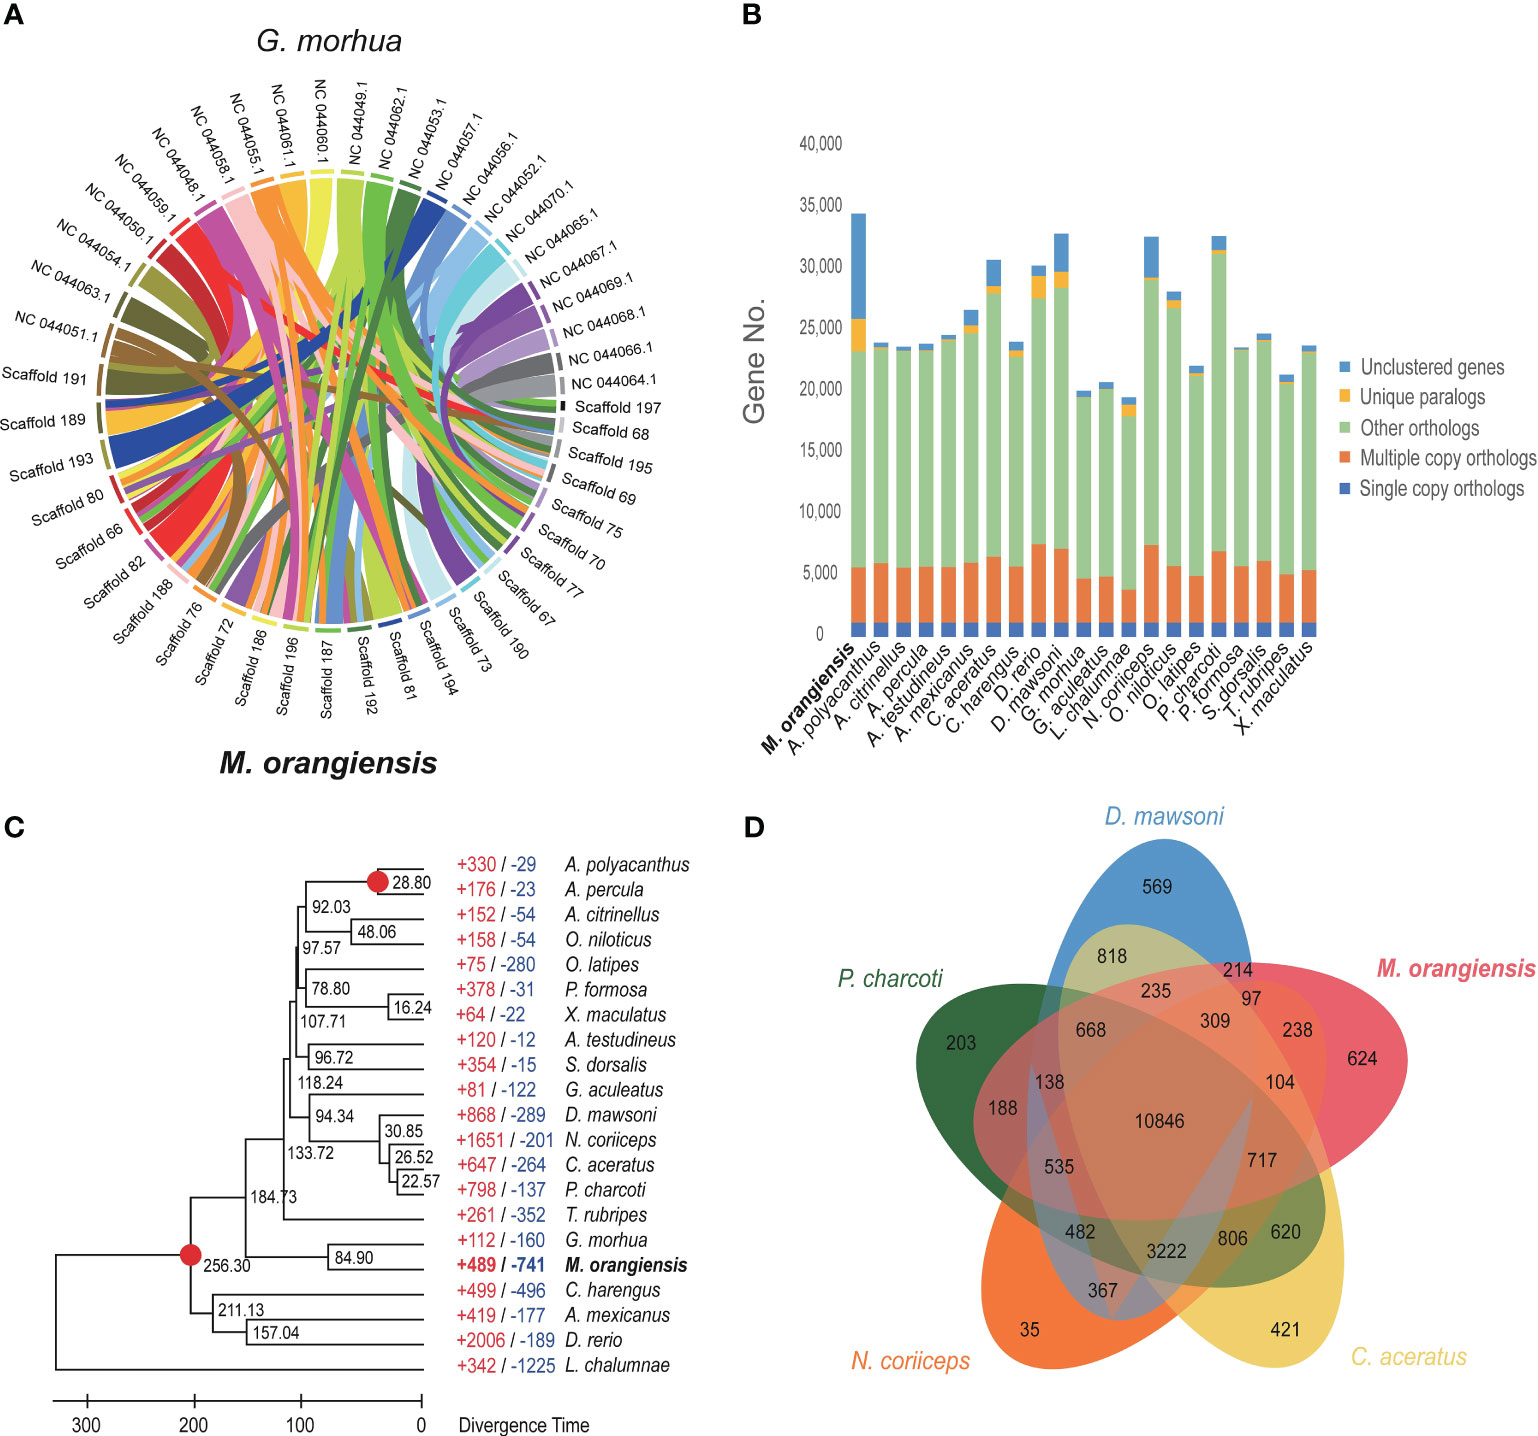
Figure 2 Genome analysis of M. orangiensis. (A) The collinear relationships between M. orangiensis pseudochromosomes and G. morhua chromosomes. (B) The orthologous gene families among M. orangiensis and other teleosts. (C) The phylogenetic analysis of M. orangiensis within the teleost lineage. The black numbers represent divergence times between the 21 species. A gene gain-and-loss analysis was performed, and the number of gained genes (+) are depicted in red, whereas the number of deleted genes (-) is given in blue. (D) The Venn diagram depicts the orthologous gene groups shared by M. orangiensis and four other Antarctic teleosts.
There were 4,519 multiple-copy orthologs, 2,653 unique orthologs, 17,607 other orthologs, and 8,598 unclustered genes in the M. orangiensis genome. The unique orthologs and unclustered genes outperformed the other fish species (Figure 2B, Supplementary Table 6). The phylogenetic tree was built using 1,173 single-copy orthologs. The divergence time calibration was estimated using four fish species based on the phylogenetic tree, and the M. orangiensis divergence time was calculated to be 84.9 Mya. While no other Muraenolepididae species’ whole genomes have been sequenced, the phylogenetic tree revealed that M. orangiensis was connected to G. morhua in the Gadiformes order (Figure 2C).
M. orangiensis and four other Antarctic fish were compared for orthologous gene clusters (Supplementary Table 6). There were 10,846 orthologous gene clusters identified to be common among the five Antarctic fish species, with M. orangiensis species alone detecting 624 orthologous gene clusters (Figure 2D). An enrichment test was conducted to identify the GO terms for the unique gene clusters identified in M. orangiensis, and as a result, five, including defense response to other organisms (GO:0098542), were identified as the highest in BP GO categories. Binding (GO:0005488) had the highest number of gene counts, with 353 in the MF GO category, followed by ion binding (GO:0043167; Supplementary Table 7).
3.4 Gene family expansion and contraction
Along the M. orangiensis lineage, 489 gene families that were significantly expanded and 741 gene families that were significantly contracted were identified. In comparison with the other Antarctic fish species included in the phylogenetic tree, M. orangiensis had less expanded gene families and more contracted gene families. At levels 5 and 6, the GO terms of the expanded and contracted gene families were analyzed using a gene enrichment analysis.
The highest BP in level 5 that related to the expanded gene families was organelle organization (GO:0006996) with 79 genes, followed by organonitrogen compound biosynthetic process (GO:1901566) and cellular macromolecule biosynthetic process (GO:0034645) both with 40 genes. The highest MF was DNA binding (GO:0003677) with 138 genes. For the CC, intracellular membrane-bounded organelle (GO:0043231) was the highest, with 355 genes. The highest BP and CC in level 6 were cytoskeleton organization (GO:0007010) with 66 genes and nucleus (GO:0005634) with 222 genes, respectively (Supplementary Table 8). Among the contracted gene families, the highest BPs in level 5 were macromolecule modification (GO:0043412) and protein modification process (GO:0036211) with 32 genes, for the MF and CC, DNA binding (GO:0003677) and intracellular membrane-bounded organelle (GO:0043231) were the highest, respectively. The highest BP, MF, and CC in level 6 were RNA metabolic process (GO:0016070), pyrophosphatase activity (GO:0016462), and nucleus (GO:0005634), respectively (Supplementary Table 9). The GO terms for the gene families that were quickly expanding and contracting covered a broad range of biological phenomena.
3.5 Immune deficiency of MHC class II genes and gene expansion of TLRs
Although the functionality of the adaptive immune system was assumed to remain preserved since the origin of jawed vertebrates, substantial changes in the immune gene repertoire have lately been identified in teleosts (Malmstrom et al., 2016). The Atlantic cod has undergone one of the most drastic alterations, resulting in the full loss of the MHC class II pathway, which is important for detecting bacterial infections in vertebrates. Furthermore, this loss is accompanied by a significantly expanded repertoire of MHC I genes, which ordinarily produce molecules for defense against viral pathogens (Malmstrom et al., 2016). M. orangiensis, which likewise belongs to the Gadiformes order, was studied in terms of MHC class II-related immune systems.
The immune gene repertoires of the M. orangiensis genome were identified based on the findings of the annotation data and BLAST searches to identify the cause and scope of the MHC class II pathway gene loss seen in the Gadiformes order. The presence of 26 genes known to play important roles in MHC class I, MHC class II, and cross-presentation pathways was specifically looked for and compared with three other teleosts (Neefjes et al., 2011; Roche and Furuta, 2015). Initially, all the critical genes for MHC class I were found, with 23 genes identified, including 10 MHC I genes, which were the most identified in the M. orangiensis genome. In the three other teleost species, the MHC class I genes were analyzed, and it was confirmed that 73 MHC I genes were significantly duplicated in G. morhua. Seven antigen peptide transporter 2 (TAP2) genes were the second most identified MHC class I genes in M. orangiensis. Cross-presentation refers to the processing of foreign antigens into the MHC class I pathway (Heath and Carbone, 2001). A total of 11 important genes in cross-presentation were found, with two proteins identified: protein transport protein Sec61 subunit alpha (Sec61A), protein transport protein Sec61 subunit gamma (Sec61G), and cathepsin S precursor (CTSS). In addition, the signal sequence receptor subunit gamma (SSRG) gene is the sole gene missing from the cross-presentation key genes set. Lastly, except for two genes for endoplasmic reticulum aminopeptidase 1 (ERAP1) and one gene for autoimmune regulator (AIRE), no major MHC class II genes have been found in M. orangiensis. In contrast, in D. mawsoni and T. rubripes, CD4, CD74, and MHC class II, which are important key genes for MHC class II immunity, have all been identified. Given the loss of the CD4 and CD74 genes in M. orangiensis and G. morhua, which are critical for MHC class II immunization, these findings challenge the fundamental ideas regarding the evolution of the adaptive immune system and its components in vertebrates (Table 3).
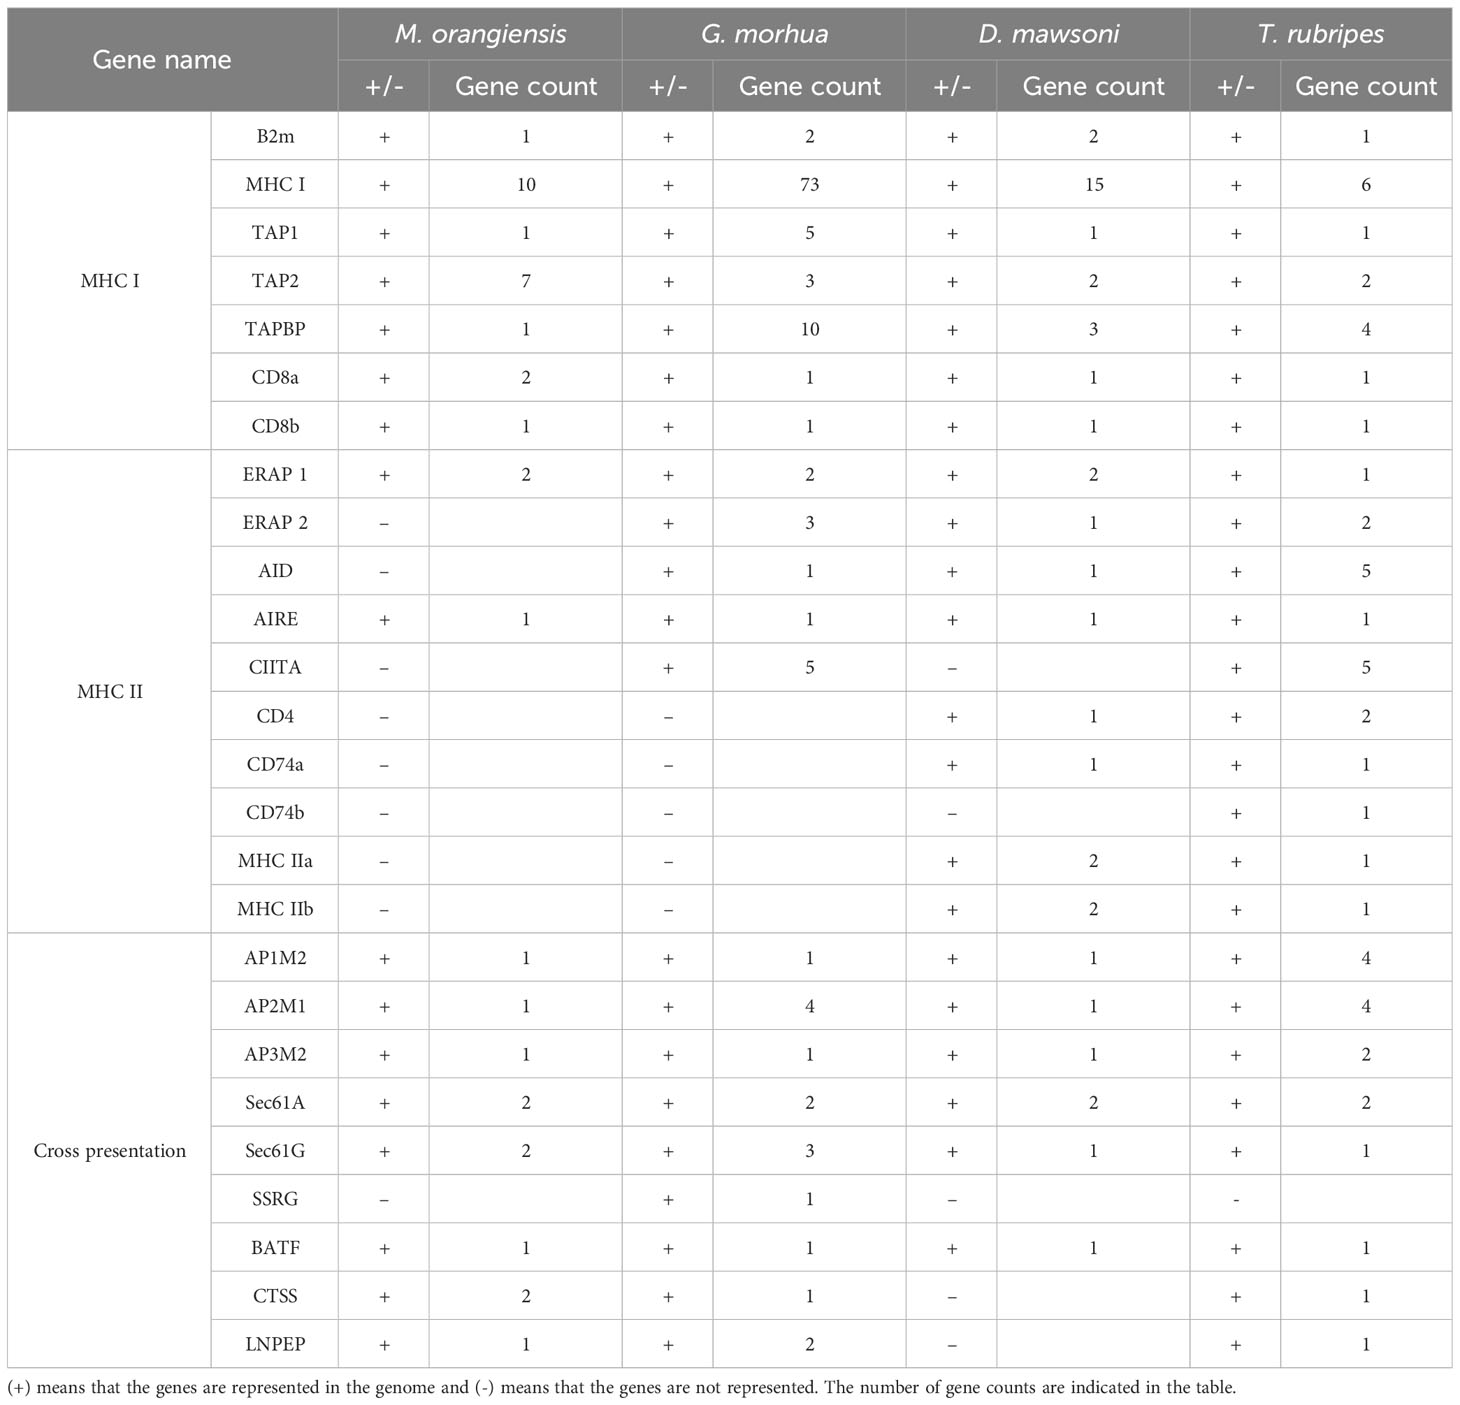
Table 3 The presence and absence of important genes in the MHC I, MHC II, and cross-presentation pathways for pathogen-derived antigen recognition in four different teleosts.
According to a previous study, the CD4 gene on chromosome 11 was fragmented, and the CD74 gene was lacking in the genome of G. morhua. We looked for a segment in M. orangiensis using the T. rubripes reference genome, which is known to have well-preserved CD4 and CD74 genes (Star et al., 2011). We identified well-preserved genes at both ends of the CD4 region, but the CD4 gene had been deleted. A conserved gene synteny of gene order was observed on pseudochromosome 10 surrounding the CD4 genes (Figure 3A, Supplementary Table 10). The same method was used to identify the CD74 gene, which was not identified in the M. orangiensis genome, even among the well-preserved genes at both ends of the CD74 gene on pseudochromosome 10 (Figure 3B, Supplementary Table 10). As a result, CD4 and CD74, the key genes of MHC class II, were not identified anywhere in the M. orangiensis genome.
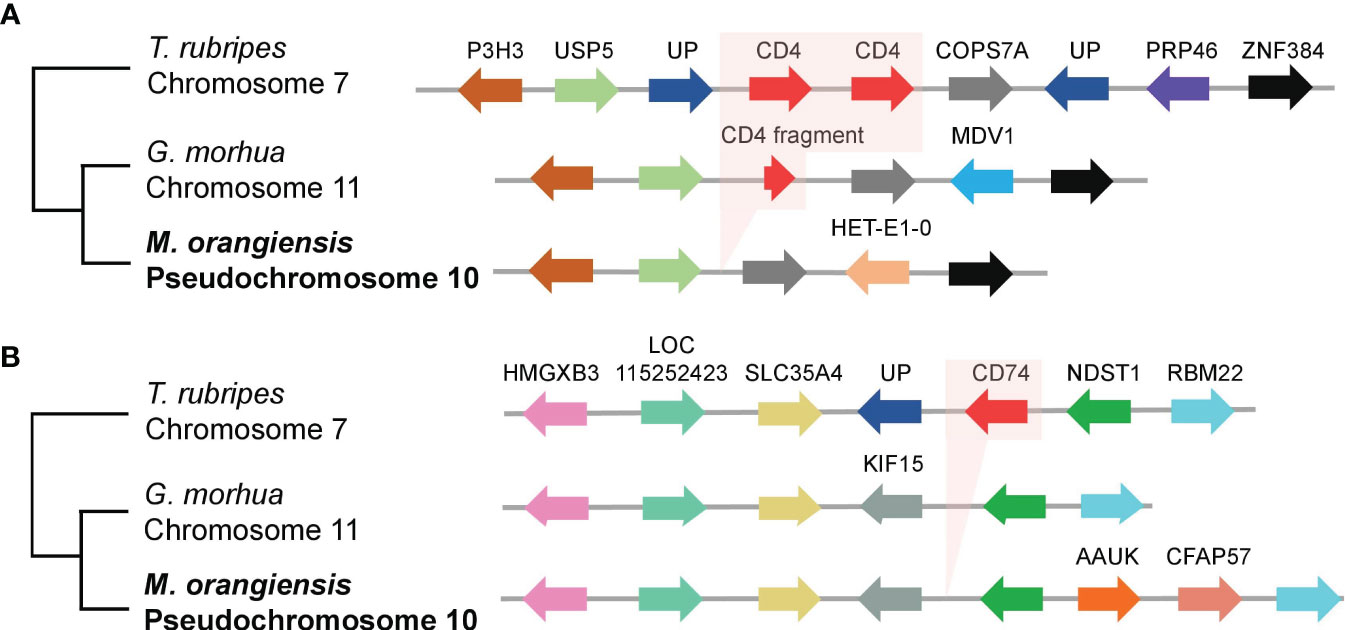
Figure 3 Gene synteny between CD4 and invariant chain (CD74) region among three teleosts. (A) The region around the CD4 genes (red arrows) and shows conserved gene synteny of the gene order and transcriptional direction of the other genes in different colors. The chromosome location of the CD4 genes is specified below the species name. G. morhua CD4 fragment is shown with a short red arrow of 79 out of about 463 amino acids in the T. rubripes CD4 gene. (B) The region around the invariant chain (CD74, red arrow) shows conserved gene synteny of the gene order and transcriptional direction of the other genes in different colors. The chromosome location of the CD74 gene is specified below the species name. The abbreviations of the genes are represented in Supplementary Table 10.
The results of the CD4 and CD74 gene deletions in G. morhua have been reported previously, and one peculiarity was that TLRs were repeatedly expanded in the genome (Star et al., 2011). Accordingly, we identified TLRs in the M. orangiensis genome and compared them with three other teleosts. Notably, the TLR13 genes were highly expanded. A total of 44 TLRs were identified, with TLR13 having the highest gene counts, which were evenly distributed across six distinct pseudochromosomes, followed by seven TLR8 genes, which were identified on pseudochromosome 17 with the TLR7 gene (Supplementary Table 11). Thirty-seven TLR13 genes were identified in G. morhua; however, only seven and five TLR13 genes were identified in D. mawsoni and T. rubripes, respectively. The TLR7 and TLR8 genes were not identified in the D. mawsoni and T. rubripes genomes. Finally, two TLR2 genes and one TLR3 gene were identified on pseudochromosomes 5, 10, and 24 (Figure 4A). Five different types of TLRs were used to construct a phylogenetic tree across three different fish species (G. morhua, D. mawsoni, and T. rubripes), with the TLR8 (AAF78036.1) gene from H. sapiens serving as an outgroup. Most of the TLRs were well-conserved, while TLR13 genes were significantly expanded in M. orangiensis, as they were in G. morhua (Figure 4B). There is no detailed study of this result in M. orangiensis, but compared with G. morhua, the absence of MHC class II, the immune system is assumed to have developed comprehensive mechanisms in both adaptive and innate immunity (Star et al., 2011).
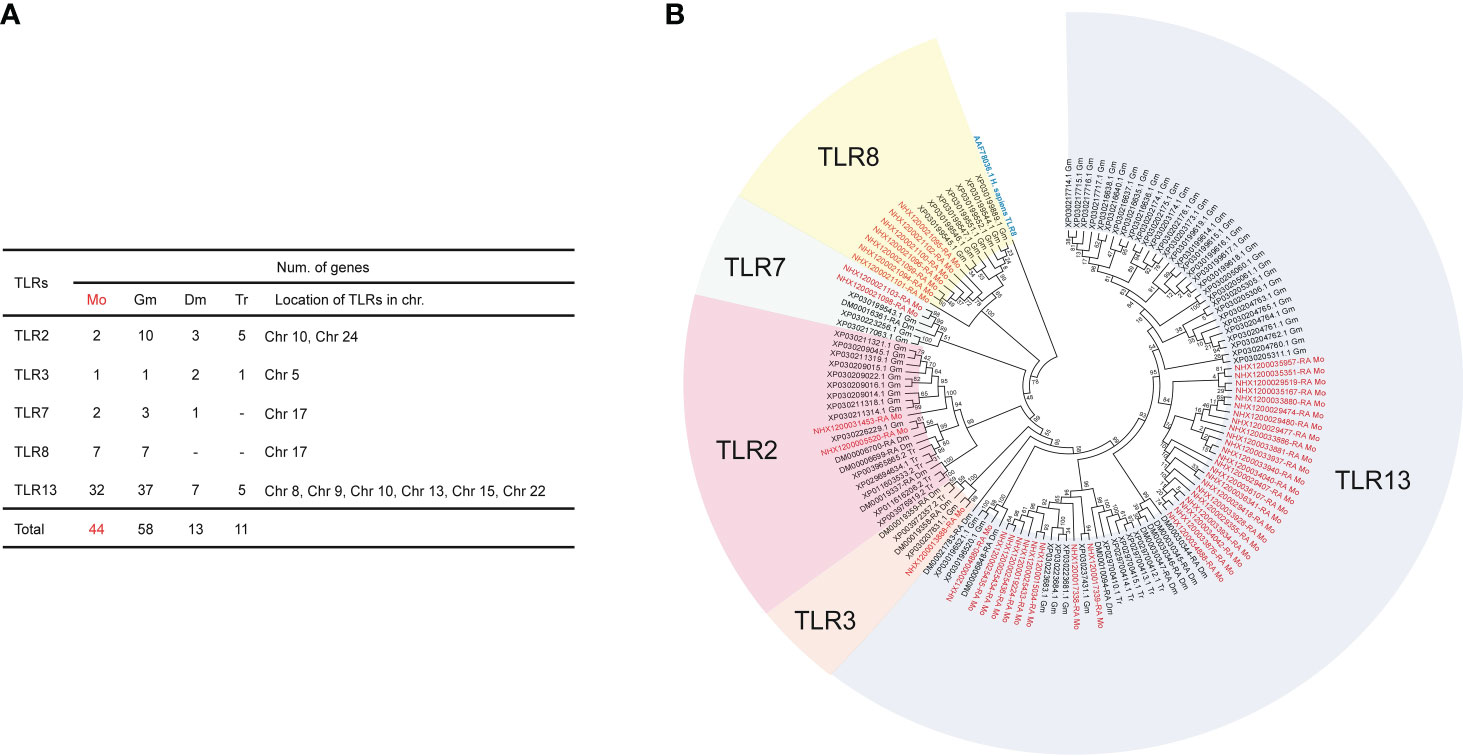
Figure 4 Number of TLRs in four different teleosts and the phylogenetic tree displaying 44 TLRs in the M. orangiensis genome. (A) Number and total gene counts of TLRs in four different teleosts are indicated and the locations of the TLRs in the M. orangiensis pseudochromosomes are represented. (-) means that the genes are not represented (B) The phylogenetic tree was built utilizing the JTT method and 1,000 bootstrap replications, as shown by the numbers on the nodes. The TLRs in M. orangiensis were compared with three different teleosts with the outgroup of the TLR8 gene from Homo sapiens indicated in blue. The species are abbreviated with (A, B) using Mo; M. orangiensis, Gm; G. morhua, Dm; D. mawsoni, and Tr; T. rubripes. The genes of M. orangiensis are indicated in red.
4 Discussion
Fish are the oldest and largest vertebrate group. Their lengthy evolutionary history, which comprises numerous rounds of whole genome duplication and re-diploidization processes that boosted their genetic complexity, has resulted in them having more complicated karyotypes and a variety of genome sizes than other vertebrate taxonomic groups (Volff, 2005). Importantly, the prevalence of TEs and the considerable variety in the genetic and phenotypic features parallel this taxonomic diversity. The majority of REs in fish genomes are TEs, which represent between 5 and 56% of all REs (Shao et al., 2019). M. orangiensis is included in the Muraenolepididae family, with categorized TEs accounting for 51.28% of the total genomic proportion of REs. The LTR class was the most prevalent among the REs, accounting for 14.93%, followed by the DNA class at 9.98% (Supplementary Table 3). However, according to a previous study, fish genomes are mostly composed of DNA transposons and LINEs, with SINEs being the least prevalent (Shao et al., 2019). Further correlational research studies have indicated that retrotransposons (Class I) have a larger impact on genome size than DNA transposons (Class II). LTRs have been shown to be strongly linked with genome size across the various types of retrotransposons studied. Even though multiple DNA transposons, LTRs, LINEs, and SINEs were shown to be positively associated with genome size since the majority of TEs are present in teleosts genomes at low levels, it is unclear if they influence the size of the genome. While further research is needed to fully understand the role of TEs, teleosts exhibit a broad pattern where the TE contents increase with the size of the genome (Shao et al., 2019). This study is the first to complete whole genome sequencing to the chromosomal level from a Muraenolepididae family member using this genome assembly. When the whole genomes of other species in this family are sequenced, the source of the specific elevation in LTRs will be precisely elucidated.
A comparison of M. orangiensis orthologs with other Antarctic fish species, and a GO enrichment analysis of the unique orthologs from M. orangiensis, revealed “response to stimulus” in the BP and “binding” in the MF (Supplementary Table 7). There is no clear basis for identification in this GO term, but it can be assumed that these parts have been enriched due to the habitat of M. orangiensis. M. orangiensis inhabits the Southwest Atlantic, the Patagonian region of Argentina, and the Southern Ocean (Nakamura et al., 1986). The hydromineral disturbances in this area are distinct from other areas, with external factors such as water pH, ambient temperature, and ionic calcium levels having a substantial influence on the severity of stress (Wendelaar Bonga, 1997). Moreover, polar adaptation is characterized by the ability to control stimuli like thermal stress, and this trait has been linked to a variety of polar teleost properties (Hotaling et al., 2022). Further studies are needed to determine how selection has affected the development of genes related to ion binding and stimulus response.
Generally, vertebrates have a well-preserved genetic basis for immunity (Netea et al., 2019). The genome of the Atlantic cod, on the other hand, demonstrated that this order of Gadiformes fish has a fundamentally diverse immune gene repertoire that influences both innate and adaptive immunity and lacks MHC class II, CD74, and CD4 genes (Star et al., 2011; Malmstrom et al., 2016). MHC class I and II are critical components of the adaptive immune system in jawed vertebrates, including teleosts (Litman et al., 2010), and have been recognized as universal characteristics of the adaptive immune system since their appearance over 500 million years ago. Several studies have demonstrated that there are teleost lineages where the complete (or parts of the) MHC class II pathway is effectively eliminated (Star et al., 2011; Haase et al., 2013; Malmstrom et al., 2016; Swann et al., 2020). G. morhua has been discovered to have gene loss of CD4 and CD74, which are significant MHC class II-related genes. MHC class II is critical for the traditional adaptive immune response to bacterial and parasite infections in other vertebrates via the activation of CD4 T cells, and defects in the function of MHC class II are assumed to result in severe immunodeficiency and death (Star et al., 2011). This study identified M. orangiensis as belonging to the Gadiformes order and identified 10 MHC I genes and the loss of MHC class II genes, which is similar to various fish belonging to the Gadiformes order.
The teleost immune system’s evolutionary background is unknown; however, there are two possible scenarios that may explain the lack of MHC class II. The first scenarios hold that teleosts’ immune defenses are not dependent on the MHC class II system and that the loss was caused mostly by genetic drift as a substitute for biological or environmental variables. The next scenarios proposes that MHC class II activity was lost by directional selection sometime in the evolutionary past. An important presumption of the directional selection scenarios, in contrast to the first, is that a few biological or environmental forces have influenced this procedure. We looked at two potential selection theories that may have contributed to the loss of MHC class II in the setting of a directional selection scenario, either independently or together. First, despite the fact that MHC class II activity has certain adaptive benefits, the “metabolic cost hypothesis” contends that these benefits are not always enough to offset the metabolic costs associated with expressing the procedure. Second, the “functional shift hypothesis” proposes that in some circumstances, functioning immune system components other than MHC class II, whether innate or adaptive, give an alternate evolutionary immunological strategy that is more adaptable than the MHC class II system’s capabilities. The MHC class II system may have become obsolete and more susceptible to genetic drift as a result of this strategy, which may have produced higher adaptation to certain environmental constraints than MHC class II. It is likely that the mechanical deconstruction of the MHC class II system was necessary to maintain selection pressure on it while allowing for the ongoing development of different strategies (Star and Jentoft, 2012).
The directional selection hypotheses presume that specific biological or environmental variables might be linked to the distribution. Many families of the order Gadiformes (i.e., Macrouridae, Bathygadidae, and Muraenolepdidae) have species found in the deep sea that live in bathypelagic or bathymetric ocean regions (Roa-Varon and Orti, 2009). Consequently, Gadiformes might have descended from teleost ancestors that dwell in deep water and have a distinct microbial community compared with the mesopelagic or epipelagic regions. The microbial communities of the deep-sea habitats have a higher proportion of archaea and a decreased microbial abundance (Orcutt et al., 2011). Temperature and microbial community composition are both thought to be major factors in the development of the vertebrate immune system (Bowden, 2008; Magnadottir, 2010; Messier-Solek et al., 2010). Temperature has a profound impact on metabolic rates in poikilothermic organisms, and cold conditions alter the immune system, weakening adaptive parameters while strengthening innate parameters (Bly and Clem, 1992; Magnadottir, 2010). As a result of the frigid circumstances and distinctive microbial population, an immune system with comparatively larger and smaller innated and adaptive components might have been favored, culminating in the system’s deficit in MHC class II (Star and Jentoft, 2012).
Aside from the deficiency of MHC class II genes, we identified a unique composition of highly conserved TLR families (Figure 4), which are crucial for both pathogen detection and the innate immune response. The majority of genes that encode TLRs in teleosts are found in well-preserved phylogenetic clusters that share practical features with their mammalian orthologues; however, a few are unique (Palti, 2011). The expansion of the TLRs in fish is especially noteworthy. TLRs with large copy numbers have been identified in distantly related lineages to G. morhua, such as sea urchins and chordates, which contain 222 and 77 TLRs, respectively, and they were studied in connection to these species’ lack of a particular adaptive immune system (Rast et al., 2006; Huang et al., 2008). The TLR gene expansion and isoform acquisition in G. morhua have been linked to the extremely varied pathogen loads and community composition of paleoclimatic Arctic environments (Solbakken et al., 2016). Indeed, it is believed that the enormous quantity and diversity of bacteria and viruses prevalent in aquatic habitats affected the evolution of innate immunity in teleosts (Groff, 2001). The role of TLR in immunity in teleosts is mainly unknown, although protein homology suggests they detect comparable pathogens to TLR in mammals; however, some can recognize both bacterial and viral pathogens (Palti, 2011; Liu et al., 2020). The TLR model addresses the conundrum that most vertebrates have a highly conserved TLR repertoire while being exposed to radically varied microbial loads, communities, and surface or molecular features of their pathogens (Sousa et al., 2022). The functions of the TLRs are unidentified; however, the majority of TLRs in G. morhua implies a basic trade-off between innate and adaptive immune abilities, where a more robust innate system could result in less reliance on the adaptive system (Trede et al., 2004). As one Antarctic species, M. orangiensis, this TLR expansion provides cold adaptation outcomes for MHC class II deficiency.
In this study, 44 TLRs were identified to have increased copy numbers and to be dispersed over six distinct pseudochromosomes, with TLR13 (32 copies) being the most abundant (Figure 4A). TLR13 has only been discovered in two fish species: miiuy croaker (Wang et al., 2016) and orange-spotted grouper (Liang et al., 2018). Furthermore, TLR13 has only been identified in mice and has been demonstrated to target the highly preserved bacterial 23S ribosomal RNA 5′-CGGAAAGACC-3′ (Li and Chen, 2012; Oldenburg et al., 2012). In conjunction with the study that recognized the 23 rRNA targeting of TLR13 in mammals, TLR13 in fish was upregulated following Vibrio anguillarum and poly I:C stimulation (Wang et al., 2016) or 19-mer Staphylococcus aureus 23S rRNA-derived oligoribonucleotide (ORN Sa19) stimulation (Liang et al., 2018), indicating that TLR13 in fish may be involved in recognizing a variety of PAMPs from viruses and bacteria. Moreover, lipopolysaccharide stimulation increased the TLR13 genes in sturgeons (Tang et al., 2020), indicating that TLR13 in fish can defend against bacteria and is implicated in the immunological defense against viruses.
The precise reason for the immunological deficiency of MHC class II genes and the massive expansion of TLRs is still unknown, but this is an important study that supports the biological characteristics immunological deficiency of MHC class II in Gadiformes and is the first study to perform a genome assembly at the chromosomal level on a member of the Muraenolepidae family.
5 Conclusion
In this study, a high-quality chromosome-level genome assembly was constructed using PacBio and Hi-C-based chromatin contact maps. Important genes in the cross-presentation pathways, MHC class I, and MHC class II were identified in the M. orangiensis genome. However, the important genes associated with MHC class II were missing in the genome. Although no specific reason for the MHC class II deficiency has been identified, it is worth noting that TLR genes, critical in the innate immune response, have been greatly expanded in M. orangiensis. There have been no accurate studies of MHC class II deficiency in Gadiformes fish species. The first whole genome from the Muraenolepididae family was reported in this study, providing another rationale for MHC class II deficiency in the Gadiformes order, and it will also contribute to various population genetics, accurate molecular biological classification of other species in the family, and basic research on deep-water specifications in Antarctic waters. This genome will also be an invaluable resource for immune system functional studies, but a thorough genetic analysis is required to pinpoint the distinctive traits of M. orangiensis and to provide more insightful data on the divergence and evolution of Antarctic teleosts.
Data availability statement
The datasets presented in this study can be found in online repositories. The names of the repository/repositories and accession number(s) can be found in the article/Supplementary Material.
Ethics statement
The procedures adopted in this study were performed in accordance with the guidelines of the Animal Welfare Ethical Committee and the Animal Experimental Ethics Committee of the Korea Polar Research Institute (KOPRI, Incheon, Korea). The studies were conducted in accordance with the local legislation and institutional requirements. Written informed consent was obtained from the owners for the participation of their animals in this study.
Author contributions
HP and J-HK conceived the study. SL, EC, EJ, and MC performed genome sequencing and assembly. JK and HP wrote the manuscript. All the authors contributed to writing and editing the manuscript, collating the supplementary information, and preparing the figures. All authors contributed to the article and approved the submitted version.
Funding
This work was supported by a Korea Institute of Marine Science & Technology Promotion (KIMST) grant funded by the Ministry of Oceans and Fisheries (KIMST 20220547), the National Institute of Fisheries Science (NIFS; R2023003), and by a grant from the Korea University.
Conflict of interest
The authors declare that the research was conducted in the absence of any commercial or financial relationships that could be construed as a potential conflict of interest.
Publisher’s note
All claims expressed in this article are solely those of the authors and do not necessarily represent those of their affiliated organizations, or those of the publisher, the editors and the reviewers. Any product that may be evaluated in this article, or claim that may be made by its manufacturer, is not guaranteed or endorsed by the publisher.
Supplementary material
The Supplementary Material for this article can be found online at: https://www.frontiersin.org/articles/10.3389/fmars.2023.1215125/full#supplementary-material
References
Aeschlimann P., Häberli M., Reusch T., Boehm T., Milinski M. (2003). Female sticklebacks Gasterosteus aculeatus use self-reference to optimize MHC allele number during mate selection. Behav. Ecol. Sociobiol. 54, 119–126. doi: 10.1007/s00265-003-0611-6
Altschul S. F., Gish W., Miller W., Myers E. W., Lipman D. J. (1990). Basic local alignment search tool. J. Mol. Biol. 215 (3), 403–410. doi: 10.1016/S0022-2836(05)80360-2
Balushkin A. V., Prirodina V. P. (2006). A new species of eel cods Muraenolepis trunovi sp. nova (Muraenolepididae) from the Lazarev Sea with redescription of lectotypes Muraenolepis marmorata Günther, 1880 and M. microps (Lönnberg, 1905). J. Ichthyol. 46 (9), 687–693. doi: 10.1134/S0032945206090013
Benson G. (1999). Tandem repeats finder: a program to analyze DNA sequences. Nucleic Acids Res. 27 (2), 573–580. doi: 10.1093/nar/27.2.573
Bly J. E., Clem L. W. (1992). Temperature and teleost immune functions. Fish Shellfish Immunol. 2 (3), 159–171. doi: 10.1016/S1050-4648(05)80056-7
Bowden T. J. (2008). Modulation of the immune system of fish by their environment. Fish Shellfish Immunol. 25 (4), 373–383. doi: 10.1016/j.fsi.2008.03.017
Brooks C. M., Bloom E., Kavanagh A., Nocito E. S., Watters G. M., Weller J. (2021). The Ross Sea, Antarctica: A highly protected MPA in international waters. Mar. Policy 134, 104795. doi: 10.1016/j.marpol.2021.104795
Bruna T., Lomsadze A., Borodovsky M. (2020). GeneMark-EP+: eukaryotic gene prediction with self-training in the space of genes and proteins. NAR Genom. Bioinform. 2 (2), lqaa026. doi: 10.1093/nargab/lqaa026
Bryant D. M., Johnson K., DiTommaso T., Tickle T., Couger M. B., Payzin-Dogru D., et al. (2017). A tissue-mapped axolotl de novo transcriptome enables identification of limb regeneration factors. Cell Rep. 18 (3), 762–776. doi: 10.1016/j.celrep.2016.12.063
Castresana J. (2000). Selection of conserved blocks from multiple alignments for their use in phylogenetic analysis. Mol. Biol. Evol. 17 (4), 540–552. doi: 10.1093/oxfordjournals.molbev.a026334
Chalopin D., Naville M., Plard F., Galiana D., Volff J. N. (2015). Comparative analysis of transposable elements highlights mobilome diversity and evolution in vertebrates. Genome Biol. Evol. 7 (2), 567–580. doi: 10.1093/gbe/evv005
Choi E., Park S. H., Lee S. J., Jo E., Kim J., Kim J. H., et al. (2020). The complete mitochondrial genome of Patagonian moray cod, Muraenolepis orangiensis Vaillant, 1888 (Gadiformes, Muraenolepididae). Mitochondrial DNA B Resour. 5 (3), 2707–2708. doi: 10.1080/23802359.2020.1787275
Conesa A., Gotz S., Garcia-Gomez J. M., Terol J., Talon M., Robles M. (2005). Blast2GO: a universal tool for annotation, visualization and analysis in functional genomics research. Bioinformatics 21 (18), 3674–3676. doi: 10.1093/bioinformatics/bti610
Dainat J. (2021). Another Gff Analysis Toolkit to handle annotations in any GTF/GFF format (Version v0.7.0). Zenodo. Vol. 10 (Zenodo). doi: 10.5281/zenodo.3552717
Dimmer E. C., Huntley R. P., Alam-Faruque Y., Sawford T., O’Donovan C., Martin M. J., et al. (2012). The UniProt-GO annotation database in 2011. Nucleic Acids Res. 40 (Database issue), D565–D570. doi: 10.1093/nar/gkr1048
Durand N. C., Robinson J. T., Shamim M. S., Machol I., Mesirov J. P., Lander E. S., et al. (2016a). Juicebox provides a visualization system for Hi-C contact maps with unlimited zoom. Cell Syst. 3 (1), 99–101. doi: 10.1016/j.cels.2015.07.012
Durand N. C., Shamim M. S., Machol I., Rao S. S., Huntley M. H., Lander E. S., et al. (2016b). Juicer provides a one-click system for analyzing loop-resolution Hi-C experiments. Cell Syst. 3 (1), 95–98. doi: 10.1016/j.cels.2016.07.002
Eizaguirre C., Lenz T. L., Kalbe M., Milinski M. (2012). Divergent selection on locally adapted major histocompatibility complex immune genes experimentally proven in the field. Ecol. Lett. 15 (7), 723–731. doi: 10.1111/j.1461-0248.2012.01791.x
Eizaguirre C., Lenz T. L., Traulsen A., Milinski M. (2009). Speciation accelerated and stabilized by pleiotropic major histocompatibility complex immunogenes. Ecol. Lett. 12 (1), 5–12. doi: 10.1111/j.1461-0248.2008.01247.x
Ellinghaus D., Kurtz S., Willhoeft U. (2008). LTRharvest, an efficient and flexible software for de novo detection of LTR retrotransposons. BMC Bioinf. 9, 18. doi: 10.1186/1471-2105-9-18
Fitzcharles E., Hollyman P. R., Goodall-Copestake W. P., Maclaine J. S., Collins M. A. (2021). The taxonomic identity and distribution of the eel cod Muraenolepis (Gadiformes: Muraenolepididae) around South Georgia and the South Sandwich Islands. Polar Biol. 44 (4), 637–651. doi: 10.1007/s00300-021-02819-2
Flynn J. M., Hubley R., Goubert C., Rosen J., Clark A. G., Feschotte C., et al. (2020). RepeatModeler2 for automated genomic discovery of transposable element families. Proc. Natl. Acad. Sci. 117 (17), 9451–9457. doi: 10.1073/pnas.1921046117
Geib S. M., Hall B., Derego T., Bremer F. T., Cannoles K., Sim S. B. (2018). Genome Annotation Generator: a simple tool for generating and correcting WGS annotation tables for NCBI submission. Gigascience 7 (4), 1–5. doi: 10.1093/gigascience/giy018
Groff J. M. (2001). Cutaneous biology and diseases of fish. Vet. Clinics North America: Exotic Anim. Pract. 4 (2), 321–411. doi: 10.1016/S1094-9194(17)30037-3
Haas B. J., Salzberg S. L., Zhu W., Pertea M., Allen J. E., Orvis J., et al. (2008). Automated eukaryotic gene structure annotation using EVidenceModeler and the Program to Assemble Spliced Alignments. Genome Biol. 9 (1), R7. doi: 10.1186/gb-2008-9-1-r7
Haase D., Roth O., Kalbe M., Schmiedeskamp G., Scharsack J. P., Rosenstiel P., et al. (2013). Absence of major histocompatibility complex class II mediated immunity in pipefish, Syngnathus typhle: evidence from deep transcriptome sequencing. Biol. Lett. 9 (2), 20130044. doi: 10.1098/rsbl.2013.0044
Heath W. R., Carbone F. R. (2001). Cross-presentation in viral immunity and self-tolerance. Nat. Rev. Immunol. 1 (2), 126–134. doi: 10.1038/35100512
Hedges S. B., Dudley J., Kumar S. (2006). TimeTree: a public knowledge-base of divergence times among organisms. Bioinformatics 22 (23), 2971–2972. doi: 10.1093/bioinformatics/btl505
Hotaling S., Desvignes T., Sproul J. S., Lins L. S. F., Kelley J. L. (2022). Pathways to polar adaptation in fishes revealed by long-read sequencing. Mol. Ecol. 32 (6), 1381–1397.https://doi.org/10.1111/mec.16501
Huang S., Yuan S., Guo L., Yu Y., Li J., Wu T., et al. (2008). Genomic analysis of the immune gene repertoire of amphioxus reveals extraordinary innate complexity and diversity. Genome Res. 18 (7), 1112–1126. doi: 10.1101/gr.069674.107
Jin X., Morro B., Torresen O. K., Moiche V., Solbakken M. H., Jakobsen K. S., et al. (2020). Innovation in nucleotide-binding oligomerization-like receptor and toll-like receptor sensing drives the major histocompatibility complex-II free Atlantic Cod immune system. Front. Immunol. 11, 609456. doi: 10.3389/fimmu.2020.609456
Kalbe M., Eizaguirre C., Dankert I., Reusch T. B., Sommerfeld R. D., Wegner K. M., et al. (2009). Lifetime reproductive success is maximized with optimal major histocompatibility complex diversity. Proc. R. Soc. B: Biol. Sci. 276 (1658), 925–934. doi: 10.1098/rspb.2008.1466
Kanehisa M., Goto S. (2000). KEGG: kyoto encyclopedia of genes and genomes. Nucleic Acids Res. 28 (1), 27–30. doi: 10.1093/nar/28.1.27
Karvonen A., Seehausen O. (2012). The role of parasitism in adaptive radiations—when might parasites promote and when might they constrain ecological speciation? Int. J. Ecol. 2012, 20. doi: 10.1155/2012/280169
Klein L., Kyewski B., Allen P. M., Hogquist K. A. (2014). Positive and negative selection of the T cell repertoire: what thymocytes see (and don’t see). Nat. Rev. Immunol. 14 (6), 377–391. doi: 10.1038/nri3667
Kolmogorov M., Yuan J., Lin Y., Pevzner P. A. (2019). Assembly of long, error-prone reads using repeat graphs. Nat. Biotechnol. 37 (5), 540–546. doi: 10.1038/s41587-019-0072-8
Krzywinski M., Schein J., Birol I., Connors J., Gascoyne R., Horsman D., et al. (2009). Circos: an information aesthetic for comparative genomics. Genome Res. 19 (9), 1639–1645. doi: 10.1101/gr.092759.109
Li H. (2013). Aligning sequence reads, clone sequences and assembly contigs with BWA-MEM. arXiv: Genomics. 1303.3997. doi: 10.48550/arXiv.1303.3997
Li X.-D., Chen Z. J. (2012). Sequence specific detection of bacterial 23S ribosomal RNA by TLR13. elife 1, e00102. doi: 10.7554/eLife.00102.011
Li L., Stoeckert C. J. Jr., Roos D. S. (2003). OrthoMCL: identification of ortholog groups for eukaryotic genomes. Genome Res. 13 (9), 2178–2189. doi: 10.1101/gr.1224503
Liang Y., Ding X., Yu X., Wang Y., Zhou Y., He J., et al. (2018). Identification and functional characterization of Toll-like receptor 13 from orange-spotted grouper (Epinephelus coioides). Fish Shellfish Immunol. 74, 309–317. doi: 10.1016/j.fsi.2017.12.054
Litman G. W., Rast J. P., Fugmann S. D. (2010). The origins of vertebrate adaptive immunity. Nat. Rev. Immunol. 10 (8), 543–553. doi: 10.1038/nri2807
Liu G., Zhang H., Zhao C., Zhang H. (2020). Evolutionary history of the Toll-like receptor gene family across vertebrates. Genome Biol. Evol. 12 (1), 3615–3634. doi: 10.1093/gbe/evz266
Lomsadze A., Ter-Hovhannisyan V., Chernoff Y. O., Borodovsky M. (2005). Gene identification in novel eukaryotic genomes by self-training algorithm. Nucleic Acids Res. 33 (20), 6494–6506. doi: 10.1093/nar/gki937
Lönnberg E., Nordenskjöld O., Anstalt G. L., Asher A., Co, Haar, et al. (1905). The fishes of the Swedish South Polar expedition. Lithographisches Institut Des. Generalstabs. 5 (6).
Löytynoja A., Goldman N. (2005). An algorithm for progressive multiple alignment of sequences with insertions. Proc. Natl. Acad. Sci. 102 (30), 10557–10562. doi: 10.1073/pnas.0409137102
Magnadottir B. (2010). Immunological control of fish diseases. Mar. Biotechnol. 12, 361–379. doi: 10.1007/s10126-010-9279-x
Malmstrom M., Matschiner M., Torresen O. K., Star B., Snipen L. G., Hansen T. F., et al. (2016). Evolution of the immune system influences speciation rates in teleost fishes. Nat. Genet. 48 (10), 1204–1210. doi: 10.1038/ng.3645
Manni M., Berkeley M. R., Seppey M., Simão F. A., Zdobnov E. M. (2021). BUSCO update: novel and streamlined workflows along with broader and deeper phylogenetic coverage for scoring of eukaryotic, prokaryotic, and viral genomes. Mol. Biol. Evol. 38 (10), 4647–4654. doi: 10.1093/molbev/msab199
Marcais G., Delcher A. L., Phillippy A. M., Coston R., Salzberg S. L., Zimin A. (2018). MUMmer4: A fast and versatile genome alignment system. PloS Comput. Biol. 14 (1), e1005944. doi: 10.1371/journal.pcbi.1005944
Marchler-Bauer A., Lu S., Anderson J. B., Chitsaz F., Derbyshire M. K., DeWeese-Scott C., et al. (2011). CDD: a Conserved Domain Database for the functional annotation of proteins. Nucleic Acids Res. 39 (Database issue), D225–D229. doi: 10.1093/nar/gkq1189
Mendes F. K., Vanderpool D., Fulton B., Hahn M. W. (2020). CAFE 5 models variation in evolutionary rates among gene families. Bioinformatics 36 (22-23), 5516–5518. doi: 10.1093/bioinformatics/btaa1022
Messier-Solek C., Buckley K. M., Rast J. P. (2010). Highly diversified innate receptor systems and new forms of animal immunity. Semin. Immunol. Elsevier 22 (1), 39–47. doi: 10.1016/j.smim.2009.11.007
Milinski M. (2006). The major histocompatibility complex, sexual selection, and mate choice. Annu. Rev. Ecol. Evol. Syst. 37, 159–186. doi: 10.1146/annurev.ecolsys.37.091305.110242
Nakamura I., Inada T., Takeda M., Hatanaka H. (1986). Important fishes trawled off Patagonia (Tokyo: Japan Marine Fishery Resource Research Center).
Neefjes J., Jongsma M. L., Paul P., Bakke O. (2011). Towards a systems understanding of MHC class I and MHC class II antigen presentation. Nat. Rev. Immunol. 11 (12), 823–836. doi: 10.1038/nri3084
Netea M. G., Schlitzer A., Placek K., Joosten L. A. B., Schultze J. L. (2019). Innate and adaptive immune memory: an evolutionary continuum in the host’s response to pathogens. Cell Host Microbe 25 (1), 13–26. doi: 10.1016/j.chom.2018.12.006
Oldenburg M., Krüger A., Ferstl R., Kaufmann A., Nees G., Sigmund A., et al. (2012). TLR13 recognizes bacterial 23 S rRNA devoid of erythromycin resistance–forming modification. Science 337 (6098), 1111–1115. doi: 10.1126/science.1220363
Orcutt B. N., Sylvan J. B., Knab N. J., Edwards K. J. (2011). Microbial ecology of the dark ocean above, at, and below the seafloor. Microbiol. Mol. Biol. Rev. 75 (2), 361–422. doi: 10.1128/MMBR.00039-10
Ou S., Jiang N. (2017). LTR_retriever: A highly accurate and sensitive program for identification of long terminal repeat retrotransposons. Plant Physiol 176 (2), 1410–1422. doi: 10.1104/pp.17.01310
Palti Y. (2011). Toll-like receptors in bony fish: from genomics to function. Dev. Comp. Immunol. 35 (12), 1263–1272. doi: 10.1016/j.dci.2011.03.006
Parham P. (2015). Co-evolution of lymphocyte receptors with MHC class I. Immunol. Rev. 267 (1), 1–5. doi: 10.1111/imr.12338
Parkes G. (1992). Fishes of the Southern Ocean. Rev. Fish Biol. Fisheries 2 (4), 344–345. doi: 10.1007/BF00043525
Paysan-Lafosse T., Blum M., Chuguransky S., Grego T., Pinto B. L., Salazar Gustavo A., et al. (2022). InterPro in 2022. Nucleic Acids Res. 51 (D1), D418–DD27. doi: 10.1093/nar/gkac993
Putnam N. H., O’Connell B. L., Stites J. C., Rice B. J., Blanchette M., Calef R., et al. (2016). Chromosome-scale shotgun assembly using an in vitro method for long-range linkage. Genome Res. 26 (3), 342–350. doi: 10.1101/gr.193474.115
Rast J. P., Smith L. C., Loza-Coll M., Hibino T., Litman G. W. (2006). Genomic insights into the immune system of the sea urchin. Science 314 (5801), 952–956. doi: 10.1126/science.1134301
Reusch T. B., HaÈberli M. A., Aeschlimann P. B., Milinski M. (2001). Female sticklebacks count alleles in a strategy of sexual selection explaining MHC polymorphism. Nature 414 (6861), 300–302. doi: 10.1038/35104547
Rice P., Longden I., Bleasby A. (2000). EMBOSS: the European molecular biology open software suite. Trends Genet. 16 (6), 276–277. doi: 10.1016/S0168-9525(00)02024-2
Roa-Varon A., Orti G. (2009). Phylogenetic relationships among families of Gadiformes (Teleostei, Paracanthopterygii) based on nuclear and mitochondrial data. Mol. Phylogenet Evol. 52 (3), 688–704. doi: 10.1016/j.ympev.2009.03.020
Roche P. A., Furuta K. (2015). The ins and outs of MHC class II-mediated antigen processing and presentation. Nat. Rev. Immunol. 15 (4), 203–216. doi: 10.1038/nri3818
Shao F., Han M., Peng Z. (2019). Evolution and diversity of transposable elements in fish genomes. Sci. Rep. 9 (1), 15399. doi: 10.1038/s41598-019-51888-1
Solbakken M. H., Tørresen O. K., Nederbragt A. J., Seppola M., Gregers T. F., Jakobsen K. S., et al. (2016). Evolutionary redesign of the Atlantic cod (Gadus morhua L.) Toll-like receptor repertoire by gene losses and expansions. Sci. Rep. 6 (1), 25211. doi: 10.1038/srep25211
Sonnhammer E. L. L., Eddy S. R., Durbin R. (1997). Pfam: A comprehensive database of protein domain families based on seed alignments. Proteins: Struct. Funct. Bioinf. 28 (3), 405–420. doi: 10.1002/(SICI)1097-0134(199707)28:3<405::AID-PROT10>3.0.CO;2-L
Sousa C., Fernandes S. A., Cardoso J. C. R., Wang Y., Zhai W., Guerreiro P. M., et al. (2022). Toll-like receptor evolution: does temperature matter? Front. Immunol. 13, 812890. doi: 10.3389/fimmu.2022.812890
Stamatakis A. (2014). RAxML version 8: a tool for phylogenetic analysis and post-analysis of large phylogenies. Bioinformatics 30 (9), 1312–1313. doi: 10.1093/bioinformatics/btu033
Stanke M., Schoffmann O., Morgenstern B., Waack S. (2006). Gene prediction in eukaryotes with a generalized hidden Markov model that uses hints from external sources. BMC Bioinf. 7, 62. doi: 10.1186/1471-2105-7-62
Star B., Jentoft S. (2012). Why does the immune system of Atlantic cod lack MHC II? Bioessays 34 (8), 648–651. doi: 10.1002/bies.201200005
Star B., Nederbragt A. J., Jentoft S., Grimholt U., Malmstrom M., Gregers T. F., et al. (2011). The genome sequence of Atlantic cod reveals a unique immune system. Nature 477 (7363), 207–210. doi: 10.1038/nature10342
Sundaram A. Y. M., Kiron V., Dopazo J., Fernandes J. M. O. (2012). Diversification of the expanded teleost-specific toll-like receptor family in Atlantic cod, Gadus morhua. BMC Evol. Biol. 12 (1), 256. doi: 10.1186/1471-2148-12-256
Swann J. B., Holland S. J., Petersen M., Pietsch T. W., Boehm T. (2020). The immunogenetics of sexual parasitism. Science 369 (6511), 1608–1615. doi: 10.1126/science.aaz9445
Tamura K., Stecher G., Kumar S. (2021). MEGA11: molecular evolutionary genetics analysis version 11. Mol. Biol. Evol. 38 (7), 3022–3027. doi: 10.1093/molbev/msab120
Tang R., Wang S., Han P., Zhang Q., Zhang S., Xing X., et al. (2020). Toll-like receptor (TLR) 2 and TLR13 from the endangered primitive-ray finned fish Dabry’s sturgeon (Acipenser dabryanus) and their expression profiling upon immune stimulation. Aquac. Rep. 16, 100247. doi: 10.1016/j.aqrep.2019.100247
Teufel F., Almagro Armenteros J. J., Johansen A. R., Gíslason M. H., Pihl S. I., Tsirigos K. D., et al. (2022). SignalP 6.0 predicts all five types of signal peptides using protein language models. Nat. Biotechnol. 40 (7), 1023–1025. doi: 10.1038/s41587-021-01156-3
Trede N. S., Langenau D. M., Traver D., Look A. T., Zon L. I. (2004). The use of zebrafish to understand immunity. Immunity 20 (4), 367–379. doi: 10.1016/S1074-7613(04)00084-6
UniProt C. (2019). UniProt: a worldwide hub of protein knowledge. Nucleic Acids Res. 47 (D1), D506–DD15. doi: 10.1093/nar/gky1049
Volff J. N. (2005). Genome evolution and biodiversity in teleost fish. Heredity 94 (3), 280–294. doi: 10.1038/sj.hdy.6800635
Walker B. J., Abeel T., Shea T., Priest M., Abouelliel A., Sakthikumar S., et al. (2014). Pilon: an integrated tool for comprehensive microbial variant detection and genome assembly improvement. PloS One 9 (11), e112963. doi: 10.1371/journal.pone.0112963
Wang Y., Bi X., Chu Q., Xu T. (2016). Discovery of toll-like receptor 13 exists in the teleost fish: Miiuy croaker (Perciformes, Sciaenidae). Dev. Comp. Immunol. 61, 25–33. doi: 10.1016/j.dci.2016.03.005
Wendelaar Bonga S. E. (1997). The stress response in fish. Physiol. Rev. 77 (3), 591–625. doi: 10.1152/physrev.1997.77.3.591
Keywords: Muraenolepis orangiensis, Gadiformes, MHC class II, CD4, CD74, TLRs
Citation: Kim J, Lee SJ, Jo E, Choi E, Cho M, Choi S, Kim J-H and Park H (2023) Chromosome-level genome assembly of Patagonian moray cod (Muraenolepis orangiensis) and immune deficiency of major histocompatibility complex (MHC) class II. Front. Mar. Sci. 10:1215125. doi: 10.3389/fmars.2023.1215125
Received: 01 May 2023; Accepted: 19 September 2023;
Published: 04 October 2023.
Edited by:
Hyuk Je Lee, Sangji University, Republic of KoreaCopyright © 2023 Kim, Lee, Jo, Choi, Cho, Choi, Kim and Park. This is an open-access article distributed under the terms of the Creative Commons Attribution License (CC BY). The use, distribution or reproduction in other forums is permitted, provided the original author(s) and the copyright owner(s) are credited and that the original publication in this journal is cited, in accordance with accepted academic practice. No use, distribution or reproduction is permitted which does not comply with these terms.
*Correspondence: Jeong-Hoon Kim, amhraW05NEBrb3ByaS5yZS5rcg==; Hyun Park, aHBhcmtAa29yZWEuYWMua3I=
†These authors have contributed equally to this work