 Jing Cai1
 Zili He
- 1Institute of Underground Space, Zhejiang University of Technology Engineering Design Group Co., Ltd, Hangzhou, China
- 2College of Civil Engineering, Zhejiang University of Technology, Hangzhou, China
Vacuum preloading coupled with prefabricated vertical drains (PVDs) has been widely used to improve the property of the dredged slurry. However, the effect of PVD layout on slurry consolidation characteristics remains poorly understood. This study conducted two vacuum preloading model tests—with single and dual PVDs. Particle image velocimetry (PIV) was used to directly observe the slurry displacements and strain paths. The test results revealed that the slurry consolidation characteristics were similar under different PVD layouts in the early stage of vacuum preloading. However, in the mid-stage, the effect of dual PVDs led to a significant reduction and increased dispersion of the slurry horizontal displacement. This, in turn, resulted in a thinner clogging zone and a subsequent decrease in vacuum pressure loss. Consequently, the slurry near the PVDs experienced an extended period of consolidation deformation. During the later stage, the single PVD model test exhibited a distinct zone of both vertical and horizontal compression in the slurry, while under dual PVDs, the slurry primarily underwent vertical compression and horizontal extension. The study also provided the relationship between the clogging zone thickness and time, which provided a reference for theoretical consolidation calculations.
1 Introduction
The technique of vacuum preloading combined with prefabricated vertical drains (PVDs) was invented by Kjellman. It is one of the most common methods for treating hydraulic landfill and in-situ marine soils (Mesri and Khan, 2012; Cai et al., 2016; Cai et al., 2017; Geng and Yu, 2017; Wang et al., 2017a; Cai et al., 2018; Fang et al., 2019; Ni and Geng, 2022; Zhang et al., 2022). There is usually significant settlement and inward lateral displacement with this method (Chai et al., 2005; Robinson et al., 2012; Chai et al., 2020; Sun et al., 2022a; Sun et al., 2022b). Many studies have reported the displacement of slurry during the vacuum preloading process. Sun et al. (2022b) reported that the horizontal displacement of slurry elements increases first and then decreases along the radial direction. Also, the slurry elements near the PVD exhibit horizontal extension prior to compression during the improvement of high-water-content slurry. Chai et al. (2020) found less settlement near the PVD in single-PVD model tests. Yao et al. (2023) observed the displacement of dredged slurry during air-boost vacuum preloading and indicated the pressurization induces soil cracking, thereby facilitating the consolidation of dredged slurry. Feng et al. (2022) monitored the surface settlement of the soil under air-boosted vacuum preloading and proposed a ground settlement prediction empirical formula based on a 2D continuum FE analysis. Wang et al. (2019) pointed out that the horizontal displacement of the soil at the midpoint between the two PVDs is zero. Pan et al. (2020) found that slurries near the PVD and in the far field are dominated by radial and vertical consolidation, respectively. These studies mainly focus on the soil deformation under vacuum preloading by means of model tests, finite element and in-situ tests, and the soil displacement patterns near the PVD or at the boundary of the consolidation zone are obtained. Since the soil displacement depends on the stress state (Chai et al., 2005), the deformation characteristics are also affected by the PVD layout. However, owing to a lack of data on the displacement and strain profile of slurry under different PVD layouts during consolidation, the effect of PVD layout on slurry deformation characteristics under vacuum preloading remains poorly understood.
In addition to the uncertainty regarding the effect of PVD layout on deformation characteristics, there is also a lack of research on the effect of PVD layout on the clogging zone. Numerous laboratory and in-situ tests have reported a low-permeability clogging zone occurred near the PVD during the vacuum preloading treating the dredged slurry, which demonstrates the prevention of vacuum pressure propagation as well as a slowing of pore water pressure dissipation, resulting in inadequate improvement (Tang et al., 2010; Bao et al., 2014; Deng et al., 2019; Sun et al., 2020; Xu et al., 2020; Wu et al., 2022). Many studies discussed the formation of soil columns and also proposed methods such as pretreating the slurry (Wang et al., 2017a; Wang et al., 2017b; Sun et al., 2022c), step vacuum preloading (Fang et al., 2019), and reducing PVD spacing (Tang et al., 2010; Wu et al., 2021) to reduce the clogging. In addition, Fang et al. (2019); Zhou et al. (2021); Sun et al. (2022a); Sun et al. (2022b), and Shen (2018) used particle size distribution, soil sample water content distribution, vane shear strength along the radial direction and particle image velocimetry (PIV) technology to determine the thickness of the clogging zone to be 40–100 mm under a single-PVD model test. As the formation of the clogging zone is the result of the accumulation of soil particles near PVD (Sun et al., 2022a; Sun et al., 2022b), with the gradual transfer of vacuum pressure from PVD to far field during consolidation, the effect of PVD layout on the displacement of soil particles will further impact the formation of the clogging zone. Compared with the extensive studies focused on the thickness of the clogging zone, few studies have investigated the clogging zone development, especially the development under different PVD layouts. Determining the development characteristics and differences in the slurry clogging zone under different PVD layouts can further improve the understanding of clogging zone development and provide a reference for developing consolidation theory that considers clogging zones.
In the past decade, particle image velocimetry (PIV), which is a non-intrusive method, has played an important role in experimental geomechanics. It can obtain the displacement of the soil as well as the strain paths occurring throughout the improvement process. Compared to traditional displacement measurement methods, PIV offers higher accuracy and the advantage of full-field measurement (White et al., 2003; White and Bolton, 2004; Wang et al., 2021). With the advancement of photography and algorithms, PIV technology has been more widely used in geotechnical tests, such as vacuum preloading model tests (Jiang et al., 2020; Sun et al., 2022a; Sun et al., 2022b), cone penetration tests (White and Bolton, 2004; Arshad et al., 2014) and undrained cyclic torsional shear tests (Zhao et al., 2020). These cases rely on an artificial texture when modelling fine-grained soils, which provides the basis for this research.
In this study, two laboratory model tests were carried out to investigate the effect of PVD layout on the consolidation characteristics of dredged slurry under vacuum preloading. The displacement field and strain profile during the improvement process were visualized using PIV technology. The effect of PVD layout on consolidation characteristics was investigated by combining PIV analysis with monitoring information, such as pore water pressure dissipation and water discharged mass data. The results provide a reference for developing consolidation theory that considers the clogging zone.
2 Experimental materials and methods
2.1 Testing materials
The dredged slurry used in this study was taken from a construction site in Dongtou District, Wenzhou City, Zhejiang Province, China. The properties of the slurry sample are listed in Table 1. The liquid and plastic limits of the slurry were 53% and 32%, respectively. The particle size distribution of the slurry is shown in Figure 1.
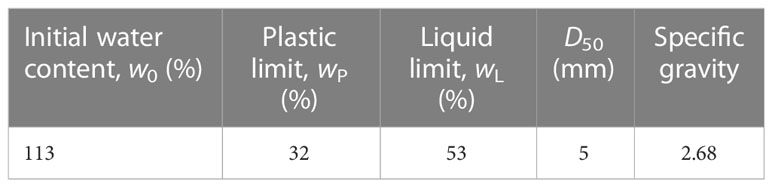
Table 1 Index properties of slurry sample.
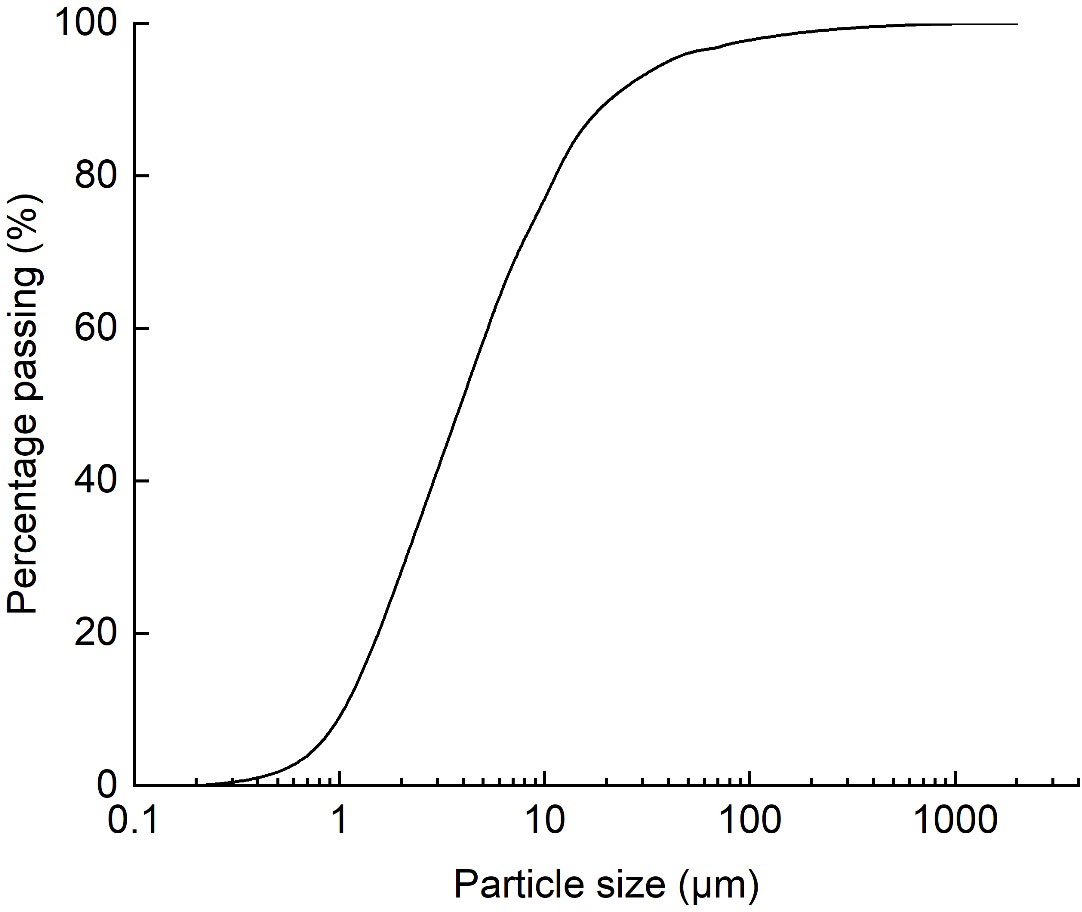
Figure 1 Particle size distribution of the slurry sample.
As the variation in pixel intensity is crucial in PIV analysis (White et al., 2003; Stanier and White, 2013; Stanier et al., 2016), tracer particles must be used to create artificial textures when performing geotechnical tests on fine-grained soils of uniform color (Take and Bolton, 2011; Kim et al., 2017). Black-dyed sand was used as tracer particles in this PIV analysis (Bauer et al., 2016; Kwak et al., 2020; Wang et al., 2021), which has been proven a good representativeness (>93%) in the movement of particles within the slurry (Wang et al., 2021). Since the tracer particles were randomly sprayed on the contact of the Perspex sheet and slurry sample, they had little effect on the slurry improvement process due to their small amount and high permeability (Wang et al., 2019). Moreover, as the PIV algorithm (Stanier et al., 2016) used in this study will update the new ‘reference’ image during the calculation process when the correlation coefficient for one of the subsets contravenes user-defined thresholds. Thus, a small amount of the tracer particles mixed into the slurry during the consolidation has no significant influence on the results.
The integral PVD used in this study had dimensions of 100 ± 3 mm (width) × 4 mm (thickness) × 310 mm (height). The tensile strength of the PVD was >2 kN/10 cm, the equivalent pore diameter was 75 μm, and the permeability coefficient was > 5×10⁻³ cm/s.
2.2 Testing apparatus
The testing apparatus consists of three parts: a model testing box, a vacuum system, and a data and image acquisition system.
As shown in Figure 2, a cuboid aluminium model testing box with an internal dimension of 870 mm (length) × 160 mm (width) × 620 mm (height) was made for the laboratory tests. Silicon grease was smeared onto the inner wall of the case to reduce the friction between the soil and the model walls (Sun et al., 2022b). The front wall of the testing box consisted of a Perspex window with a thickness of 45 mm, in which control points for optimizing the photogrammetric transformation parameters were set (White et al., 2003). To minimize friction between the Perspex window and slurry sample, the window was polished and then flanged to the testing box (Sun et al., 2022b). The top of the box was sealed with a polyvinyl chloride (PVC) membrane to ensure airtightness during vacuum preloading. The PVD was attached to the Perspex sheet and fixed to a custom-made iron bracket to prevent bending during the tests. Model tests with a single PVD and dual PVDs were carried out to compare the effects of PVD layout under vacuum preloading. In in-situ practice, the PVDs layout patterns commonly follow a square or triangular arrangement, with spacing ranging from 0.6–1.5 m (Chu et al., 2000; Tang and Shang, 2000; Bergado et al., 2002; Wang et al., 2019). Thus, the dual PVDs model test with a spacing of 0.6 m was conducted. The single-PVD model test was used to simulate the slurry under a large spacing between PVDs. The PVDs were connected to the vacuum system via a vacuum tube and geosynthetic cap. As shown in Figures 2C, D, the slurry displacements were tracked by PIV through observation windows 1 (OW1) and 2 (OW2; dimensions 300 × 180 mm) in the Perspex sheet on the right side of the PVD.
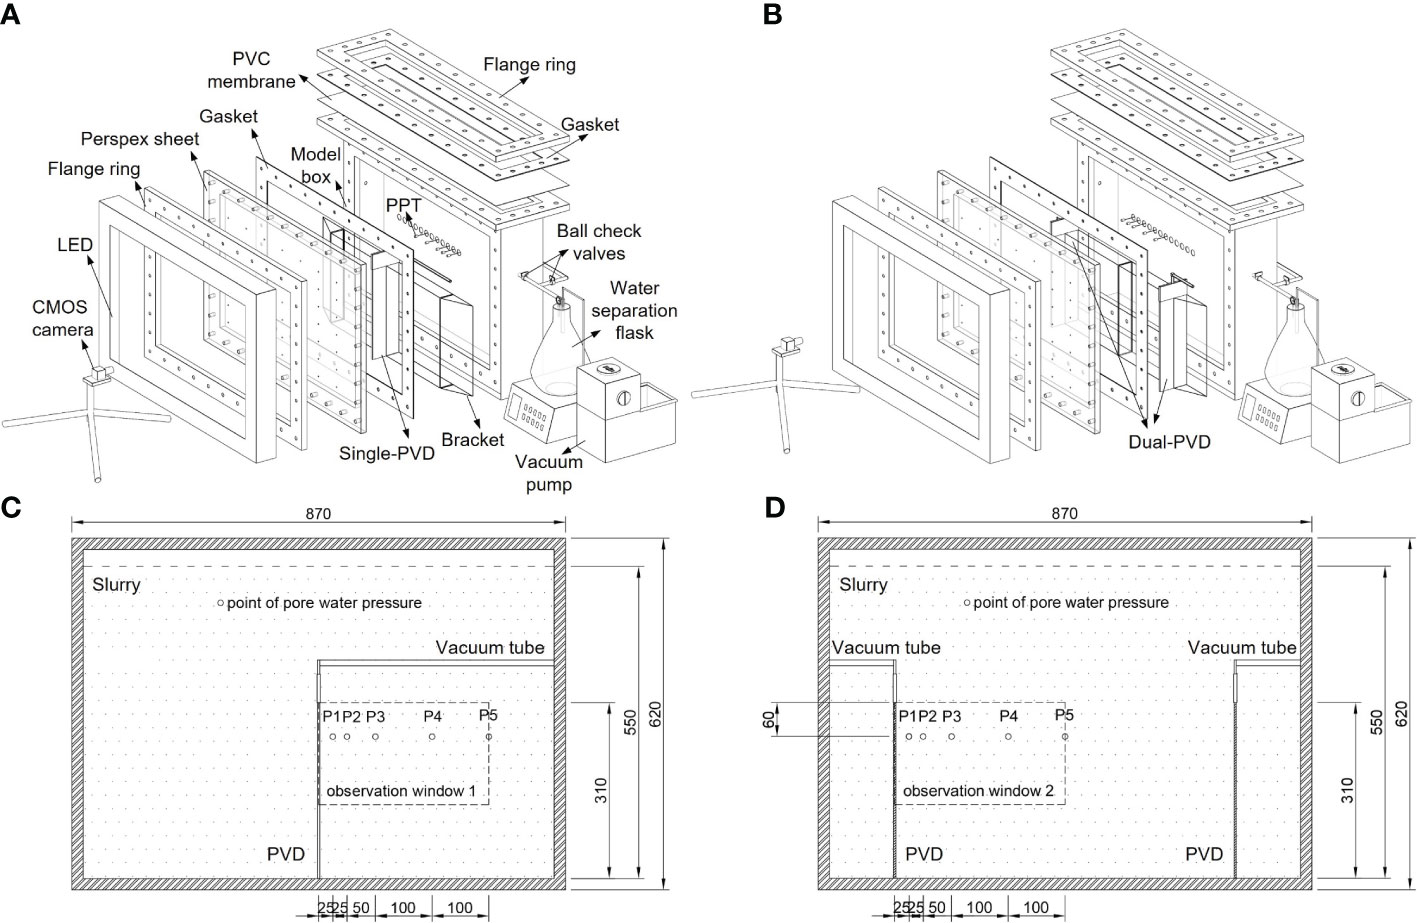
Figure 2 Testing apparatus. Exploded views of the (A) single-PVD and (B) dual-PVD model tests; schematic diagrams of the (C) single-PVD and (D) dual-PVD- model tests.
As shown in Figures 2A, B, the vacuum system was mainly composed of a vacuum pump, water separation bottle and vacuum tubes. The water separation bottle separated the airflow from the water flow. The water separation bottle was connected to the vacuum pump by vacuum tubes to apply vacuum pressure. Based on the in-situ applications of vacuum preloading tests, the 80 kPa vacuum pressure was adopted as the design value for the model test.
The data and image acquisition system consisted of five pore water pressure transducers (PPTs), an electronic scale, a light emitting diode (LED) light source, and a complementary metal oxide semiconductor (CMOS) camera. As shown in Figures 2C, D, the PPTs (P1–P5) were fixed at positions 25, 50, 100, 200, and 300 mm away from the PVD and 60 mm from the top of the PVD to record the variation in pore water pressure along the horizontal direction during the tests. The electronic scale was placed at the bottom of the water separation bottle to record the water discharged mass during vacuum preloading. The CMOS camera (18 megapixels) was placed on the front side of the model testing box to record the slurry sample’s displacement during consolidation. The LED light source was placed between the box and camera to illuminate the observation windows. Figure 3 shows a typical captured photo demonstrating that the tracer particles can be distinguished from the light-gray slurry, ensuring the PIV analysis. In the PIV analysis, the photographs were divided into thousands of slurry elements (shown in Figure 3) for correlation calculation (White et al., 2003).
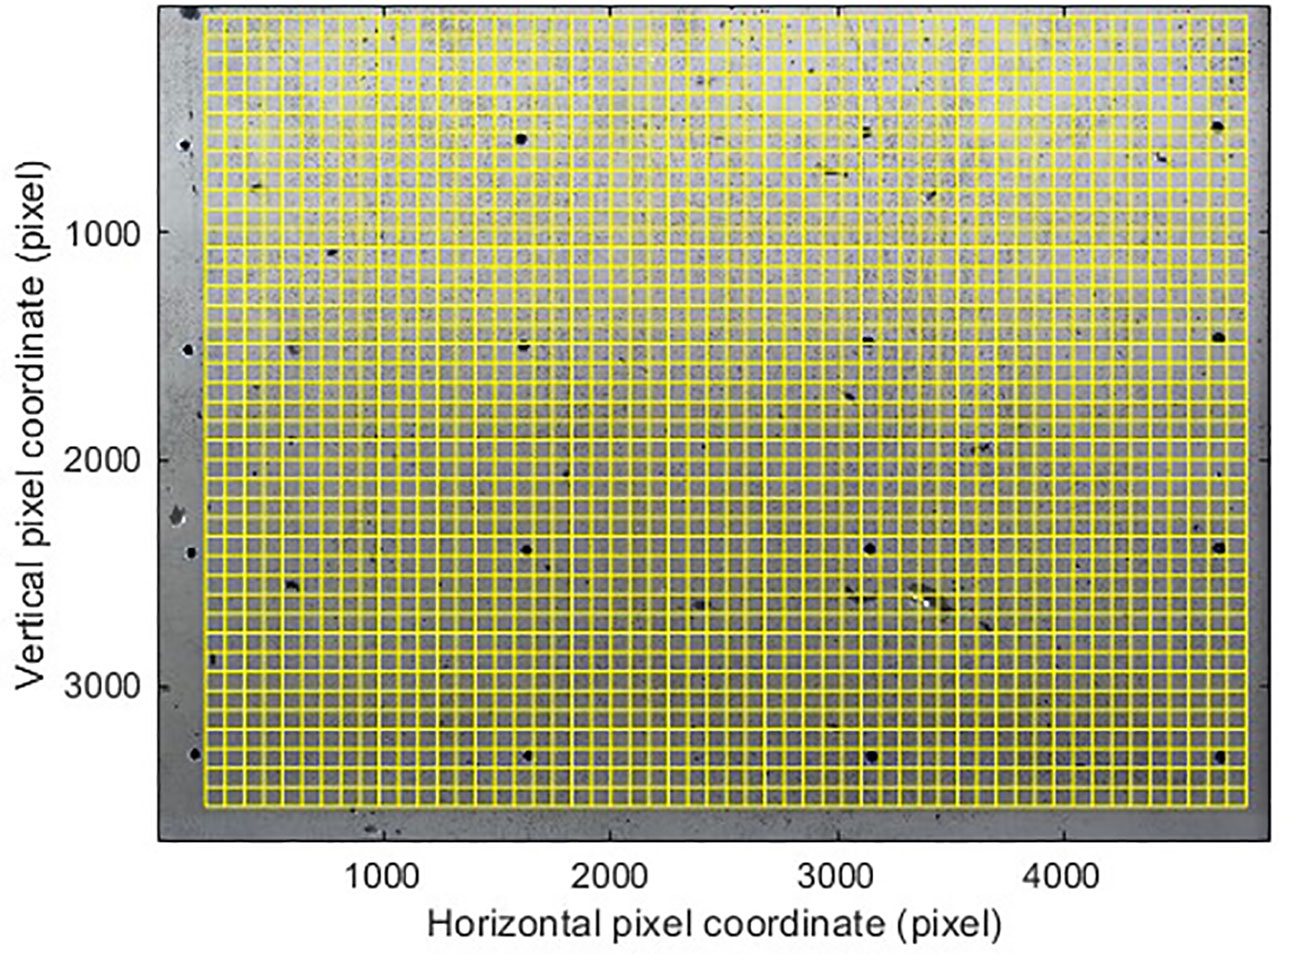
Figure 3 Typical captured photo and PIV mesh.
2.3 Testing procedure
The primary procedures of the test are as follows, more details of the operation of the PIV test are given in Sun et al. (2022b):
(i) Check the airtightness of the test apparatus. (ii) Spray tracer particles onto the Perspex sheet using a powder spray ball. (iii) Connect the PVD to the geosynthetic cap and seal the connection to reduce vacuum pressure loss. (iv) Fix the PVDs on a custom-made iron bracket, which was then fixed to the bottom of the testing box. (v) Connect the geosynthetic cap, water separation bottle and vacuum pump through the vacuum tube and seal each interface with clamps to reduce vacuum pressure loss. (vi) Install the PPTs and Perspex sheet into the testing box. (vii) Place slurry into the model case slowly and place one layer of PVC membrane on top of the dredged slurry. Seal the model testing box using a flange connection. (viii) Adjust the camera and light source in front of the model testing box and take 1 image each minute. (ix) Switch on the vacuum pump and record the pore water pressure and water discharge. (x) Stop the vacuum preloading test after 340 h, when the pore water pressure no longer decreases, and the water discharged mass remains stable.
3 Test results
3.1 Discharged water
Figure 4 shows the variations in water discharged mass (m) and water mass discharged rate (q) versus consolidation time (t) for the single PVD model test (test C1) and the dual PVDs model test (test C2). Based on the m curves in Figure 3, it can be observed that the increased PVD resulted in a higher m for test C2, with m values of 15.94 kg at t=340 h, which is approximately 24% higher than test C1. Furthermore, due to the increased PVD in test C2, the q was significantly higher than test C1 at t=0 h, with q=0.237 kg/h and 0.637 kg/h for test C1 and C2, respectively. Notably, q tended to be the same at 80 h in both tests, which means that the clogging stabilized. Based on the q curves, the consolidation process can be divided into three stages: Stage I (0–10 h), where clogging developed rapidly, resulting in a rapid decrease in q. In stage II (10–80 h), the formation velocity of the clogging was relatively slow, resulting in q decreasing slowly. In stage III (80–340 h), the clogging remained stable and q was similar in both tests.
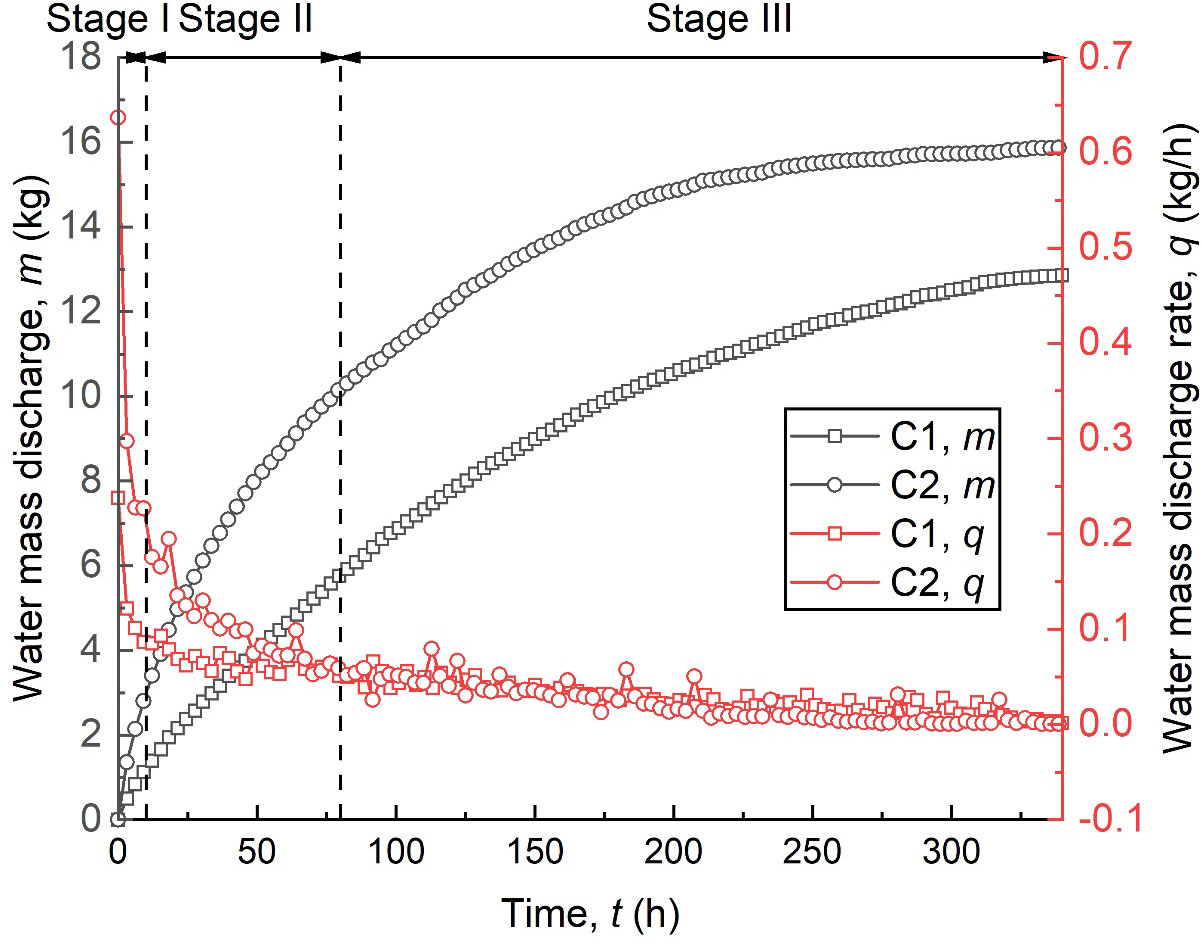
Figure 4 The curves of water discharged versus time.
3.2 Pore water pressure dissipation
Figure 5 shows the pore water pressure (U) dissipation law, in which Figures 5A, B show how U dissipated with consolidation time at different positions, with the three stages defined above marked with dashed lines. Figure 5C plots the U distribution along the horizontal direction at the end of each stage.
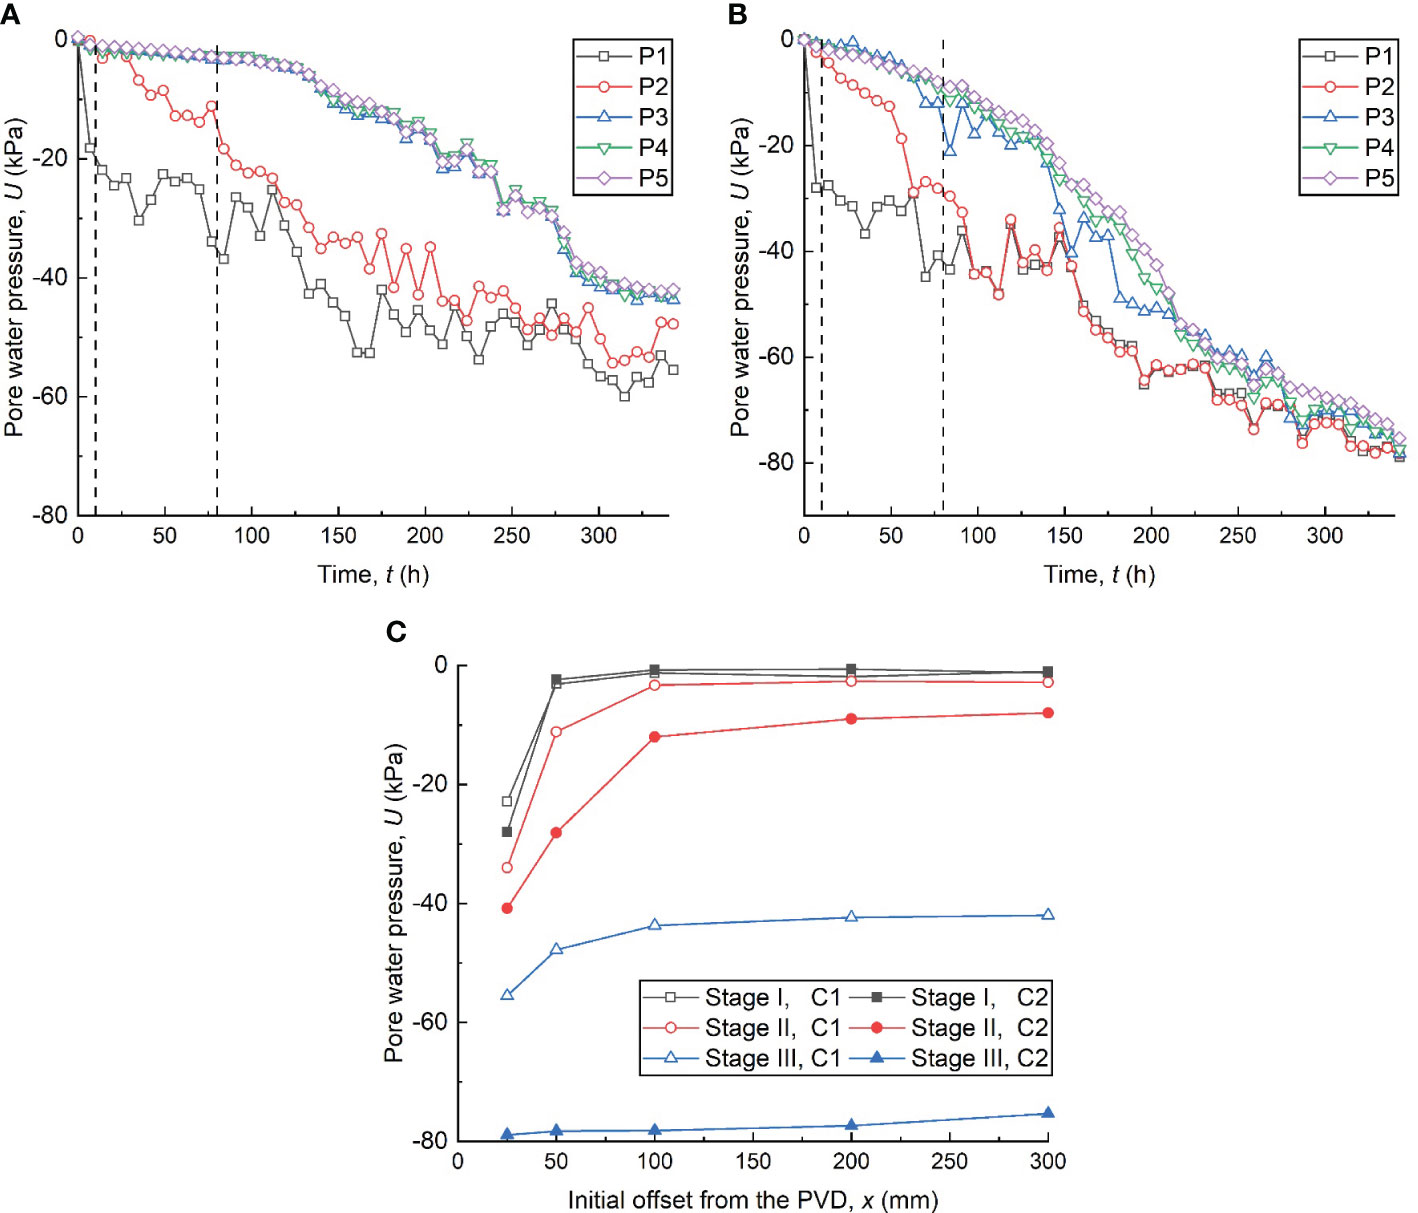
Figure 5 Curves of pore water pressure dissipation versus time in (A) single-PVD and (B) dual-PVD model tests; and (C) pore water pressure distribution along the horizontal direction.
As shown in Figure 5, the U dissipation rate at P1 (25 mm away from the PVD, x=25 mm) was much faster than that at other positions within stage I. Since the vacuum pressure did not propagate to the far field, the U in test C2 at P1 was not affected by the right PVD, thus resulting in a similar lateral distribution of U within stage I (see Figure 5C). In stage II, the U at P2 (x=50 mm) decreased significantly as the vacuum pressure was transmitted to the far field. Notably, as shown in Figure 5C, the U dissipation in test C2 was greater than that in test C1 within stage II, and test C1 had a higher vacuum pressure loss (i.e., the slope of the curve) from P1 to P2. This indicates that the adjacent PVD enhanced the consolidation efficiency of dredged slurry, reducing the clogging between P1 and P2. Within stage III, U dissipated further, and the U dissipation curves at P3, P4 and P5 (100, 200 and 300 mm away from the PVD, respectively) were approximated in both tests. As shown in Figure 5C, at t=340 h in C2, the U dissipation decreased slowly along the lateral direction and the uneven consolidation phenomenon was reduced, while in C1, the U dissipation at P1–P2 were significantly greater than those at P3–P5. This indicates that the effect of an adjacent PVD can relieve the vacuum pressure loss near the PVD during stage III, thus improving the vacuum preloading effect.
3.3 Horizontal displacement of slurry elements
The horizontal and vertical displacements of each slurry element were calculated, respectively. Figure 6 shows the horizontal displacement (dx) field of the slurry during the three stages, where the negative dx represents the slurry move toward to the PVD. Due to the significant settlement of the slurry during the consolidation, some elements defined in the PIV technique move outside the calculation field while some undefined elements move in the calculation field, resulting in a blank area.
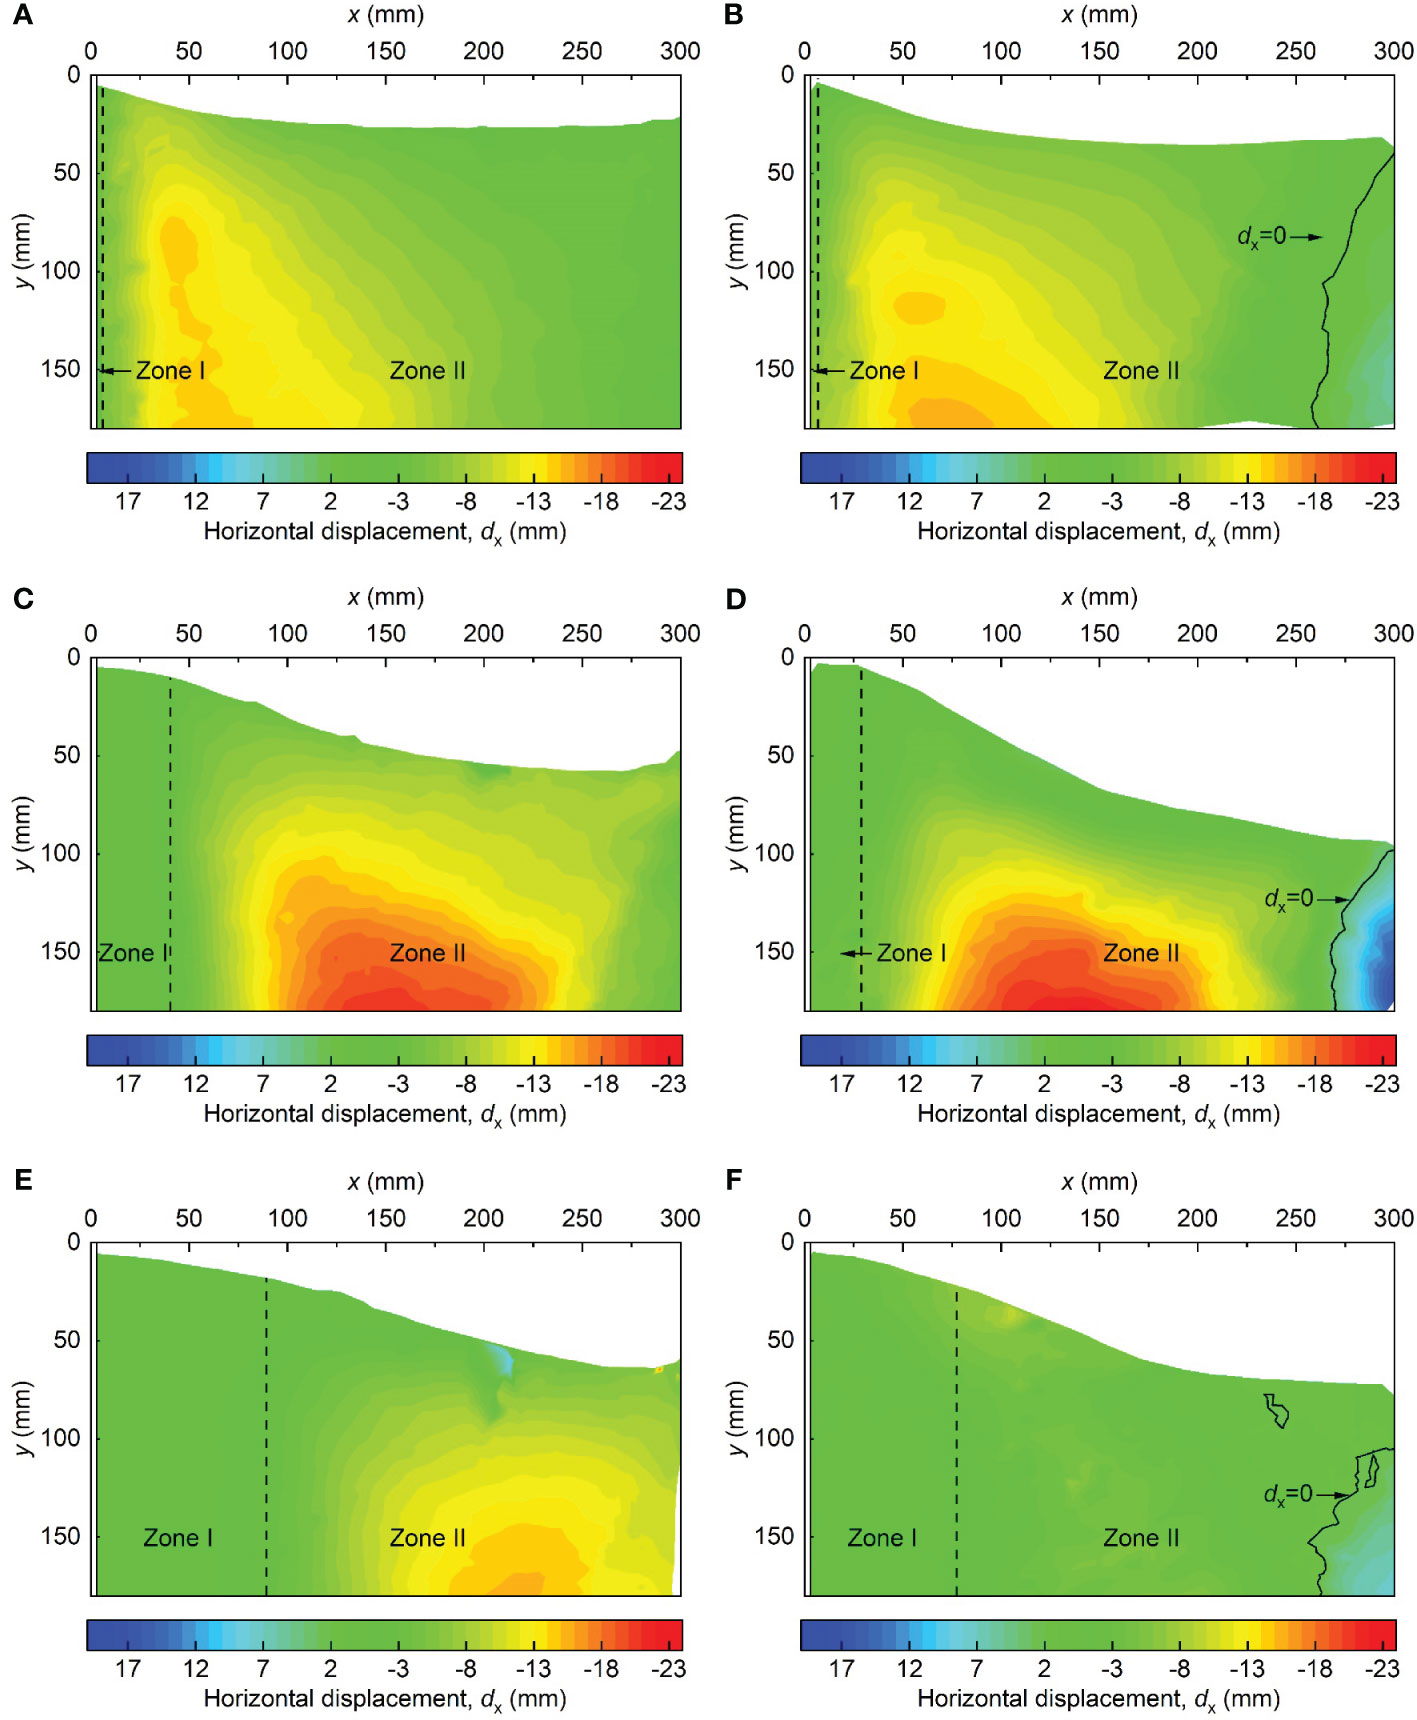
Figure 6 Horizontal displacement fields of dredged slurry in different tests at different times: (A) C1, 0–10 h; (B) C2, 0–10 h; (C) C1, 10–80 h; (D) C2, 10–80 h; (E) C1, 80–340 h; and (F) C2, 80–340 h.
As shown in Figures 6A, B, the dx fields in the range of x=0–225 mm of the two tests were roughly the same in stage I. Based on the vacuum pressure transition characteristics, the displacement field can be divided into two zones by the dx. Zone I is a consolidated zone where the slurry has been consolidated, and the dx=-2–0 mm. Zone II is a transitional zone, where the |dx|>2 mm. It is worth noting that in test C2, a horizontal displacement contour with dx=0 mm appeared in the range of x=250–300 mm, while the slurry still moved toward the PVD at the same position in test C1. This is because the vacuum pressure from the two PVDs in C2 reached equilibrium at x=250–300 mm. This finding is consistent with the test results reported by Wang et al. (2019), which indicated that the dx in the midpoint between two PVDs is zero. The difference between this study and Wang et al. (2019) may be attributed to the difference in vacuum pressure loss in the two PVDs. Figures 6C, D show the variations in dx for the two tests in stage II. In stage II, as the vacuum pressure propagated further in the slurry, the dx of the far-field slurry increased further, and the maximum horizontal displacement moved away from the PVD. It is worth noting that zone I was further enlarged in stage II, and the width of zone I was larger in test C1 than in test C2. As reported by Sun et al. (2022a); Sun et al. (2022b), the dredged slurry near the PVD rapidly moves towards the PVDs under the vacuum pressure gradient, resulting in the formation of a clogging zone. A larger Zone I indicates a thicker thickness of the clogging zone, which implies that the adjacent PVD can effectively reduce the thickness of the clogging zone around the PVD, thereby reducing vacuum pressure loss and improving the consolidation efficiency of the dredged slurry (as shown in Figure 5). Figures 6E, F show the variations in dx for both tests in stage III. Within stage III, the vacuum pressure loss due to the clogging zone caused a significant decrease in dx. Furthermore, in test C2, the decrease in dx of the slurry is also due to the horizontal vacuum stress offset by the vacuum pressure transmitted from the right PVD.
To further compare the differences in dx between the two tests, the mean horizontal displacement () distributions of the slurry within each stage were calculated. Figure 7 shows the with error bars representing ± 1 standard deviation in each stage.
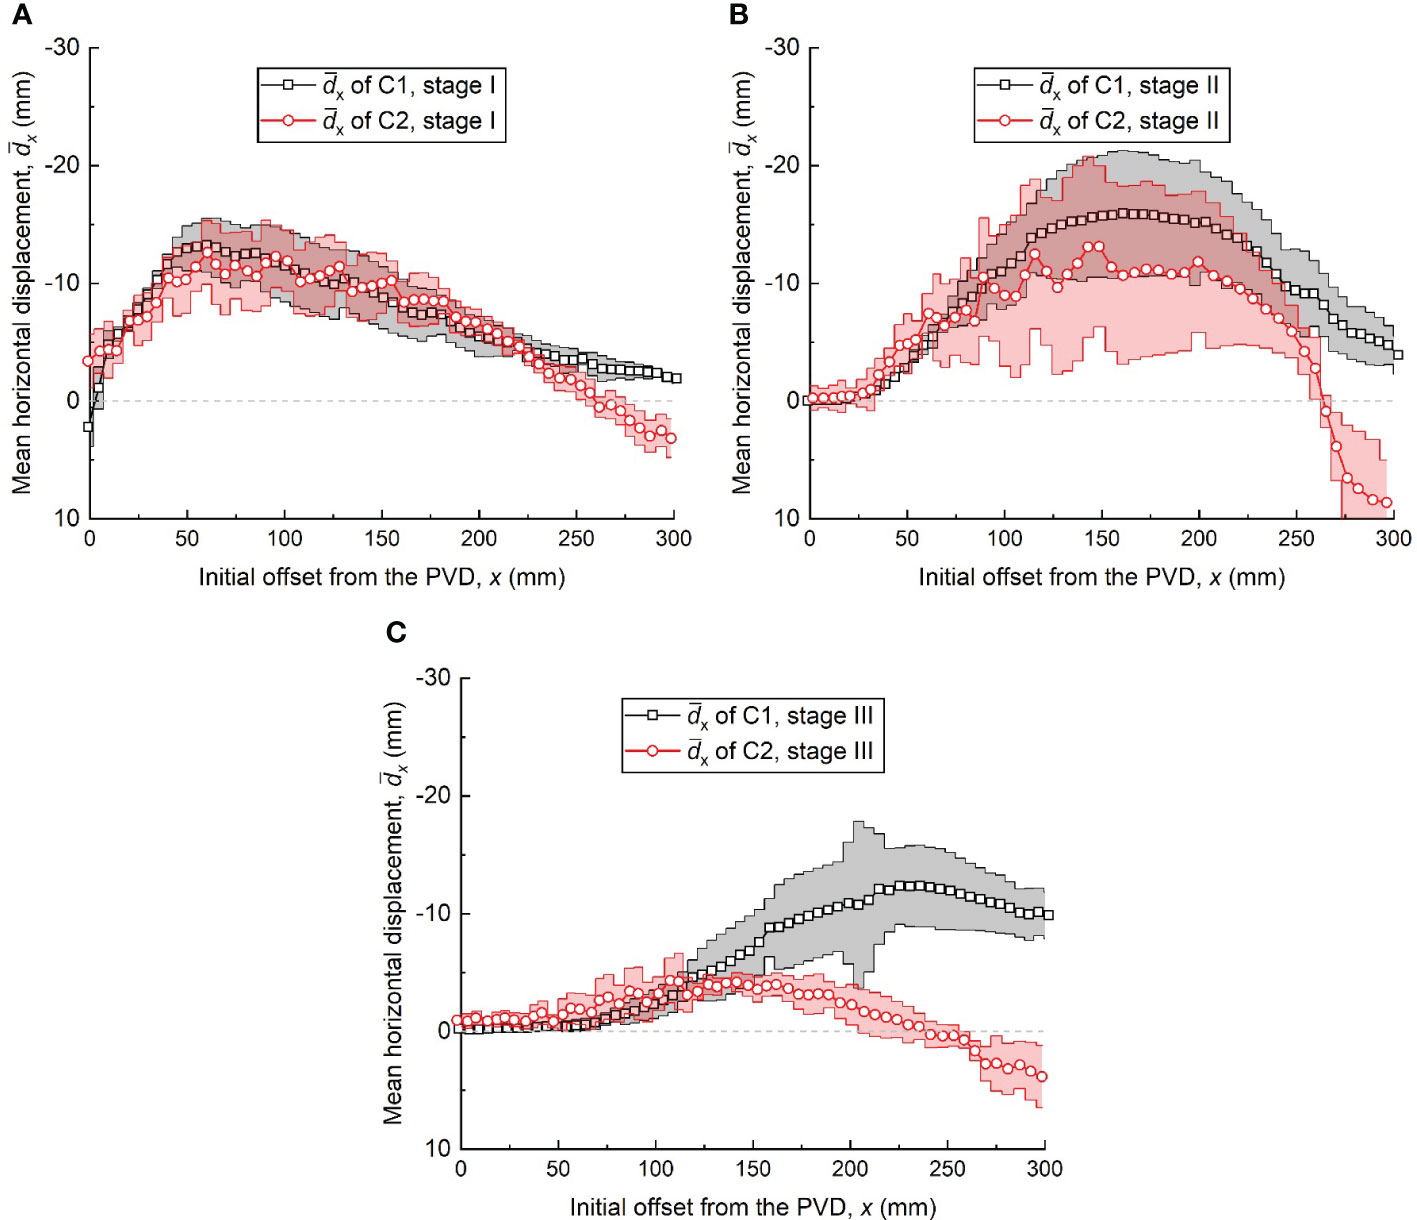
Figure 7 Horizontal displacement distributions at stages: (A) 0–10 h, stage I, (B) 10–80 h, stage II and (c) 80–340 h, stage III (mean ± 1 standard deviation).
As shown in Figure 7A, since the vacuum pressure transmitting from the right PVD did not reach x=0–225 mm, the distribution and standard deviation of the slurry in this range were approximately the same in stage I. Within x=225–300 mm, the vacuum pressures from the two PVDs canceled each other out, resulting in a slightly larger standard deviation of dx in test C2 than in C1, indicating a more scattered dx of the dredged slurry. In addition, the slopes of each curve reflect the degree of lateral strain experienced by the slurry element. The positive slope indicates that the element was compressed horizontally, while the negative slope signifies the element was under extension. And the higher negative slope in x=225–300 mm means the slurry underwent a larger extension (see below). As shown in Figure 7B, the of C1 was larger than that of C1 in x=0–75 mm, and the of C2 was much smaller than that of C1 in x=75–263 mm. The larger of C2 in x=0–75 mm indicates that higher consolidation effect during this stage. Furthermore, as the vacuum pressure transmitted from the PVD was partially canceled by the vacuum pressure from the adjacent PVD, it is noteworthy that the dx distribution of the slurry in C2 was more scattered, especially in x=75–263 mm. In Figure 7C, the and standard deviation in x=0–114 mm in test C2 was larger than in C1, indicating that the slurry near the left PVD in test C2 was further consolidated. In addition, the in x=114–300 mm was much greater in test C1 than in C2 in stage III. Differing from stage II, the dx in C1 was more discrete, which can be explained by the vacuum stress from the right PVD acting on the slurry element having stabilized, leading to a lower and more uniform dx value.
3.4 Vertical displacement of slurry elements
Figure 8 shows the vertical displacement (dy) of the displacement vector of dredged slurry within the three stages. A positive dy value represents vertical settlement of the slurry. As shown in Figures 8A, B, a non-uniform settlement was observed near the PVD, characterized by smaller dy near the PVD and larger dy in the far field. Moreover, owing to the limited propagation of vacuum pressure, dy of test C1 demonstrates an initial increase followed by a subsequent decrease along the x. Additionally, in test C2, the slurry vertical settlement superimposed in the far field, resulting in a “W”-shaped distribution of dy contour lines. Figures 8C, D show the dy fields of the slurry during stage II in the two tests. In stage II, the dy was developed toward the far field and downward. In addition, the dy of the slurry corresponding to C2 was superimposed by the effect of the two PVDs, resulting in dy being much larger than that of C1. Figures 8E, F show the dy field in stage III corresponding to C1 and C2. In stage III, dy was significantly reduced due to the stabilization of clogging, which also reduced the difference in dy between the two tests.
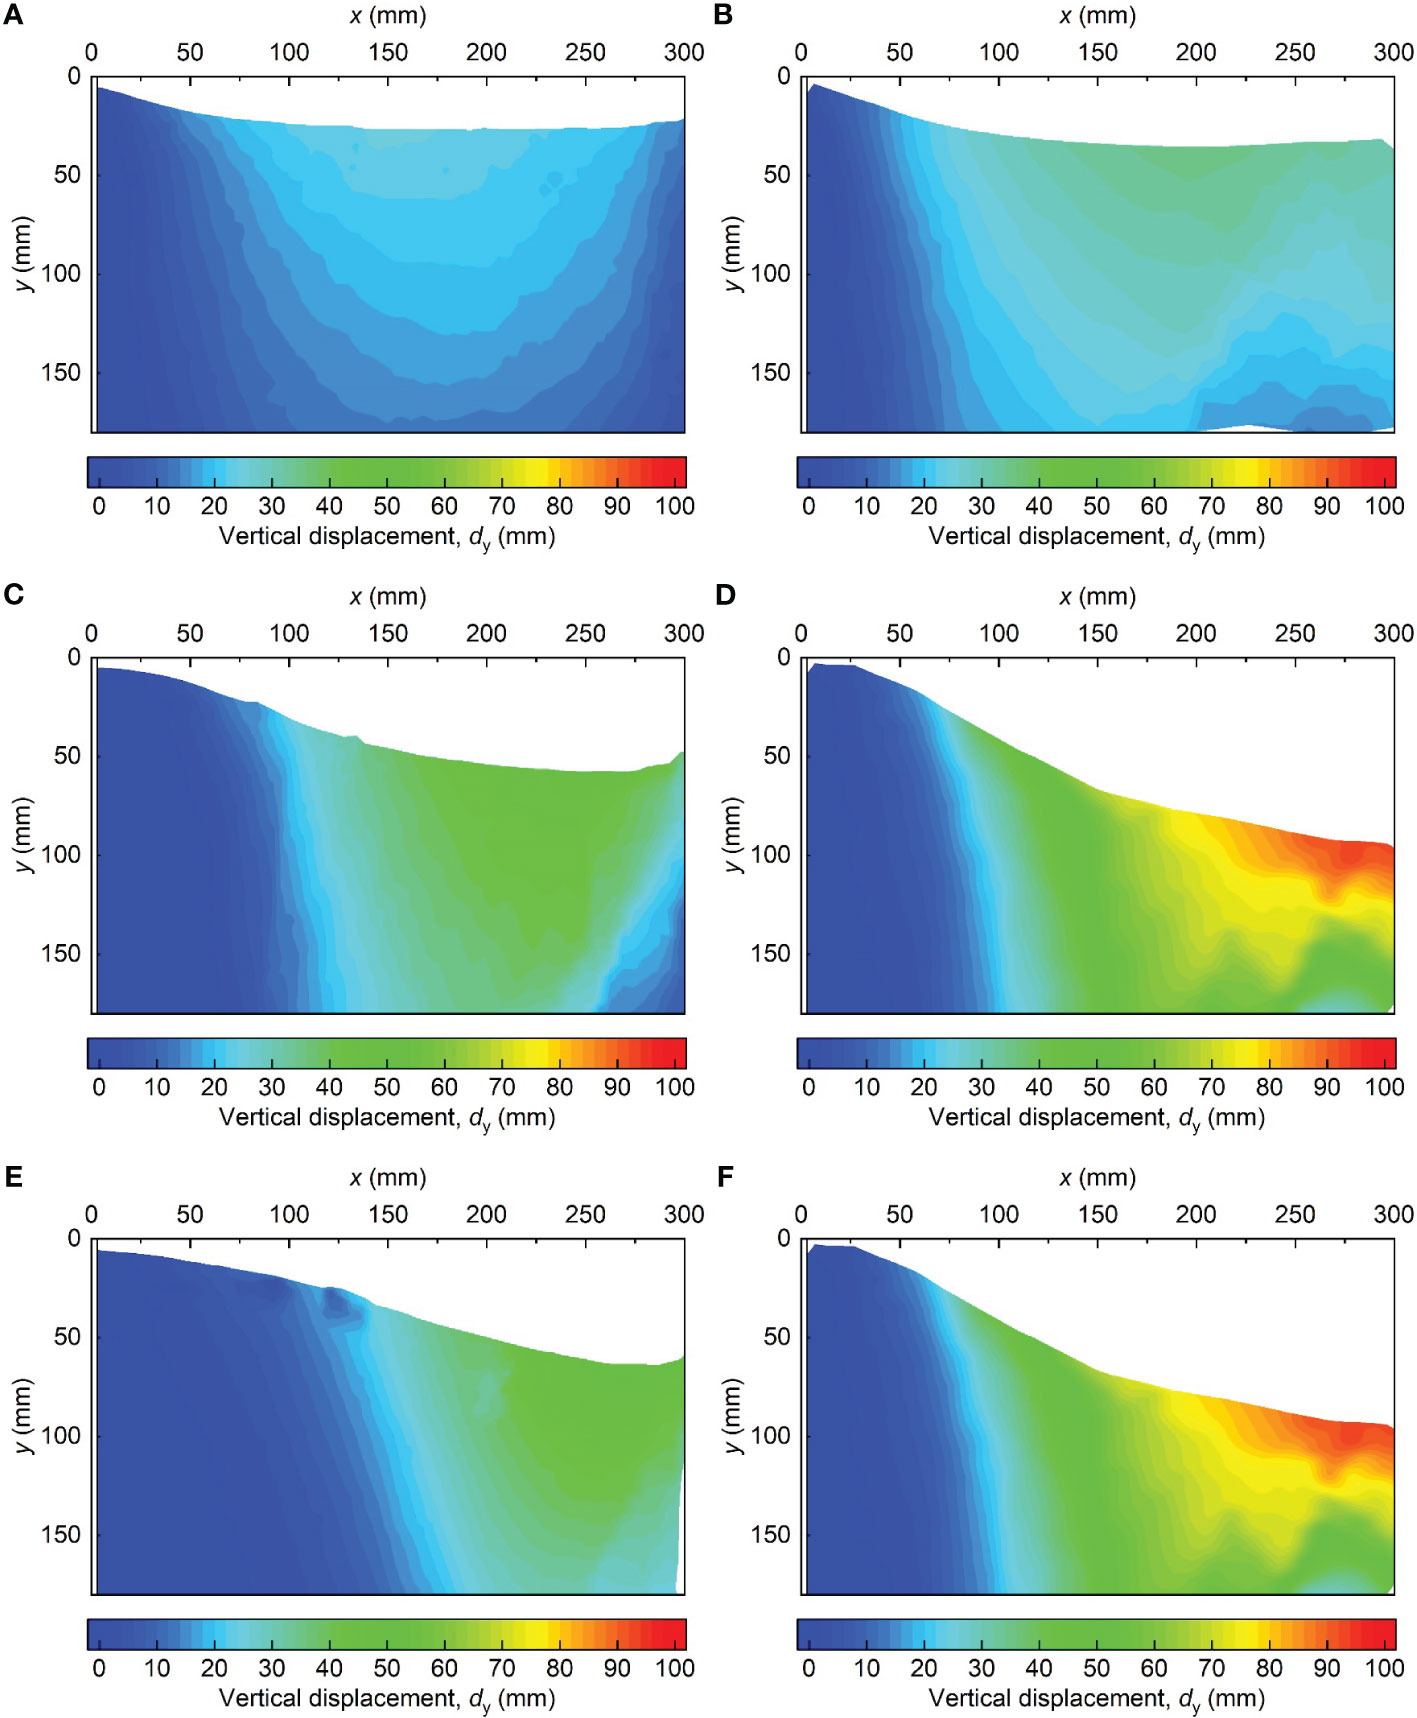
Figure 8 Vertical displacement fields of dredged slurry in the different tests at different stages: (A) C1, 0–10 h; (B) C2, 0–10 h; (C) C1, 10–80 h; (D) C2, 10–80 h; (E) C1, 80–340 h; and (F) C2, 80–340 h.
Similarly, the mean vertical displacements () and standard deviations of the vertical displacements of the slurry along the horizontal direction within each stage were calculated. As shown in Figure 9A, the near the PVD (x≈0 mm) corresponding to tests C1 and C2 were approximated. Since the vacuum pressure did not propagate to the far field, the slurry element underwent the same stress state, resulting in similar standard deviations in in tests C1 and C2. As shown in Figure 9B, in the range of x=0–28 mm, the slurry in test C1 trended to be stable, whereas the slurry in C2 still underwent a small settlement. As vacuum pressure propagated to the far field, the difference between the two tests increased further. In addition, in test C1 decreased at x=220–300 mm, which indicates that the vacuum pressure was significantly reduced. Moreover, the standard deviation in in stage II was greater in test C2 than in C1. This is because the vertical non-uniform vacuum stress applied to the slurry element between the two PVDs made dy of the slurry more discrete. Figure 9C shows the distributions of two tests in stage III. The differences in the and standard deviation in both tests were reduced due to the loss of vacuum pressure. As dual PVDs reduce the clogging zone near the PVD, the slurry near the PVD further settled.
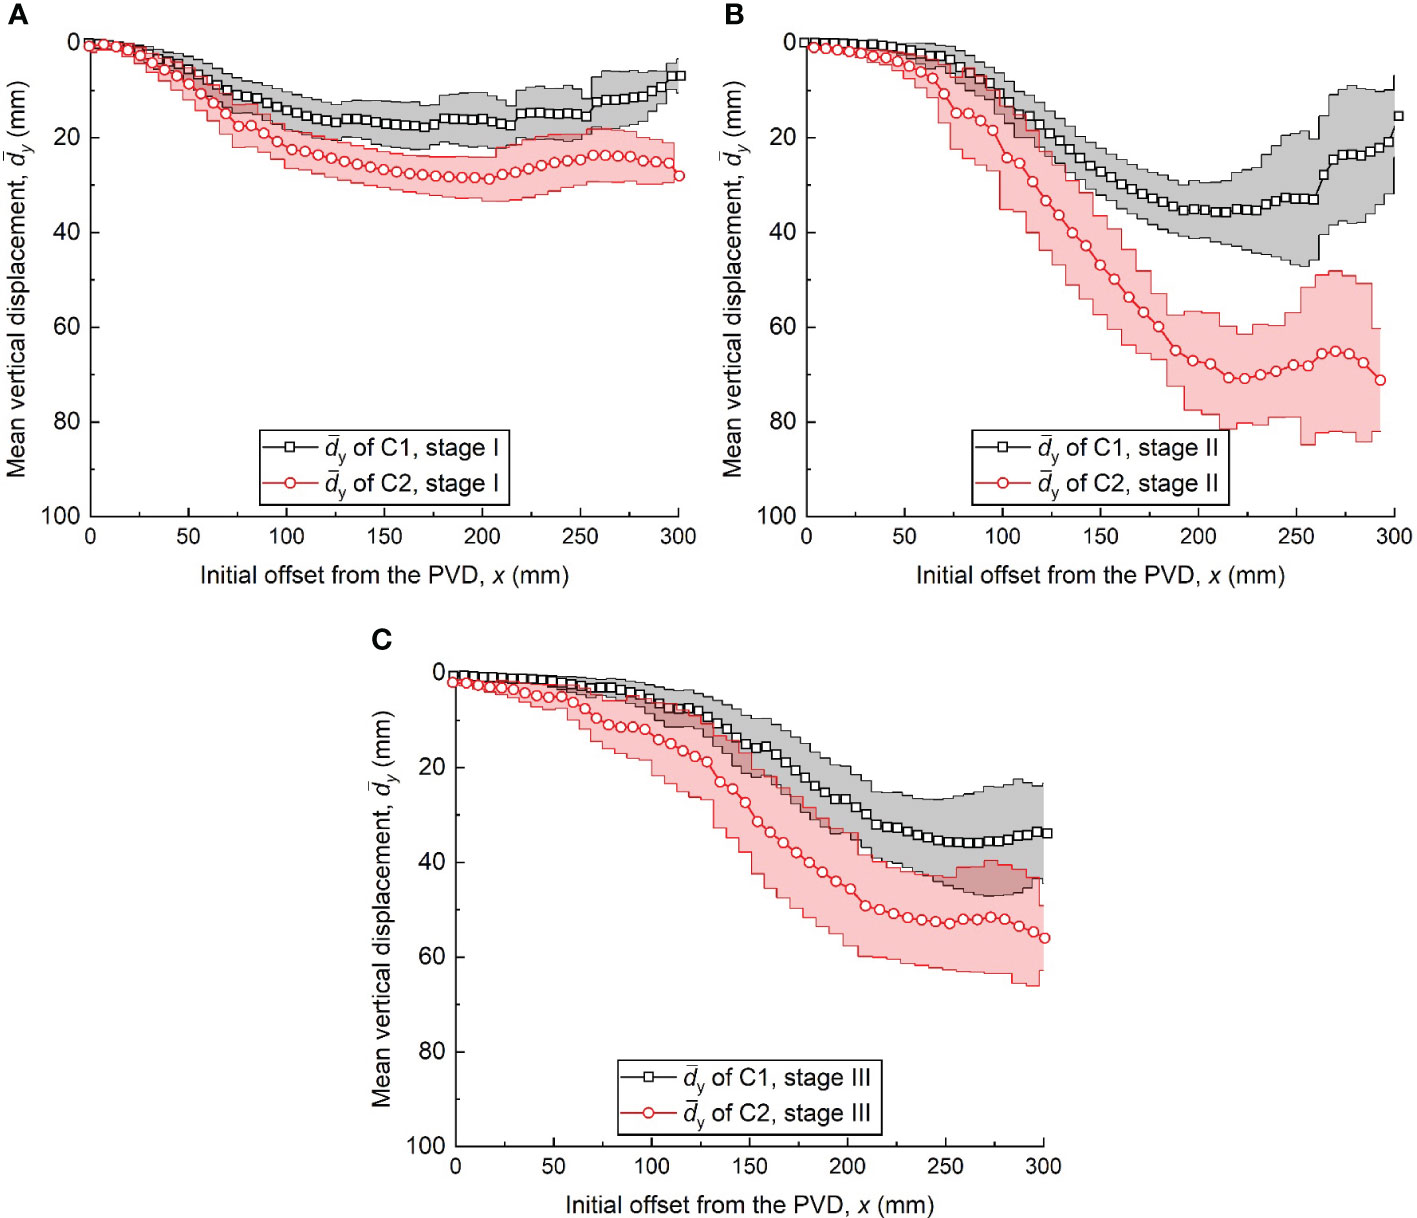
Figure 9 Vertical displacement distributions at different stages: (A) 0-10 h, stage I (B) 10-80 h, stage II and (C) 80-340 h, stage III (mean ± 1 standard deviation).
3.5 Strain profile of slurry elements
The GeoPIV-RG algorithm (Stanier et al., 2016) was adopted to convert the horizontal and vertical displacements to horizontal strain and vertical strain, respectively. Natural strains were used, as is conventional for large-strain behavior with positive compression (White and Bolton, 2004; Stanier et al., 2016).
Figure 10 shows the mean horizontal strain () profiles of the three stages in the two tests. Within stage I, the slurry elements near the PVD (x=0–28 mm) underwent severe horizontal compression ( ≈19%). In the range of x=0–50 mm, the horizontal vacuum stress acting on the slurry element was greater than the stress of the element maintaining the at-rest state, which led to the slurry being compressed horizontally. As the vacuum pressure attenuated along the lateral direction, gradually decreased to 0 and was converted to horizontal extension. Within x=0–225 mm, the distribution was approximately the same for both tests. The horizontal extension strain of C2 was greater than that of C1 in the x=225–300 mm range due to the effect of the two PVDs. In stage II, as the slurry elements near the PVD consolidated in stage I rapidly, the in x=0–28 mm were low. In addition, the of test C2 in this range was larger than that in test C1, indicating a longer consolidation stage of slurry near the PVD. As the horizontal vacuum stress transmitted from the PVD was partially cancelled, the values in the range of x=28–100 mm were less than those in test C1. In stage III, the horizontal compression range in C1 increased further to x≈225 mm, while that in C2 was only x=0–115 mm, and the of test C2 in the range was only about 3%.
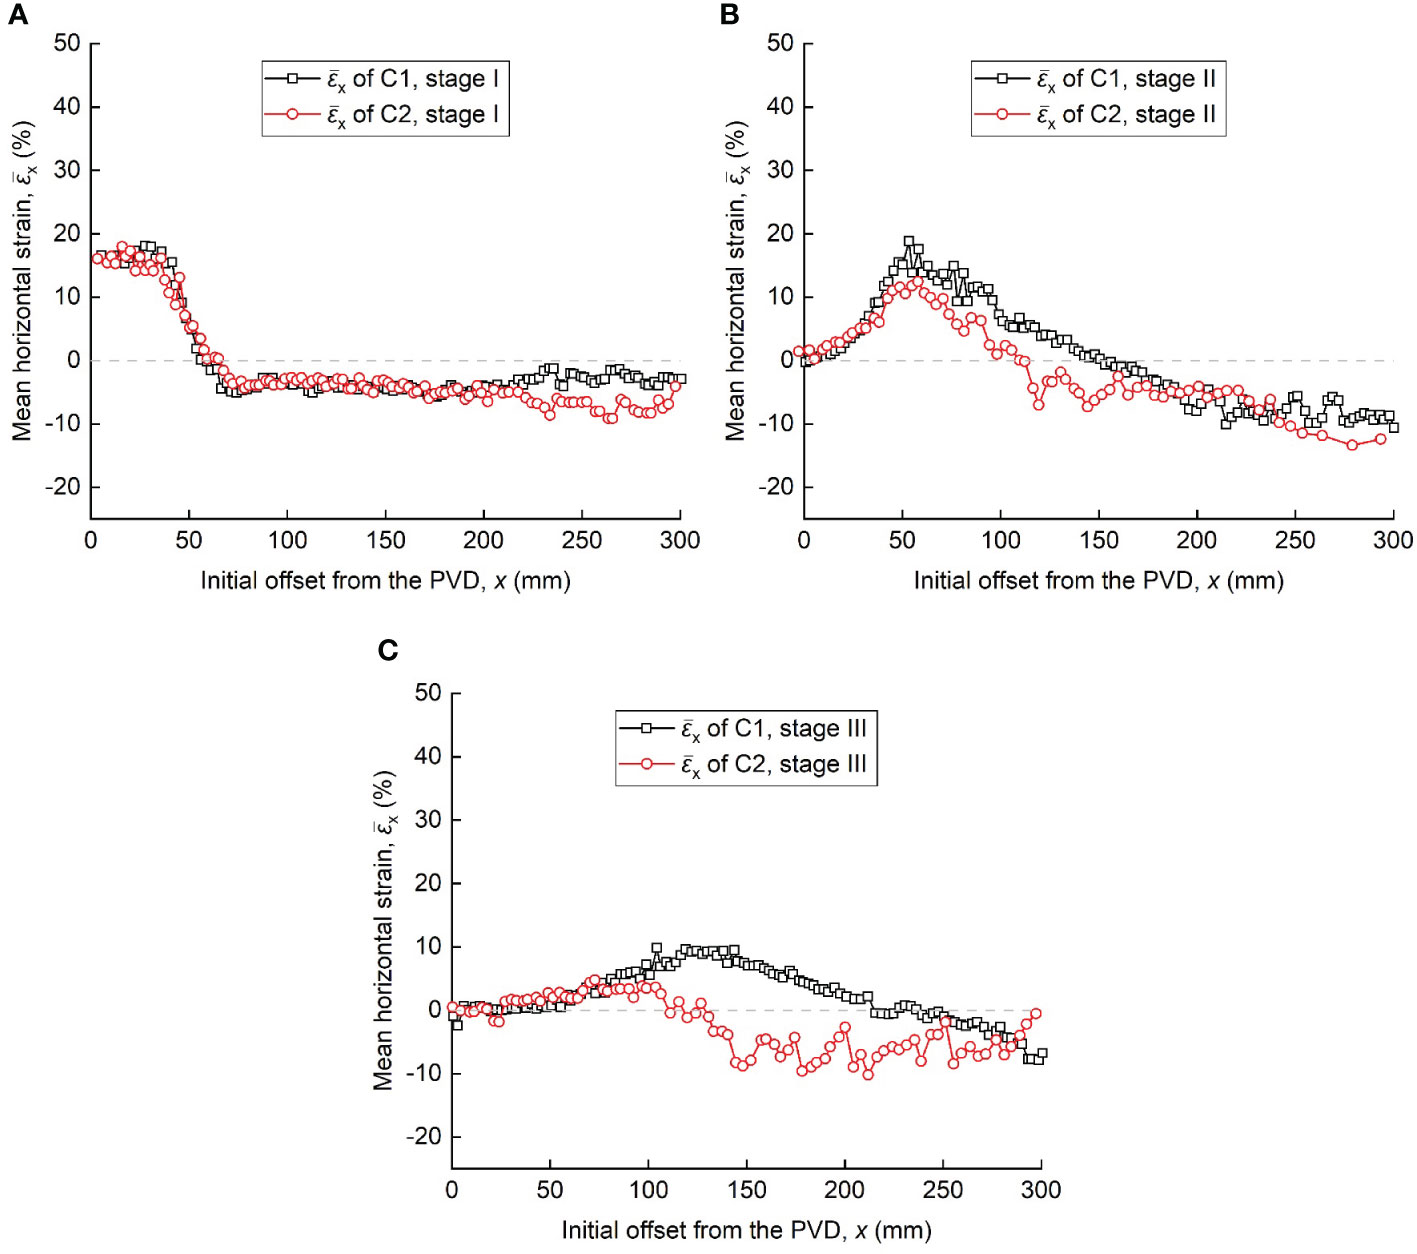
Figure 10 Mean horizontal strains distributions at different stages: (A) 0–10 h, stage I, (B) 10–80 h, stage II and (C) 80–340 h, stage III.
Figure 11 shows the mean vertical strain () profiles of during the three stages in the two tests. In stage I, was about zero at x=0 mm and gradually increased with x. In test C2, was greater than in C1 due to the effect of the two PVDs. In stage III, the slurry elements in the far field compressed further vertically under the vertical vacuum stress, and was much greater than in stage I. In stage III, was slightly reduced compared with stage II. Compared with the values, it can be inferred that the slurry in test C2 was mainly compressed vertically in stage III.
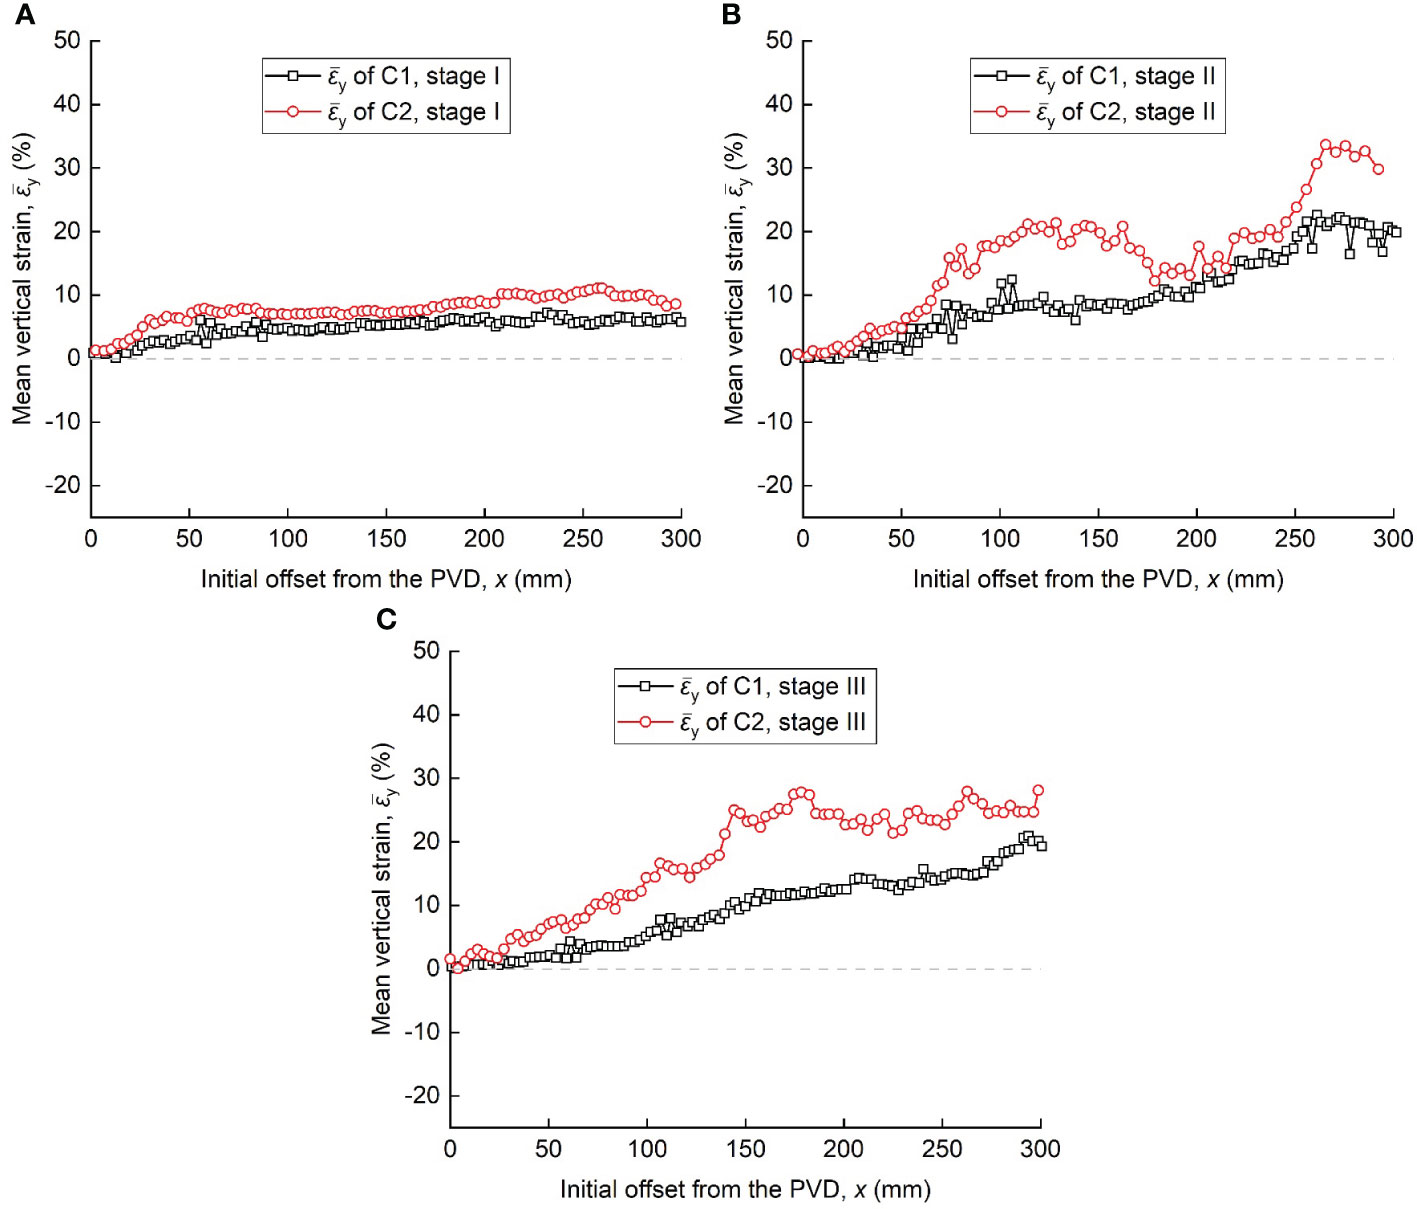
Figure 11 Mean vertical strains distribution at different stages: (A) 0–10 h, stage I, (B) 10–80 h, stage II and (C) 80–340 h, stage III.
To compare the degree of uneven consolidation of slurry along the horizontal direction under different PVD layout, the volume strains of slurry elements at each stage in tests C1 and C2 were calculated, and the mean volume strains () are shown in Figure 12. As shown in Figure 12A, slurry in both tests C1 and C2 experienced rapid compression near the PVD (x=0–28 mm), with ≈19%. In the range of x=28–300 mm, the of slurry element in tests C1 and C2 was relatively similar. This is attributed to the fact that the vacuum pressure was not transmitted to the far field within this range, resulting in minimal stress difference among the slurry elements. Figure 12B indicates that during stage II, slurry units within the range of x=100–300 mm experienced greater volume compression strains under the influence of dual PVDs, leading to larger dissipation of pore water pressure within this range (as shown in Figure 5C). As shown in Figure 12C, the of slurry element in test C2 were greater than those in test C1. This implies that under the influence of dual PVDs, slurry elements in test C2 underwent greater volume compression after the stabilization of the clogging zone, with compression mainly occurring vertically (as shown in Figure 11C). This indicates that test C2 achieved better consolidation effects for the slurry.
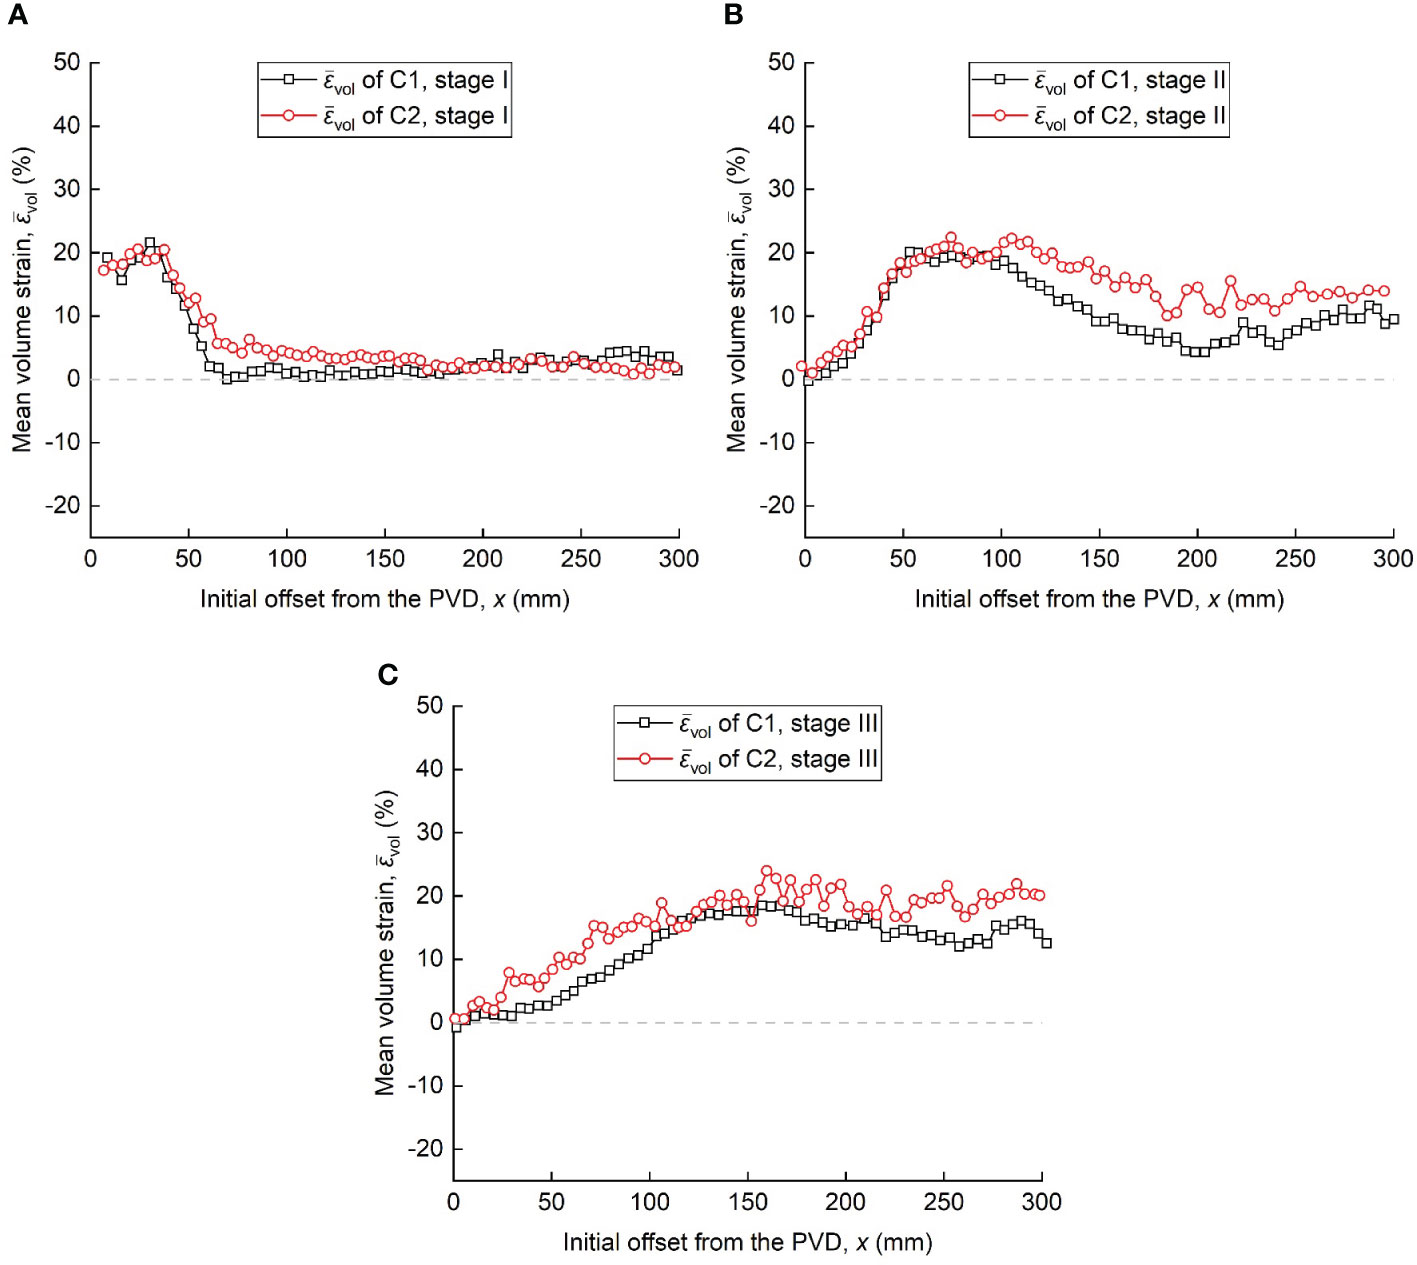
Figure 12 Mean volume strains distribution at different stages: (A) 0–10 h, stage I, (B) 10–80 h, stage II and (C) 80–340 h, stage III.
3.6 Clogging zone development
The clogging zone has been widely reported (Tang et al., 2010; Bao et al., 2014; Xu et al., 2020; Sun et al., 2022a). The development of clogging zone thickness in the presence of one or two PVDs was investigated. As mentioned above, the formation of clogging zone was related to the horizontal displacement of the slurry. As per (Sun et al., 2022b), a contour representing zero horizontal strain was defined as the boundary of the clogging zone. The average thickness of the clogging zone over the whole field was used to characterize the thickness versus time.
Figure 13 shows the variation in clogging zone thickness (R) with consolidation time. In stage I, R was roughly the same in both tests. In early stage II (t=10–25 h), the clogging zone thicknesses were approximately equal because the vacuum pressure from the right PVD did not transfer to the observation field. When the vacuum pressure was transmitted to the far field, the horizontal vacuum pressure applied to the slurry elements was offset by the vacuum pressure transmitted from the right PVD, making R greater in test C1 than in C2 at 20–80 h. Since the development of clogging zone thickness stabilized at about 140 h, in which the water discharge rate and the pore water pressure dissipation rate tend to a constant, the later variations in R are not shown in Figure 11. The fitted curves are listed below:

Figure 13 Average clogging zone thickness versus time.
4 Discussion
4.1 Consolidation characteristics under different PVD layout
The two tests revealed different consolidation characteristics under different PVD layout. These are summarized as follows:
In stage I, the slurry near the PVD was rapidly consolidated by horizontal compression under vacuum pressure. Since the vacuum pressure transmitted from the right PVD did not reach this vicinity, the dual PVD had less influence on the consolidation of the slurry near the PVD in this stage. Thus, there was a similar pore pressure dissipation distribution (Figure 5). Besides, the accumulation of vertical vacuum stress and the offset of horizontal vacuum stress led to a larger vertical displacement and strain in the far-field slurry under the dual PVD condition.
In stage II, as the vacuum pressure in test C2 was transmitted from one PVD to the other PVD, the vacuum stresses between the two PVDs were superimposed in the vertical direction, while they offset each other in the horizontal direction. This resulted in a further reduction in the horizontal migration of slurry in test C2 during stage II, reducing the clogging and the thickness of clogging zone in this test. As a result, the slurry near the PVD further consolidated during this stage II, leading to larger pore water pressure dissipation of slurry.
In stage III, the slurry deformation became gradually stabilized and the displacement and strain were much smaller than in stage II, resulting in slow rates of water drainage and pore water pressure dissipation (Figures 4 and 5). The consolidation patterns of the slurry exhibit certain differences during stage III. In test C1, the displacement field of the slurry can be divided into two zones: a zone near the PVD characterized by horizontal compression and vertical compression, and a far-field zone characterized by vertical compression and horizontal compression. On the other hand, in test C2, the deformation pattern of the slurry is predominantly characterized by vertical compression and horizontal stretching, with only a small amount of horizontal compression strain observed near the PVD. Furthermore, the less vacuum pressure loss in test C2 resulted in higher volume compression of the slurry, thereby enhancing the consolidation effect of the slurry.
4.2 Potential application
This paper provided equations describing the relationship between clogging zone thickness and time that can be used in consolidation calculations that consider the clogging effect. As indicated by Liu et al. (2021) the thickness of the clogging zone is vital important in calculating the consolidation process of dredged slurries improved by vacuum preloading. It can thus make the calculation more practical when considering the gradual increase in the radius of the clogging zone. A direct and accessible method can be used for applying the equation in consolidation calculation, in which the effective zone around a PVD can be divided into a clogging zone and a normal zone in the consolidation model. As shown by Eq. (1) or (2), the radius of the clogging zone can be assumed as a function of time with other basic assumptions in the large or small strain consolidation theory reserved.
5 Conclusions
This study investigated the effect of PVD layout on the characteristics of dredged slurry deformation under vacuum preloading. Two vacuum preloading model tests were carried out—with single and dual PVDs. The PIV technology was used to observe the displacement and strain profile of dredged slurry during consolidation. The test results offer the following conclusions:
1. Due to the vacuum stresses transmitted from the two PVDs offset each other in the horizontal direction, the horizontal displacement of slurry significantly decreased and became more dispersed in the mid-stage of vacuum preloading, resulting in a thinner clogging zone, thereby reducing vacuum pressure loss, which in turn improved the dissipation efficiency of pore water pressure.
2. In the case of dual PVDs, the slurry near the PVD underwent a longer period of consolidation deformation, and the consolidation pattern of the slurry was primarily characterized by vertical compression and horizontal extension during the later stages of vacuum preloading. In the case of a single PVD, there is a distinct zone where the slurry experienced both vertical and horizontal compression deformation in the later stages.
3. The development of the clogging zone during the initial stage of vacuum preloading was similar under different PVD layouts. In the later stages of consolidation, the growth rate of the clogging zone was slow in two PVDs case. A relationship between the thickness of the clogging zone and time is proposed, providing a reference for theoretical consolidation calculations considering the clogging zone.
Data availability statement
The raw data supporting the conclusions of this article will be made available by the authors, without undue reservation.
Author contributions
JC contributed to conception and design of the study. ZH, and BX conducted the model test. ZH performed the analysis. ZH wrote the first draft of the manuscript. BX, and MY wrote sections of the manuscript. All authors contributed to manuscript revision, read, and approved the submitted version.
Conflict of interest
Author JC was employed by the company Zhejiang University of Technology Engineering Design Group Co.,Ltd.
The authors declare that the research was conducted in the absence of any commercial or financial relationships that could be construed as a potential conflict of interest.
Publisher’s note
All claims expressed in this article are solely those of the authors and do not necessarily represent those of their affiliated organizations, or those of the publisher, the editors and the reviewers. Any product that may be evaluated in this article, or claim that may be made by its manufacturer, is not guaranteed or endorsed by the publisher.
References
Arshad M. I., Tehrani F. S., Prezzi M., Salgado R. (2014). Experimental study of cone penetration in silica sand using digital image correlation. Géotechnique 64 (7), 551–569. doi: 10.1680/geot.13.P.179
Bao S., Lou Y., Dong Z., Mo H., Chen P., Zhou R. (2014). Causes and countermeasures for vacuum consolidation failure of newly-dredged mud foundation. Chin. J. Geotechnical Eng. 36 (7), 1350–1359. doi: 10.11779/CJGE201407020
Bauer J., Kempfert H.-G., Reul O. (2016). Lateral pressure on piles due to horizontal soil movement. Int. J. Phys. Model. Geotechnics 16 (4), 173–184. doi: 10.1680/jphmg.15.00005
Bergado D. T., Balasubramaniam A., Fannin R. J., Holtz R. D. (2002). Prefabricated vertical drains (PVDs) in soft Bangkok clay: a case study of the new Bangkok international airport project. Can. Geotechnical J. 39 (2), 304–315. doi: 10.1007/s40891-021-00339-x
Cai Y., Qiao H., Wang J., Geng X., Wang P., Cai Y. (2017). Experimental tests on effect of deformed prefabricated vertical drains in dredged soil on consolidation via vacuum preloading. Eng. Geology 222, 10–19. doi: 10.1016/j.enggeo.2017.03.020
Cai Y. Q., Wang J., Ma J., Wang P., Fu H. (2016). A new method to improve the effectiveness of vacuum preloading on the consolidation of dredged fill in wenzhou. Japanese Geotechnical Soc. Special Publ. 2 (51), 1794–1797. doi: 10.3208/jgssp.TC217-05
Cai Y., Xie Z., Wang J., Wang P., Geng X. (2018). New approach of vacuum preloading with booster prefabricated vertical drains (PVDs) to improve deep marine clay strata. Can. Geotechnical J. 55 (10), 1359–1371. doi: 10.1139/cgj-2017-0412
Chai J. C., Carter J. P., Hayashi S. (2005). Ground deformation induced by vacuum consolidation. J. Geotechnical Geoenvironmental Eng. 131 (12), 1552–1561. doi: 10.1061/(Asce)1090-0241(2005)131:12(1552
Chai J.-c., Fu H.-t., Wang J., Shen S.-L. (2020). Behaviour of a PVD unit cell under vacuum pressure and a new method for consolidation analysis. Comput. Geotechnics 120. doi: 10.1016/j.compgeo.2019.103415
Chu J., Yan S. W., Yang H. (2000). Soil improvement by the vacuum preloading method for an oil storage station. Géotechnique 50 (6), 625–632. doi: 10.1680/geot.2000.50.6.625
Deng Y., Liu L., Cui Y.-J., Feng Q., Chen X., He N. (2019). Colloid effect on clogging mechanism of hydraulic reclamation mud improved by vacuum preloading. Can. Geotechnical J. 56 (5), 611–620. doi: 10.1139/cgj-2017-0635
Fang Y., Guo L., Huang J. (2019). Mechanism test on inhomogeneity of dredged fill during vacuum preloading consolidation. Mar. Georesources Geotechnology 37 (8), 1007–1017. doi: 10.1080/1064119x.2018.1522398
Feng S., Lei H., Lin C. (2022). Analysis of ground deformation development and settlement prediction by air-boosted vacuum preloading. J. Rock Mechanics Geotechnical Eng. 14 (1), 272–288. doi: 10.1016/j.jrmge.2021.05.006
Geng X., Yu H. S. (2017). A large-strain radial consolidation theory for soft clays improved by vertical drains. Géotechnique 67 (11), 1020–1028. doi: 10.1680/jgeot.15.T.013
Jiang H., Wu Y., Kong G., Li J. (2020). Transparent soil model test of vacuum preloading method on ultra-soft soil and formation mechanism of “soil pile”. J. Harbin Inst. Technol. 52, 33–40. doi: 10.11918/201809039
Kim J., Woo S. I., Chung C.-K. (2017). Assessment of non-uniform deformation during consolidation with lateral drainage using particle image velocimetry (PIV). KSCE J. Civil Eng. 22 (2), 520–531. doi: 10.1007/s12205-017-0707-6
Kwak, Park, Kim, Chung, Baek (2020). Shear band characterization of clayey soils with particle image velocimetry. Appl. Sci. 10 (3), 1139. doi: 10.3390/app10031139
Liu S. J., Cai Y. Q., Sun H. L., Geng X. Y., Shi L., Pan X. D. (2021). Consolidation considering clogging effect under uneven strain assumption. Int. J. Geomechanics 21 (1), 12. doi: 10.1061/(asce)gm.1943-5622.0001898
Mesri G., Khan A. Q. (2012). Ground improvement using vacuum loading together with vertical drains. J. Geotechnical Geoenvironmental Eng. 138 (6), 680–689. doi: 10.1061/(asce)gt.1943-5606.0000640
Ni J., Geng X.-Y. (2022). Radial consolidation of prefabricated vertical drain-reinforced soft clays under cyclic loading. Transportation Geotechnics 37, 100840. doi: 10.1016/j.trgeo.2022.100840
Pan X., Zhou L., Sun H., Cai Y., Shi L., Yuan Z. (2020). Vacuum preloading test for high moisture content slurry using particle image velocimetry. J. ZheJiang Univ. (Engineering Science) 54 (6), 1078–1085. doi: 10.3785/j.issn.1008-973X.2020.06.004
Robinson R. G., Indraratna B., Rujikiatkamjorn C. (2012). Final state of soils under vacuum preloading. Can. Geotechnical J. 49 (6), 729–739. doi: 10.1139/t2012-024
Shen J. (2018). Laboratory model test of vacuum preloading on dredged clays at high initial water content. Nanjing China: Southeast Univ.
Stanier S. A., Blaber J., Take W. A., White D. J. (2016). Improved image-based deformation measurement for geotechnical applications. Can. Geotechnical J. 53 (5), 727–739. doi: 10.1139/cgj-2015-0253
Stanier S. A., White D. J. (2013). Improved image-based deformation measurement in the centrifuge environment. Geotechnical Testing J. 36 (6), 915–928. doi: 10.1520/gtj20130044
Sun H.-l., He Z.-l., Geng X.-y., Shen M.-f., Cai Y.-q., Wu J., et al. (2022a). Formation mechanism of clogging of dredge slurry under vacuum preloading visualized using digital image technology. Can. Geotechnical J. 59 (7), 1292–1298. doi: 10.1139/cgj-2021-0341
Sun H.-l., He Z.-l., Pan K., Lu J.-l., Pan X.-d., Shi L., et al. (2022b). Consolidation mechanism of high-water-content slurry during vacuum preloading with prefabricated vertical drains. Can. Geotechnical J. 59 (8), 1373–1385. doi: 10.1139/cgj-2021-0248
Sun H. L., Weng Z. Q., Geng X. Y., Shen M. F., Pan X. D., Shi L., et al. (2022c). Experimental study on the effects of particle grading on lime-treated slurry with vacuum preloading. Mar. Georesources Geotechnology 40 (7), 869–881. doi: 10.1080/1064119x.2021.1946626
Sun H.-l., Weng Z.-q., Liu S.-j., Geng X.-y., Pan X.-d., Cai Y.-q., et al. (2020). Compression and consolidation behaviors of lime-treated dredging slurry under vacuum pressure. Eng. Geology 270, 105573. doi: 10.1016/j.enggeo.2020.105573
Take W. A., Bolton M. D. (2011). Seasonal ratcheting and softening in clay slopes, leading to first-time failure. Géotechnique 61 (9), 757–769. doi: 10.1680/geot.9.P.125
Tang T., Huang J., Guan Y., Chen H., Cheng W. (2010). Experimental study on dredged fill sludge improved by vacuum preloading. Port Waterway Eng. 4, 115–122. doi: 10.16233/j.cnki.issn1002-4972.2010.04.027
Tang M., Shang J. Q. (2000). Vacuum preloading consolidation of yaoqiang airport runway. Géotechnique 50 (6), 613–623. doi: 10.1680/geot.2000.50.6.613
Wang J., Cai Y., Ni J., Geng X., Xu F. (2017a). Effect of sand on the vacuum consolidation of dredged slurry. Mar. Georesources Geotechnology 36 (2), 238–244. doi: 10.1080/1064119x.2017.1304473
Wang J., Fu Z., Yu Y., Wang G., Shi L., Yuan Z., et al. (2021). Numerical investigating on representativeness of tracers in PIV model test of dredged slurry treated by vacuum preloading. Appl. Sci. 11 (20), 9715. doi: 10.3390/app11209715
Wang P., Han Y., Wang J., Cai Y., Geng X. (2019). Deformation characteristics of soil between prefabricated vertical drains under vacuum preloading. Geotextiles Geomembranes 47 (6), 798–802. doi: 10.1016/j.geotexmem.2019.103493
Wang J., Ni J., Cai Y., Fu H., Wang P. (2017b). Combination of vacuum preloading and lime treatment for improvement of dredged fill. Eng. Geology 227, 149–158. doi: 10.1016/j.enggeo.2017.02.013
White D. J., Bolton M. D. (2004). Displacement and strain paths during plane-strain model pile installation in sand. Géotechnique 54 (6), 375–397. doi: 10.1680/geot.2004.54.6.375
White D. J., Take W. A., Bolton M. D. (2003). Soil deformation measurement using particle image velocimetry (PIV) and photogrammetry. Géotechnique 53 (7), 619–631. doi: 10.1680/geot.2003.53.7.619
Wu Y.-j., Li J.-p., Lu Y.-T., Zhang X.-d., Le T. H., Chau N. X. Q. (2021). The influence of drainage spacing on the deformation characteristics of transparent ultrasoft soil. Int. J. Geosynthetics Ground Eng. 7 (4), 99. doi: 10.1007/s40891-021-00343-1
Wu Y. J., Zhou R., Lu Y. T., Zhang X. D., Zhang H. Q., Tran Q. C. (2022). Experimental study of PVD-improved dredged soil with vacuum preloading and air pressure. Geotextiles Geomembranes 50 (4), 668–676. doi: 10.1016/j.geotexmem.2022.03.008
Xu B.-H., He N., Jiang Y.-B., Zhou Y.-Z., Zhan X.-J. (2020). Experimental study on the clogging effect of dredged fill surrounding the PVD under vacuum preloading. Geotextiles Geomembranes 48 (5), 614–624. doi: 10.1016/j.geotexmem.2020.03.007
Yao K., Cheng D., Sheng J., Shi L., Hu L., Yu Y. (2023). Real-time behaviour of dredged slurry treated by air-booster vacuum consolidation. Appl. Sci. 13 (6), 3550. doi: 10.3390/app13063550
Zhang H., Geng X.-y., Sun H.-l., Deng Y.-f., Liu S.-j., Cai Y.-q. (2022). Consolidation theory of slurry dewatered by permeable geotextile tube with distributed prefabricated drains. Can. Geotechnical J. 60 (2), 213–229. doi: 10.1139/cgj-2022-0083
Zhao C., Koseki J., Liu W. (2020). Local deformation behaviour of saturated silica sand during undrained cyclic torsional shear tests using image analysis. Géotechnique 70 (7), 621–629. doi: 10.1680/jgeot.18.T.017
Keywords: vacuum preloading, dredged slurry, particle image velocimetry, deformation, clogging
Citation: Cai J, He Z, Xu B and Yu M (2023) The effect of PVD layout on the consolidation characteristics of dredged slurry under vacuum preloading. Front. Mar. Sci. 10:1213820. doi: 10.3389/fmars.2023.1213820
Received: 28 April 2023; Accepted: 03 July 2023;
Published: 20 July 2023.
Edited by:
Zhen Guo, Zhejiang University, ChinaReviewed by:
Guoxiong Mei, Guangxi University, ChinaAlfrendo Satyanaga, Nazarbayev University, Kazakhstan
Copyright © 2023 Cai, He, Xu and Yu. This is an open-access article distributed under the terms of the Creative Commons Attribution License (CC BY). The use, distribution or reproduction in other forums is permitted, provided the original author(s) and the copyright owner(s) are credited and that the original publication in this journal is cited, in accordance with accepted academic practice. No use, distribution or reproduction is permitted which does not comply with these terms.
*Correspondence: Zili He, aGV6aWxpNzdAemp1dC5lZHUuY24=