 Ying Liu
 Cheng Chen*
- School of Marine Science and Technology, Northwestern Polytechnical University, Xi’an, Shaanxi, China
Leveraging the benefits of low transmission loss and high signal-to-noise ratio, the reliable acoustic path (RAP) has been extensively employed in various underwater applications. In this study, we investigate RAP properties on a global scale. Acoustic simulations were conducted using global grids with a 0.25° × 0.25° spatial resolution, revealing that RAP range is positively correlated with ocean depth. Contrary to the prevailing belief that RAP properties are relatively unaffected by sound speed variations, our findings indicate that sound speed profiles (SSPs) play a crucial role in determining RAP properties by altering the RAP from 15 km to 50 km at a constant ocean depth of 4000 m. Additionally, the receiver angle can vary by nearly 5 km at the same source location due to SSP variations. Consequently, utilizing highly accurate SSPs can enhance the performance of underwater localization or communication systems that rely on RAP.
Introduction
Ocean acoustic propagation has long been recognized as sensitive to various ocean environmental parameters (Heitsenrether and Mohsen, 2004; Dosso et al., 2007a; Dosso et al., 2007b; Lermusiaux et al., 2010; Pecknold and Osler, 2012; Ngodock et al., 2022; Zhang et al., 2023a; Zhang et al., 2023b), such as bathymetry, geo-acoustic parameters, sound speed fields, and sea surface roughness. This sensitivity renders underwater acoustic activities, including localization and communication, highly dependent on the ocean environment. In deep ocean acoustic propagation studies, sound energy is typically categorized into distinct propagation patterns, including surface duct propagation, convergence zone propagation, bottom bounce propagation, and reliable acoustic path propagation. These propagation patterns exhibit varying levels of sensitivity to changes in the ocean environment. For instance, surface duct energy propagation is sensitive to the thickness of the surface duct (Chen et al., 2016; Chen et al., 2019; Duan et al., 2016), convergence zone propagation is sensitive to the thermocline gradient (Worcester et al., 2013; Chen et al., 2017; Khan et al., 2021), and bottom bounce propagation is sensitive to geo-acoustic parameters (Choi and Peter, 2004; Heaney et al., 2013; Yang et al., 2017).
The Reliable Acoustic Path (RAP), which represents the direct path between a source and receiver, is generally considered to be less sensitive to ocean environment fluctuations. Moreover, RAP boasts low transmission loss (TL) compared to boundary-reflected paths (Duan et al., 2012) and lower ambient noise levels, with noise below the critical depth being nearly 20 dB less than above it (Gaul et al., 2007). Due to these advantages, such as low TL and high signal-to-noise ratio (SNR), RAP has been widely employed in underwater acoustic localization and communication. Duan et al. utilized RAP multipath time de-lays recorded by a single hydrophone for localizing a moving source (Duan et al., 2014), while the interference structure of RAP was leveraged to estimate source depth with robust performance (Duan et al., 2019). Recently, Qu et al. conducted a comprehensive spatial gain analysis for vertical line arrays in RAP regions (Qiu et al., 2018), and Tompson incorporated RAP as a crucial sound propagation factor in deep ocean acoustic networks, achieving impressive performance in high SNR scenarios (Thompson, 2009).
Besides localization and communication, RAP sound energy has also been applied in geo-acoustic inversion and ocean tomography. Geo-acoustic parameters in the Philippine Sea were obtained using RAP sound energy (Xu et al., 2019), and Varamo et al. examined the feasibility of RAP tomography by employing a mobile ship with an acoustic source transmitting to a fixed bottom hydrophone at the ALOHA Cabled Observatory (Varamo and Howe, 2016).
Despite the growing interest in RAP over the past half-century, the effects of sound speed profiles (SSPs) on RAP properties remain underexplored. Xiao et al. demonstrated that RAP TL is relatively insensitive to seasonal SSP variations (Xiao et al., 2016); however, in some cases, seasonal SSP variations may be minimal compared to global spatial variations.
The properties of the Reliable Acoustic Path (RAP) are highly significant, and prior to our study, there had been no global research conducted on this topic. The prevailing impression was that RAP was insensitive to sound speed profiles; however, our findings have proven otherwise. Through extensive analysis and research, we have demonstrated the sensitivity of RAP to sound speed profiles.
In our study, we conducted a global investigation of Reliable Acoustic Path (RAP) properties and their variations, identifying ocean depth and sound speed profile (SSP) structure as the primary influencing factors. The findings of this paper offer valuable insights for leveraging RAP in underwater acoustic localization and communication. The impact of SSP structure on RAP is found to be significant, with RAP range varying up to 35 kilometers for a depth of 4000 meters. Dynamically complex regions, like the Kuroshio Extension, exhibit substantial variations in SSP even at the same location, resulting in notable changes in RAP characteristics.
Deep-sea positioning methods heavily rely on underwater acoustic propagation characteristics and rely on angle information from measurements for precise underwater localization. Inaccuracies in the sound speed profile can lead to significant reductions in positioning accuracy. For effective underwater acoustic communication, acquiring sufficient environmental information is crucial to obtain more precise underwater acoustic channel characteristics.
In conclusion, this comprehensive study enhances our understanding of RAP properties across different regions worldwide, providing essential guidance for utilizing RAP in underwater applications such as localization and communication.
Properties of reliable acoustic path
Figure 1 presents a typical case of 2D transmission loss of the reliable acoustic propagation. The SSP was the Munk profile as shown in Figure 1A. The source frequency was 200 Hz, the ocean depth was 5000 m, and the source depth was 4800 m. Figure 1B shows that when the source was deployed near the ocean bottom, the coverage of the RAP was bowl shaped. The radiance of the RAP could reach nearly 40 km near the surface, suggesting that the receiver deployed in this case could detect targets within this range with a high SNR ratio.
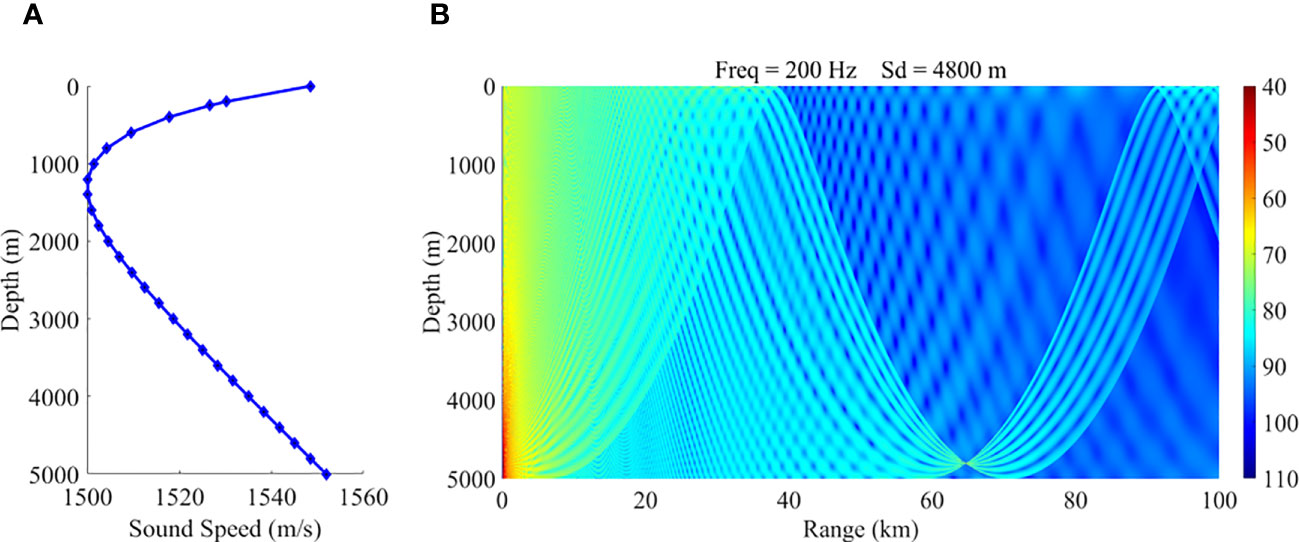
Figure 1 2D transmission loss of the RAP. (A) Sound speed profile (B) 2D transmission loss.
In order to validate the model and simulation method employed in this study, we utilized acoustic experiment data collected from a specific region in the Western Pacific Ocean in 2021 and compared it to the simulated results. For the comparison with the experimental data, we used a ray model and the acoustic reciprocity method, setting the source depth at 5470m and the receiving depth at 300m. In the Figure 2, Figure 2A displays the two-dimensional propagation loss acquired through simulation using real topography, sediment characteristics, and sound speed profiles, while Figure 2B presents a comparison between the propagation loss at 200Hz and the experimental data at a receiving depth of 300m. As evident in the figure, both the simulated results and the experimental data exhibit a rapid decline trend at the edge of the reliable acoustic paths, with similar magnitudes, implying that the model and modeling methods used in this study are relatively trustworthy. Moreover, the ray model has mature applications in acoustic field simulation. The results of the model are reliable in deep-sea areas, and are effective for the analysis of reliable acoustic paths in this study.
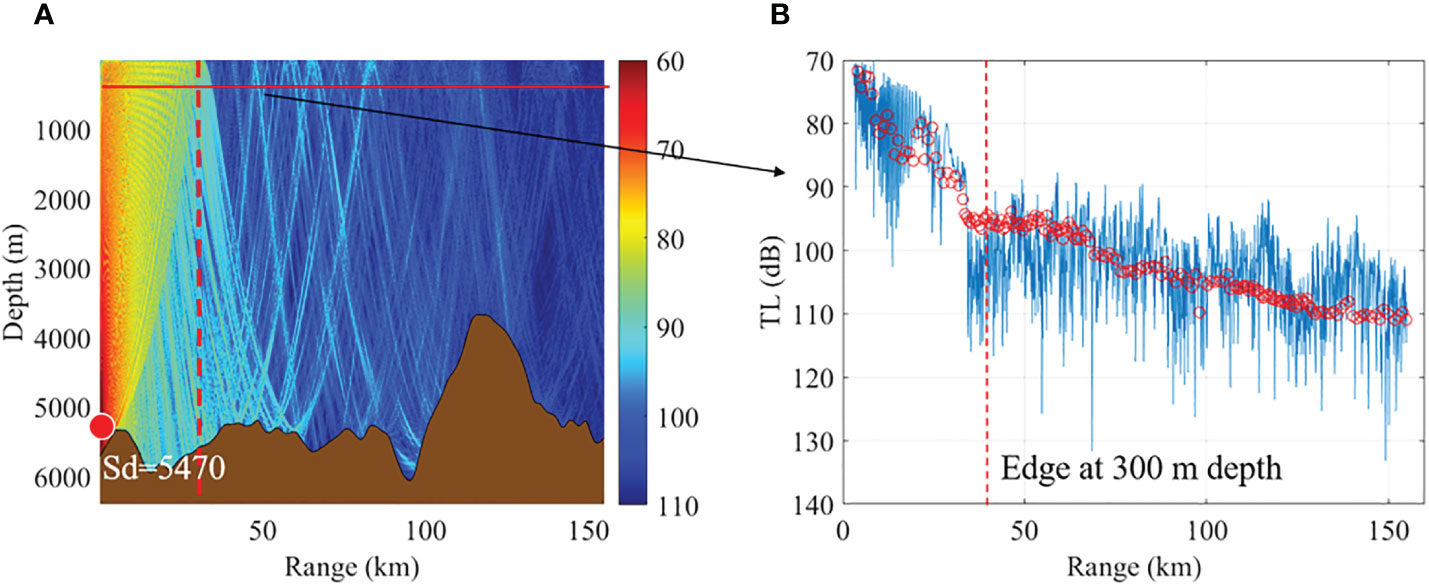
Figure 2 The measured data compared to the simulated result. (A) Two-dimensional Propagation loss (B) Propagation loss comparison.
Here, we focused on two RAP properties, namely, the RAP radiance near the sea surface and the receiver direction that varies with the source range. In the previous studies of Duan et al (Heaney et al., 2013), they showed that the receiver direction is sensitive to the source locations. Figure 3 presents the receiver directions and the source locations. The source/receiver set is the same as that in Figure 1. At a water depth of 5000 meters and a source depth of 4800 meters, the sound speed profile follows the Munk curve as shown in Figure 1A. The seafloor has a minor impact on the arrival structure and is set with a sound speed of 1600 m/s, density of 1.8 g/cm³, and an attenuation coefficient of 0.8 dB/wavelength. In Figure 3, the receiver directions of the direct path (also named RAP), the bottom reflected path with no surface reflection, the surface reflected path with no bottom reflection and the surface and bottom reflected path are denoted as B0T0, B1T0, B0T1 and B1T1, respectively. We notice that the receiver directions of the RAP arrival and the other paths are sensitive to the source ranges. Thus, determining the source range with the RAP arrivals has practical significance. However, when we use the physics-based RAP arrival to estimate the source location, we should be aware that the RAP properties could be affected by the ocean acoustic environment. For the RAP case, the SSP structure and the ocean depth should be considered. Detailed analyses were carried out on a global scale to study the variation pattern.
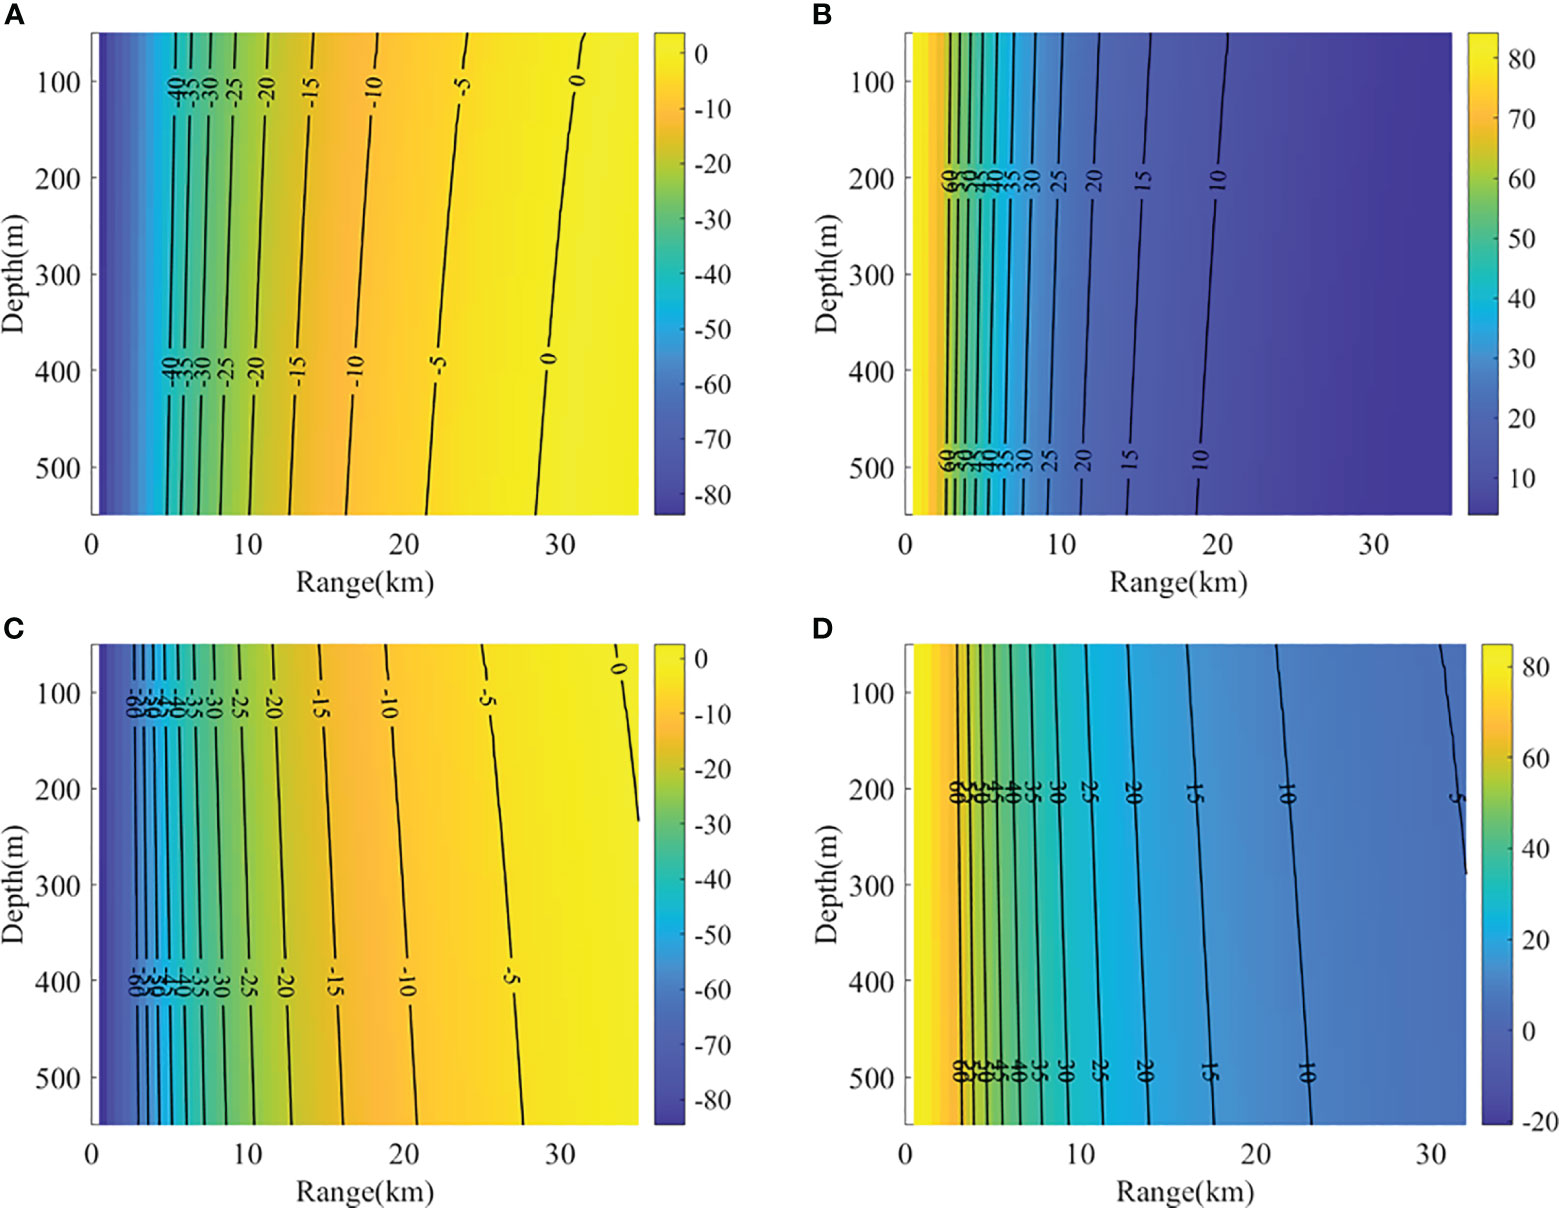
Figure 3 Receiver directions and source locations for different arrivals: (A) B0T0 (B) B1T0 (C) B0T1 (D) B1T1.
Characterization of the reliable acoustic path worldwide
The Etopo1 database was used as the bathymetry data (Hirt and Rexer, 2015). The WOA18 annual database (Locarnini et al., 2018; Zweng et al., 2018) was used in this paper to provide the temperature and salinity profiles for the computation of the SSPs. The empirical formula (Lovett, 1978) is shown in Equation (1), where C (m/s) refers to the sound speed, T (°C) refers to the temperature, and S (‰) refers to the salinity. P (kg/cm²) is the static pressure of the immediate ocean water column.
Here,
To study the effects of the ocean depth and the SSPs on the RAP properties, we conducted acoustic model simulation on each grid of the WOA18 database. The SSPs were obtained from the WOA18 data of the same grids, and the ocean depths were obtained by interpolating the ETOPO1 bathymetry over the grids. On each grid, we set up a reasonable range-independent case model because the RAP does not interact with the sea bottom. Thus, the combined effects of the ocean depth and SSP variations on the RAP properties could be obtained on the global scale.
Figure 4A presents the bathymetry from the ETOPO1 database. In Figure 4B, the maximum range of the RAP at the surface has a 0.25° × 0.25° spatial resolution. On each grid point, we set up an acoustic model to calculate the maximum range of the RAP near the surface. The source 200 m above the ocean bottom, and the source frequency was 200 Hz. The SSP was obtained from the WOA18 annual database. The grids with an ocean depth smaller than 2500 m were excluded. The reason for choosing a grid of less than 2500m lies in the focus of our study, which is primarily concerned with deep-sea areas. Given that the sound speed profile inflection points in most sea areas are around 1000m, we wanted to take into account more common situations, enabling us to observe and analyze a more comprehensive structure of the sound speed profile. As a compromise, we chose a depth of 2500m as a boundary point.
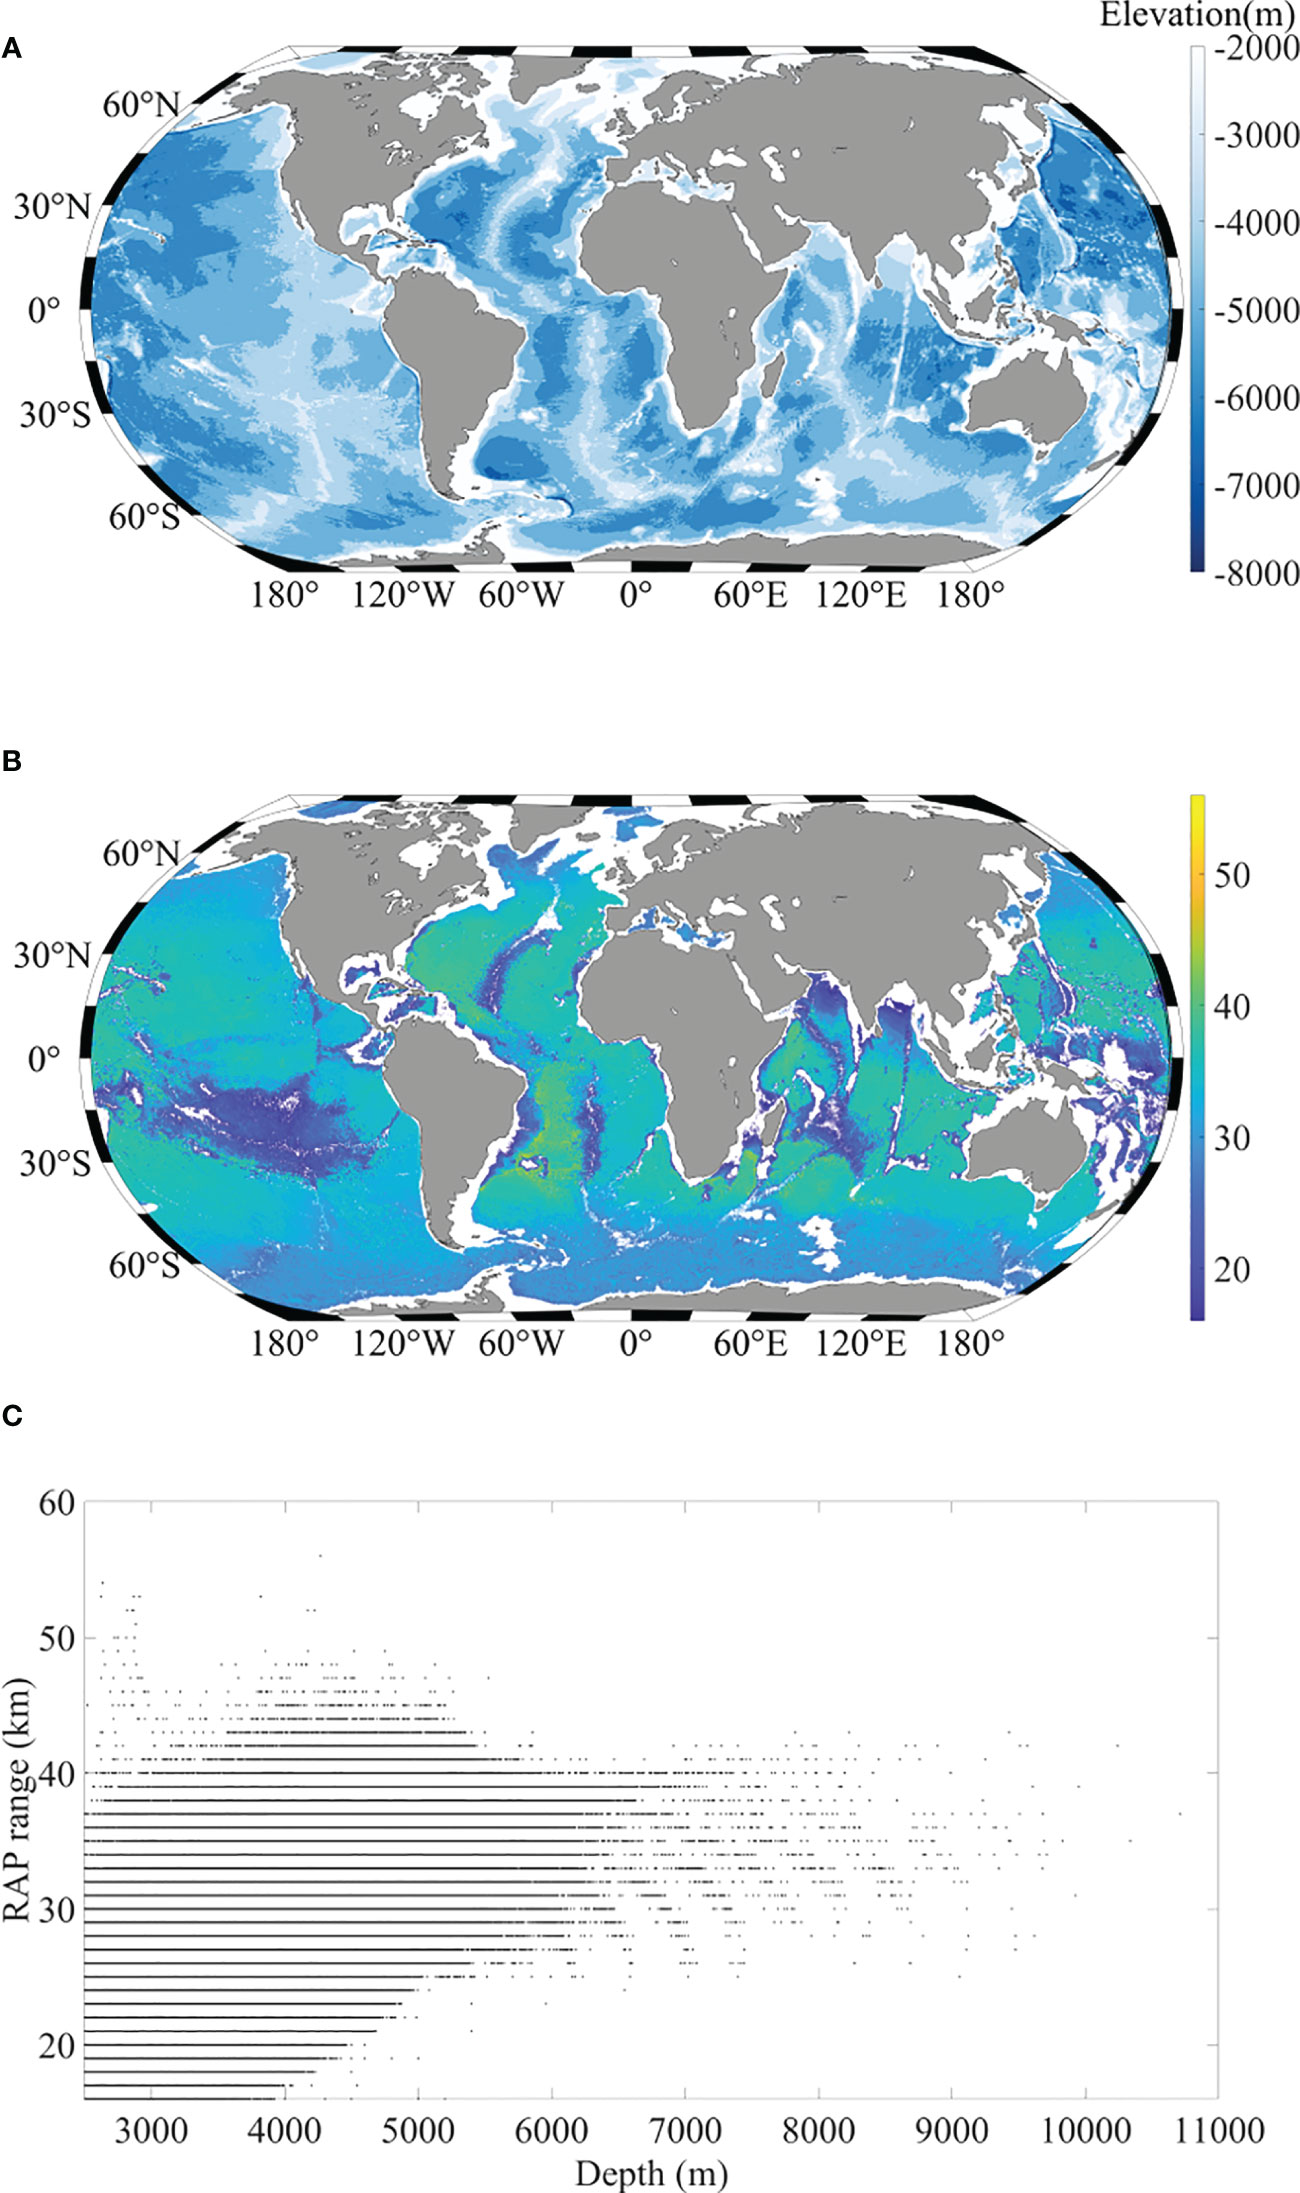
Figure 4 (A) Bathymetry of the global ocean, (B) the maximum range of the RAP in the global ocean scale, and (C) the relation between the ocean depth and the maximum range of the RAP.
Figure 4B indicates that the maximum range of the RAP varies from 20 km to 60 km. The comparison of Figures 4A, B shows that the maximum range of the RAP is weakly related to the ocean depth. Figure 4C presents the relation between the ocean depth and the maximum range of the RAP with a scatter plot. The maximum range of the RAP increases with the ocean depth. For example, at the ocean depth of 4000 m, the maximum RAP range is 15–50 km. Given that the two factors affecting the RAP range are the ocean depth and the SSP structure, the effect of the SSP structure on the RAP range should be examined.
Figure 5A presents the latitudinal Sound Speed Profiles (SSPs) at a longitude of 160.125°E, revealing significant variations in the SSP structure. In Figure 5B, the bathymetry along the same line is displayed, excluding depths smaller than 2500 meters. Figure 5C shows the relationship between the maximum range of the Reliable Acoustic Path (RAP) and ocean depth, indicating a linear trend between the range and the ocean depth.
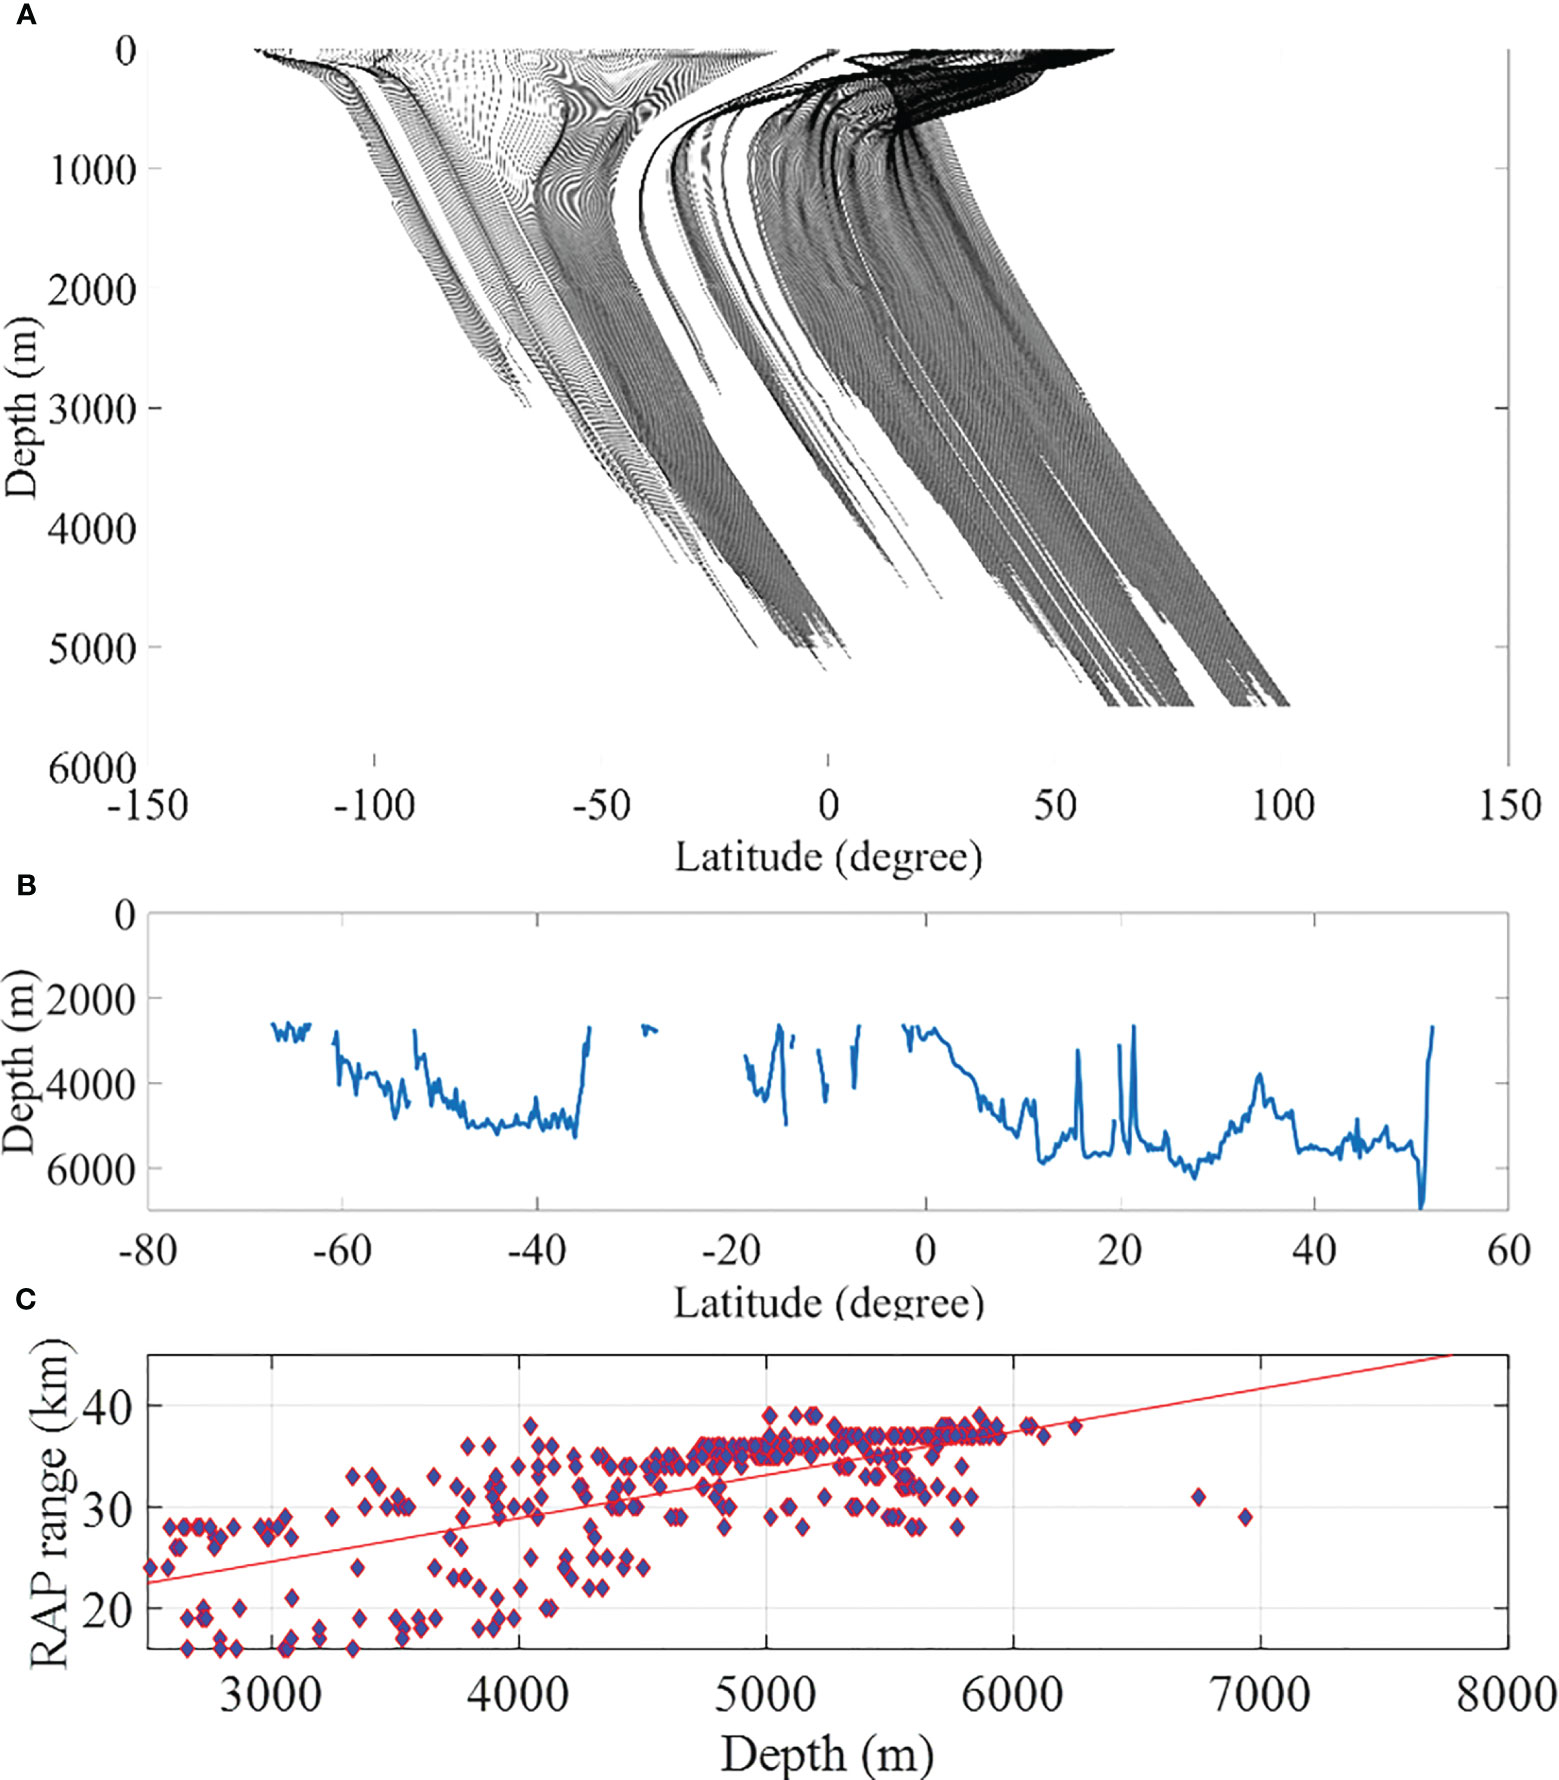
Figure 5 (A) SSPs, (B) the bathymetry and (C) the relation between maximum range of the RAP and the ocean depth along the latitudinal direction at the longitude 160.125°E.
The structurally consistent sound speed profile was utilized to examine the impact of ocean bathymetry on the reliable acoustic path range under the same sound speed profile conditions. Figure 6 illustrates the variation in the RAP range. The left subplot depicts the SSP used, while the right subplot exhibits the RAP variation as we vary the water depth from 2600 to 5500 meters.
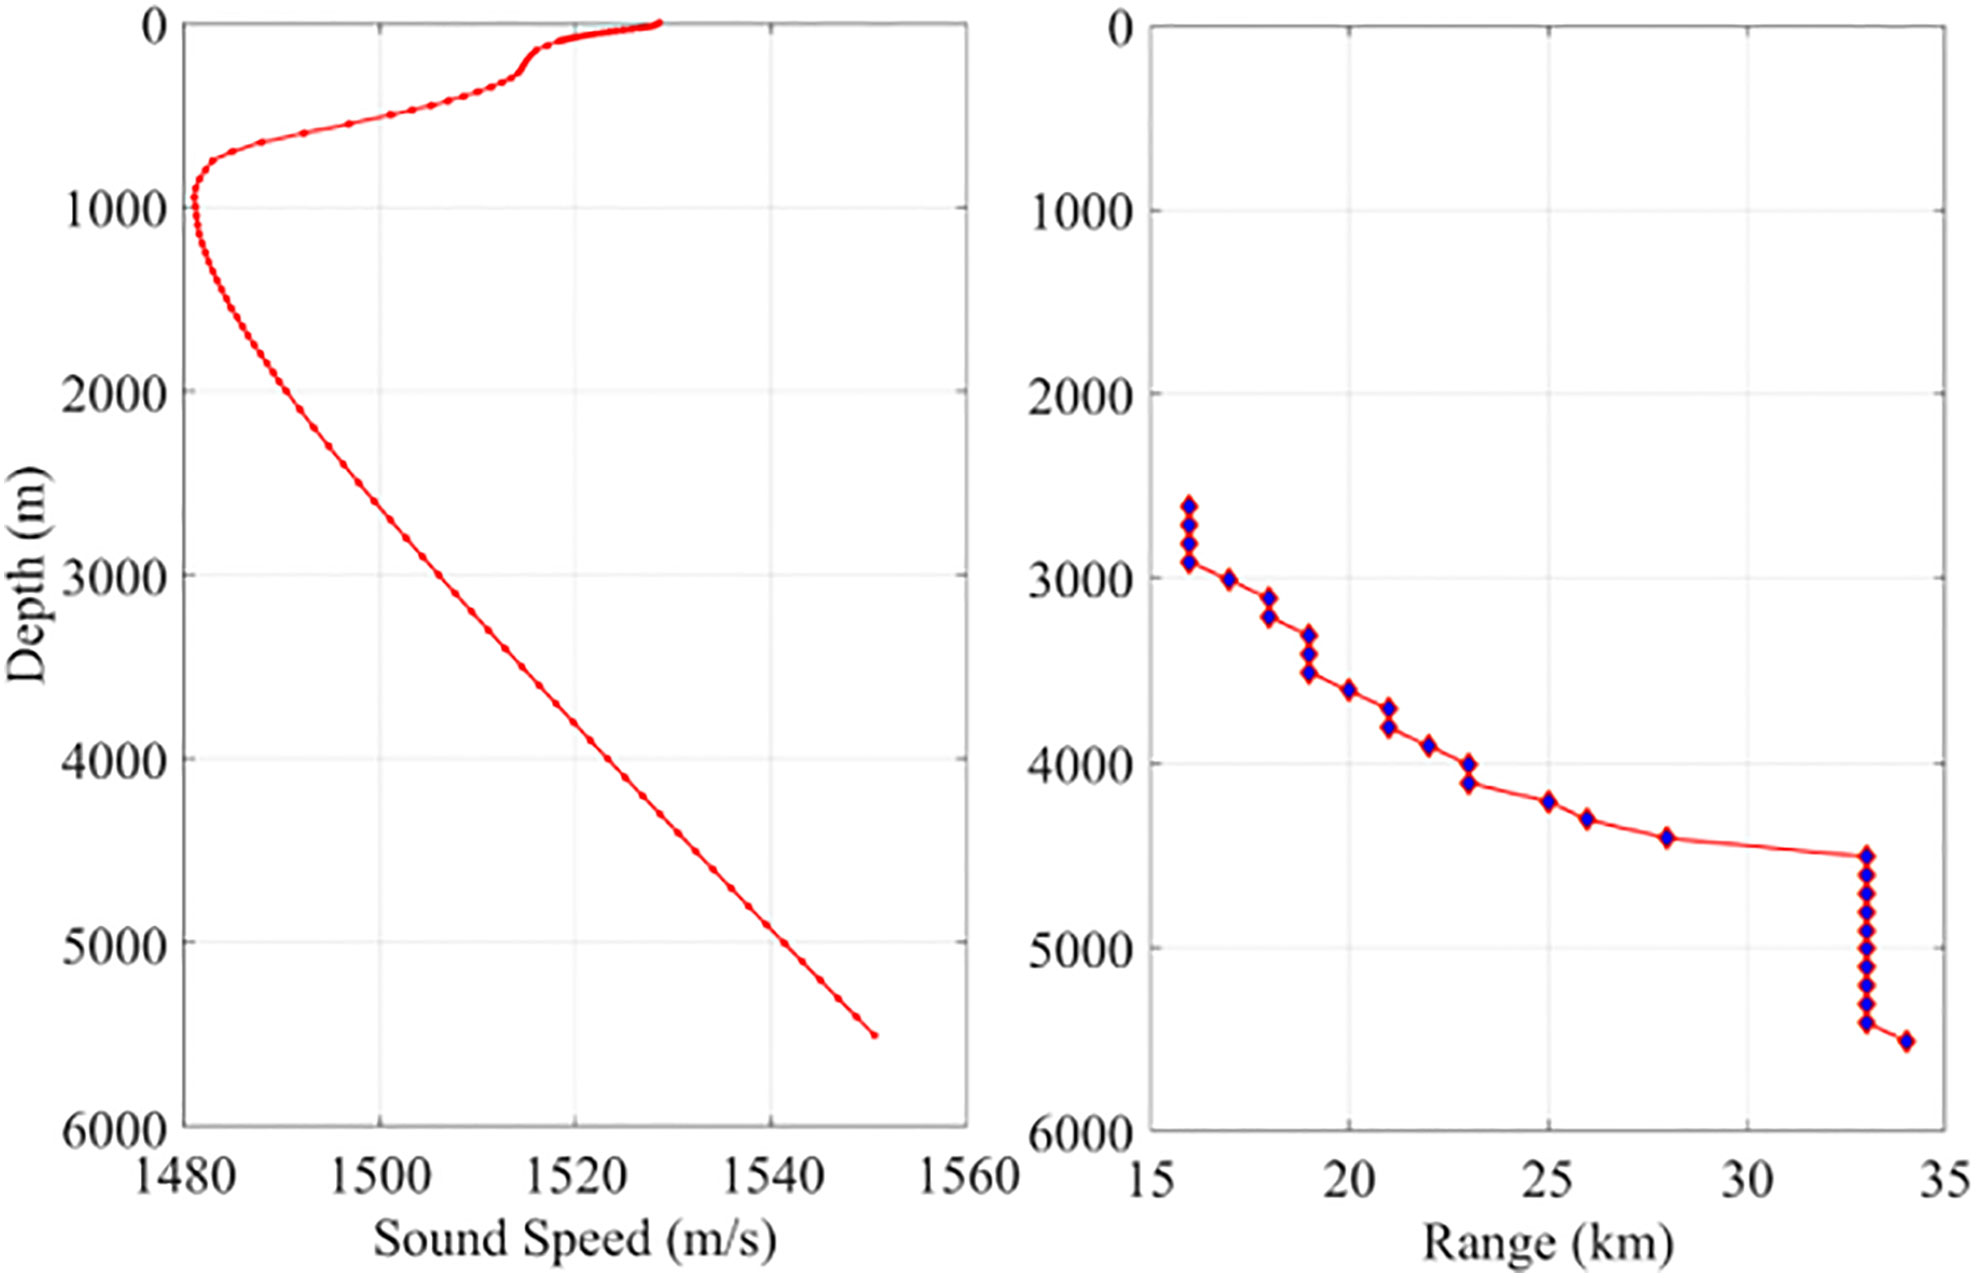
Figure 6 The range variation of the Reliable Acoustic Path (RAP) along with the bathymetry variation. The left subplot represents the Sound Speed Profile (SSP) used, while the right subplot shows the RAP variation as we vary the water depth from 2600 to 5500 meters.
From analyzing Figures 5, 6, it is evident that there is a linear trend between the RAP range and ocean depth. However, the range can vary significantly even at the same ocean depth. This variation can be attributed to the considerable differences in the SSP structure for the same ocean depth, resulting in variations in the RAP range.
To determine the effects of the SSP structure on the RAP properties on the global scale, we clustered the global SSPs obtained from the WOA18 data into 12 groups. There are numerous approaches for classifying transonic airfoil shapes, each resulting in different categorizations. The 12 categories used in this study were chosen purely to facilitate analysis, and the results could be presented even more concisely in a 4 x 3 matrix. The profiles with a maximum depth exceeding 4500 were used, and a total of 242934 profiles were available for use. The temperature and salinity profiles were used to obtain the SSPs on each grid. Figure 7A shows the 12 types of SSPs, and Figure 7B presents their distributions around the world.
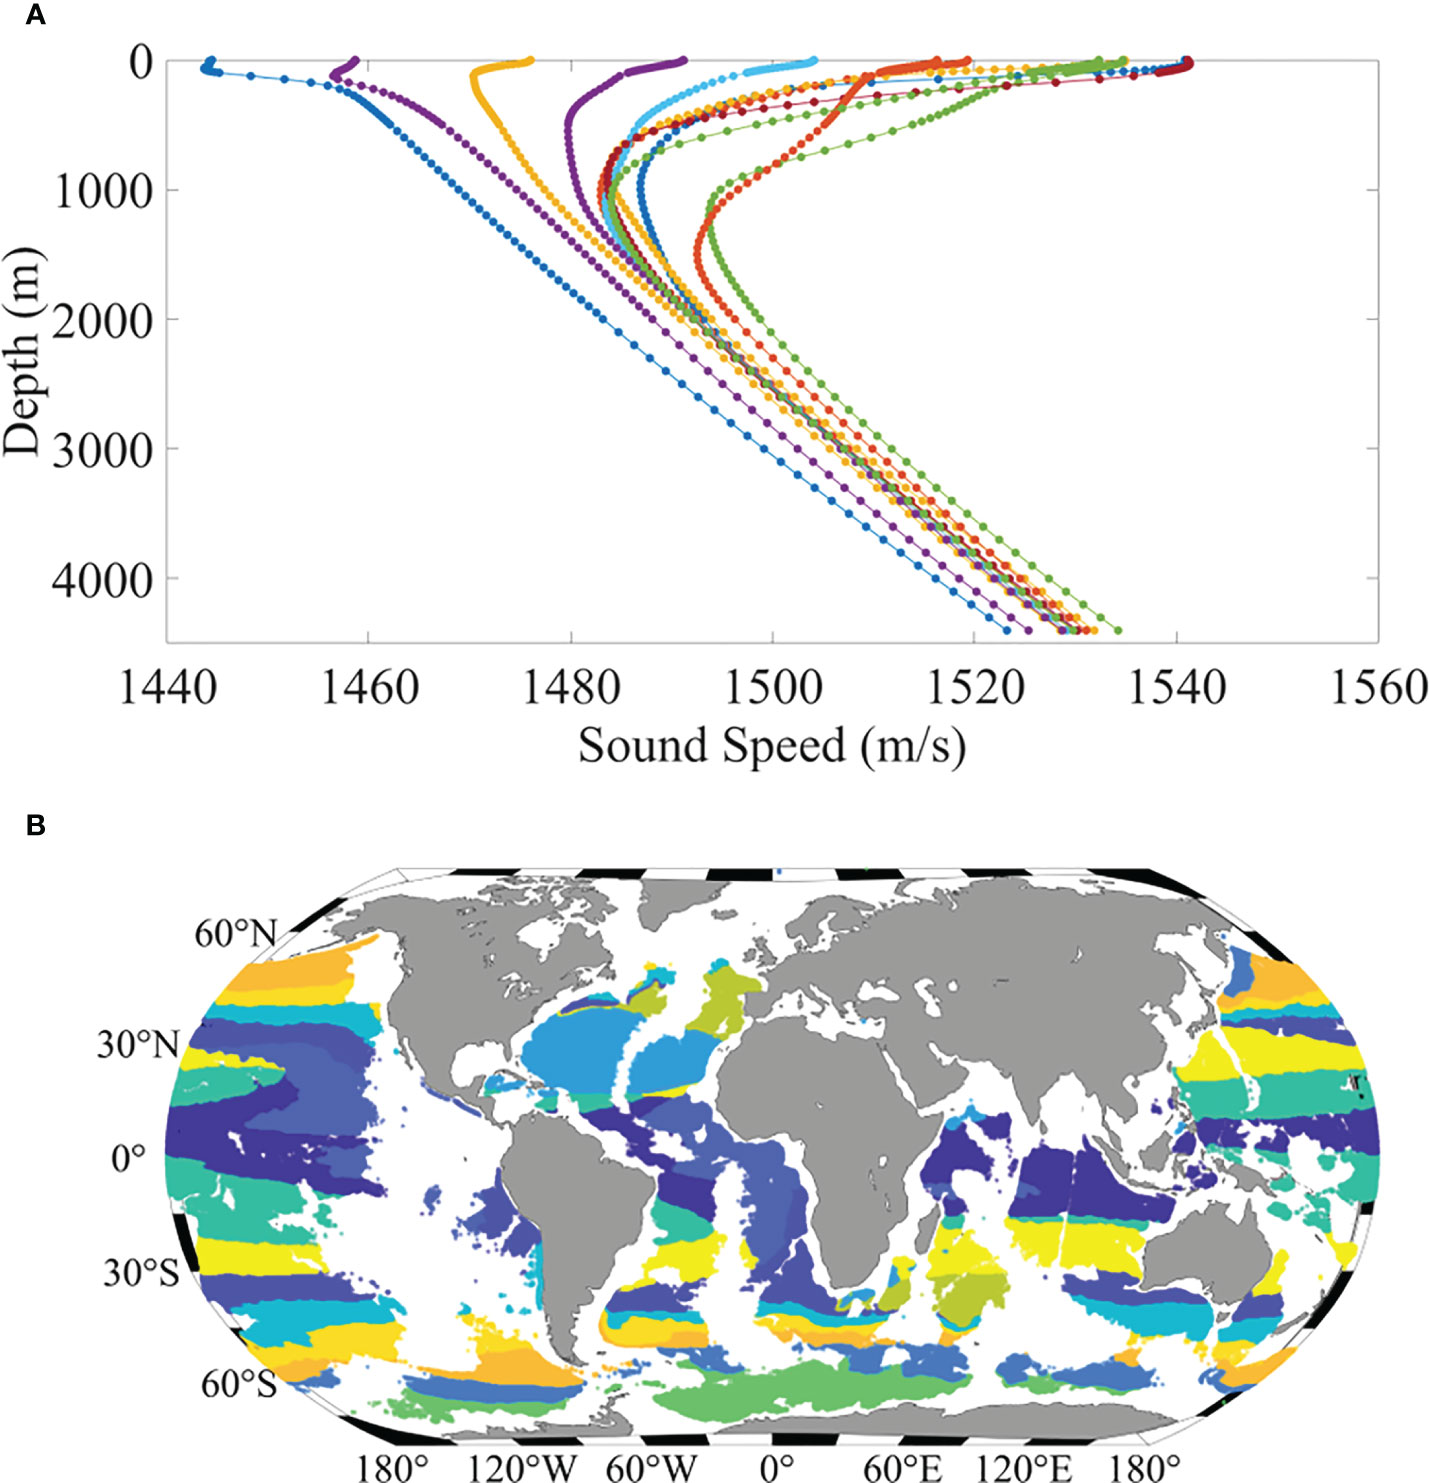
Figure 7 (A) 12 types of SSPs around the global ocean, and (B) the distribution of the 12 groups of SSPs (each color referring to one group of SSPs).
The 12 types of SSPs were then used to study the effects of the SSP structure on the RAP properties. Figure 8 presents the TL and the rays corresponding to the 12 types of SSPs. In Figure 8A, the 2D TLs for the 12 cases with a maximum depth of 4500 m are presented. The source depth was 4300 m, and the source frequency was 200 Hz. Figure 8B presents the 2D TLs for the upper 500 m for the 12 cases. The major difference could be observed near the edge of the RAP, and the SSPs could result in a significant variation pattern of the TL on the upper 500-m deep layers. In Figure 8C, the ray’s geometry is illustrated with green lines, indicating the case with surface and non-bottom reflections, and the red lines represent the case with no surface or bottom reflection. Figure 8C clearly indicates that the variation of the SSP structure could result in a significant change in RAP properties.
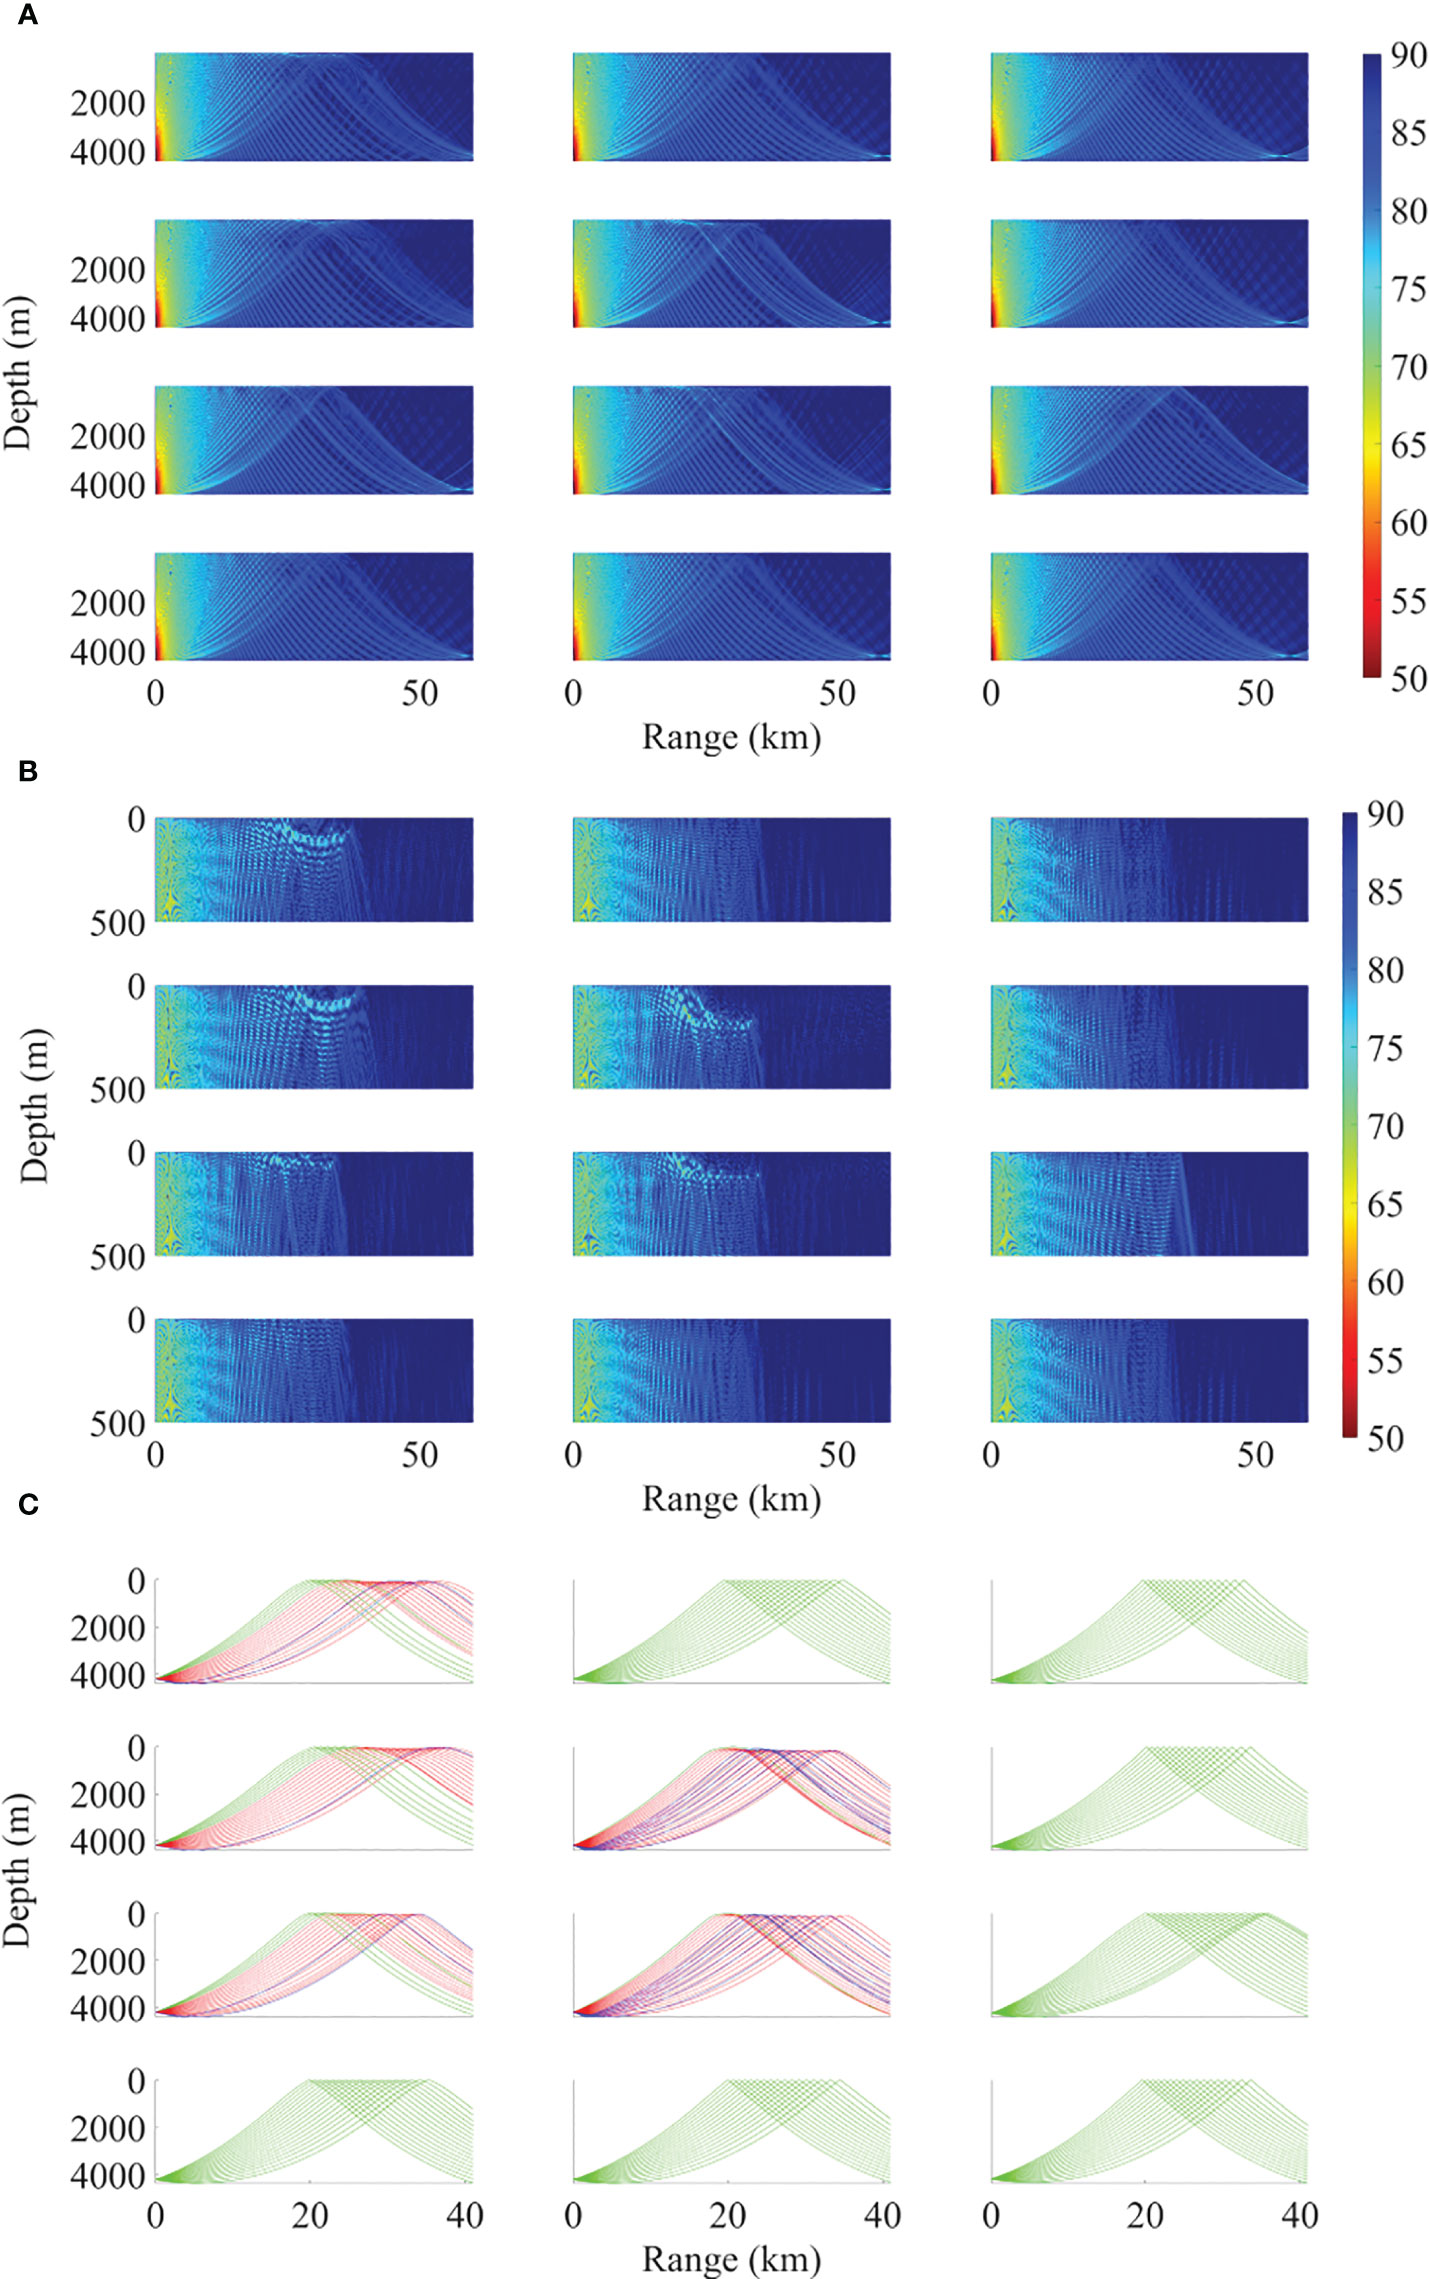
Figure 8 TLs and rays corresponding to the 12 types of the SSPs. (A) 2D TL with the maximum depth down to 4500 m, (B) 2D TL with the maximum depth range down to 500 m, (C) the ray figure (the grey lines refer to the eigenrays with one time of surface reflection and non-bottom reflection, the red lines refer the eigenrays with no bottom or surface reflection).
Table 1 lists the maximum range of the RAP for the 12 types of SSPs with an ocean depth 4500 m and a source depth of 200 m above the ocean bottom. The maximum range varies from 25 km to 42 km, which could be significant in many cases when the RAP is used for underwater localization or communication.

Table 1 Maximum range of the RAP for the 12 types of SSPs.
Then, we investigated the possible effect of SSP variation on underwater localization. Figure 9 shows the effects of SSP variation on the receiver angle. Figure 9 reveals that the effects of the SSP variation on the receiver angles increase with the source range. For example, at the receiver angle of -10°, the source range could vary by approximately 1 km when the source range is lower than 15 km. At the receiver angle of -5°, the source range could vary by nearly 5 km when the source range reaches or exceeds 20 km. The variation of the source range at the same receiver angle is large, even in the case of 1-km variation because the 1 km variation could be a significant localization error when we attempt to detect underwater sources with the RAP rays.
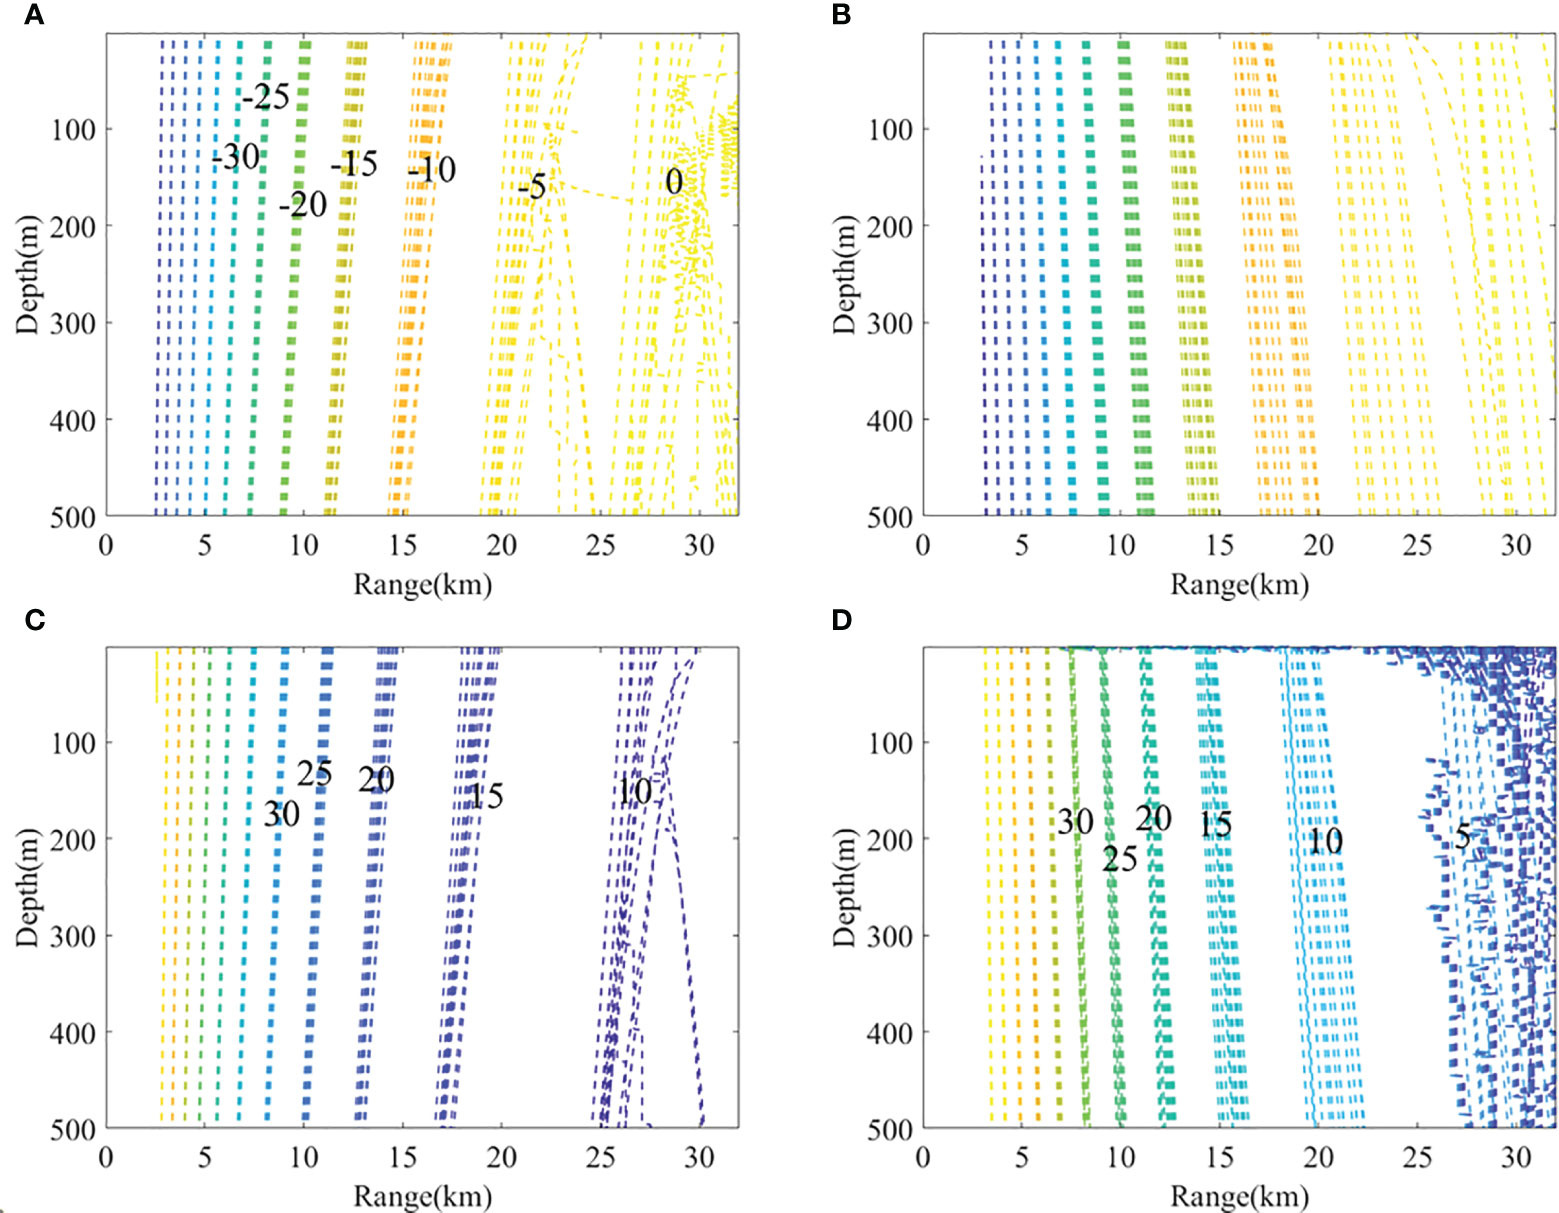
Figure 9 Effects of the SSP variation on the receiver angle (A) B0T0, (B) B0T1, (C) B1T0, (D) B1T1, (the SSPs used here were the 12 types from the cluster result).
Specifically, we selected the Kuroshio Extension region to study the effect of the Kuroshio Extension front on the RAP properties. In Figure 10, the left subplot is of the SSPs on the two sides of the Kuroshio Extension front. The right subplot is of the effects of the two SSPs on the receiver angles of the RAP. Figure 10 suggests that the SSPs could induce great variation in the receiver angle. At the 25-km range, the variation of the source range could vary by approximately 1 km in the upper 500-m deep layers at the same receiver angle. Even in some specific regions, the dynamics of the ocean front could result in a significant change in RAP properties. Thus, if we want to make full use of the RAP for underwater activities, then SSPs with high accuracy should be used to avoid a large error.
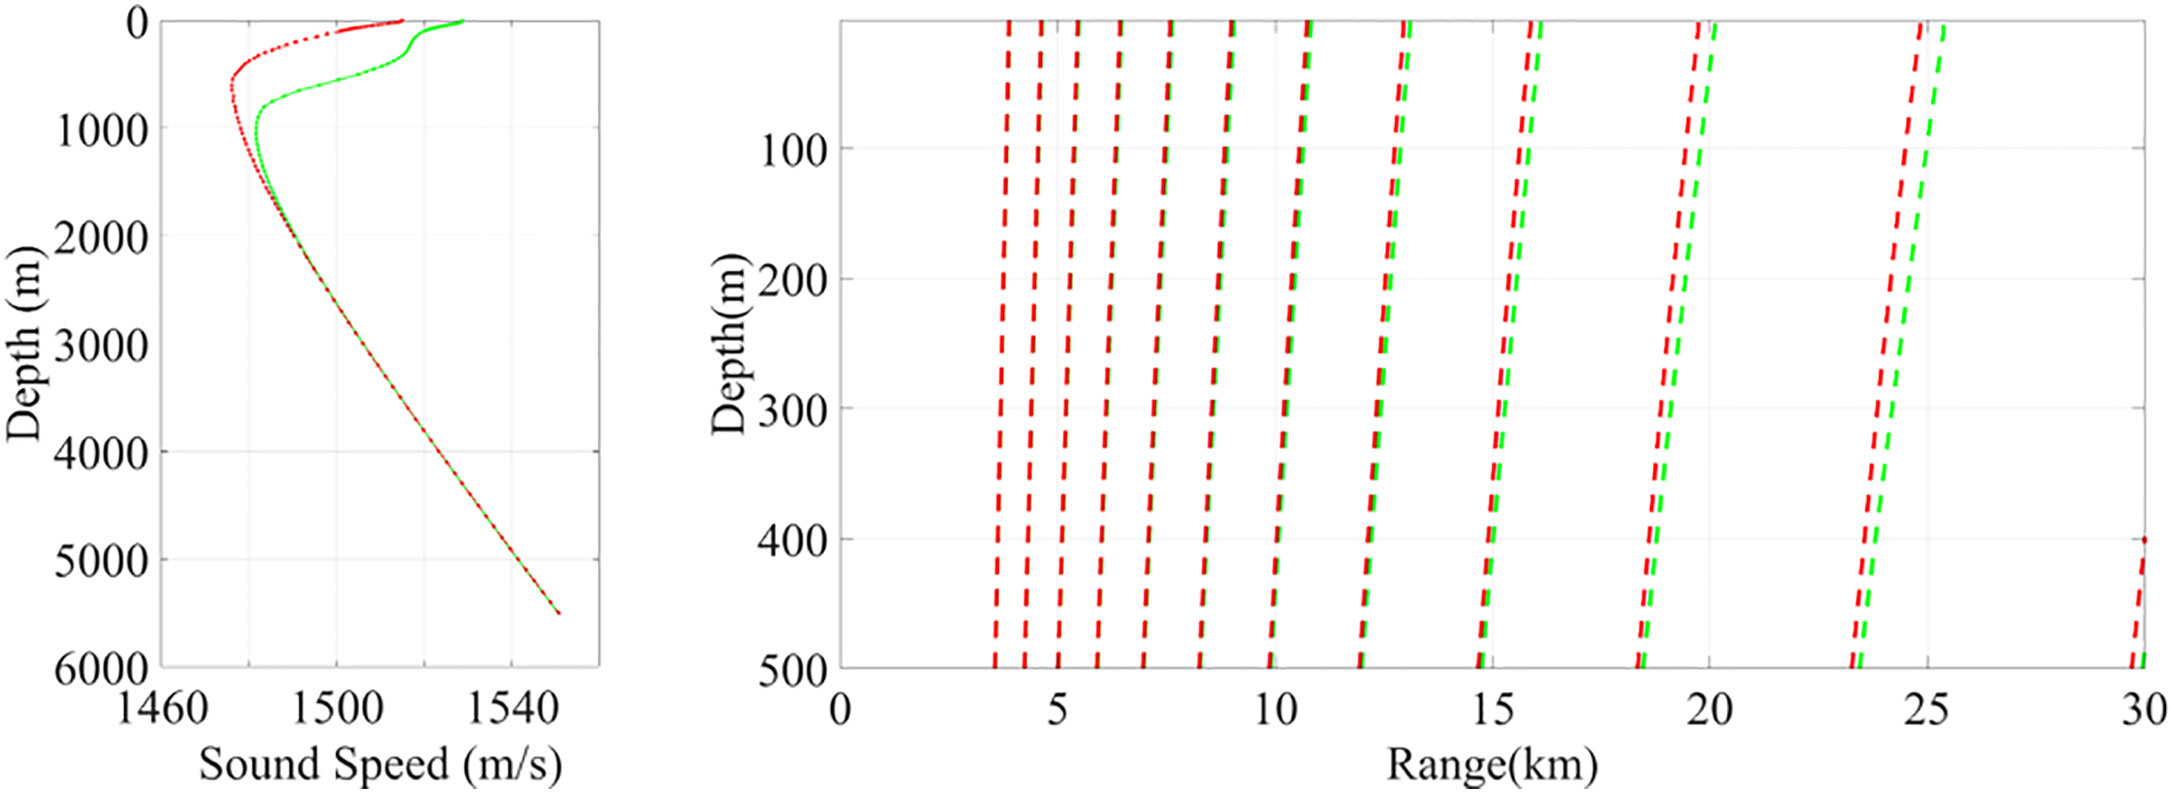
Figure 10 SSPs in the Kuroshio Extension region (left) and the effect of SSPs on the receiver angles of the RAP (right).
Conclusions
In this study, we examined the RAP properties on a global scale using SSPs calculated from temperature and salinity profiles within the WOA18 annual database, and ocean depth data from the ETOPO1 dataset. Acoustic modeling was conducted on each grid of the WOA18 data at a 0.25° × 0.25° spatial resolution, and the maximum RAP range across the global ocean was calculated. Results indicate that the RAP range increases with ocean depth, albeit with a weak correlation. At a consistent ocean depth of 4000 meters, the RAP range can vary between 15 and 50 kilometers, with the SSP structure being the main variable.
We also investigated the effect of SSPs on RAP properties by clustering global SSPs into 12 groups, yielding 12 distinct SSP types. Acoustic simulations revealed that the RAP range could vary between 25 and 42 kilometers when using these 12 SSPs. Additionally, the impact of SSP variation on receiver angles was studied. Results demonstrated that receiver angle variation increases with source range, reaching up to 5 kilometers at a 20-kilometer distance. This variation can introduce significant localization errors when using the RAP for underwater source localization with inappropriate SSPs. Therefore, careful consideration of SSP structure is essential when leveraging the RAP for underwater activities.
Data availability statement
The original contributions presented in the study are included in the article/supplementary materials, further inquiries can be directed to the corresponding author.
Author contributions
Conceptualization, YL, CC; methodology, YL software, CC; validation, YL; formal analysis, YL.; investigation, YL, CC; resources, CC; data curation, CC, XF; writing—original draft preparation, YL; writing—review and editing, CC; visualization, CC; supervision, CC; project administration, CC; funding acquisition, CC. All authors contributed to manuscript revision, read, and approved the submitted version.
Funding
This research was funded by the National Natural Science Foundation of China (Grant No. 52101389); the Natural Science Foundation of Shandong Province, China (Grant No. ZR201910220437); the Open Fund of State Key Laboratory of Acoustics (Grant No. SKLA202103); and Fundamental Research Funds for the Central Universities.
Conflict of interest
The authors declare that the research was conducted in the absence of any commercial or financial relationships that could be construed as a potential conflict of interest.
Publisher’s note
All claims expressed in this article are solely those of the authors and do not necessarily represent those of their affiliated organizations, or those of the publisher, the editors and the reviewers. Any product that may be evaluated in this article, or claim that may be made by its manufacturer, is not guaranteed or endorsed by the publisher.
References
Chen C., Yang K. D., Ma Y. L., Duan R. (2016). Comparison of surface duct energy leakage with bottom-bounce energy of close range propagation. Chin. Phys. Lett. 33 (10), 104302. doi: 10.1088/0256-307X/33/10/104302
Chen C., Yang K., Duan R., Ma Y. (2017). Acoustic propagation analysis with a sound speed feature model in the front area of Kuroshio Exten-sion. Appl. Ocean Res. 68, 1–10. doi: 10.1016/j.apor.2017.08.001
Chen C., Tao J., Zhiquan Z. (2019). Effect of eddy on acoustic propagation from the surface duct perspective. Ap-plied Acoustics 150, 190–197. doi: 10.1016/j.apacoust.2019.02.019
Choi J. W., Peter H. D. (2004). Mid-to-high-frequency bottom loss in the East China Sea. IEEE J. Oceanic Eng. 29 (4), 980–987. doi: 10.1109/JOE.2004.834178
Dosso S. E., et al. (2007a). Linear and nonlinear measures of ocean acoustic environmental sensitivity. J. Acoust. Soc. Am. 121 (1), 42–45. doi: 10.1121/1.2382719
Dosso S. E., Morley M. G., Giles P. M., Brooke G. H., McCammon D. F., Pecknold S., et al. (2007b). Spatial field shifts in ocean acoustic environmental sensitivity analysis. J. Acoust. Soc. Am. 122 (5), 2560–2570. doi: 10.1121/1.2783123
Duan R., Yang K., Ma Y., Chapman N. R. (2016). A simple expression for sound attenuation due to surface duct energy leakage in low-latitude oceans. J. Acoust. Soc. Am. 139 (5), EL118–EL123. doi: 10.1121/1.4947012
Duan R., Yang K., Li H., Yang Q., Wu F., Ma Y. (2019). A performance study of acoustic interference structure applications on source depth estimation in deep water. J. Acoust. Soc Am. 145, 903–916. doi: 10.1121/1.5091100
Duan R., Yang K. D., Ma Y. L., Hui L. (2014). Moving source localization with a single hydrophone using multipath time delays in the deep ocean. J. Acoust. Soc Am. 136, 159–165. doi: 10.1121/1.4890664
Duan R., Yang K. D., Ma Y. L., Lei B. (2012). A reliable acoustic path: Physical properties and a source localization method. Chin. Phys. B 21, 276–289. doi: 10.1088/1674-1056/21/12/124301
Gaul R. D., Knobles D. P., Shooter J. A., Wittenborn A. F. (2007). Ambient noise analysis of deep-ocean measurements in the Northeast Pacific. IEEE J. Ocean. Eng. 32, 497–512. doi: 10.1109/JOE.2007.891885
Heaney K. D., Campbell R. L., Murray J. J., Baggeroer A. B., Scheer E. K., Stephen R. A., et al. (2013). Deep water towed array measurements at close range. J. Acoust. Soc. Am. 134 (4), 3230–3241. doi: 10.1121/1.4818869
Heitsenrether R. M., Mohsen B. (2004). “Modeling acoustic signal fluctuations induced by sea surface roughness,” in HIGH FREQUENCY OCEAN ACOUSTICS: High frequency ocean acoustics conference, Vol. 728 La Jolla, California (USA): (American Institute of Physics).
Hirt C., Rexer M. (2015). Earth2014: 1 arc-min shape, topography, bedrock and ice-sheet models – Available as gridded data and degree-10,800 spherical harmonics. Int. J. Appl. Earth Obs. Geoinf. 39, 103–112. doi: 10.1016/j.jag.2015.03.001
Khan S., Song Y., Huang J., Piao S. (2021). Analysis of underwater acoustic propagation under the influence of mesoscale ocean vortices. J. Mar. Sci. Eng. 9 (8), 799. doi: 10.3390/jmse9080799
Lermusiaux P. F., Xu J., Chen C. F., Jan S., Chiu L. Y., Yang Y. J. (2010). Coupled ocean–acoustic prediction of transmission loss in a continental shelfbreak region: Predictive skill, uncertainty quantification, and dynamical sensitivities. IEEE J. Oceanic Eng. 35 (4), 895–916. doi: 10.1109/JOE.2010.2068611
Locarnini R. A., Mishonov A. V., Baranova O. K., Boyer T. P., Zweng M. M., Garcia H. E., et al. (2018). World ocean atlas 2018, volume 1: temperature. Ed. Mishonov A. (NOAA Atlas NESDIS 81), 52.
Lovett J. R. (1978). Merged seawater sound-speed equations. J. Acoust. Soc Am. 63, 1713–1718. doi: 10.1121/1.381909
Ngodock H. E., Carrier M. J., Fabre J., Zingarelli R., Smith S., Souopgui I. (2022). “Sensitivity analysis in ocean acoustic propagation,” in Data assimilation for atmospheric, oceanic and hydrologic applications, vol. IV. (Switzerland: Springer, Cham), 427–438.
Pecknold S., Osler J. C. (2012). Sensitivity of acoustic propagation to uncertainties in the marine environment as char-acterized by various rapid environmental assessment methods. Ocean Dynamics 62 (2), 265–281. doi: 10.1007/s10236-011-0497-1
Qiu C., Ma S., Chen Y., Meng Z., Wang J. (2018). Reliable Acoustic path and direct-arrival zone spatial gain analysis for a vertical line array. Sensors. 18 (10), 3462. doi: 10.3390/s18103462
Thompson S. R. (2009). Sound propagation considerations for a deep-ocean acoustic network. Monterey, California. Naval Postgraduate School.
Varamo V. J., Howe B. (2016). Reliable acoustic path tomography at Aloha Cable Observatory. J. Acoust. Soc Am. 140, 3184–3184. doi: 10.1121/1.4970013
Worcester P. F., Dzieciuch M. A., Mercer J. A., Andrew R. K., Dushaw B. D., Baggeroer A. B., et al. (2013). The North Pacific Acoustic Laboratory deep-water acoustic propagation experiments in the Philippine Sea. J. Acoust. Soc. Am. 134 (4), 3359–3375. doi: 10.1121/1.4818887
Xiao P., Yang Y., Yang L., Shi Y. (2016). “Seasonal effects of sound speed profile on mid-range acoustic propagations modes: reliable acoustic path and bottom bounce,” in Theory, methodology, tools and applications for modeling and simulation of complex systems (Singapore: Springer).
Xu L., Yang K., Yang Q. (2019). Experimental study of geoacoustic inversion with reliable acoustic path in the Philippine Sea. J. Theor. Comput. Acoust. 27 (04), 1850061. doi: 10.1142/S2591728518500615
Yang K., Xiao P., Duan R., Ma Y. (2017). Bayesian inversion for geoacoustic parameters from ocean bottom reflection loss. J. Compu-tational Acoustics 25 (03), 1750019. doi: 10.1142/S0218396X17500199
Zhang X., Yang P., Sun H. (2023a). An omega-k algorithm for multireceiver SAS. Electron. Lett. 59 (13), 1–3. doi: 10.1049/ell2.12859
Zhang X., Yang P., Zhou M. (2023b). Multireceiver SAS imagery with generalized PCA. IEEE Geosci. Remote Sens. Lett. 20, 1502205. doi: 10.1109/LGRS.2023.3286180
Keywords: ocean acoustic propagation, properties of reliable acoustic path, sound speed profile variation, bathymetry variation, transmission loss
Citation: Liu Y, Chen C and Feng X (2023) Investigating the reliable acoustic path properties in a global scale. Front. Mar. Sci. 10:1213002. doi: 10.3389/fmars.2023.1213002
Received: 27 April 2023; Accepted: 08 August 2023;
Published: 23 August 2023.
Edited by:
Haixin Sun, Xiamen University, ChinaCopyright © 2023 Liu, Chen and Feng. This is an open-access article distributed under the terms of the Creative Commons Attribution License (CC BY). The use, distribution or reproduction in other forums is permitted, provided the original author(s) and the copyright owner(s) are credited and that the original publication in this journal is cited, in accordance with accepted academic practice. No use, distribution or reproduction is permitted which does not comply with these terms.
*Correspondence: Cheng Chen, Y2hlbi5jaGVuZ0Bud3B1LmVkdS5jbg==