 Minglun Yang
 Lei Guan
 Liqin Qu2
- 1Key Laboratory of Ocean Observation and Information of Hainan Province, Sanya Oceanographic Institution, Ocean University of China, Sanya, China
- 2College of Marine Technology, Faculty of Information Science and Engineering, Ocean University of China, Qingdao, China
- 3Laboratory for Regional Oceanography and Numerical Modeling, Qingdao National Laboratory for Marine Science and Technology, Qingdao, China
Sea surface temperature (SST) is an important variable in the study of ocean boundary layers and heat exchange. The accurate simulation and measurement of skin effects are vital to air–sea model processing and satellite SST retrieval. Shipboard measurements from eleven cruises in the Northwest Pacific between August 2015 and October 2018 were used to estimate the cool skin effect and compare model results. The temperature difference ΔT between the sea surface skin temperature (SSTskin), as measured by an infrared radiometer, and the sea surface depth temperature (SSTdepth) at around 4 meters showed a mean difference and a standard deviation of the same 0.2 K, with a total of 5-min 39909 measurements. Both daytime and nighttime ΔT values were compared to physical model simulations and were found to have relatively larger mean values. A set of new coefficients for an exponential parameterization of the cool skin effect was derived in the research area, which performed well in comparison to previous empirical models. In nighttime observations from two summer cruises, the reverse process of heat flux transfer from the air to the sea in the form of a warm skin was distinguished. There were 667 positive ΔT values out of the 1917 nighttime observations, with magnitudes ranging from around 0 to 0.3 K. A high proportion of the cases of the warm skin phenomenon occurred when the air was very humid and much warmer than the sea surface.
1 Introduction
Variations in Sea surface temperature (SST) is an indicator for climate changes. SST is one of the most essential factors for studies on air–sea interaction. Donlon et al. (2007) defined different SSTs related to near-surface thermal structures. Sea surface skin temperature (SSTskin) is the temperature at depths of ~10-20 μm, which can be measured by infrared radiometers. Sea surface depth temperature (SSTdepth) refers to the temperature at depths from millimeters to a few meters, which can be measured by contact sensors attached to platforms, such as those on vessels, buoys, gliders, etc. (Donlon et al., 2007). SST gradients in the upper ocean caused by air–sea heat exchange are often recognized as “skin effects”, which mainly include the warm layer and cool skin effects (Saunders, 1967; Fairall et al., 1996). The warm layer effect results from solar absorption during the daytime and can reach magnitudes of several Kelvins (Fairall et al., 1996). Many research studies have modeled and simulated the warm layer effect (Fairall et al., 1996; Fairall et al., 2003; Gentemann et al., 2003; Kawai and Wada, 2007; Gentemann et al., 2009; Akella et al., 2017). In contrast to the warm layer effect, the cool skin effect occurs both in the day and at night and is subject to interface heat fluxes and shear-driven mixing (Fairall et al., 1996). The accurate simulation and measurement of skin effects are helpful for better understanding air–sea interaction, as well as for satellite SST retrieval and validation (Donlon et al., 2002).
Shipboard infrared radiometers have become the most common and effective way to obtain SSTskin measurements in recent years (Donlon et al., 1999; Minnett et al., 2001; Donlon et al., 2008; Jessup and Branch, 2008). After correcting for atmospheric radiance and the self-calibration of internal blackbodies, SSTskin can be derived with an accuracy of 0.1 K. In-situ SSTskin measurements with high accuracy which could be traceable to the International System of Units (SI) are required to validate satellite SST used in Climate Data Records (CDRs) (Minnett and Corlett, 2012; Minnett et al., 2019). Considering the skin effects, shipboard SSTskin measurements provide more accurate datasets to match and validate satellite infrared SSTskin products (Wimmer et al., 2012). Combined with SSTdepth measurements and other auxiliary meteorological observations, the cool skin effect can be simulated using models and compared to field measurements. Numerous research studies have modeled the cool skin effect (Saunders, 1967; Fairall et al., 1996; Donlon et al., 2002; Fairall et al., 2003; Gentemann and Minnett, 2008; Minnett et al., 2011; Alappattu et al., 2017; Zhang et al., 2020; Zhang et al., 2021; Luo et al., 2022; Jia et al., 2023). One of the most popular cool skin models, called F96, was developed by Fairall et al. (1996; Fairall et al. 2003) and was trained using field observations from the international Coupled Ocean–Atmosphere Response Experiment (COARE) program by Tropical Ocean Global Atmosphere (TOGA), which took place in the Western Pacific Warm Pool over 4 months from November 1992 to February 1993 (Webster and Lukas, 1992). The F96 model comprises cool skin and warm layer calculations on the physical basis of air–sea heat flux transfer. In addition, other parts of the model follow the empirical parameterization proposed by Donlon et al. (2002), the details of which are introduced in the next section.
The cool skin effect often results in a cooler temperature at the sea surface skin than the layer just beneath. However, a warm skin effect has also been proven to exist during net heat flux transfer from the air to the sea (Zhang et al., 2020). This opposite heat flux transfer has rarely been mentioned in previous works. Using shipboard SSTskin and SSTdepth measurements in the Northwest Pacific from August 2015 to October 2018, this study mainly evaluated the behavior of models compared to the observed cool skin effect and warm skin phenomenon. The aim of this study is to evaluate the performance of the cool skin models in the research area and provide reference to the related study on the air–sea interaction, satellite SST retrieval and validation, etc.
The paper is organized as follows. The cool skin models and data used in this study are introduced in Section 2. The details of the cruises and the sources of the datasets are also listed in this section. The statistics and our analysis of the results regarding the cool skin effect are presented in Section 3, as well as a further discussion around the cases of the warm skin phenomenon. Finally, the conclusions are discussed in Section 4.
2 Materials and methods
2.1 Cool skin models
The cool skin F96 model, also known as the COARE model, was proposed on the basis of the physics described by Saunders (1967). The net heat flux Qnet of the sea surface cool skin is given by:
where Ql and Qs represent the latent heat flux and sensible heat flux, respectively, and Qnlw is the net longwave radiance. The temperature difference ΔT, also referred to as the magnitude of the cool skin effect, can be described as:
where δ is the thickness of the cool skin and k is the thermal conductivity of the sea surface. Details can be found in Saunders (1967) and Fairall et al. (1996). Note that in this paper, ΔT equals SSTskin minus SSTdepth and positive values of fluxes refer to heat flux transfer from the air to the sea. The COARE model has been updated to the latest version 3.6 since November 1993. Significant modifications to the COARE 3.0 model included extending the range of wind speed to about 20 m s-1, which was validated using field measurements at high wind speeds and high latitudes (Fairall et al., 2003). COARE 3.5 was based on buoy data and was trained using a larger dataset of observations (Edson et al., 2013). Zhang et al. (2021) compared latent heat fluxes computed by the COARE 3.0 and 3.5 models according to different factors and reported that COARE 3.5 produced a mean percentage error of 2.0% compared to COARE 3.0 when using SSTskin as input. The mean percentage error increased to 18% when SSTskin was replaced by SSTdepth as the input for COARE 3.0. The COARE 3.6 model improved the effects of waves on fluxes, including the influence of surface roughness and whitecap fraction on wave parameters. In this study, we simulated the F96 model using COARE 3.6 and used SSTskin measurements as the inputs for the flux computations.
Donlon et al. (2002) first obtained an empirical parameterization for the relationship between cool skin ΔT and wind speed at a height of 10 meters (U10). The function is as follows:
The function contains three coefficients (a, b and c). A number of studies have assumed similar relationships and derived their own parameterizations (Minnett et al., 2011; Alappattu et al., 2017; Zhang et al., 2020; Luo et al., 2022). The details of the coefficients from previous studies can be found in Table 1 of Luo et al., 2022. In this study, our newly derived parameterization was compared to other existing models.
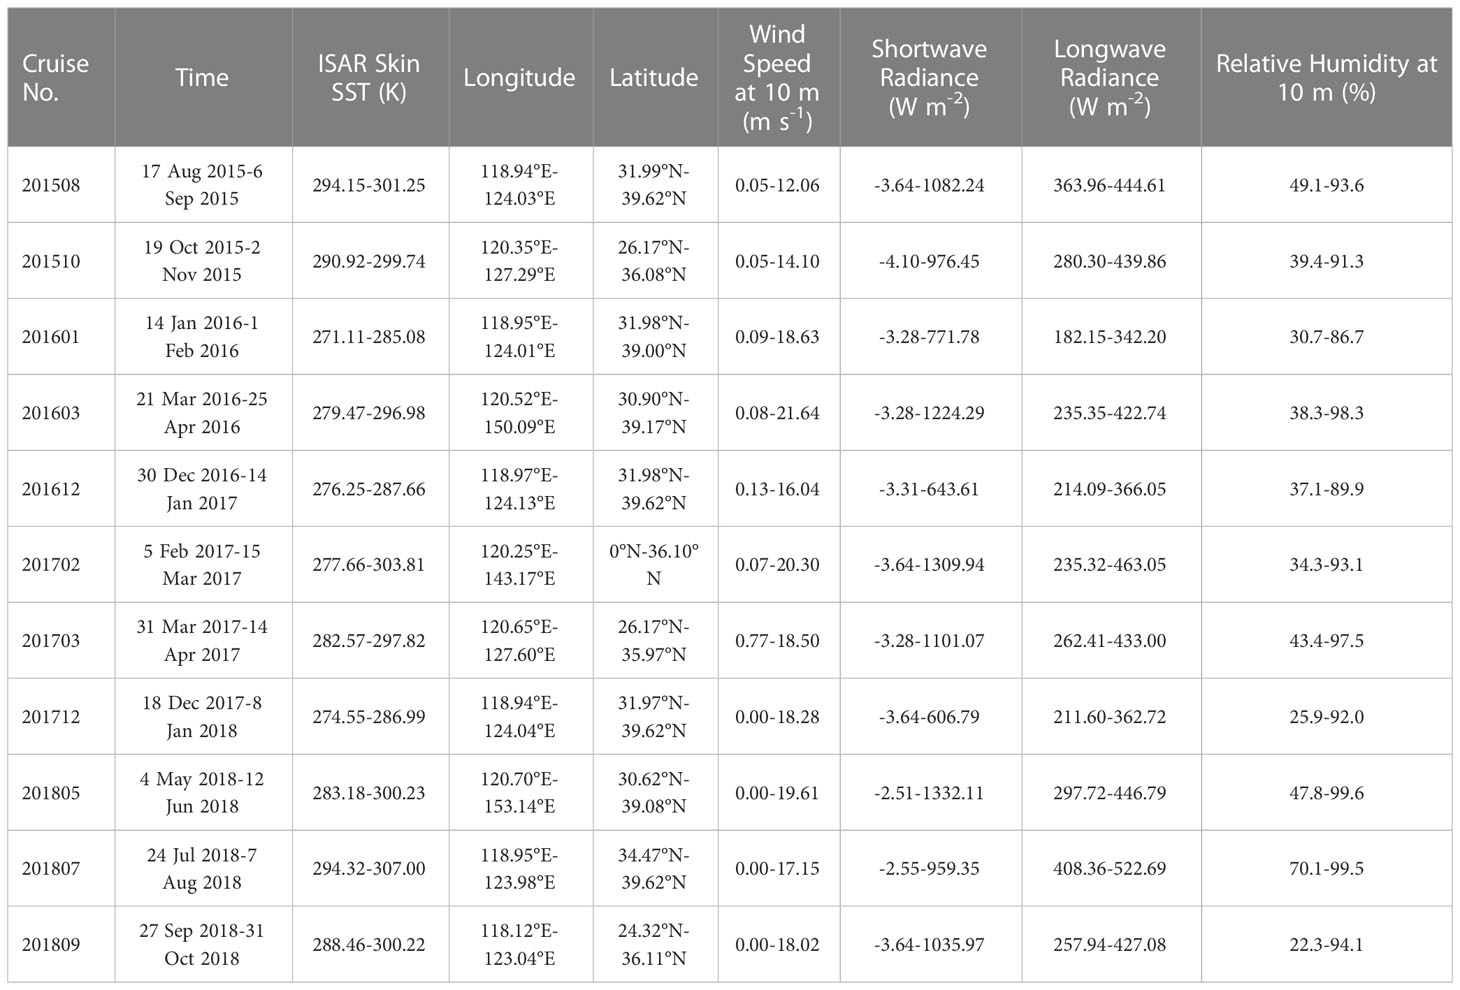
Table 1 Cruise information and measurement ranges.
2.2 Shipboard measurements
We used a dataset comprising measurements from 11 cruises by the research vessel Dong Fang Hong II of the Ocean University of China to compute the cool skin effect and validate the models. The dataset included measurements from 263 days, from 17 August 2015 to 31 October 2018. The cruises were named according to the starting year and month, e.g., “201508”. The cruise information and measurement ranges are listed in Table 1 and the cruise tracks are shown in Figure 1. All of the cruises took place in the Northwest Pacific: eight (“201508”, “201510”, “201601”, “201612”, “201703”, “201712”, “201807” and “201809”) were conducted in the China Seas and their adjacent waters; two (“201603” and “201805”) went east to areas with longitudes of 142°E to 153°E and latitudes of 32°N to 39°N; and one (“201702”) went southeast to around 143°E, 22°N and then headed south to the equator.
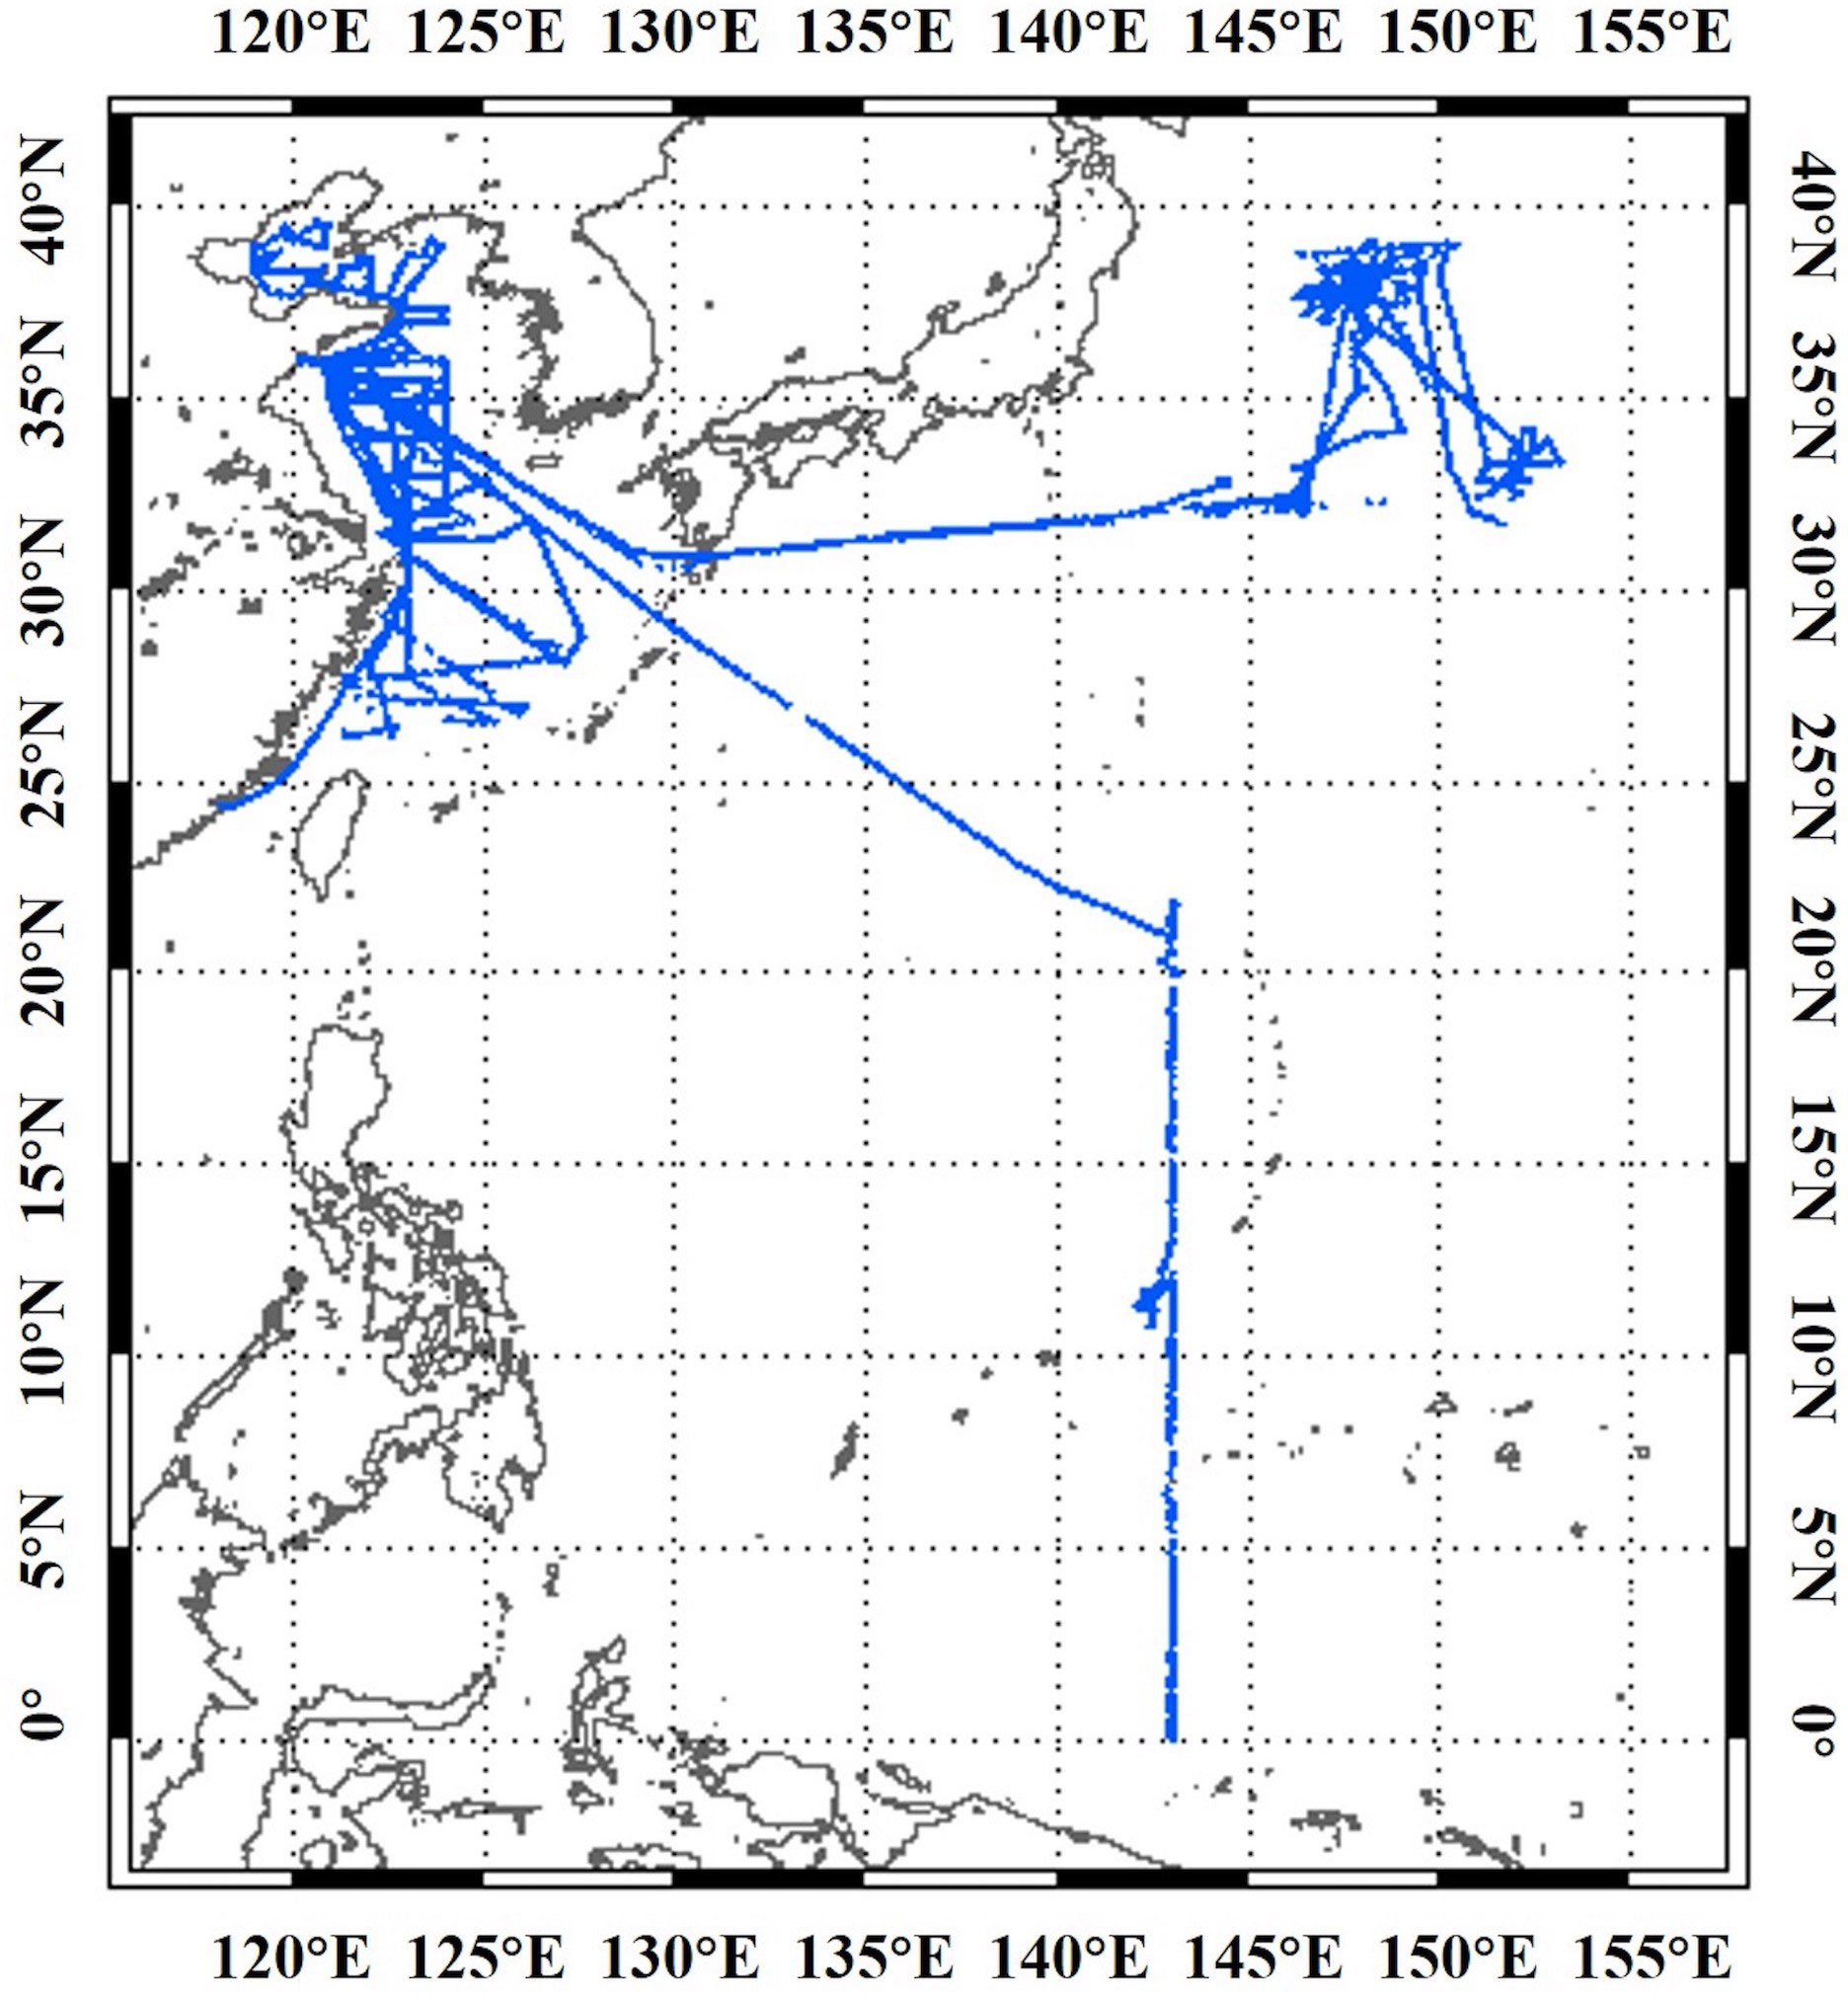
Figure 1 Cruise tracks included in this study.
The SSTskin measurements were obtained using the Infrared Sea Surface Temperature Autonomous Radiometer (ISAR), which is a self-calibrating radiometer with a spectral bandpass of 9.6-11.5 μm and a nominal accuracy of ±0.1 K (Donlon et al., 2008). ISAR is capable of continuous autonomous operation for up to about 3 months, under the protection of a storm shutter. An ISAR 5C was deployed on the Dong Fang Hong II and has been operating continuously since 2009. The ISAR 5C was installed on the port side of the vessel at a height of 13 meters above the waterline, which had a nadir sea view angle of 45° to avoid being affected by the ship’s wake and a zenith sky view angle of 45°. Radiance observed from sea view mainly consists of two parts: the SSTskin emitted radiance at the spectral bandpass and the reflected downwelling sky radiance (Donlon et al., 2008). The ISAR 5C obtained SSTskin measurements at time intervals of approximately 4 to 5 minutes. As shown in Table 1, the minimum SSTskin observed by the ISAR occurred during the cruise “201601”, with a measurement of 271.11 K, and the maximum value was observed during the cruise “201807”, with a measurement of 307 K. The largest temperature range was observed during the cruise “201702”, which was measured as being from 277.66 K to 303.81 K.
Many sources have contributed to the uncertainty of SSTskin measurements collected by ISAR while operating on the sea (Donlon et al., 2008; Wimmer and Robinson, 2016). To improve confidence in the performance of ISAR and evaluate the accuracy of the measurements, the ISAR 5C used in this study was calibrated before and after each cruise using an external BB-ASSIST II blackbody, manufactured by LR TECH, Canada. BB-ASSIST II have a 70 mm aperture and an effective emissivity greater than 0.9998. Its absolute temperature accuracy is ±5 mK and the operating temperature ranges from ambient to 65°C because it only has a heating system. The temperature differences between the ISAR 5C and the BB-ASSIST II blackbody of both pre- and post-calibration showed good agreement with the ±0.1 K accuracy. Maintenance was carried out after each cruise, including changing the hardened gold front surface mirror on the scan drum inside the ISAR (Donlon et al., 2008). SSTskin measurements need to be calibrated and traced to SI units when used for the validation of satellite SST measurements and other research objectives, including the evaluation of the oceanic thermal effects discussed in this paper (Minnett and Corlett, 2012). The ISAR 5C radiometer and BB-ASSIST II blackbody used in this study both participated in an international comparison project conducted by the National Physical Laboratory (NPL), UK, in June 2016, which was called Fiducial Reference Measurements for Surface Temperatures derived by Satellite (FRM4STS) (Theocharous et al., 2019). The comparison results from both the ISAR 5C and the BB-ASSIST II showed good agreement with the NPL traceable radiometric standards. Note that ISAR SSTskin measurements from 7 out of 11 cruises in this study were used to validate the Level 2P SST product of the Visible Infrared Imaging Radiometer Suite (VIIRS) onboard Suomi National Polar-orbiting Partnership (S-NPP) satellite. The comparison results showed positive bias of 0.14 K and standard deviation of 0.30 K in total number of 853 matchups (Yang et al., 2018).
A Sea Bird SBE 48 hull contact temperature sensor was used for the SSTdepth measurements at a depth of approximately 4 m. It was installed on the port side of the vessel, as with the ISAR 5C. The SBE 48 was attached to the inside of the ship’s hull below the waterline using magnets and was then covered with insulating sponge material. The initial accuracy of SBE 48 is ±0.002 K, with a typical stability of 0.0002 K per month. SBE 48 temperature sensors have been deployed on several vessels and have proved to be capable of measuring SST with similar accuracy as that measured by water injection temperature sensors, such as the SBE 3 and SBE 38 (Beggs et al., 2012). The SBE 48 SSTdepth data were sampled every second and averaged every 10 samples.
The downwelling shortwave and longwave radiation were measured by a Kipp & Zonen CMP21 pyranometer and a CGR4 pyrgeometer, respectively. CMP21 pyranometer has a spectral range of 285–2800 nm and a response time of 5 s. CGR4 pyrgeometer has a spectral range of 4500–42000 nm and a response time of 18 s. Both instruments were installed on top of a small plane platform, which was at a height of approximately 15 m above the waterline with a 180° field of view. The solar radiation measurements were averaged every minute. As shown in Table 1, the shortwave radiance measured by the CMP21 had a maximum value of 1332.11 W m-2 in cruise “201805”. The nighttime measurements from the CMP21 were slightly less than zero due to the zero offsets of the instrument. The longwave radiance ranged from 182.15 W m-2 to 522.69 W m-2 across the 11 cruises.
The vessel management system (VMS) on the Dong Fang Hong II provided meteorological observation data at 1-minute intervals, including wind speed, air temperature, air pressure, relative humidity, etc. Wind sensors on the VMS weather station were installed at a height of 19 m and the other sensors were installed 18 m above the sea surface. Using the real heights of the observations as inputs, the COARE 3.6 model was capable of computing reference heights for the wind speed, air temperature and relative humidity profiles (Fairall et al., 2003). The wind speeds adjusted to 10 m (U10) ranged from 0 to 21.64 m s-1 and the maximum wind speed occurred during cruise “201603”, as shown in Table 1. Strong winds often lead to large uncertainties of the shipboard measurements, especially the ISAR SSTskin used in this study. The roll and pitch of the vessel contributed to uncertainty of the view angle dependent sea surface emissivity which is crucial to the sky radiance correction (Wimmer and Robinson, 2016). Hence, datasets under strong winds (U10 >15 m s-1) are eliminated to further ensure the quality of the measurements. The last column in Table 1 shows the ranges of the relative humidity adjusted to 10 m (RH10) measurements. The most humid air conditions occurred during the summer cruise “201805” and “201807”, with maximum RH10 values of 99.6% and 99.5%, respectively.
3 Results and discussion
3.1 Cool skin effect
The sea skin layer is cooler than the layer just below it due to air–sea heat transfer throughout the whole day (Fairall et al., 1996; Minnett et al., 2011). Previous researches on the cool skin effect have mostly used nighttime measurements to avoid the diurnal warming effect (DW) during daytime (Donlon et al., 2002; Zhang et al., 2020; Zhang et al., 2021; Luo et al., 2022). Zhang et al. (2020) reported a new approach that uses the maximum diurnal warming effect (DWmax) during the daytime as a constraint to eliminate DW residuals at nighttime. Strong DW events can lead to the warming of the sea surface skin at the whole night (Zhang et al., 2020). Note that in this study, we separated day and night using the solar zenith angle of 110° to consider less solar heat contamination at night. Due to the large number of measurements (63108), we first examined the appropriate DWmax threshold for the dataset. We only used daytime and nighttime data that had DW amplitudes that were less than the DWmax for our analysis. The statistics for the temperature differences ΔT (SSTskin minus SSTdepth) under different DWmax thresholds from 1.0 K to 0.0 K are shown in Figure 2. The mean ΔT decreased slightly as the DWmax decreased from 1.0 K to 0.3 K and then dropped from -0.22 K to -0.36 K when the DWmax decreased to 0.0 K. The total number of ΔT measurements reduced from 39909 to 29086, i.e., from 63.2% to 46.1% of the 63108 measurements, as the DWmax changed from 0.3 K to 0.2 K. The differences between the daytime and nighttime ΔT measurements and the standard deviation reduced as the DWmax decreased because DW events were removing. As shown in Figure 2, DWmax values of 0.2 K or smaller were quite strict as the majority of the ΔT measurements were eliminated. In addition, for the cases of the warm skin phenomenon discussed in this study, we selected 0.3 K for the DWmax threshold.
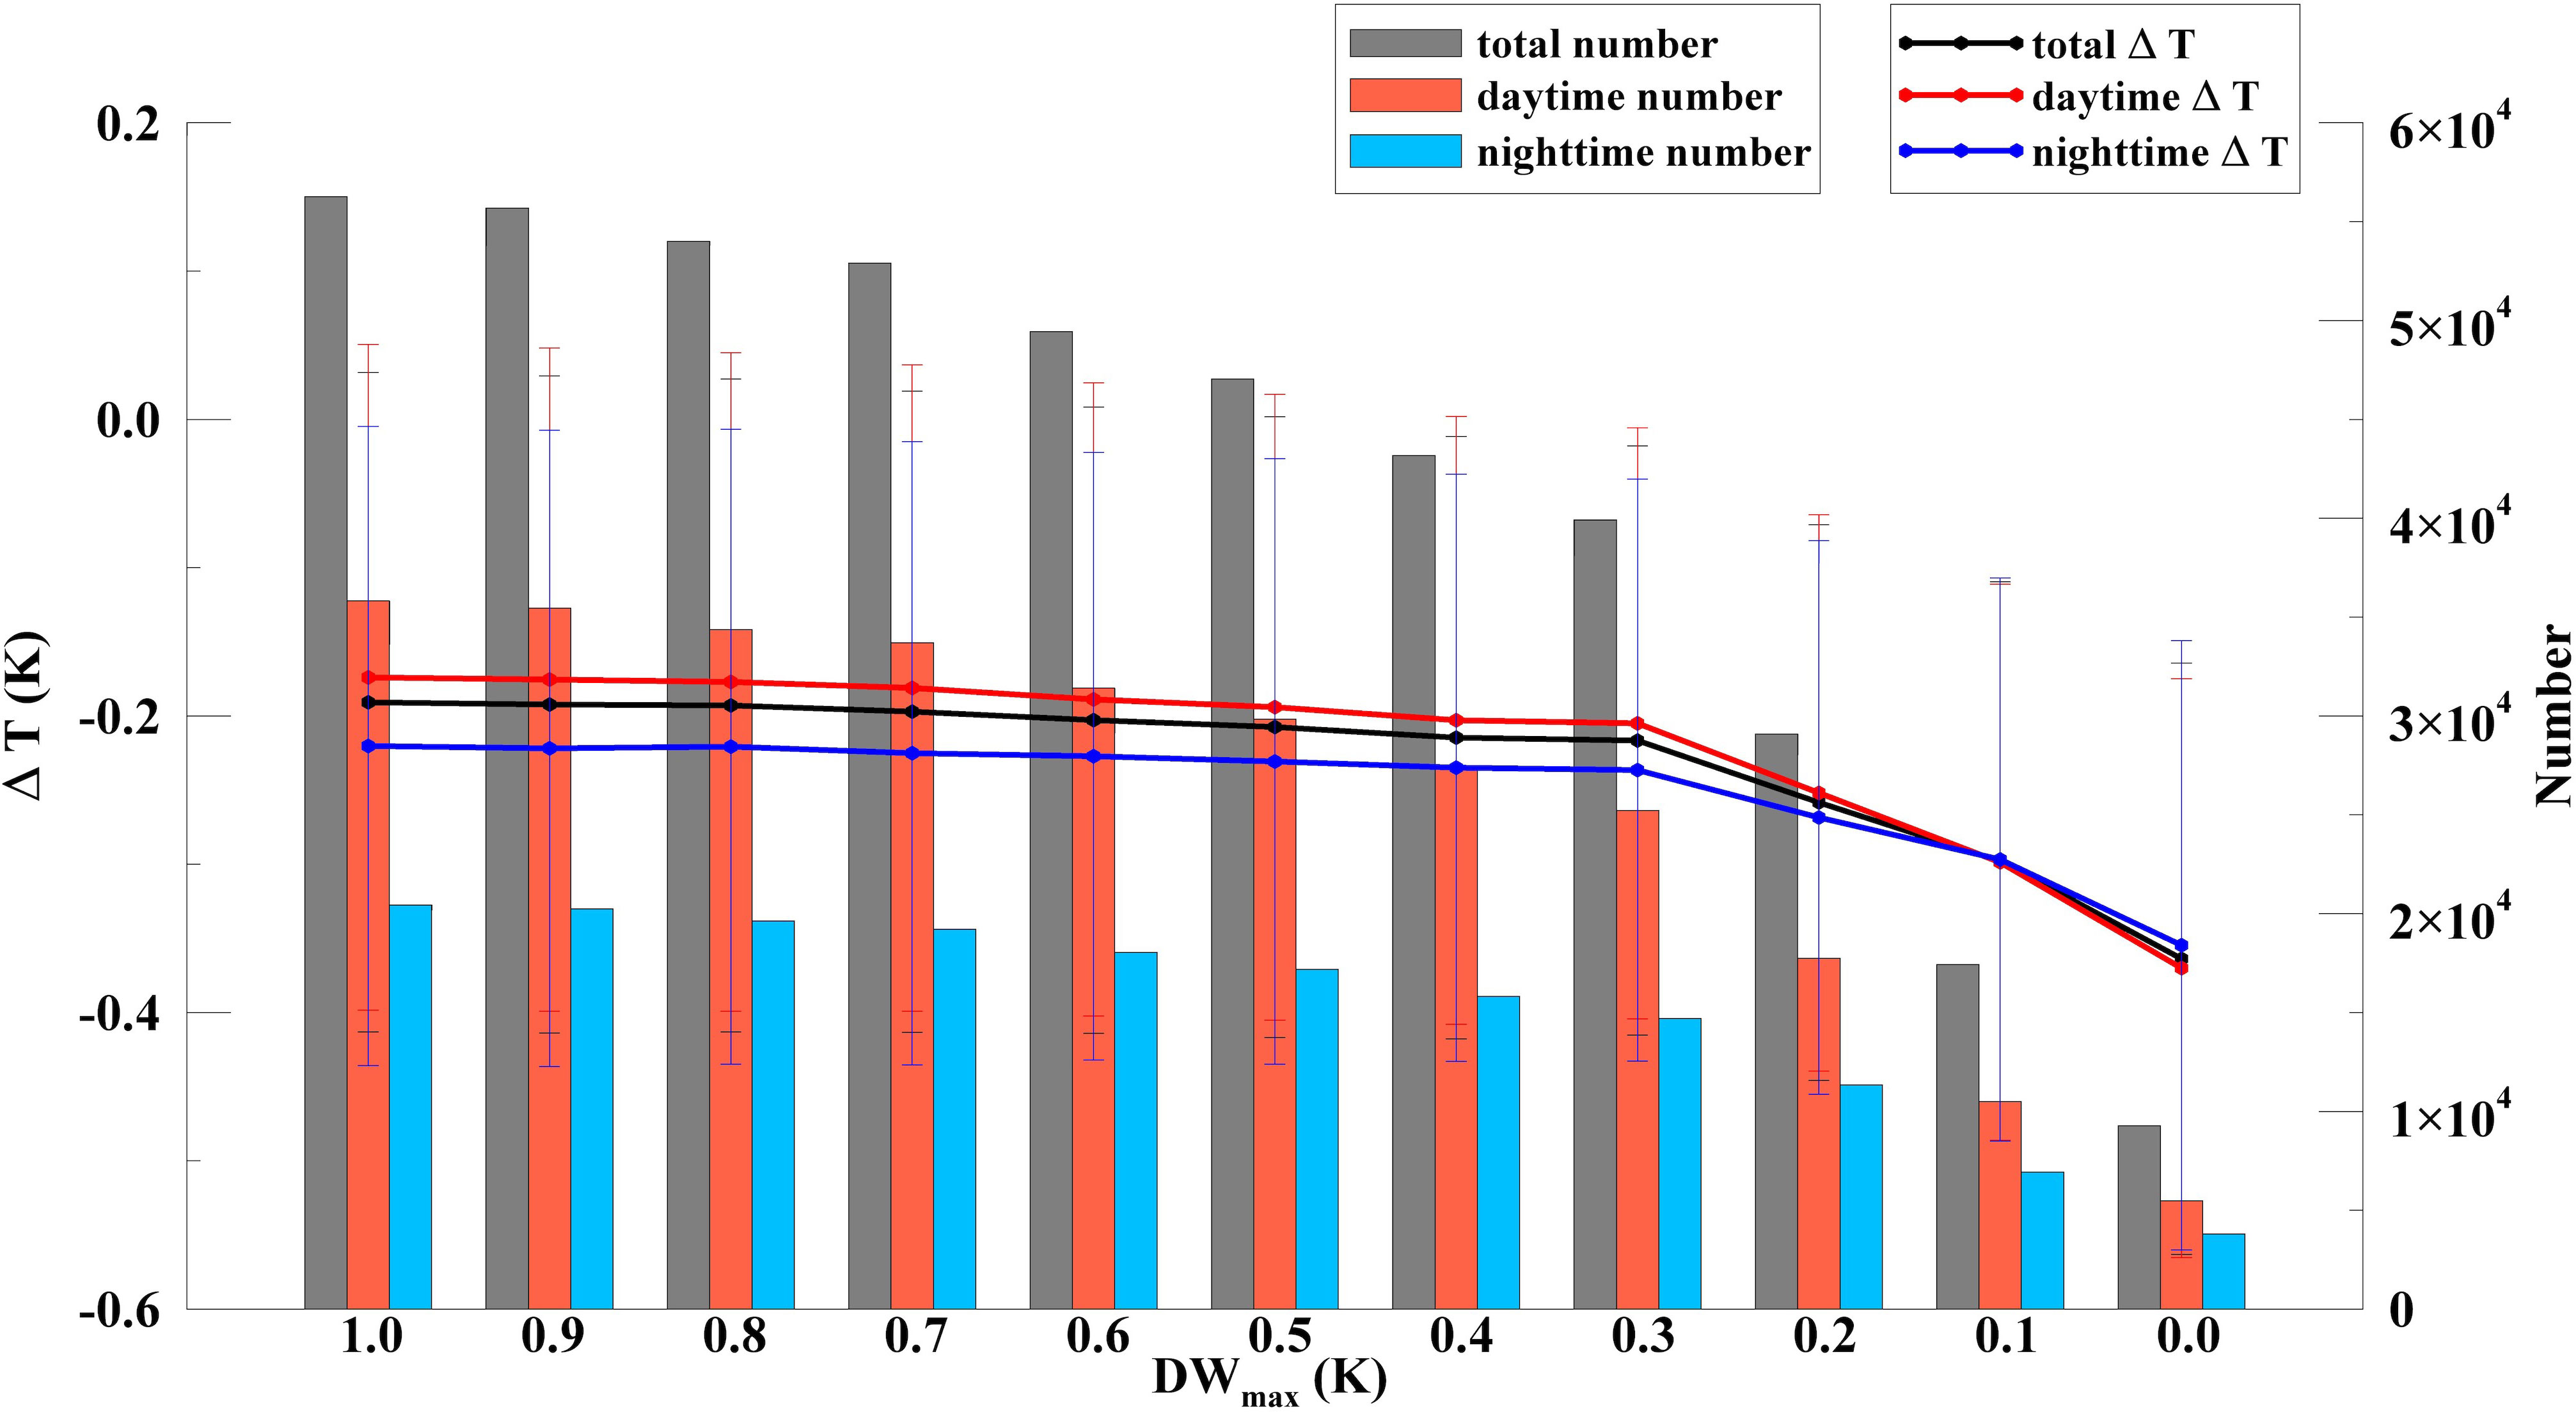
Figure 2 The lines show the mean ΔT under each DWmax constraint for the total (black), daytime (red) and nighttime (blue) values. The error bars represent the standard deviation. The gray, orange and blue bars display the numbers for each DWmax threshold.
For the dataset with the 0.3 K DWmax threshold, the statistics for the ΔT results from the F96 model and the observed data are shown in Table 2. The distributions of the nighttime and daytime ΔT measurements and the ΔT measurements from the F96 model and the field observations are shown in Figure 3. The total number of ΔT measurements was 39909, with 14693 (36.8%) collected at nighttime and 25216 (63.2%) collected during daytime. As shown in Figure 3A, the observed nighttime and daytime ΔT measurements had similar quasi-Gaussian distributions to those presented in previous studies (Zhang et al., 2020; Luo et al., 2022). The mean and median ΔT values were smaller at nighttime compared to daytime. The mean and standard deviation of all observed ΔT measurements were -0.22 K and 0.20 K, respectively. The ΔT measurements from the F96 model had lower mean and median values, as well as smaller STD and RSD values, in comparison to those from the field observations. The distribution of the ΔT measurements from the F96 model had a peak value around -0.20 K, as shown in Figure 3B. Note that in contrast to previous studies, we measured more positive ΔT values, especially in nighttime, with a proportion of 1251 (8.5%) out of the 14693 ΔT measurements.
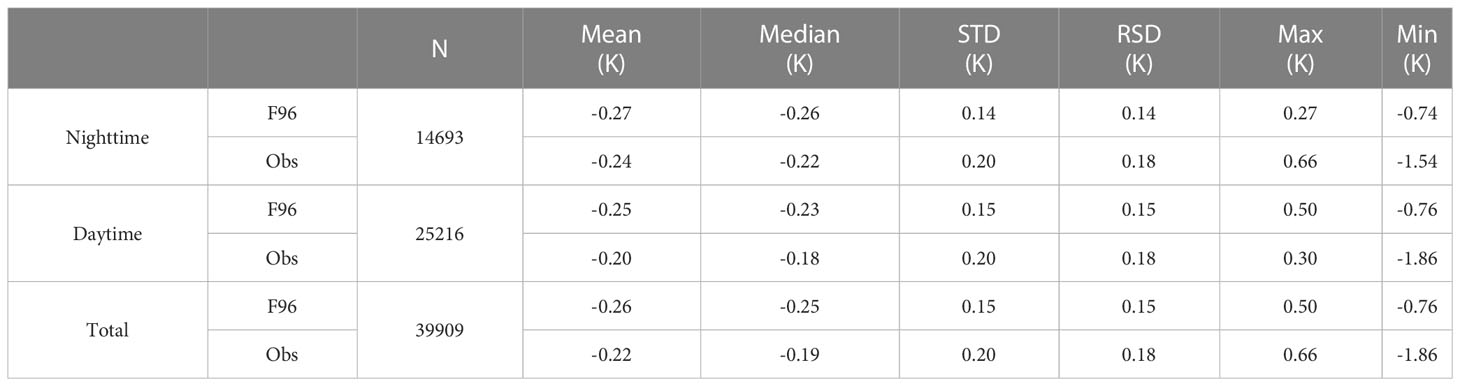
Table 2 Statistics for the temperature difference ΔT from the F96 model and the field observations.
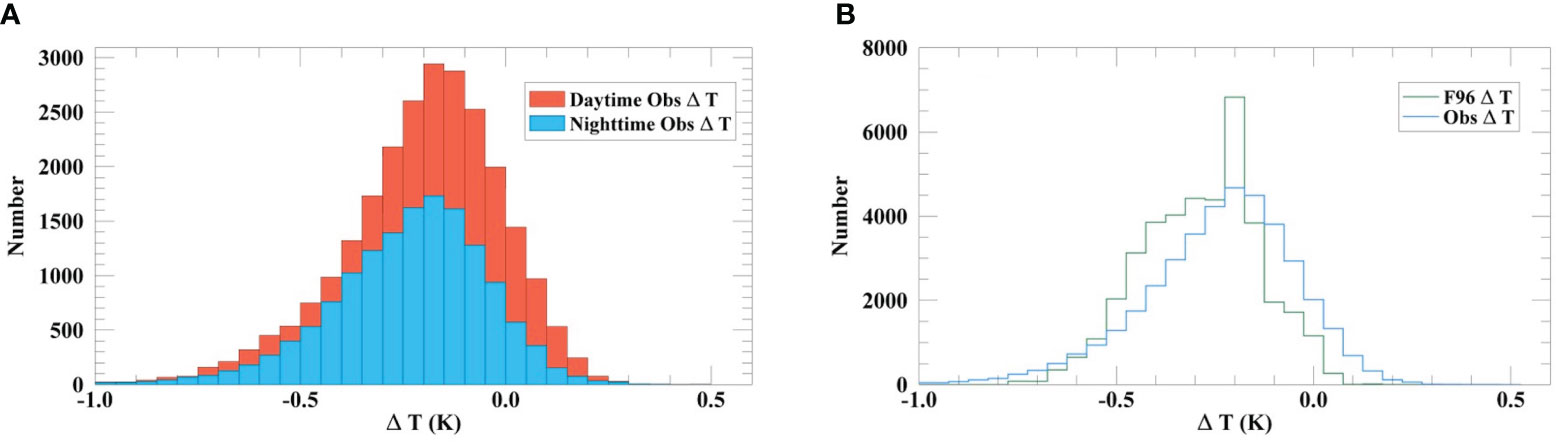
Figure 3 (A) The histograms of the nighttime (blue) and daytime (orange) ΔT measurements; (B) the distributions of the ΔT measurements from the F96 model (green) and the field observations (blue). The interval of the bars is 0.05 K.
The relationship between ΔT and local time is shown in Figure 4. The observed ΔT measurements changed little at midnight, with the minimum bin-averaged ΔT of -0.25 K occurring between 6 a.m. and 7 a.m. The ΔT reduced by a quite small amplitude from midnight to dawn, which was similar to the findings of Zhang et al. (2020). Even though strong DW events were eliminated using the 0.3 K DWmax threshold, the observed ΔT measurements still increased after sunrise and reached a peak of the bin-averaged value of -0.17 K between 11 a.m. and 12 a.m. due to solar heat compensation. The measurements from the F96 model did not increase in the daytime and instead remained relatively stable throughout the whole day because the cool skin effect in the model was independent from the warm layer estimation and was corrected using an improved solar transmission model (Fairall et al., 2003; Wick et al., 2005).
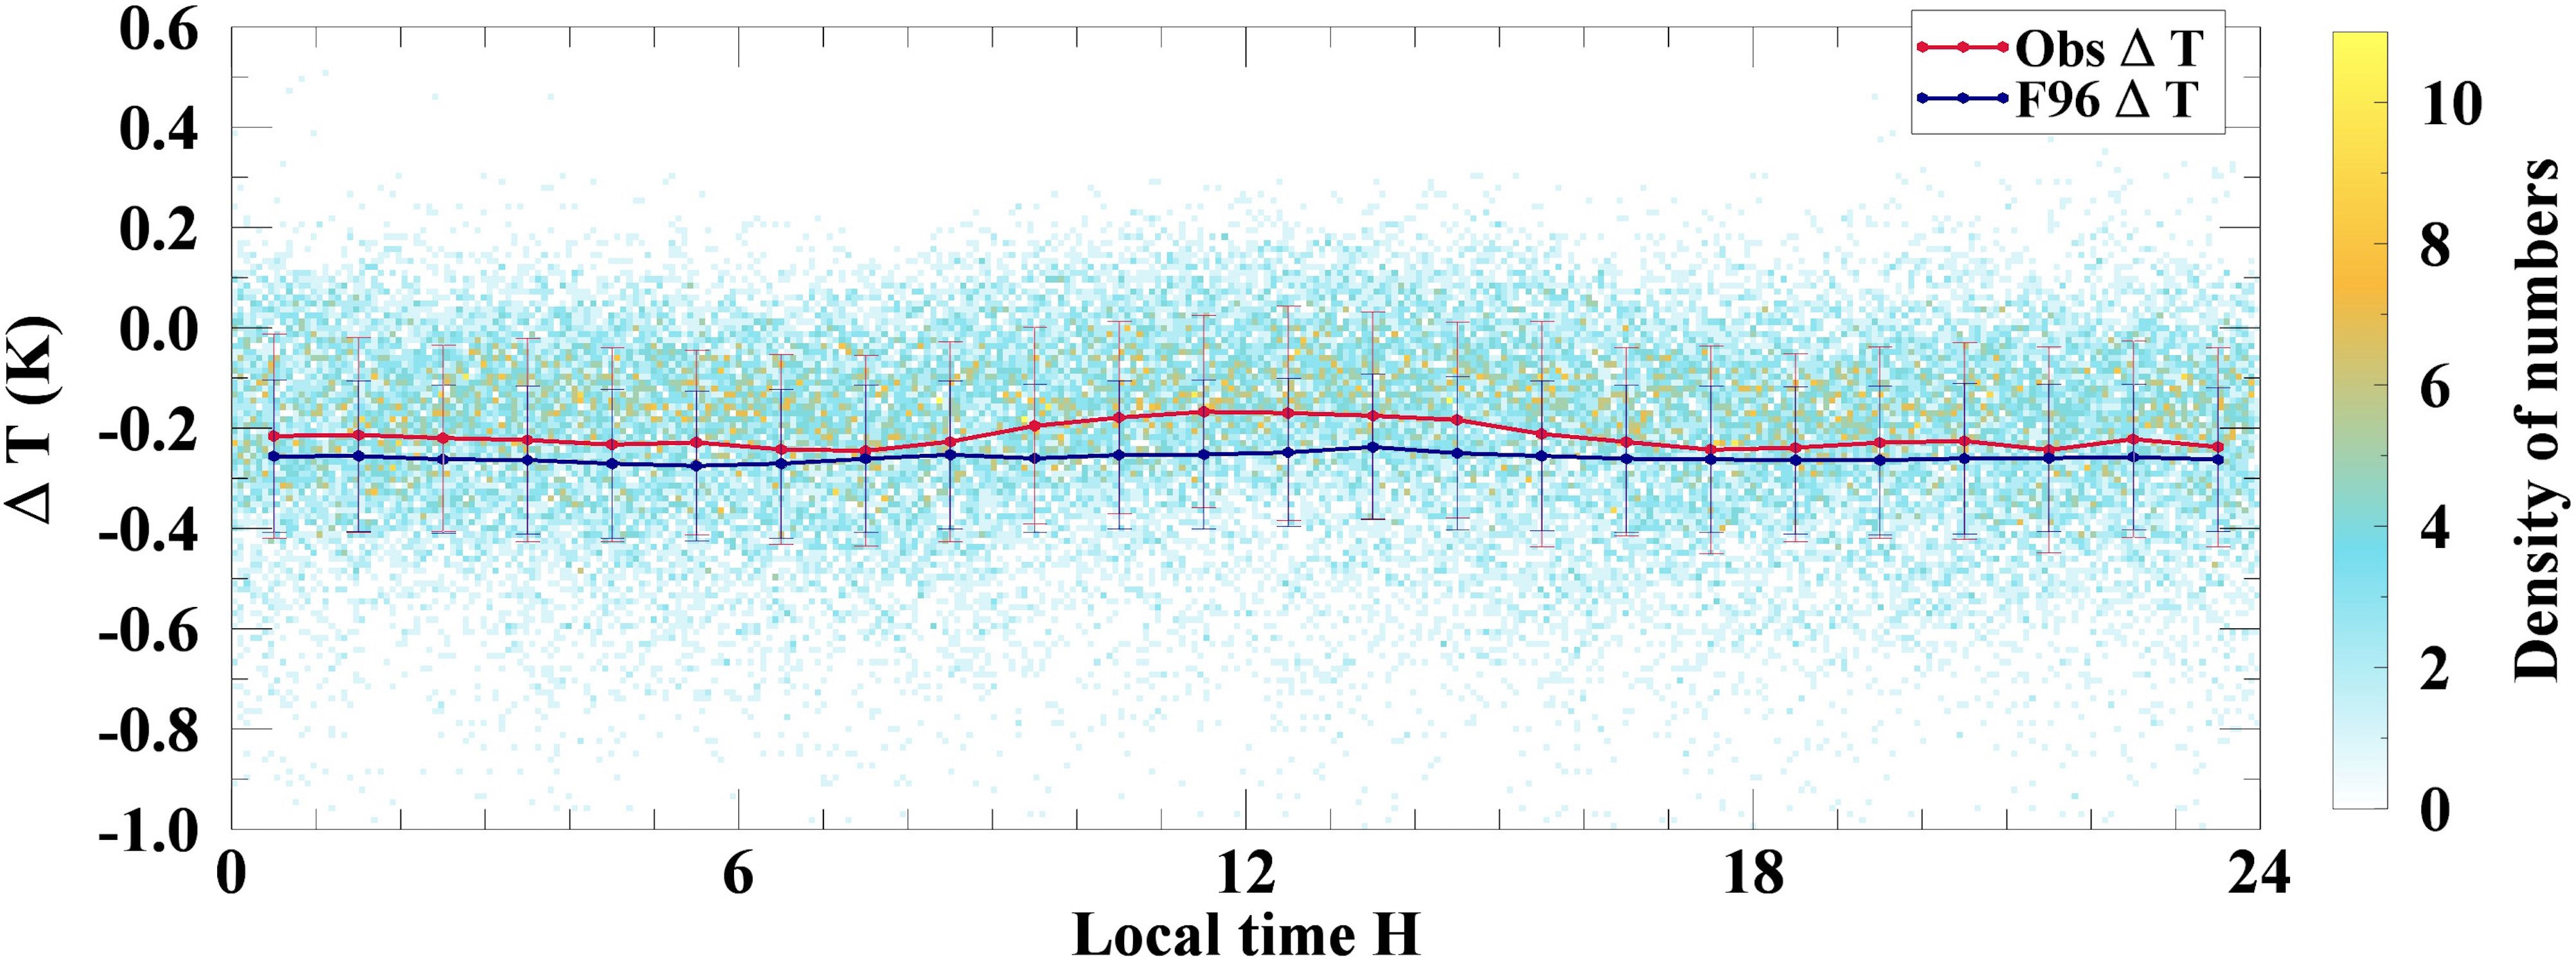
Figure 4 Observed ΔT as a function of local time in hours. The lines represent the mean values of the ΔT measurements from the field observations (red) and the F96 model (dark blue), with intervals of 1 hour. The error bars represent the standard deviation. The color bar indicates the densities of the observed ΔT measurements in one bin (0.07 hours and 0.01 K).
The coefficients in Eq. (3) from the empirical model of Donlon et al. (2002) were derived using observed ΔT and U10 measurements, as follows:
Figure 5 shows five previous parameterization functions and the new parameterization that we derived in this study. The parameterizations of Donlon et al. (2002); Minnett et al. (2011) and Alappattu et al. (2017) were given under 2 m s-1< U10< 15 m s-1, considering the relatively minor role of wind shear-driven mixing on thermal skin heat transfer when U10< 2 m s-1 and also with the small number of measurements. Based on our large number of measurements, we extended U10 to 0 m s-1, which was similar to the study by Zhang et al. (2020) and Luo et al. (2022). The results from our dataset fit well with those of Luo et al. (2022) within the entire U10 range and were also in good agreement with those of Donlon et al. (2002) at 2 m s-1< U10< 6 m s-1. The magnitude of ΔT in this study was slightly smaller than that in the study by Zhang et al. (2020) at 2 m s-1< U10< 6 m s-1. Minnett et al. (2011) overestimated ΔT at low wind speeds when U10 was< 6 m s-1, possibly due to their relatively small dataset. At moderate to high wind speeds (U10 > 6 m s-1), all of the results produced similar patterns, which were less dependent on U10. Alappattu et al. (2017) overestimated the magnitudes of ΔT at all U10 values in comparison with other parameterizations. Note that Minnett et al. (2011) and Alappattu et al. (2017) also included both daytime and nighttime observations, whereas the others only included nighttime measurements. The newly derived parameterization showed a good performance compared to those of the previous models.
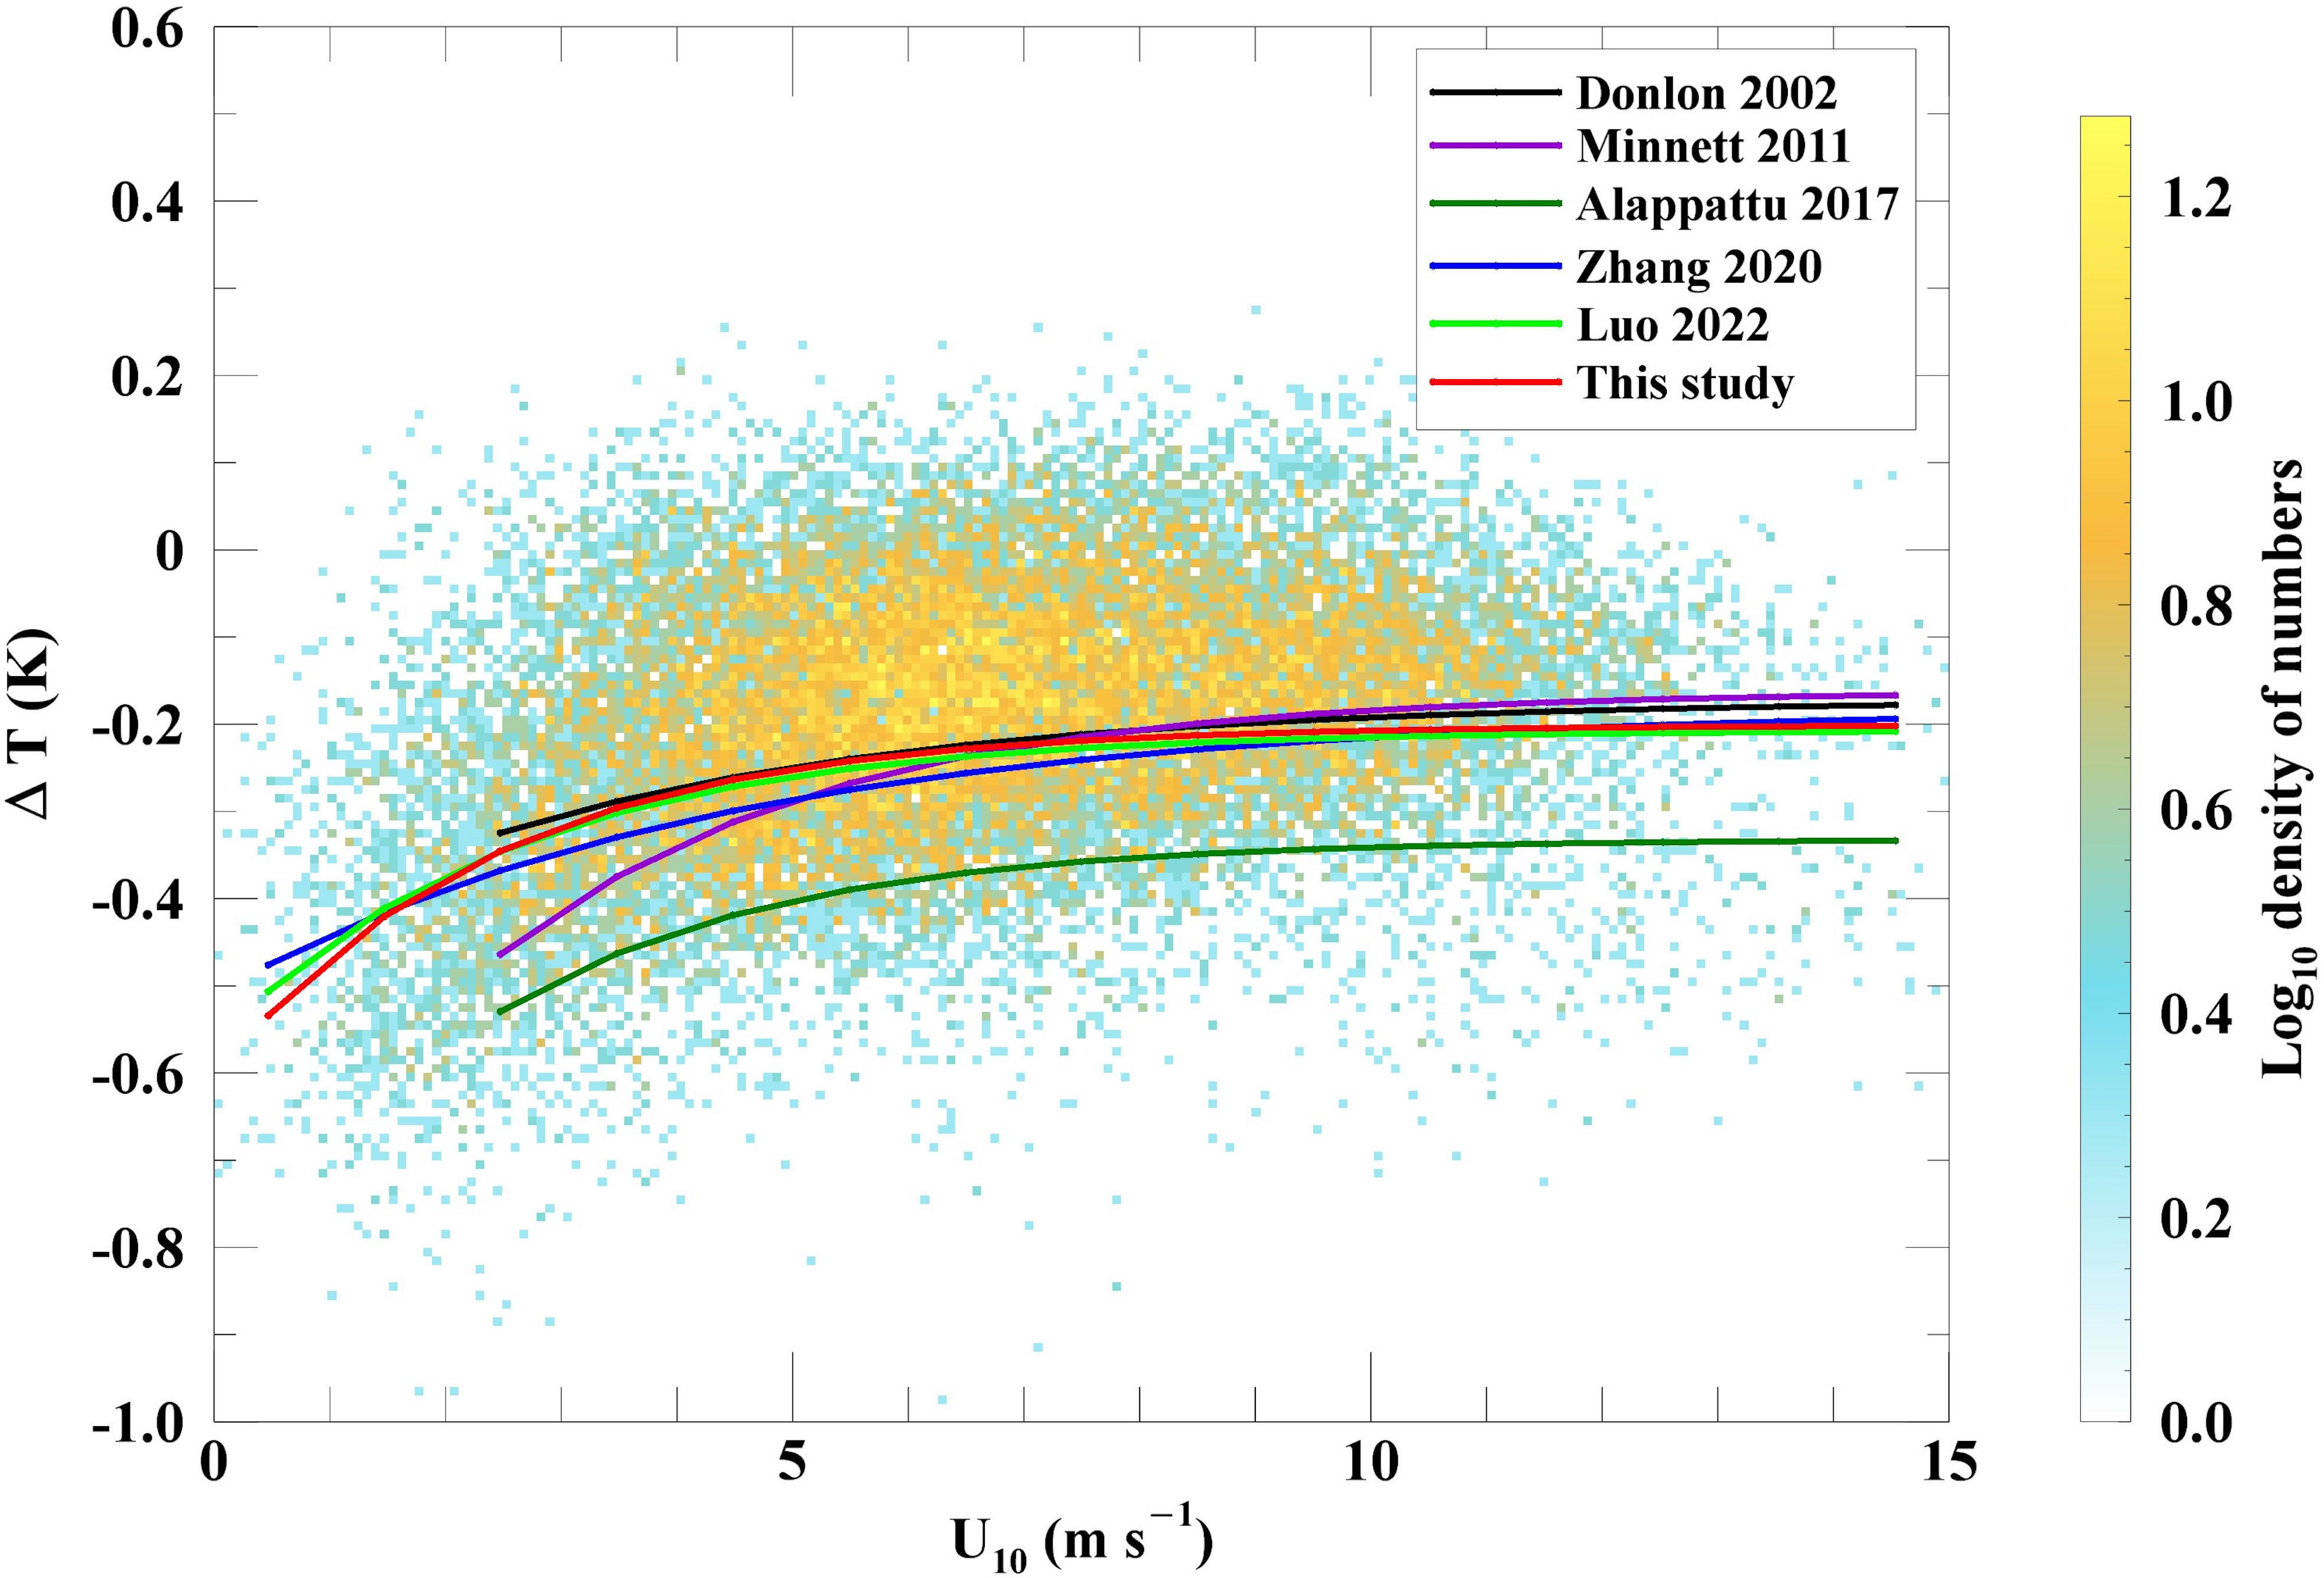
Figure 5 The relationship between the observed ΔT and U10 measurements. The lines represent the results from the empirical models of Donlon et al. (2002) (black), Minnett et al. (2011) (purple), Alappattu et al. (2017) (green), Zhang et al. (2020) (blue), Luo et al. (2022) (lime) and this study (red). The color bar indicates the densities of the observed ΔT measurements using the base-10 logarithm.
3.2 Evidence of the warm skin phenomenon at nighttime
The cool skin effect is described as the loss of heat from the sea surface. Zhang et al. (2020) introduced the idea of the reverse process of air–sea heat flux transfer, which can be considered as the “warm skin”. Direct physical evidence of the warm skin under the conditions of heat flux transfer from the air to the sea has been observed when the air is extremely humid and the air temperature is higher than the SST (Zhang et al., 2020). In this study, 8.5% of the observed nighttime ΔT measurements were positive, which motivated us to investigate the warm skin phenomenon. We first checked the relationship between ΔT and RH10 and the temperature difference between Tair_10 and SSTskin (Figure 6). There was a strong positive correlation between the ΔT measurements from both the field observations and the F96 model and the RH10, as well as the temperature difference between Tair_10 and SSTskin. As shown in Figure 6A, the F96 model overestimated the ΔT measurements of the cool skin at around 30%–60% humidity in comparison to the observed ΔT measurements and the average values of the observed ΔT measurements were almost equal within the range. The ΔT results fit well when humidity increased from 60% to 100% and the maximum mean value of the observed ΔT measurements was 0.01 K at 95%–100% humidity. The temperature difference between Tair_10 and SSTskin mainly ranged from -10 K to 3 K and the majority of the observed positive ΔT values were distributed at temperature differences of -1 K to 3 K, as shown in Figure 6B. The observed cases of the warm skin phenomenon with positive ΔT values occurred under the conditions of very humid air and an air temperature that was equivalent to or warmer than the temperature of the sea surface. In this study, measurements were taken in the Northwest Pacific, which often has high atmospheric moisture levels and temperatures in the summer. Therefore, we further investigated seasonal variations in ΔT. As shown in Figure 7, the magnitudes of ΔT in May, June and July were smaller than those in other months, which was mainly contributed by the measurements from the cruise “201805” and “201807”. The bin-averaged observed ΔT values were -0.09 K, -0.06 K and 0.02 K in these three months, respectively. The results from the other months were larger, with the minimum value occurring in November with 232 ΔT measurements.
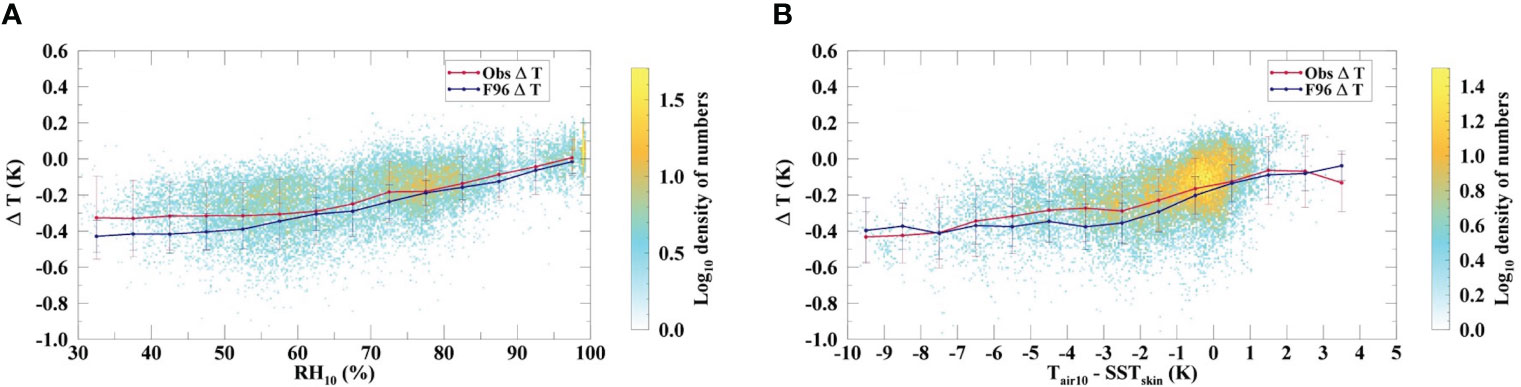
Figure 6 (A) The observed ΔT measurements as a function of RH10; (B) the observed ΔT measurements as a function of the temperature difference between Tair_10 and SSTskin.
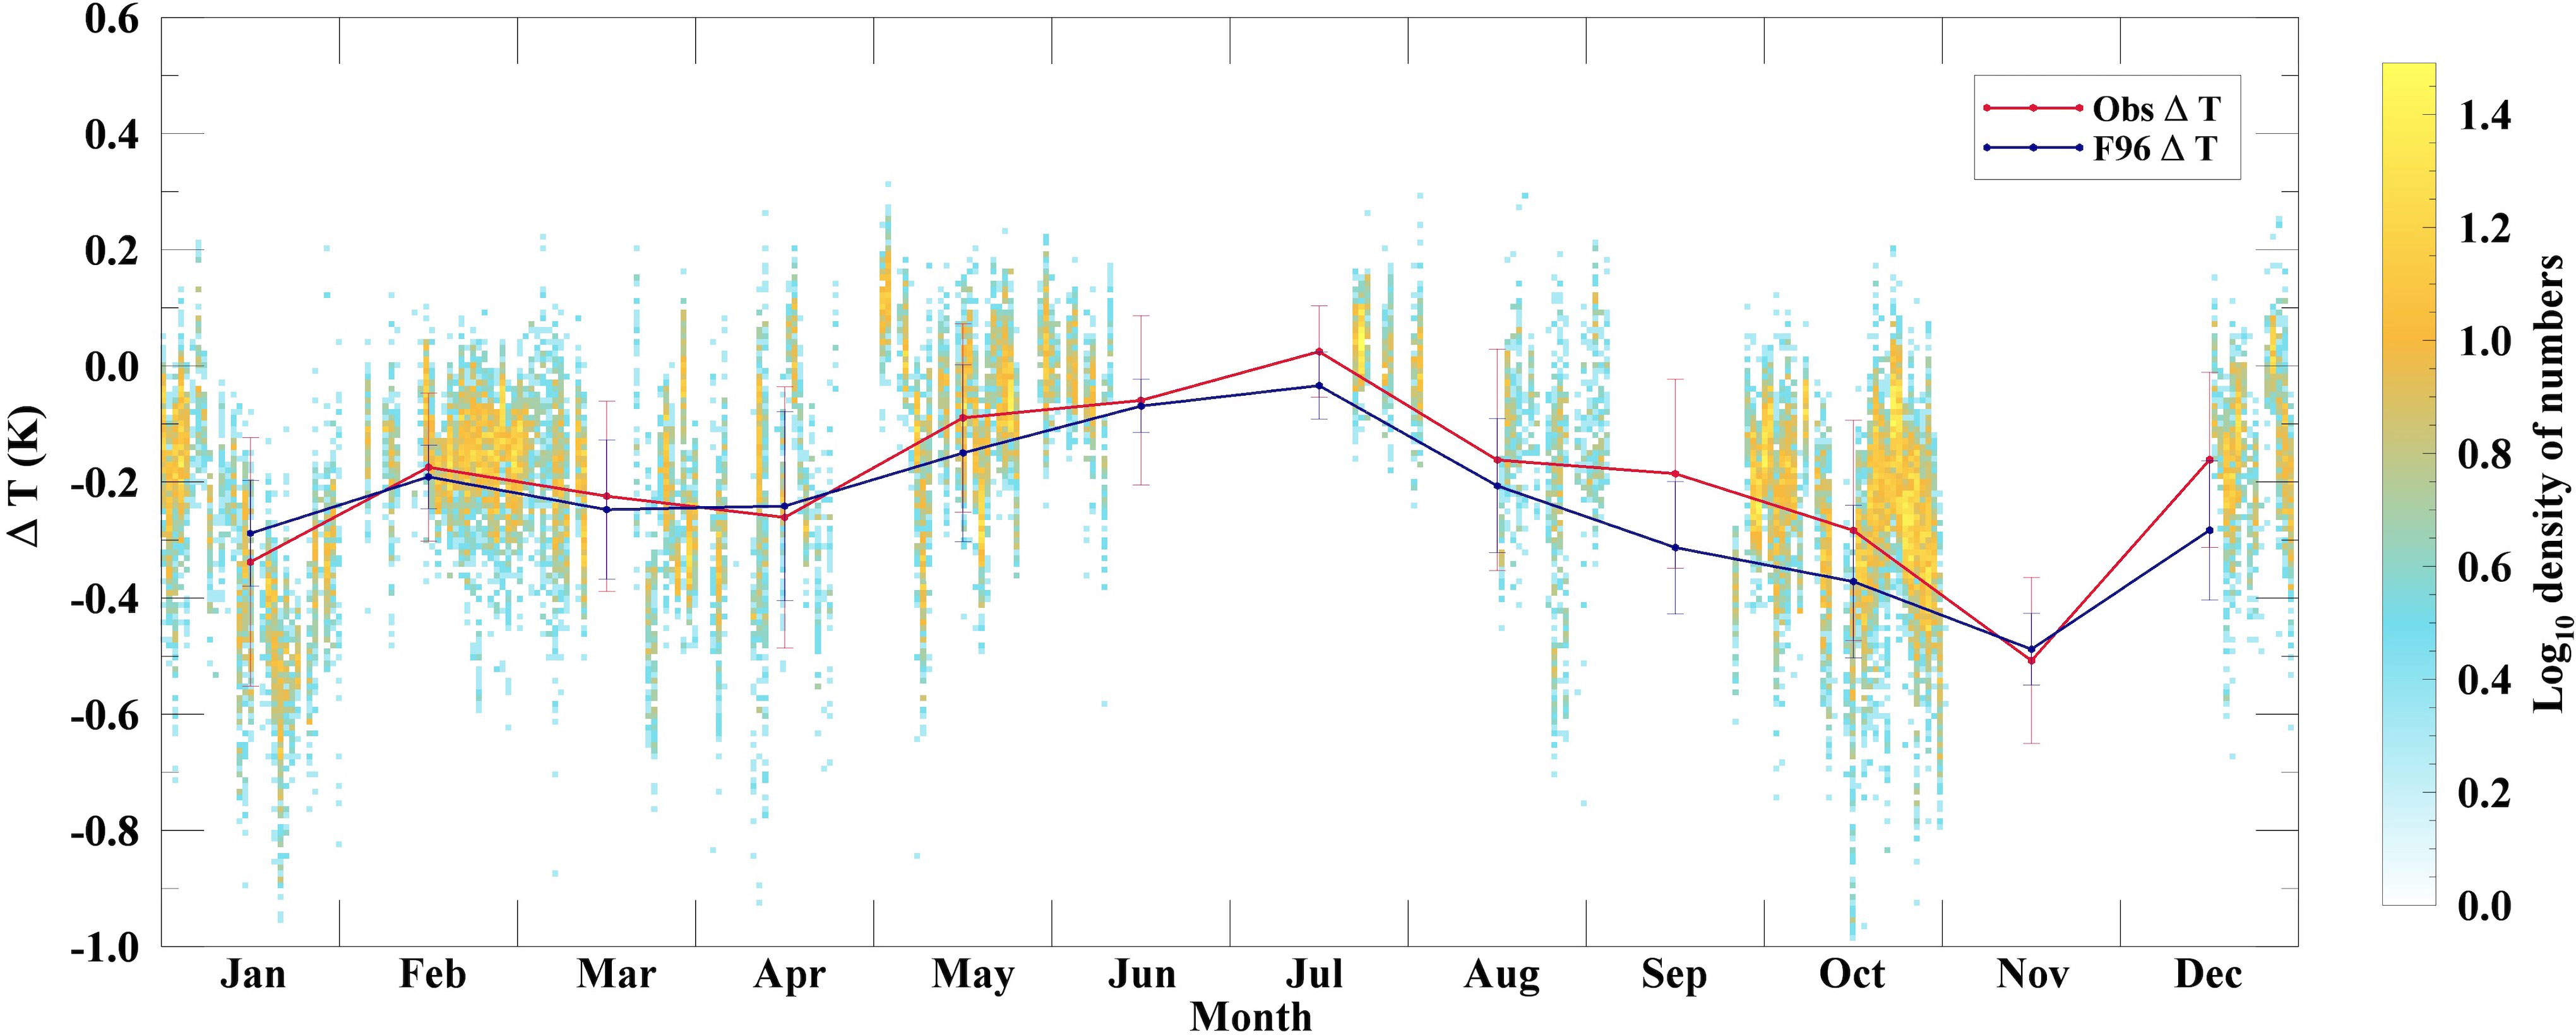
Figure 7 The relationship between the observed ΔT and time (in months).
Even though we used DWmax constraints to eliminate strong DW events from the dataset, we still needed to be careful when investigating the warm skin phenomenon considering solar contamination. Thus, we chose the observed nighttime ΔT measurements from the cruise “201805” and “201807” to conduct a further analysis. Figure 8 shows the locations of all observed nighttime ΔT measurements during the two cruises (121.00°E–153.14°E 31.10°N–39.22°N). The maximum positive ΔT value of 0.45 K was measured at 123.51°E 34.85°N, together with an RH10 value of 96.6%.
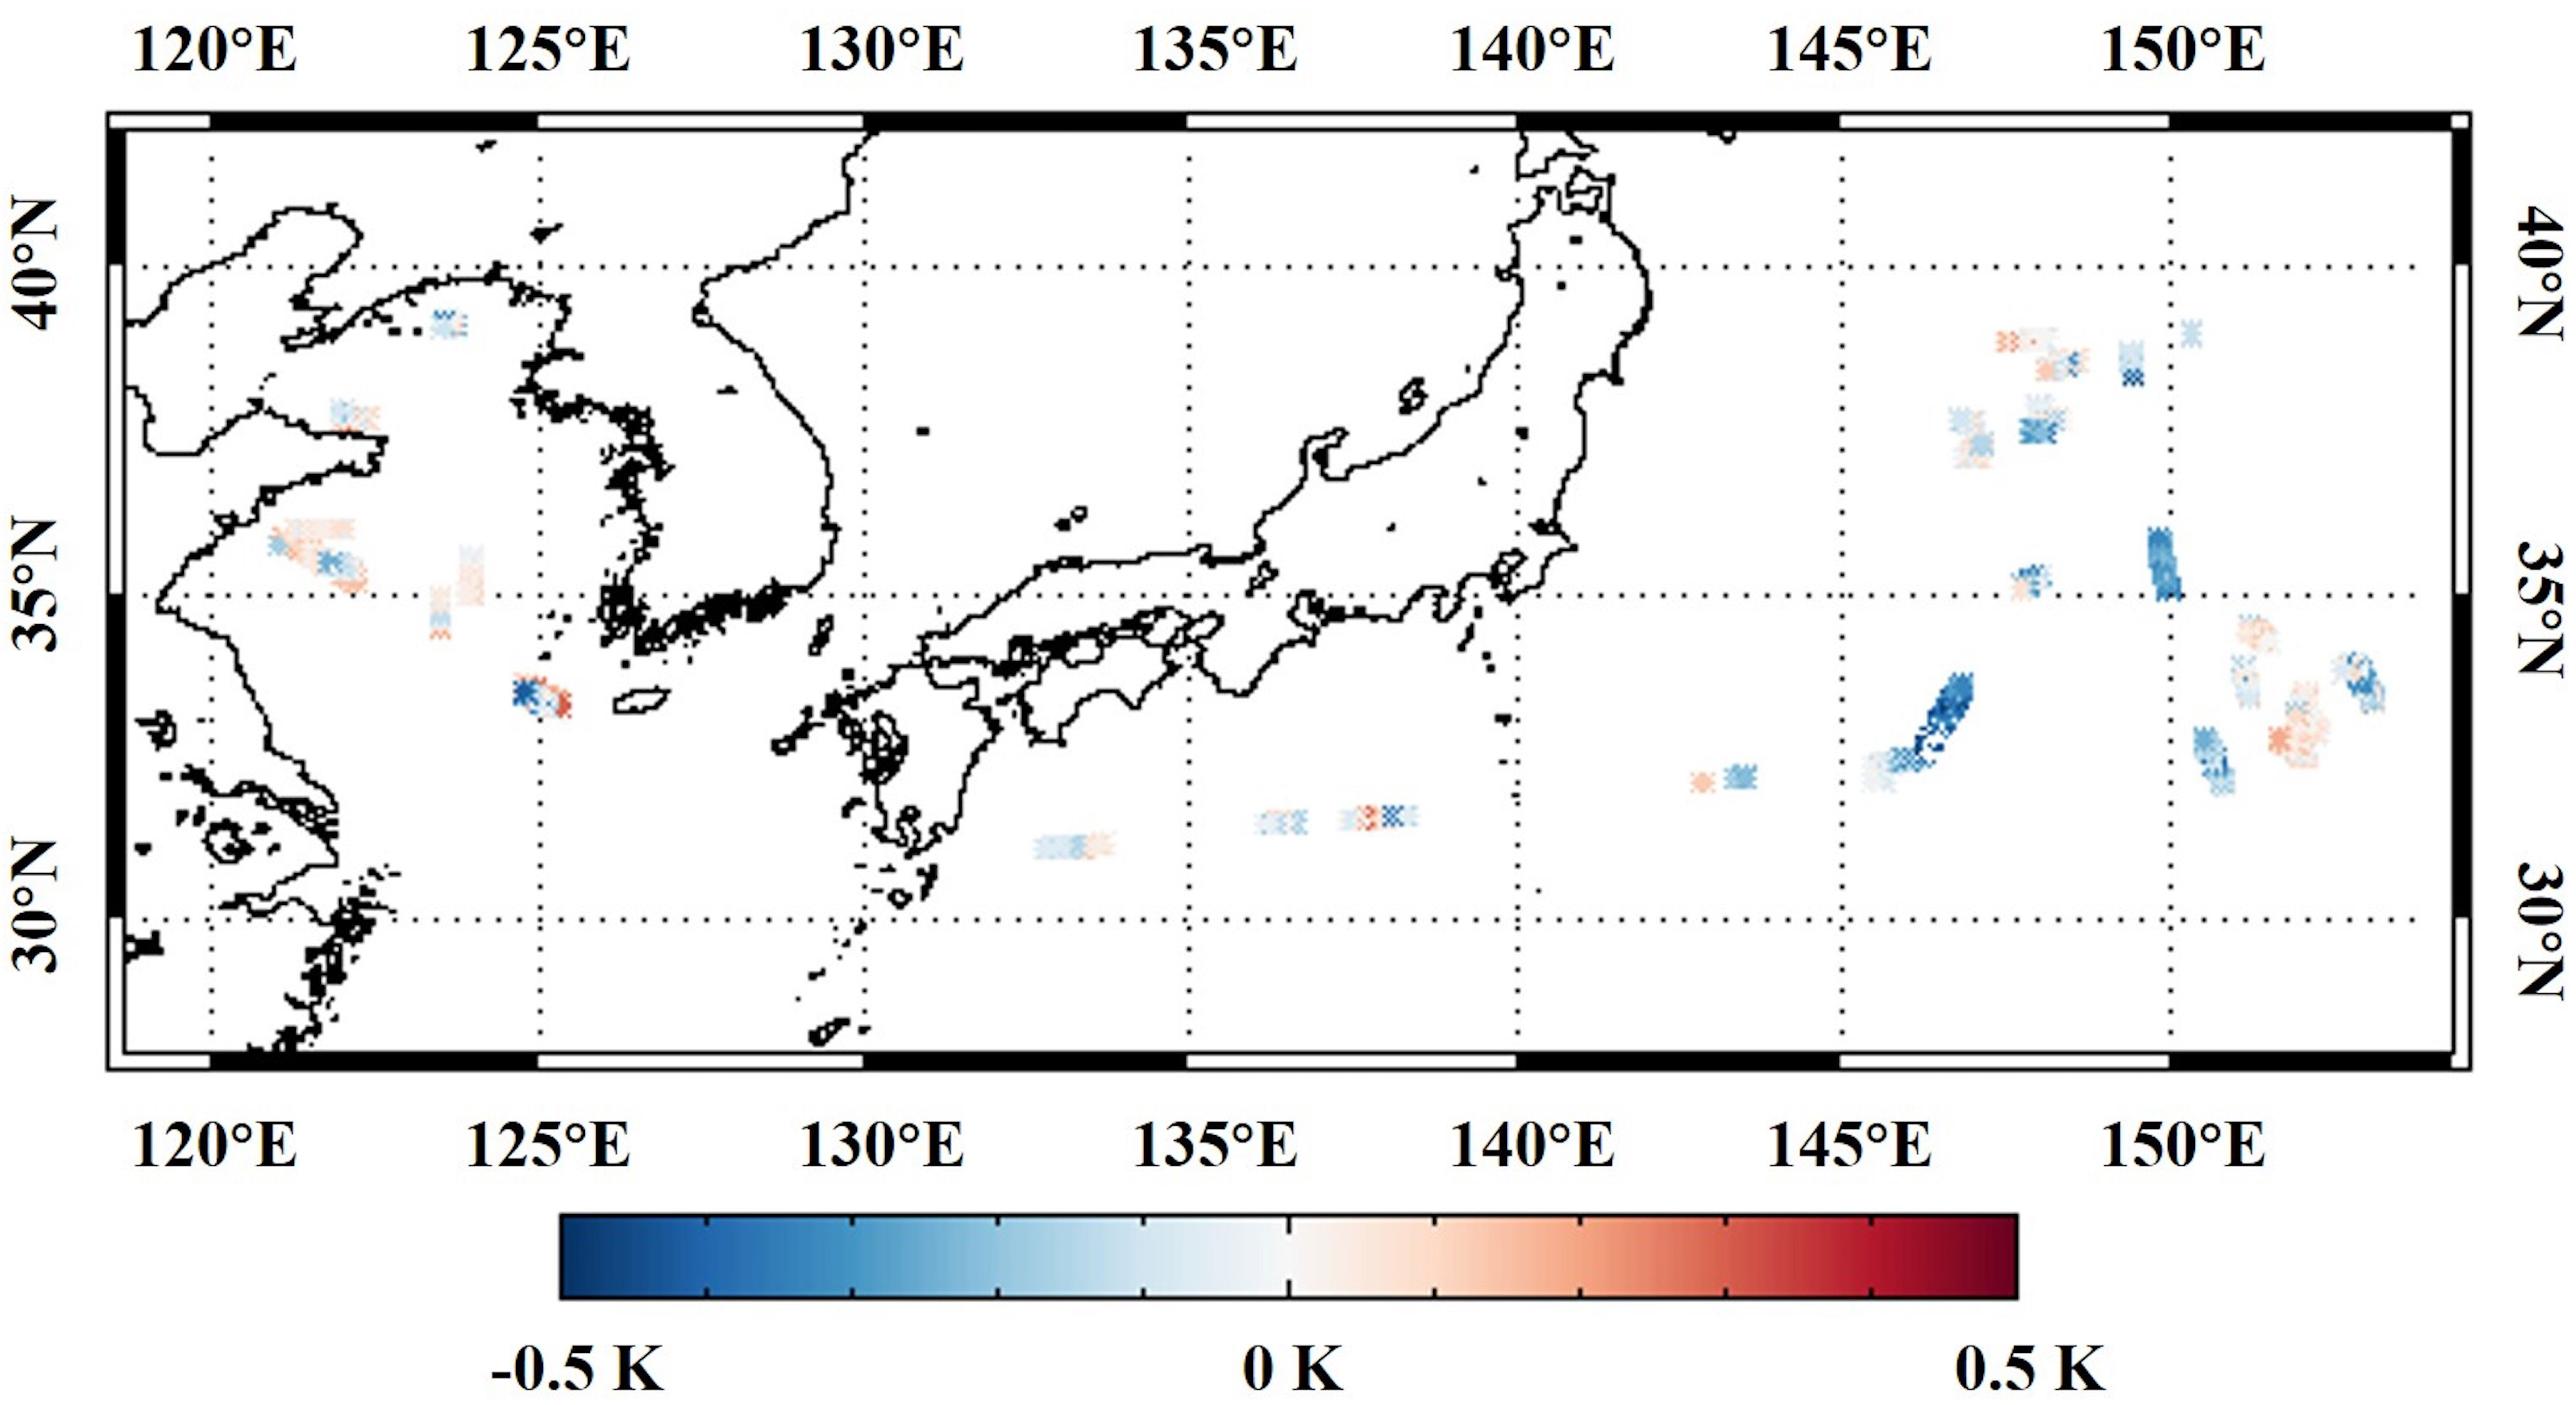
Figure 8 The locations of the nighttime ΔT measurements during the cruise “201805” and “201807”.
Figure 9 illustrates the relationships between the RH10 and air–sea temperature differences and the observed nighttime ΔT measurements from the cruise “201805” and “201807”. The ΔT measurements from the field observations and the F96 model increased as the air became more humid and the bin-averaged ΔT values were -0.02 K and 0.02 K at 96%–98% and 98%–100% RH10, respectively, and the percentages of positive ΔT values were 51.8% and 63.5%, respectively. The warm skin phenomenon occurred when the air was much warmer than the sea surface. The proportions of positive ΔT values were 60.8%, 49.3% and 64.3% at RH10 values of 76%–78% and 84%–88%. The presence of high proportions of positive ΔT values resulted from higher air–sea temperature differences of around 2–3 K. Positive ΔT values at extremely high RH10 also came with warmer air temperatures. The physical processes of the warm skin phenomenon were interpreted as follows: high relative humidity contributed to a large positive (air to sea) latent heat flux Ql; the large positive air–sea temperature difference resulted in a large positive (air to sea) sensible heat flux Qs; Ql, Qs and the net longwave radiation Qnlw (downward was positive) constituted the net heat flux Qnet of the sea surface (Fairall et al., 1996). In total, we observed 667 positive ΔT values out of the 1913 nighttime measurements during the cruise “201805” and “201807”. The magnitude of the observed warm skin phenomenon ranged from around 0 to 0.3 K, with a mean value of 0.08 K and a standard deviation of 0.06 K. More measurements are needed in future research, especially under very humid and warm atmospheric conditions, in order to conduct an accurate numerical analysis of the reverse heat transfer mechanism at the air–sea interface.
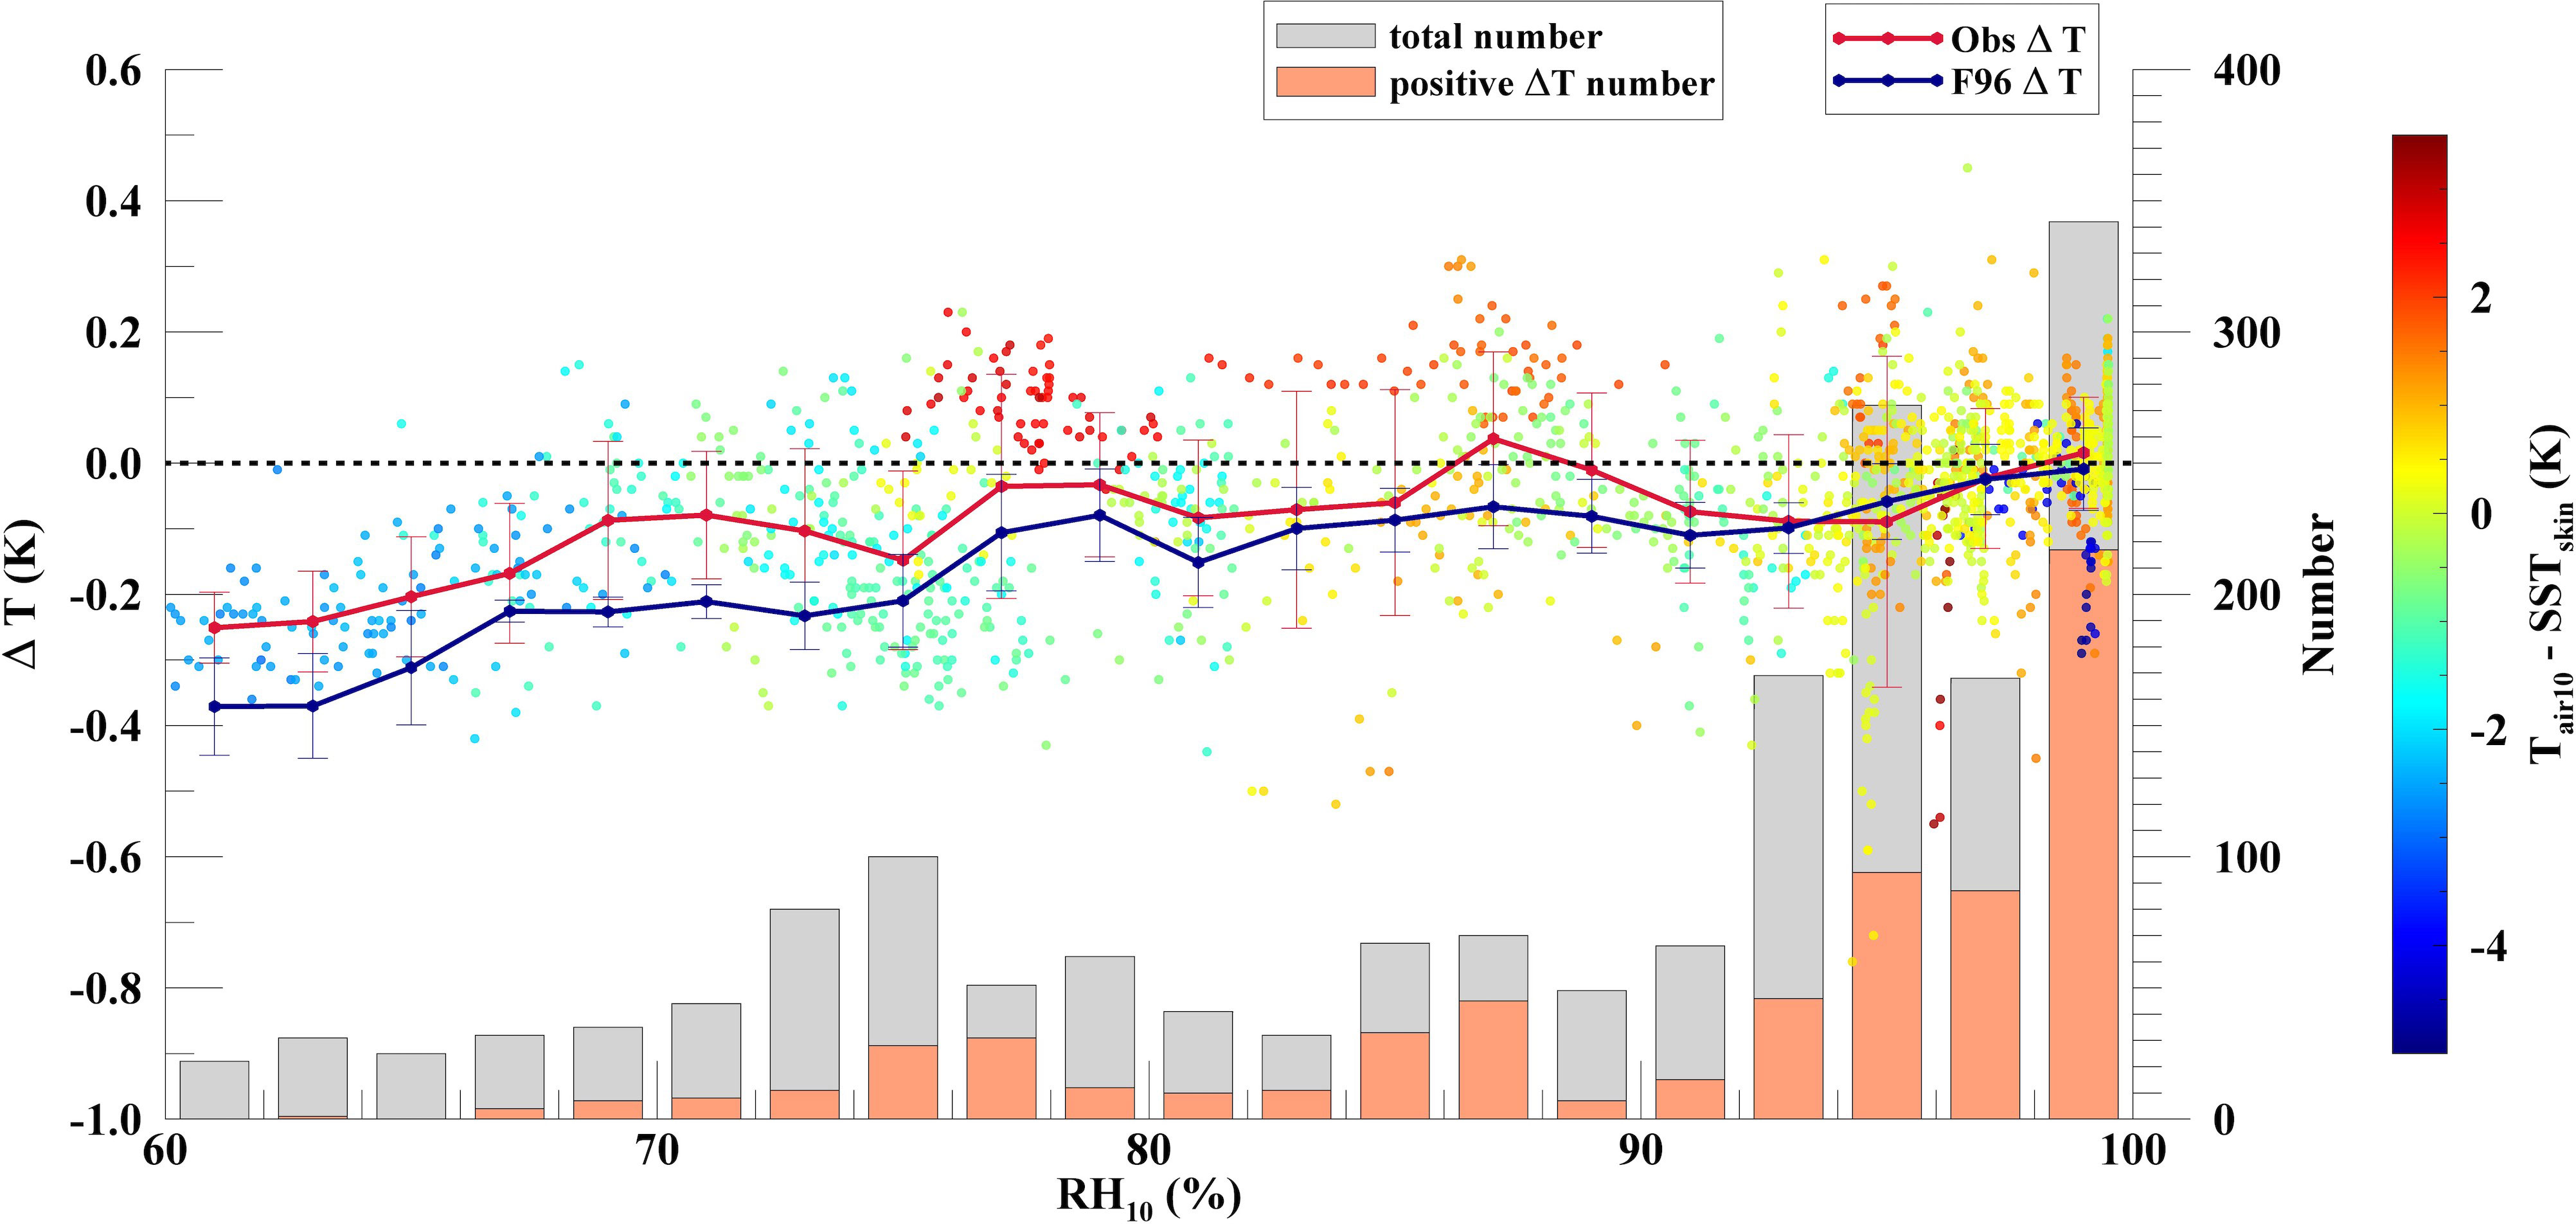
Figure 9 A scatter plot of the relationship between RH10 and observed ΔT values. The color bar indicates the temperature differences between Tair_10 and SSTskin. The bars represent the numbers of total (gray) and positive (orange) ΔT values within a 2% RH10 bin. The dashed line represents the ΔT value of 0 K.
4 Conclusion
Measurements taken during 11 cruises by the research vessel Dong Fang Hong II were used to study the cool skin effect of the sea surface in the Northwest Pacific. The SSTskin was measured using a radiometer and the SSTdepth at a depth of 4 m was measured using an SBE 48 temperature sensor. The auxiliary meteorological and radiation data were all collected by ship-based sensors. The cool skin effect calculated by the COARE 3.6 algorithm was compared to observed ΔT (SSTskin - SSTdepth) measurements. DWmax thresholds were used to eliminate the effects of strong DW events and 0.3 K was determined to remove DW event days from the data. Statistics for the ΔT measurements from the field observations and the F96 model showed mean ΔT values of 0.22 K and 0.26 K, respectively, and standard deviations of 0.20 K and 0.15 K, respectively, with a total of 39909 measurements. The ΔT measurements from the F96 model had relatively larger magnitudes and could simulate the cool skin effect during the daytime without contamination from solar heat. A set of new coefficients for the parameterization of Donlon et al. (2002) were derived using our data from the research area. The new empirical model fitted that of Luo et al. (2022) well and was in good agreement with those of Donlon et al. (2002); Minnett et al. (2011) and Zhang et al. (2020) at U10 > 6 m s-1.
In general, the magnitude of the cool skin ΔT decreased when the relative humidity increased from 60% to 100% and the air–sea temperature difference increased. Under the conditions of RH10 values ranging from 98% to 100%, the mean ΔT value was 0.02 K, and the percentage of positive ΔT values was 63.5%. In contrast to the cool skin effect, heat flux transfer from the air to the sea in the form of a warm skin was observed in this study, according to nighttime measurements from two summer cruises. A high proportion of the cases of the warm skin phenomenon occurred under the conditions of air that was much warmer than the sea surface and high humidity. The magnitudes of the warm skin were around 0–0.3 K in 667 cases out of 1913 observations. The cool skin effect analysis in this study could be essential for the retrieval and validation of satellite SST measurements in the Northwest Pacific and further research on the heat flux transfer at the air–sea interface, especially the reverse process, which has rarely been discussed before.
Data availability statement
The raw data supporting the conclusions of this article will be made available by the authors, without undue reservation.
Author contributions
MY and LG contributed to conception and design of the study. MY and LQ processed research vessel Dong Fang Hong II cruises data. MY, LG, LQ and KZ maintained the shipboard instruments and collected all the datasets. MY wrote the first draft of the manuscript, LG reviewed and edited the manuscript. All authors contributed to manuscript revision, read, and approved the submitted version.
Funding
The research was supported by National Key R&D Program of China (No. 2022YFC3104900/2022YFC3104905), Hainan Provincial Natural Science Foundation of China (No. 122CXTD519).
Acknowledgments
The authors would like to thank the crews of the research vessel Dong Fang Hong II, the Research Vessel Center of Ocean University of China and all the colleagues who worked with us on the maintenance of the instruments.
Conflict of interest
The authors declare that the research was conducted in the absence of any commercial or financial relationships that could be construed as a potential conflict of interest.
Publisher’s note
All claims expressed in this article are solely those of the authors and do not necessarily represent those of their affiliated organizations, or those of the publisher, the editors and the reviewers. Any product that may be evaluated in this article, or claim that may be made by its manufacturer, is not guaranteed or endorsed by the publisher.
References
Akella S., Todling R., Suarez M. (2017). Assimilation for skin SST in the NASA GEOS atmospheric data assimilation system. Q. J. R. Meteorol. Soc 143 (703), 1032–1046. doi: 10.1002/qj.2988
Alappattu D. P., Wang Q., Yamaguchi R., Lind R. J., Reynolds M., Christman A. J. (2017). Warm layer and cool skin corrections for bulk water temperature measurements for air-sea interaction studies. J. Geophys. Res.: Oceans 122 (8), 6470–6481. doi: 10.1002/2017JC012688
Beggs H. M., Verein R., Paltoglou G., Kippo H., Underwood M. (2012). Enhancing ship of opportunity sea surface temperature observations in the Australian region. J. Operational Oceanography 5 (1), 59–73. doi: 10.1080/1755876X.2012.11020132
Donlon C. J., Minnett P. J., Gentemann C., Nightingale T. J., Barton I. J., Ward B., et al. (2002). Toward improved validation of satellite sea surface skin temperature measurements for climate research. J. Climate 15 (4), 353–369. doi: 10.1175/1520-0442(2002)015<0353:TIVOSS>2.0.CO;2
Donlon C. J., Nightingale T., Fiedler L., Fisher G., Baldwin D., Robinson I. S. (1999). The calibration and intercalibration of sea-going infrared radiometer systems using a low cost blackbody cavity. J. Atmos. Oceanic Technol. 16 (9), 1183–1197. doi: 10.1175/1520-0426(1999)016<1183:TCAIOS>2.0.CO;2
Donlon C. J., Robinson I., Casey K. S., Vazquez-Cuervo J., Armstrong E., Arino O., et al. (2007). The global ocean data assimilation experiment high-resolution sea surface temperature pilot project. Bull. Amer. Meteor. Soc 88 (8), 1197–1214. doi: 10.1175/BAMS-88-8-1197
Donlon C. J., Robinson I. S., Wimmer W., Fisher G., Reynolds M., Edwards R., et al. (2008). An infrared sea surface temperature autonomous radiometer (ISAR) for deployment aboard volunteer observing ships (VOS). J. Atmos. Oceanic Technol. 25 (1), 93–113. doi: 10.1175/2007JTECHO505.1
Edson J. B., Jampana V., Weller R. A., Bigorre S. P., Plueddemann A. J., Fairall C. W., et al. (2013). On the exchange of momentum over the open ocean. J. Phys. Oceanogr. 43 (8), 1589–1610. doi: 10.1175/JPO-D-12-0173.1
Fairall C. W., Bradley E. F., Godfrey J. S., Wick G. A., Edson J. B., Young G. S. (1996). Cool-skin and warm-layer effects on sea surface temperature. J. Geophys. Res. 101 (C1), 1295–1308. doi: 10.1029/95JC03190
Fairall C. W., Bradley E. F., Hare J. E., Grachev A. A., Edson J. B. (2003). Bulk parameterization of air–sea fluxes: Updates and verification for the COARE algorithm. J. Climate 16 (4), 571–591. doi: 10.1175/1520-0442(2003)016<0571:BPOASF>2.0.CO;2
Gentemann C. L., Donlon C. J., Stuart-Menteth A., Wentz F. J. (2003). Diurnal signals in satellite sea surface temperature measurements. Geophys. Res. Lett. 30 (3), 1140–1143. doi: 10.1029/2002gl016291
Gentemann C. L., Minnett P. J. (2008). Radiometric measurements of ocean surface thermal variability. J. Geophys. Res.: Oceans 113 (C8), C08017. doi: 10.1029/2007JC004540
Gentemann C. L., Minnett P. J., Ward B. (2009). Profiles of ocean surface heating (POSH): A new model of upper ocean diurnal warming. J. Geophys. Res.: Oceans 114 (C7), C07017. doi: 10.1029/2008JC004825
Jessup A. T., Branch R. (2008). Integrated ocean skin and bulk temperature measurements using the calibrated infrared in situ measurement system (CIRIMS) and through-hull ports. J. Atmos. Oceanic Technol. 25 (4), 579–597. doi: 10.1175/2007JTECHO479.1
Jia C., Minnett P. J., Luo B. (2023). Significant diurnal warming events observed by Saildrone at high latitudes. J. Geophys. Res.: Oceans 128 (1), e2022JC019368. doi: 10.1029/2022JC019368
Kawai Y., Wada A. (2007). Diurnal sea surface temperature variation and its impact on the atmosphere and ocean: A review. J. Oceanogr. 63 (5), 721–744. doi: 10.1007/s10872-007-0063-0
Luo B., Minnett P. J., Szczodrak M., Akella S. (2022). Regional and seasonal variability of the oceanic thermal skin effect. J. Geophys. Res.: Oceans 127, e2022JC018465. doi: 10.1029/2022JC018465
Minnett P. J., Alvera-Azcárate A., Chin T. M., Corlett G. K., Gentemann C. L., Karagali I., et al. (2019). Half a century of satellite remote sensing of sea-surface temperature. Remote Sens. Environ. 233, 111366. doi: 10.1016/j.rse.2019.111366
Minnett P. J., Corlett G. K. (2012). A pathway to generating climate data records of sea-surface temperature from satellite measurements. Deep Sea Res. Part II 77-80, 44–51. doi: 10.1016/j.dsr2.2012.04.003
Minnett P. J., Knuteson R. O., Best F. A., Osborne B. J., Hanafin J. A., Brown O. B. (2001). The marine-atmospheric emitted radiance interferometer: A high-accuracy, seagoing infrared spectroradiometer. J. Atmos. Oceanic Technol. 18 (6), 994–1013. doi: 10.1175/1520-0426(2001)018<0994:TMAERI>2.0.CO;2
Minnett P. J., Smith M., Ward B. (2011). Measurements of the oceanic thermal skin effect. Deep Sea Res. Part II 58 (6), 861–868. doi: 10.1016/j.dsr2.2010.10.024
Saunders P. M. (1967). The temperature at the ocean-air interface. J. Atmos. Sci. 24 (3), 269–273. doi: 10.1175/1520-0469(1967)024<0269:TTATOA>2.0.CO;2
Theocharous E., Fox N. P., Barker-Snook I., Niclòs R., Santos V. G., Minnett P. J., et al. (2019). The 2016 CEOS infrared radiometer comparison: Part II: Laboratory comparison of radiation thermometers. J. Atmos. Oceanic Technol. 36 (6), 1079–1092. doi: 10.1175/JTECH-D-18-0032.1
Webster P. J., Lukas R. (1992). TOGA COARE: The coupled ocean–atmosphere response experiment. Bull. Amer. Meteor. Soc 73 (9), 1377–1416. doi: 10.1175/1520-0477(1992)073<1377:TCTCOR>2.0.CO;2
Wick G. A., Ohlmann J. C., Fairall C. W., Jessup A. T. (2005). Improved oceanic cool-skin corrections using a refined solar penetration model. J. Phys. Oceanogr. 35 (11), 1986–1996. doi: 10.1175/JPO2803.1
Wimmer W., Robinson I. S. (2016). The ISAR instrument uncertainty model. J. Atmos. Oceanic Technol. 33 (11), 2415–2433. doi: 10.1175/JTECH-D-16-0096.1
Wimmer W., Robinson I. S., Donlon C. J. (2012). Long-term validation of AATSR SST data products using shipborne radiometry in the Bay of Biscay and English Channel. Remote Sens. Environ. 116, 17–31. doi: 10.1016/j.rse.2011.03.022
Yang M., Guan L., Zhang K., Qu L. (2018). Comparison of SUOMI NPP VIIRS SST product with Shipboard skin SST measurements in the Northwest Pacific 2018 IEEE International Geoscience and Remote Sensing Symposium (IGARSS); 2018 July 22-27; Valencia, Spain. p. 5621–5624. doi: 10.1109/IGARSS.2018.8517642
Zhang H., Beggs H., Ignatov A., Babanin A. V. (2020). Nighttime cool skin effect observed from Infrared SST Autonomous Radiometer (ISAR) and depth temperatures. J. Atmos. Oceanic Technol. 37 (1), 33–46. doi: 10.1175/JTECH-D-19-0161.1
Keywords: sea surface temperature (SST), infrared radiometer, cool skin effect, shipboard measurements, Northwest Pacific
Citation: Yang M, Guan L, Qu L and Zhang K (2023) Cool skin effect and warm skin phenomenon observed by shipboard radiometer in the Northwest Pacific. Front. Mar. Sci. 10:1212974. doi: 10.3389/fmars.2023.1212974
Received: 27 April 2023; Accepted: 12 July 2023;
Published: 26 July 2023.
Edited by:
Dongxiao Zhang, University of Washington and NOAA, United StatesReviewed by:
Jayanarayanan Kuttippurath, Indian Institute of Technology Kharagpur, IndiaBingkun Luo, Harvard University, United States
Copyright © 2023 Yang, Guan, Qu and Zhang. This is an open-access article distributed under the terms of the Creative Commons Attribution License (CC BY). The use, distribution or reproduction in other forums is permitted, provided the original author(s) and the copyright owner(s) are credited and that the original publication in this journal is cited, in accordance with accepted academic practice. No use, distribution or reproduction is permitted which does not comply with these terms.
*Correspondence: Lei Guan, bGVpZ3VhbkBvdWMuZWR1LmNu