 Shenming Zhu1
 Li Shi
- 1Zhejiang Qiantang River Basin Centre, Hangzhou, Zhejiang, China
- 2Huadong Engineering Corporation Limited, Hangzhou, Zhejiang, China
- 3College of Civil Engineering, Zhejiang University of Technology, Hangzhou, Zhejiang, China
To investigate the vibrational impact of vehicular traffic on the ancient Qiantang River seawall, on-site measurements of the seawall’s pulsation and forced vibrations under different vehicle speeds and axle loads were conducted. The acquired data were analyzed in the time domain, frequency domain, and 1/3 octave bands, revealing the time-frequency vibrational characteristics of the ancient seawall structure. The results indicate that the characteristic frequencies of the ancient seawall are 3 Hz and 10 Hz, with the primary frequency band of the structural vibrations induced by vehicular traffic ranging from 0 to 30 Hz. Vehicle traffic primarily caused vertical vibrations in the seawall structure, with along-dike horizontal vibrations being significantly higher than cross-dike vibrations. Based on the measurement results, an empirical relationship between the peak vibration velocity of the ancient seawall and variations in vehicle speed and axle load was established. It was found that, compared to axle load, increased vehicle speed had a more pronounced amplification effect on the structural vibrations of the ancient seawall. To ensure the vibrational safety of the ancient seawall relics, maximum vehicle speeds for different loading conditions of tri-axle trucks were provided based on vibration limits: for an axle load of 10 t, speeds should be below 34 km/h; for 11.52 t, below 24 km/h; for 13.04 t, below 20 km/h; and for 14.56 t, below 15 km/h.
1 Introduction
The ancient Qiantang River seawall, located on the northern bank of the Qiantang River estuary, serves as a crucial barrier against natural disasters such as tidal bores, typhoon storm surges, and floods. Initially constructed during the Ming and Qing dynasties, the ancient seawall has been designated as a national cultural relic protection unit and is among the few national relics still in service. Given the exceptional historical and cultural value of national cultural relics and the difficulty in restoring them when damaged, both domestic and international standards impose strict protection requirements for these relics. For instance, China’s “Technical specifications for protection of historic buildings against man-made vibration” (GB/T 50452-2008, 2008) prescribes stringent vibration response limits for cultural relics made of different materials and constructed using various masonry techniques. The ancient Qiantang River seawall essentially comprises a stone retaining wall, with block stones laid in layers using glutinous rice mortar and gradually tapering to form a trapezoidal cross-section. Factors such as the non-uniform cross-sectional shape, the staggered masonry technique, and the differences in the material properties of block stones and mortar render the vibrational response of the ancient seawall structure highly complex.
With rapid urban development, existing cultural relics, such as bell towers, pagodas, and temples made of brick and stone structures, inevitably experience vibrational disturbances from nearby traffic (Vogiatzis, 2000; Ma et al., 2016; Alan and Caliskan, 2017), blasting (Pal Roy et al., 2016; Xiong et al., 2020), and construction (Jiang et al., 2012; Fan et al., 2018). External vibration sources can induce vibrational waves within the structures of cultural relics, with the fundamental cause of material deterioration or even structural damage being dynamic strain (γd). However, directly measuring dynamic strain is challenging, and thus current domestic and international cultural relic protection standards often adopt vibration velocity ([v]) as an indirect control indicator (an empirical relationship exists between dynamic strain and vibration velocity: γd≈[v]/c, where c is the vibration wave propagation speed within the cultural relic structure). It is evident that different structural and material types of cultural relics have distinct wave speeds (c), and consequently, different vibration velocity limits ([v]).
In light of the complexity of cultural relic structures and materials, it is difficult to predict the vibration levels of these structures using theoretical formulas when external excitation sources, such as construction vibrations and moving vehicles, are present. Existing research predominantly employs numerical simulations (Zhao et al., 2013; Sadeghi and Esmaeili, 2017; Ma et al., 2018) and on-site measurements (Meng et al., 2009; Hinzen, 2014) to analyze the vibrational impacts of subway trains on ancient city towers (Xin et al., 2019), bell towers (De Angelis et al., 2022), and other brick and stone cultural relic structures. Ma et al., 2011 established a train-track coupling model and a 3D coupled finite element model of the tunnel-soil-structure system to analyze the dynamic responses of monuments at different train speeds, finding that vibrations exceeded the limits when train speeds surpassed 58 km/h. Due to the passage of time and long-term weathering, cultural relics exhibit numerous uncertainties in architectural structure and material properties (Gentile and Saisi, 2007). To ensure the accuracy of brick and stone cultural relic numerical models, these models often require comparison and validation against on-site measurement results (Aras et al., 2011). Li et al., 2021 tested the dynamic responses of a pagoda under the influence of moving train loads and used the measured data to verify the accuracy of the finite element model of pagoda. Crispino, 2001 measured the vibration velocities of historical buildings under the influence of different vehicle types and speeds, using the data to validate the feasibility of the empirical prediction model of Watts (Watts, 1992).
In the field of traffic-induced environmental vibration control, existing researches primarily focused on vibration reduction measured along the propagation path, such as filled trenches (Cai et al., 2021), empty trenches (Yang et al., 2018), pile rows (Cheng et al., 2022), and wave barriers (Chen et al., 2022). Wang et al., 2022 optimized the design parameters of pile row vibration barriers using a 3D finite element model and found through field vibration tests that pile rows can reduce vibrations by approximately 30% to 50%. As the ancient seawall is a cultural relic structure, it is infeasible to construct vibration barriers, such as pile rows, between the road behind the seawall and the ancient seawall itself to protect its structural integrity. Instead, it may be worthwhile to consider controlling vehicle speed and axle load from the vibration source perspective to mitigate the vibrational impact on the ancient seawall structure caused by traffic behind the seawall.
With climate warming and sea-level rise, increasingly frequent and intense tidal bores pose a more severe challenge to the ancient seawall at the Qiantang River estuary. Currently, the ancient Qiantang River seawall is undergoing a upgradation to improve its flood protection from a 50-year recurrence interval to a 100-year recurrence interval. During the renovation period, the inevitable passage of construction vehicles behind the seawall will have a vibrational impact on the ancient seawall, posing a threat to the durability of cultural relic materials and structural safety. In response, this study conducts on-site measurements of the pulsation of the ancient seawall and its vibrational response under different construction vehicle speeds and loads. The time-domain extreme values and frequency-domain analyses of the test results are performed to analyze the characteristic frequencies of the ancient seawall. A quantitative relationship between the ancient seawall’s time-domain vibration extreme values and axle loads and vehicle speeds is established, providing a scientific basis for proposing speed and axle load limits for construction vehicles traveling behind the seawall.
2 Basic information on the ancient seawall
As shown in Figure 1, the ancient seawall is located on the north bank of the Qiantang River estuary and is constructed as a vertical stone retaining wall. The seawall in the test area has a height of 5.44 m and a bottom width of 3.84 m. The seawall consists of 17 layers of masonry stones, narrowing progressively upward into a trapezoidal shape with a top width of 1.44 m. The seawall is constructed using 0.32 m thick and 0.38 m wide stone blocks arranged in a staggered manner with overlapping joints, as shown in Figures 2 and 3. The stones are bonded with glutinous rice mortar.
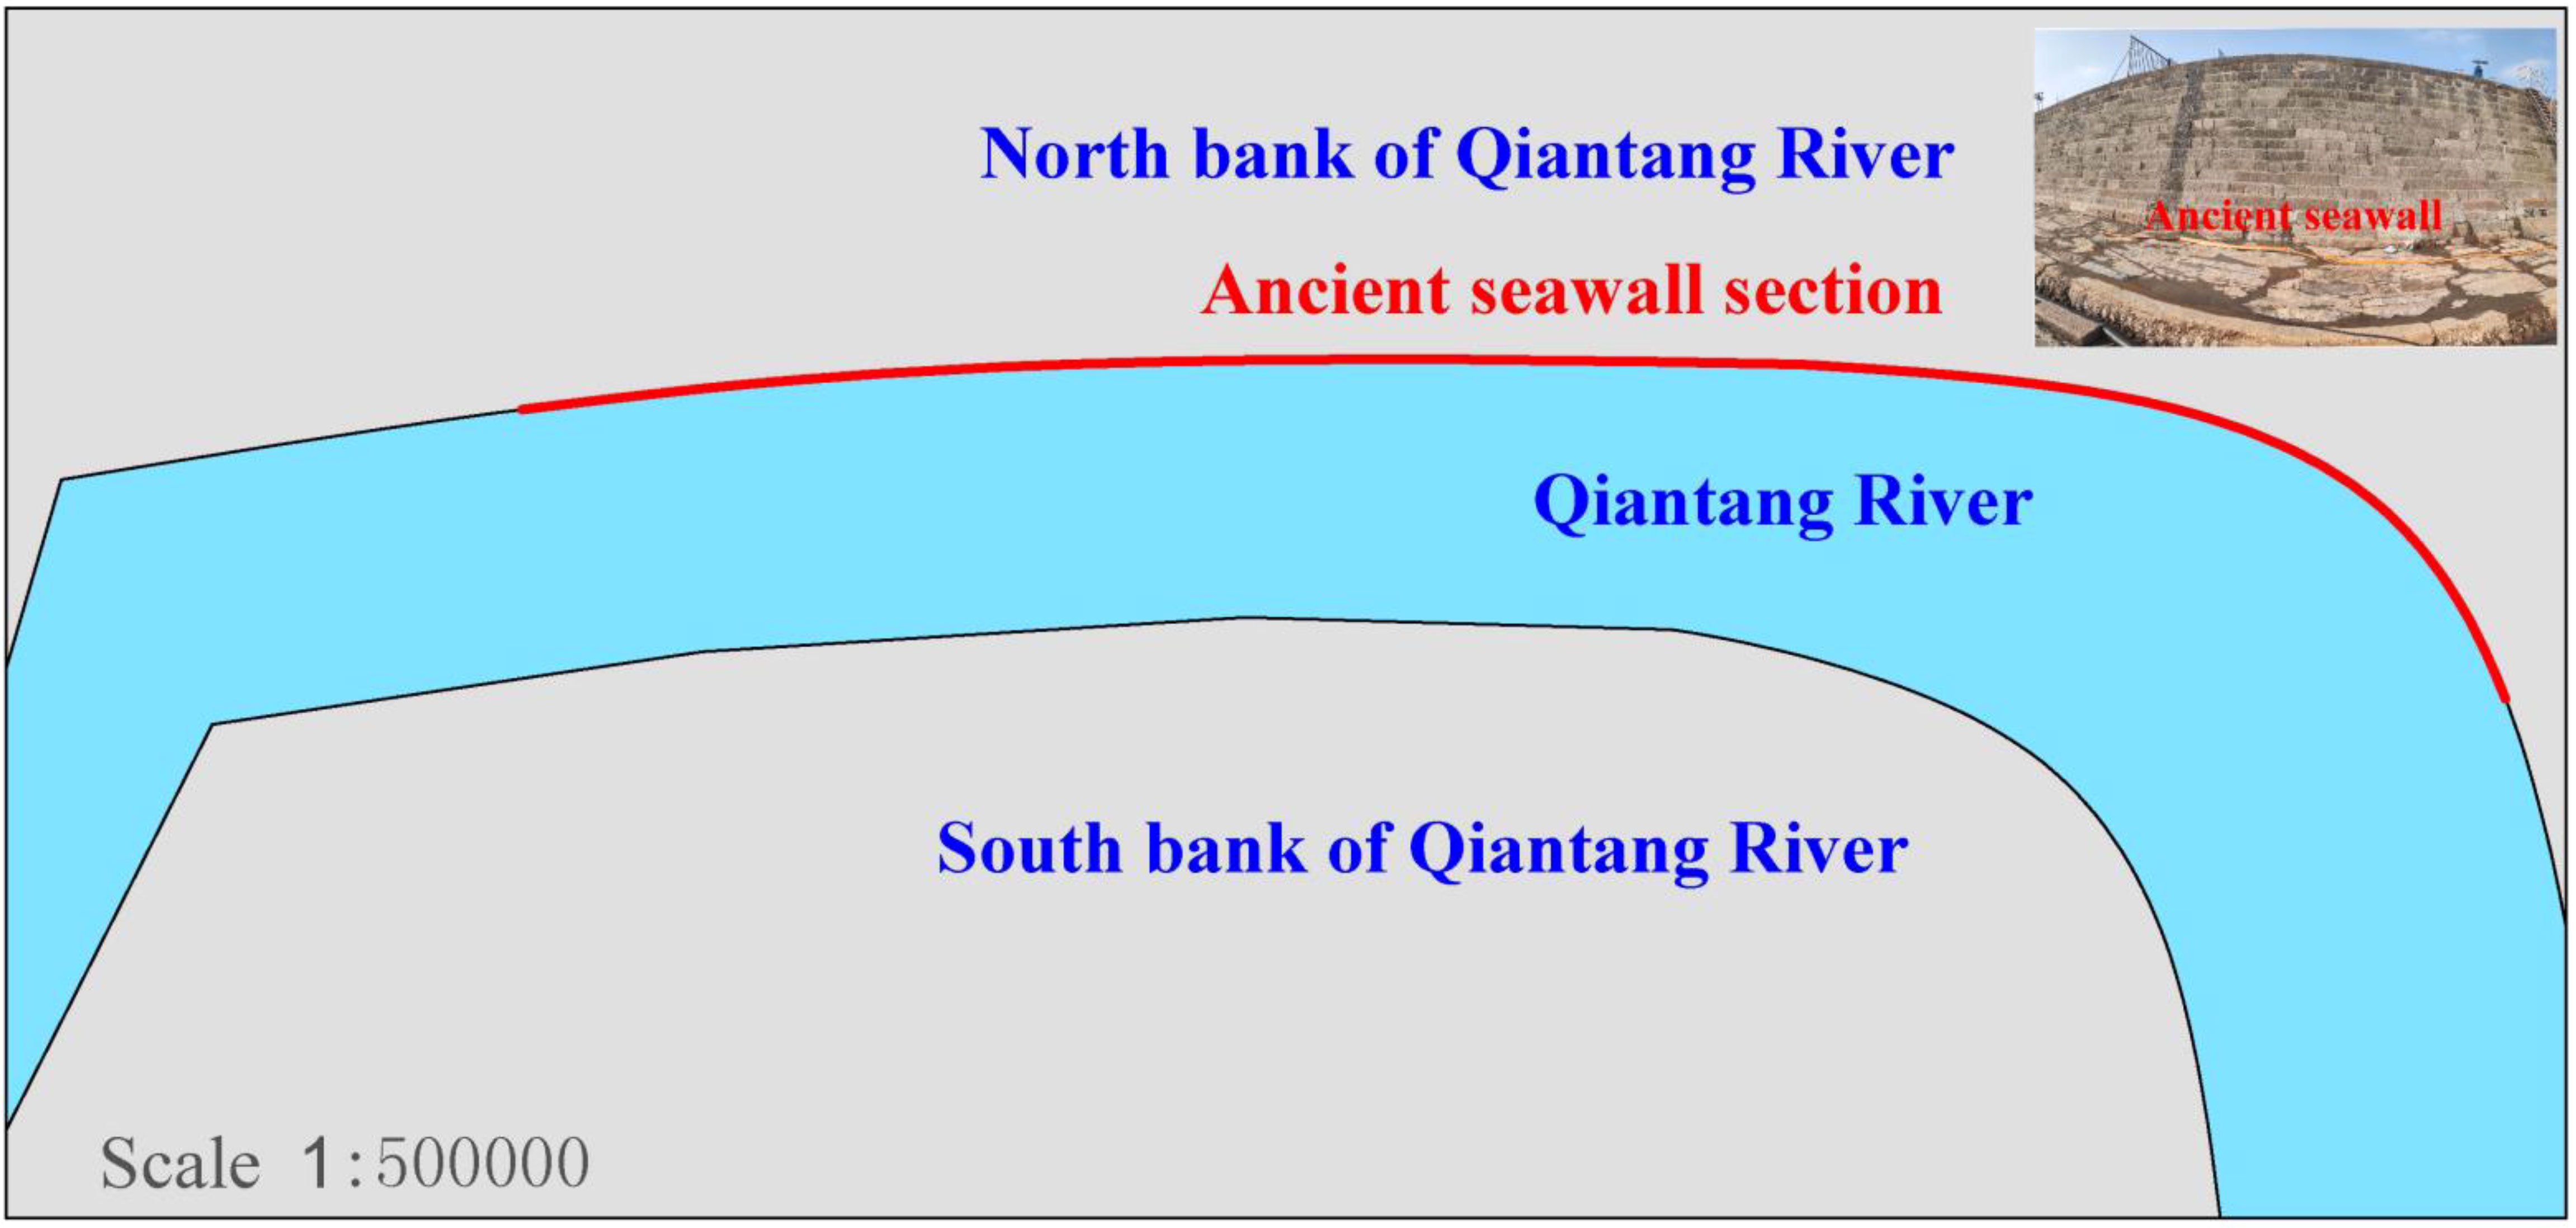
Figure 1 Schematic illustration of the ancient seawall cultural relics at the mouth of the Qiantang River and its north bank.
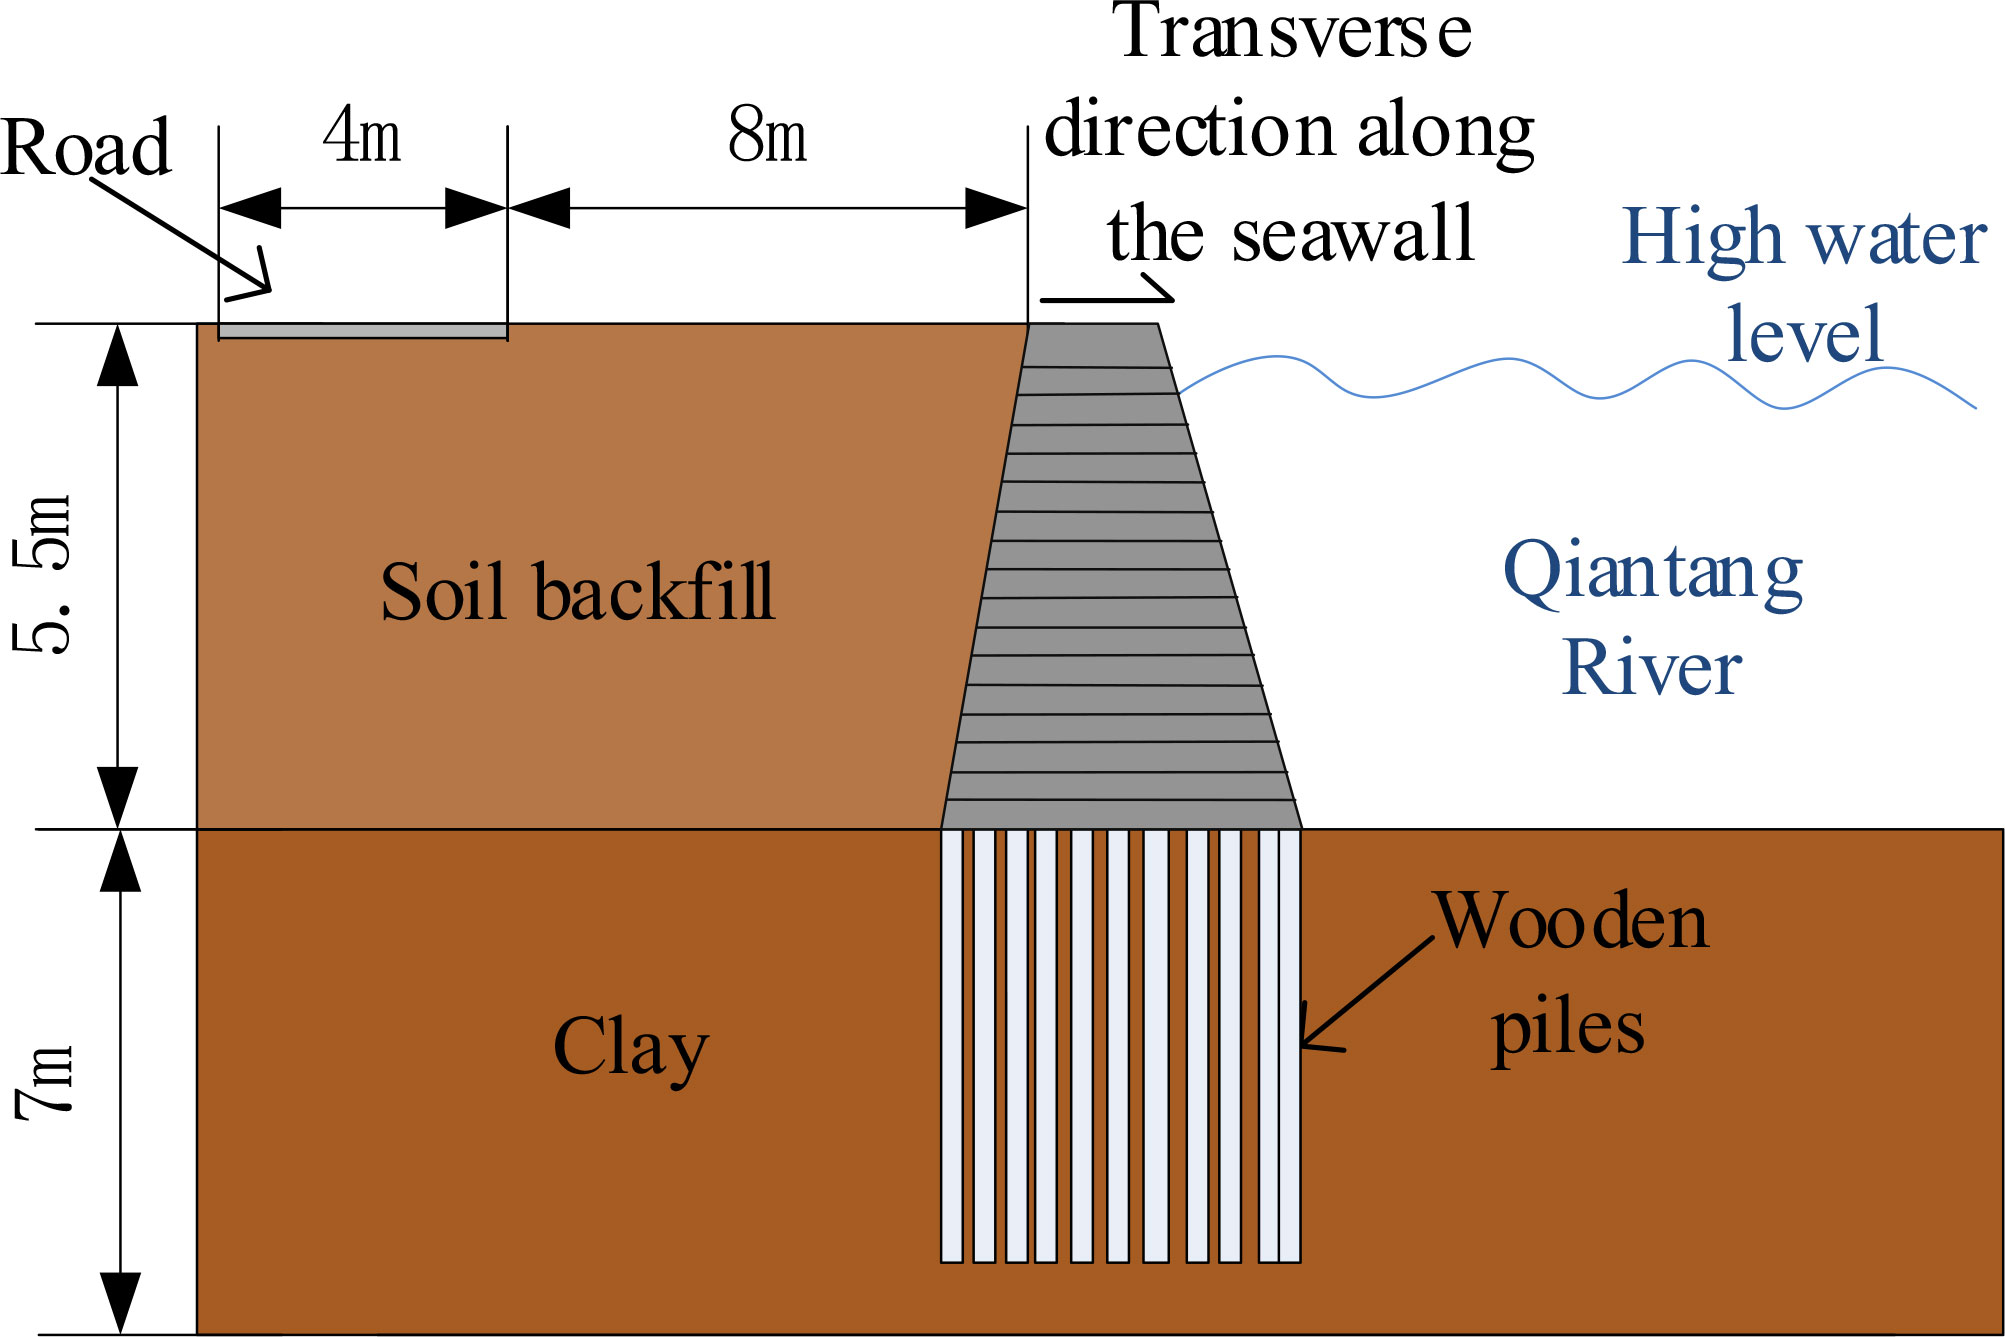
Figure 2 Schematic diagram of the ancient seawall at the Qiantang River estuary and nearby roads.
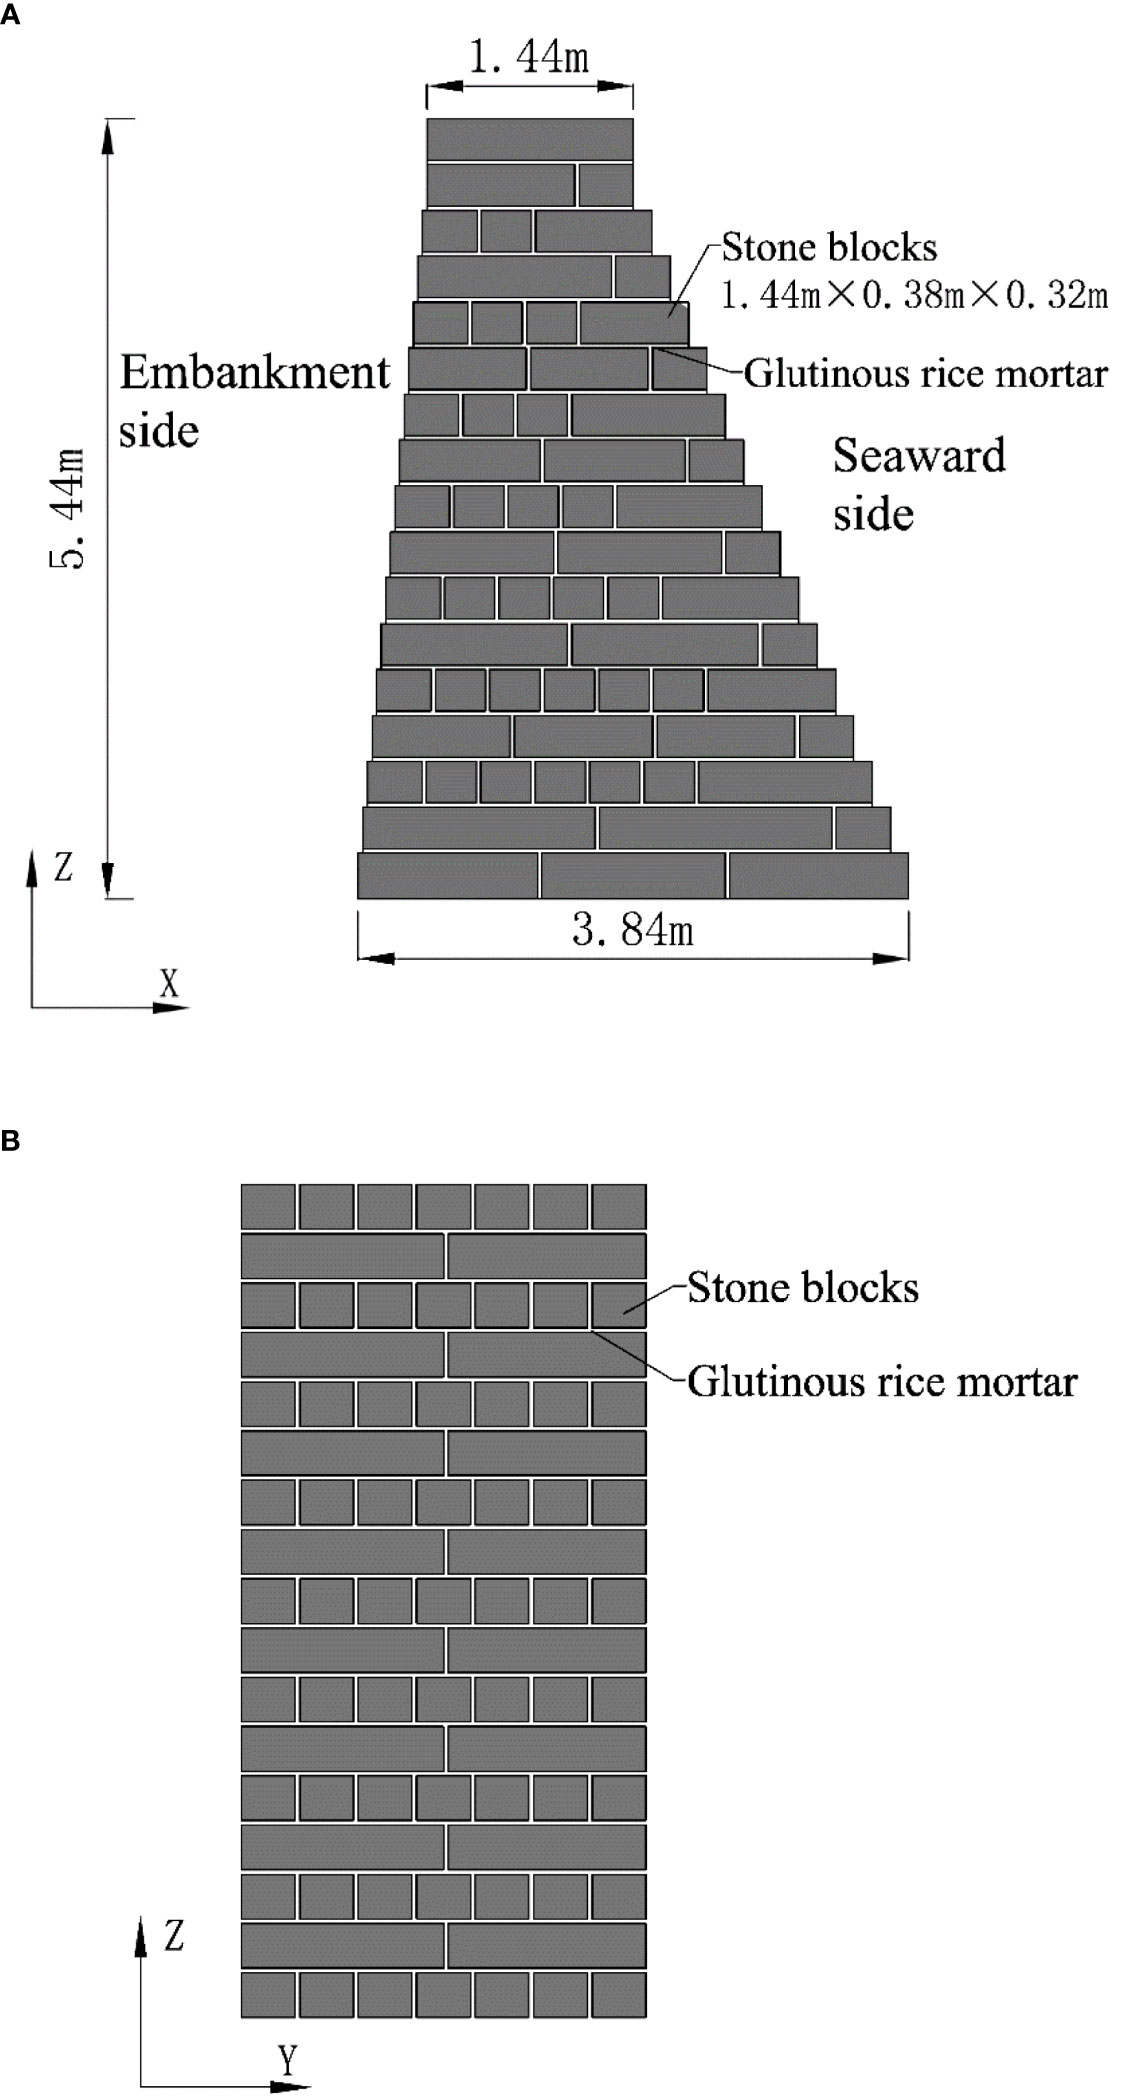
Figure 3 Schematic diagram of the ancient seawall masonry structure. (A) Cross-sectional view along the seawall. (B) Longitudinal sectional view along the seawall.
The foundation of the ancient seawall is clay, with 11 rows of wooden piles arranged within the foundation to support the seawall body. The area behind the seawall consists of soil backfill, with the top surface of the fill level with the top of the seawall. A concrete road is situated 8 meters behind the seawall and has a width of 4 meters. The road typically serves as a scenic patrol route, during construction, it is used as a construction route mainly for tri-axle loader trucks and other construction vehicles. The physical and mechanical properties of the various soil layers are presented in Table 1. For the sake of clarity in subsequent descriptions, we define X as the transverse direction along the seawall, Y as the longitudinal direction along the seawall, and Z as the vertical direction.
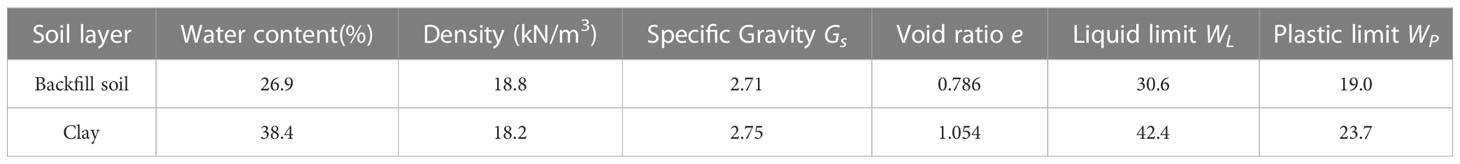
Table 1 Physical and mechanical properties of the soil layers behind the seawall.
3 Test plan
On-site vibration velocity measurements were taken using Donghua 2D001-type magneto-electric vibration sensors, with a sensitivity of 20 V·s/m and a frequency range of 1-100 Hz. Data was collected using the Donghua DH5922D dynamic signal test and analysis system (8 channels), with a sampling frequency of 500 Hz.
3.1 Pulsation test
The ambient vibration test of ancient seawall was conducted during construction breaks, with two horizontal and one vertical vibration velocity sensors placed at the top of the seawall. The sensors arrangement is shown in Figures 4 and 5, and the ambient vibration test duration was 10 minutes.

Figure 4 Schematic diagram of pulsation test vibration sensor arrangement.
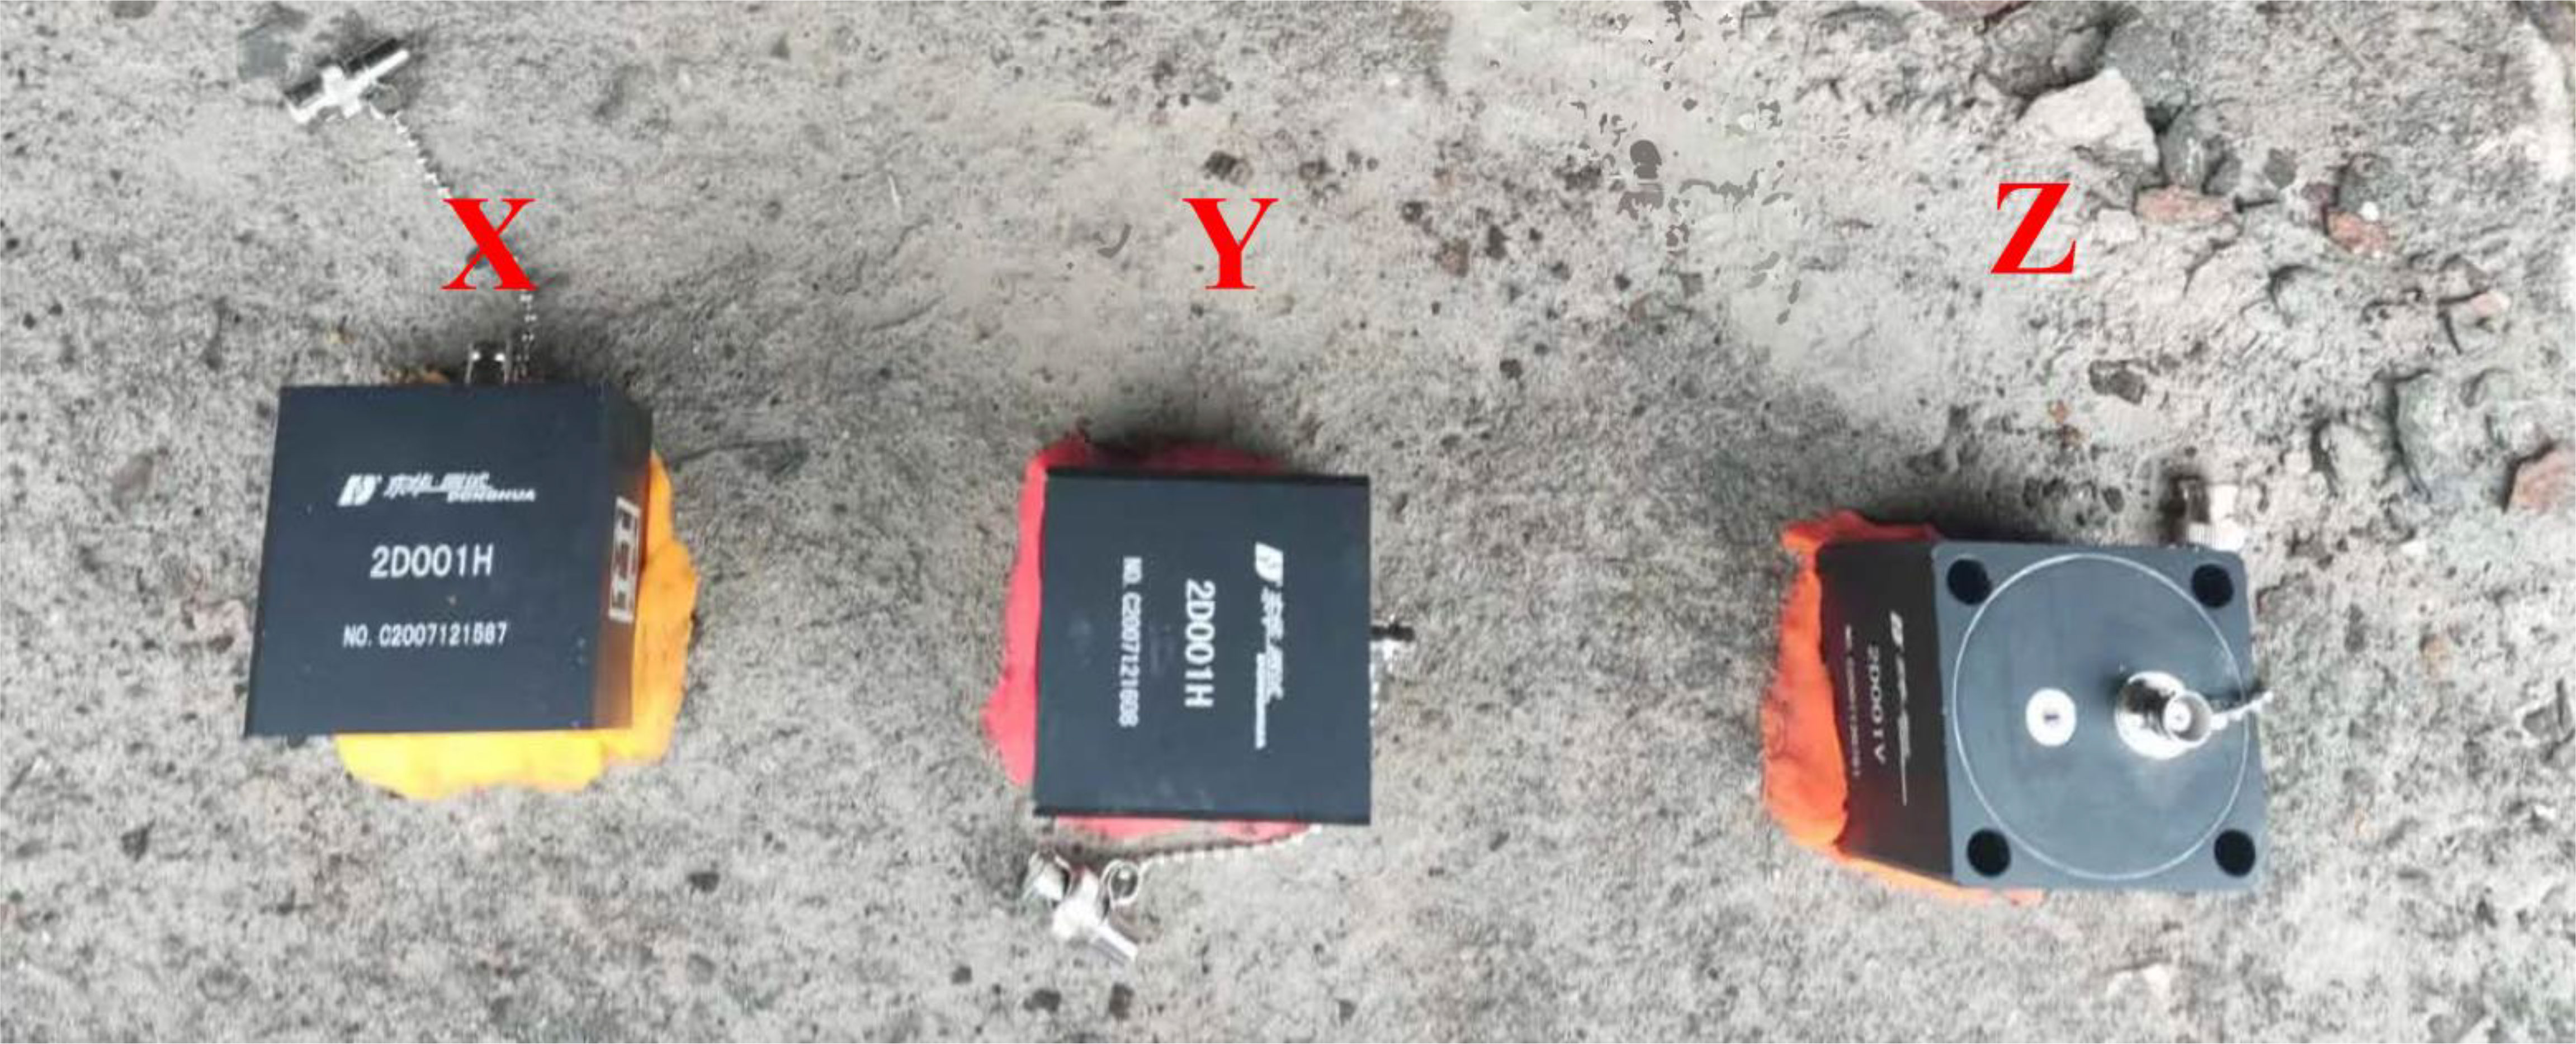
Figure 5 Physical layout of pulsation test vibration sensors.
3.2 Vehicle-induced vibration test
A 100-meter test section was set up on the road behind the seawall, with tri-axle loader trucks controlled to travel at constant speed through the test section. Three-direction vibration velocity sensors were arranged at the midpoint of the road surface and at the top of the seawall, as shown in Figures 6 and 7. Field tests were mainly conducted under two conditions: axle load and vehicle speed.
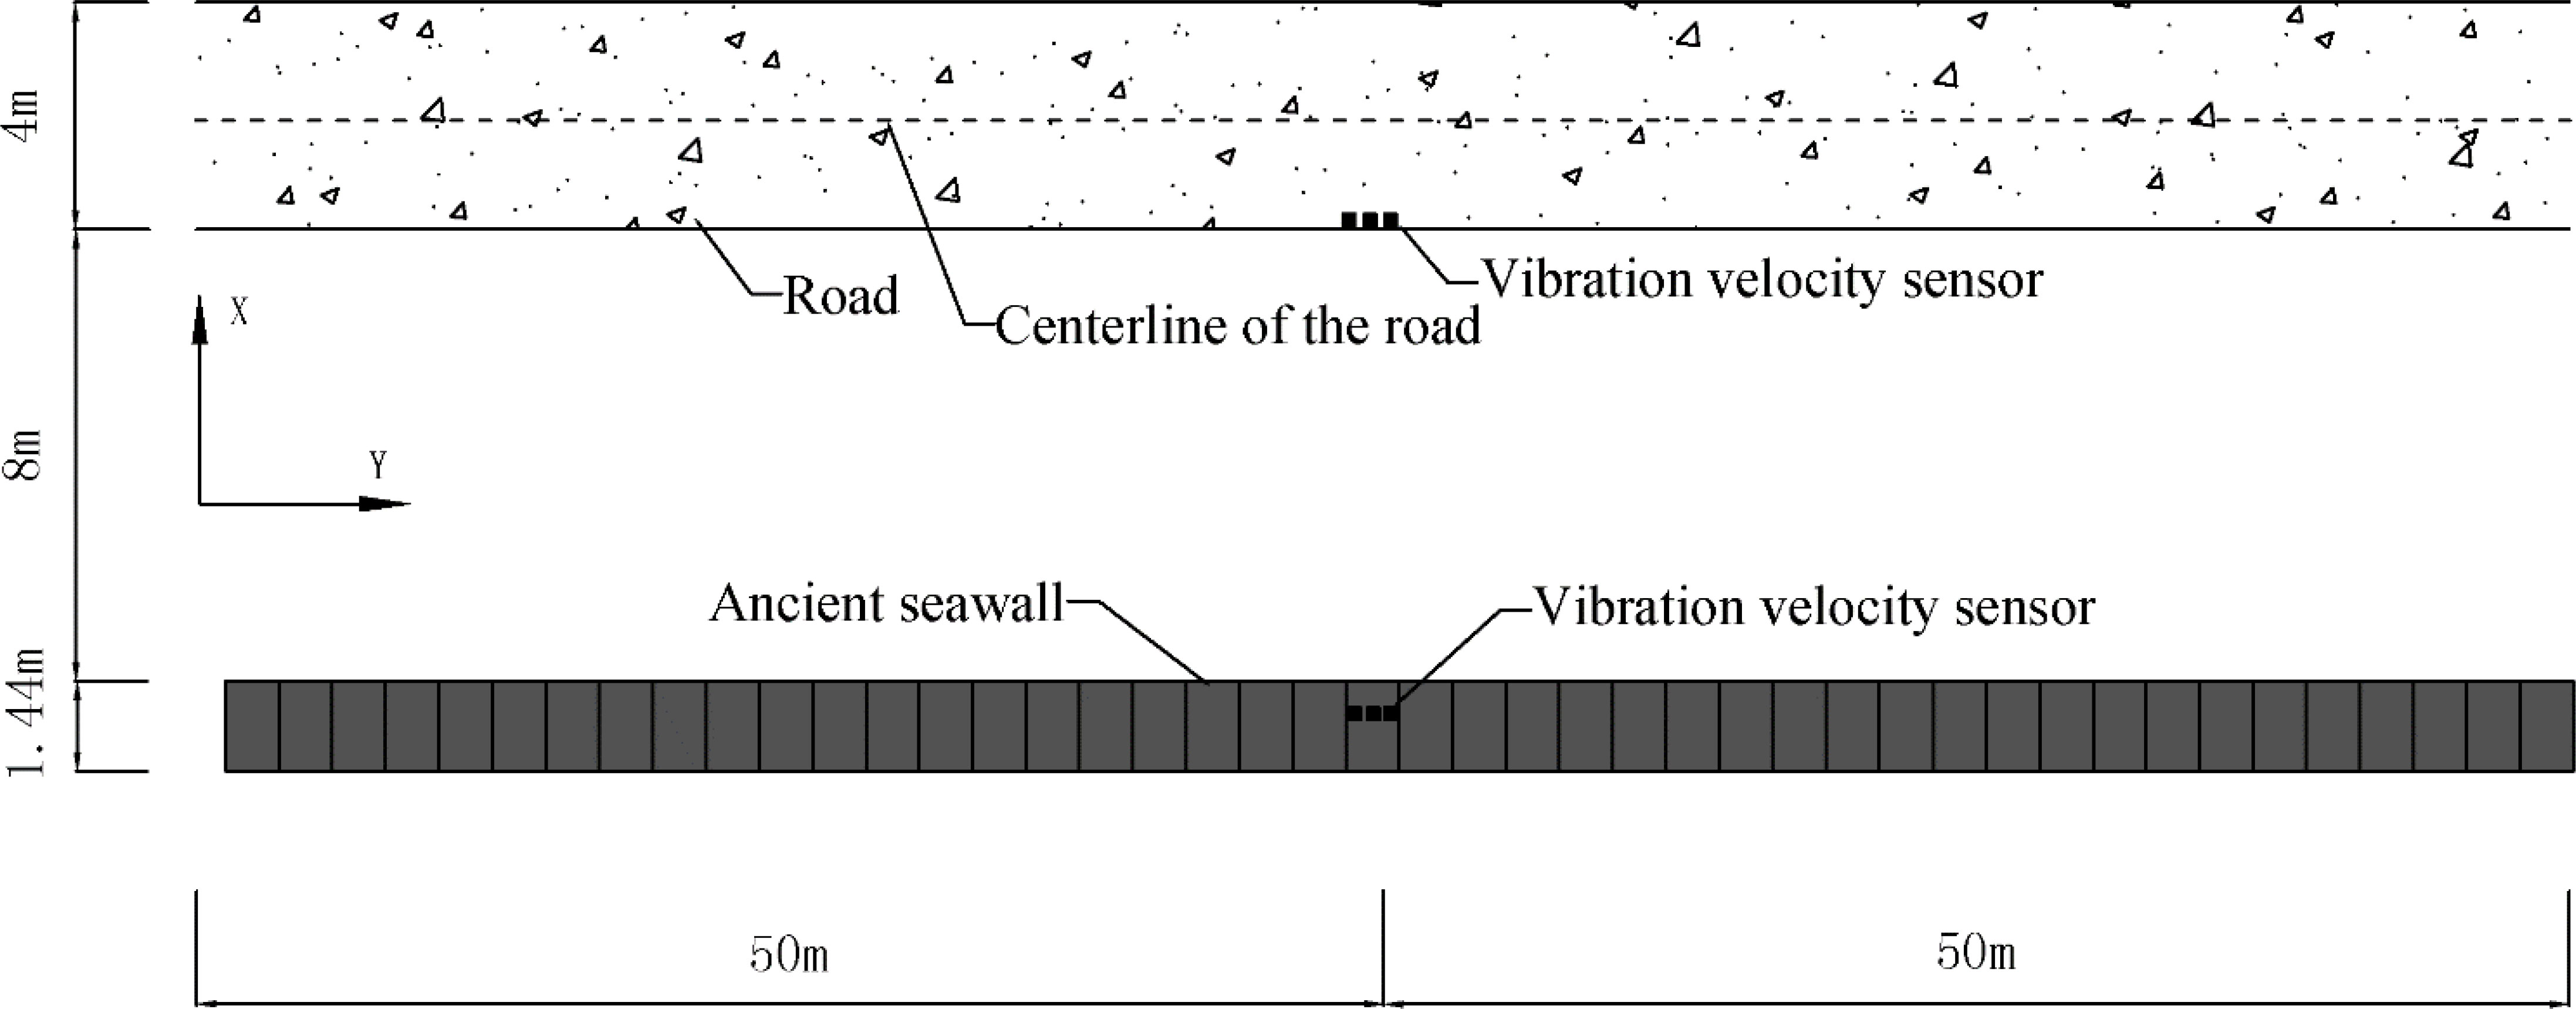
Figure 6 Schematic diagram of the vehicle-induced vibration test section plan.
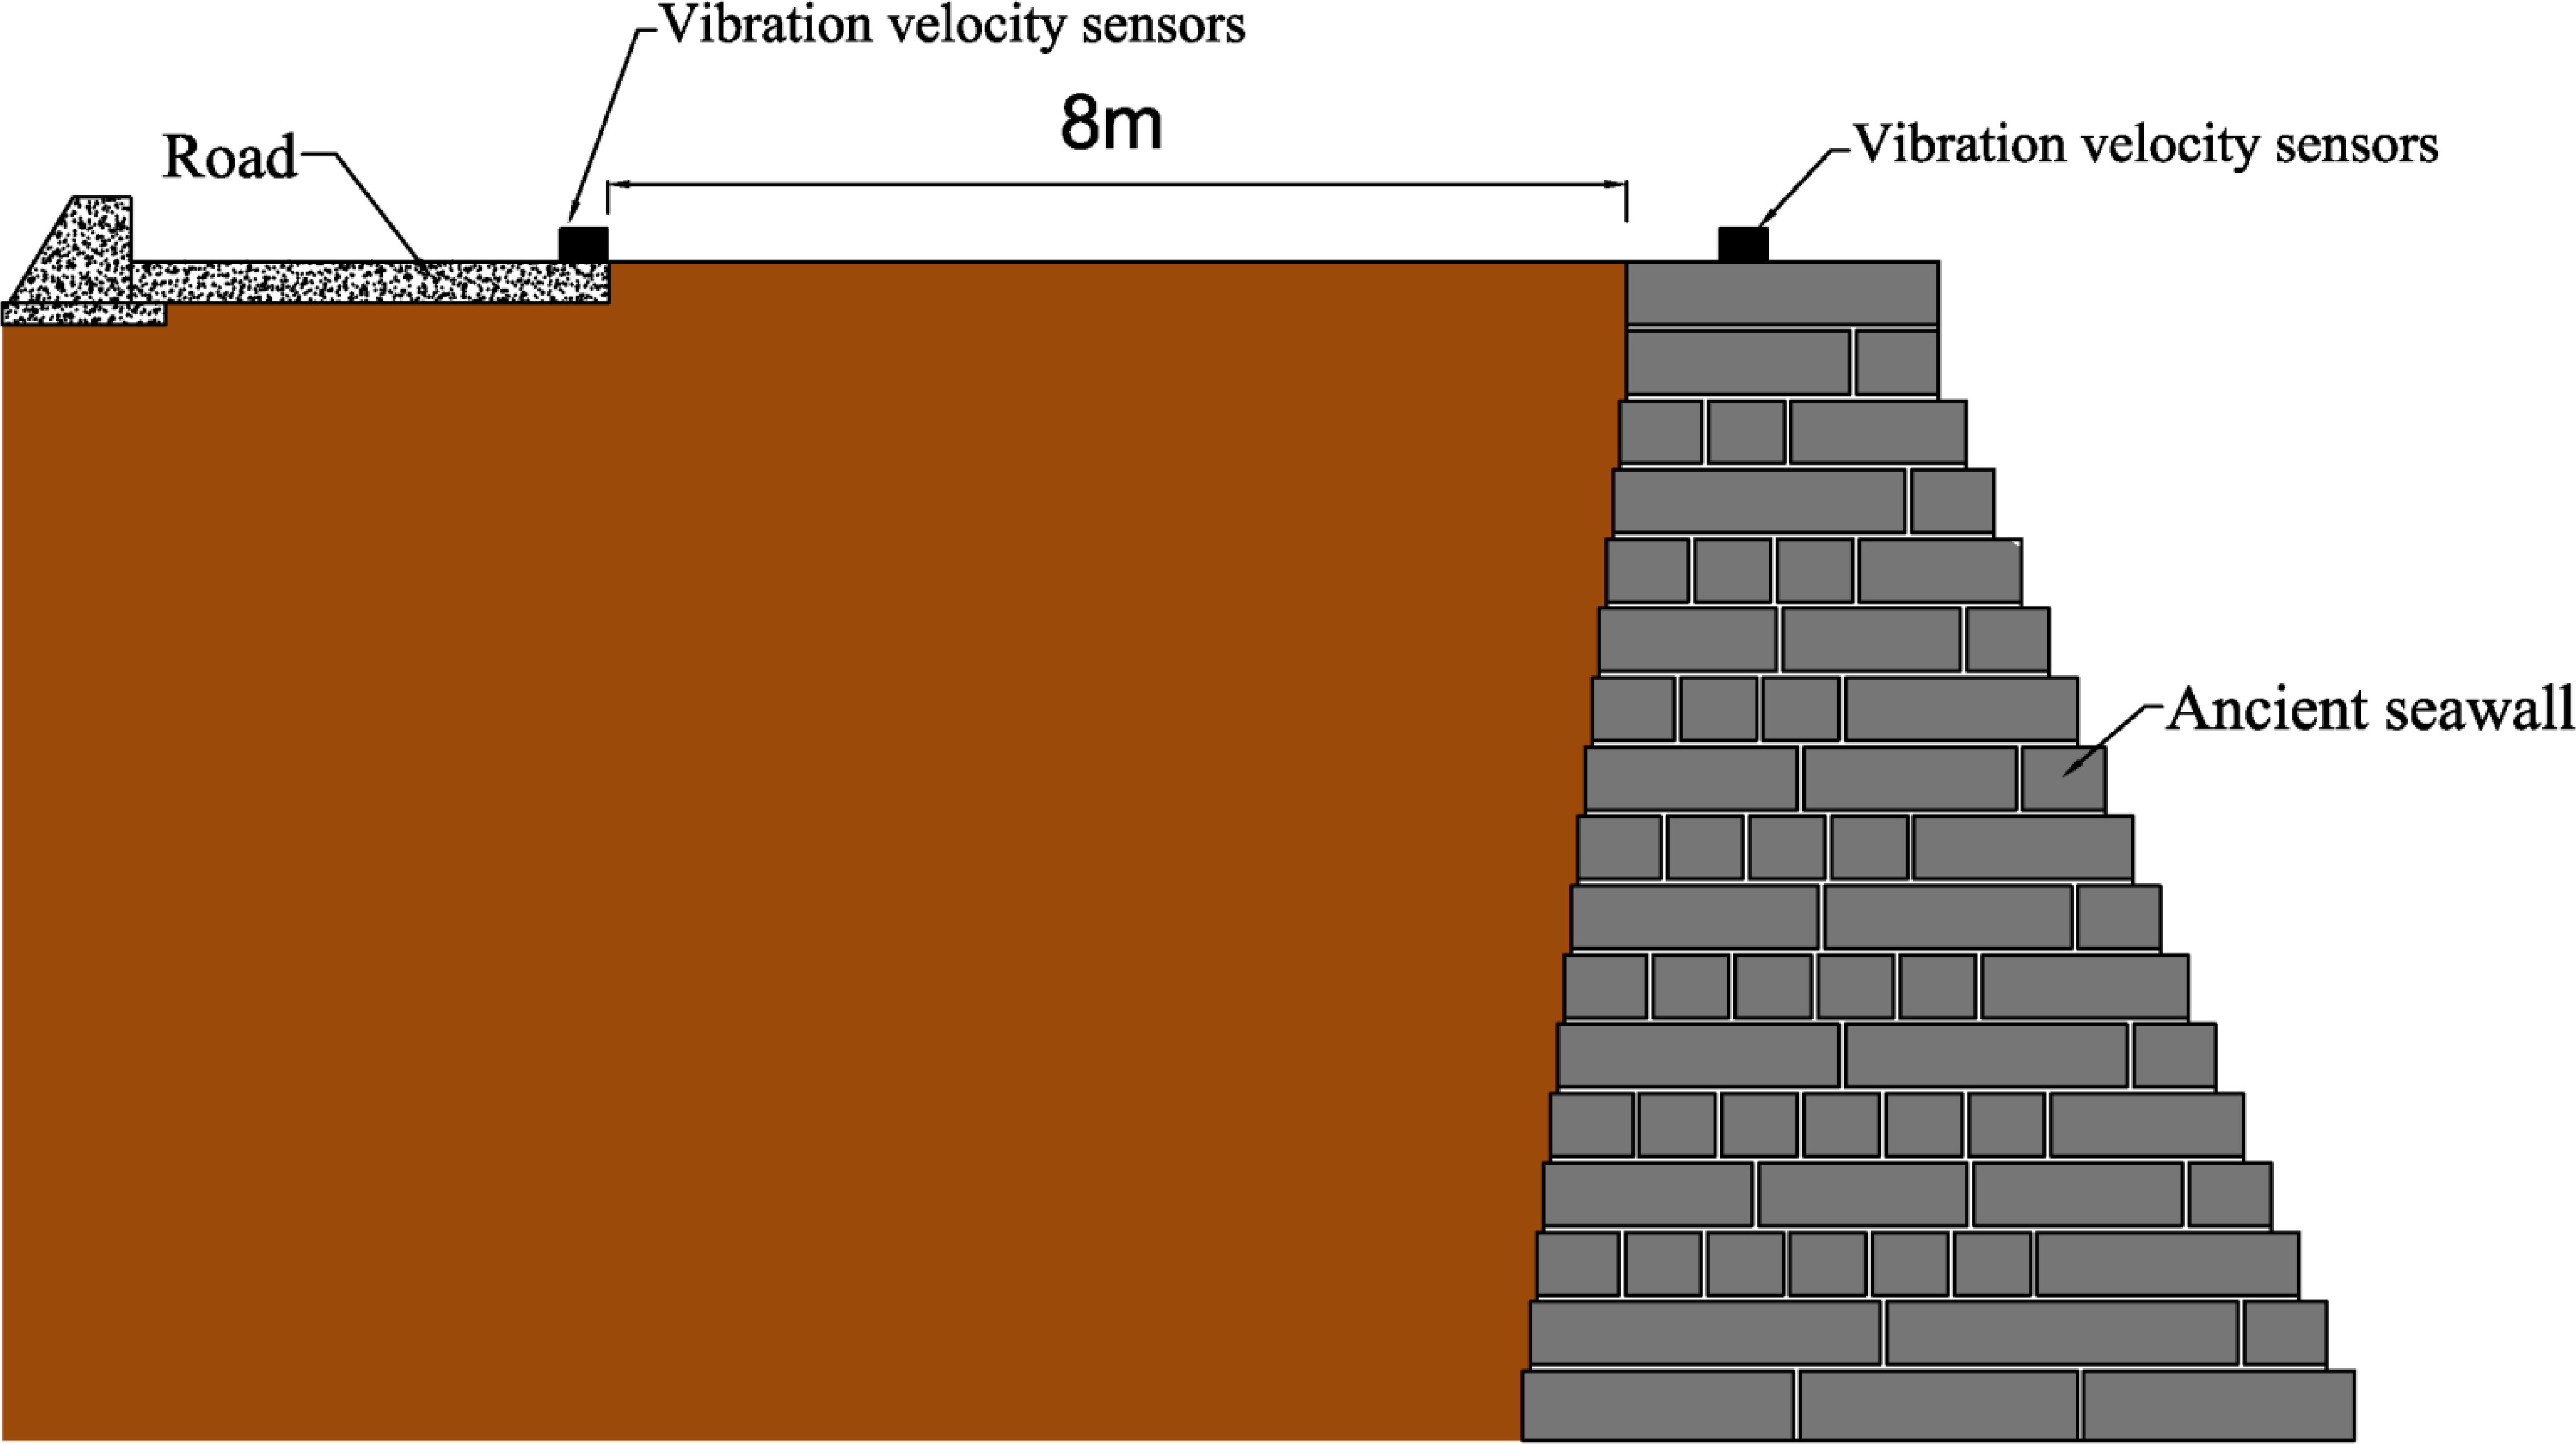
Figure 7 Schematic diagram of vehicle-induced vibration test points.
3.2.1 Different axle load conditions
The main vehicle type traveling on the road behind the seawall is a tri-axle loader truck transporting concrete sheet piles, each weighing approximately 3.8 t. Considering three different conditions: empty vehicle, transporting 1 sheet pile, and transporting 3 sheet piles, the distribution of total vehicle weight and axle load for each condition is shown in Figures 8–10. The vehicle speed was controlled at 20 km/h and the travel route followed the centerline of the road.
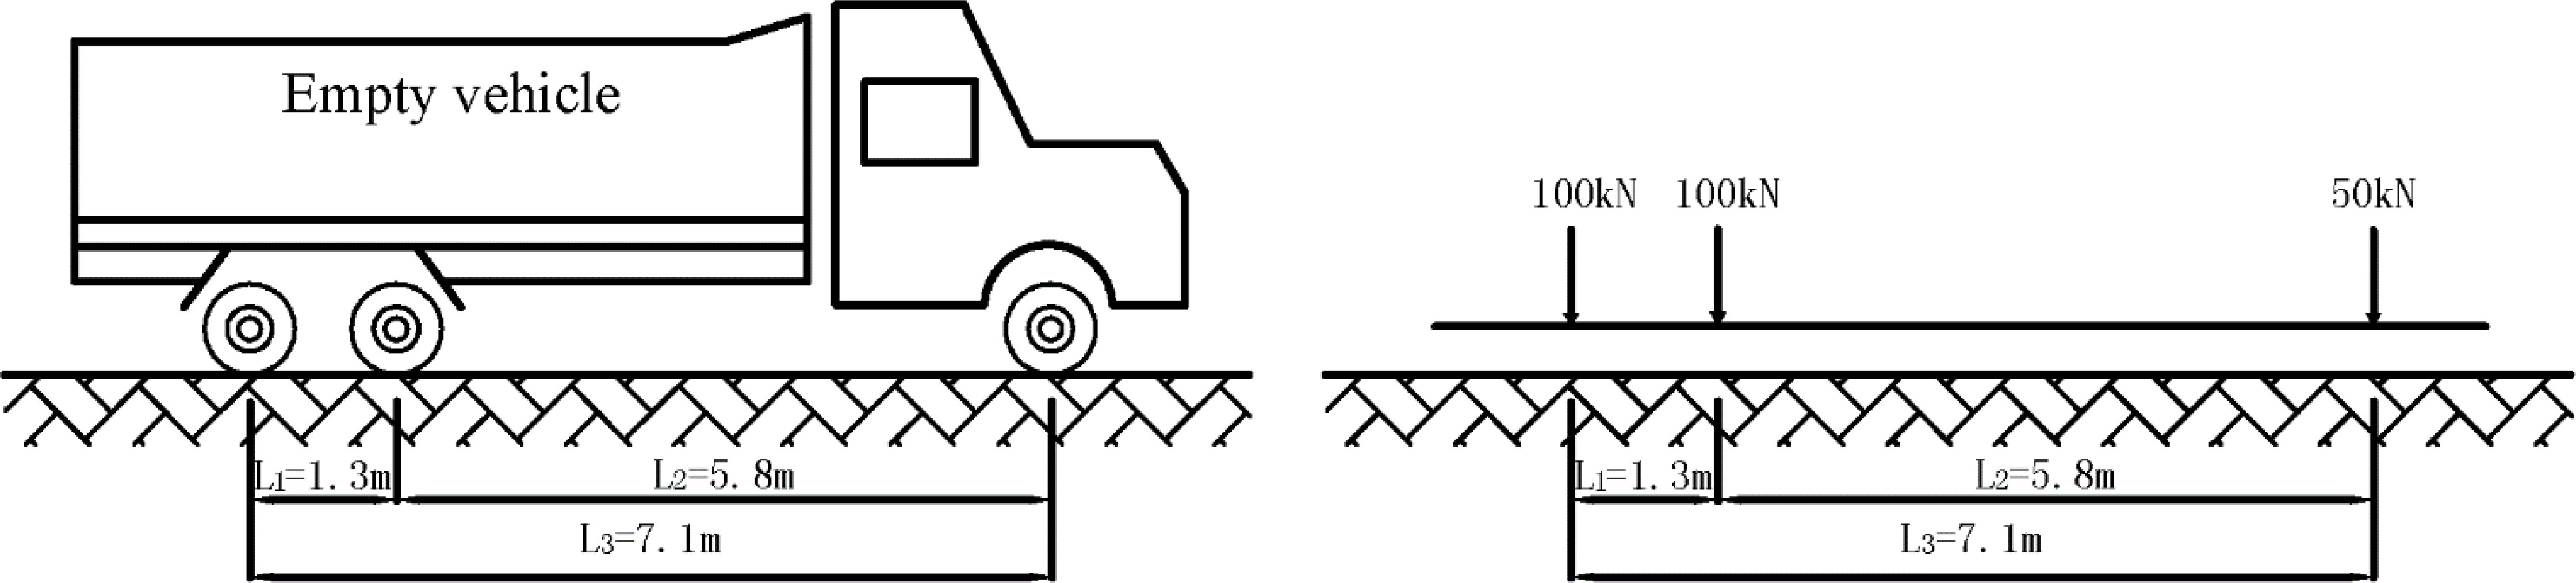
Figure 8 Total weight 25t, axle load 10t.

Figure 9 Total weight 28.8t, axle load 11.52t.
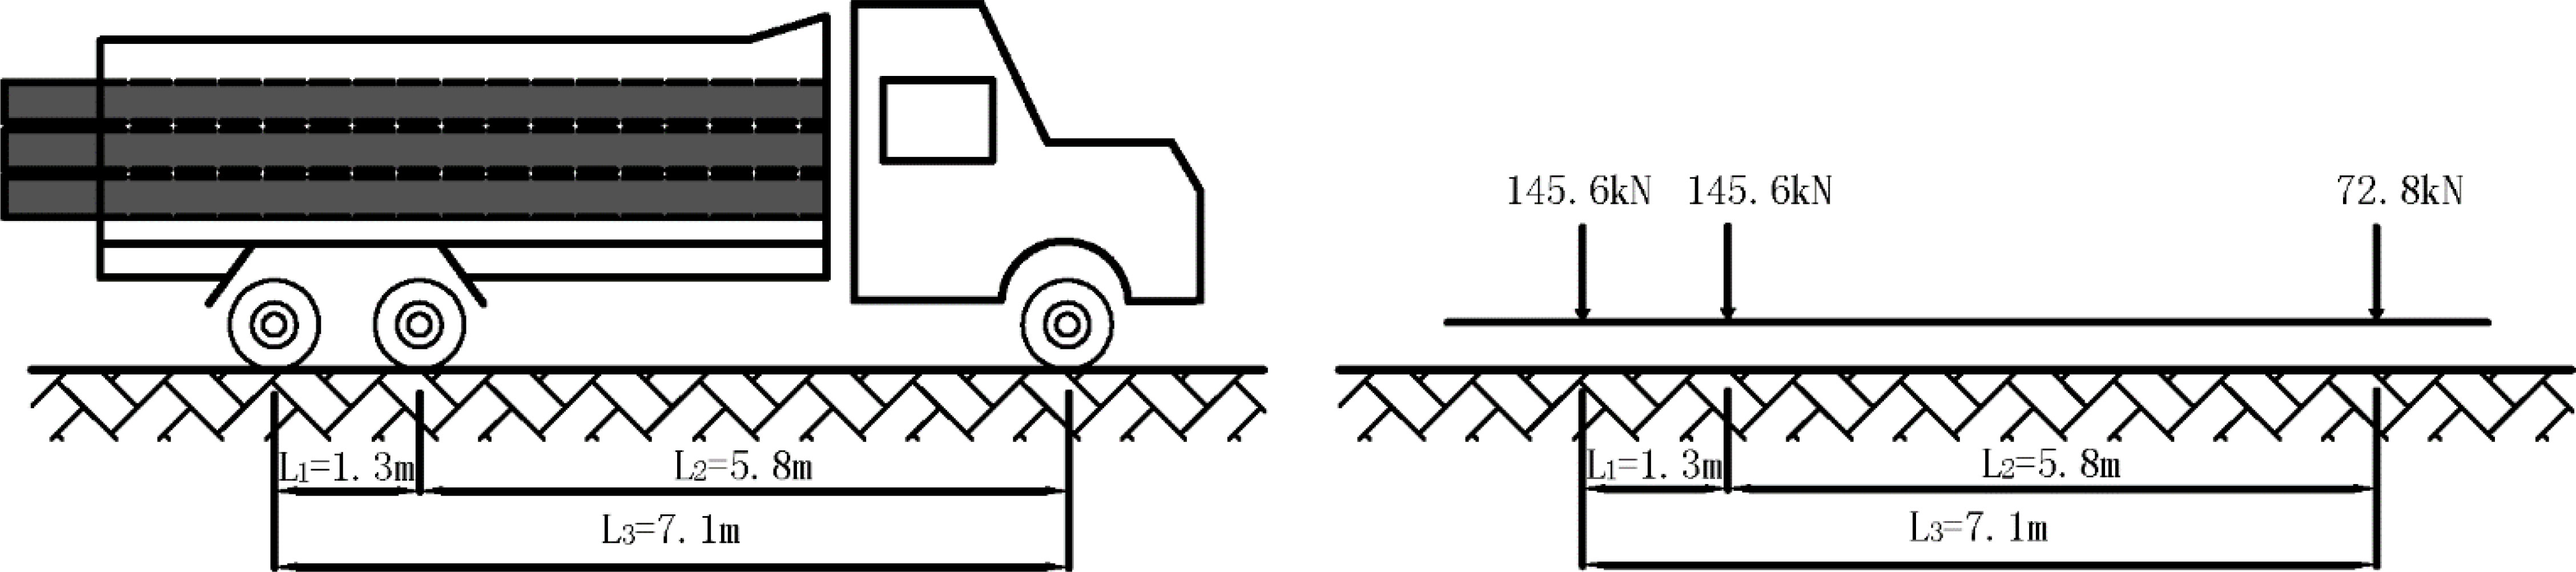
Figure 10 Total weight 36.4t, axle load 14.56t.
3.2.2 Different vehicle speed conditions
An empty tri-axle loader truck was selected, with a total vehicle weight of 25 t and an axle load of 10 t. Vehicle speeds were controlled at 20 km/h, 40 km/h, and 60 km/h, with the travel route of vehicle following the centerline of the road.
4 Test results and analysis
4.1 Time-domain results
4.1.1 Pulsation
The three-directional ambient vibration time history curve of the ancient seawall structure under natural vibration conditions is shown in Figure 11. As seen in the figure, the overall changes in the three-directional vibration velocity of the ancient seawall are relatively stable. The peak values of the three-directional ambient vibration of the ancient seawall structure are shown in Table 2, indicating that the vertical vibration is the most significant, with a peak value of 0.0237 mm/s, which is 1.58 and 1.29 times the horizontal X and Y directions, respectively.
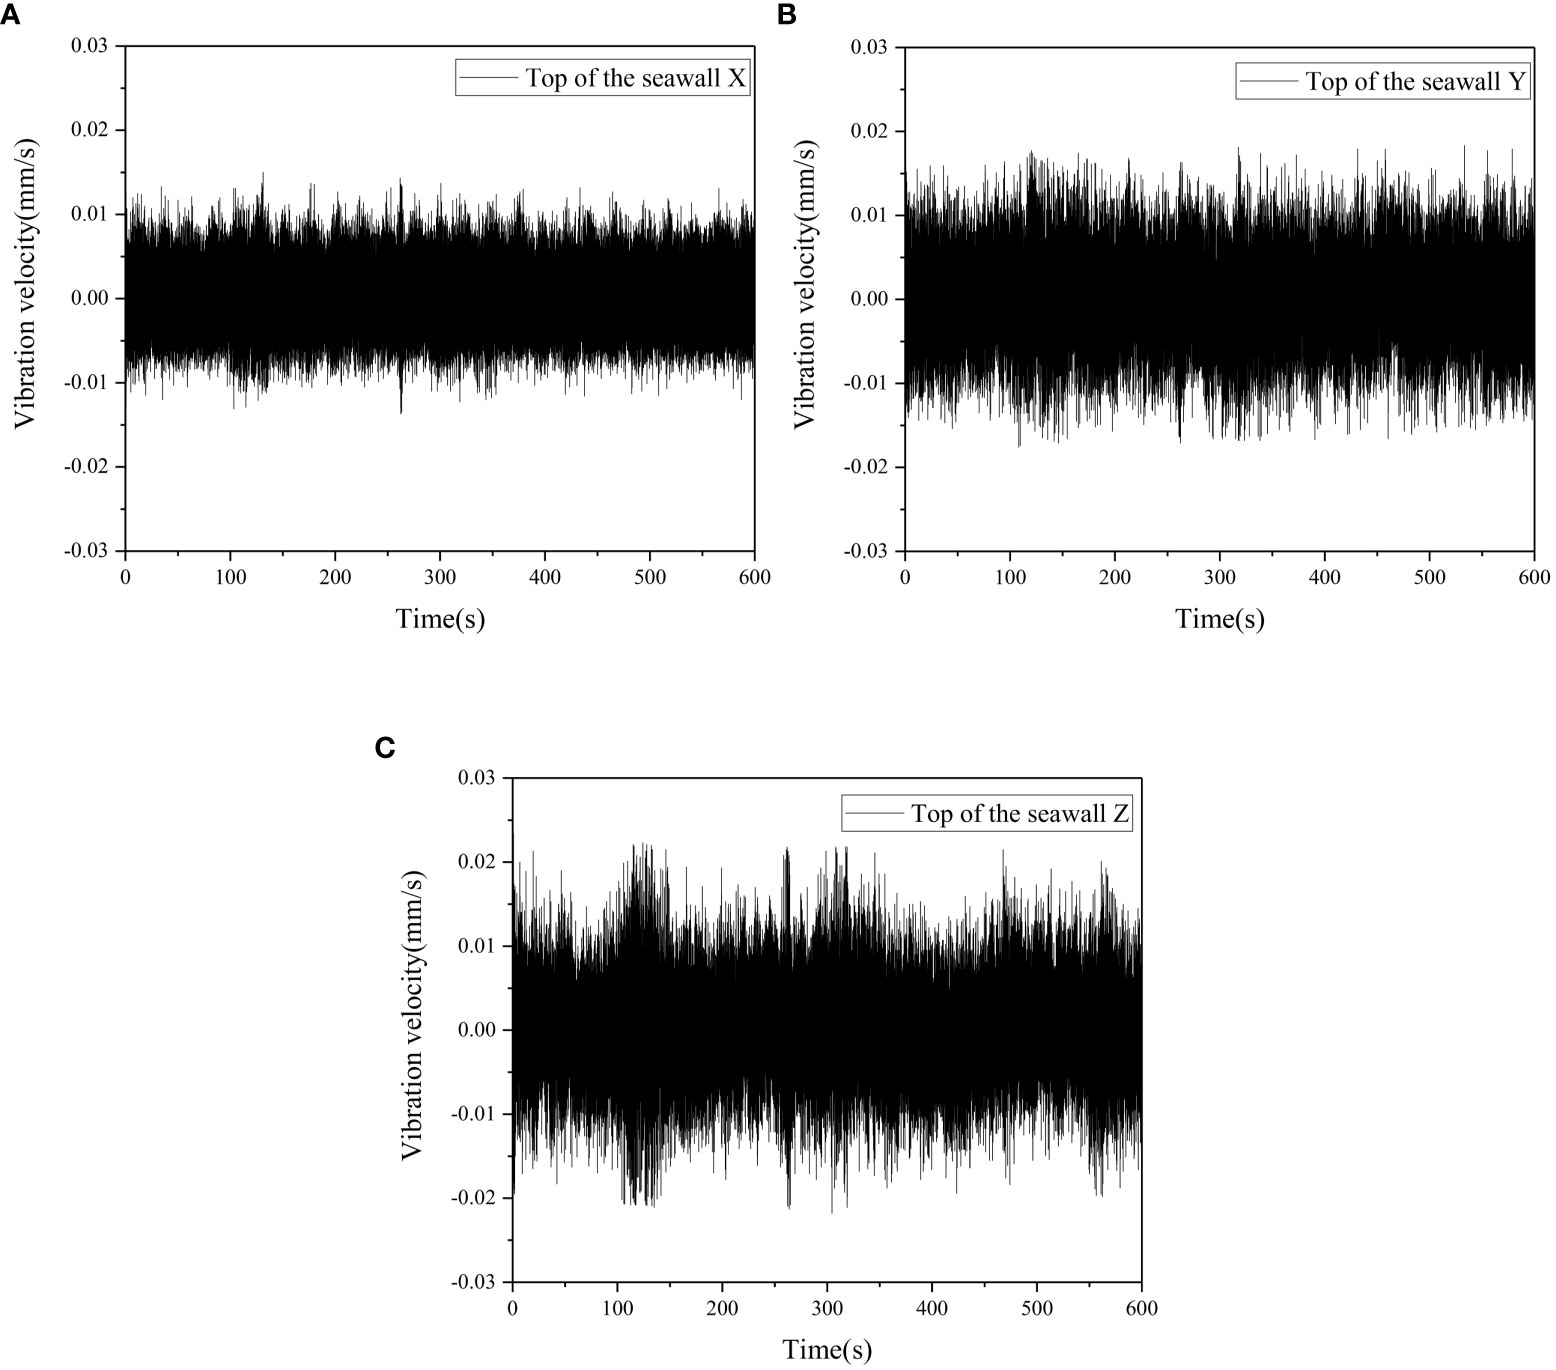
Figure 11 Pulsation time-history curves. (A) Horizontal direction X. (B) Horizontal direction Y. (C) Vertical direction Z.
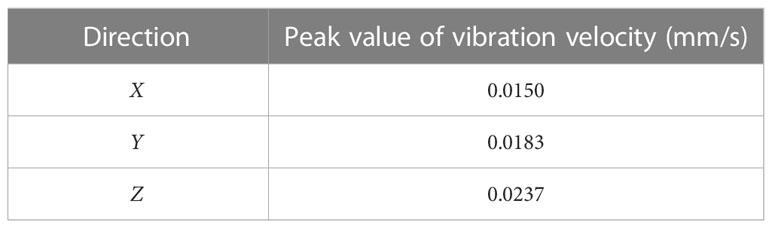
Table 2 Peak values of three-directional ambient vibration velocity.
4.1.2 Different axle load conditions
The time history curves of vertical vibration velocity (Z) and horizontal vibration velocity (X, Y) of the ancient seawall under different axle load conditions are shown in Figure 12. The overall forced vibration changes of the ancient seawall structure caused by the vehicles are consistent, and the three-directional vibration velocity of the ancient seawall structure increases as the vehicle approaches, with the vertical direction showing the most significant increase. As the axle load of the vehicle increases, the three-directional vibration velocity of the ancient seawall structure also increases. The peak values of the three-directional vibration velocity of the ancient seawall structure under different axle load conditions are shown in Table 3. As can be seen from the table, the vertical direction is the dominant direction of vehicle-induced vibration for the ancient seawall, with the peak vibration velocity reaching 7.02 and 2.79 times the horizontal X (cross-dike direction) and Y directions (along-dike direction), respectively.
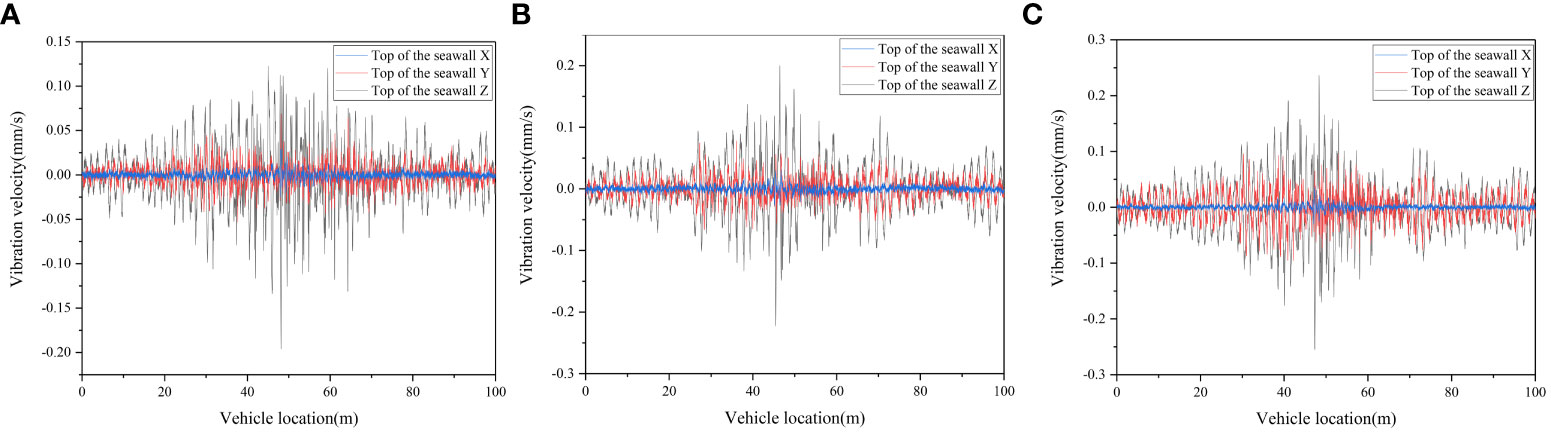
Figure 12 Time-domain curves of forced vibrations in ancient seawall structure under different axle load conditions. (A) Axle load 10t. (B) Axle load 11.52t. (C) Axle load 14.56t.
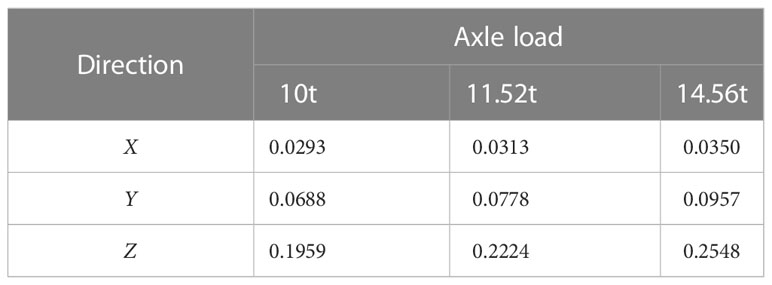
Table 3 Peak values of three-directional vibration velocity in ancient seawall under different axle load conditions.
As shown in Figure 13, the peak values of the three-directional vibration velocity of the ancient seawall structure basically increase linearly with the increase of axle load. The figure presents the fitting equations between the peak values of the three-directional vibration velocity (Vx, Vy, and Vz) and axle load (W), which can be used to predict the three-directional vibration velocity of the ancient seawall structure under other axle load conditions.
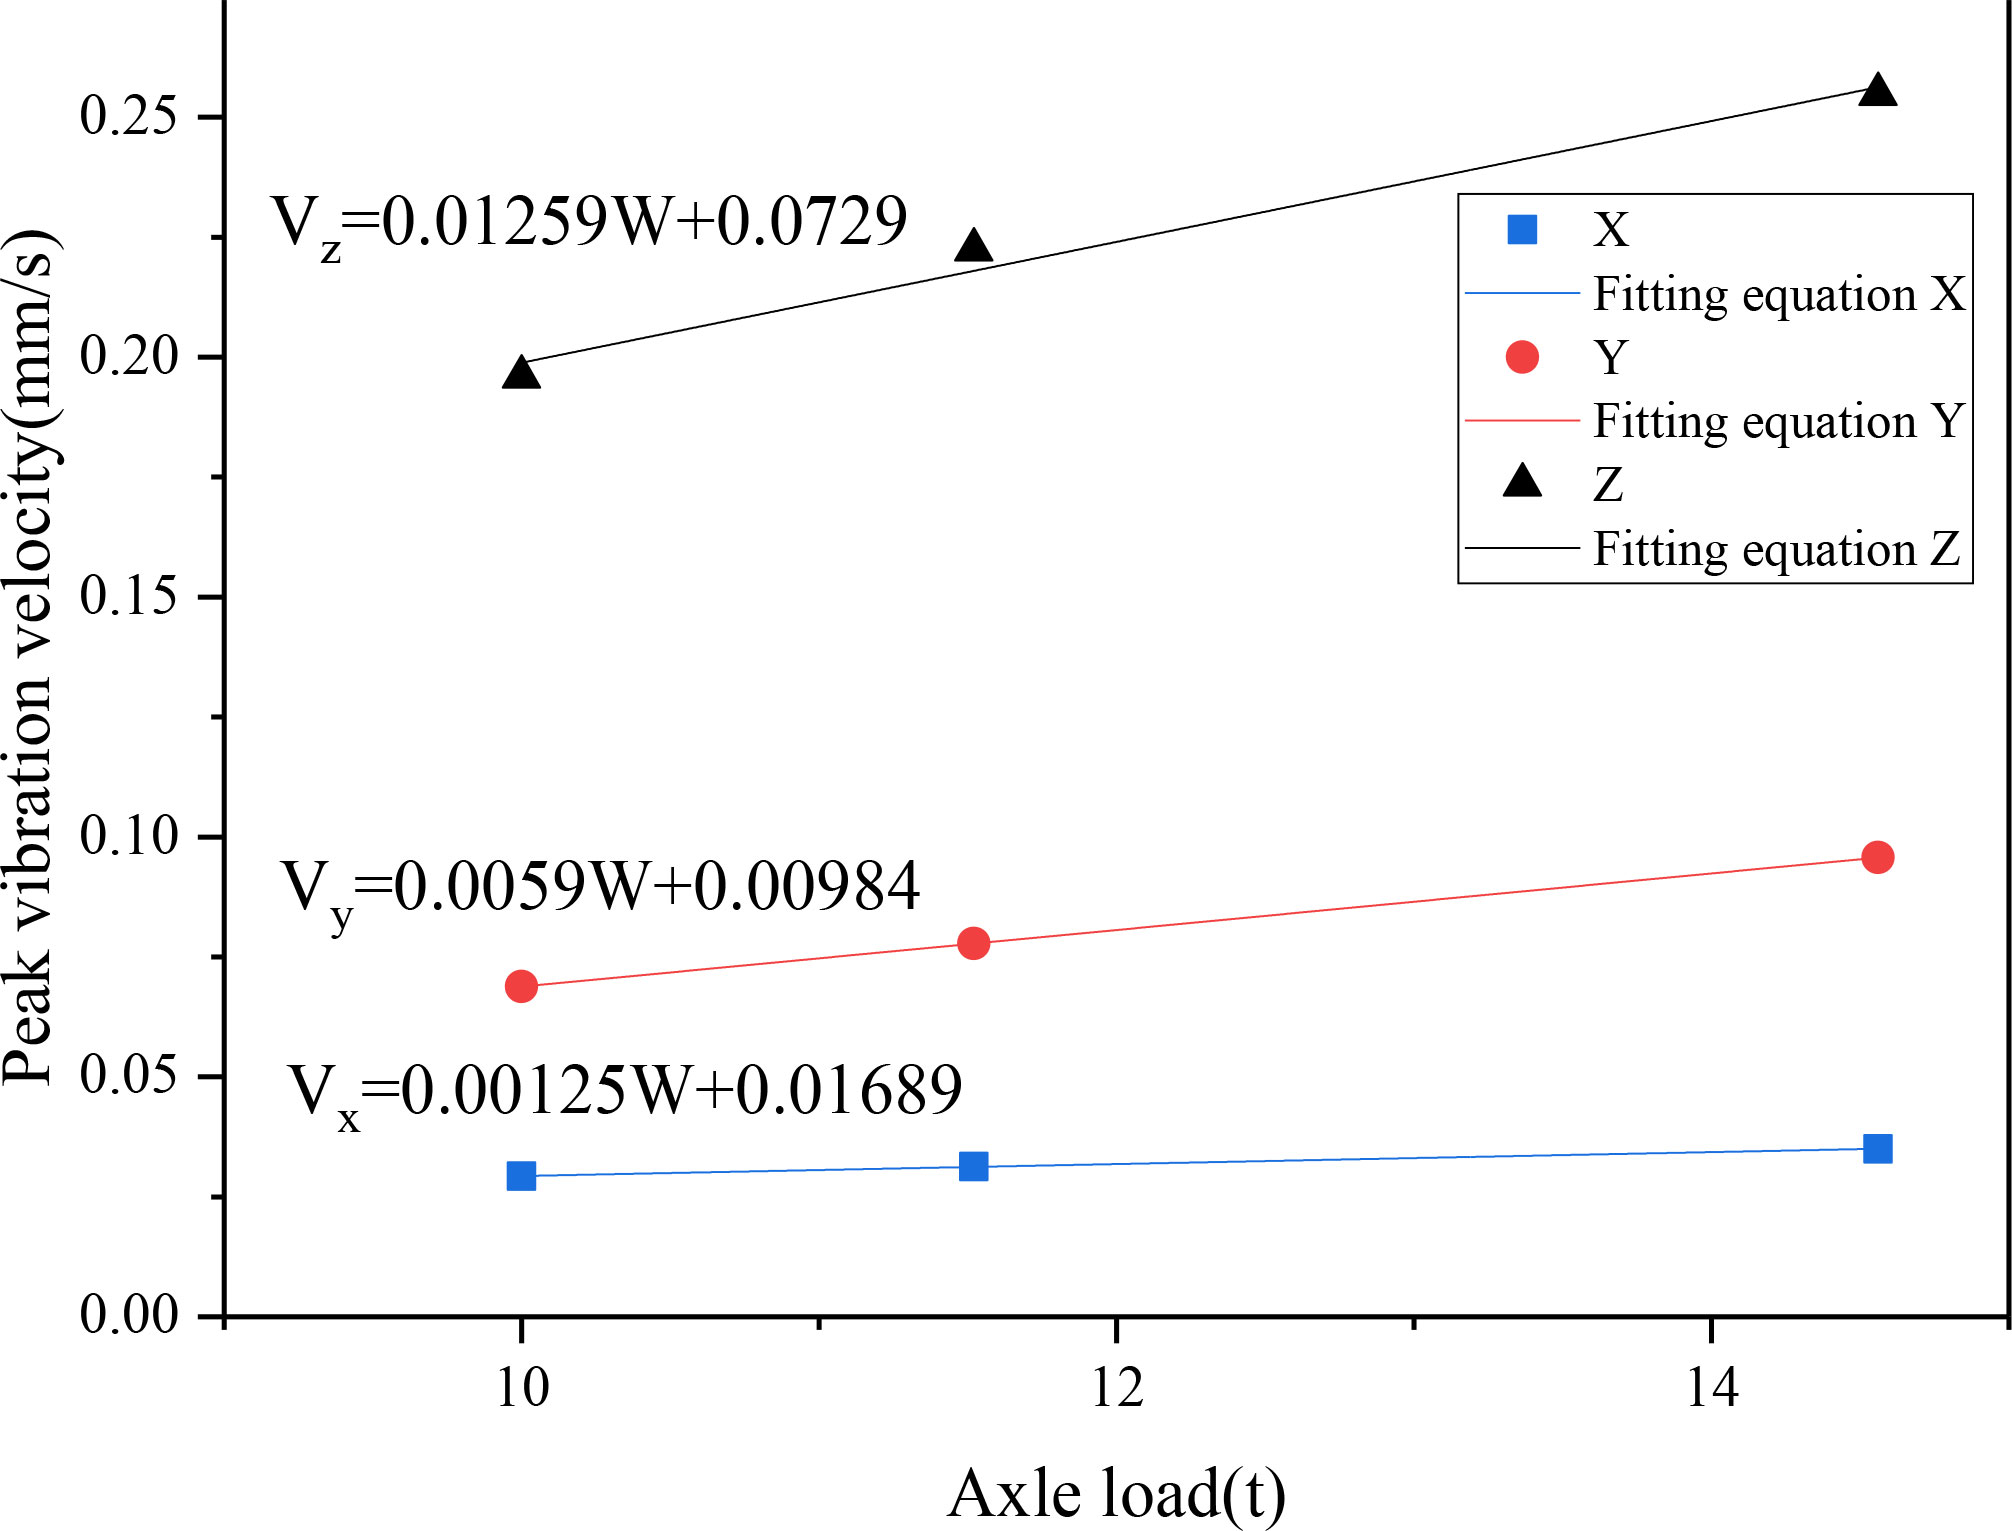
Figure 13 Fitting curves of peak three-directional vibration velocity in ancient seawall with respect to axle load changes.
4.1.3 Different vehicle speed conditions
The time history curves of vertical vibration velocity (Z) and horizontal vibration velocity (X, Y) of the ancient seawall under different vehicle speed conditions are shown in Figure 14. As seen in the figure, the three-directional vibration velocity of the ancient seawall increases as the vehicle approaches, with the vertical direction showing the most significant increase. As the vehicle speed increases, the three-directional vibration velocity of the ancient seawall structure also increases. The peak values of the three-directional vibration velocity of the ancient seawall structure under different vehicle speed conditions are shown in Table 4. As can be seen from the table, the vertical direction (Z-axis) is the dominant direction of vehicle-induced vibration for the ancient seawall, with the peak vibration velocity reaching 7.88 and 2.52 times the horizontal X (cross-dike direction) and Y directions (along-dike direction), respectively.
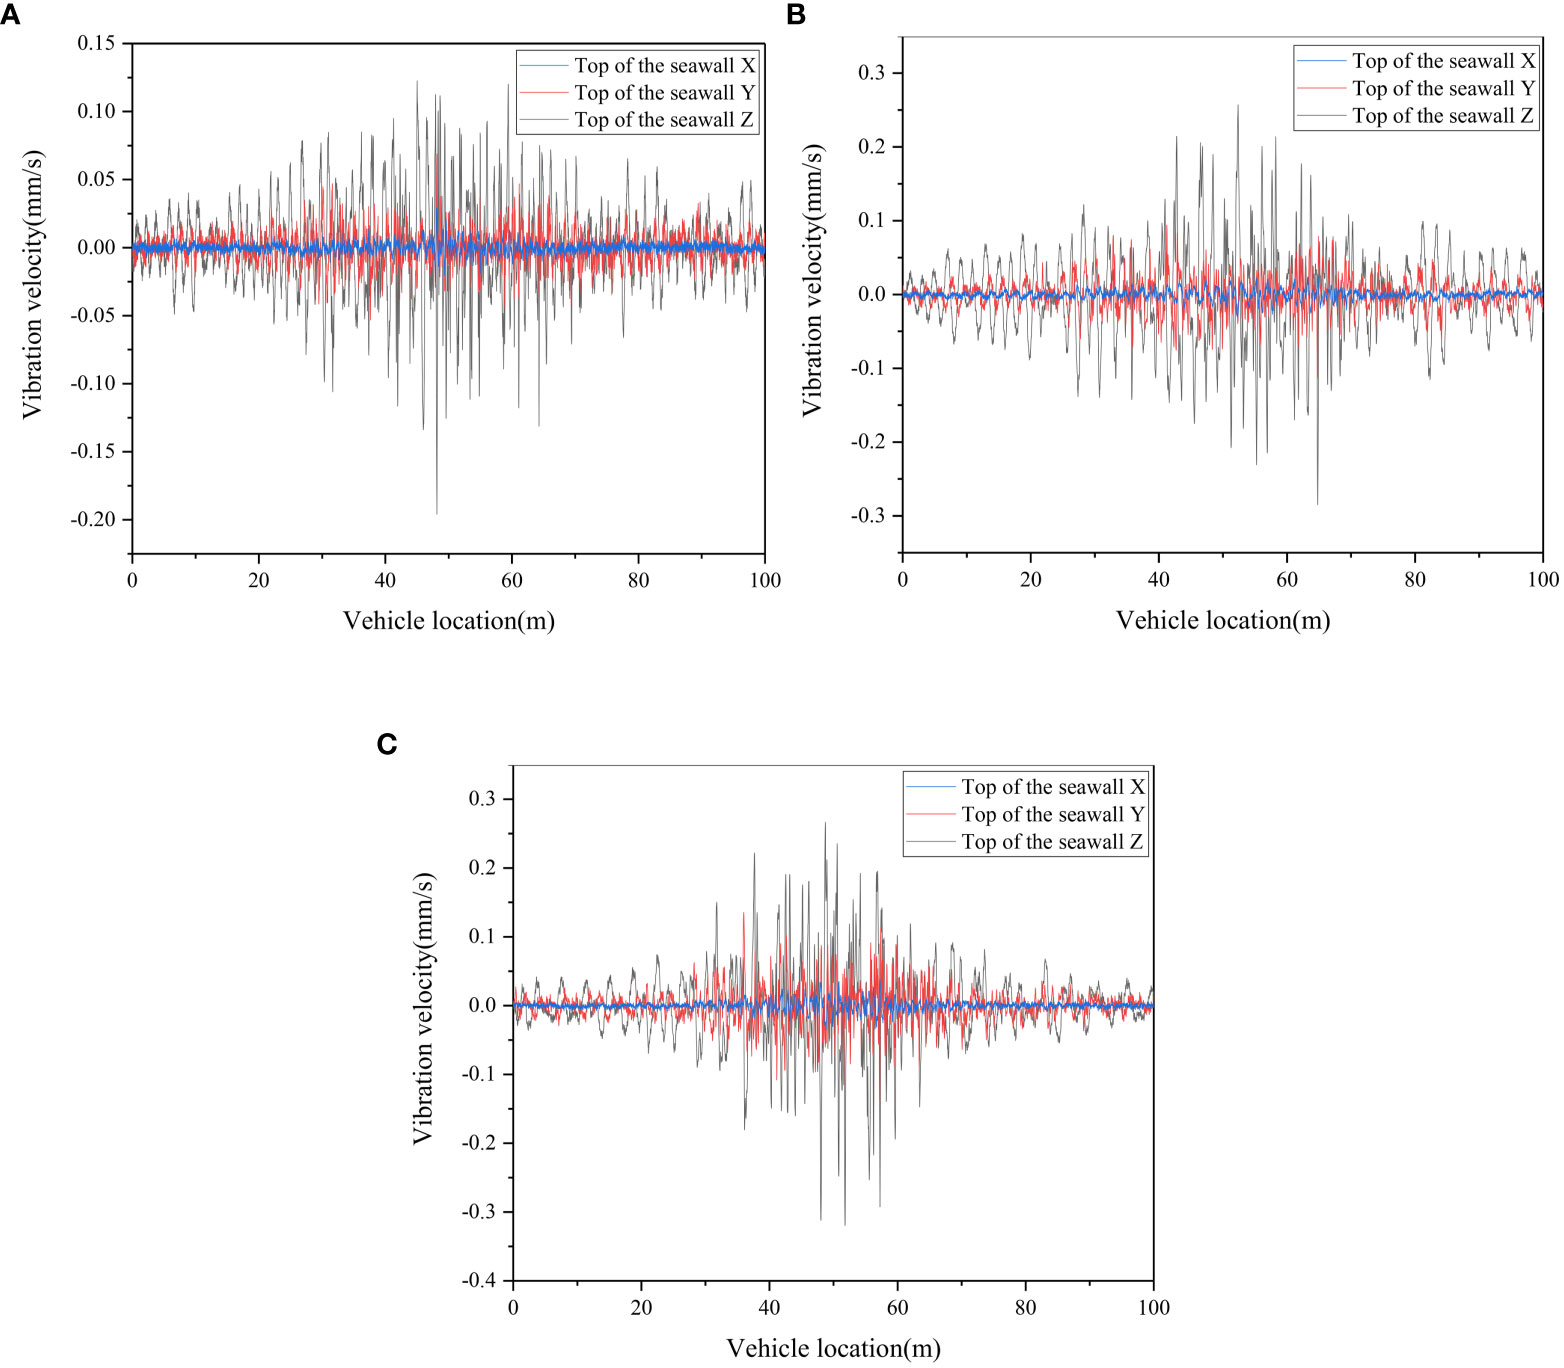
Figure 14 Forced vibration time history curves of ancient seawall under different vehicle speed conditions. (A) 20km/h. (B) 40km/h. (C) 60km/h.
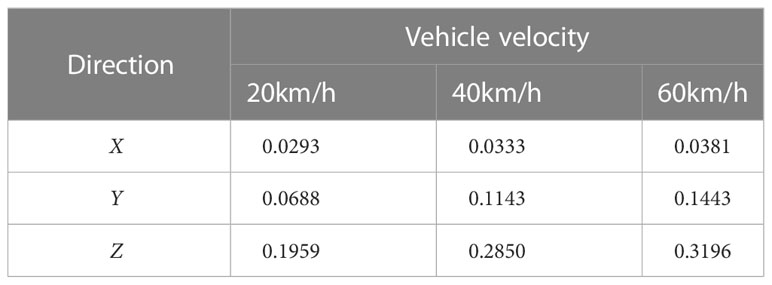
Table 4 Peak three-directional vibration velocities of ancient seawall under different vehicle speed conditions.
As shown in Figure 15, the peak values of the three-directional vibration velocity of the ancient seawall structure basically increase linearly with the increase of vehicle speed. The figure presents the fitting equations between the peak values of the vibration velocity (Vx, Vy, and Vz) and vehicle speed (C), which can be used to predict the three-directional vibration velocity of the ancient seawall structure under other vehicle speed conditions.
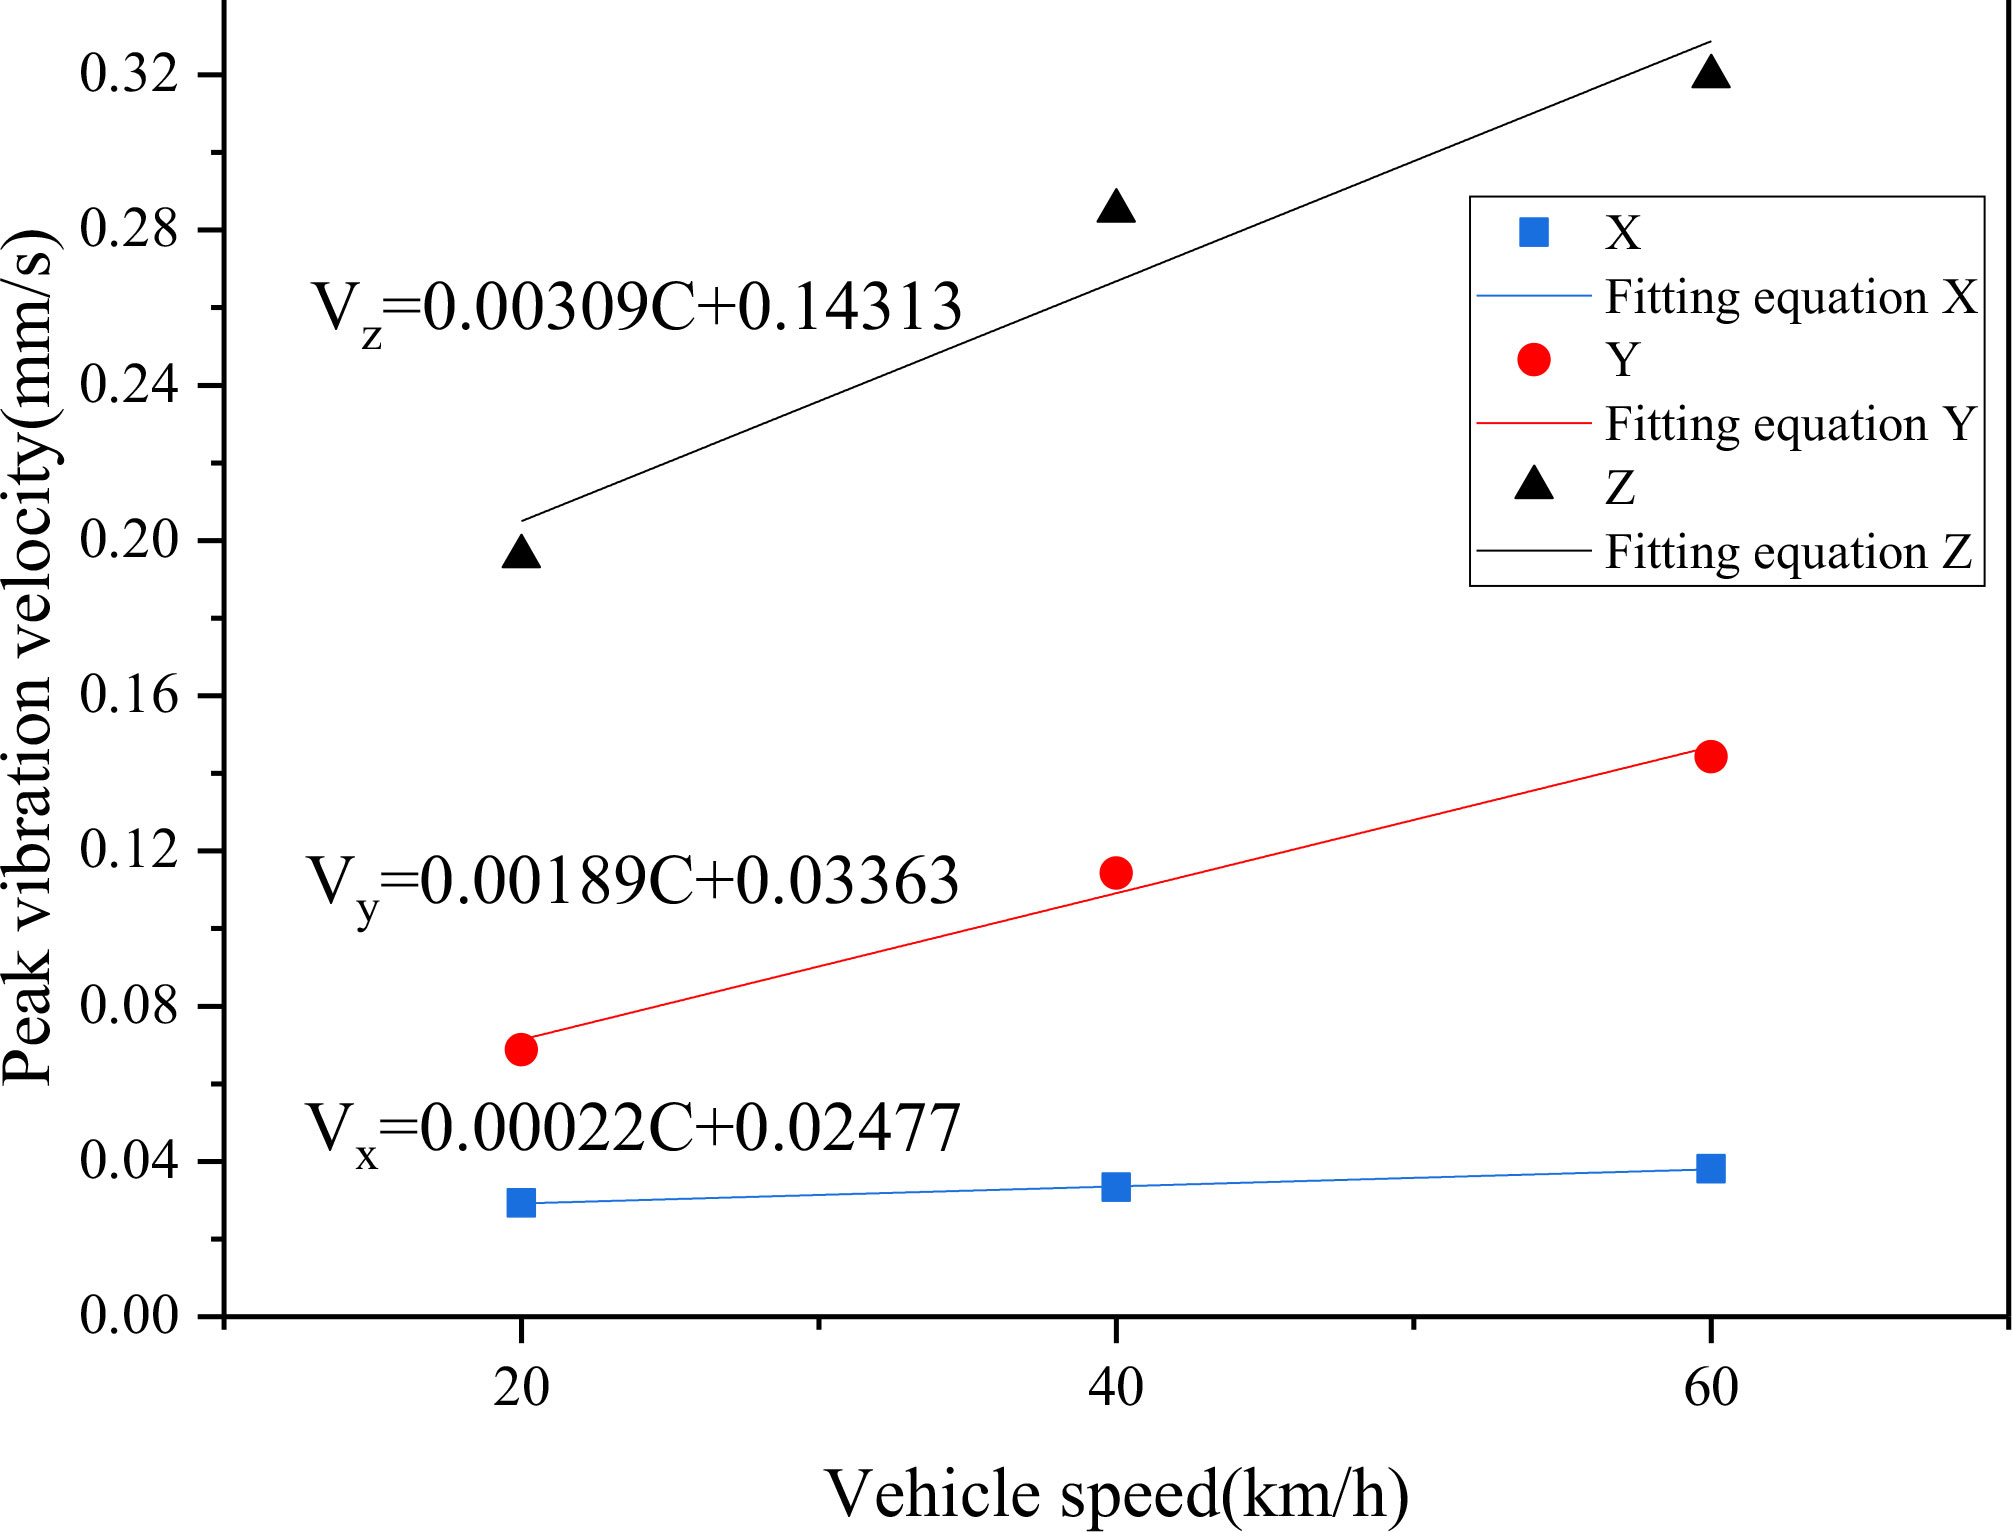
Figure 15 Fitting curves of peak three-directional vibration velocity in ancient seawall with respect to vehicle speed changes.
From the above analysis, it can be concluded that the vibration response of the ancient seawall caused by vehicle passage is significantly larger than the pulsation response of the ancient seawall in its natural vibration state. Therefore, the vibration impact of vehicle passage on the ancient seawall heritage site cannot be ignored. When a vehicle passes, the three-directional vibration velocity of the ancient seawall structure increases, with the vertical direction being the dominant direction of vehicle-induced vibration and the vibration velocity being much larger than the horizontal direction. The peak vibration velocity of the ancient seawall caused by different vehicle speed conditions is larger than that caused by different axle load conditions, indicating that the ancient seawall vibration is more sensitive to vehicle speed.
4.2 Frequency domain results
The pulsation results were subjected to a spectral analysis to obtain the pulsation spectrum curve shown in Figure 16. It can be seen that the pulsation frequencies of the ancient seawall in the horizontal Y-direction (along-dike) and vertical Z-direction are concentrated within 5 Hz, while the dominant frequency band of the horizontal X-direction pulsation is 0-15 Hz. The three-directional pulsations of the ancient seawall exhibit peaks near 3 Hz and 10Hz, indicating that 3 Hz is the first-order characteristic frequency of the ancient seawall, while 10 Hz is a higher-order characteristic frequency.
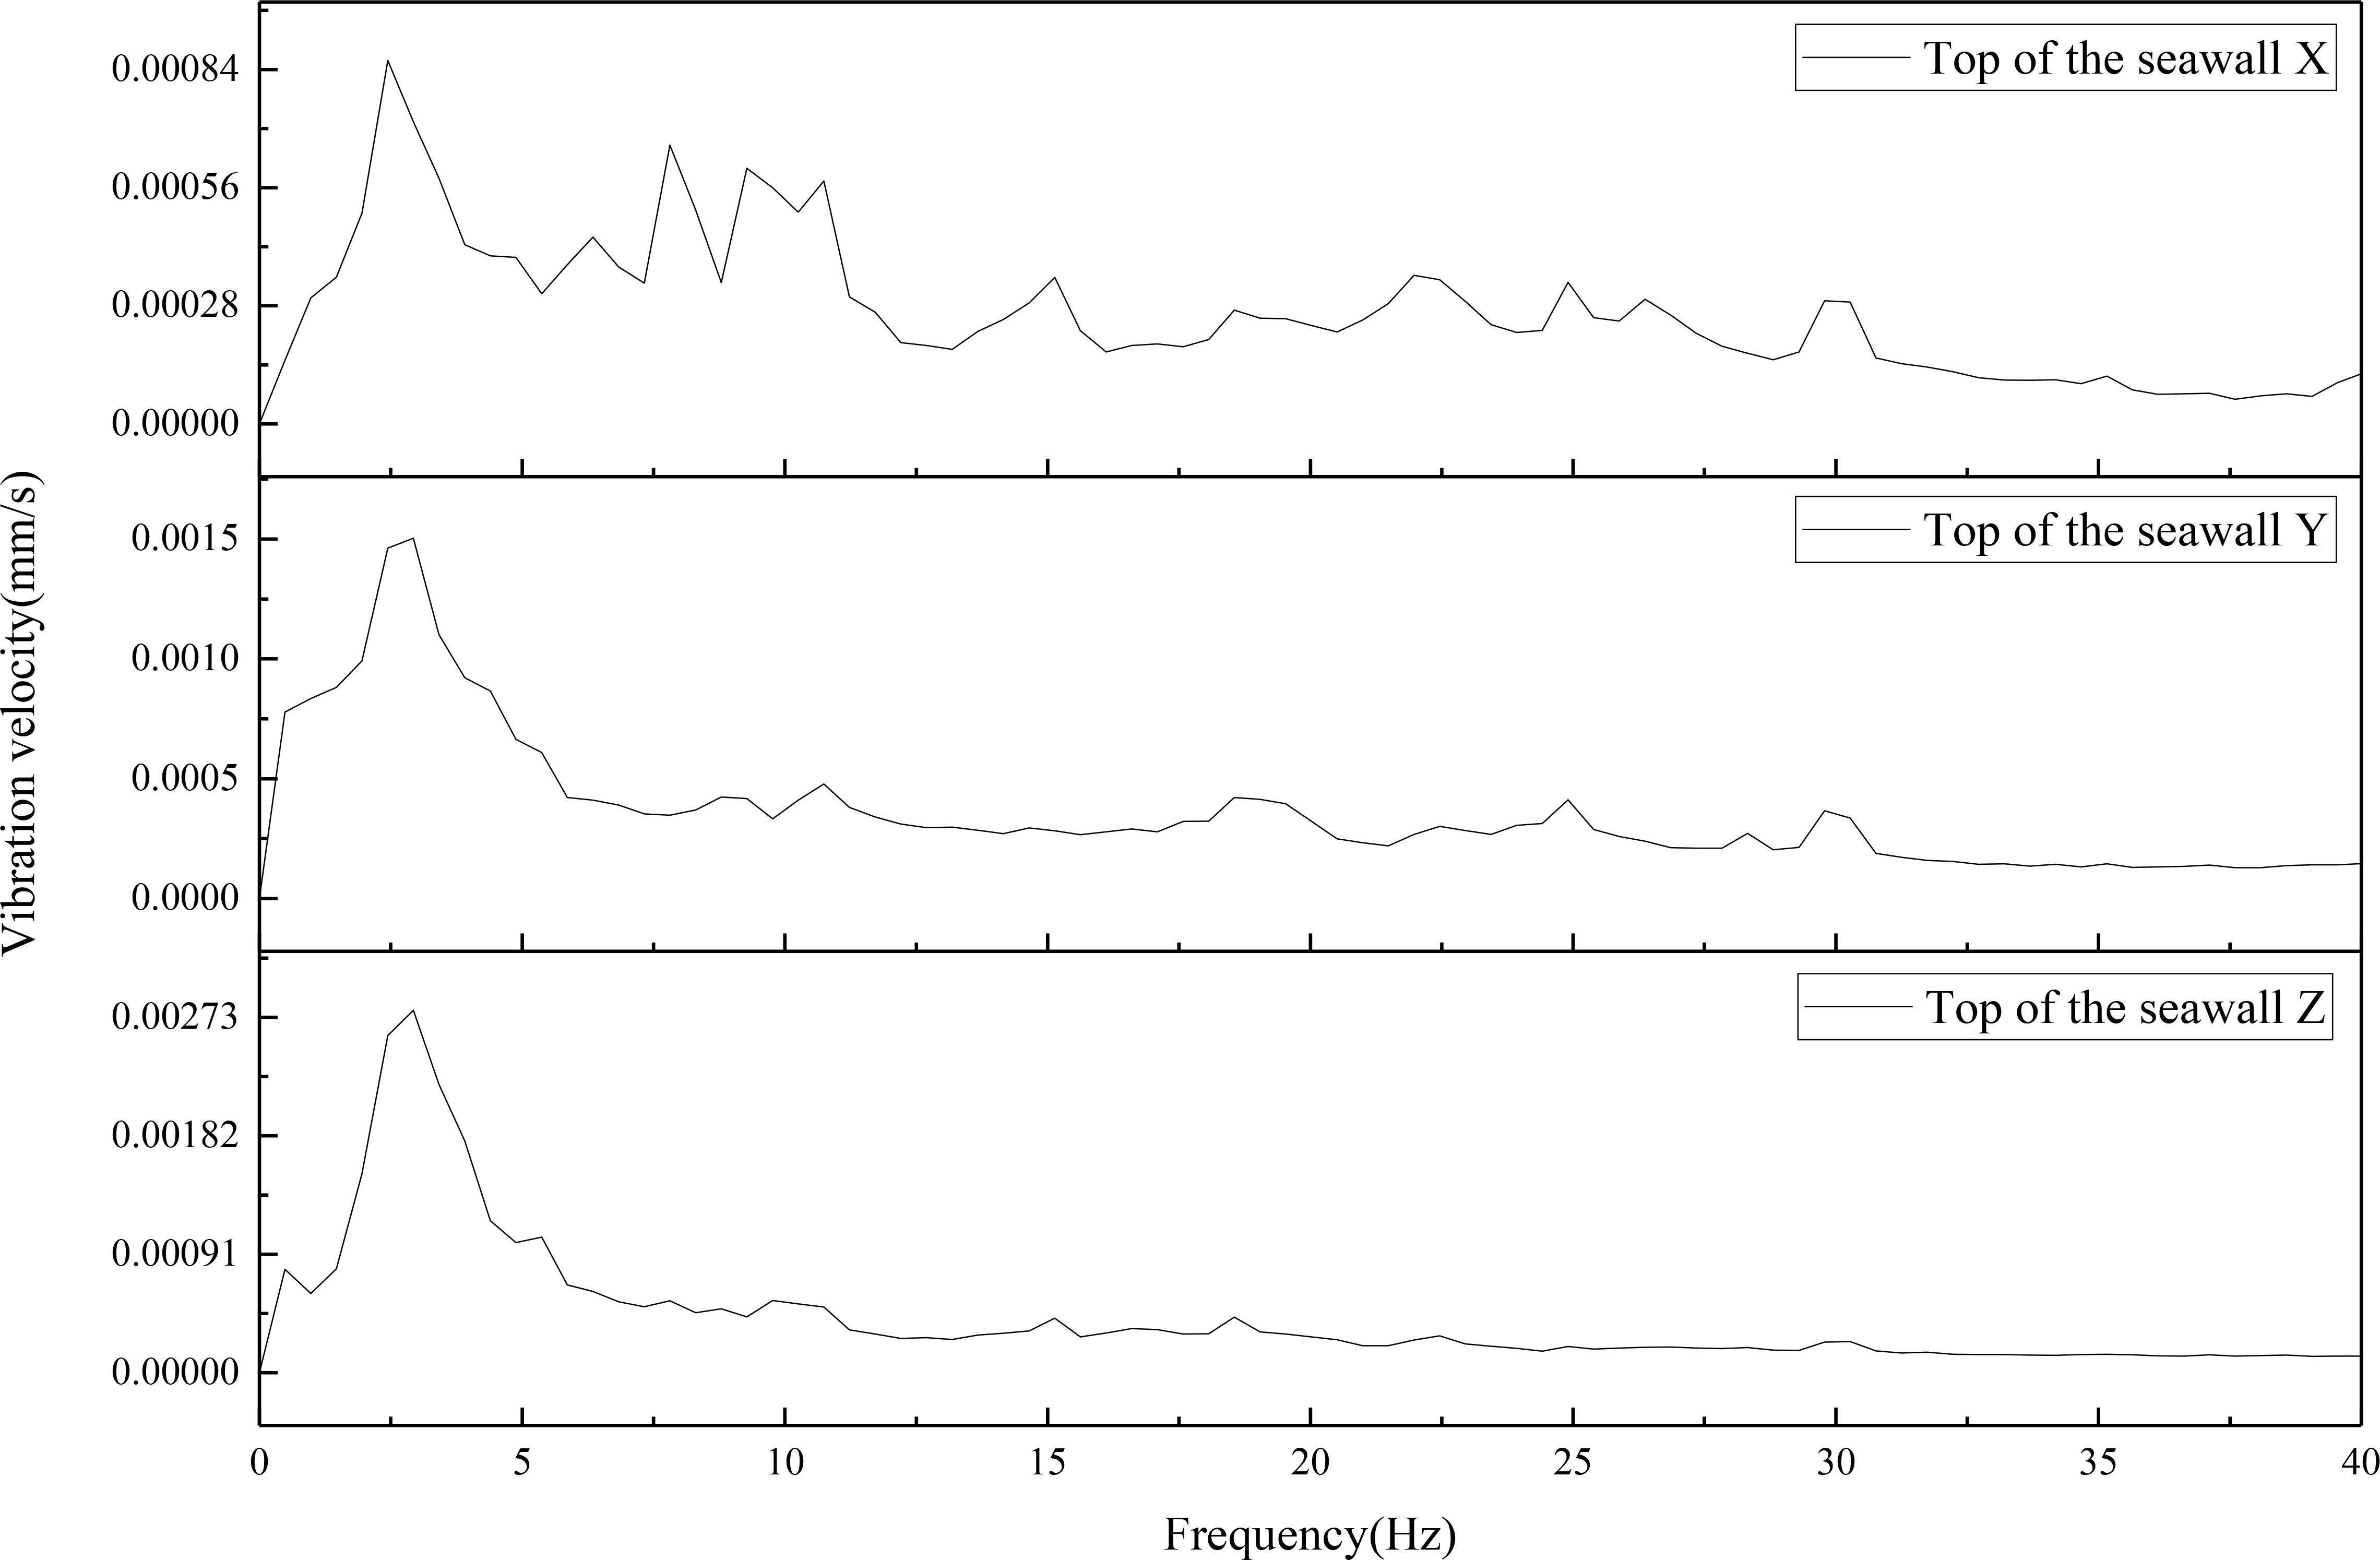
Figure 16 Ancient seawall pulsation spectrum curve.
By selecting the axle load of 10 t and vehicle speed of 20 km/h condition and performing a spectral analysis on the time-domain results of the ancient seawall vibration, the typical spectrum curve of vehicle-induced vibration of the ancient seawall is obtained, as shown in Figure 17. As can be seen from the figure, the three-directional vehicle-induced vibrations of the ancient seawall are mainly concentrated within the 0-30 Hz frequency band, with high-frequency vibrations experiencing significant attenuation, and three-directional vibrations above 50 Hz are almost zero.
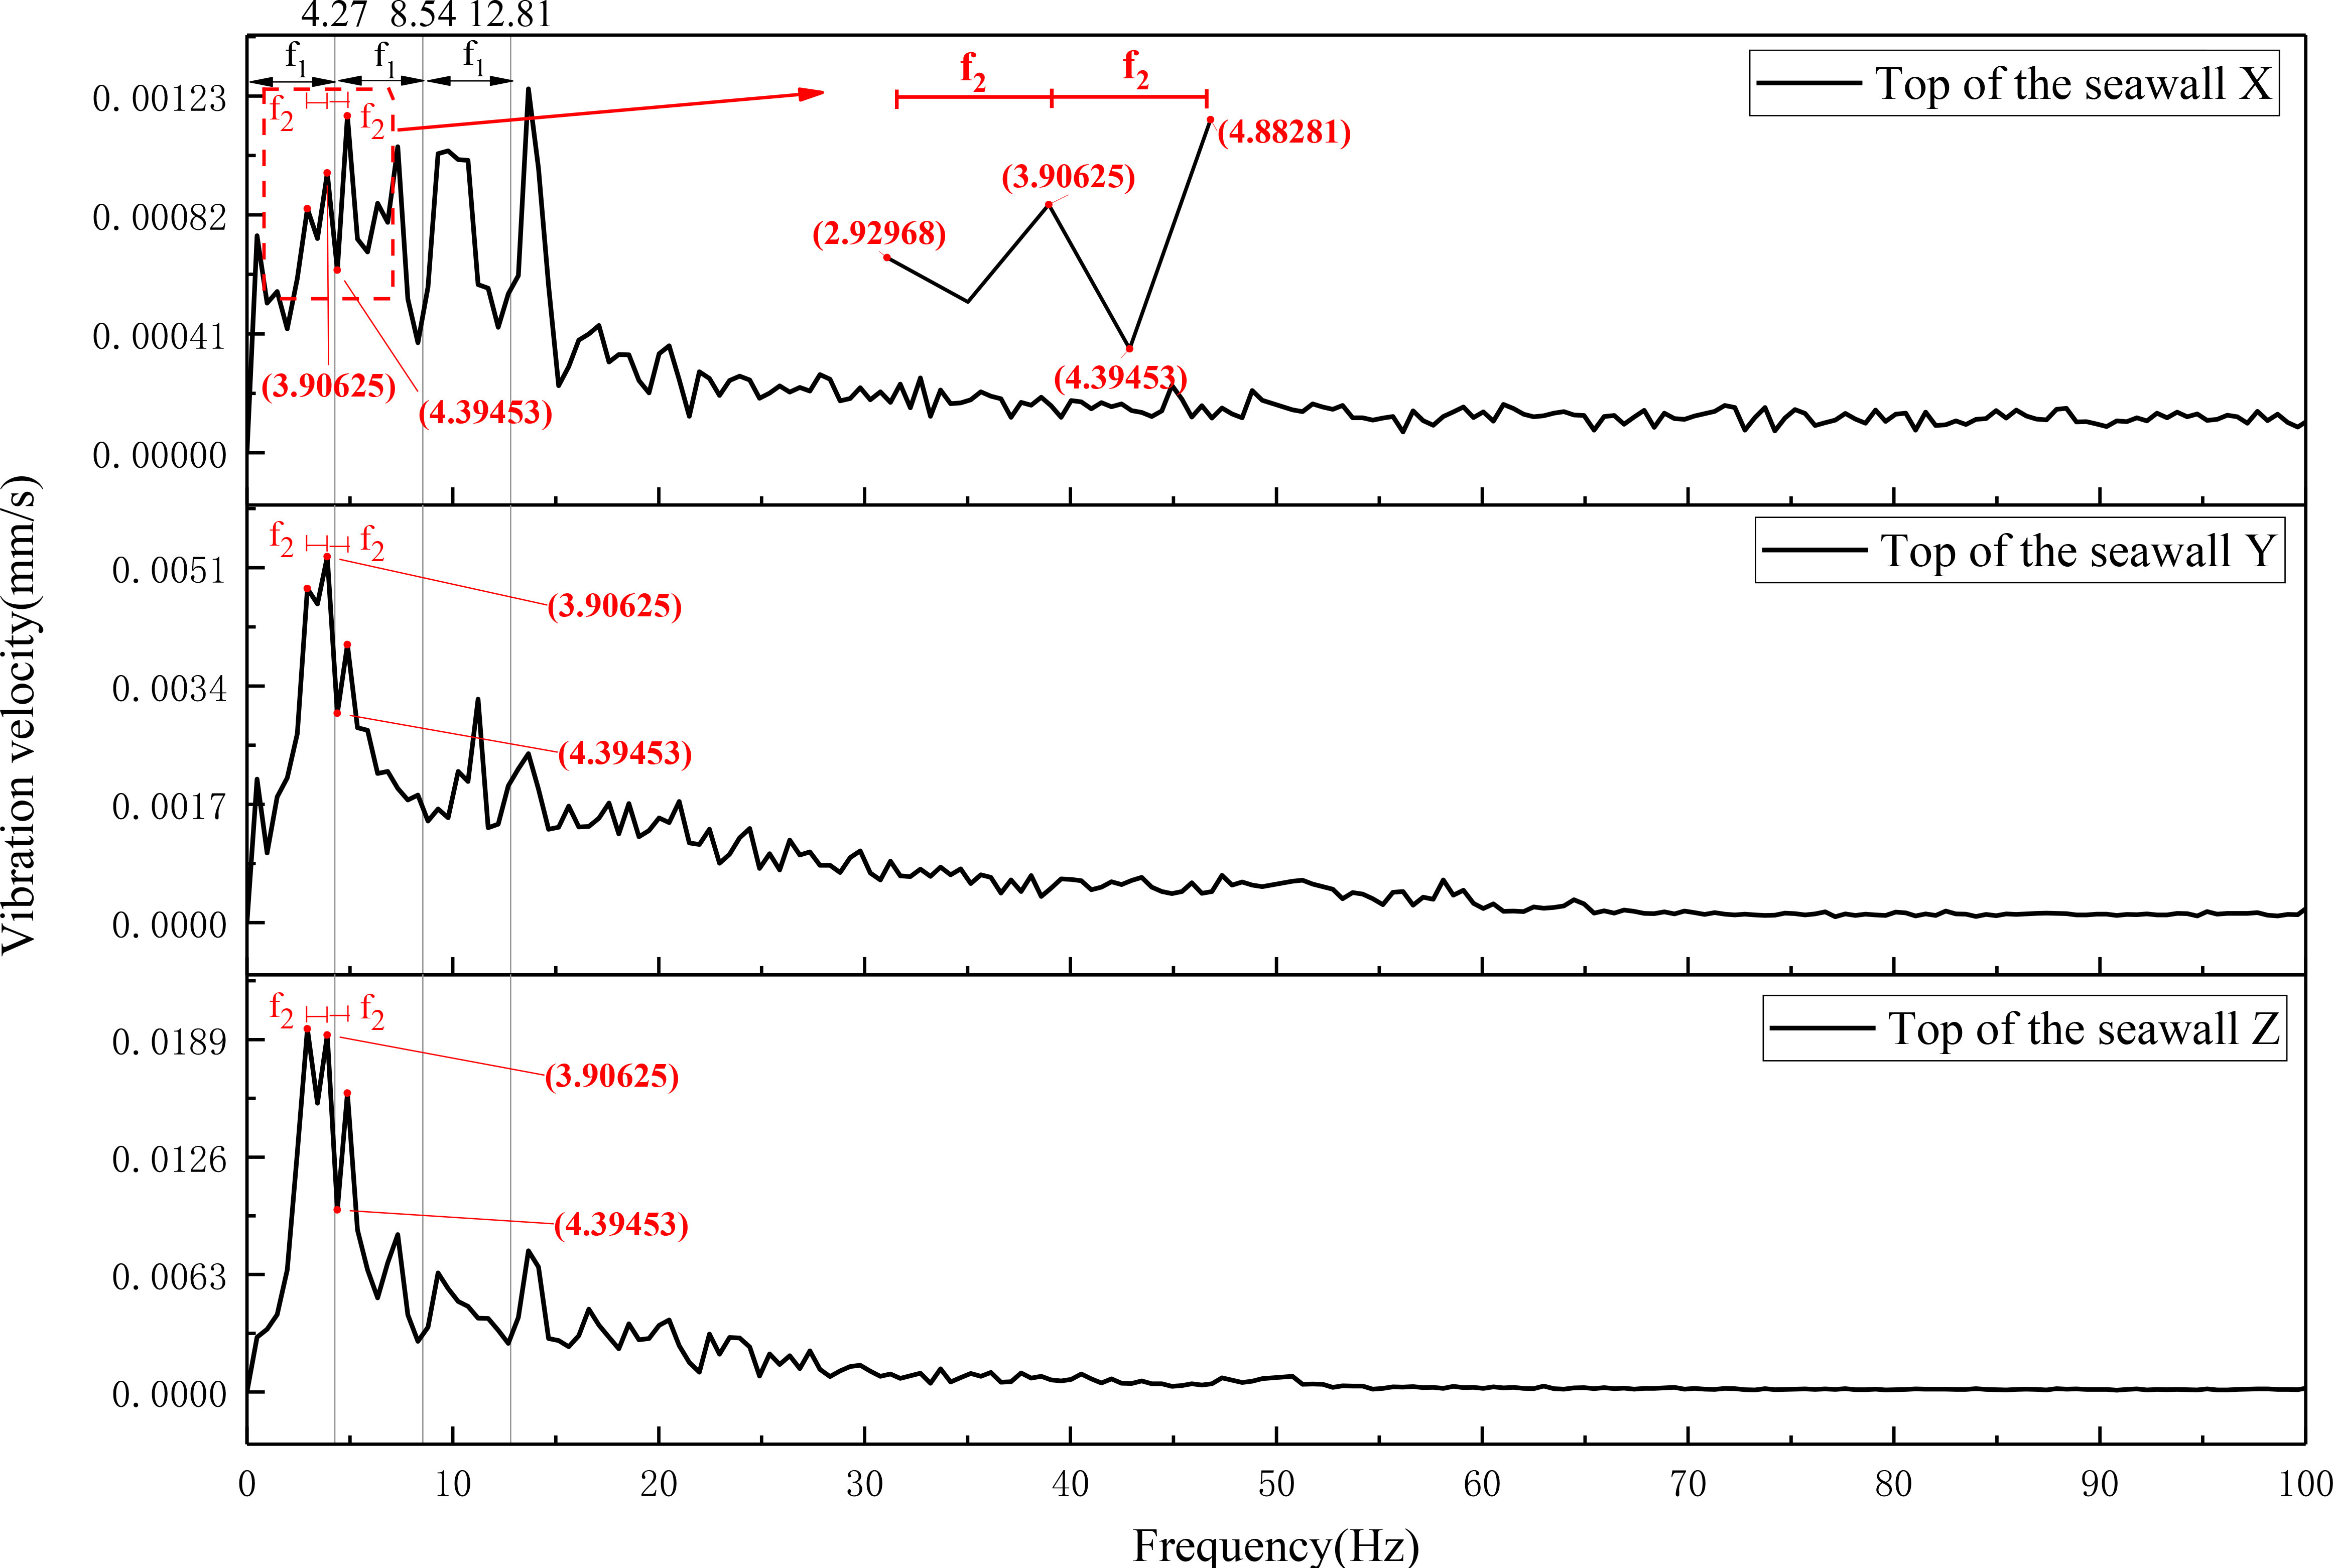
Figure 17 Typical frequency spectrum curve of vehicle-induced vibration in ancient seawall.
As the vehicle axles pass through the measuring point in sequence, they form a moving axle periodic excitation effect on the measuring point, with an excitation frequency of f = C/L, where L is the axle spacing. For the tri-axle loaded vehicle shown in Figure 8, there are three cases of axle spacing L, namely L1 = 1.3 m, L2 = 5.8 m, and L3 = 7.1 m. The moving axle load excitation frequencies for different vehicle speeds are shown in Table 5.
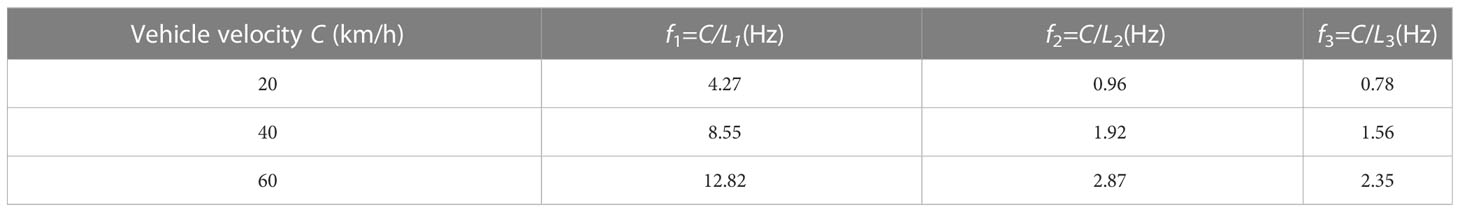
Table 5 Vehicle moving axle load excitation frequency f.
As can be seen from Table 5, the moving axle load excitation frequencies f1 and f2 at C = 20 km/h are 4.27 Hz and 0.96 Hz, respectively. The contributions of moving axle periodic excitation frequency nf1 (where n is a positive integer) can be seen in Figure 17, as indicated by the vertical lines at f1, 2f1, and 3f1. It should be noted that Figure 17 does not show peaks exactly at nf1, but rather on either side of it, which is the Doppler effect of the moving load. For example, the three-directional vibrations in Figure 17 exhibit peaks at 3.90 Hz to the left of f1 and 4.39 Hz to the right. In addition, Figure 17 clearly shows the contributions of moving axle periodic excitation frequency nf2, as indicated by the short vertical lines. In contrast to moving axle periodic excitation frequencies nf1 and nf2, the contribution of nf3 is not evident, which may be due to the fact that this frequency is contributed by axles 1 and 3 of the loaded vehicle, which are furthest apart, making it difficult to cause periodic excitation.
Compared with conventional time-domain extreme value analysis and spectral curves, the 1/3 octave analysis can present the root mean square values of vibration signals in each frequency band, thus better characterizing the frequency and energy distribution characteristics of the vibration signal. According to the national standard (GB/T 3241-2010, 2010), the 0-100 Hz frequency range is divided into 21 frequency bands. The center frequencies of each band are as follows: 1, 1.25, 1.6, 2, 2.5, 3.15, 4, 5, 6.3, 8, 10, 12.5, 16, 20, 25, 31.5, 40, 50, 63, 80, and 100 Hz. The upper and lower limits of each frequency band are determined by multiplying and dividing the center frequency by the factor 21/6, respectively.
4.2.1 One-third octave results for different axle load conditions
An analysis of the time domain results of forced vibrations under different axle load conditions using the 1/3 octave method is conducted, and the results are shown in Figure 18. It can be observed from the figure that the distribution pattern of the 1/3 octave band of the three-directional vibrations of the ancient seawall is not significantly affected by the changes in axle load. The peak values of the three-directional vibrations under different axle load conditions appear in both 3.15 Hz and 10 Hz frequency bands. The peak values of the horizontal X-directional vibration in these two frequency bands are similar, but the peak values of the vertical Z-direction and horizontal Y-direction vibrations at 3.15 Hz are noticeably higher than those in the 10 Hz band. Relative to the 3.15 Hz peak frequency band, the peak frequency band near 10 Hz is broader, essentially encompassing 8 Hz, 10 Hz, 12.5 Hz, and 16 Hz frequency bands. As previously mentioned, the characteristic frequencies of the ancient seawall are 3 Hz and 10 Hz, and by combining the data from Table 5, it can be concluded that the peak values in the 3.15 Hz and 10 Hz bands are caused by the resonance between the vehicle moving axle load excitation frequency and the characteristic frequency of the ancient seawall. For example, the peak in the 3.15 Hz band is rendered by coincidence of the excitation frequency nf2(n=3) and the first characteristic frequency of seawall (i.e. 3Hz).
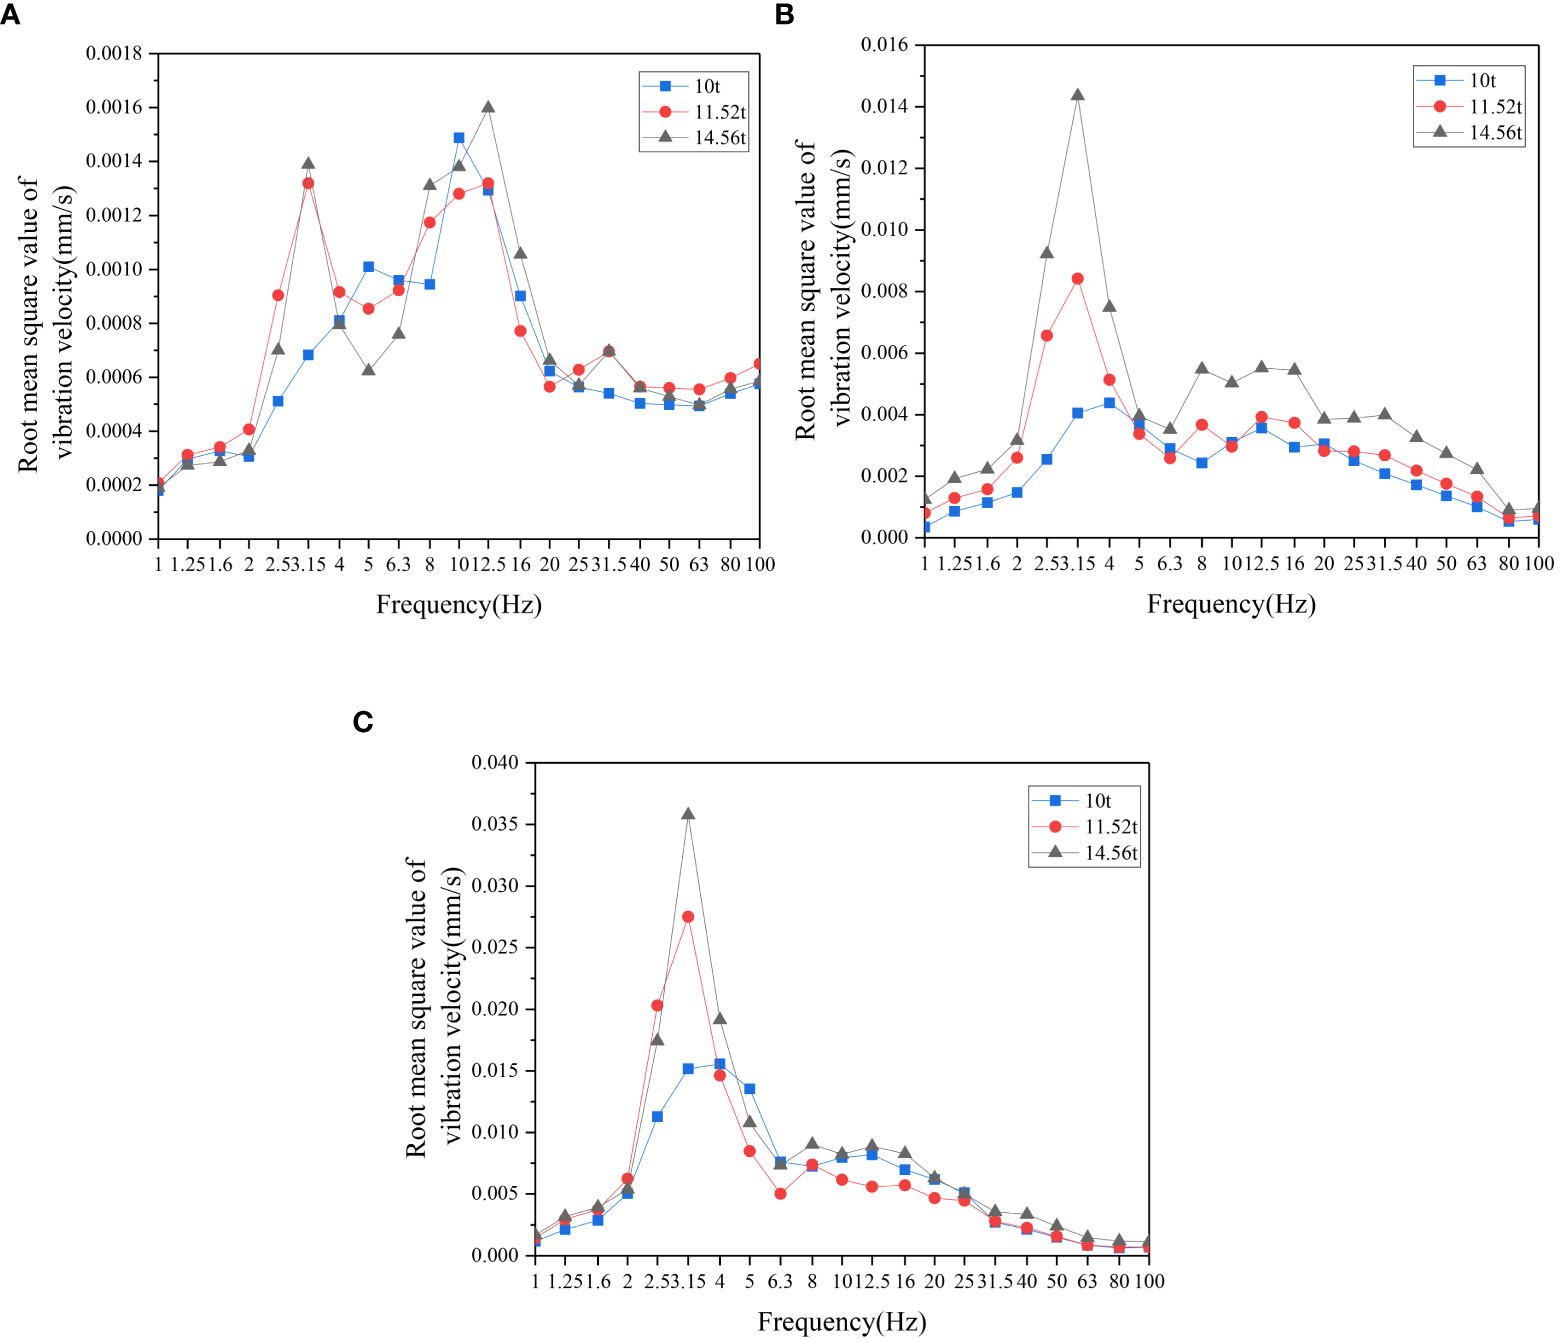
Figure 18 Forced vibration one-third octave curves of ancient seawall structure under different axle load conditions. (A) Horizontal direction X. (B) Horizontal direction Y. (C) Vertical direction Z.
The stress and deformation behaviors of brick material exhibit a significant frequency dependence (Lacanna et al., 2016), and existing vibration standards (GB 6722-2014, 2015) stipulate different vibration velocity limits according to different frequencies. In general, the higher the frequency, the higher the allowable vibration velocity. Therefore, it is necessary to derive a peak vibration velocity prediction formula for the dominant vibration frequency band of the ancient seawall. As shown in Figure 19, a fitting is conducted for the dominant frequency band (3.15 Hz) in the dominant direction (vertical Z-direction) of the structure induced by vehicle vibrations. The figure presents the fitting relationship between the root mean square value of vibration velocity (Vf) and axle load (W), which can be used to predict the root mean square value of vibration velocity in the vertical Z-direction of the ancient seawall structure at the 3.15 Hz frequency band under other axle load conditions.
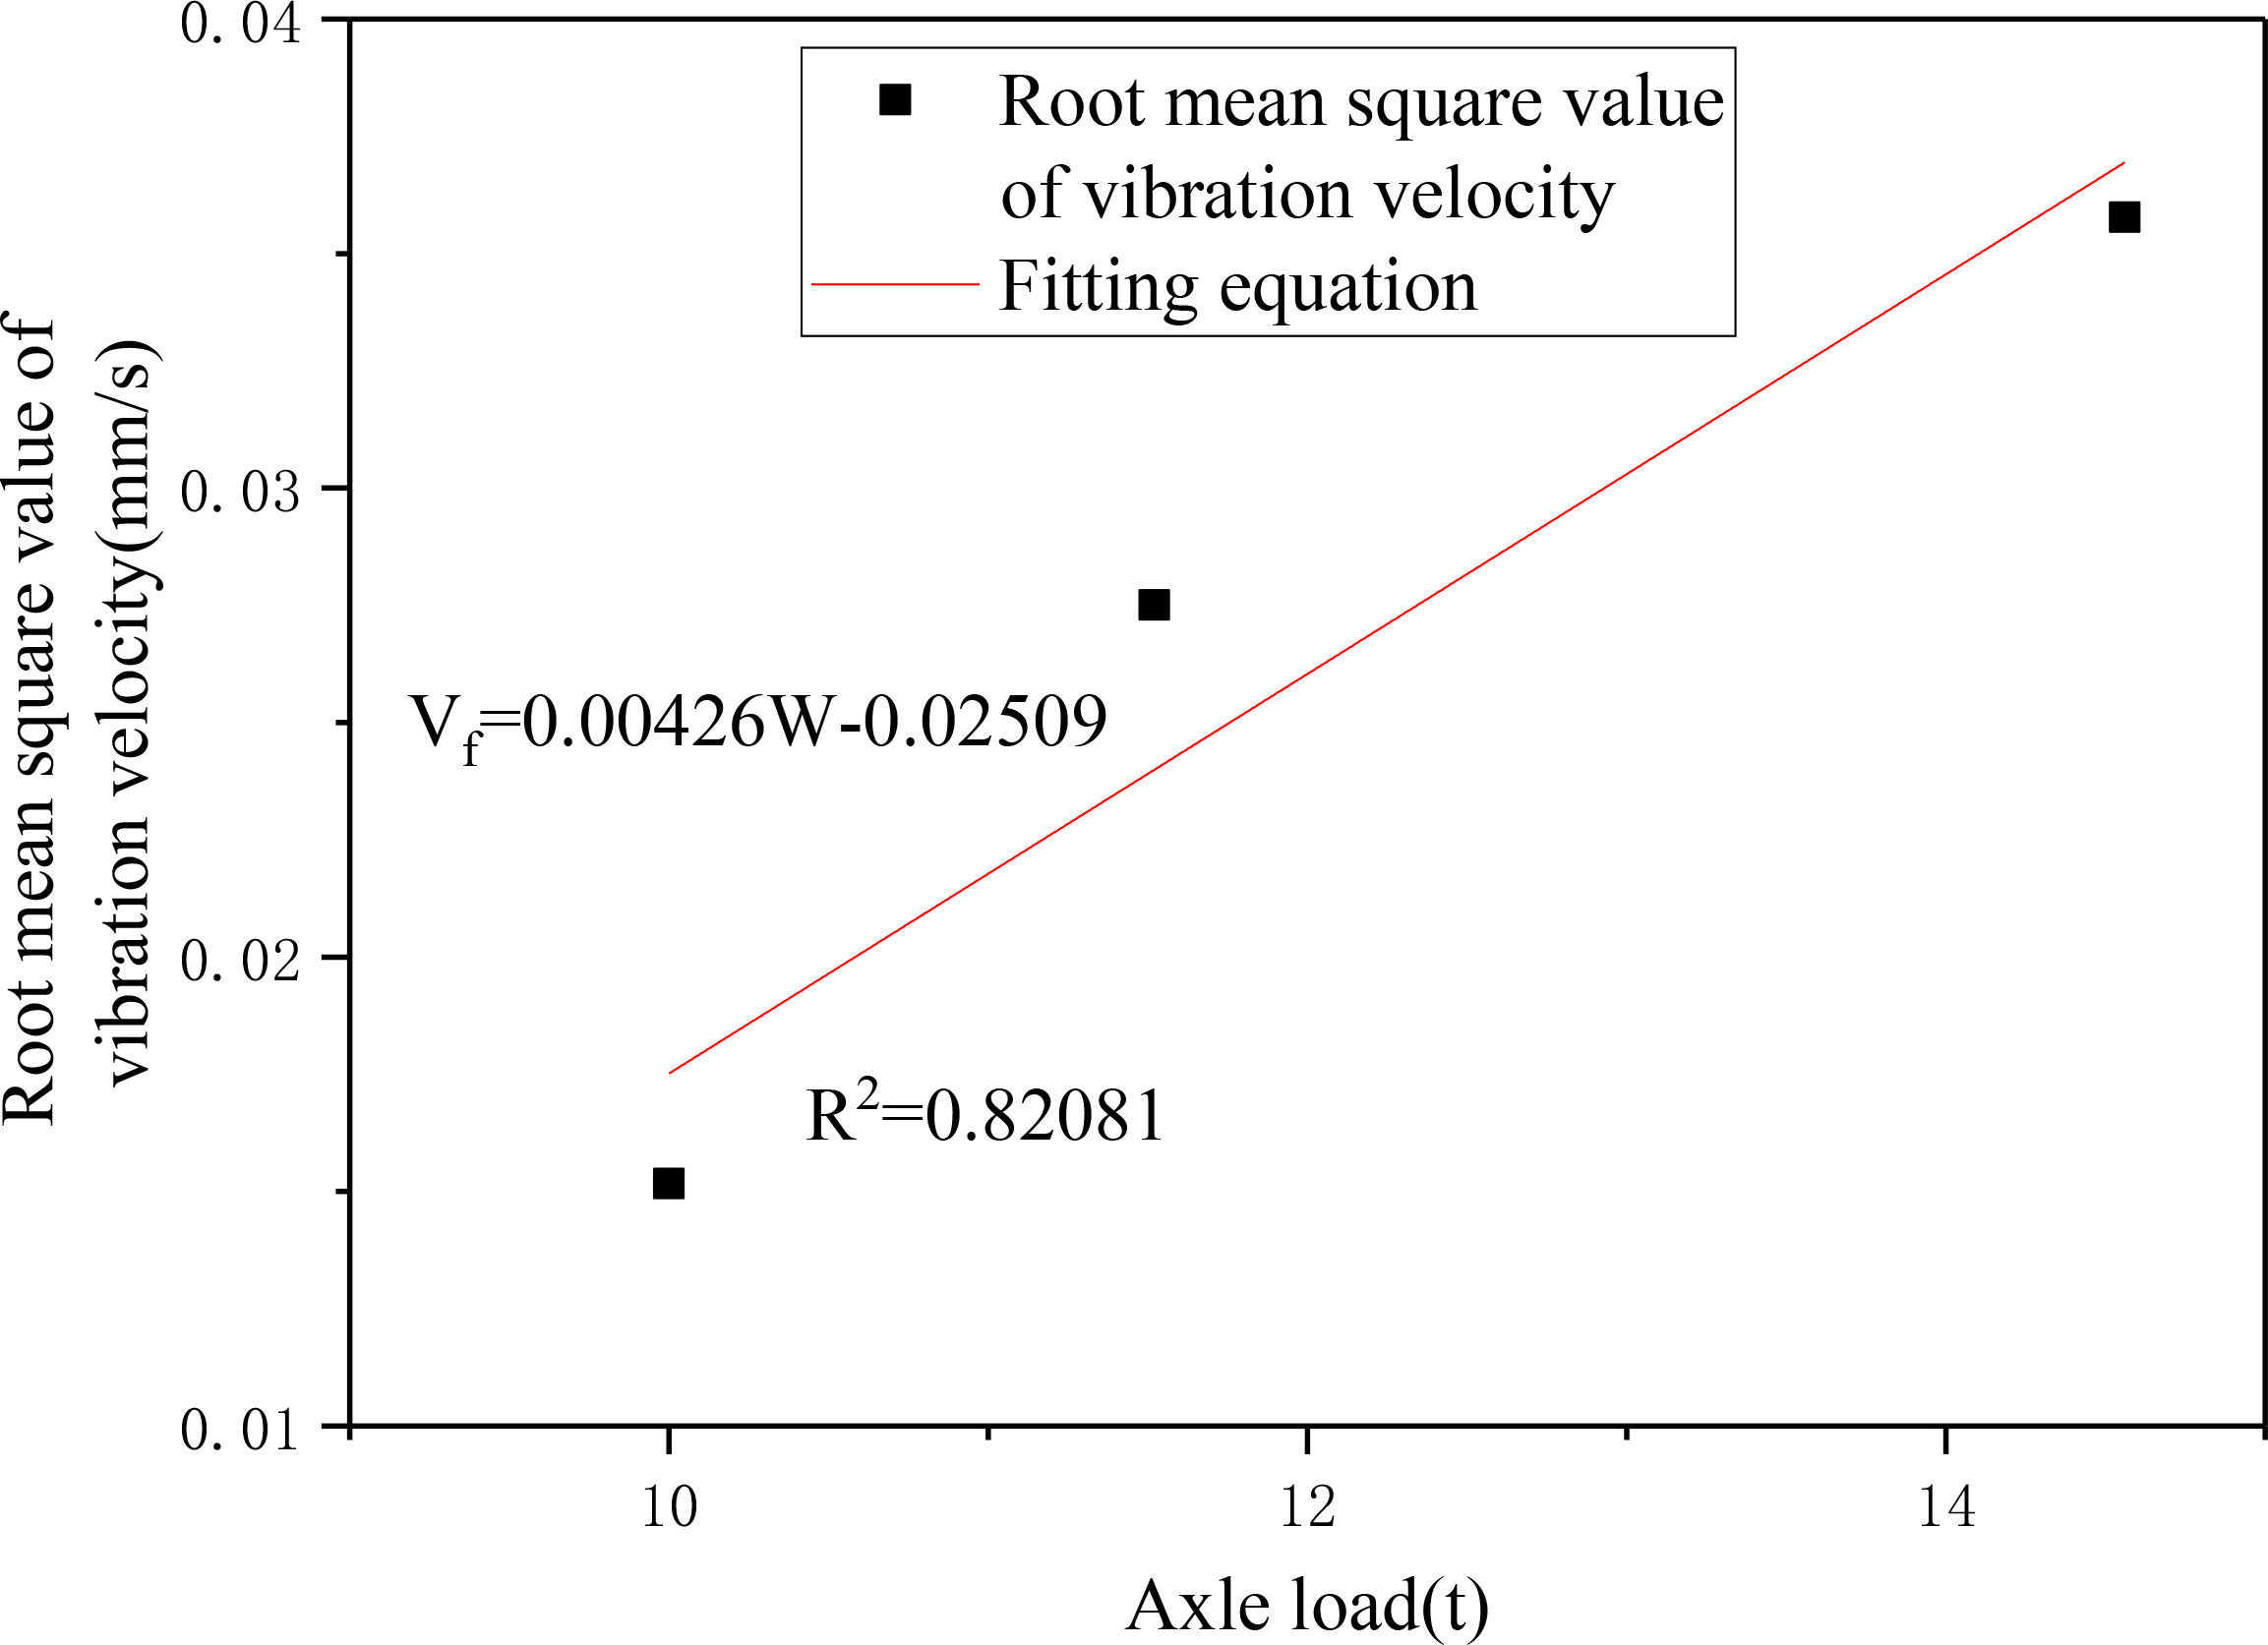
Figure 19 Fitting curve of the root mean square value of vertical vibration in the 3.15 Hz frequency band in ancient seawall with respect to axle load changes.
4.2.2 One-third octave results for different vehicle speed conditions
An analysis of the time domain results of forced vibrations under different vehicle speed conditions using the 1/3 octave method is conducted, and the results are shown in Figure 20. As can be observed from the figure, the distribution pattern of the 1/3 octave band of the three-directional vibrations of the ancient seawall generally shifts to the right as the vehicle speed increases. The peak values of the three-directional vibrations under different vehicle speed conditions are mainly concentrated in the 0-10 Hz frequency band. In combination with Table 5, it can be seen that the vehicle moving axle load excitation frequencies (f1) are 4.27 Hz, 8.55 Hz, and 12.82 Hz, as indicated by the vertical lines in Figure 20. Due to the Doppler effect of the moving load, peak values appear on both sides of f1 in the 1/3 octave spectra for all three vehicle speed conditions.
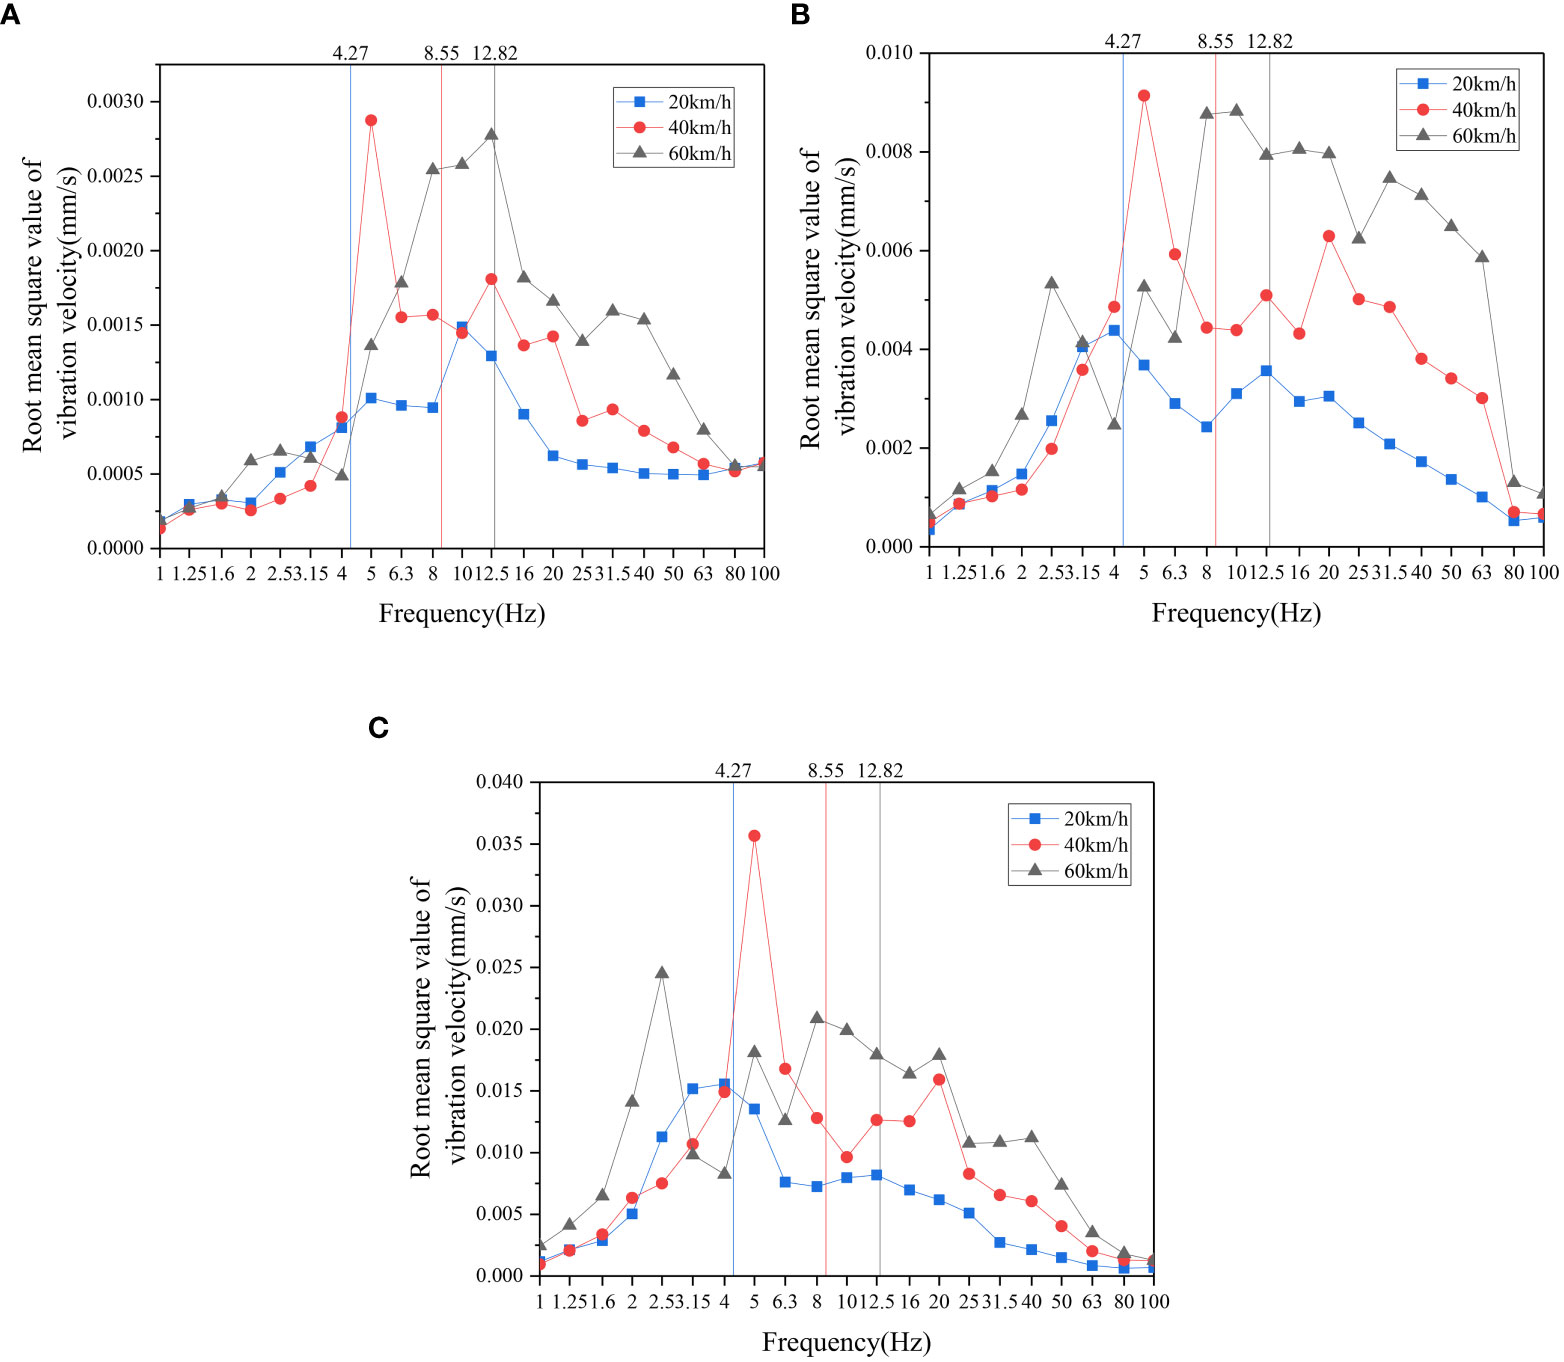
Figure 20 Forced vibration one-third octave curves of ancient seawall structure under different vehicle speed conditions. (A) Horizontal direction X. (B) Horizontal direction Y. (C) Vertical direction Z.
Based on the above analysis, it can be concluded that the characteristic frequencies of the ancient seawall are 3 Hz and 10 Hz, and the overall change in the vibration response of the ancient seawall structure caused by vehicle passage behind the embankment is the same, with a general downward trend as the frequency increases. The three-directional vehicle-induced vibrations of the ancient seawall structure are mainly concentrated within the 0-30 Hz frequency band, with the high-frequency vibrations significantly attenuated and the three-directional vibrations virtually zero for frequencies greater than 50 Hz.
5 Analysis and discussion
The ancient seawall is a national-level protected site, and according to the current standard “Technical specifications for protection of historic buildings against man-made vibration “, considering the structure type, materials used, protection level, and the propagation speed of elastic waves in the ancient seawall structure, the allowable vibration limit value for the ancient seawall structure is 0.25 mm/s.
As can be seen from Tables 3, 4, the vertical vibration velocity peak values of the ancient seawall structure under the conditions of an axle load of 14.56 t and vehicle speeds of 40 km/h and 60 km/h would exceed the aforementioned allowable vibration limit value of 0.25 mm/s. Comparing the sensitivity of the ancient seawall structure’s vibrations to vehicle speed and axle load, it can be concluded that controlling the speed of construction vehicles is an effective measure to reduce the vibration response of the ancient seawall. Specifically, based on the fitting curves from Figures 13 and 15, Table 6 presents the speed limits for tri-axle trucks under empty load and towing 1-3 sheet piles, ensuring the vibration safety of the ancient seawall cultural relics.
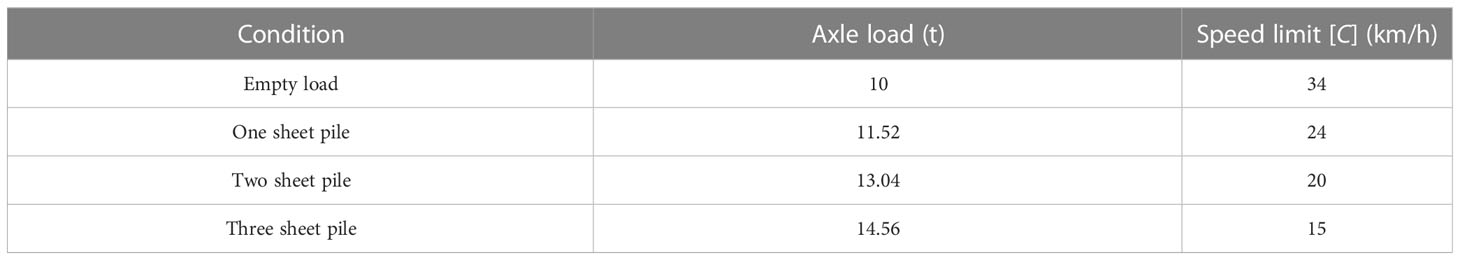
Table 6 Speed limits for different loading conditions of triaxial loaded vehicles.
6 Conclusion
In this study, we conducted field measurements of the ancient seawall’s vibrations and the vibration response of the ancient seawall under different construction vehicle speeds and loads. The test results were analyzed in terms of time-domain extremes and frequency-domain characteristics. The characteristic frequencies of the ancient seawall were investigated, leading to the following conclusions:
1. The vibration measurements showed that vehicle traffic primarily induced vertical vibrations in the ancient seawall structure.
2. The characteristic frequencies of the ancient seawall were 3 Hz and 10 Hz, and three-directional vibrations induced by vehicles were mainly concentrated in the 0-30 Hz frequency range. High-frequency vibrations exhibited severe attenuation, with three-directional vibrations virtually zero above 50 Hz.
3. Comparing the allowable vibration limits specified in the “Technical specifications for protection of historic buildings against man-made vibration, “ it was evident that the vertical vibration velocity peaks of the ancient seawall structure induced by a 14.56-ton axle load and vehicle speeds of 40 km/h and 60 km/h exceeded the allowable vibration speed limits, posing risks to the structural integrity of the ancient seawall.
4. Empirical relationships between the time-domain maximum vibrations of the ancient seawall and axle load and vehicle speed were established based on the measurement results. Using the allowable vibration speeds proposed in the “Technical specifications for protection of historic buildings against man-made vibration “ as limiting values, the maximum vehicle speeds under different load conditions for allowable vibration limits were calculated as follows: unloaded vehicles should not exceed 34 km/h, vehicles carrying one pile (3.8 t) should not exceed 24 km/h, vehicles carrying two piles (7.6 t) should not exceed 20 km/h, and vehicles carrying three piles (11.4 t) should not exceed 15 km/h.
Data availability statement
The original contributions presented in the study are included in the article/Supplementary Material. Further inquiries can be directed to the corresponding author.
Author contributions
Conceptualisation: LS, SZ and LZ. Methodology: XT, MH and LS. Formal analysis: LZ and XT. Writing—original draft preparation: LS, SZ, MH and XT. Data curation: SZ and MH. Writing—review and editing: LS, MH and LZ. All authors have read and agreed to the published version of the manuscript. All authors contributed to the article and approved the submitted version.
Funding
This study was supported by 2021 Zhejiang Provincial Water Resources Department Science and Technology Plan Project (RB2123).
Conflict of interest
Authors XT, MH, and LZ was employed by Huadong Engineering Corporation Limited.
The remaining authors declare that the research was conducted in the absence of any commercial or financial relationships that could be construed as a potential conflict of interest.
Publisher’s note
All claims expressed in this article are solely those of the authors and do not necessarily represent those of their affiliated organizations, or those of the publisher, the editors and the reviewers. Any product that may be evaluated in this article, or claim that may be made by its manufacturer, is not guaranteed or endorsed by the publisher.
References
Alan S., Caliskan M. (2017). “Prediction of ground-borne vibrations on historical structures due to tram traffic in antalya, Turkey,” in Proceedings of Meetings on Acoustics, Honolulu, Hawaii. (Acoustical Society of America), 065007. doi: 10.1121/2.0000555
Aras F., Krstevska L., Altay G., Tashkov L. (2011). Experimental and numerical modal analyses of a historical masonry palace. Construction Building Mater. 25, 81–91. doi: 10.1016/j.conbuildmat.2010.06.054
Cai C., Gao L., He X., Zou Y., Yu K., Wu D. (2021). The surface wave attenuation zone of periodic composite in-filled trenches and its isolation performance in train-induced ground vibration isolation. Comput. Geotech. 139, 104421. doi: 10.1016/j.compgeo.2021.104421
Chen J., Geng J., Gao G., Luo W., Liu Y., Li K. (2022). Mitigation of subway-induced low-frequency vibrations using a wave impeding block. Transportation Geotech. 37, 100862. doi: 10.1016/j.trgeo.2022.100862
Cheng G., Shan Y., Zhou X. (2022). “Influence of metro vehicle operation on adjacent high-speed railway bridge pier,” in Advances in transportation geotechnics IV, lecture notes in civil engineering. Eds. Tutumluer E., Nazarian S., Al-Qadi I., Qamhia I. I. A. (Cham: Springer International Publishing), 963–974. doi: 10.1007/978-3-030-77238-3_72
Crispino M. (2001). Measurement and prediction of traffic-induced vibrations in a heritage building. J. Sound Vib. 246 (2), 319–335. doi: 10.1006/jsvi.2001.3648
De Angelis A., Lourenço P. B., Sica S., Pecce M. R. (2022). Influence of the ground on the structural identification of a bell-tower by ambient vibration testing. Soil Dynamics Earthquake Eng. 155, 107102. doi: 10.1016/j.soildyn.2021.107102
Fan F., Chen J., Wang J. (2018). Protection of historical buildings in metro line construction: a case study in shanghai, China. J. Shanghai Jiaotong Univ. (Sci.) 23, 490–504. doi: 10.1007/s12204-017-1883-8
GB/T 3241-2010. (2010). Electroacoustics-octave-band and fractional-octave-band filters (Beijing: Chinese Standards Press).
GB/T 50452-2008. (2008). Technical specifications for protection of historic buildings against man-made vibration (Beijing: China Architecture & Building Press).
GB 6722-2014. (2015). The national standards compilation group of people's republic of China (Beijing: Chinese Standard Press).
Gentile C., Saisi A. (2007). Ambient vibration testing of historic masonry towers for structural identification and damage assessment. Construction Building Mater. 21, 1311–1321. doi: 10.1016/j.conbuildmat.2006.01.007
Hinzen K.-G. (2014). Subway-induced vibrations in cologne cathedral. Seismol. Res. Lett. 85, 631–638. doi: 10.1785/0220140003
Jiang Y., Wang J., Fang Y., Qi C., He C. (2012). “Analysis of impact of shield tunnel construction on xi’an bell tower in loess strata, in: ICPTT 2012,” in ICPTT 2012: Better Pipeline Infrastructure for a Better Life, Wuhan, China. (American Society of Civil Engineers), 1574–1584. doi: 10.1061/9780784412619.160
Lacanna G., Ripepe M., Marchetti E., Coli M., Garzonio C. A. (2016). Dynamic response of the baptistery of San Giovanni in Florence, Italy, based on ambient vibration test. J. Cultural Heritage 20, 632–640. doi: 10.1016/j.culher.2016.02.007
Li M., Ma M., Cao Z., Xia Q., Liu W. (2021). Dynamic response analysis of train-induced vibration impact on the probhutaratna pagoda in Beijing. Earthq. Eng. Eng. Vib. 20, 223–243. doi: 10.1007/s11803-021-2016-9
Ma M., Cao Y., Sun X., Liu W. (2018). “Prediction of metro train-induced vibrations on a historic building: the case of the round city and chengguang hall in Beijing,” in Recent developments in railway track and transportation engineering, sustainable civil infrastructures. Eds. Pombo J., Jing G. (Cham: Springer International Publishing), 133–141.
Ma M., Liu W., Qian C., Deng G., Li Y. (2016). Study of the train-induced vibration impact on a historic bell tower above two spatially overlapping metro lines. Soil Dynamics Earthquake Eng. 81, 58–74. doi: 10.1016/j.soildyn.2015.11.007
Ma M., Markine V., Liu W., Yuan Y., Zhang F. (2011). Metro train-induced vibrations on historic buildings in chengdu, China. J. Zhejiang Univ. Sci. A. 12, 782–793. doi: 10.1631/jzus.A1100088
Meng Z., Chang Y., Song L., Yuan J. (2009). “The effects of micro-vibration excited by traffic vehicles on xi’an bell tower, in: international conference on transportation engineering 2009,” in International Conference on Transportation Engineering 2009, Southwest Jiaotong University, Chengdu, China. (American Society of Civil Engineers), 37–42. doi: 10.1061/41039(345)7
Pal Roy P., Sawmliana C., Singh R. K. (2016). Safety concerns of ancient temple due to blasting in adjacent mines. Geotech. Geol. Eng. 34, 901–909. doi: 10.1007/s10706-016-0013-y
Sadeghi J., Esmaeili M. H. (2017). Safe distance of cultural and historical buildings from subway lines. Soil Dynamics Earthquake Eng. 96, 89–103. doi: 10.1016/j.soildyn.2017.02.008
Vogiatzis C. (2000). ‘Vibration at buildings of high cultural value from tbm operation at athens metro line: akademia - syntagma.” in Inter-noise and noise-con congress and conference proceedings. (Institute of Noise Control Engineering).
Wang H., Zhang C., Jiang J., Huang W., Guo D., Sheng T. (2022). Vibration characteristics and isolation in vibration-sensitive areas under moving vehicle load. Soil Dynamics Earthquake Eng. 153, 107077. doi: 10.1016/j.soildyn.2021.107077
Watts G. R. (1992). The generation and propagation of vibration in various soils produced by the dynamic loading of road pavements. J. Sound Vibration 156, 191–206. doi: 10.1016/0022-460X(92)90692-Q
Xin Y., Li X., Wang J. (2019). “Risk analysis of the impact of metro construction activities on cultural relics,” in Proceedings of the Sixth Symposium of Risk Analysis and Risk Management in Western China (WRARM 2019), Kunming, China. (Atlantis Press), doi: 10.2991/wrarm-19.2019.39
Xiong J., Si J., Zheng Y. (2020). Analysis of controlled blasting for Large-span tunnel passing beneath cultural relics building. IOP Conf. Ser.: Mater. Sci. Eng. 741, 12105. doi: 10.1088/1757-899X/741/1/012105
Yang W., Yuan R., Wang J. (2018). Vibration induced by subway trains: open-trench mitigation analysis in the time and frequency domains. Shock Vibration 2018, 1–16. doi: 10.1155/2018/1879392
Keywords: vehicle traffic, ancient seawall, vibration, field measurement, time-domain analysis, frequency-domain analysis
Citation: Zhu S, Tu X, Hu M, Shi L and Zhou L (2023) Field investigation on the impact of vehicle traffic on the vibration of ancient seawalls in Qiantang River. Front. Mar. Sci. 10:1212413. doi: 10.3389/fmars.2023.1212413
Received: 26 April 2023; Accepted: 19 June 2023;
Published: 05 July 2023.
Edited by:
Shengjie Rui, Norwegian Geotechnical Institute (NGI), NorwayReviewed by:
Xun Zhang, Southwest Jiaotong University, ChinaYong Rui, Ningbo University, China
Hang Xu, Zhejiang University, China
Copyright © 2023 Zhu, Tu, Hu, Shi and Zhou. This is an open-access article distributed under the terms of the Creative Commons Attribution License (CC BY). The use, distribution or reproduction in other forums is permitted, provided the original author(s) and the copyright owner(s) are credited and that the original publication in this journal is cited, in accordance with accepted academic practice. No use, distribution or reproduction is permitted which does not comply with these terms.
*Correspondence: Li Shi, bGlzaGlAemp1dC5lZHUuY24=