 Yafei Duan1,2,3
 Zhaowei Liu
94% of researchers rate our articles as excellent or good
Learn more about the work of our research integrity team to safeguard the quality of each article we publish.
Find out more
ORIGINAL RESEARCH article
Front. Mar. Sci., 09 June 2023
Sec. Marine Ecosystem Ecology
Volume 10 - 2023 | https://doi.org/10.3389/fmars.2023.1211981
This article is part of the Research TopicFlow, Mass Transport and Ecological Process in Land-Freshwater-Marine Ecosystems on EarthView all 11 articles
While remote sensing images could convey essential information of surface water environment, the low spatial resolution limits their application. This study carried out a series of experiment tests of thermal discharge from a coastal power plant and constructed an image dataset HY_IRS, representing the transport and diffusion of discharged heated water in tidal waters. Two image super-resolution (SR) reconstruction models based on deep learning (DL), ESPCN and ESRGAN, were trained based on this dataset and then used to reconstruct high-resolution remote sensing images. It shows that the two DL models can markedly improve the spatial resolution of the surface diffusion image of thermal discharging, with the PSNR improved by 8.3% on average. The trained two models were successfully used to improve the spatial resolution of thermal infrared remote sensing SST images from Landsat8 TIRS, indicating that the SR model based on DL has a good effect and a crucial application prospect in the field of improving the resolution of pollutant diffusion remote sensing images.
Remote sensing images are an essential data source for surface environmental monitoring. However, their spatial resolution is generally low due to the long distance between sensor and observation object as well as the technical limitation of photosensitive device in camera. Table 1 summarizes the current thermal infrared d satellite remote sensing techniques, which involve surface temperature information. It can be found that their spatial resolution is around 0.1~1km (Hu et al., 2017). This low spatial resolution makes it unsatisfactory to meet the needs both in scientific research and engineering management. Specifically, the satellite remote sensing is supposed to assist in assessing the impact of thermal discharge by coastal power plants, but in reality the temperature rise area cannot be accurately determined due to the low spatial resolution of sensing images. In the case of near-surface field monitoring and indoor tests, industrial thermal infrared cameras are often used to photograph the thermal effluent dispersion patterns. However, due to the large size of the lens imaging unit of the uncooled thermal infrared imager, the low imaging pixels of the camera (currently, the number of pixels per side of the images produced by state-of-the-art industrial thermal infrared cameras at most 640). In most cases, it is often necessary to carry the camera on a platform far away from the test object (such as low-flying unmanned aerial vehicles) to capture the full-field patterns, resulting in failure to capture a clear and detailed thermal pollutant diffusion field from the sensing inversion images.
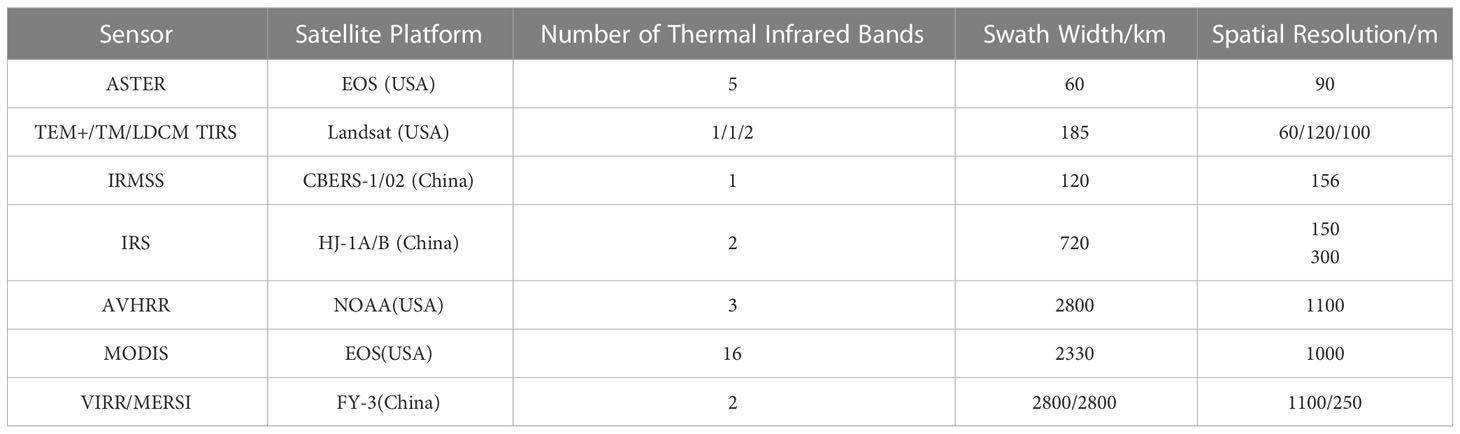
Table 1 Current thermal infrared satellite remote sensing images and their spatial resolutions.
Super-resolution (SR) reconstruction refers to the technology focusing on constructing high-resolution (HR) images from low-resolution (LR) ones. SR techniques can be classified into three categories: reconstruction-based, sample learning-based, and deep learning (DL)-based (Tang et al., 2020; Xia et al., 2021). Among them, the f data-driven DL-based image super-resolution algorithms have been significantly improved since 2014, and subsequently applied in computer vision and image processing, which becomes the hotspot in SR research (Wang et al., 2020). The first DL-based SR model is the Super-Resolution Convolutional Neural Network (SRCNN) model based on a pure convolutional neural network proposed by Dong et al. (2014). In 2016, Shi et al. (2016) improved the SRCNN by introducing sub-pixel convolution layers and proposed the Efficient Sub-Pixel Convolutional Neural Network (ESPCN) model. The ESPCN model offers a computationally efficient solution by leveraging sub-pixel convolution layers, which perform upscaling in the feature space rather than the image space. This design significantly reduces computational complexity and memory requirements, allowing the model to perform super-resolution tasks at a much faster rate compared to the traditional methods. Subsequently, the Super-Resolution Generative Adversarial Network (SRGAN) model, combining residual networks and generative adversarial networks (GANs), has been developed with a more satisfactory performance. In 2018, Wang et al. (2018) proposed the Enhanced Super-Resolution GAN (ESRGAN) model, an extension of the SRGAN introducing several significant improvements, which includes a generator, a discriminator, and a feature extraction network. Recently, the application of a transformer-based approach was presented in (Lu et al., 2022), named the Efficient Super-Resolution Transformer, and it has also been successfully applied to image super-resolution reconstruction. Deep learning techniques continue to outperform traditional based algorithms in terms of efficiency and effectiveness due to end to end training (Bashir et al., 2021). Deep learning algorithms carry flexibility which could handle super resolution issue with different scale factors, blur kernels and noise levels inside a unified maximum a posteriori framework (Dawa et al., 2023). Overall, the ESPCN and ESRGAN models are currently the most advanced and widely-used SR models.
The fates of pollutants in water are dominated by the dynamic flow and the turbulent field, resulting in the chaotic but organized distribution patterns and boundaries (Figure 1A). However, the current ESPCN and ESRGAN SR models are usually developed for universal use and thus trained by diverse categories data (Figure 1B), consequently they cannot specifically address SR for pollutant diffusion images in natural waters. In recent years, DL has been applied to SR research on geographic remote sensing images (Dong et al., 2020; Li et al., 2020; Shen et al., 2020; Zhang et al., 2020; Guo et al., 2021). Nevertheless, the satellite images used for model training generally have a low resolution, resulting in an insufficient capture of the details of pollutant diffusion field such as the turbulent diffusion driven by small-scale vortices.
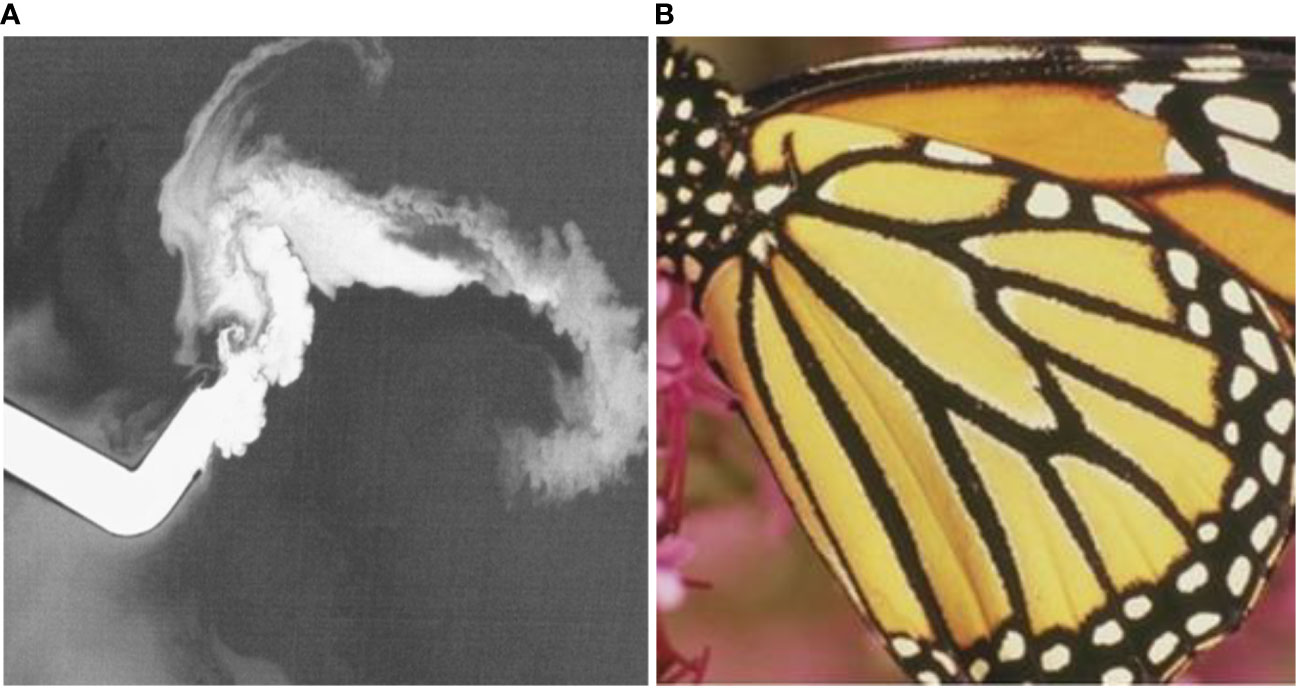
Figure 1 Typical distribution patterns of pollutant transport in natural waters (A) and a typical image (a butterfly image from the DIV2K dataset) used in DL SR model training (B).
Taking the thermal discharge in cooling water from a coastal power plant as an example, this study aims to establish a thermal infrared imaging dataset for surface temperature measurement. The ESPCN and ESRGAN models were trained and tested to conduct SR research on the images of surface-water pollutants diffusion, and then applied to the satellite remote sensing images of thermal discharge from a coastal power plant to evaluate the effectiveness of image quality improvement by DL models.
The dataset used in this study consists of continuously-observed thermal infrared images in a physical test for the cooling water discharged from a coastal power plant. The power plant uses raw seawater for cooling, which is drawn vis a channel on the southeast side of the plant and discharged through another channel on the west side. The layout of the water intake and discharge can be found in Figure 2A. The study area locates in a typical irregular semi-diurnal tidal zone, with tidal durations of 346 minutes and 397 minutes for the flooding tide and ebbing tide periods, respectively.
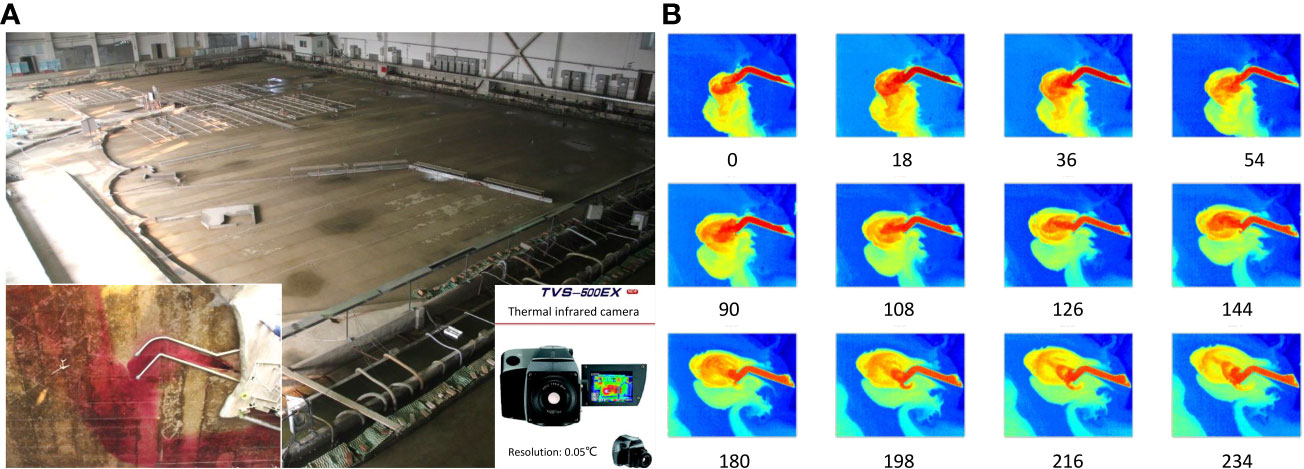
Figure 2 Physical model test of the thermal discharge from a coastal power plant (A), and the thermal infrared images captured by TVB-500EX infrared thermal imager (B).
A series of physical model experiments were conducted to study the thermal discharge. Experiment scenarios include two types of heat discharge, three types of tides (typical spring, moderate, and neap tides) in two seasons (winter and summer), and two types of open channel discharge schemes. The experiments were designed based on gravity and buoyancy similarity, with the detailed parameters shown in Table 2. The surface thermal diffusion field was obtained by the TVS-500EX thermal infrared camera (Produced by NEC Corporation of Japan), with a temperature detection sensitivity of 0.1 °C and an imaging size of 320×240 pixels. The camera was installed at a height of 7 meters above the water surface, and the shooting interval was 3 seconds in the experiment, corresponding to 1.64 minutes in the prototype. Some images captured by the camera are listed in Figure 2B. During the experiment, the ambient temperature in the lab was 4.1 °C, and the emissivity of water body was 0.97.
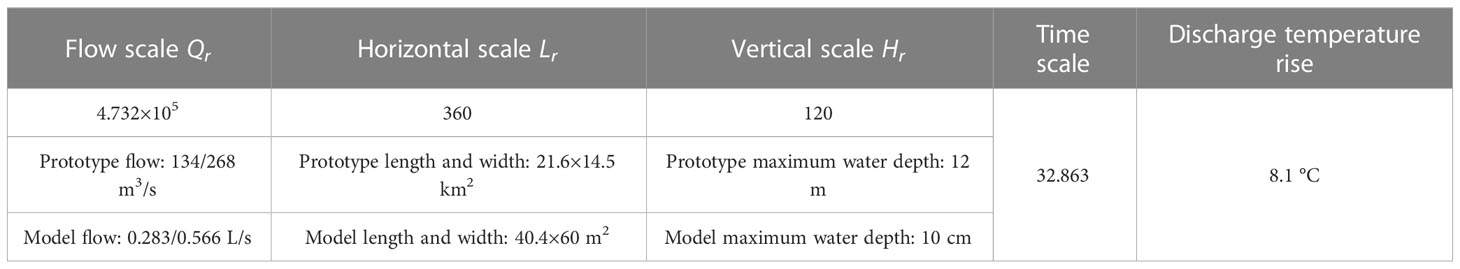
Table 2 Design parameters of the physical test for thermal discharge from a coastal power plant.
The experimentally acquired images were organized into a dataset named HY_IRS dataset including 10736 thermal infrared images of cooling water discharge under different experiment conditions was obtained. These images were converted into grayscale images with a resolution of 320×240 pixels and randomly divided into a training set (8701 images), a validation set (1535 images), and a test set (500 images). The training set samples were generated by down-sampling the original images with a 1/4 scaling factor (i.e., r=4).
During the summer of 2020, prototype monitoring of the sea surface temperature (SST) in the vicinity of the power plant was conducted using ship-based measurements, unmanned aerial vehicles, and satellite remote sensing. Seventeen cloudless satellite images (since the nuclear power plant has been in operation since October 2018) were obtained from Landsat8 TIRS. The C1 Level1 data products of thermal infrared bands 10 and 11 of the TIRS sensor were selected. The SST of the TIRS data was retrieved using the atmospheric correction method based on the radiative transfer equation and the atmospheric correction parameter calculator provided by National Oceanic and Atmospheric Administration of United States (NOAA) (Barsi et al., 2003), making use of the meteorological data collected from the local meteorological tower. The spatial resolution of the SST retrieval images from Landsat8 TIRS was 100 meters per pixel.
Through improving the ESPCN and ESRGAN architectures, SR models for thermal infrared diffusion images of cooling water discharge from the power plant were established.
The DL-based ESPCN model proposed by Shi et al. (2016) was specifically designed for single-image SR tasks, with the primary objective of upscaling LR images to HR ones while retaining or even enhancing the perceptual quality. In its architecture, the feature maps are extracted in the LR space, and an efficient sub-pixel convolution layer which learns an array of upscaling filters to upscale the final LR feature maps into the HR output is introduced. The handcrafted bicubic filter in the SR pipeline is replaced with more complex upscaling filters specifically trained for each feature map, whilst reducing the computational complexity of the overall SR operation.
The underlying architecture of ESPCN comprises three key components: a convolutional feature extraction layer, a non-linear mapping layer, and a sub-pixel convolution layer.
Convolutional Feature Extraction Layer: The initial layer in the ESPCN model is dedicated to extracting essential features from the LR input image. This layer employs a set of convolutional filters, which are convolved with the input image to generate feature maps. The purpose of this process is to capture both local and global structures present in the image which are crucial for reconstructing the HR output.
Non-linear Mapping Layer: Following the feature extraction layer, the second layer aims to establish a non-linear mapping between the extracted features and the HR image representations. This layer consists of multiple convolutional filters which are applied to the previously generated feature maps. These filters are responsible for learning the complex relationships between the LR input and the HR output, enabling the model to effectively upscale the image.
Sub-pixel Convolution Layer: The final component of the ESPCN architecture is the sub-pixel convolution layer, also known as the upscaling or deconvolution layer. This layer performs a pixel-shuffle operation to rearrange the feature maps produced by the non-linear mapping layer into a HR output. The sub-pixel convolution layer ensures that the reconstructed image retains the spatial characteristics of the input image while minimizing computational complexity and memory usage.
In this study, MeanSquaredError was used as the loss function and the Adam was adopted as the optimizer with 0.001 learning rate. The architecture of the ESPCN model consists of three convolution layers for feature maps extraction, and a sub-pixel convolution layer that aggregates the feature maps from LR space and builds the SR image in a single step. The last layer is processed to convert the LR feature maps to a HR image. r=4 is referred to the upscaling ratio when downsample the image; nl is the number of features at layer l, (where l ∈ (1, L − 1) for a network with L layers, L=5 in this model); n0 = 3 is equal to the color channels of the image in this work. The output shapes of layer 1 to 5 are 1, 64, 64, 32, 16, 1, with 0, 1664, 36928, 18464, 4624, 0 parameters respectively. This architecture avoids upscaling LR image before feeding it into the network. It first applied a l layer convolutional neural network directly to the LR image, and then applied a sub-pixel convolution layer that upscaled the LR feature maps to produce SR image. After the input layer, one convolutional layer was added in accordance with Shi et al. (2016). The channel numbers of the three conventional 2D convolutional layers were 64, 64, and 32, respectively, with convolution kernel sizes of 5, 3, and 3, and finally follows a 2D convolutional layer with r2 = 42 channels, with a kernel size of 3×3. The network was trained with input training images of size (320/4) × (240/4). The total number of network parameters was 61680.
ESRGAN introduces several enhancements to the original SRGAN model, such as the incorporation of the Residual-in-Residual Dense Block (RRDB) architecture, a relativistic discriminator, and an improved loss function that combines perceptual, adversarial, and content losses. These innovations result in superior performance and the ability to generate HR images with enhanced perceptual quality, finer details, and fewer artifacts. The ESRGAN model consists of a generator, a discriminator, and a feature extraction network.
Generator: The generator in ESRGAN is responsible for producing HR images from the given LR inputs. The architecture of the generator is based on the RRDB design, which is an enhanced version of the residual dense block in the original SRGAN. RRDB incorporates a hierarchical residual learning mechanism to facilitate efficient information flow and gradient propagation, allowing the generator to capture both global and local features effectively. The generator consists of multiple RRDBs, followed by an upscaling layer that employs sub-pixel convolution to upscale the generated feature maps into an HR image.
Discriminator: The discriminator in ESRGAN is designed to distinguish the HR images generated by the generator from the ground truth HR images. The architecture of the discriminator is based on a deep convolutional neural network, which includes several convolutional, batch normalization, and Leaky ReLU activation layers. The primary objective of the discriminator is to guide the generator towards producing more realistic and perceptually convincing HR images.
Feature Extraction Network: In addition to the generator and discriminator, ESRGAN employs a feature extraction network to compute the perceptual loss during the training process. The perceptual loss is calculated as the difference between these extracted features, encouraging the generator to produce images with similar high-level structures and characteristics as the ground truth.
The ESRGAN model selects the optimal parameters trained on the bicubically down-sampled DIV2K dataset (https://tfhub.dev/captain-pool/esrgan-tf2/1). The network architecture used in this study is shown in Figure 3. Compared with the traditional SRGAN, this network removes all batch norm (BN) layers from residual block (RB) and replaces the original basic block with RRDB, which combines a multi-layer residual network and dense connection, and introduces a residual scaling factor β.

Figure 3 The network architecture of ESRGAN model in this work redrawn based on the model proposed by Wang et al. (2018). Residual in Residual Network consisting of convolution layers, residual in residual block (RB) as the trunk of the model, pixel shuffler layers, and the upscaling convolutional layers. All BN layers in RB are removed compared the standard SRGAN model, the RRDB block is added to replace the original basic block, and β is the residual scaling parameter.
As for the loss function design, the following three image training effect evaluation indicators are combined in the standard ESPCN model and ESRGAN model:
(1) Mean squared error (MSE) of image interpolation;
(2) Peak signal-to-noise ratio (PSNR),
where n represents the bit depth of each pixel in the image, which is 8 in this study.
SR algorithms are typically evaluated by several widely-used distortion measures, such as PSNR. Compared with the subjective evaluation of images by human observers, PSNR is more objective in evaluating the effect of image signal processing (Ledig et al., 2017). Human visual quality is more sensitive to the low spatial frequencies and more sensitive to brightness compared to chromaticity. Besides, visual judgment could be easily affected by neighbouring pixels. Generally, for image reconstruction, a PSNR > 40 dB represents good quality, PSNR = 30~40 dB represents moderate quality, PSNR = 20~30 dB represents poor quality, and PSNR< 20 represents unacceptable quality.
(3) Hash fingerprint comparison between images
The hash fingerprints of the images are calculated using mean hash algorithm and difference hash algorithm. The main process is as follows: first, the image is converted to grayscale. In the mean algorithm, the mean value of grayscale within the whole image is calculated first; then traverse the gray value of each pixel, set it to 1 if it is greater than the mean value, and set it to 0 if it is less than the mean value, to form a fingerprint; finally, the similarities of corresponding pixels between the two images are compared, by calculating the proportion of the same number of pixels to the total number of pixels. In the difference algorithm, the pixel value is compared with the next pixel value in the order of rows and columns, and the greater is recorded as 1, and the smaller is recorded as 0, forming a fingerprint; finally, compare the similarities of the corresponding pixels of the two images, and count the proportion of the mean value of the same number to the total number of pixels.
The model was built using the DL framework TensorFlow 2.3.0. Model training and evaluation were conducted on an HP Z4G4 GPU workstation. The GPU parameters were NVIDIA Quadro RTX 4000, Cudnn 7.6.5 cuda10.1_0, RAM: 32.0GB, and Python 3.8.10.
During model training, the batch size was from 8 to 64, and EarlyStopping technique was used for regularization. The model was tested by training 20-100 epochs, and the model with the best performance in the last 100 batches was selected. The results showed that after 20 batches, the loss gradually stabilized, and the PSNR gradually increased to above 37, as shown in Figure 4A.
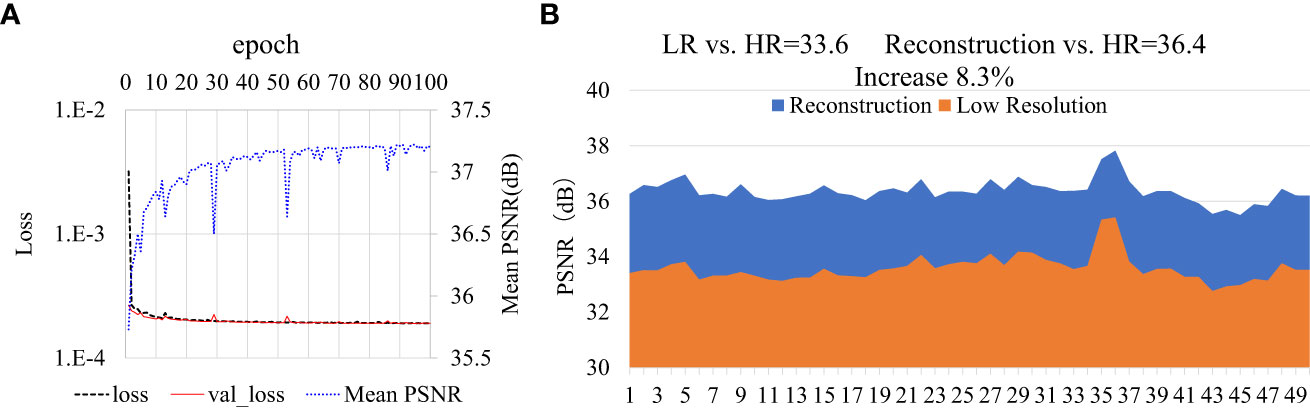
Figure 4 The training process of ESPCN model (A) and its result evaluation of PSNR for 50 selected test images (B). The model was tested by training 100 epochs, and the model with the best performance in the last 100 batches was selected. The results showed that after 20 batches, the loss gradually stabilized, and the PSNR gradually increased to above 37, as shown in subfigure (A). The val_loss (red line) is the value of cost function for the cross-validation data, and the loss (black dashed line) is the value of cost function for the training data. The mean PSNR for epoch is shown in blue dotted line. In subfigure (B), the orange results represent PSNR of LR image and HR image, and the blue results represent PSNR of ESPCN reconstruction and HR.
Fifty thermal infrared images, representing temperature fields on different tidal state, were selected from 500 images of temperature distribution under cooling water discharge. The ESPCN model was used to test the SR effect, and the traditional Bicubic method was used as the comparative baseline. The image quality of the model prediction was evaluated, as shown in Figure 5. The results showed that the average PSNR of the LR images obtained by Bicubic was 33.6, while the PSNR of the images reconstructed by the ESPCN model increased to 36.4, with an improvement in image resolution of 8.3%, as shown in Figure 4B. Although there is still some difference between “HR” and “ESPCN”, it is clear that the reconstructed HR images are significantly closer to the original HR images. The transport-diffusion patterns shaped by tidal flow and turbulence, as well as the irregular edge of the heated water could be better restored.
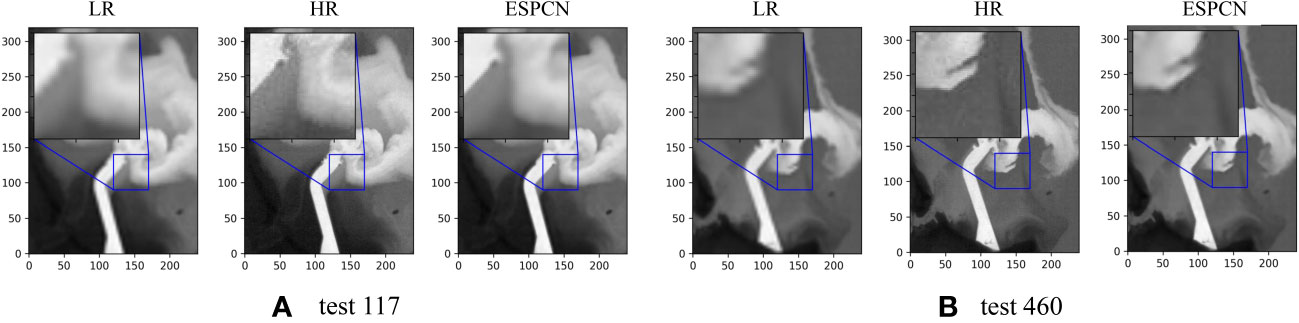
Figure 5 Two super-resolution reconstructed image samples by ESPCN model. As for the ebbing tidal image shown in (A), the PSNR increase by 8.1% from 33.26 (LR vs. HR) to 35.95 (ESPCN vs. HR). As for the flooding tidal image shown in (B), the PSNR increase by 10.6% from 32.91 (LR vs. HR) to 36.37 (ESPCN vs. HR).
The optimal ESPCN model trained on the HY_IRS dataset and the ESRGAN model trained on the DIV2K dataset were used to reconstruct 4x super-resolution Landsat8 SST inversion images (for the selected 18 views from Oct. 2018 to Dec. 2022). Since no original high-resolution image is available for satellite remote sensing images, the bicubic interpolation method was used as a baseline for comparison. The PSNR of the ESPCN predicted images and Bicubic is 33.96 on average (with maximum value 34.64 and minimum value 33.39), while that of the ESRGAN predicted images and Bicubic is 28.96 on average. Figure 6A shows the SR effect of remote sensing images at 2:30 GMT on December 24, 2018. It shows that both the two DL models improve the spatial resolution of remote sensing images and ensure coherence with the original images and the bicubic reconstructed images.
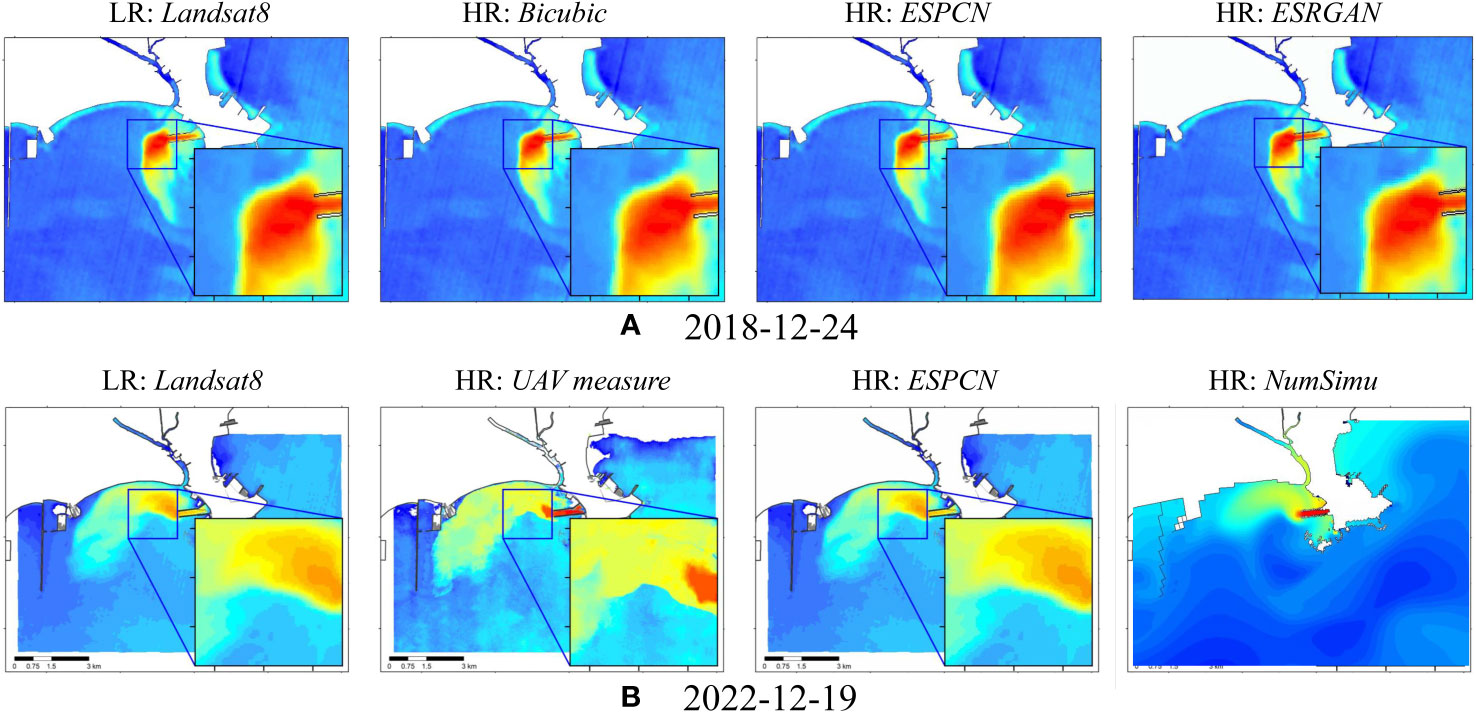
Figure 6 SR of Landsat8 TIRS thermal infrared satellite images based on DL models. Subfigure (A) shows the SR effect of remote sensing images at 2:30 GMT on December 24, 2018 based on ESPCN and ESRGAN; subfigure (B) compares the results obtained by all three methods, i.e., Landsat8 satellite remote sensing inversion, UAV remote sensing inversion, and numerical simulation.
The quantitative comparison and detailed analysis of the water surface temperature (SST) area, obtained by remote sensing before and after SR, as well as by the In-situ observation and numerical simulation, were conducted. Take the results of SST field near the coastal power plant on December 19, 2022 as an example. At 2:30 am GMT, a low-spatial-resolution (100m) image of the SST field was obtained using Landsat8 satellite remote sensing inversion, and we refer to it as the LR: Landsat8 Image. The image was inverted from the single-channel thermal infrared data on the satellite, through the atmospheric impact correction by method of MODTRAN atmospheric radiative transfer model. Simultaneously, we carried out thermal infrared remote sensing survey using a low-altitude UAV (with the Optris PI640 thermal infrared imager on board) and obtained a HR (1.2m) image of the SST field, and we refer to it as the UAV measure image. Both the inversion SST results obtained by satellite and UAV remote sensing were calibrated using a large number of direct measurements at the sea surface. Also, a SST three-dimensional numerical simulation was carried out using the Delft3D model (Deltares, FLOW2D3D Version 6.03.00.64634). In the simulation, meteorological data were obtained from the monitoring data at the power plant site and the reanalysis data CFSv2 of the National Centers for Environmental Prediction (NCEP). The corresponding simulation result is denoted as NumSimu. Finally, we reconstructed the 4x high-resolution image from the input of LR: Landsat8 Image by the trained ESPCN model that discussed above.
The results obtained by all the above methods are compared in Figure 6B. These areas of different temperature ranges (within the 134 km2 observation area) of all the methods are quantitatively analyzed for comparison, shown in Figure 7. Statistically, there are some visible differences between the statistical results of temperature areas obtained by low-resolution satellite remote sensing and that by the high-resolution UAV remote sensing. The mean relative error of temperature areas (from ≥0 to ≥015 °C) is -28.4%. At the same time, it can be found that the statistical area values of different temperature intervals of the images after SR reconstruction by DL model are closer to the high-resolution UAV real-world results. The mean relative error of temperature areas reduced to -11.4%. In contrast, the errors of temperature areas in the result of the numerical simulation are significantly larger, with an average relative error of 50.2%. Even some obviously difference in distribution shape of the temperature rise can be seen. It is understandable that the numerical simulations yielded poor results, since the numerical simulation of coastal water temperature is always a difficult task. There are many sources of errors in the simulation, such as numerical errors, inaccurate input meteorological conditions, errors in the calculation for tidal flow and surface heat exchange, etc. The use of DL models to improve image resolution has proven to be a very effective and fast way to achieve the goal of improving the statistical accuracy of SST remote sensing data.
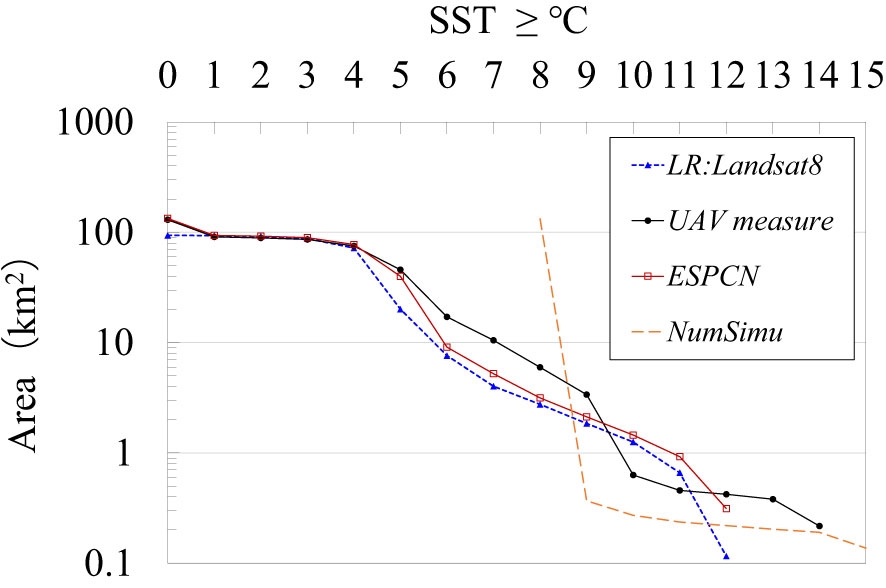
Figure 7 Quantitatively comparison in areas of different temperature ranges on 2022-12-19, acquired by different methods. LR: Landsat8 Image: the low-spatial-resolution (100m) image of the SST field from Landsat8 satellite remote sensing inversion; the UAV measure image: a high-spatial-resolution (1.2m) image of the SST field acquired by the thermal infrared remote sensing survey using a low-altitude UAV; NumSimu: a SST three-dimensional numerical simulation was carried out using the Delft3D model; HR : ESPCN: the 4x reconstructed HR image from the input of LR: Landsat8 Image by the trained ESPCN model.
In conclusion, the study carried out a series of physical tests of thermal discharge from a coastal power plant and built an image dataset HY_IRS, representing the pollutant transport and diffusion in tidal waters. Two SR models based on deep learning, ESPCN and ESRGAN, were trained based on this dataset. Dataset HY_IRS is designed to facilitate the development of SR models for thermal infrared images of cooling water discharge, which is of great significance for improving the accuracy of water pollution surveys and providing effective support for water environmental management.
Targeted training of deep learning-based image SR models using thermal infrared images of wastewater discharge experiments can effectively capture the distribution morphology of pollutant transport and diffusion in tidal waters and enhance spatial resolution for images of such substance diffusion fields. The average improvement of the spatial resolution of images is up to 8.3%. Quantitatively comparison in areas of different temperature ranges given by satellite and UAV remote sensing inversion, as well as a numerical model indicates that the use of DL models to improve image resolution has proven to be a very effective and fast way to achieve the goal of improving the statistical accuracy of SST remote sensing data. Deep learning models trained on thermal infrared images of thermal discharge experiments can be used for spatial resolution enhancement of satellite remote sensing inversed images of the surface water environment.
The original contributions presented in the study are included in the article/supplementary materials, further inquiries can be directed to the corresponding author/s.
YD and ZL contributed to conception and design of the study. YD organized the database, performed the statistical analysis, and wrote the first draft of the manuscript. ML improved the English writing. All authors contributed to the article and approved the submitted version.
This study was supported by the National Key Research and Development Program of China under grant No. 2022YFC3203903, the National Natural Science Foundation of China under grant No. 42206214 and No. 52179083.
The authors declare that the research was conducted in the absence of any commercial or financial relationships that could be construed as a potential conflict of interest.
All claims expressed in this article are solely those of the authors and do not necessarily represent those of their affiliated organizations, or those of the publisher, the editors and the reviewers. Any product that may be evaluated in this article, or claim that may be made by its manufacturer, is not guaranteed or endorsed by the publisher.
Barsi J. A., Barker J. L., Schott J. R. (2003). “An atmospheric correction parameter calculator for a single thermal band earth-sensing instrument,” in IGARSS 2003. 2003 IEEE International Geoscience and Remote Sensing Symposium. Proceedings (IEEE Cat. No. 03CH37477), Vol. 5. 3014–3016 (Denver, Colorado, USA: IEEE).
Bashir S. M. A., Wang Y., Khan M. (2021). A comprehensive review of deep learning-based single image super-resolution. PeerJ Computer Sci. 7, e621. doi: 10.7717/peerj-cs.621
Dawa C. L., Bhawna G., Ayush D., Goyal V. (2023). Image super-resolution: a comprehensive review, recent trends, challenges and applications. Inf. Fusion 91, 230–260. doi: 10.1016/j.inffus.2022.10.007
Dong C., Loy C. C., He K., Tang X. (2014). “Learning a deep convolutional network for image super-resolution,” in Computer vision–ECCV 2014: 13th European conference, Zurich, Switzerland, September 6-12, 2014, proceedings, part IV 13 (Zurich, Switzerland: Springer International Publishing), 184–199.
Dong X., Sun X., Jia X., Xi Z., Gao L., Zhang B. (2020). Remote sensing image super-resolution using novel dense-sampling networks. IEEE Trans. Geosci. Remote Sens. 59 (2), 1618–1633. doi: 10.1109/TGRS.2020.3041211
ESRGAN Enhanced super-resolution generative adversarial networks [2] TF 2.0 implementation of ESRGAN. Available at: https://tfhub.dev/captain-pool/esrgan-tf2/1.
Guo D., Xia Y., Xu L., Li W., Luo X. (2021). Remote sensing image super-resolution using cascade generative adversarial nets. Neurocomputing 443, 117–130. doi: 10.1016/j.neucom.2021.02.026
Hu D., Kun Q., Xingling W., Limin Z., Guohua. Ji (2017). Comparison of three single-window algorithms for retrieving land-surface temperature with landsat 8 TIRS data. Geomatics Inf. Sci. Wuhan Univ. 42 (7), 869–876. doi: 10.13203/j.whugis20150164
Ledig C., Theis L., Huszár F., Caballero J., Cunningham A., Acosta A., et al. (2017). “Photo-realistic single image super-resolution using a generative adversarial network,” in Proceedings of the IEEE conference on computer vision and pattern recognition. (Honolulu, Hawaii, USA: IEEE), 4681–4690.
Li J., Cui R., Li B., Song R., Li Y., Dai Y., et al. (2020). Hyperspectral image super-resolution by band attention through adversarial learning. IEEE Trans. Geosci. Remote Sens. 58 (6), 4304–4318. doi: 10.1109/TGRS.2019.2962713
Lu Z., Li J., Liu H., Huang C., Zhang L., Zeng T., et al. (2022) in Proceedings of the IEEE Conference on Computer Vision and Pattern Recognition Workshops (CVPRW 2022). (New Orleans, LA, USA: IEEE)
Shen H., Lin L., Li J., Yuan Q., Zhao L. (2020). A residual convolutional neural network for polarimetric SAR image super-resolution. ISPRS J. Photogrammetry Remote Sens. 161, 90–108. doi: 10.1016/j.isprsjprs.2020.01.006
Shi W., Caballero J., Huszár F., Totz J., Aitken A. P., Bishop R., et al. (2016). “Real-time single image and video super-resolution using an efficient sub-pixel convolutional neural network,” in Proceedings of the IEEE conference on computer vision and pattern recognition. (Las Vegas, NV, USA: IEEE), 1874–1883.
Tang Y.-Q., Hong P., Ya-Ping Z., Xin-De. Li (2020). A survey of image super-resolution reconstruction. Acta Electronica Sin. 48 (7), 1407–1420. doi: 10.3969/j.issn.0372-2112.2020.07.002
Wang Z., Chen J., Hoi S. (2020). Deep learning for image super-resolution: a survey. IEEE Trans. Pattern Anal. Mach. Intell. PP (99), 1–1. doi: 10.1109/TPAMI.2020.3015213
Wang X., Yu K., Wu S., Gu J., Liu Y., Dong C., et al. (2018). “Esrgan: enhanced super-resolution generative adversarial networks,” in Proceedings of the European conference on computer vision (ECCV) workshops. (Munich, Germany: Springer International Publishing), 0–0.
Xia H., Hongfeng L., Jun L., Nian. C. (2021). Survey on deep learning based image super-resolution. Comput. Eng. Appl. 57 (24), 51–60. doi: 10.3778/j.issn.1002-8331.2105-0418
Keywords: super resolution (SR), deep learning, thermal discharge, transport and diffusion field, thermal infrared remote sensing
Citation: Duan Y, Liu Z and Li M (2023) Super-resolution reconstruction of sea surface pollutant diffusion images based on deep learning models: a case study of thermal discharge from a coastal power plant. Front. Mar. Sci. 10:1211981. doi: 10.3389/fmars.2023.1211981
Received: 25 April 2023; Accepted: 30 May 2023;
Published: 09 June 2023.
Edited by:
Senlin Zhu, Yangzhou University, ChinaReviewed by:
Hoang Tran, Pacific Northwest National Laboratory (DOE), United StatesCopyright © 2023 Duan, Liu and Li. This is an open-access article distributed under the terms of the Creative Commons Attribution License (CC BY). The use, distribution or reproduction in other forums is permitted, provided the original author(s) and the copyright owner(s) are credited and that the original publication in this journal is cited, in accordance with accepted academic practice. No use, distribution or reproduction is permitted which does not comply with these terms.
*Correspondence: Zhaowei Liu, bGl1emh3QHRzaW5naHVhLmVkdS5jbg==
Disclaimer: All claims expressed in this article are solely those of the authors and do not necessarily represent those of their affiliated organizations, or those of the publisher, the editors and the reviewers. Any product that may be evaluated in this article or claim that may be made by its manufacturer is not guaranteed or endorsed by the publisher.
Research integrity at Frontiers
Learn more about the work of our research integrity team to safeguard the quality of each article we publish.