 Yucong Wei
 Guoliang Ma1
 Xiangqian Quan
- 1Institute of Deep-sea Science and Engineering, Chinese Academy of Sciences, Sanya, China
- 2University of Chinese Academy of Sciences, Beijing, China
Introduction: The design of high-pressure optical windows is one of the key tasks in deep-sea exploration, as it directly determines the reliability and maximum operating depth of underwater optical equipment.
Method: In this paper, mechanical modeling and finite element analysis methods are employed to study optical windows.
Results and discussion: Results show that changes in boundary conditions during loading significantly affect the stress distribution of the window. Based on this conclusion, an optimization design method is proposed, which involves the use of transition materials to reduce the impact of base deformation on the window. The study further analyzes the effects of the transition material’s Young’s modulus, Poisson’s ratio, thickness, and friction coefficient on the stress of the optical window. A calculation method for material selection criteria is proposed to select appropriate transition materials, and actual materials are used for verification. Finally, the reliability of the optimization design scheme based on transition materials is confirmed through high-pressure experiments.
1 Introduction
1.1 Research background of optical windows in deep-sea pressure-resistant structures
As one of the important means of human understanding of the world, optical sensing has been widely used in deep-sea exploration, such as marine archaeology, marine biology observation, and seabed geological exploration (Bingham et al., 2010; Ahn et al., 2018; Du et al., 2021; Peng et al., 2023). Unlike the terrestrial environment, the deep-sea environment has a higher pressure, so such equipment requires pressure-resistant structures with optical windows to ensure stable operation at the seabed (Rajput et al., 2020; Vlachos and Skarlatos, 2021). The larger the size of the optical window, the more information the equipment can obtain and the higher the efficiency of deep-sea exploration (Boffety et al., 2012; Zhao et al., 2015). However, at the same time, it will also cause a decrease in the mechanical performance of the pressure-resistant structure. Therefore, in the past few decades, researchers worldwide have conducted a large amount of research on the performance and design methods of pressure-resistant window components, hoping to find a more simple and effective optimization design method while ensuring the reliability of the pressure-resistant structure in improving the efficiency of deep-sea exploration.
1.2 Related work
At present, optical windows commonly come in three structural forms: flat disc, conical, and spherical shell sector. The flat disc optical window has a simple structure and low manufacturing and installation difficulties; it was the main form of underwater equipment optical windows in the early days. However, with the increasing depth of human diving, this form of optical window gradually cannot meet people’s requirements for the mechanical and visual range of pressure-resistant structures (Zhu, 1992). Due to the fact that the internal stress of the conical window under the external pressure of seawater is mainly compressive stress, its pressure resistance performance has been greatly improved compared to the flat disc form. Stachiw (1967) proposed the use of organic glass material to manufacture conical optical windows and analyzed the bearing capacity of this scheme under short-term loads with different angles and thickness-to-diameter ratios, which greatly improved the pressure resistance performance of the window. Additionally, Stachiw (Stachiw, 1970a; Stachiw, 1970b; Stachiw, 1972) conducted subsequent long-term load tests under different hydrostatic pressures to obtain complete data results. These data provided a large number of numerical references for the American Society of Mechanical Engineers (ASME) to establish design standards for deep-sea pressure-resistant equipment. Since the properties of organic glass materials are greatly affected by the load situation and environmental factors, Luo et al (Luo et al., 2007; Wang et al., 2019). explored the optimal design parameters from the perspectives of material creep and environmental temperature. In comparison to the conical optical window, the spherical shell sector optical window makes it easier to control the volume of the window. In 1972, Stachiw et al (Stachiw and Sletten, 1976). replaced the optical window of the “Alvin” manned submersible with a spherical shell sector window, obtaining better mechanical performance within a limited volume. They also analyzed the optimal parameters of the spherical shell sector optical window made of organic glass and proposed a method of impregnating epoxy resin or chlorobutyl rubber-coated cloth at the bottom of the optical window to avoid point contact (Stachiw, 1975). Xu and Pei (Junhou, 1984; Binghan, 1987) simplified the mechanical model of this structure and applied the boundary coefficient method to give the theoretical stress distribution results. Du et al. (2011) analyzed the coordination between the optical window and the base and applied the contact finite element method to analyze the optimal cone angle of the flanged spherical shell sector optical window. SB, et al. (2018) optimized the design of the local part using the biological growth method to obtain a better design scheme for the stress concentration problem of the spherical shell sector optical window.
1.3 Our work and paper structure
The above research work primarily focuses on improving the mechanical performance of pressure-resistant structures by identifying optimal design parameters for optical windows. However, the potential improvement achieved through adjustments to the window’s design parameters alone is often limited. Previous studies have also overlooked the mutual influence between components during compression. To address these limitations, this paper proposes an optimized design approach for deep-sea pressure-resistant structural optical windows using transition materials and conducts relevant research in this area. Specifically, we investigate the impact of base deformation on the optical window by selecting the spherical sector optical window as our research subject. We aim to calculate and analyze the actual effects of base deformation on the optical window. To mitigate this impact, we incorporate transitional materials into the design. The experimental results obtained validate the effectiveness of this approach.
The organization of this paper is as follows: In Theoretical conceptualizations, we introduce the theoretical foundations, relevant mathematical models, and simulation methods employed in our calculations. Optimization methods presents the optimization design method and analyzes the influencing factors. Subsequently, in Experiments and results, we outline the experimental design and present the obtained results. The Discussion talks about the outcomes of the optimization approach. Finally, in the Conclusion, we provide a comprehensive summary and draw conclusions based on our findings.
2 Theoretical conceptualizations
Compared with other configurations, spherical shell sector optical windows have the advantages of high-pressure resistance, small size, and a large field of view. They are also the most commonly used design for deep pressure-resistant structures at present. Therefore, this paper selects this form of the optical window as the research object and conducts related optimization design research.
2.1 Theoretical analysis of spherical shell sector optical windows
As shown in Figure 1, a thin spherical surface of radius r and thickness dr is taken as the spherical shell sector optical window. The symmetry axis of the optical window is defined as the z-axis, with the center of the sphere as the origin. A spherical coordinate system is established, with the positive direction being away from the center of the sphere. is the normal stress on the boundary, is the shear stress on the boundary, is the normal stress on the inner side of the thin spherical surface, and is the normal stress on the outer side.
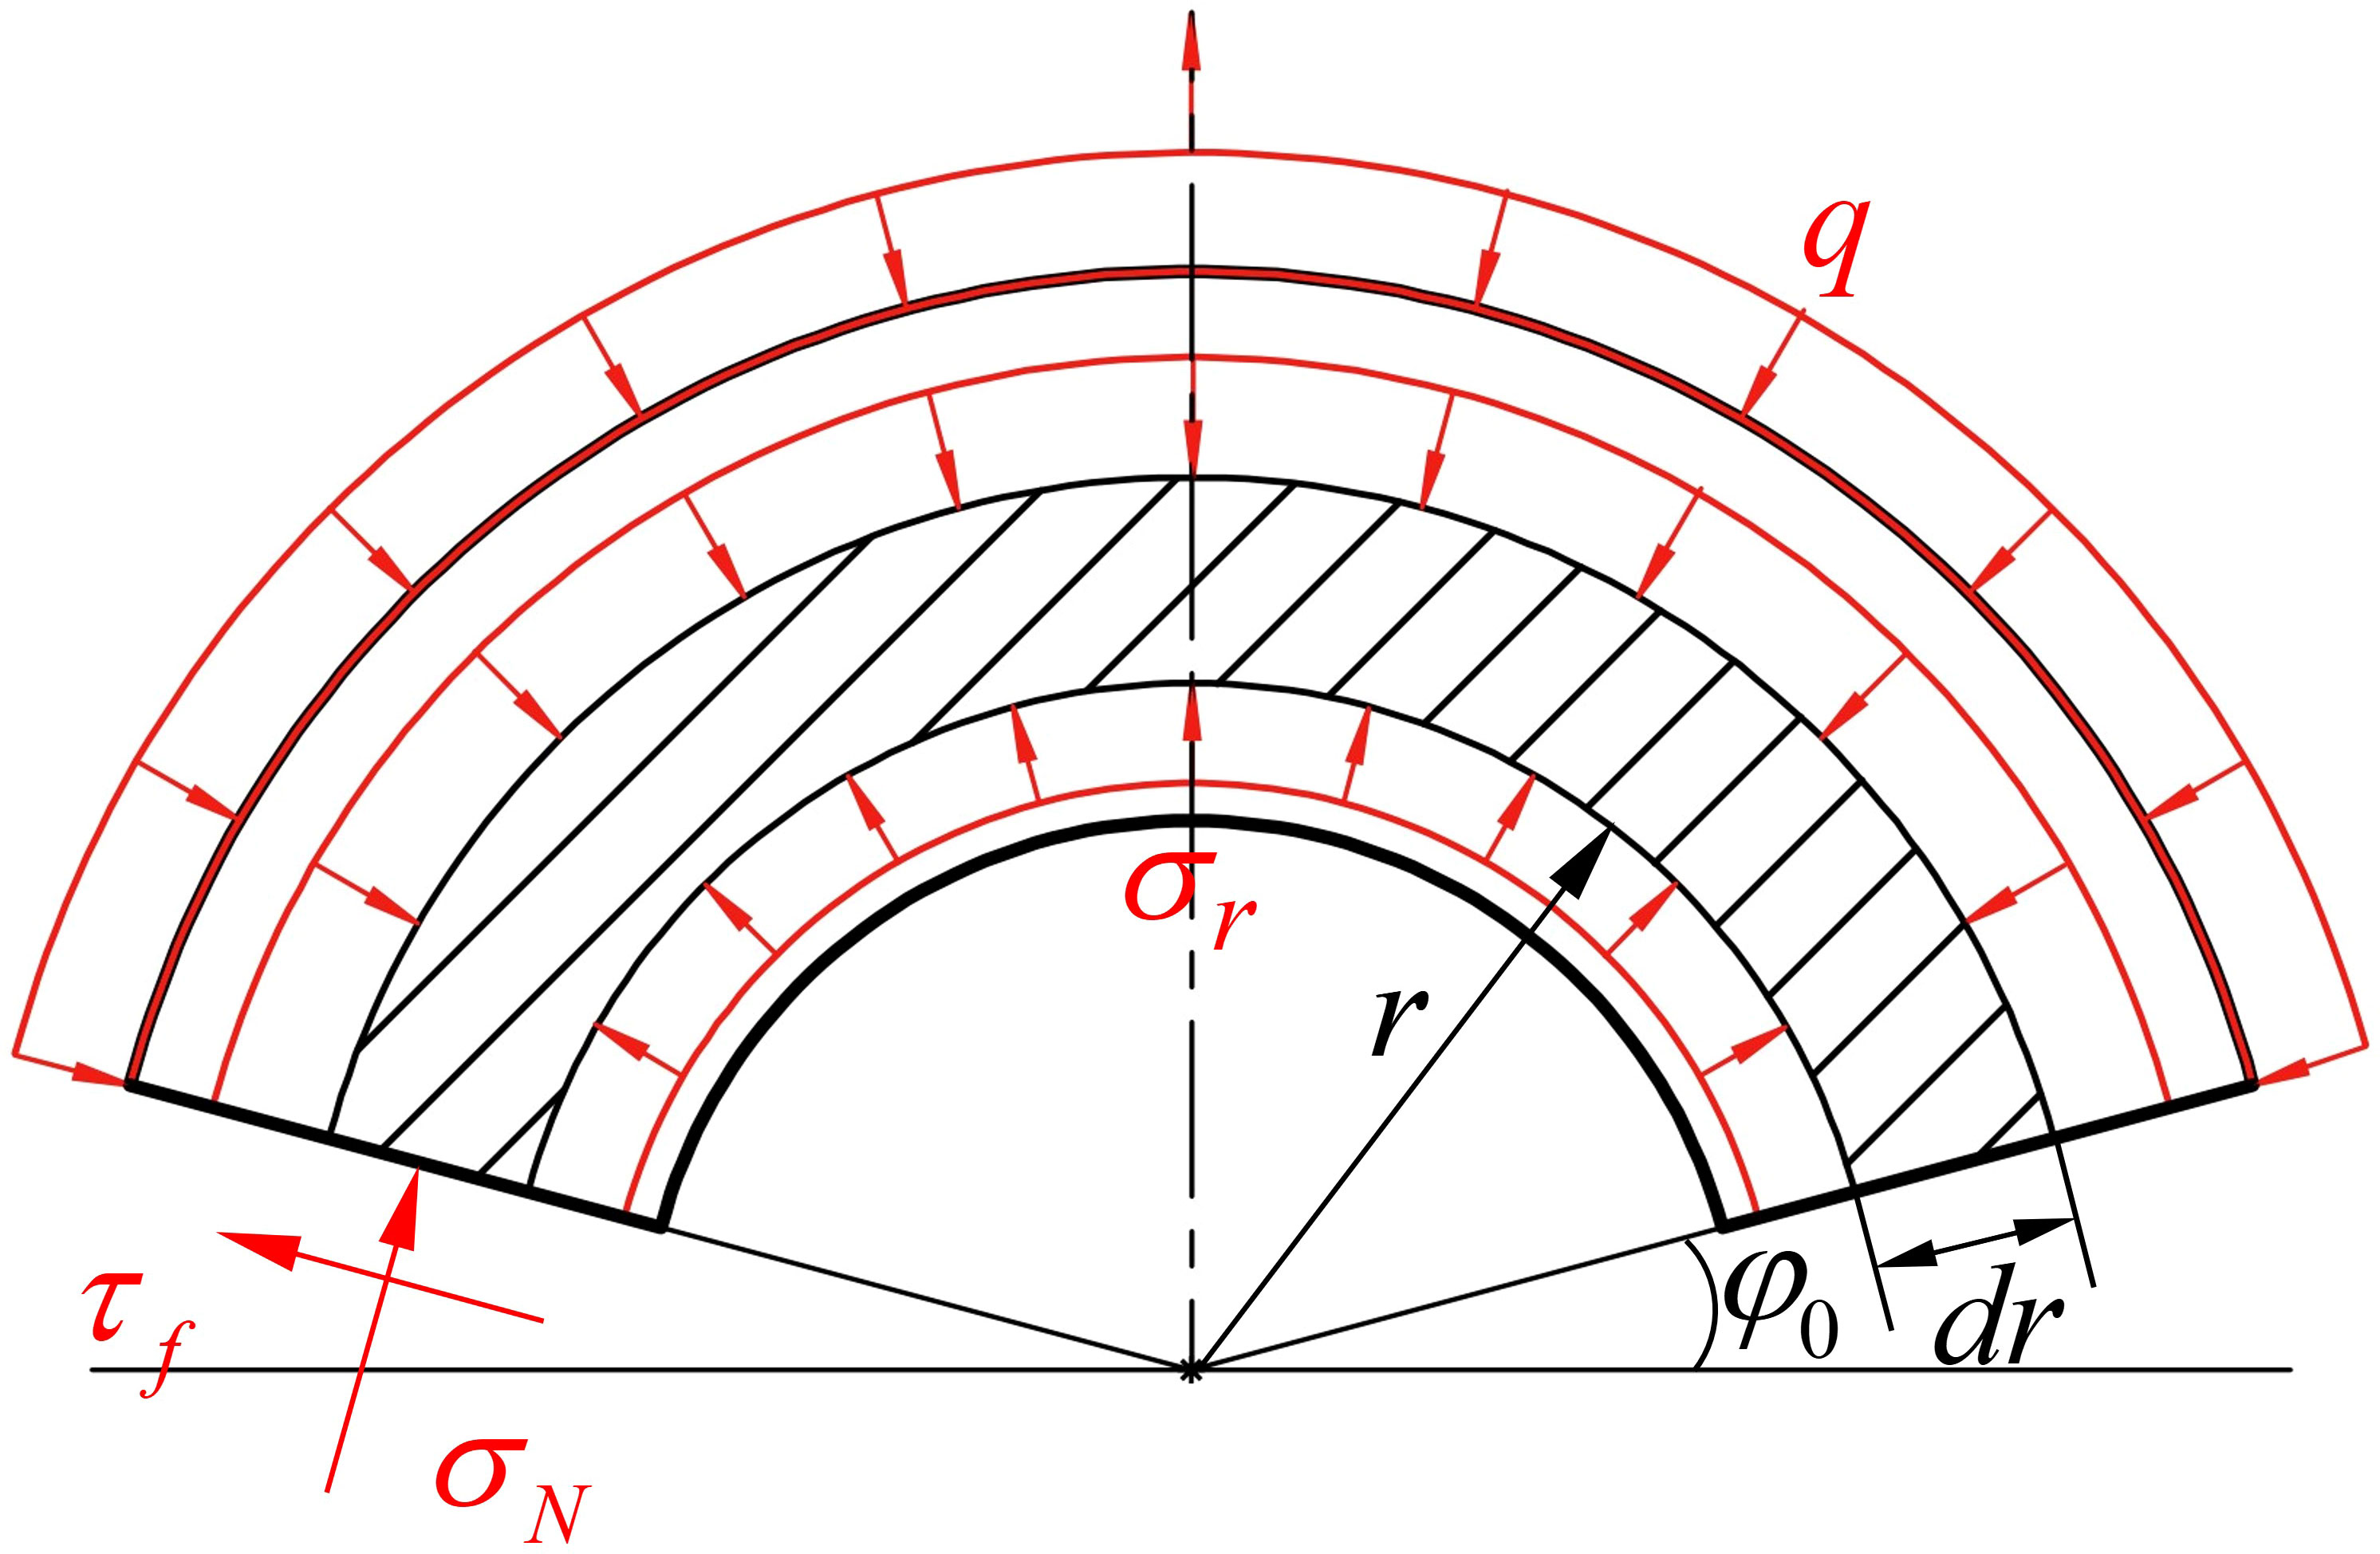
Figure 1 Theoretical analysis of spherical shell sector optical window.
Thus, the forces acting on the positive and negative directions of the z-axis of a thin spherical shell at a radius of r are expressed by Eqs. (1) and (2), respectively.
One can see that the first term of Eq. 1 represents the z-component of the internal surface stress on the thin spherical shell, and the second term represents the z-component of the boundary stress on the shell. denotes the total surface area of the thin spherical shell at the given radius, and represents the area of contact with the base.
By combining Eqs. (1) and (2), we can establish the equilibrium equation of the z-axis and neglect higher-order terms:
When the boundary is in sliding contact, we can establish a relationship between and :
Substituting Eq. (6) into Eq. (5), we can obtain:
The general solution of a first-order linear nonhomogeneous differential equation is the sum of the general solution of the corresponding homogeneous equation and a particular solution of the nonhomogeneous equation. Thus, the general solution of Eq. (7) can be expressed as:
However, as the boundary normal stress is a function of radius r, the particular solution of the equation is also dependent on radius r, making it an indeterminate value. The physical interpretation of this conclusion is that changes in the boundary conditions of a spherical shell sector optical window may cause a change in its stress distribution. Therefore, the deformation of the base may affect the stress distribution of the optical window.
2.2 Finite element analysis of spherical shell sector optical window
The base material of the window selected for this study is TC4 titanium alloy, and the transparent material of the window is high-borosilicate glass (HBG), with material properties shown in Table 1. Compared to other traditional metal materials, TC4 titanium alloy has advantages such as higher specific strength, corrosion resistance, and rust resistance, and is commonly used in the field of deep-sea engineering. As a new type of glass material, high-boron silicon glass has the advantages of high strength, a small thermal expansion coefficient, low deformation, and high transmittance. Compared to traditional organic glass, high-boron silicon glass has a smaller impact on light transmission and is more suitable for application in the pressure-resistant structures of optical equipment with small volumes, high precision, and diving depths exceeding 3,000 m (Quan et al., 2022).
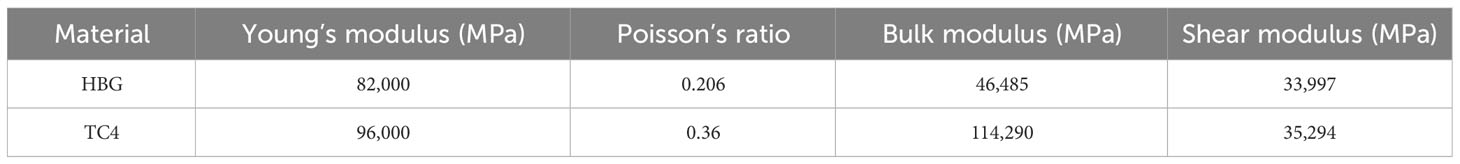
Table 1 Material properties of TC4 titanium alloy and high-borosilicate glass.
The structural parameters of the spherical shell sector optical window and pressure-resistant structure are shown in Figure 2. Here, denotes the internal radius of the optical window, denotes the external radius of the optical window, and denotes the opening angle of the window. Additionally, denotes the internal diameter of the optical window’s base, denotes the external diameter of the optical window’s base, and denotes the thickness of the base. Finally, denotes the internal diameter of the cylinder, denotes the external diameter of the cylinder, and denotes the length of the cylinder.
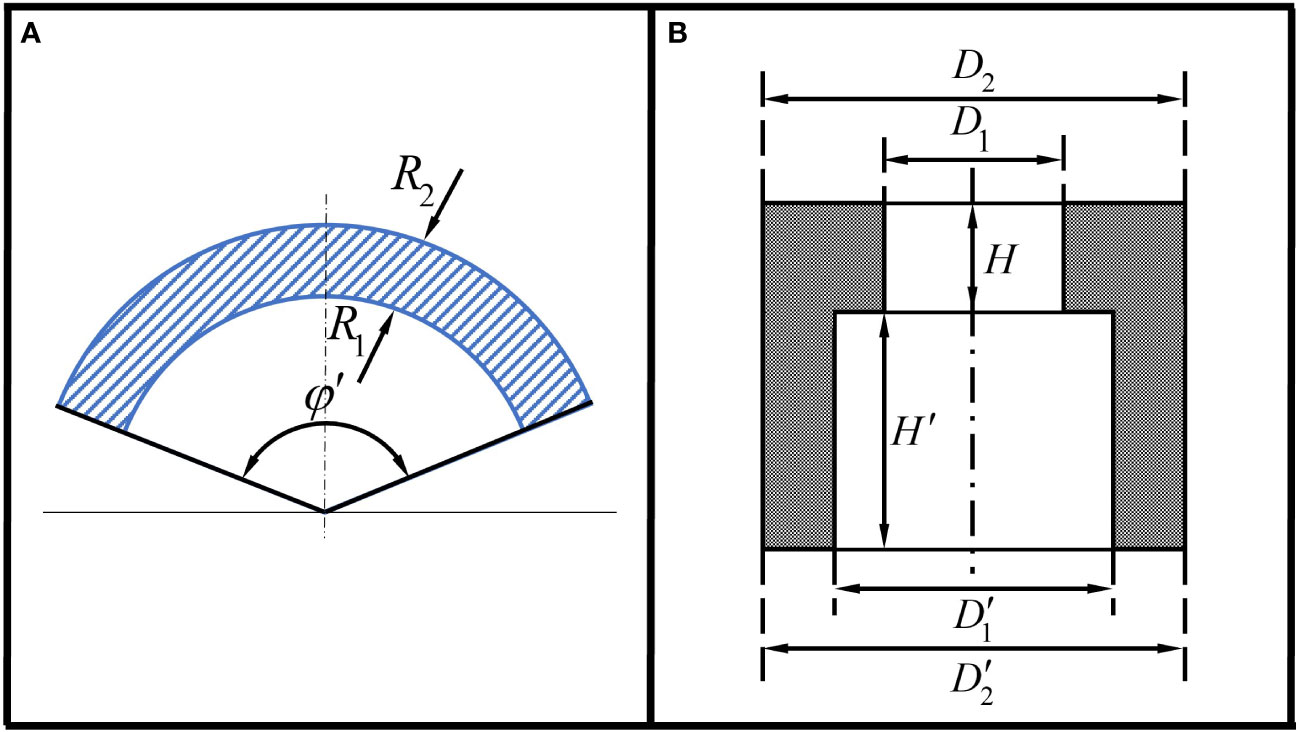
Figure 2 (A) Parameters of spherical shell sector optical window. (B) Parameters of base and cylinder.
For the spherical shell optical window with and subjected to a working pressure of 115 MPa, the relevant design parameters were calculated based on the ASME (2016) design standards. The calculated design parameters are presented in Tables 2, 3.

Table 2 Design parameters of spherical shell sector optical window.

Table 3 Design parameters of optical window base and cylinder.
Establish a model, divide the mesh, and control the element size to 1 mm, as shown in Figure 3.
Figure 3 Finite element model of optical window and base.
As shown in Figure 4, in order to eliminate the influence of frictional force on the results, a frictionless contact is set between the window and the base. The base part with high stiffness and a large area is selected as the target body, and the window part is selected as the contact body.
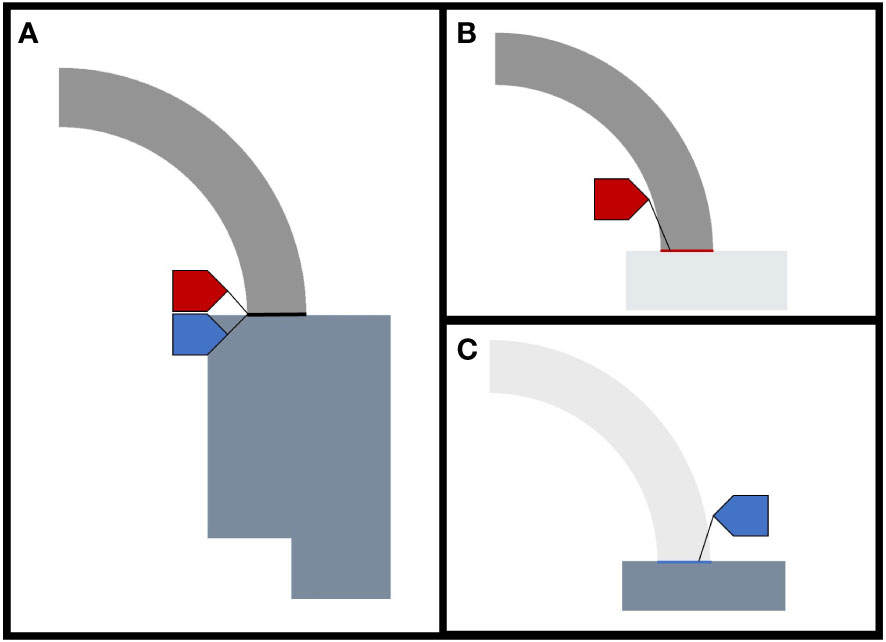
Figure 4 Setting of contact surface. (A) Contact surface between window and base. (B) Contact body view. (C) Target body view.
The boundary conditions and load situation are shown in Figure 5. In order to avoid the difference between the displacement boundary conditions and the actual situation, which may lead to inaccurate finite element calculation results near the contact surface between the window and the base, setting , and the displacement constraint is set at the far end A surface (bottom of the cylinder), with axial displacement restricted to 0 mm and radial displacement free. The static water pressure is simulated by applying a normal pressure of 115 MPa on the B surface (outside of the optical window, the top surface of the base, and outside of the cylinder).
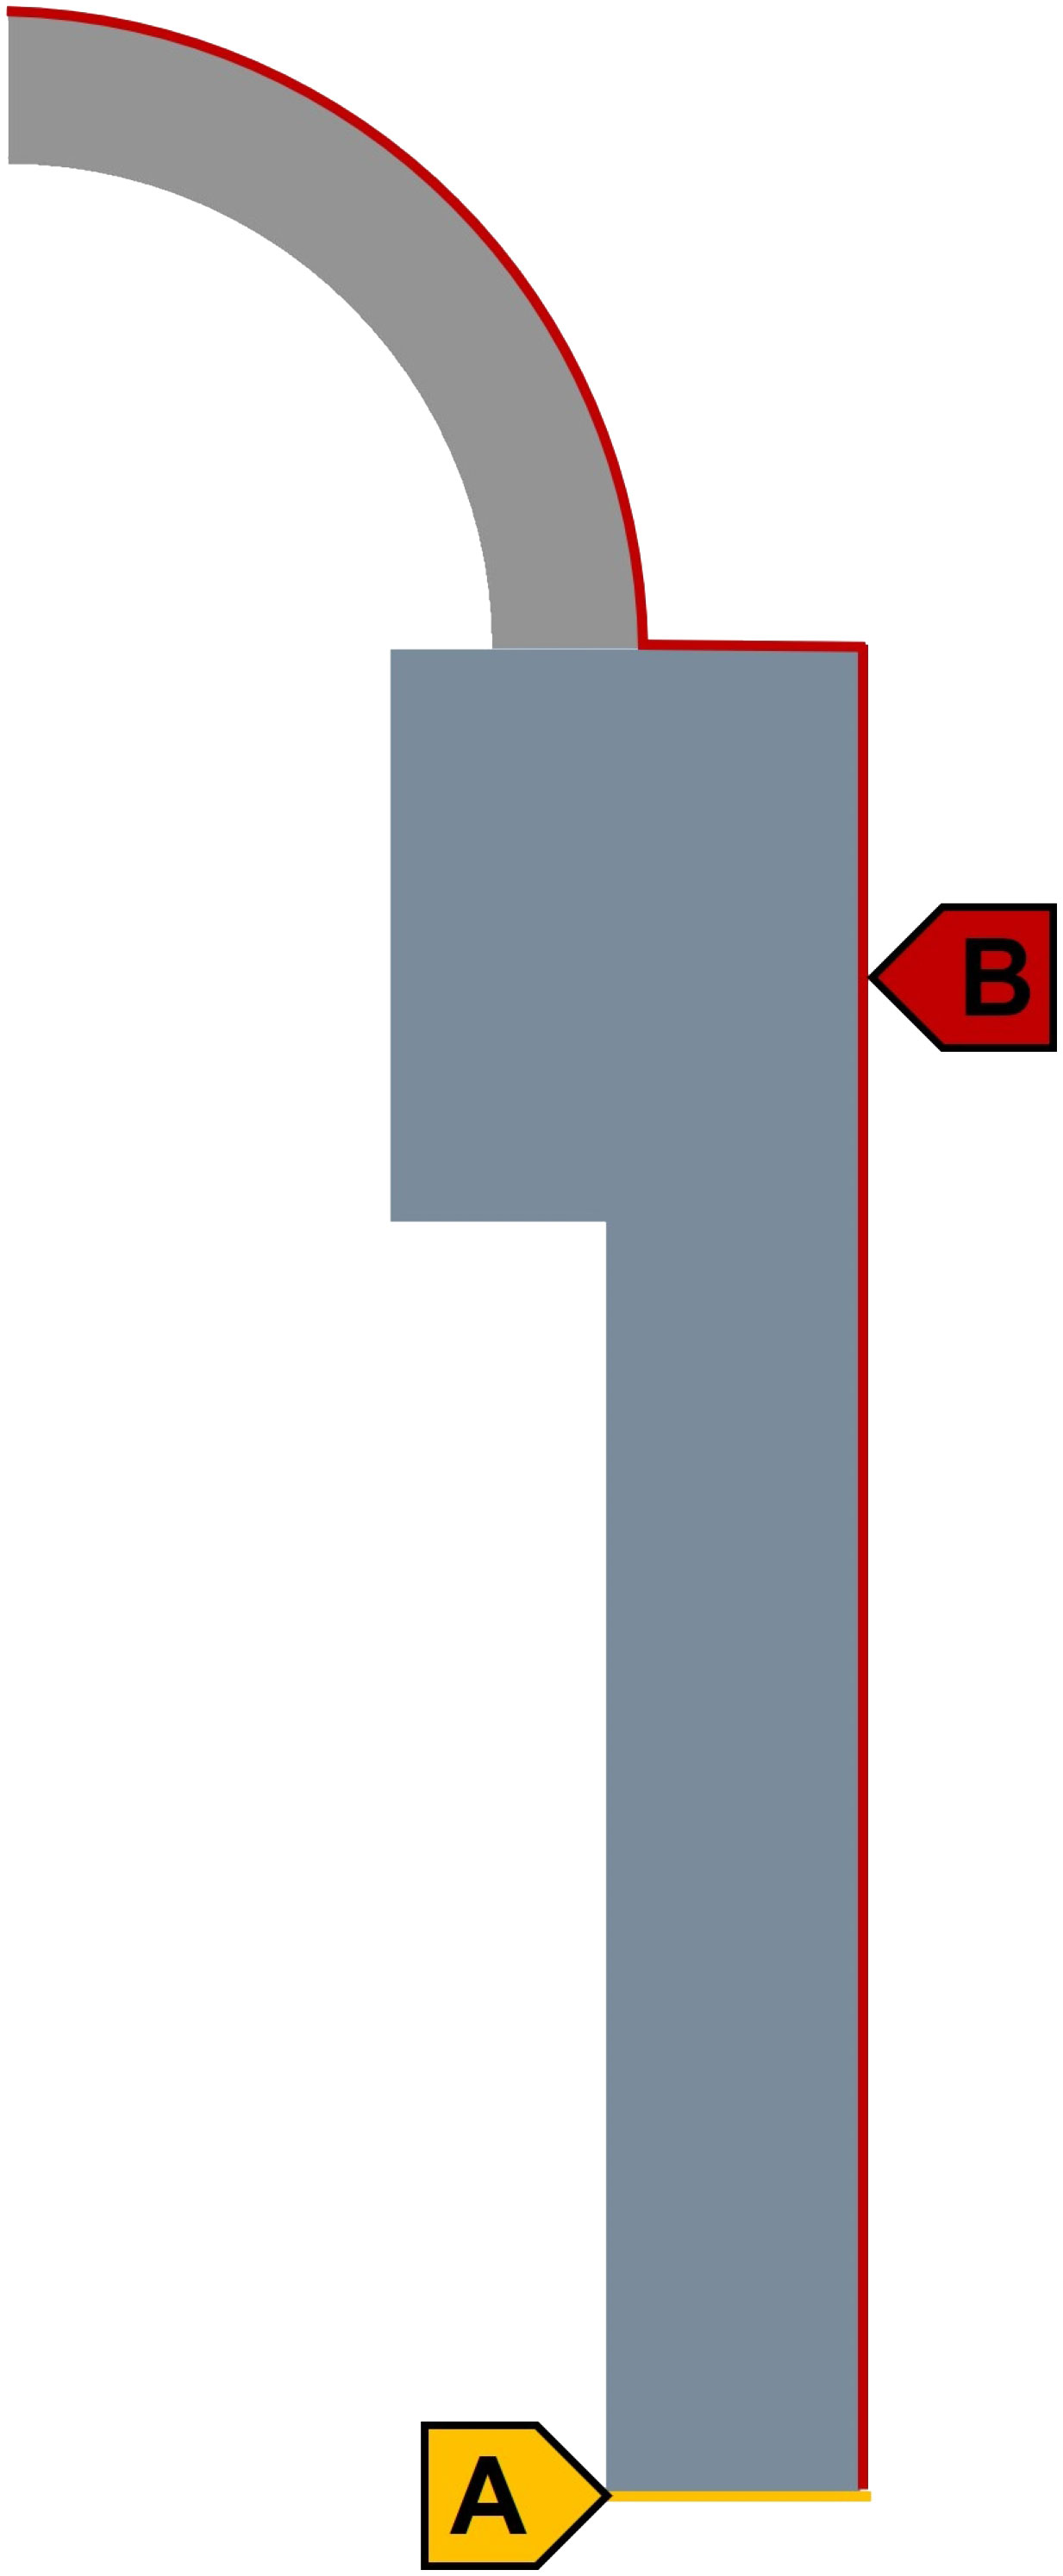
Figure 5 The part A (yellow) is the location of boundary, and the part B (red) is the location of load condition.
The base and cylinder of the suppression preprocessing model were removed, and the displacement boundary condition was set at the bottom of the optical window (restricting axial displacement to 0mm and allowing radial freedom). The load conditions remained unchanged, and the analysis results were obtained for the stress distribution of the spherical shell optical window under an external pressure of 115 MPa, assuming no deformation due to the absence of a base. In order to ensure the convergence of the solution and avoid the occurrence of mutual infiltration between materials, the Normal Lagrange method was chosen for the solution.
The stress and strain distribution of the optical window are presented in Figure 6, and the maximum values of data in two scenarios are presented in Table 4. Compared to the situation where the base has no deformation, the maximum equivalent elastic strain and maximum equivalent stress inside the optical window increase by 69% when the base deforms. Additionally, the equivalent elastic strain and equivalent stress distribution inside the optical window are uniform when the base has no deformation, as it is a part of the regular spherical shell. However, a significant stress concentration phenomenon appears at the inner diameter of the optical window when the base deforms. Based on the aforementioned data, it can be concluded that the deformation of the base during the loading process of the pressure-resistant structure has a significant impact on the stress distribution of the optical window. It aligns with the conclusion of the theoretical analysis in the Theoretical analysis of spherical shell sector optical windows section. Moreover, since stress concentration appears at the inner diameter of the optical window, it can be inferred that this area will be the first to fail during the loading process. The failure mode will manifest in the form of circular layer peeling.
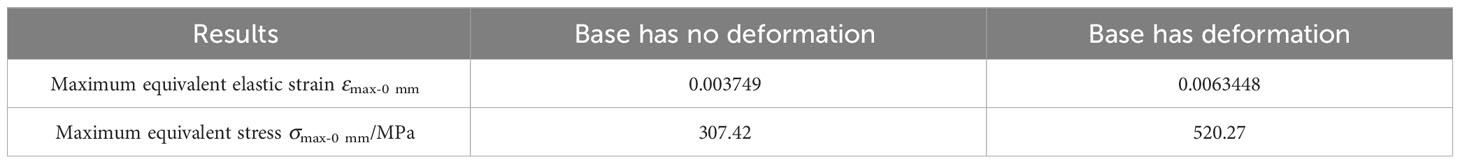
Table 4 Optical window solution results.
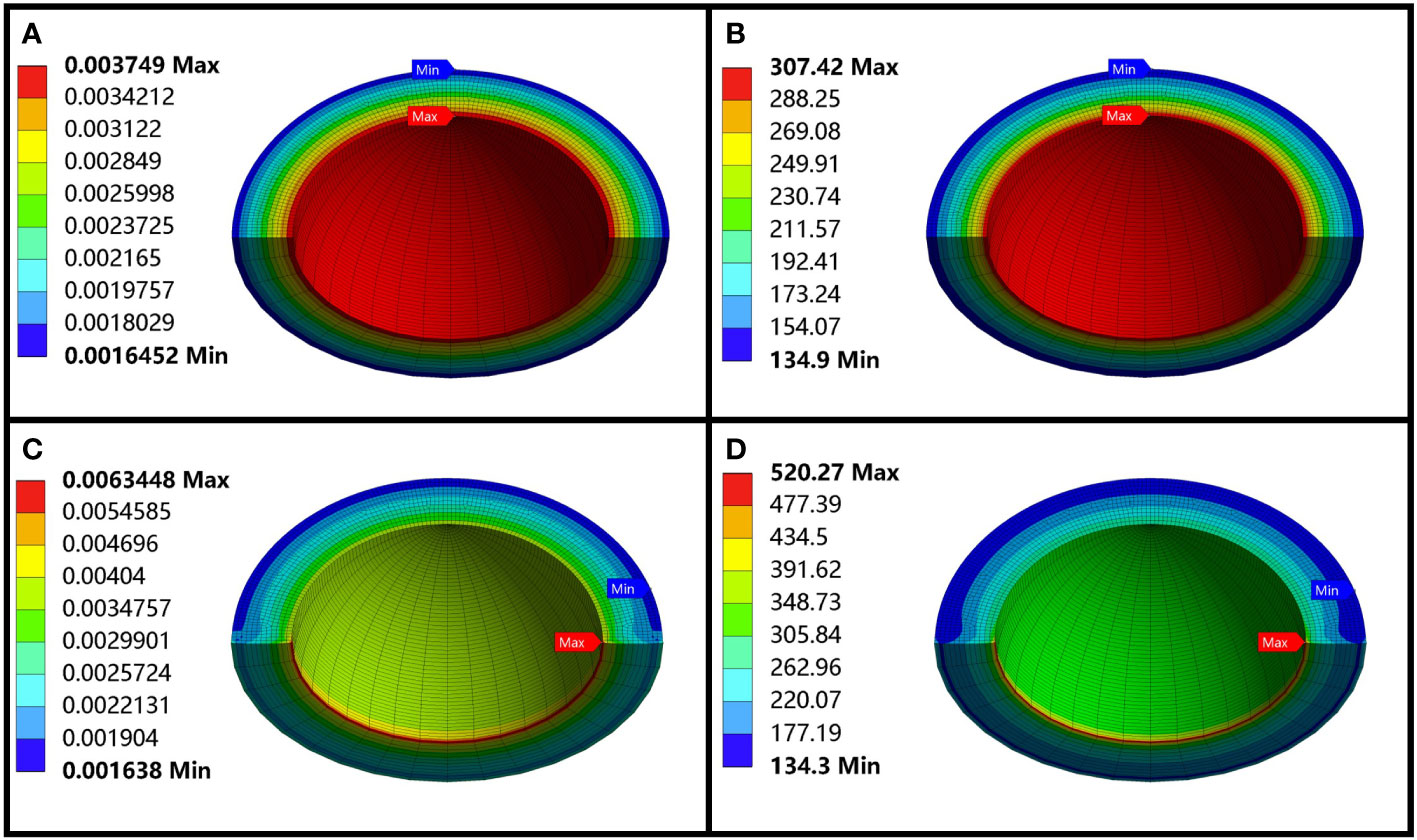
Figure 6 The calculation results of the optical window. (A) The equivalent elastic strain of the optical window when the base is not deformed. (B) The equivalent stress of the optical window when the base is not deformed. (C) The equivalent elastic strain of the optical window when the base is deformed. (D) The equivalent stress of the optical window when the base is deformed.
3 Optimization methods
The total deformation of the base and cylinder is shown in Figure 7. There is a significant depression at the contact surface between the base and optical window, and the overall deformation pattern of the base is similar to that of a cantilever beam, where the deformation increases as the radius of the contact end decreases. Based on the calculation results and conclusions obtained in the previous section, the main cause of failure of the deep-sea pressure-resistant structure’s optical window is due to the increased stress concentration inside the window caused by the deformation of the base, which exceeds the ultimate compressive strength of the component, resulting in the failure of the pressure-resistant structure. Therefore, it is suggested to fill the transition between the optical window and the base with other materials with reinforced gaskets to prevent the direct impact of base deformation on the optical window, thereby reducing stress concentration in the optical window itself.
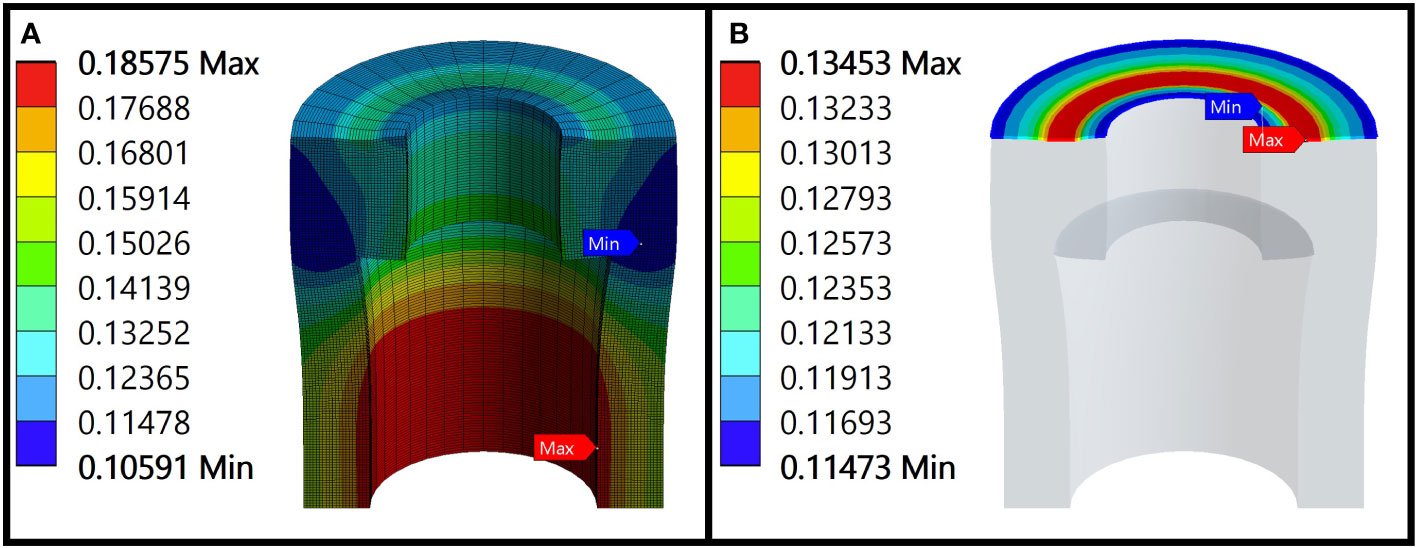
Figure 7 Total deformation of base, cylinder, and contact surface. (A) Total deformation of base and cylinder. (B) Total deformation of contact surface.
3.1 Optimization design scheme
To fully utilize the role of the transition material, the inner and outer diameters of the transition material should completely cover the end face of the optical window. Therefore, we established a model with an inner diameter of 66 mm and an outer diameter of 110 mm for the transition material gasket, as shown in Figure 8. The binding contact was set between the gasket and the base, and frictionless contact was set between the optical window and the reinforced gasket. We selected the Normal Lagrange method for solving and ensured that the boundary conditions and loads were consistent with those in the Finite element analysis of spherical shell sector optical window section.
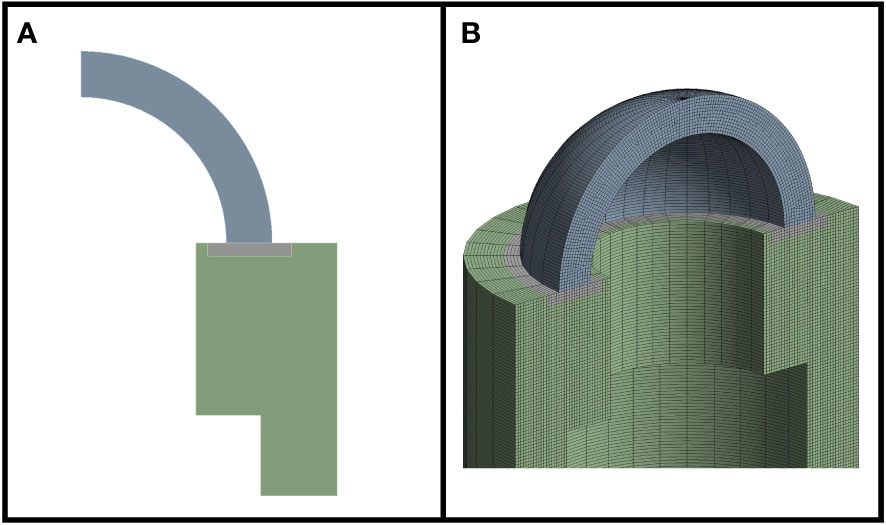
Figure 8 The model after adding the gasket. (A) Two-dimensional cross-sectional image. (B) Three-dimensional cross-sectional image.
The maximum stress value on the window was calculated when the filling thickness was 1–4 mm, the Young’s modulus range was 1–300 GPa, and the Poisson’s ratio range was 0–0.45 for the transition material. The data were linearly interpolated and expanded, and the results were represented in three-dimensional space, as shown in Figure 9. The analysis of the results shows that, when the thickness of the transition material is constant, the maximum stress value on the window decreases as the Young’s modulus of the transition material increases and decreases as the Poisson’s ratio of the transition material increases. Increasing the filling thickness makes the stress more sensitive to changes in the Young’s modulus and Poisson’s ratio of the transition material.
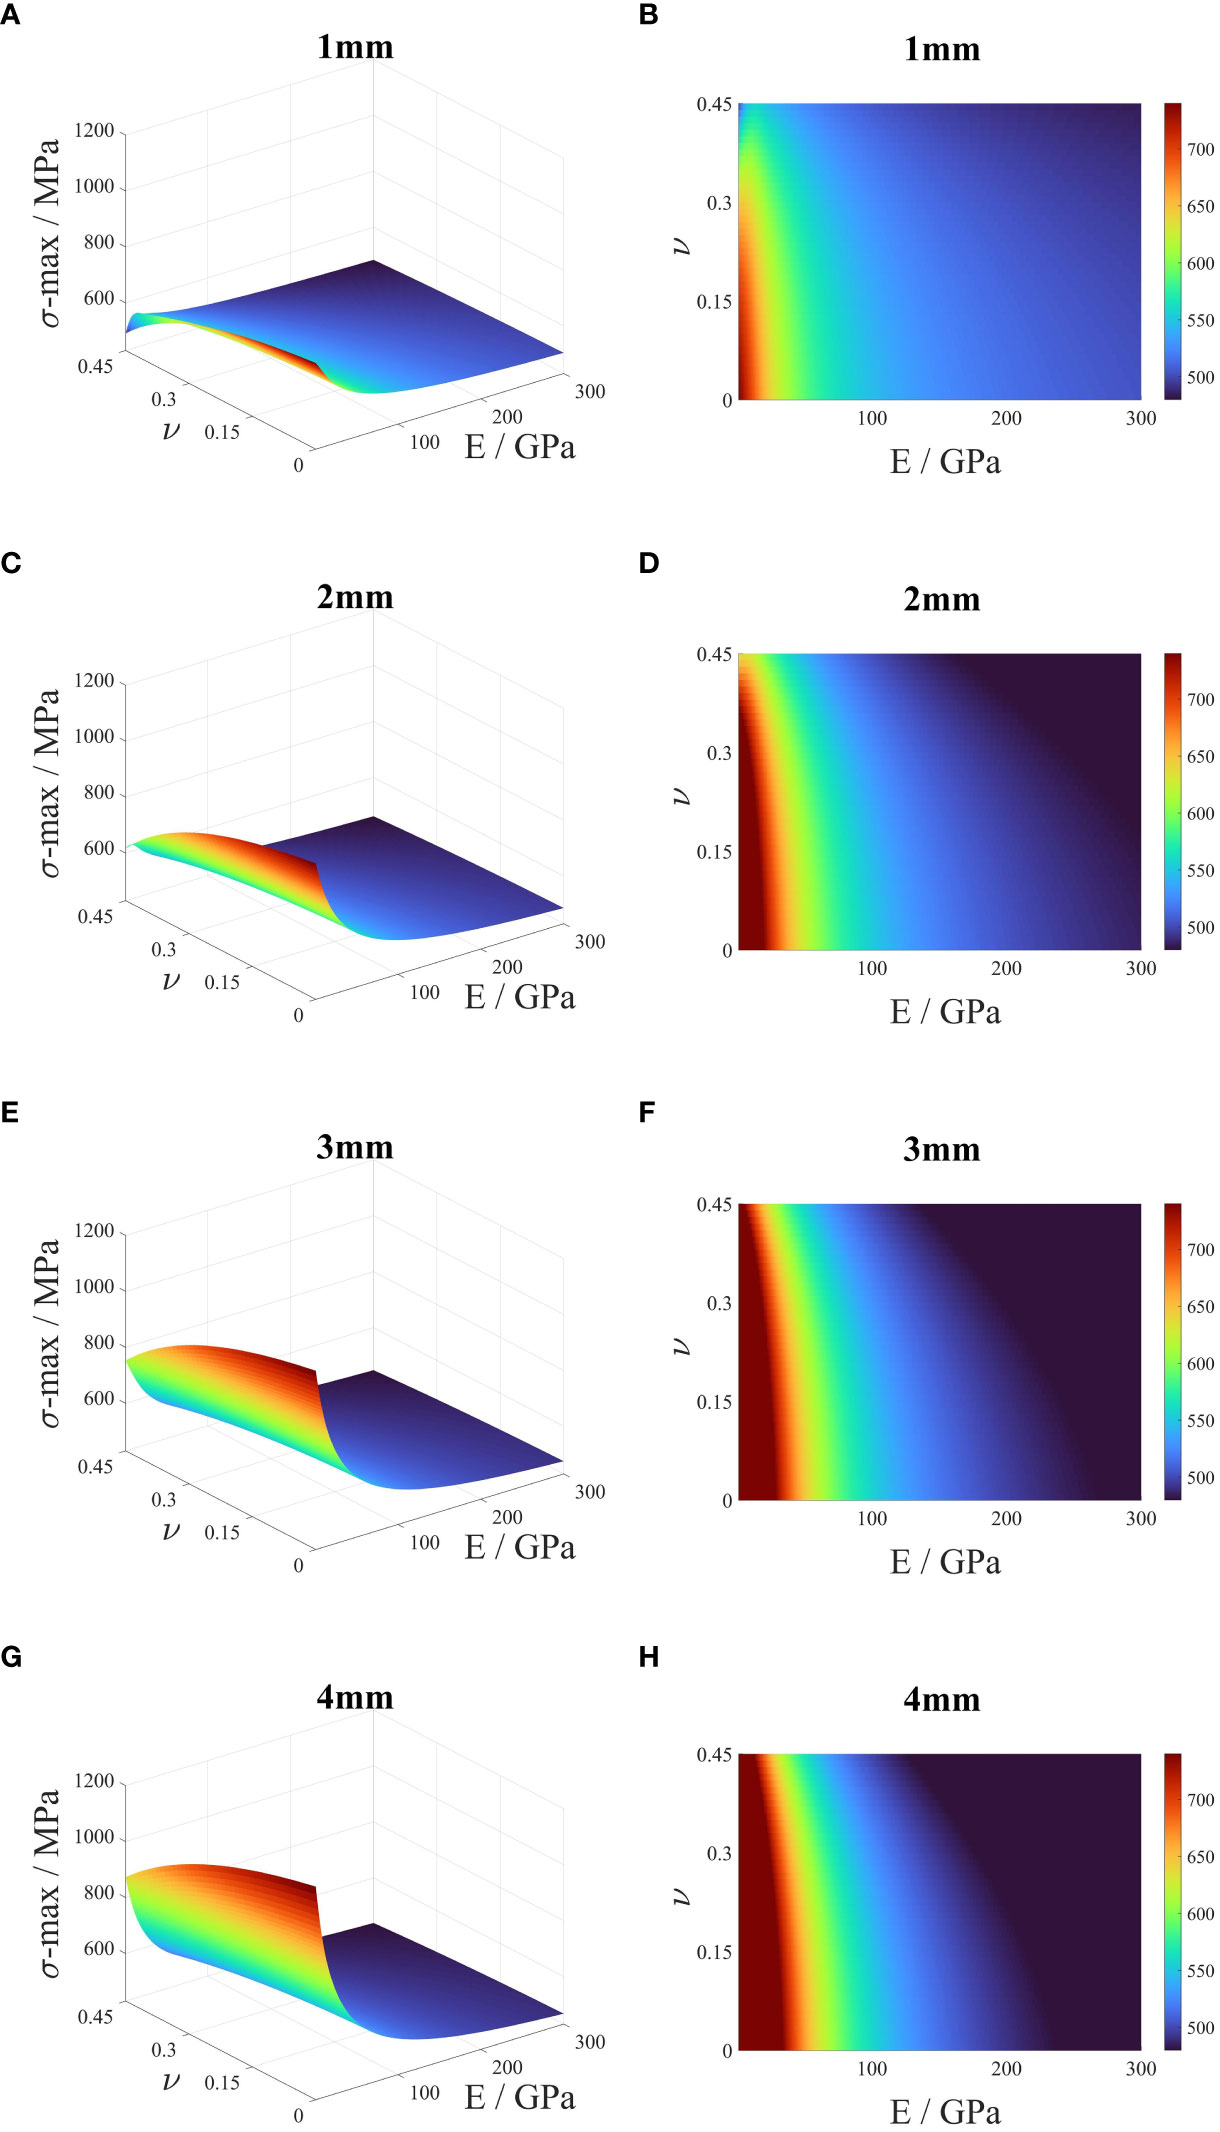
Figure 9 Maximum stress of optical window under different thickness, Young modulus and Poisson’s ratio of transition material. (A) The 3D image of stress of optical window with 1mm transition material thickness. (B) The 2D image of stress of optical window with 1mm transition material thickness. (C) The 3D image of stress of optical window with 2mm transition material thickness. (D) The 2D image of stress of optical window with 2mm transition material thickness. (E) The 3D image of stress of optical window with 3mm transition material thickness. (F) The 2D image of stress of optical window with 3mm transition material thickness. (G) The 3D image of stress of optical window with 4mm transition material thickness. (H) The 2D image of stress of optical window with 4mm transition material thickness.
When a transition material with a thickness of 4 mm, a Young’s modulus of 1 GPa, and a Poisson’s ratio of 0 is used, the equivalent stress on the window is the highest, at 1,191.596 MPa, which is an increase of approximately 129% compared to the maximum stress when no transition material is used. However, when a transition material with a thickness of 4 mm, a Young’s modulus of 300 GPa, and a Poisson’s ratio of 0.45 is used, the equivalent stress on the window is the lowest, at 438.5262 MPa, which is a decrease of approximately 15.7% compared to the maximum stress when no transition material is used.
The maximum stress value on the window before reinforcement was inserted into the results after reinforcement, i.e., plane σ-max = 520.27 MPa, as shown in Figure 10. The before-reinforcement results were made to intersect with the after-reinforcement results, and a third-degree polynomial was used to fit the intersection line, represented as . The x value is the Young’s modulus E of the transition material, with units of 103 GPA, and the y value is the Poisson’s ratio ν of the material. The A, B, C, and D values under 1–4-mm transition material thickness were calculated and shown in Table 5. A judgment value Q was defined, and when the thickness is constant, if the judgment value Q< 0 for the transition material, it indicates that using the material of that size can alleviate stress concentration on the optical window in the pressure-resistant structure.
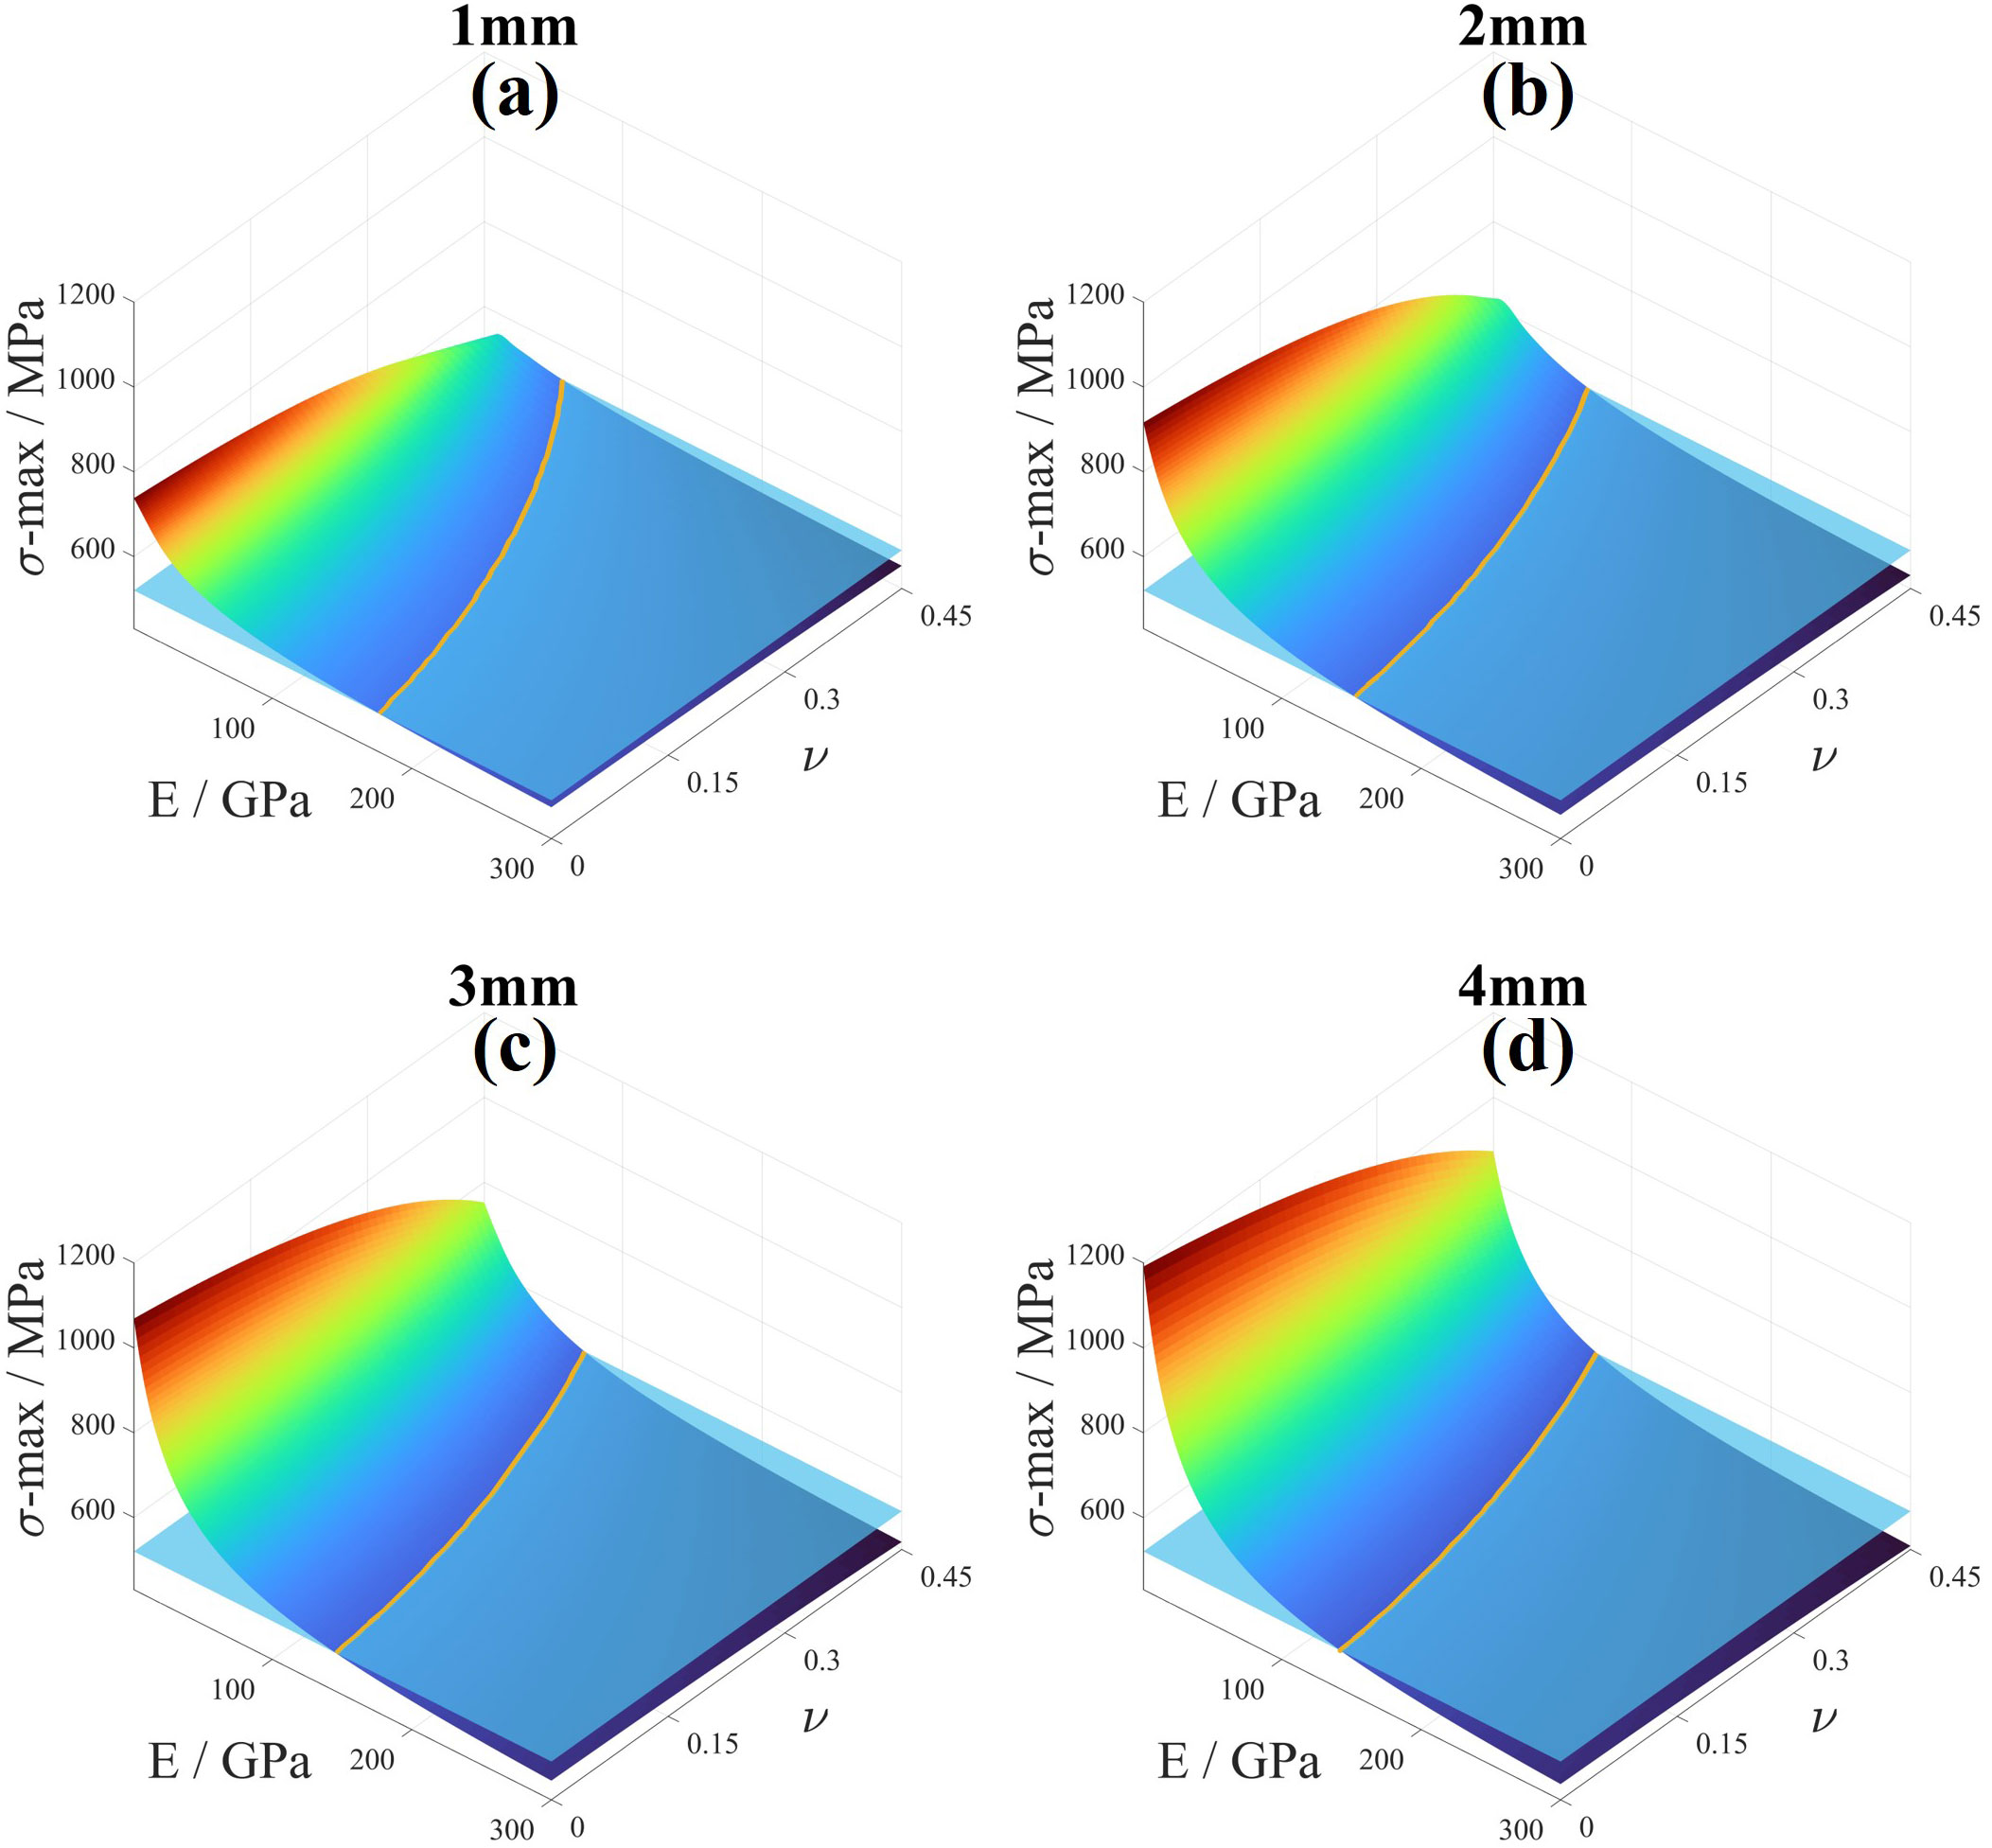
Figure 10 Maximum stress fitting before and after reinforcement. (A) The fitting result of optical window with 1mm transition material thickness. (B) The fitting result of optical window with 2mm transition material thickness. (C) The fitting result of optical window with 3mm transition material thickness. (D) The fitting result of optical window with 4mm transition material thickness.
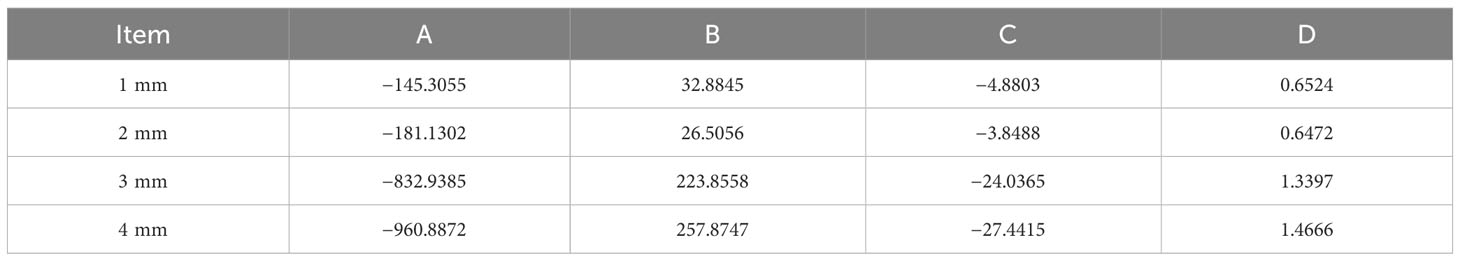
Table 5 Values of parameters A, B, C, and D at the thickness of 1–4 mm transition material.
According to the data presented in Table 5, it is evident that all four parameters are correlated with the thickness of the transition material. Overall, as the thickness increases, the odd-order parameters A and C decrease, while the even-order parameters B and D increase. Furthermore, within the same expression, coefficients of terms with lower orders are smaller. For each individual parameter, the trend remains the same with increasing material thickness, although it is not a simple linear relationship. It can be observed that when the material thickness increases from 2 mm to 3 mm, the gradients of the four parameters exhibit a rapid increase, which is not observed in other thickness ranges. In terms of their physical implications, these findings suggest that as the material thickness increases, there is a reduced requirement for Young’s modulus and an increased requirement for Poisson’s ratio of the transition material itself. However, it is important to note that these conclusions are derived from quantitative analysis and need to be verified through further calculations in practical applications.
3.2 Real material simulation for validation
As some of the data in the Optimization design scheme section was obtained through linear interpolation, it is necessary to validate the results by inputting actual data. For this purpose, we selected three materials: Nylon 66, POM, and silicon nitride ceramics (SNC). Their material properties are shown in Table 6. Nylon 66 and POM have similar Young’s modulus, but POM has a higher Poisson’s ratio. Silicon nitride ceramics have a Poisson’s ratio similar to that of Nylon 66 but a higher Young’s modulus.
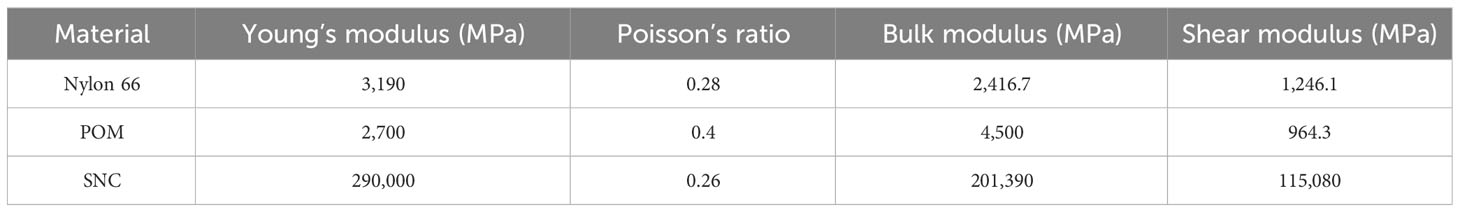
Table 6 Nylon 66, POM, and Silicon Nitride Ceramics are three material properties.
According to the finite element analysis model in the Optimization design scheme section, the maximum stress and strain values of the optical window, when reinforced with 1–4 mm thicknesses of the three materials, were calculated. The calculation results are shown in Figure 11.
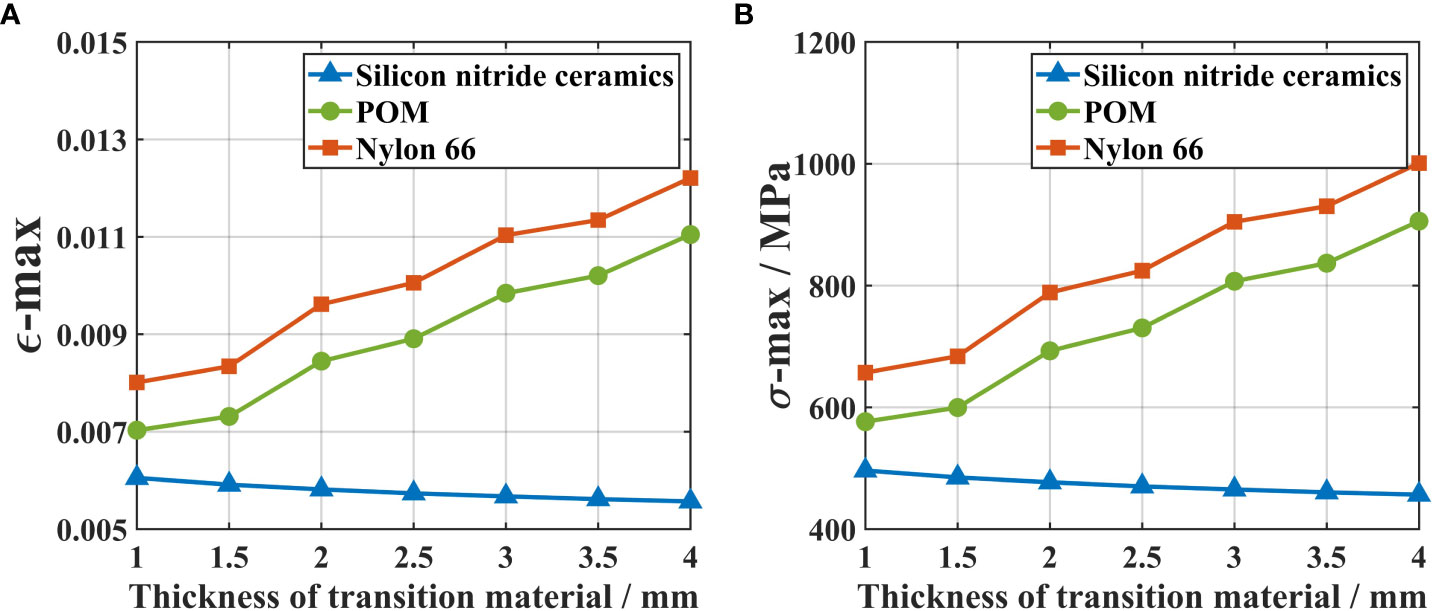
Figure 11 Effect of adding three kinds of spacers with different thicknesses on the spherical shell sector optical window. (A) The maximum equivalent elastic strain of the spherical shell sector optical window. (B) The maximum equivalent stress of the spherical shell sector optical window.
Based on the analysis of the calculation results, it can be concluded that when the gasket thickness is between 1 mm and 4 mm, the maximum stress of the optical window using silicon nitride ceramics as the transition material is always smaller than that of using Nylon 66 or POM. Specifically, when the thickness is 1 mm, the maximum stress of the optical window using silicon nitride ceramics as the transition material is 496.21 MPa, which is about 2% lower than that without using the transition material. In contrast, the maximum stress of the optical window using Nylon 66 as the transition material is 656.97 MPa, which is about 26% higher than that without using the transition material. The maximum stress of the optical window using POM as the transition material is 576.48 MPa, which is about 11% higher than that without using the transition material. Moreover, as the thickness of the transition material increases, the maximum stress of the optical window using silicon nitride ceramics gradually decreases, while the maximum stress of using the other two materials gradually increases.
When the gasket thickness is between 1 mm and 4 mm, the judgment values , , , and . According to the conclusion in the Optimization design scheme section, using POM or Nylon 66 will increase the maximum stress value of the optical window in this model, while using silicon nitride ceramics will decrease the maximum stress value of the optical window in this model. Moreover, as the thickness of the transition material increases, the change in stress becomes more significant. Therefore, the conclusion from the verification of the real material simulation is consistent with the conclusion in the Optimization design scheme section.
3.3 Analysis of the impact of friction
To investigate the impact of the friction coefficient on the stress distribution of the optical windows when the transition material remains unchanged, a finite element analysis model in the Optimization design scheme section was used. Silicon nitride ceramic was selected as the transition material. The contact mode between the optical window and the base was changed from nonfrictional contact to frictional contact, and the friction coefficient was increased from 0 to 0.8 in increments of 0.2. The maximum equivalent elastic strain and maximum equivalent stress of the optical window were calculated and statistically analyzed for different gasket thicknesses and friction coefficients. The calculation results are shown in Figure 12.
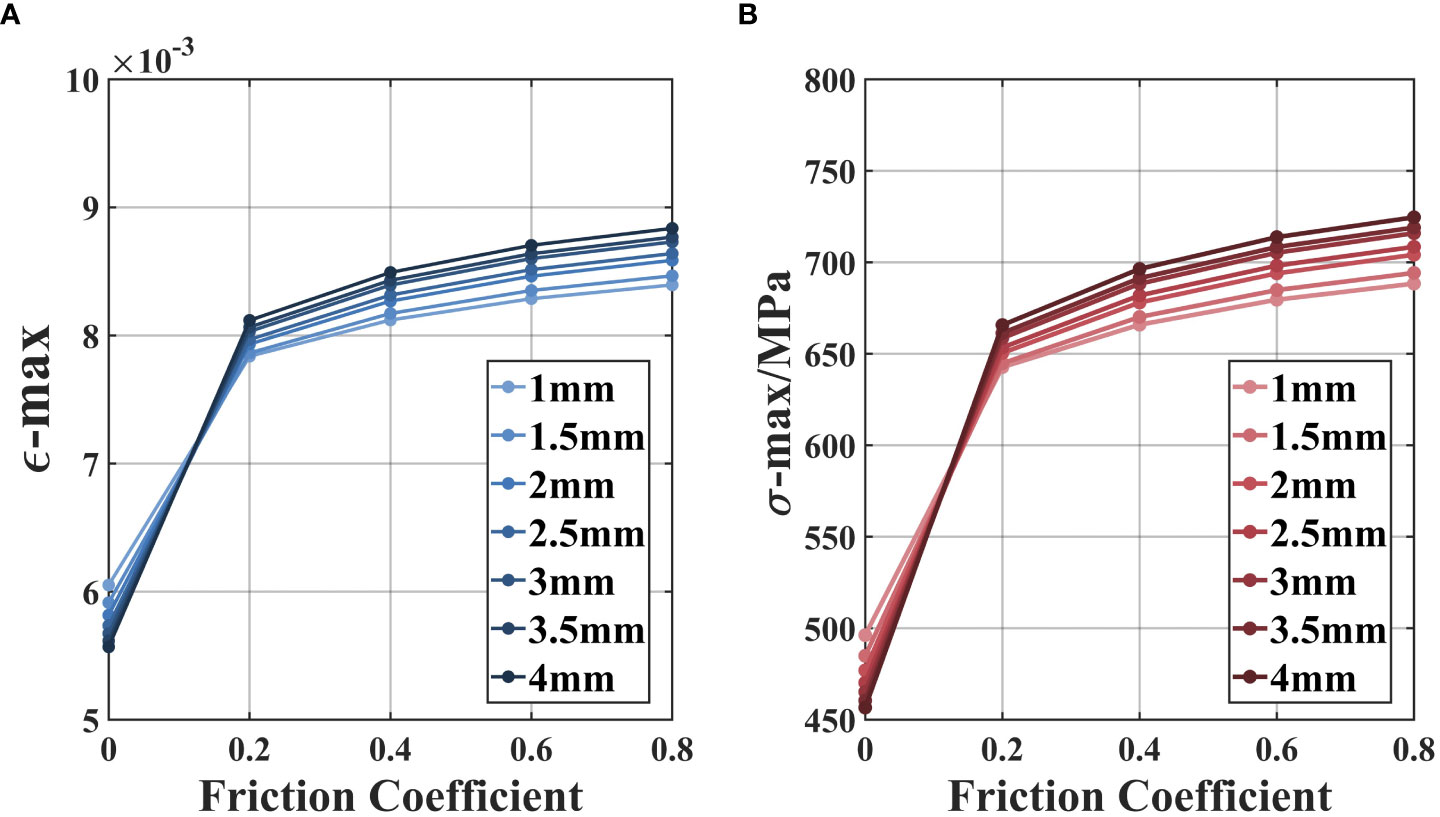
Figure 12 The impact of different friction coefficients. (A) The maximum equivalent elastic strain of the windows. (B) The maximum equivalent stress of the windows.
Based on the analysis of the calculation results, it can be concluded that the friction coefficient has a significant impact on the maximum equivalent elastic strain and equivalent stress of the optical window reinforced using silicon nitride ceramic gaskets. As the friction coefficient increases, the maximum equivalent stress of the optical window also increases, and the thickness of the gasket used has a greater impact. When the friction coefficient is less than 0.2, the impact of the friction coefficient on the stress distribution of the optical window is particularly significant. This is mainly due to the fact that when the friction coefficient is small, the contact between the optical window and the base is mainly sliding contact. When the friction coefficient is greater than 0.2, the contact between the optical window and the base changes to adhesive contact, and the effect of the increasing friction coefficient on the stress of the optical window gradually decreases.
Furthermore, based on the analysis of the results from both the friction coefficient-stress curve and the gasket thickness-stress curve, it can be concluded that thicker gaskets have a more significant reinforcement effect on the optical window and are also more sensitive to the increase in friction coefficient. However, this effect does not follow a linear pattern, and when the gasket thickness is around 2.5 mm, the overall effect is more optimal.
4 Experiments and results
To test the pressure resistance of the structure, we conducted a high-pressure simulation test using a deep-sea ultra-high-pressure simulation test device. To ensure safety, a safety factor of 1.05 was applied. The internal pressure of the pressure vessel was increased from 0 MPa to 121 MPa and maintained for 120 min before being depressurized to 0 MPa. The pressurization rate was set at 2 MPa/min, and the depressurization rate was set at −2 MPa/min, based on the actual diving and rising rates of deep-sea equipment in engineering applications. The experimental device and settings are shown in Figure 13.
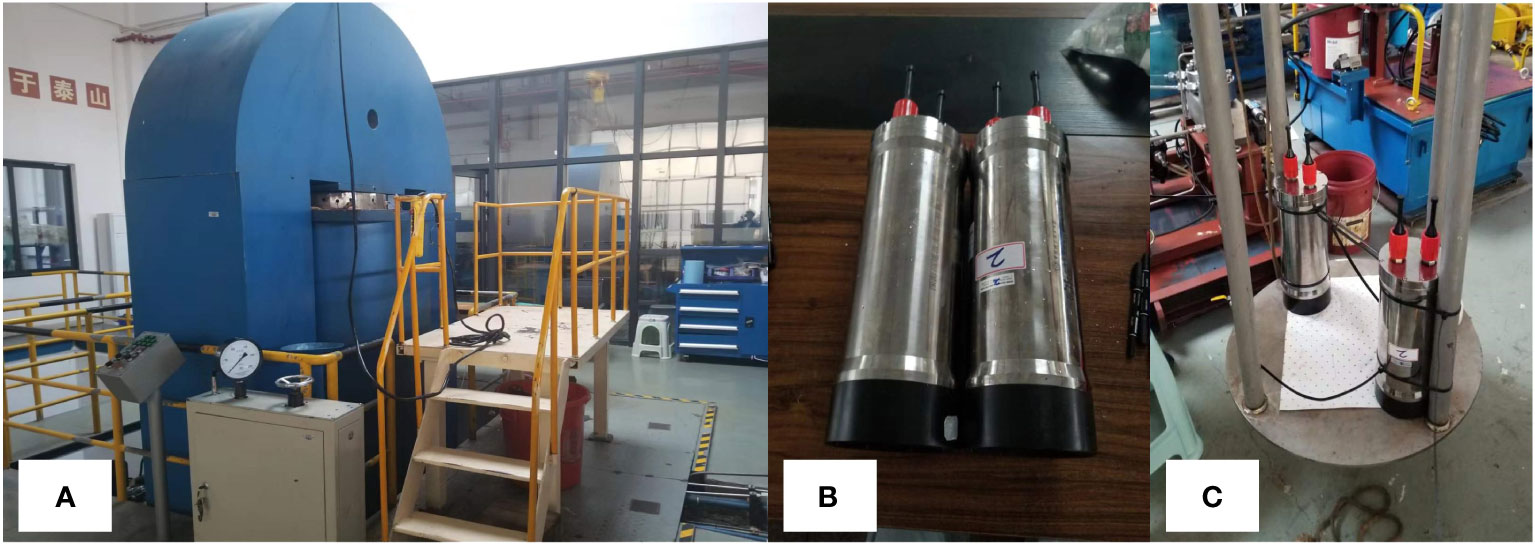
Figure 13 Experimental environment and object. (A) Deep-sea ultra-high-pressure simulation experimental equipment. (B) Silicon nitride ceramic gasket-reinforced pressure-resistant structure. (C) Pressure-resistant structure fixed.
The first transition material tested was silicon nitride ceramic with a thickness of 2.4 mm. The experimental results are shown in Figure 14. After the high-pressure simulation test, the pressure-resistant structure reinforced using silicon nitride ceramic remained visually intact, with no signs of water leakage inside. Additionally, the optical window’s inner and outer surfaces and supporting surfaces were free from any damage, demonstrating its ability to meet the requirements for the working pressure of 115 MPa.
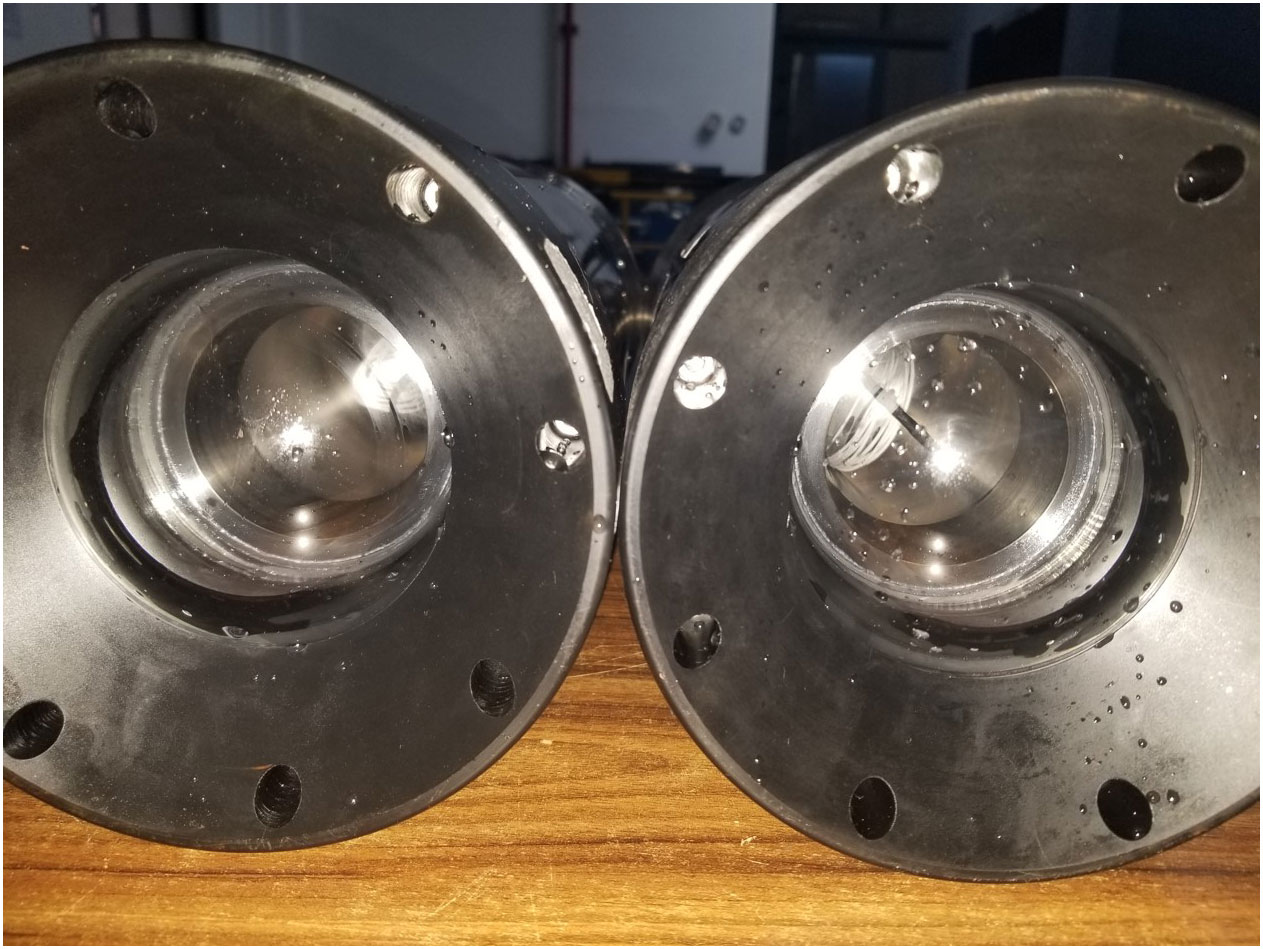
Figure 14 Optical window using silicon nitride ceramics as transition materials after a high-pressure test.
The second transition material tested was POM, with a thickness of 2.3 mm. The experimental results are shown in Figure 15. After the high-pressure simulation test, we observed obvious plastic deformation of the POM gasket, with a large number of silver streaks appearing on the outer ring, indicating that it was on the verge of failure. The pressure-resistant structure reinforced using POM as the transition material may not be reliable for use, and the deformed gasket may block the optical window, affecting the normal operation of internal equipment.
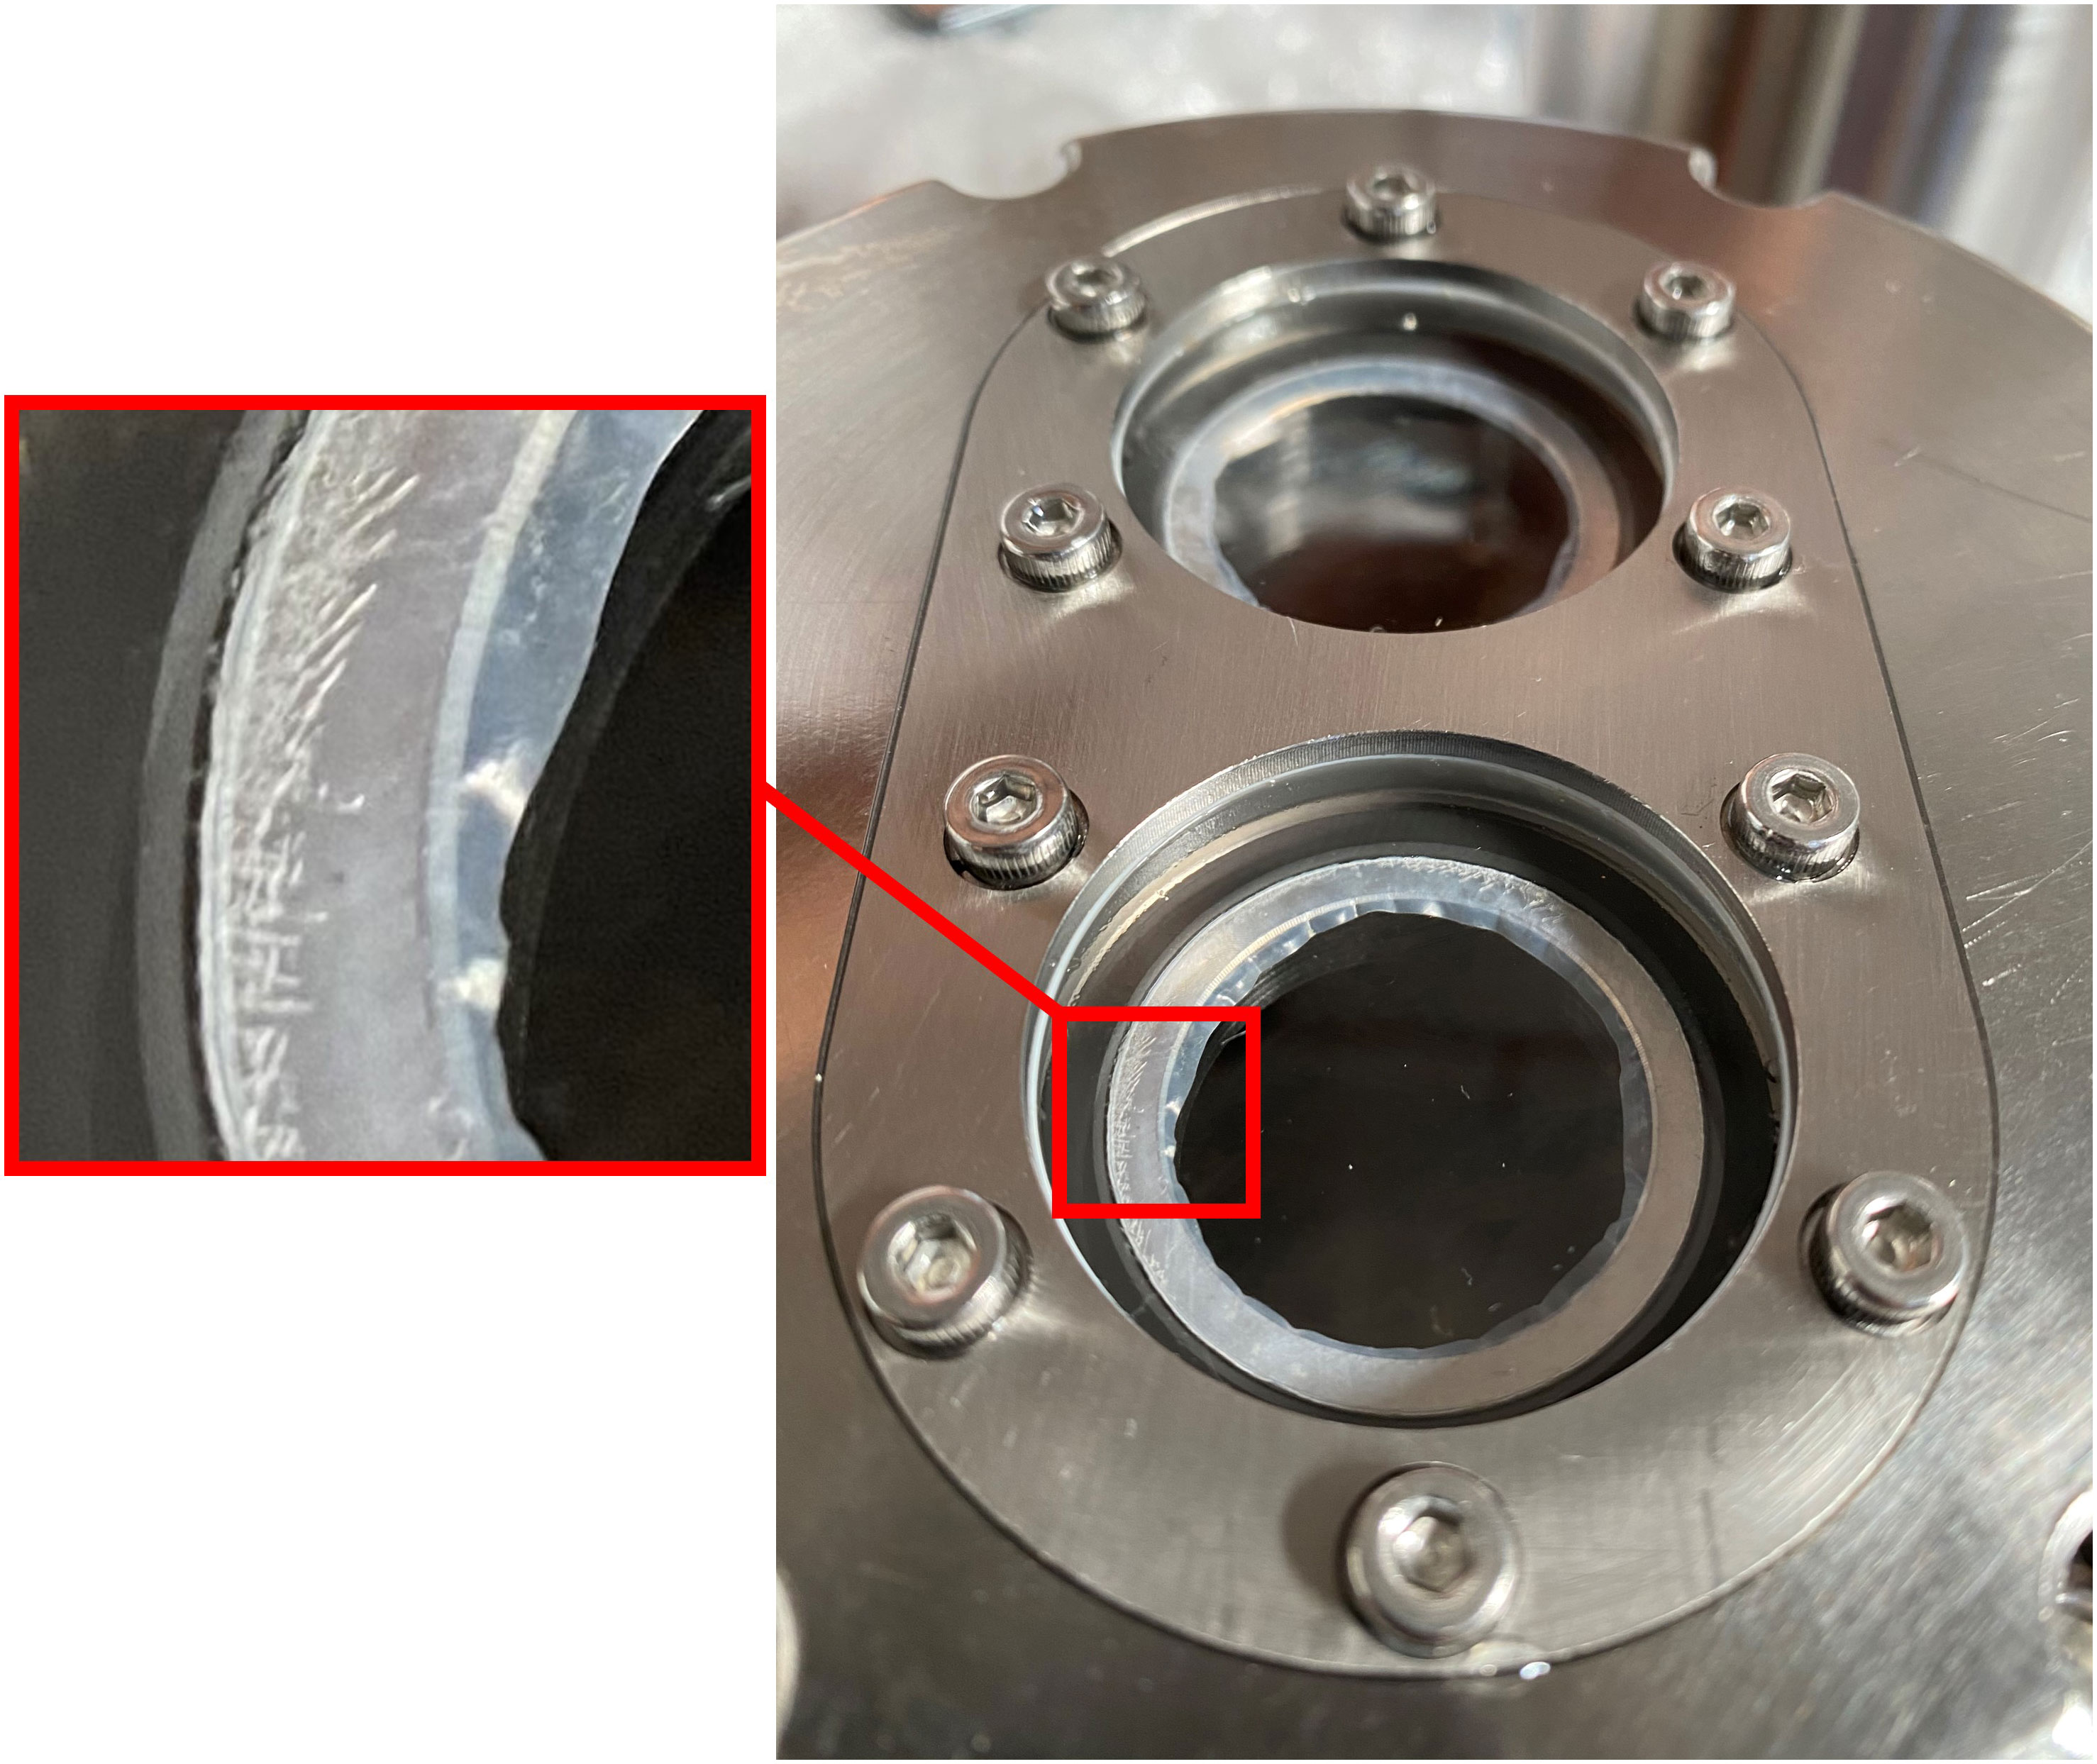
Figure 15 POM gasket after a high-pressure simulation test.
The two sets of experiments described above demonstrated the reliability of using silicon nitride ceramic as a transition material, while POM was found to be unsuitable due to its inability to effectively reduce stress concentration on the optical window and its lack of potential for multiple uses. In summary, the selection of transition materials is crucial for the success of pressure-resistant structure design with optical windows for deep-sea applications. The optimized design method and concept proposed in this study have significant implications for the field of deep-sea equipment.
5 Discussion
Based on the calculations and discussions presented in the previous sections, it can be concluded that the stress distribution and concentration of optical windows are important considerations in designing underwater pressure-resistant structures. In this study, we investigated the stress of optical windows with end-face reinforcement using computational and finite element analysis models. To compare the results with relevant research work, we summarized the data in Table 7.
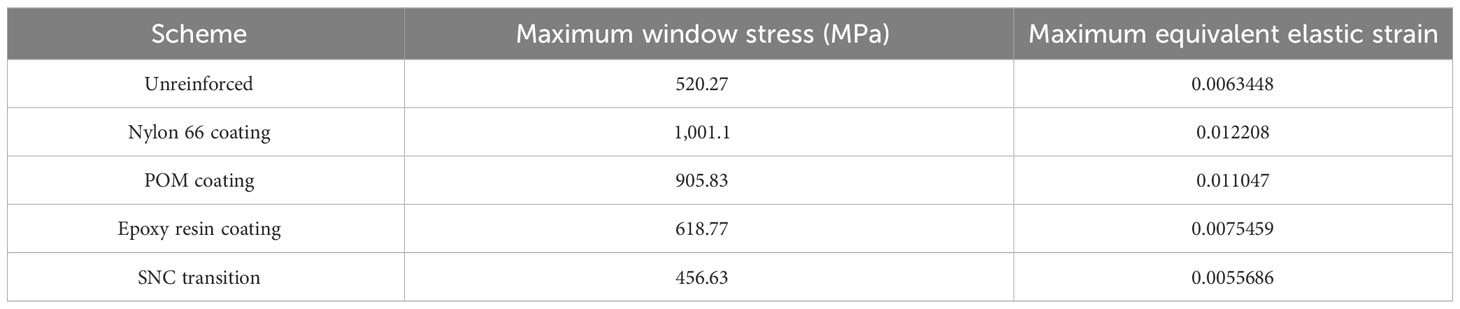
Table 7 Window calculation results for each scheme.
Considering the actual physical conditions, we set the epoxy resin thickness to 1 mm and the thickness of the remaining reinforcing materials to 4 mm. According to our data results, when using SNC for the transition, the maximum stress and equivalent elastic strain decreased by 12.2% compared to the unreinforced case. This indicates that our proposed transition material optimization design can effectively reduce stress concentration in optical windows. On the other hand, when using materials such as nylon 66, POM, and epoxy resin, although point contact effects can be avoided in practical situations, they also lead to more severe stress concentration in the window. This may be due to differences in the characteristics, stiffness, and strength of these materials.
Regarding the judgment value Q of the materials, the Q values for each scheme were calculated as shown in Table 8.
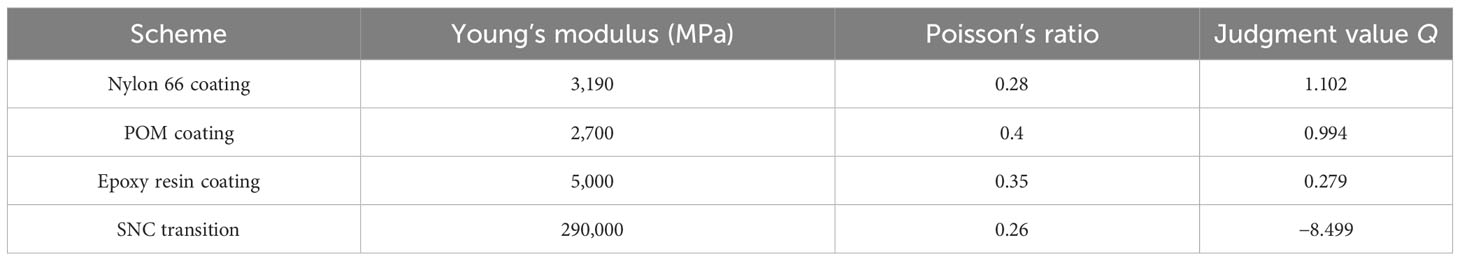
Table 8 Judgment value Q calculation results.
By comparing the data in Tables 7, 8, it can be observed that we found the material to effectively reduce stress concentration in optical windows only when the judgment value Q is less than 0. This validates the rationality of the judgment value calculation method proposed in the Optimization methods section.
In conclusion, our proposed transition material optimization design scheme can significantly reduce stress concentration in optical windows. Compared to previous relevant works, our solution demonstrates superior performance in terms of practical effectiveness.
6 Conclusion
This study focuses on the optimization design of spherical sector optical windows in pressure-resistant structures. The negative impact of base deformation on the pressure resistinlance limit is analyzed using both theoretical calculations and simulation analysis. Based on this, an optimization design method using transition materials filled between the base and the optical window is proposed, and relevant calculations and experiments are conducted. The results indicate the following: (1) The deformation of the cylindrical end face significantly alters the stress distribution of the spherical sector optical window. A notable stress concentration occurs at the bottom corner of the inner diameter, which is one of the main reasons for the window’s inability to reach the theoretical pressure resistance limit. (2) After filling the transition material between the cylindrical end face and the optical window, significant changes in the mechanical performance of the window are observed. The maximum stress in the window is influenced by the properties of the transition material and physical conditions. Specifically, the maximum stress is negatively correlated with the elastic modulus and Poisson’s ratio of the transition material, and an increase in the filling thickness makes the stress more sensitive to these factors. (3) The proposed criterion value Q for material selection is effective. However, it should be noted that when using materials with Q > 0 for transition, the maximum stress in the window is negatively correlated with the thickness of the transition material, while it is positively correlated when Q< 0. An increase in the friction coefficient leads to an increase in the maximum stress in the window; especially when the friction coefficient is less than 0.2, this effect becomes more pronounced.
In future research, we suggest further considering the following aspects: (1) Whether selecting anisotropic materials for transition is superior to isotropic materials; (2) It is necessary to study the effects of fatigue and creep of transitional materials on optical windows and estimate the maximum service life; (3) Theoretically, selecting nonlinear materials for transition can reduce the thickness of the base while ensuring the same mechanical performance, but feasibility needs to be further validated.
The contribution of this study lies in the introduction of a new approach for the design of optical windows in deep-sea pressure-resistant structures, along with the validation of its feasibility and effectiveness. The reliability of the research results has been thoroughly verified, and they hold a certain level of generality. Furthermore, the innovative aspect of this study is the proposal of an evaluation method based on transition materials, which provides a novel approach and methodology for the design and optimization of optical windows. Overall, this research holds potential value for the future development of deep-sea equipment and carries profound implications for the advancement of deep-sea scientific progress.
Data availability statement
The original contributions presented in the study are included in the article/supplementary material. Further inquiries can be directed to the corresponding author.
Author contributions
Conceptualization: YW, GM, and XQ. Methodology: YW, GM, and HZ. Analysis: YW and XZ. Manuscript writing: YW, XZ, and XQ. All authors contributed to the article and approved the submitted version.
Funding
This study was supported by the Youth Innovation Promotion Association CAS (No. 2020361), the Scientific Instrument Developing Project of the Chinese Academy of Sciences (No.YJKYYQ20190053), and National Key R&D Program of China (NO.2021YFC2800300)..
Acknowledgments
The authors thank Kelin Sun, Jingchuan Yang, Bing Zhang, and Chen Li (Institute of Deep-sea Science and Engineering, Chinese Academy of Science) for their assistance during the experiment and test.
Conflict of interest
The authors declare that the research was conducted in the absence of any commercial or financial relationships that could be construed as a potential conflict of interest.
Publisher’s note
All claims expressed in this article are solely those of the authors and do not necessarily represent those of their affiliated organizations, or those of the publisher, the editors and the reviewers. Any product that may be evaluated in this article, or claim that may be made by its manufacturer, is not guaranteed or endorsed by the publisher.
References
Ahn J., Yasukawa S., Sonoda T., Nishida Y., Ishii K., Ura T. (2018). An optical image transmission system for deep sea creature sampling missions using autonomous underwater vehicle. IEEE J. Ocean. Eng. 45(2):350–61. doi: 10.1109/JOE.2018.2872500
ASME (2016). Safety standard for pressure vessels for human occupancy: ASME PVHO-1-2016 (New York, NY: American Society of Mechanical Engineers).
Bingham B., Foley B., Singh H., Camilli R., Delaporta K., Eustice R., et al. (2010). Robotic tools for deep water archaeology: Surveying an ancient shipwreck with an autonomous underwater vehicle. J. Field Robotics 27 (6), 702–717. doi: 10.1002/rob.20350
Binghan X. U. (1987). Theory and experiment of shell opening (Beijing, China: National Defense Industry Press).
Boffety M., Galland F., Allais A. G. (2012). Color image simulation for underwater optics. Optical Soc. America 51(23), 5633–5642. doi: 10.1364/AO.51.005633
Du M., Peng X., Zhang H., Ye C., Dasgupta S., Li J., et al. (2021). Geology, environment, and life in the deepest part of the world’s oceans. Innovation 2 (2), 100109. doi: 10.1016/j.xinn.2021.100109
Du Q., Wang L., Cui W. (2011). Coordinative analysis of cone-shaped hinge window structure. J. Ship Mechanics 15 (1/2), 101–108.
Junhou P. (1984). Stress analysis of observation window structure of spherical submersible Vol. 06 (Ship Science and Technology), 39–52.
Luo W. B., Wang C. H., Zhao R. G. (2007). Application of time-temperature-stress superposition principle to nonlinear creep of poly (methyl methacrylate). Key Eng. Materials 340, 1091–1096. doi: 10.4028/www.scientific.net/KEM.340-341.1091
Peng X., Zhang W., Schnabel K., Leduc D., Xu H., Zhang H., et al. (2023). Unveiling the mysteries of the kermadec trench. Innovation 4, 100367. doi: 10.1016/j.xinn.2022.100367
Quan X., Wei Y., Liu K., Li B. (2022). The analysis and design of deep-sea lighting field based on spectral transfer function. Front. Mar. Sci. 9, 1058201. doi: 10.3389/fmars.2022.1058201
Rajput N. S., Pranesh S. B., Sathianarayanan D., Ramadass G. A. (2021). Acrylic spherical pressure hull for Manned Submersible. Materials Today: Proc. 46, 9412–9418. doi: 10.1016/j.matpr.2020.03.058
SB P., Kumar D., Anantha S. V., GA R.. (2018). Structural analysis of spherical pressure hull viewport for manned submersibles using biological growth method. Ships Offshore Structures 13 (6), 601–616. doi: 10.1080/17445302.2018.1440885
Stachiw J. D. (1967). Critical pressure of conical acrylic windows under short-term hydrostatic loading. J. Manufactur. Sci. Eng. 89 (3), 417–425. doi: 10.1115/1.3610072
Stachiw J. D. (1970a). Conical acrylic windows under long-term hydrostatic pressure of 10,000 psi. Mechanical Eng. 94 (4), 843–848. doi: 10.1115/1.3428292
Stachiw J. D. (1970b). Conical acrylic windows under long term hydrostatic pressure of 20,000 psi. J. Eng. Industry 92 (1), 237. doi: 10.1115/1.3427713
Stachiw J. D. (1972). Conical acrylic windows under long-term hydrostatic pressure of 5000 psi. J. Manufactur. Sci. Eng. 94 (3), 843–848. doi: 10.1115/1.3428259
Stachiw J. D. (1975). Deep submergence spherical shell window assembly with glass or transparent ceramic windows for abyssal depth service. J. Manufactur. Sci. Eng. 97 (3), 62–63. doi: 10.1115/1.3438652
Stachiw J. D., Sletten R. (1976). Spherical shell sector acrylic plastic windows with 12,000 ft operational depth for submersible alvin. J. Eng. Industry 98 (2), 523. doi: 10.1115/1.3438932
Vlachos M., Skarlatos D. (2021). An extensive literature review on underwater image color correction. Sensors 21 (17), 5690. doi: 10.3390/s21175690
Wang F., Wang W., Zhang Y., Du Q., Jiang Z., Cui W. (2019). Effect of temperature and nonlinearity of PMMA material in the design of observation windows for a full ocean depth manned submersible. Mar. Technol. Soc. J. 53 (1), 27–36. doi: 10.4031/MTSJ.53.1.4
Zhao X., Jin T., Qu S. (2015). Deriving inherent optical properties from background color and underwater image enhancement. Ocean Eng. 94, 163–172. doi: 10.1016/j.oceaneng.2014.11.036
Keywords: pressure-resistant structure, optical window design, finite element analysis, mechanical model analysis, optimized design scheme
Citation: Wei Y, Ma G, Zhang H, Zhang X and Quan X (2023) Optimization design of optical windows for deep-sea pressure-resistant structures based on transition materials. Front. Mar. Sci. 10:1211337. doi: 10.3389/fmars.2023.1211337
Received: 24 April 2023; Accepted: 10 August 2023;
Published: 12 December 2023.
Edited by:
Leila J. Hamdan, University of Southern Mississippi, United StatesCopyright © 2023 Wei, Ma, Zhang, Zhang and Quan. This is an open-access article distributed under the terms of the Creative Commons Attribution License (CC BY). The use, distribution or reproduction in other forums is permitted, provided the original author(s) and the copyright owner(s) are credited and that the original publication in this journal is cited, in accordance with accepted academic practice. No use, distribution or reproduction is permitted which does not comply with these terms.
*Correspondence: Xiangqian Quan, cXVhbnhxQGlkc3NlLmFjLmNu