
94% of researchers rate our articles as excellent or good
Learn more about the work of our research integrity team to safeguard the quality of each article we publish.
Find out more
ORIGINAL RESEARCH article
Front. Mar. Sci. , 09 August 2023
Sec. Marine Fisheries, Aquaculture and Living Resources
Volume 10 - 2023 | https://doi.org/10.3389/fmars.2023.1210182
 Thomas R. Carruthers1*
 Quang C. Huynh2
 Matthew V. Lauretta3
 Ann L. Preece4
 Douglas S. Butterworth5
 Adrian R. Hordyk2
 Nathan G. Taylor6
An individual tagging model was implemented within the spatial, seasonal, multi-stock, multi-fleet operating models of the peer-reviewed Management Strategy Evaluation (MSE) framework for Atlantic bluefin tuna to evaluate the benefits of a harvest strategy that utilizes conventional gene tagging. A multi-year Brownie estimator was developed to test the accuracy and precision of exploitation rate estimates arising from gene tagging programs with various scenarios for spatial release distribution, release numbers and fishery exploitation rates. Harvest strategies that used the Brownie estimator were tested to evaluate yield and resource conservation performance relative to idealized management using perfect information. For the eastern stock, releasing 1,000 fish throughout the Atlantic and genotyping 27% of all landed fish at an estimated cost of US$2M was sufficient to obtain estimates of exploitation rate with a coefficient of variation of 20%. For the western stock, the same precision in exploitation rate estimates required the release of 1,300 fish and genotyping rate of 35% at an estimated cost of US$2.5M. Harvest strategies using the gene tagging data provided expected yield and resource conservation performance that was not substantially lower than a harvest strategy assuming using perfect information regarding vulnerable biomass. Reducing the number of releases most strongly affected the worst-case ‘lower-tail’ outcomes for West area yield and eastern stock biomass. Conventional gene tagging harvest strategies offer a promising basis for calculating management advice for Atlantic bluefin tuna that may be cheaper, simpler, and more robust than the current conventional stock assessment paradigm.
The Atlantic bluefin tuna (Thunnus thynnus) fishery presents formidable management challenges. Coordinated by the International Commission for the Conservation of Atlantic Tunas (ICCAT), the primary management measures are annual total allowable catches (TACs) for the East and West management areas. However, the Atlantic population is known to consist of at least two genetically distinct but geographically overlapping stocks (Rooker et al., 2014; Block et al., 2005; Puncher et al., 2018) that differ substantially in population size (in 2019, the Reference Case operating model of the bluefin MSE estimated approximately 5M and 0.2M spawning adults for the eastern and western stocks, respectively)(Anon, 2022) and mix in the East and West management areas (Figure 1). The larger eastern stock spawns in the Mediterranean Sea (Alemany et al., 2010; Hernández et al., 2022); the less abundant western stock spawns in the Gulf of Mexico and the Slope Sea (Richardson et al., 2016). The distribution of the stocks, and hence their mixing, is seasonal and the extent of movement varies depending on the size of individual fish (Lutcavage et al., 1999; Fukuda et al., 2010; Galuardi and Lutcavage, 2012) and their stock-of-origin (Block et al., 2005; Puncher et al., 2018). Superimposed on these complex stock dynamics are a range of fishing fleets, diverse in their geographic range and the size of fish that they catch (ICCAT, 2017; ICCAT, 2021). For example, longline fleets are highly mobile and can selectively fish throughout the North Atlantic while Mediterranean trap fisheries typically operate from a static location with short duration corresponding to spawning migrations.
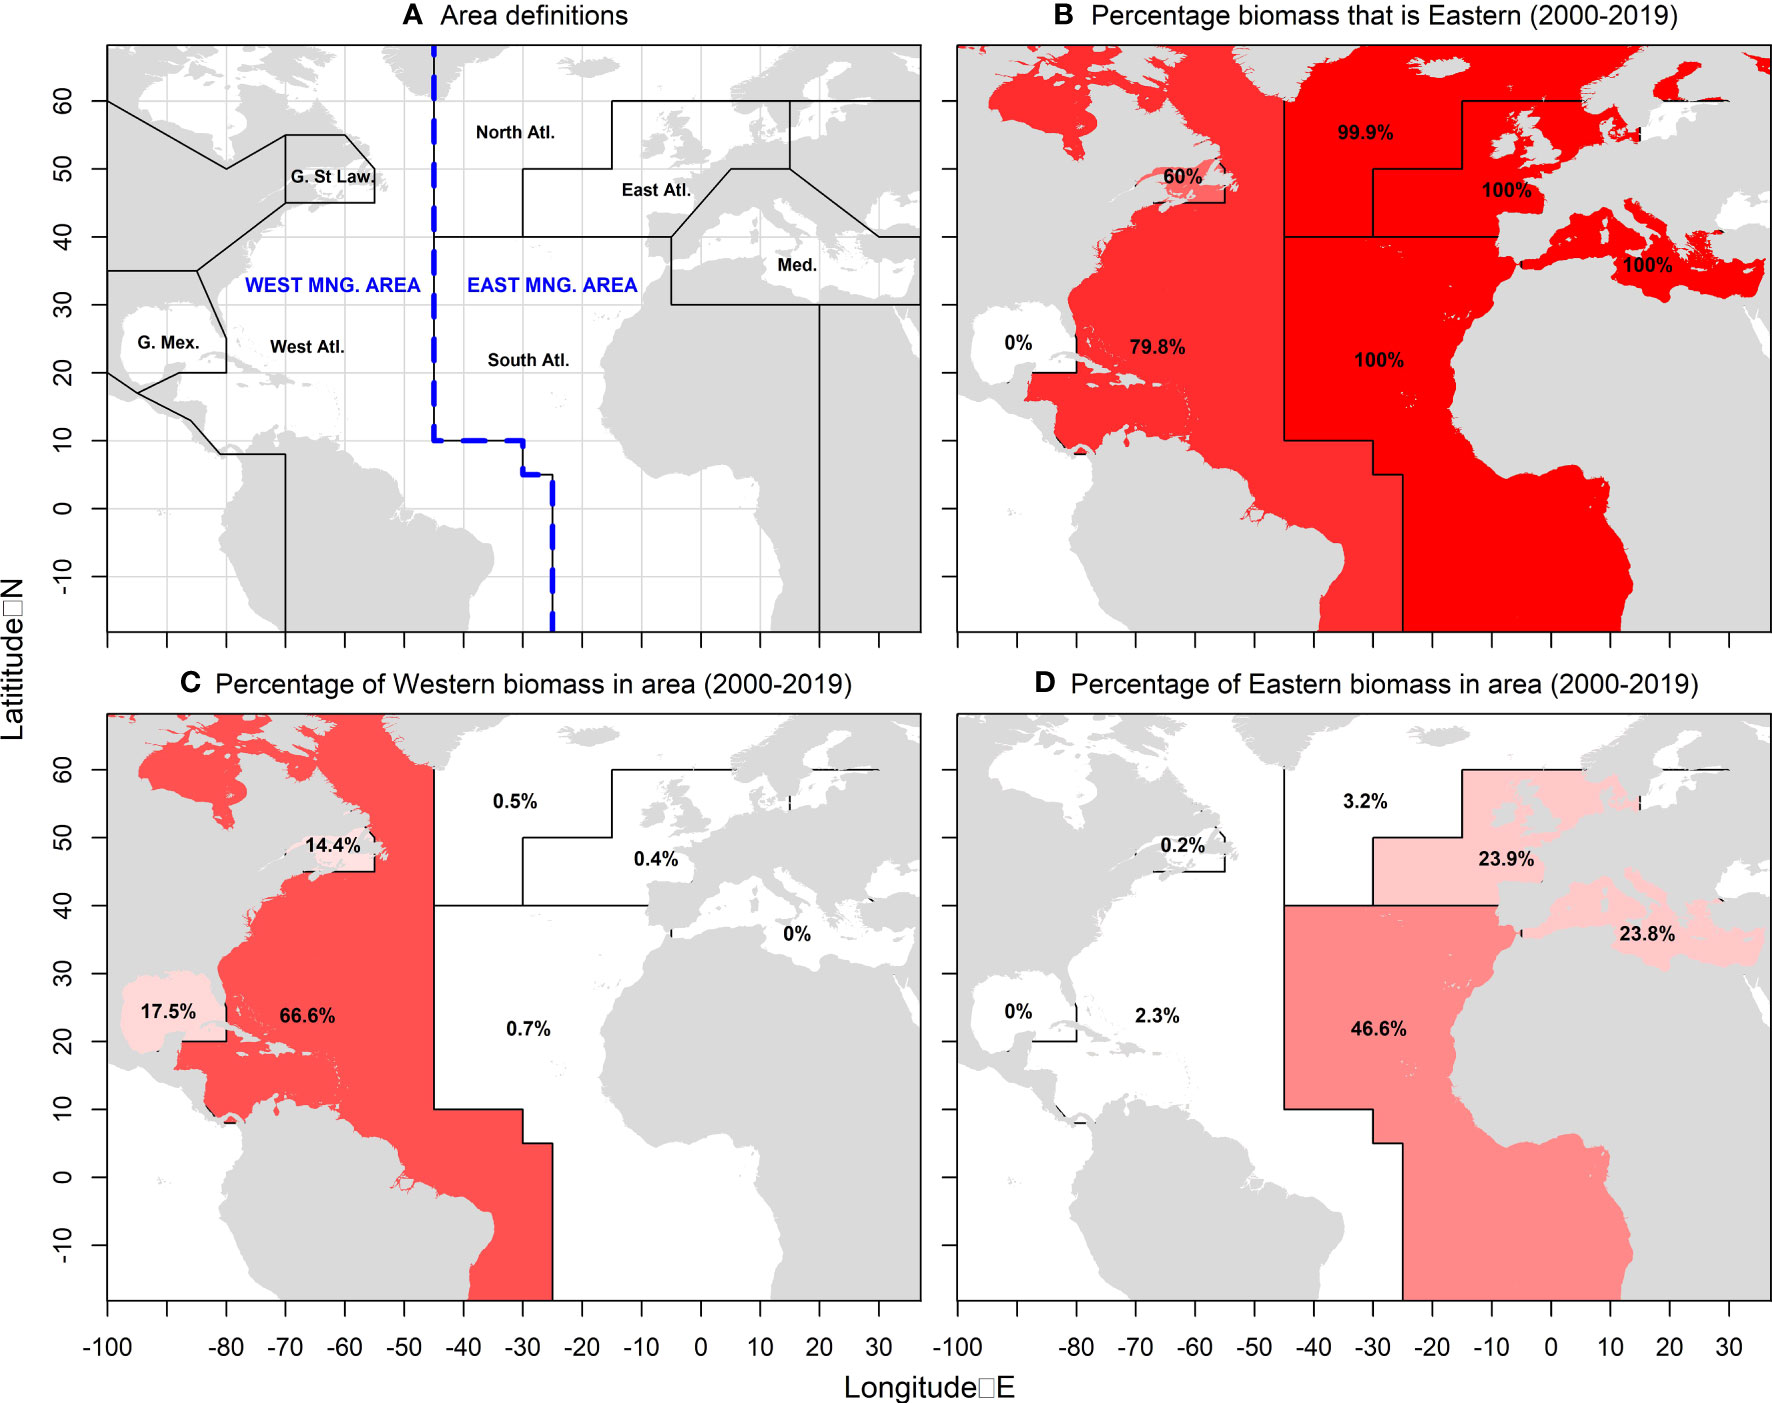
Figure 1 Definition of East and West management areas (A) (blue), the seven areas of the spatial Management Strategy Evaluation (MSE) operating model (black), and estimates of recent stock distribution and mixing (B–D) for the Reference Case ‘Low abundance’ operating model (2000-2019) where darker red areas are those of higher relative biomass (percentages are mean annual percent of total stock biomass in each area).
ICCAT specifies TACs for the East and West management areas using discrete area-specific stock assessments that aim to characterize population and fishery dynamics in order to quantify population abundance and sustainable exploitation rates (ICCAT, 2017; ICCAT, 2021). There are several complications in the interpretation of the stock assessment advice: (1) the assessments are defined geographically by management area and do not necessarily reflect stock dynamics with regards to mixing, particularly of eastern fish into the West management area; (2) it has proven difficult to establish scientifically defensible stock assessments (Maunder, 2021; Ianelli, 2023); (3) despite extensive study, considerable uncertainty remains over fundamental biological, ecological and life-history dynamics such as natural survival rate, somatic growth, and the maturity-at-length schedule (Diaz and Turner, 2007). These issues prevent selection of a defensible “best” stock assessment model to provide management advice (GBYP, 2019).
To address these challenges, ICCAT has pursued Management Strategy Evaluation (MSE) (Cochrane et al., 1998; Butterworth and Punt, 1999; Punt et al., 2016) as an alternative framework which aims to identify simple harvest strategies (algorithms for setting TACs, aka management procedures) that are robust to a wide range of uncertainties. Both empirical and model-based harvest strategies typically make use of one or more indices of relative abundance which are expected to track changes in vulnerable biomass or spawning stock biomass and can be used as indicators to drive management action in a Harvest Control Rule (e.g., Carruthers et al., 2015a; Hillary et al., 2016).
A principal concern in establishing such harvest strategies (and in traditional stock assessments) for bluefin tuna is the availability of suitable data. Given the existing conflicts among regional indices of relative abundance (including those based on commercial catch rates and fishery-independent surveys), and the concerns of various scientists and stakeholders over the representativeness of particular abundance indices, a lack of suitable data remains a potential obstacle to long-term adoption of a harvest strategy for Atlantic bluefin tuna.
In parallel to MSE development, a close-kin gene tagging program (Bravington et al., 2016; Grewe et al., 2018; McDowell et al., 2022) has been initiated in the West Atlantic (also known as close-kin mark recapture or CKMR). In essence, CKMR is intergenerational mark recapture that aims to estimate the size of the spawning stock biomass based on the ‘recapture’ of genetic markers sampled from juveniles. Individuals are sampled and genotyped, and pairwise comparisons are made among the samples to identify kin relationships, for example parent-offspring pairs. These data are then used for classical mark-recapture abundance estimation. However, unlike classical mark-recapture, CKMR does not depend on the survival of released fish, rather, tissue samples can be collected from commercial catches. Although CKMR is a relatively new method, a successful program has been in place for Southern bluefin tuna for more than 15 years (Bravington et al., 2016) and for other species (e.g., Hillary et al., 2018). The viability of the approach is also being evaluated for the eastern Atlantic stock (Anon, 2021a).
The focus on CKMR skipped an older and more established approach for estimating abundance and exploitation rates that has been rigorously theoretically tested: conventional gene tagging, in which DNA is collected from an animal at liberty, the animal is released, and then a further sample is collected at a later date to detect a recapture (Lukacs and Burnham, 2005). From such data, well-established mark-recapture estimators of abundance and exploitation rate can be applied (e.g., Cormack, 1964; Seber, 1982; Brownie et al., 1985). The potential for use of genetic markers in conventional capture-recapture analysis was first suggested by Huggins (1989) and later demonstrated by a number of theoretical and experimental studies (Luikart et al., 2003; Schwartz et al., 2007; Brazeal et al., 2017) with several applications to marine populations including salmon (Beacham et al., 2021), teleosts (Andreou et al., 2012) and more specifically, southern bluefin tuna (Preece et al., 2015; Preece et al., 2018).
For many reasons, conventional gene-tagging is an outstanding opportunity not only for bluefin tuna management in the Atlantic but also globally. As with CKMR, conventional gene tagging nearly obtains 100% reporting rates and 0% shedding rates. This contrasts with conventional tagging where the difficulty of estimating these quantities adds considerably to the uncertainty of the resultant estimates of abundance in absolute terms. Atlantic Bluefin tuna tagged in-water or by rod and reel exhibit low post-release mortality (Stokesbury et al., 2011; Marcek and Graves, 2014). Roughly 85% of global bluefin tuna are sold in a handful of concentrated markets (Japan consumes an estimated 80% of the global sashimi production, Sun et al., 2019), offering a centralized and convenient location for sampling to detect a genetic ‘recapture’. The potential cost of each gene tag recapture relative to the value of a bluefin tuna is very low. Preece et al. (2015) estimated the cost of genotyping to be approximately US$15 per sample including DNA extraction, equipment and labor (but excluding sampling costs, data analysis and management). In the same year as that publication, Atlantic bluefin tuna had an average dock price of US$12,000 per tonne and a mean end value of US$37,000 per tonne (Pew, 2020). Consequently, while releases are expensive (at-sea sampling in addition to the opportunity cost of returning a fish), the cost of recapture sampling of fish caught for consumption is negligible (less than half a percent of the end value of a fish). This opens the potential for genetic mark-recapture sampling of a large fraction of market fish, which in turn would require a relatively small number of in-water releases to obtain sufficient precision in estimates of abundance, exploitation rate, and possibly natural mortality. Such a program could be extended to all ocean areas and stocks (since genetic identification will allow marks to be partitioned by stock-of-origin), including the Pacific, and Southern Oceans (e.g., Bradford et al., 2015). Exploitation rate estimates arising from such a mark-recapture program can feed directly into harvest strategies for West and East Atlantic bluefin tuna as well as Pacific, and Southern stocks. These data can provide an alternative to, or validation of, traditional stock assessment methods that have been problematic for bluefin stocks. A similar gene-tagging program for monitoring abundance of juvenile southern bluefin tuna was implemented in 2016, for which many of the technical challenges of genotyping large numbers of samples from bluefin have been overcome (Preece et al., 2015). If evaluation of stock status is necessary, conventional gene tagging can provide estimates of exploitation rate and abundance that can directly inform stock assessments. Once established over multiple years, conventional gene tagging can also provide estimates of stock composition, stock mixing, and natural mortality rates, which are key sources of uncertainty in current stock assessments for Atlantic bluefin tuna.
Harvest strategies that provide advice based on trends in exploitation rate and abundance, rather than estimates of absolute values, can result in excellent management performance as they are not necessarily affected by persistent biases in the estimates of these quantities (e.g., the adopted harvest strategy for Atlantic bluefin tuna, ICCAT, 2022). Since they do not rely on many assumptions about stock and fishery dynamics, harvest strategies using direct information from conventional gene tagging can be expected to be robust to a wide range of uncertainties regarding stock mixing and migration. Conventional gene tagging data have already been used in the harvest strategy for Southern bluefin tuna (Hillary et al., 2019). In theory, the cost of such a program for Atlantic bluefin tuna would be of the same order of magnitude as current data collection and assessment frameworks, and could provide more accurate and precise estimates of quantities informative for decision making, such as harvest rates. Additionally, gene tagging can be a collaborative endeavor and all contracting parties can have a role in the collection of data used to inform management.
Before such a substantial shift in management paradigm might be recommended, there must first be a suitably rigorous testing to demonstrate that the proposed approach is expected to provide suitable management performance given the various uncertainties in bluefin tuna population and fishery dynamics. The MSE framework for Atlantic bluefin tuna is ideally suited for this analysis as it includes a wide range of operating models that represent plausible alternative states of nature for the mixed stock populations and fishery dynamics (Carruthers et al., 2015b; Carruthers and Butterworth, 2017; Carruthers, 2020; Anon, 2022; ICCAT, 2020).
Using the peer-reviewed MSE framework for Atlantic bluefin tuna, we aim to evaluate the expected precision and bias of genetic mark-recapture estimates of exploitation rate (and abundance) given varying distributions of gene tag releases, release numbers and fishery exploitation rates. Furthermore, we quantify the expected management performance of harvest strategies based on mark-recapture estimators informed by conventional gene tagging.
The MSE framework for Atlantic bluefin tuna includes 48 seasonal spatial multi-stock operating models designed to span uncertainty in biological and fishing dynamics (Carruthers, 2020; Anon, 2021c) (see Figure 2 for the components of MSE relevant to these analyses). In this gene-tagging simulation evaluation, we focused on three operating models (OMs) in the MSE. The first ‘Reference Case’ OM assumed spawning stock biomass estimates equivalent to the lower population scale assumptions programmed in the MSE (Low abundance). Two alternative OMs were also considered that resulted in a broad range of stock biomass and mixing scenarios. The first assumed the eastern stock abundance was relatively high (High eastern), and the second assumed that both eastern and western stock abundance were high (High abundance) (Figure 3). A total of 150 simulations were conducted for each OM including stochasticity in recruitment and the distribution of tag releases. This level of replication provided stable (within one percent) estimates of precision and bias in the exploitation rates and management performance metrics used in harvest strategies.
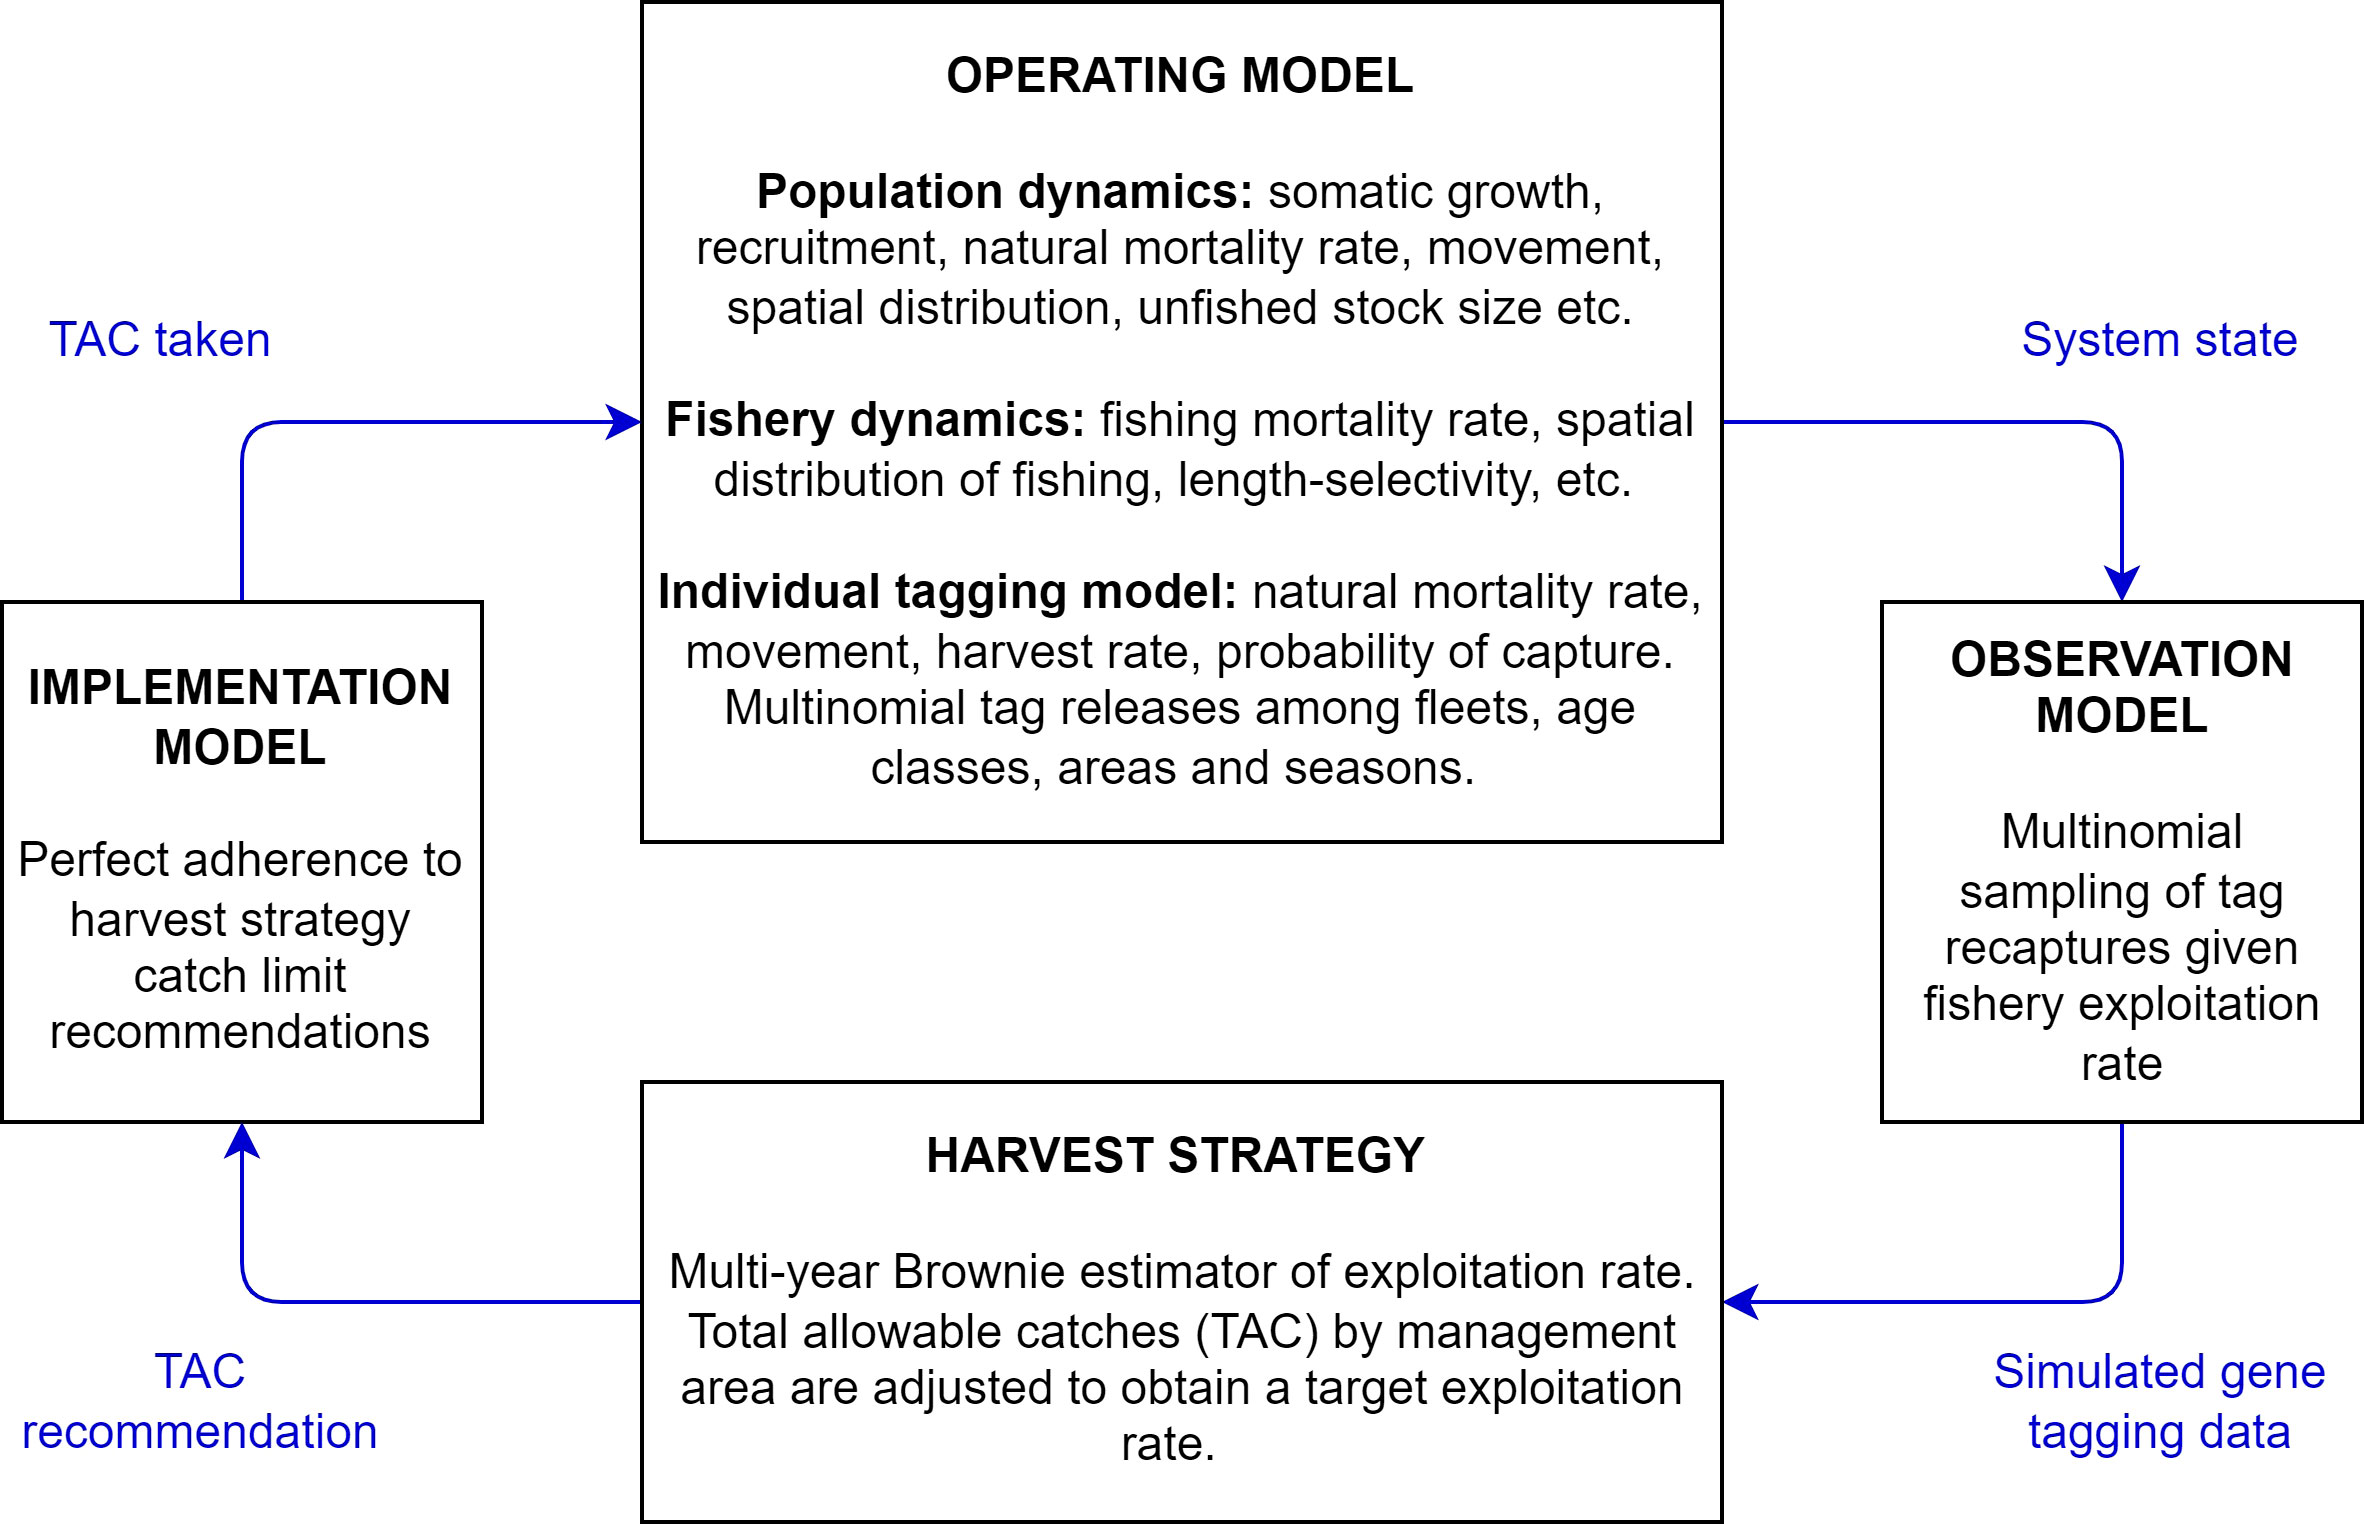
Figure 2 The components of management strategy evaluation relevant to the simulation testing of gene tagging harvest strategies in these analyses. The operating model is a plausible mathematical representation of system dynamics. From the system state simulated by the operating model, the observation model generates simulated data subject to error. Those data are passed to the harvest strategy which calculates a total allowable catch (TAC) recommendation. Here there is no implementation error and the TAC recommendation is passed through the implementation model to the operating model and the system dynamics are updated in the operating model. This ‘closed-loop’ simulation accounts for feedbacks between the system, the data and the harvest strategy. For example, given a harvest strategy with higher target exploitation rates, tag recapture rate increases proportionally, providing more precise estimates of exploitation rates.
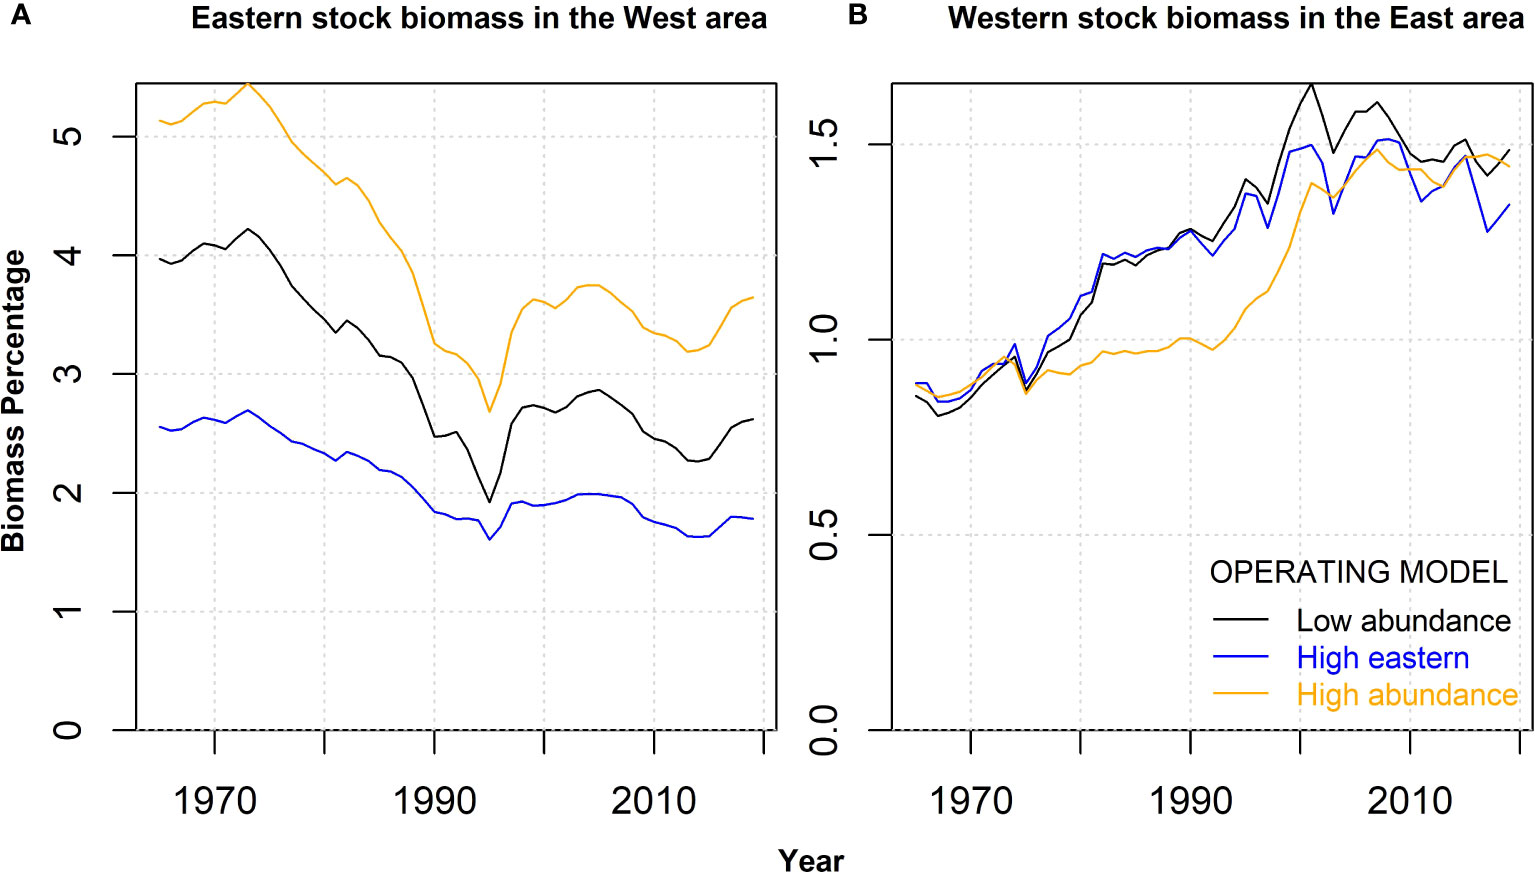
Figure 3 The percentage biomass of each stock in the opposite management area for the Reference case (Low abundance) and two alternative operating models, including high eastern stock abundance (High eastern) and high abundance of both stocks (High abundance). Panel (A) shows the percentage of Eastern stock biomass in the West management area. Panel (B) shows the percentage of the Western stock biomass in the East management area.
To generate simulated tagging datasets, a range of values of assumed exploitation rates (the ratio of catch biomass to vulnerable biomass) between 2 and 10% were projected to evaluate the precision of the tagging estimator, given varying recapture probabilities related to fishery exploitation and release numbers.
An individual-based tagging model (IBTM) was coded into the Atlantic Bluefin Tuna MSE framework (ABT_MSE) to simulate the dynamics of gene-tagging fish. For a complete mathematical description of the tagging model see Appendix A. Briefly, the ABT_MSE is a 7-area seasonal multi-stock set of operating models which have been fit to fishery dependent and independent data that simulate age-based vulnerability to fishing, movement and mixing of eastern and western bluefin tuna populations. In the gene-tagging simulation presented here, all tagged fish were assumed to follow the same population dynamics as the untagged population. The IBTM is stochastic with respect to tag release distribution, age-specific movement, natural survival and harvesting.
Non-independence in recapture probability among tag cohorts is captured by shared seasonal movement, natural mortality, and seasonal-spatial patterns of fishery exploitation. Additional of sources non-independence in recapture probability and survival that could lead to overdispersion in recapture data, for example due to schooling behavior, were not simulated. Mark-recapture estimators can provide overly precise estimates of exploitation rate and abundance when recapture data are overdispersed, but the accuracy of these estimates is unaffected (e.g., Draghici et al., 2021). Since the harvest strategies of this paper calculate management advice using mean estimates and do not account for precision, the impact of phenomena such as schooling was not considered to be substantial. The model assumes that tagged and untagged fish have equal capture probability. Conventional tagging methods such as fin-clipping or external plastic tags leave visible evidence of a tag release which could affect recapture probability or tag reporting rates; however, residual trauma is undetectable for modern gene tagging technologies (Bradford et al., 2015). The model assumed that stock-of-origin (eastern/western stock) is assigned error-free to individual fish as part of the genotyping procedure and analysis. The proportion of erroneous stock assignments is likely to be low in scenarios that incorporate fisheries that catch both eastern and western bluefin tuna. For example, Rodríguez-Ezpeleta et al. (2019) correctly assigned 89% and 98% of western and eastern bluefin tuna, respectively.
The IBTM records the fleet of recapture for each tag, allowing for varying genotyping rate of caught fish among fleets (e.g., varying fractions of caught fish at a centralized market). In the absence of data on the fate of fish caught by each fleet, this analysis remains generic and assumes homogeneity in recapture probability among fleets.
Genetic cross-contamination and gene tagging errors were assumed to be negligible. In reality these errors reduce the recapture probability but would be captured in the natural survival rate parameter of a multi-year tagging estimator and would not affect time series trends in the estimated exploitation rate. If such errors could be independently quantified as tag loss estimates, that information could be added to the tagging estimator to adjust for the negative bias in natural and fishing mortality estimates. In practice, cross-contamination can be minimized through careful tissue collection protocols and tools (Bradford et al., 2015), and genetic errors are minimized through having sufficient markers.
The gene-tagging simulation model included nine fleets, seven areas and four seasons (a total of 252 strata). The first of four simulation experiments focused on the distribution of tag releases (Table 1). Six tag release scenarios were considered in this simulation evaluation, all of which were considered practically feasible as they were based on the spatio-temporal distribution of either observed catches, previous tagging release programs or fishing effort:
1. Tagging occurred in proportion to catches by area and season. In this design, annual tag releases were distributed based on the recent (2019) spatial and seasonal pattern of catch in biomass.
2. As #1 but with tagging balanced such that the same number of tags were released in the East and West areas (Figure 1).
3. Uniformly distributed tagging across all strata with positive catches (approximately 10% of fleet-area-season strata recorded catches in 2019)
4. Tagging in proportion to estimated exploitation rate in 2019 (as estimated by the Reference Case operating model). This is intended to represent the distribution of recent fishing effort in broad terms.
5. Tagging in proportion to the distribution of historical conventional tag releases (Justel-Rubio et al., 2014; Hanke et al., 2019).
6. Tagging in proportion to the distribution of historical electronic tag releases (Anon, 2021b).
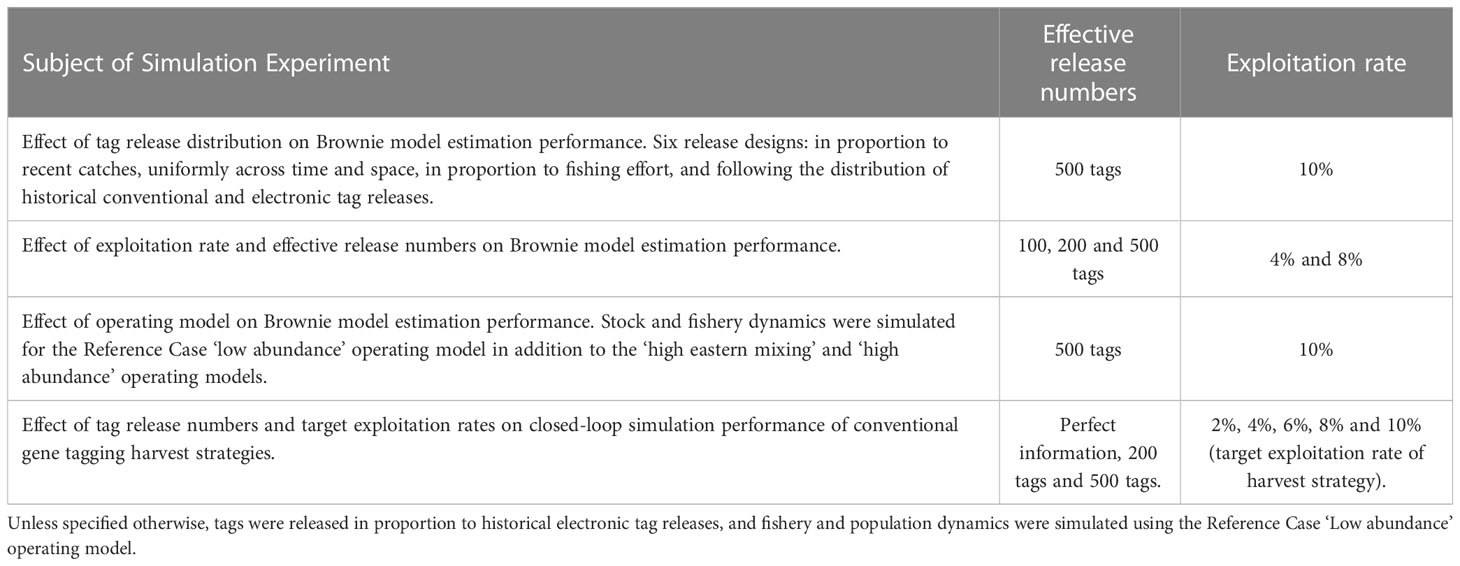
Table 1 Design of the four simulation experiments.
These six alternative tagging scenarios varied markedly in their distribution of marks among fleets, areas and seasons (Supplementary Material Figure 1).
Three levels of tag release frequency were evaluated: 100, 200 and 500 tags per year. In reality, it is not possible to genotype every fish that is caught - the genotyping rate of caught fish would be less than 100%. Since the probability of recapture is proportional to the number of tags released and the genotyping rate, it is trivial to infer the equivalent release numbers required to obtain comparable estimation performance with a lower genotyping rate. For example, the 100, 200 and 500 tag releases per year given 100% genotyping rate are equivalent to 500, 1000 and 2500 releases per year given a 20% genotyping rate of caught fish, respectively. For computational efficiency, we evaluated precision and bias in tagging estimators assuming 100% genotyping rate of caught fish. Later, we discuss the implications for release numbers given lesser and more plausible genotyping rates of caught fish. Note that this assumes that the genotyping rate can be quantified accurately, which is likely given the comprehensive monitoring of overall bluefin tuna catch numbers. Herein, we refer to the number of annual releases equivalent to a genotyping rate at capture of 100% as ‘effective releases’ or ‘effective release numbers’.
A multi-year Brownie tag-recovery model (Brownie et al., 1985) was programmed in order to estimate exploitation rates (see Appendix B for details). The estimator calculated annual exploitation rates and a parameter that adjusts for higher-than-expected recapture rates in the initial release year due to incomplete mixing/seasonal releases. The model estimates the annual exploitation rates in addition to their precision and covariance via maximum likelihood methods. In this analysis the focus was on exploitation rate-based harvest strategy performance which, for reasons described in the next section, was expected to be invariant to biases in the mark-recapture estimator. Consequently, natural survival was assumed to be known and not estimated, and the effects of alternative natural survival assumptions were expected to influence the scale of exploitation rate estimates, but not their trend over time.
The harvest strategies assumed a two-year management interval (total allowable catches by management area, or TACs, are updated every two years), and MSE closed-loop projections were carried out over a 20-year projection period (2023-2042). For each harvest strategy considered, a release program was assumed to have occurred in the three years prior to the first projection year (i.e., during 2020-2022). Harvest strategies that use the multi-year Brownie estimator varied in their target exploitation rate, and were tested for annual effective release numbers of 200 and 500 tags. The gene tagging harvest strategies adjusted the TAC (T) in a management area according to the ratio of recent (mean over n years) stock-specific exploitation rate estimates (U) to a target exploitation rate (λE):
In these investigations, the mean estimated exploitation rate of the last two years (n = 2) was used for TAC calculations. Harvest strategies were specified in pairs, with the same target exploitation rate for both stocks (i.e., the same harvest strategy was applied for both stocks, but with stock-specific information). Target exploitation rates ranging from 2% to 10% were investigated.
Performance of the tagging harvest strategies was compared to a range of constant exploitation rate harvest strategies (also paired with the same exploitation rate in each management area), based on perfect information about vulnerable biomasses in the management areas. In practice, harvest strategies are rarely implemented without considering the maximum change in TAC among management updates (e.g., Cox et al., 2008; Punt et al., 2016). All harvest strategies were subject to a relatively permissive maximum upward and downward adjustment of 50% between management updates.
The tag release distribution strongly determined both the accuracy and precision of the Brownie model estimates of exploitation rate (Figure 4). Since overall catches are biased strongly towards the eastern stock relatively few tags are released on western fish when tag releases are proportional to catches, and hence there is a high degree of error in the estimates of exploitation rate (Figure 4A). Furthermore, those estimates have relatively high variances (i.e., coefficients of variation greater than 0.5, Figure 4B panel b). Altering the release distribution to ensure an equal number of releases in the West and East management areas dramatically reduced error and variance in the estimates for the western stock, while hardly affecting estimation performance for the eastern stock (Figures 4E-H).
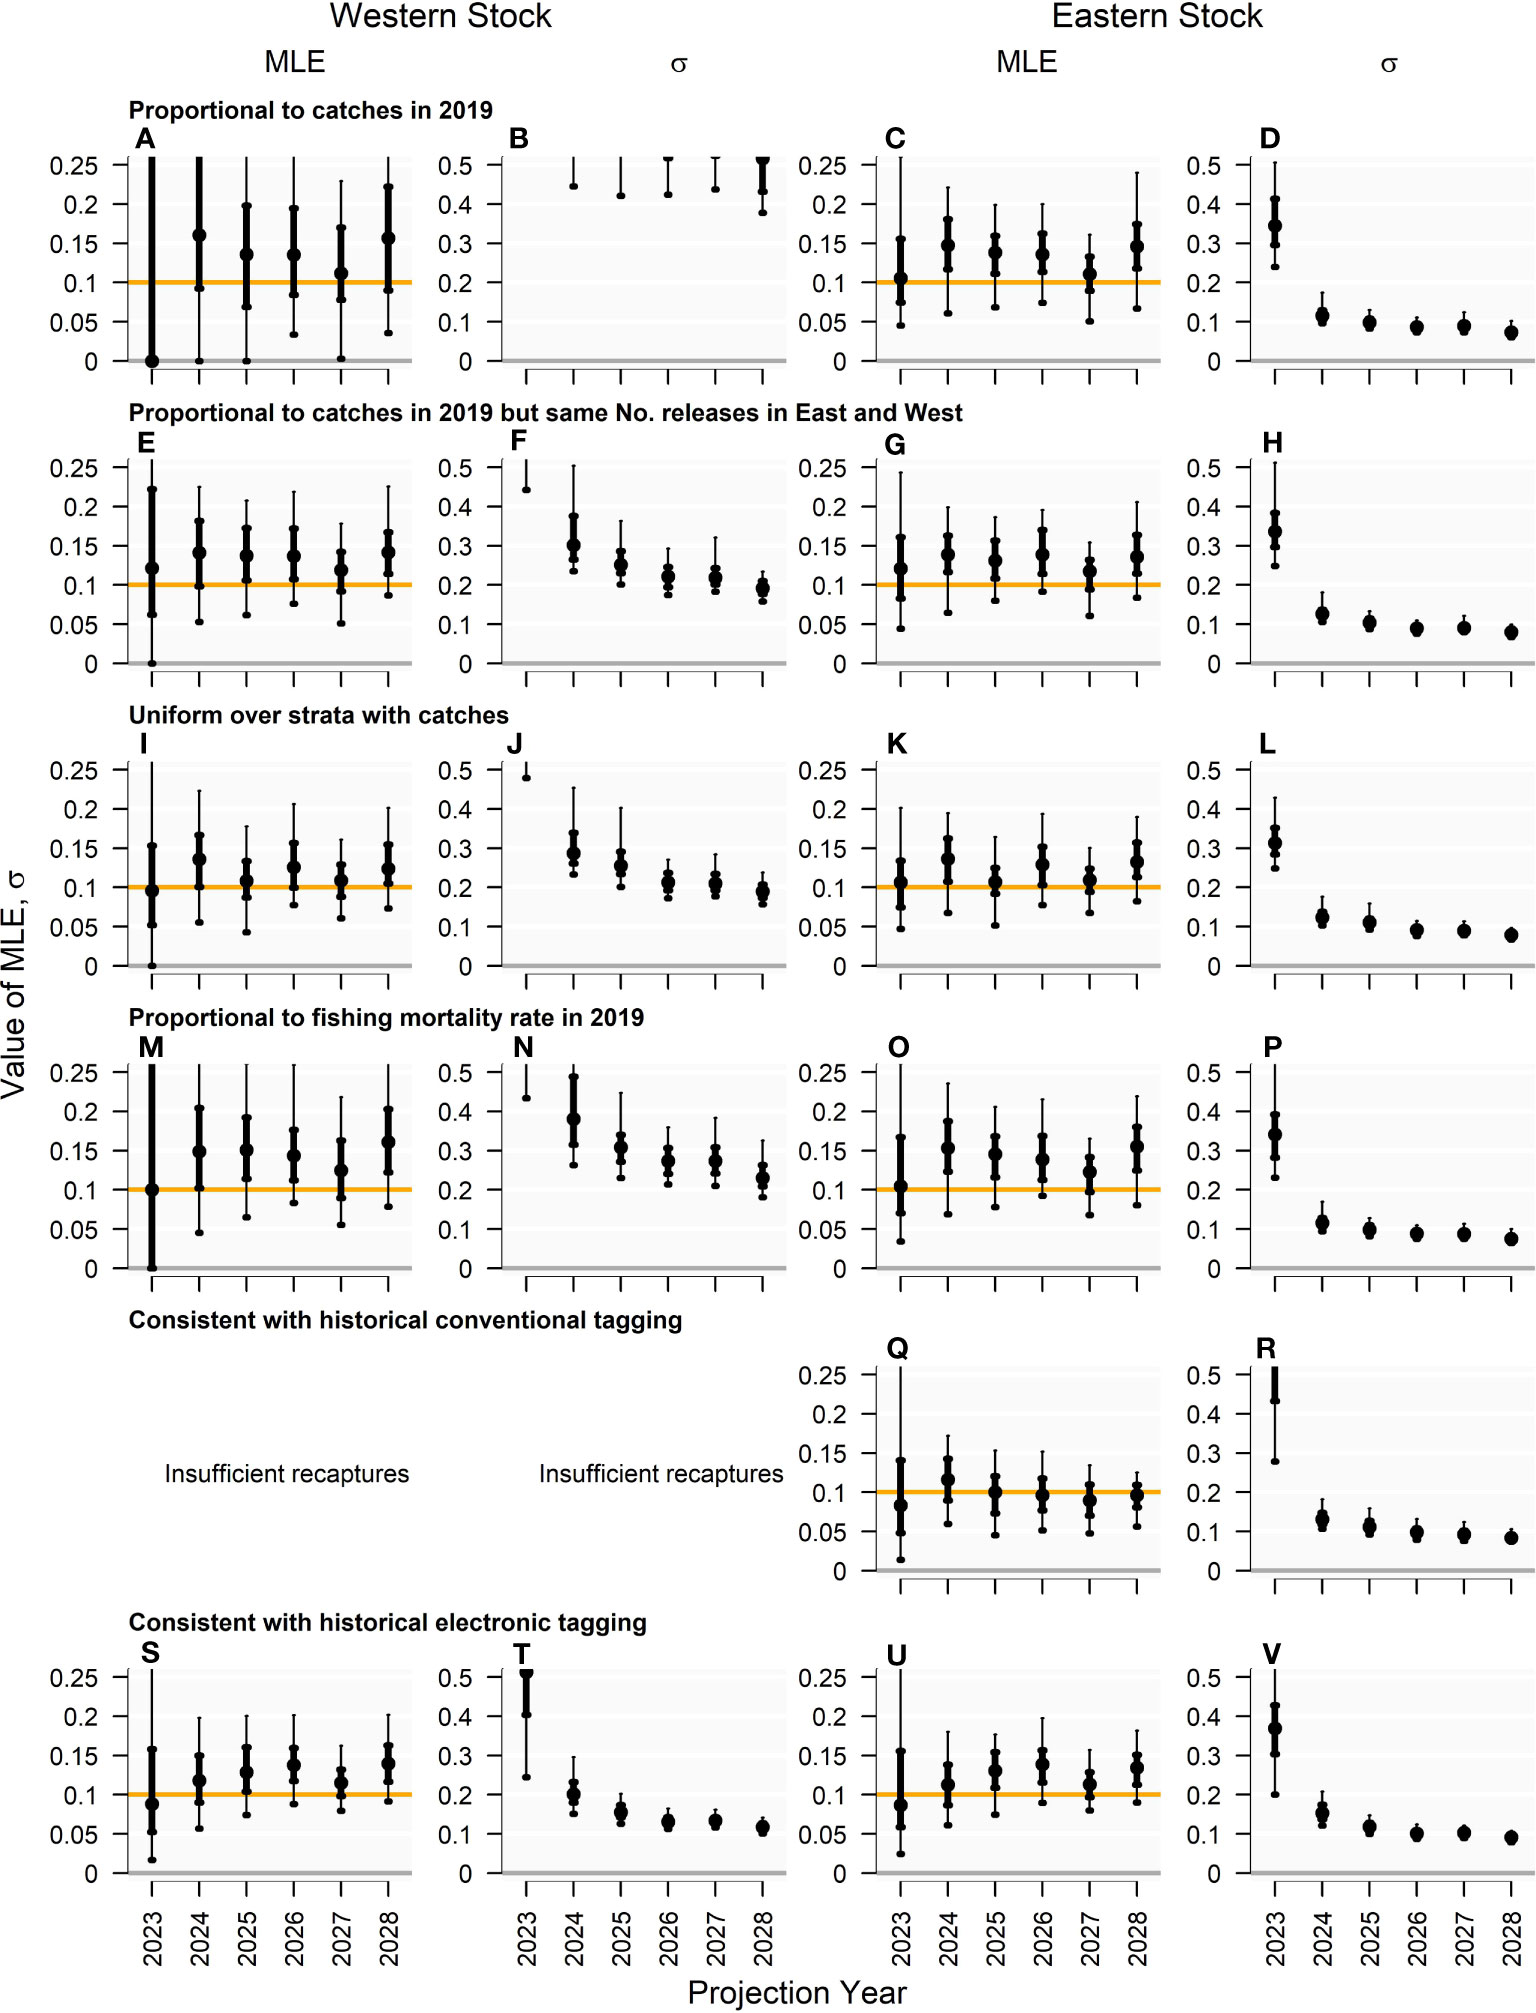
Figure 4 Annual exploitation rate (MLE) and coefficient of variation in exploitation rates (s) estimated by the multiyear Brownie model in 2028 for projection years 2024 - 2028 (150 simulations) for the ‘Low abundance’ operating model. Genetic tagging data were simulated from the individual tagging model subject to six tagging designs where the spatio-temporal pattern of tag releases was: (A–D) proportional to catches in 2019; (E–H) proportional to catches in 2019 but with the same number of releases in the West and East management areas; (I–L) distributed uniformly over all strata with recorded catches; (M–P) proportional to fishing mortality rate (a proxy for fishing effort) in 2019; (Q–R) consistent with historical conventional tag releases; (S–V) consistent with historical electronic tag releases. These simulations assumed a “true” 10% exploitation rate (orange horizontal line) and 500 effective releases per year. The points plotted represent the median values, while thick and thin bars represent the interquantile and 90% interquartile ranges, respectively.
Both of the ‘proportional to catch’ release designs led to positively biased estimates of exploitation rates, generally overestimated by between 15-50% for both western and eastern stocks. This suggests an unrepresentative marking rate due to incomplete mixing of tags throughout the vulnerable population. This heterogeneity in mark rate, with higher releases in areas of exploitation, is to be expected, since release and recapture of tags occurs for fish in specific locations and on size classes that are more susceptible to exploitation. When tags were released uniformly across areas, fleets and seasons where catches were observed, estimates of the exploitation rate were much less biased and unbiased in some recapture years (Figures 4I-L).
Releasing tags in proportion to exploitation rate (as a proxy for fishing effort) provided comparable estimation performance to when tags were released in proportion to catch, but with greater balance in the number released between the East and West; however, estimates were positively biased but less precise (Figures 4M-P).
Tag releases that were distributed according to historical conventional tag releases led to insufficient recaptures to estimate exploitation rate for the western stock using the Brownie model. However, the estimates of eastern exploitation rate were the least biased of all release distribution scenarios.
Tag releases distributed proportionally according to historical electronic tag releases produced the most precise estimates of the western stock exploitation rate, with the CV (among simulations) of the estimates around 0.1 to 0.13 over years 2026 - 2028 (Figure 4T) compared with 0.2 to 0.19 for the uniform release distribution over strata with positive catches (Figure 4J). Tag release distribution had relatively little impact on the precision of exploitation rate estimates for the eastern stock. This distribution of tag releases produced estimates of exploitation rates for both stocks that were positively biased between 10% and 30% for years 2026-2028, demonstrating that mark rates experienced by fishing are a commensurate fraction higher than the vulnerable stock in general. This release distribution was used in all analyses hereafter, because precision in estimates (reported CV of the estimator) is a greater determinant of harvest strategy performance than a consistent bias in estimates is.
In general, the effective number of tag releases did not strongly impact the accuracy of exploitation rate estimates using the Brownie model (i.e., Figure 5 where the solid-colored points in the ‘MLE’ panels were comparable in level among the colors that represent release numbers). Given releases proportional to the distribution of electronic tagging, exploitation rate estimates were generally positively biased to approximately the same degree independent of the simulated fishery exploitation rate (approximately 15-40% in years 2024 - 2028, Figure 5). For all combinations of exploitation rate and release numbers, precision in estimates of exploitation rate declined to an asymptote by recapture year 6 (2028) (e.g., Figure 5F) with release number having a stronger impact on precision than simulated exploitation rate.
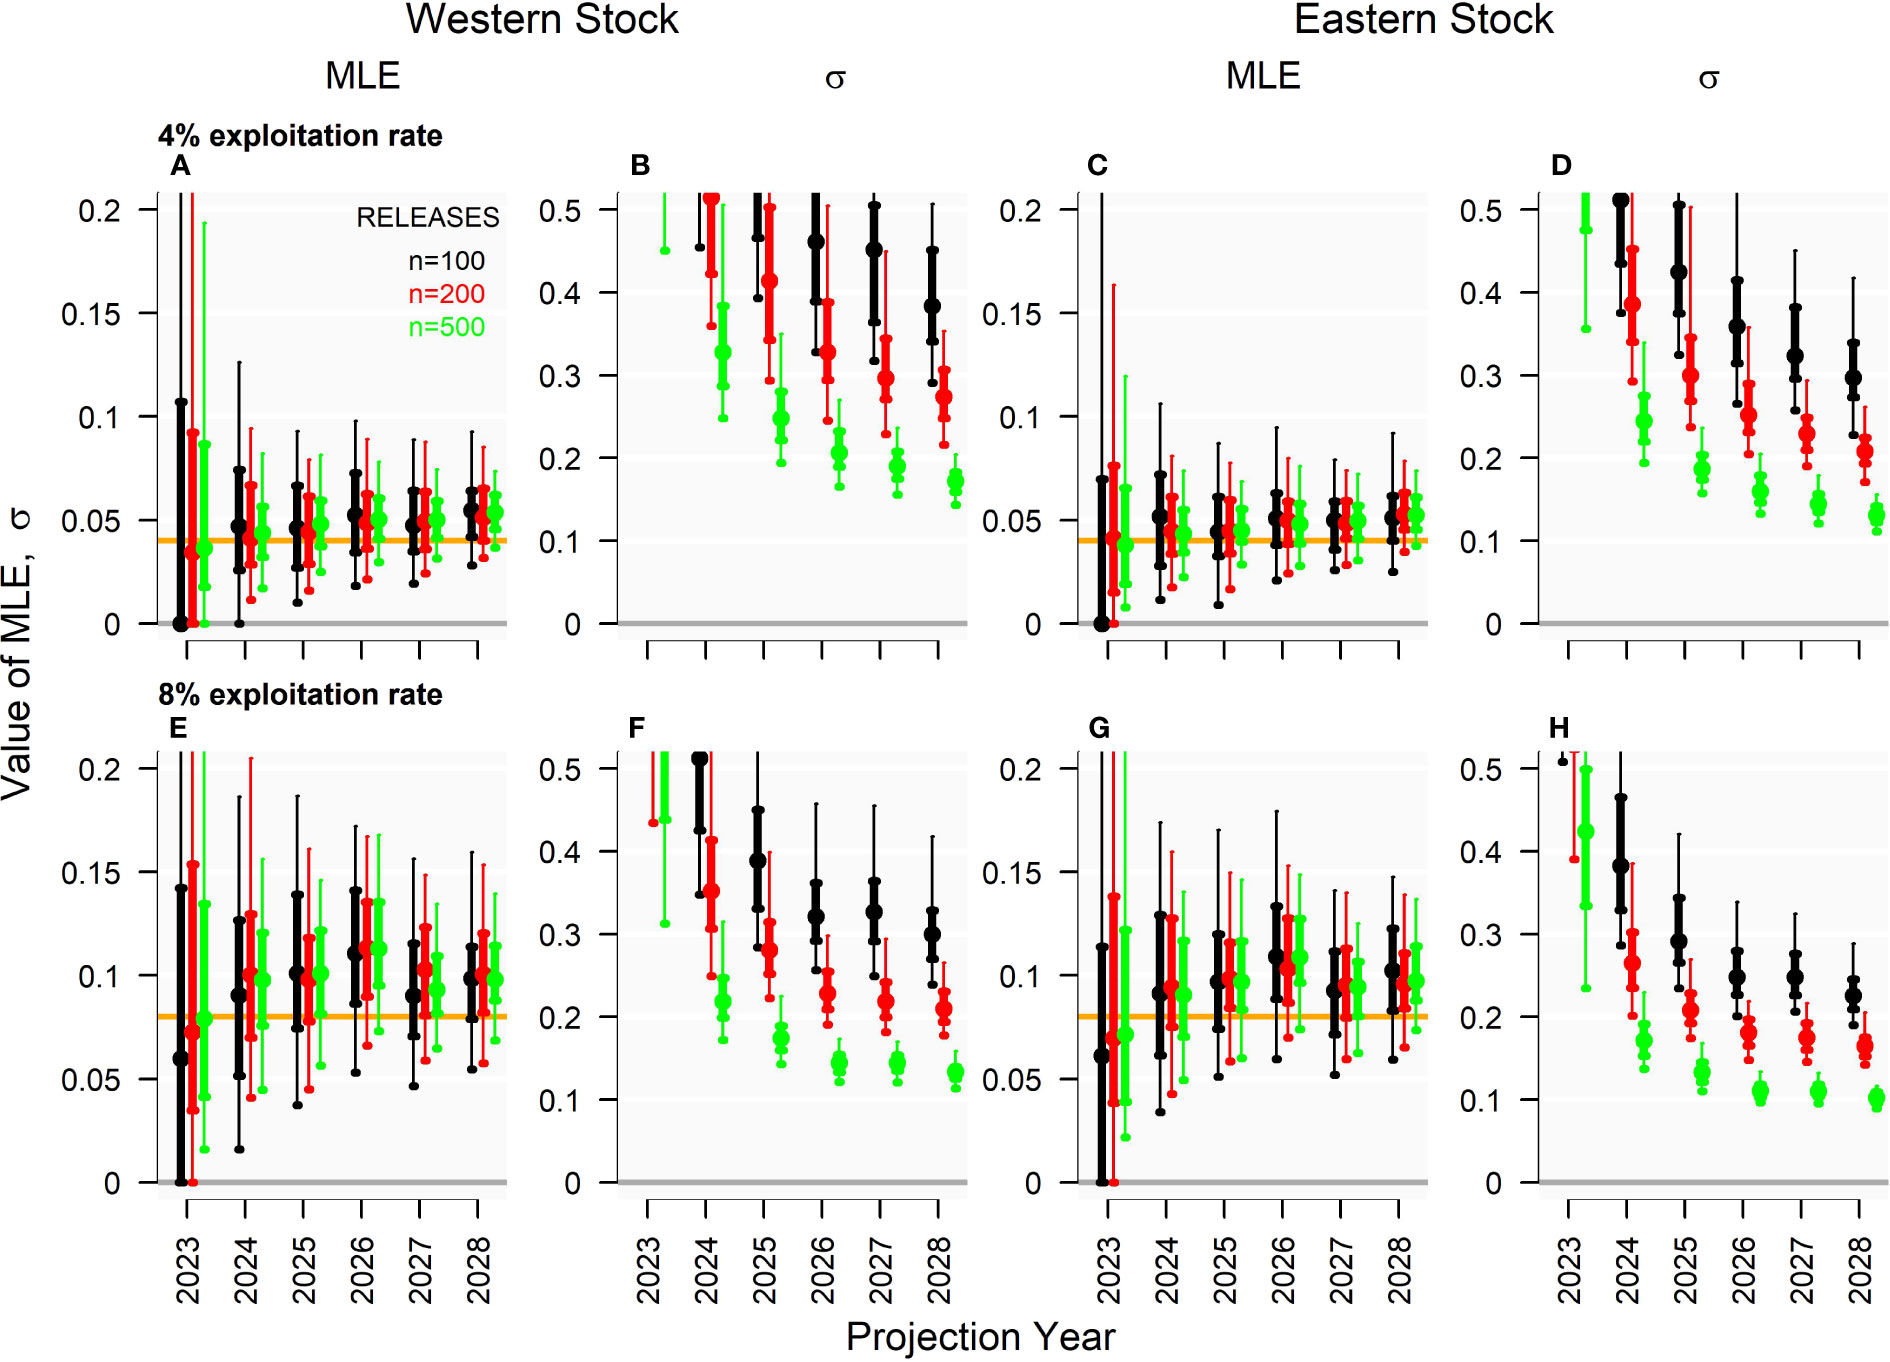
Figure 5 Annual exploitation rate (MLE) and coefficient of variation in exploitation rates (σ) estimated by the multiyear Brownie model in 2028 for projection years 2024 - 2028 (150 simulations) for the ‘Low abundance’ operating model. Genetic tagging data were simulated across varying levels of exploitation rate (row) and release number (color), given a tagging design ‘consistent with historical electronic tagging’ and the ‘Low abundance’ operating model. Panels (A–D) and (E–H) show exploitation rate estimates and their variance for exploitation rates of 4% and 8%, respectively.
The precision of the Brownie estimator, represented as the mean coefficient of variation , was well approximated by a linear model in which the inverse square-root of exploitation rate u, and effective release numbers ne, were explanatory factors (i.e., following the expected relationship between standard error and sample size):
The α, β, γ parameters were found by numerical optimization, minimizing the squared difference between estimated mean coefficient of variation from the Brownie model in 2028 and the linear model prediction of the same quantity (see Figure 6 for linear model fit for the western and eastern stocks).
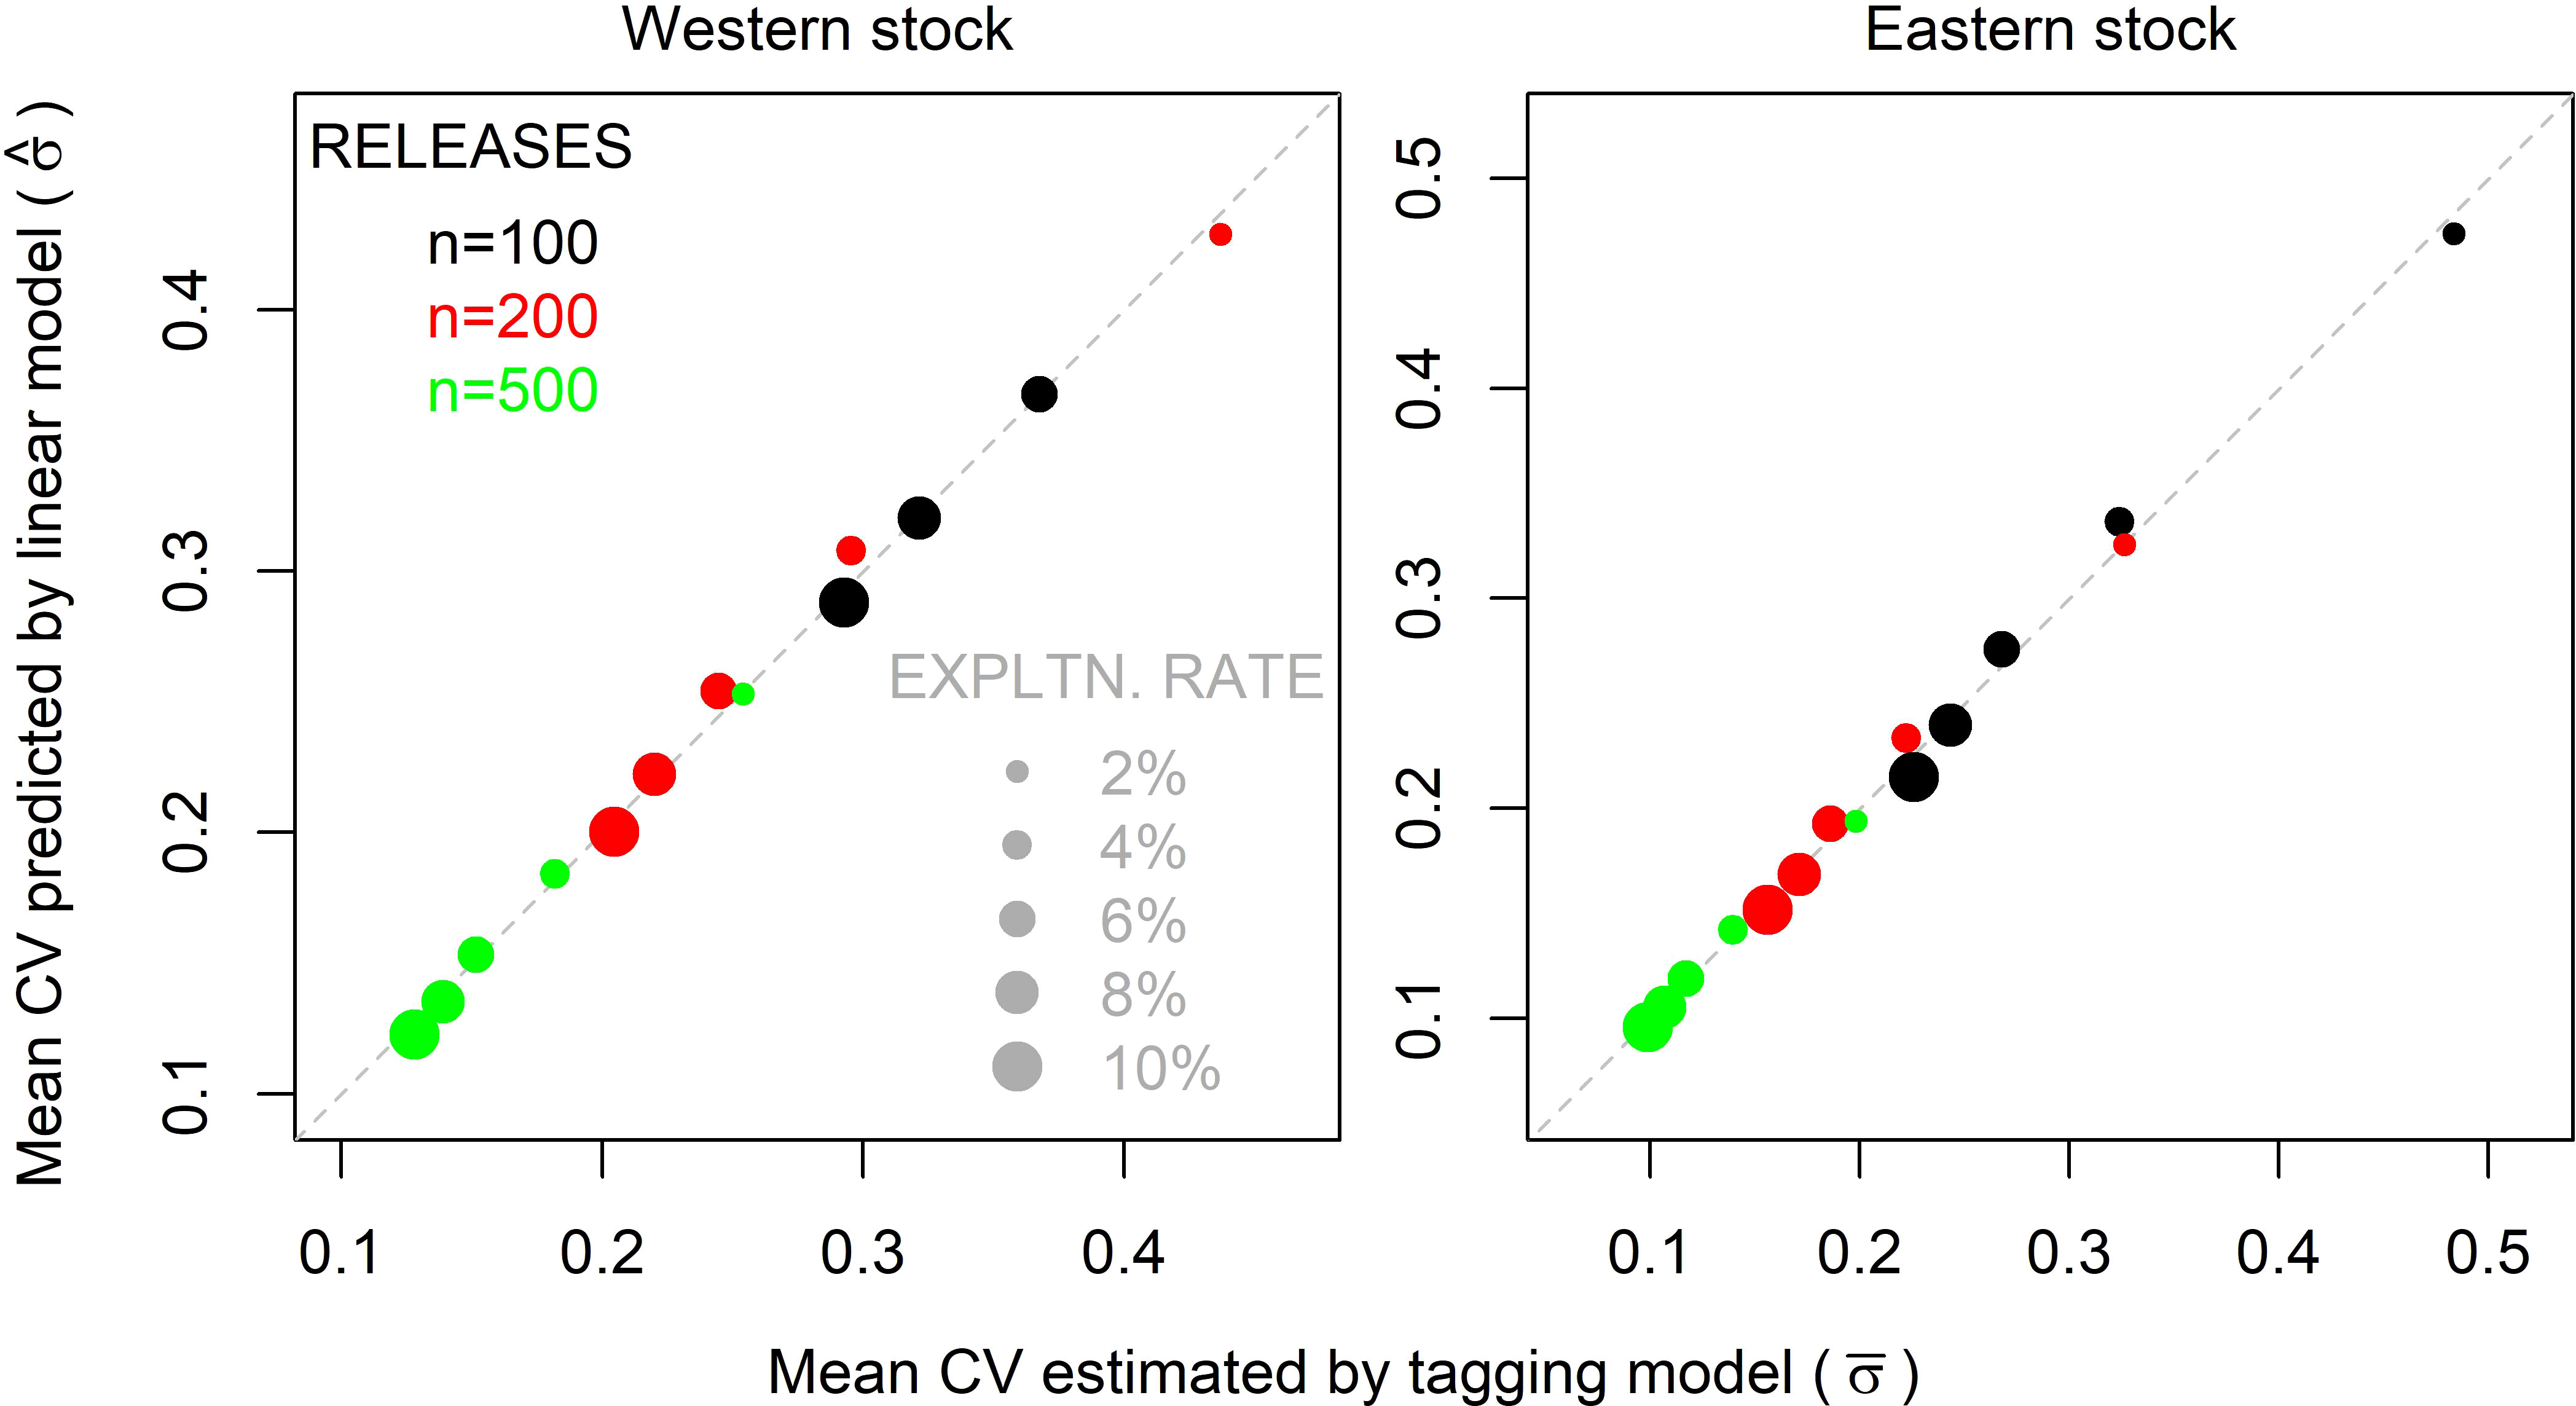
Figure 6 Mean coefficient of variation (CV) in exploitation rates estimated by the multiyear Brownie model in year 2028 ( ) versus those predicted by linear models ( ), for the western and eastern stocks. The size of points represents varying simulated exploitation rates (u), colors represent the number of effective releases (ne) (releases following the distribution of historical electronic tagging releases) (Eqn. 2).
Deriving these linear models allows for the production of tables of the required number of annual effective releases given a specified coefficient of variation in exploitation rate estimates (Table 2). Due to mixing of eastern fish in the West area, a much larger number of tag releases is required to obtain comparable precision of exploitation rate estimates of western fish (Table 2). As fishery exploitation rates increase, there is a reduction in the required intensity of the tagging program (effective tag releases). This negative relationship is approximately linear with respect to the log exploitation rate (Table 2).
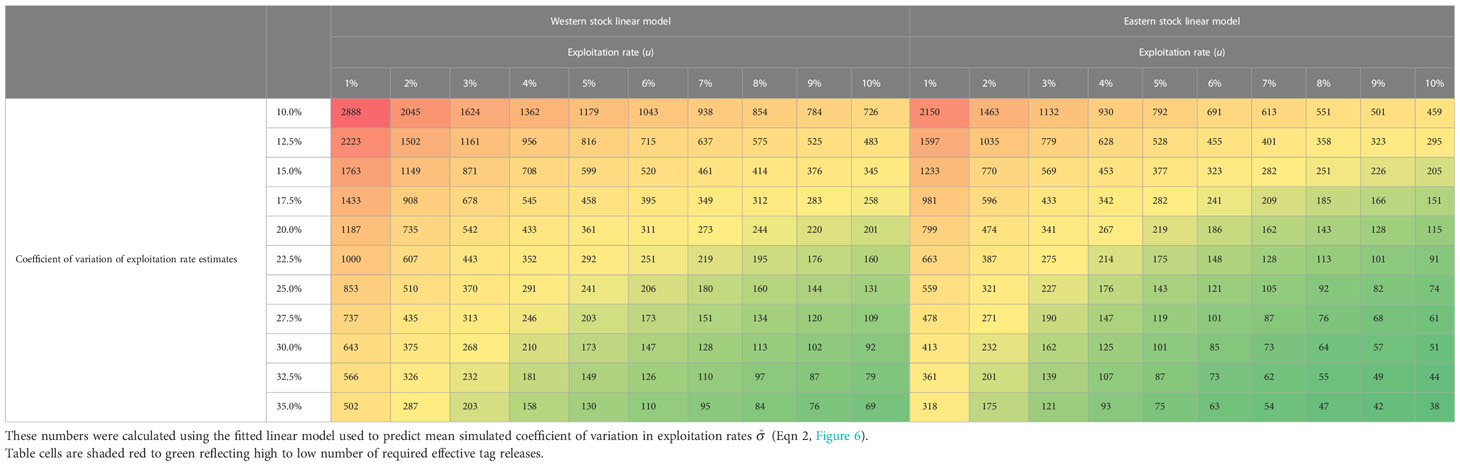
Table 2 Effective number of annual tag releases (ne, annual release number multiplied by genotyping rate of the catch) required to obtain specified coefficient of variation in exploitation rate estimates from the multiyear Brownie model (year 2028).
The coefficient of variation of the tagging estimator is non-linear with respect to the effective number of annual releases, (which is the product of annual release numbers and genotyping rate), while the cost of release and genotyping programs may be expected to be approximately linear with the number of sampled individuals. It follows that if the costs of genotyping and tag releases are available, for a specified exploitation rate, coefficient of variation in exploitation rate estimates, and number of annual catches, it is possible to solve numerically for the least expensive combination of tag release numbers and genotyping rate.
First, the effective number of releases ne, is solved for numerically by minimizing the squared difference between specified σ, and predicted coefficient of variation (calculated from the linear model and fitted parameters α, β, γ of Eqn 2):
Secondly, given the effective number tag releases ne, it is then possible to numerically solve for the genotyping rate G (and hence number of releases nr = ne/G) that corresponds with the lowest overall cost:
where Cr is the cost of releasing a tag and Cc is the cost of capturing a tag (genotyping). Since in these equations, G and nr are multiplicative with respect to ne but additive with respect to total cost (Eqn. 4), the cheapest overall combination of G and nr always occurs where total release and capture costs are equal (Suppl. Mat. Figure 2), regardless of nc, ne, Cr and Cc.
To demonstrate the sensitivity of ‘optimal’ tagging designs (release numbers and genotyping rate; the release distribution follows the pattern of historical electronic tags) to costs and the desired precision in the estimator, a set of default values were assumed for the: desired precision (σ = 0.2), fishery exploitation rate (u = 4%), number of annual fish caught and landed (nc = 250,000, following estimated catch numbers from the operating model in 2019), labor, processing and opportunity cost of releasing a tag (Cr = $1,000 per tag, given at-dock price of $12,000 per tonne, Pew, 2020, and assuming that tagging occurs on commercial vessels or that the tagged and released fish must be purchased), and cost of genotyping a caught fish (Cc = $15, a preliminary estimate from Preece et al. (2015) which is specific to the analysis for SBT gene-tagging and may not be applicable here, but is likely to be of the same order of magnitude) (Table 3). Each of these parameters were then systematically varied across a range of values (Table 3).
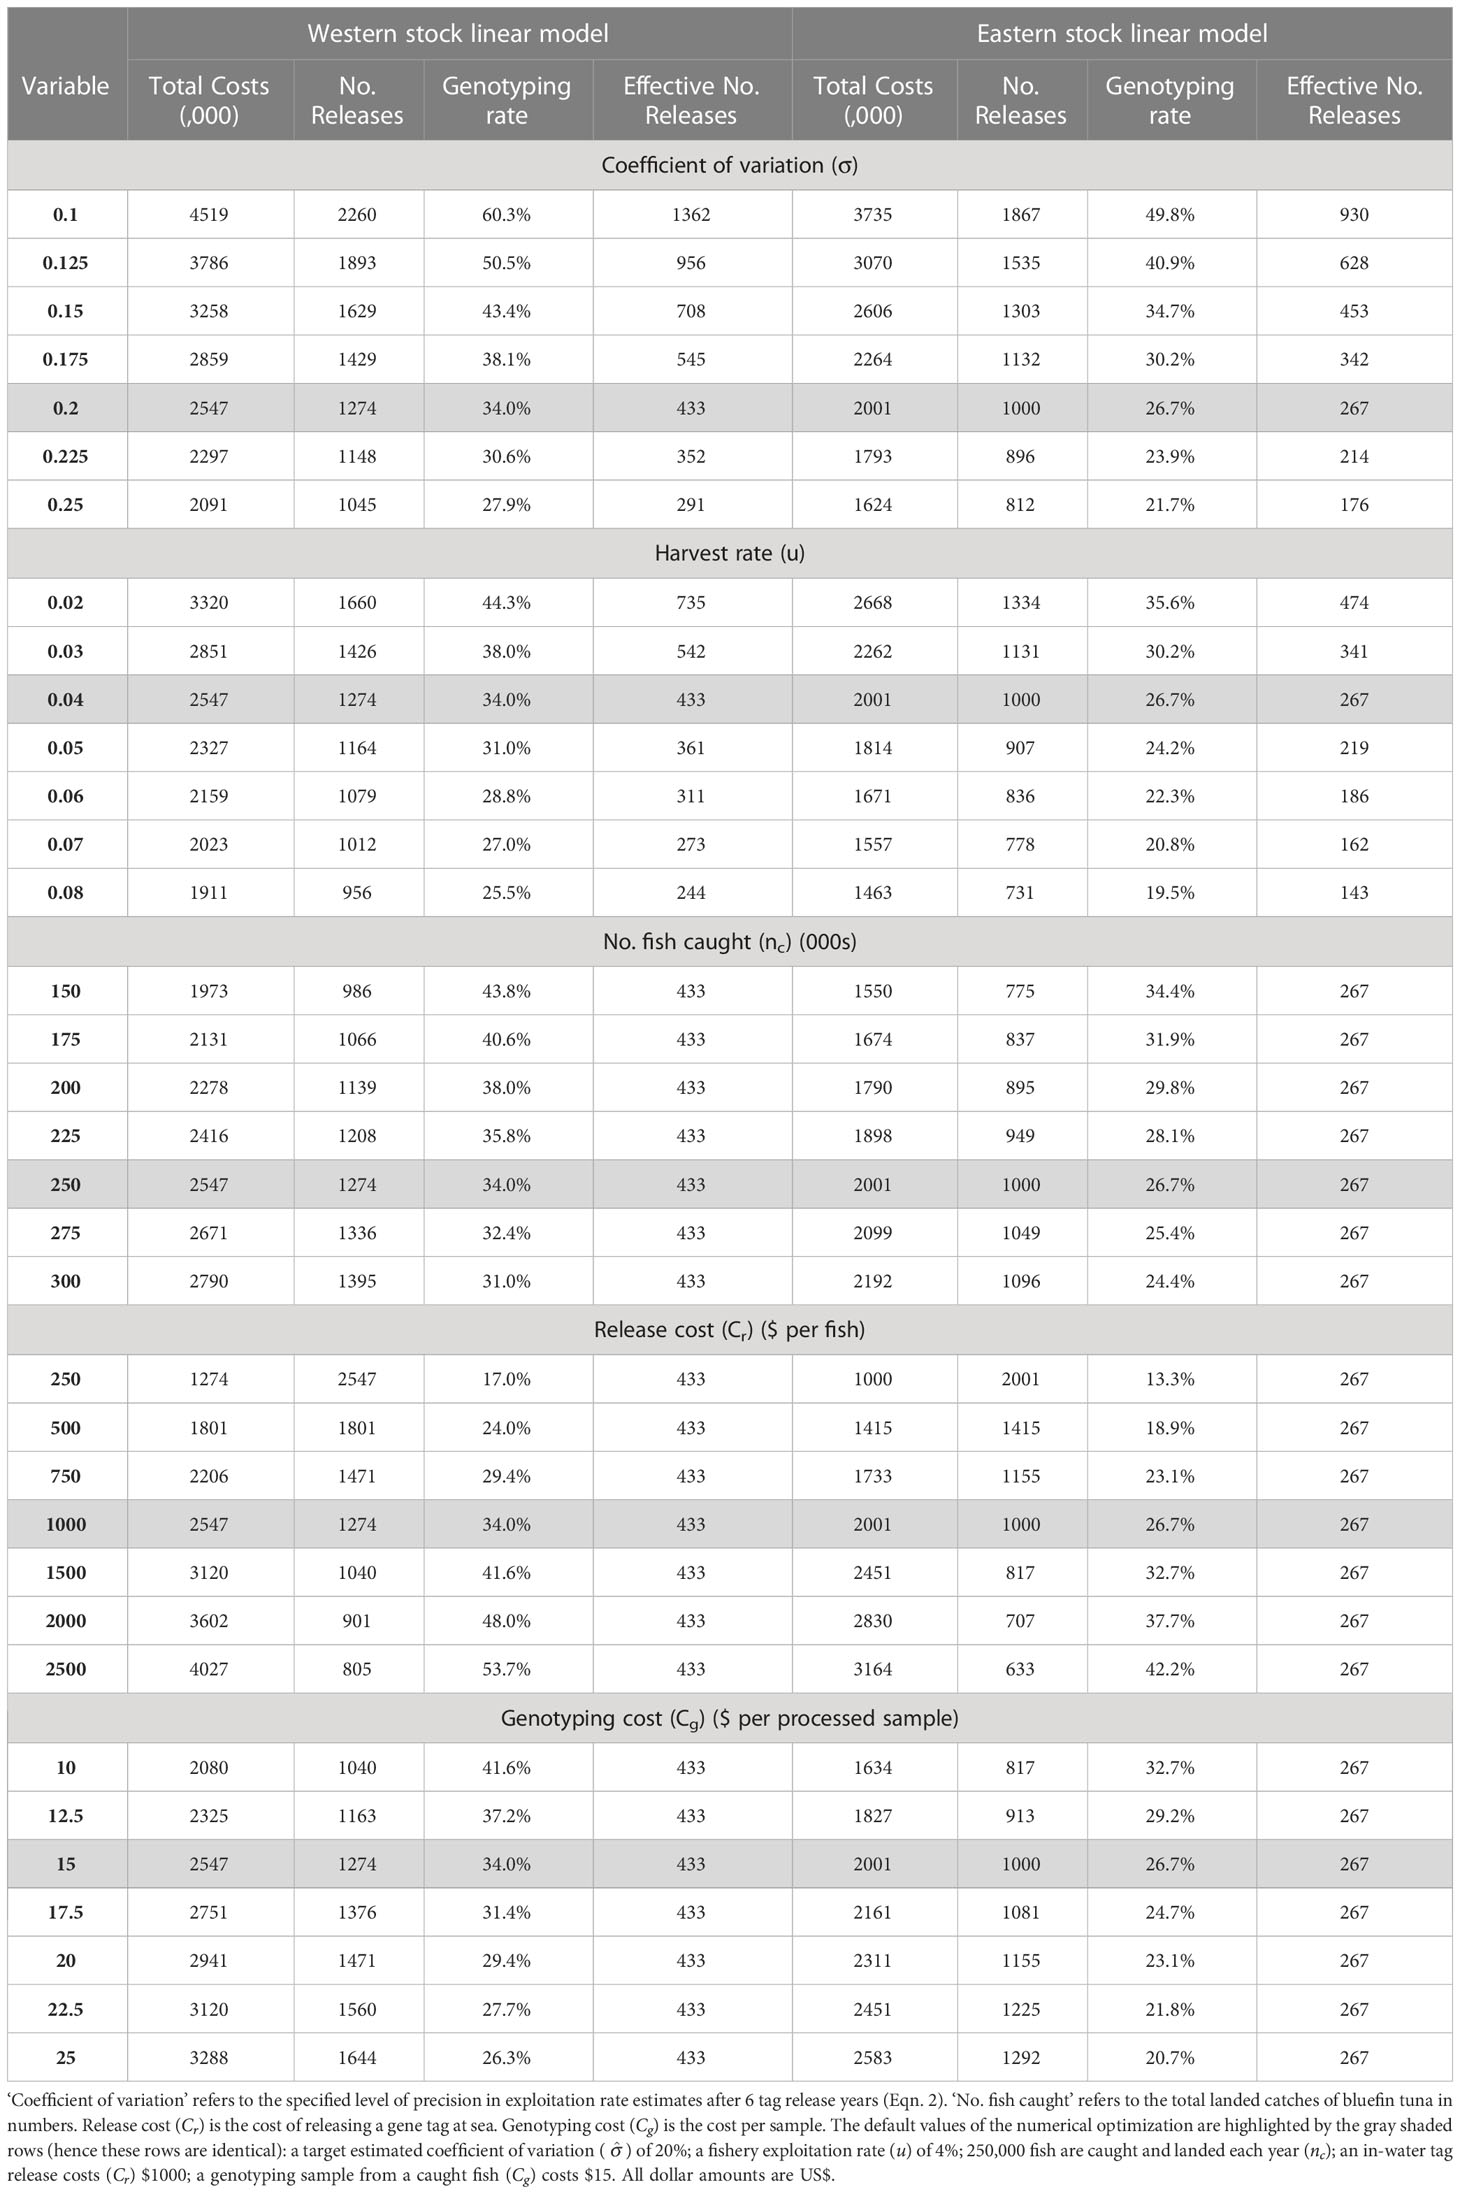
Table 3 Calculations of the least expensive combination of release number (No. Releases, nr) and genotype rate at recapture (G), calculated from the linear model approximations of precision for the eastern and western stocks (Eqns. 2, 3, Figure 6).
‘Optimal’ genotyping rates were generally between 25 and 45% of caught fish. At the default settings for the model parameters (shaded rows of Table 3), the cost of the program was estimated at approximately US$2.5m/year if focused on the precision of the western exploitation rate and $2m/year if focused on precision in eastern exploitation rate estimates. These corresponded with genotyping rates of 34% and 27%, respectively. Halving the specified coefficient of variation in estimates of exploitation rate from 0.2 to 0.1 required almost doubling the cost of the tagging program (e.g., for the western linear model an increase from $2.5m to $4.5m, Table 3). As fishery exploitation rates increase, fewer effective tag releases are required to obtain the same precision in exploitation rate estimates. The reduction in overall tagging cost is approximately linear with respect to the log exploitation rate. As a greater number of fish are caught (higher abundance), tagging costs increase in order to obtain the same precision in exploitation rate estimates (a doubling in the number of fish caught from 150 to 300 thousand, leads to 40% higher costs of tagging (e.g., from $1.55M to $2.19M for the eastern linear model). Reducing the cost of releases to one quarter ($250) halved the required genotyping rate (to 17% and 13% for the western and eastern linear models, respectively). Reducing genotyping costs by one third reduced overall tagging costs by one fifth (e.g., genotyping costs reduction from $15 to $10 reduced overall tagging costs from $2.55M to $2.08M for the western linear model).
In general, the degree of stock mixing and the relative magnitude of the two stocks did not impact the precision of the tagging estimator (phrased here as the coefficient of variation σ) substantially, but could impact the degree of positive bias (Figure 7). The ‘High abundance’ operating model, for which the magnitude of both stocks was larger, led to Brownie model estimates of exploitation rate that were around 15% more positively biased for both stocks than the ‘Low abundance’ operating model for the western stock in 2028 (Figure 7). The estimation performance of the tagging model was more comparable among the ‘High eastern’ and the ‘Low abundance’ operating models.
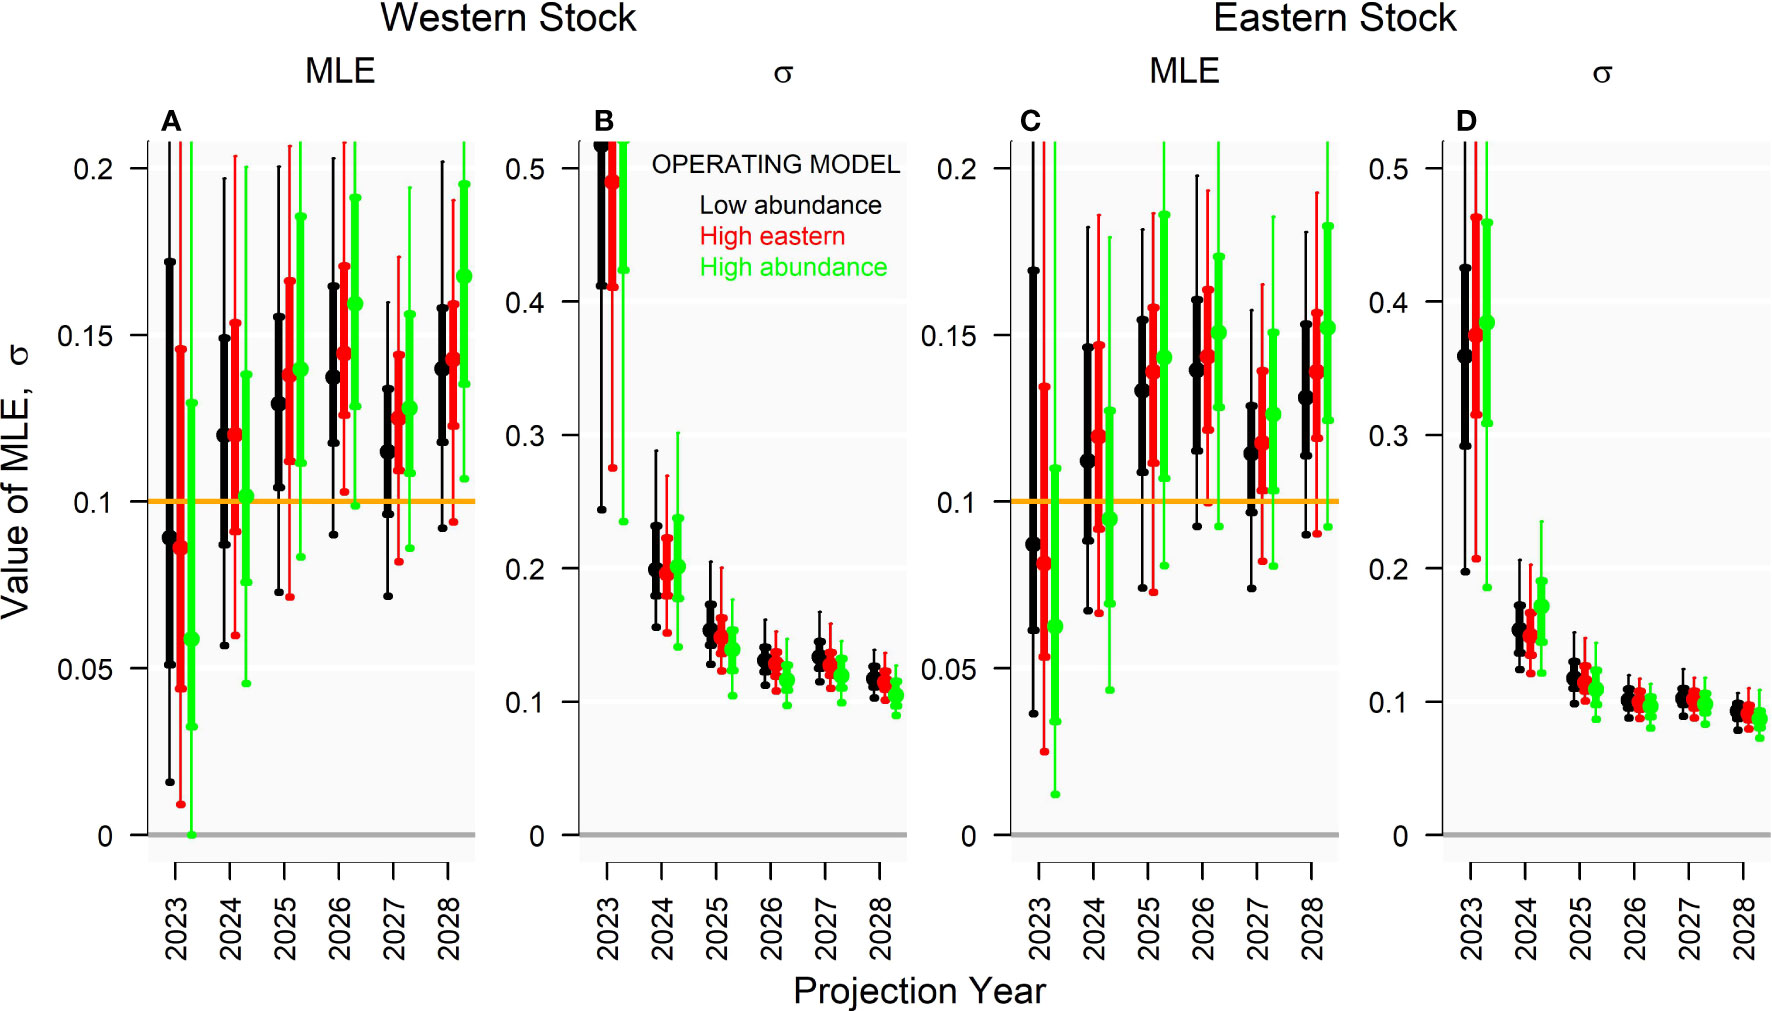
Figure 7 (A, C) Annual exploitation rate (MLE) and (B, D) coefficient of variation in exploitation rates (σ) estimated by the multiyear Brownie model in 2028 for projection years 2024 - 2028 (150 simulations). Genetic tagging data were simulated from three operating models with varying population and fishery dynamics, given a 10% exploitation rate (u), 500 effective annual releases of tags (ne), and releases distributed according to historical electronic tagging releases.
The conditions of the reference case ‘Low abundance’ operating model simulates relatively high recruitment and large vulnerable biomass, particularly for the eastern stock. Because of this large vulnerable biomass, TAC adjustments of the ‘Perfect Information’ harvest strategy were generally increasing for the first 5-10 years, after which they declined and stabilized (Figure 8).
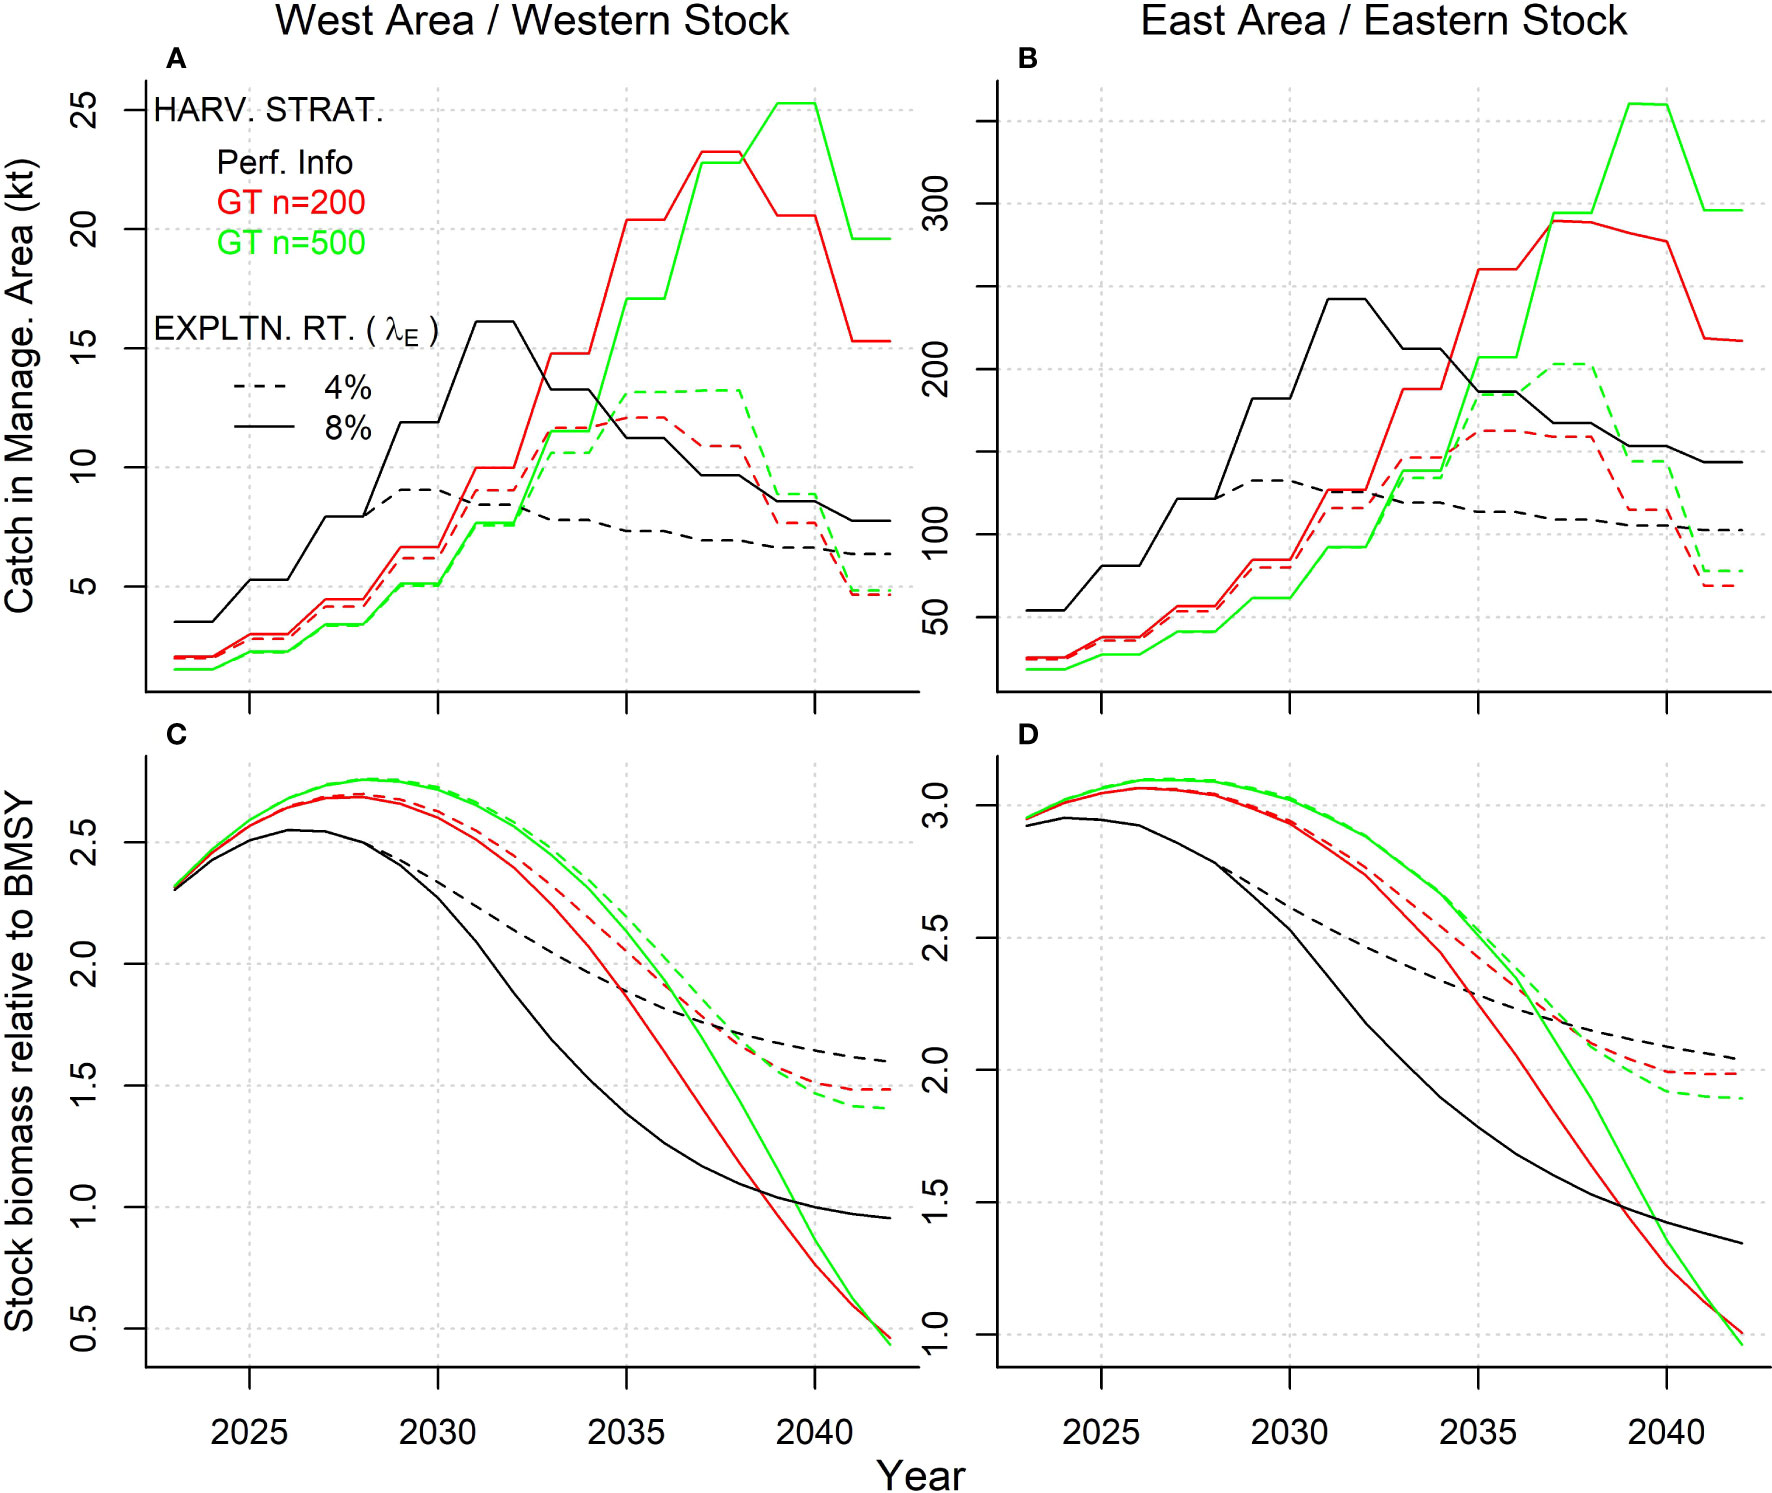
Figure 8 (A, B) Mean projected annual catches and (C, D) spawning stock biomass relative to BMSY for the gene tagging and perfect information harvest strategies at target exploitation rates (λE) of 4% and 8% (dashed and solid lines respectively) (150 simulations) for the Reference Case ‘Low abundance’ operating model and releases distributed according to historical electronic tagging releases. Red and green lines represent effective release numbers (ne) of 200 and 500 fish, respectively.
Projected yields for gene tagging harvest strategies tended to lag the perfect information harvest strategy by around 5 years, with catches increasing more slowly in response to larger available vulnerable biomass, and then also declining later as vulnerable biomass declines (Figure 8). The mean catch and biomass of the higher release numbers (GT n = 500) tended to incur a greater lag from the perfect information harvest strategy compared with the low release numbers (GT n = 200) (Figure 8) but with substantially less variability (Figure 9). This suggests that, when tested in closed-loop simulation, given the pattern of releases and recaptures, harvest strategy performance can become less responsive as release numbers increase. At higher target exploitation rates (i.e., above 6%), there was a much wider discrepancy in projections among gene tagging and perfect information harvest strategies. Catches of the gene tagging harvest strategies (GT n=200 and GT n=500, Figures 8A, B) tended to increase more slowly, but to much higher levels, than the perfect information strategy, leading to biomass trajectories that were in steep decline at the end of the 20-year projection period and with the western stock at approximately 0.5BMSY (Figures 8C, D).
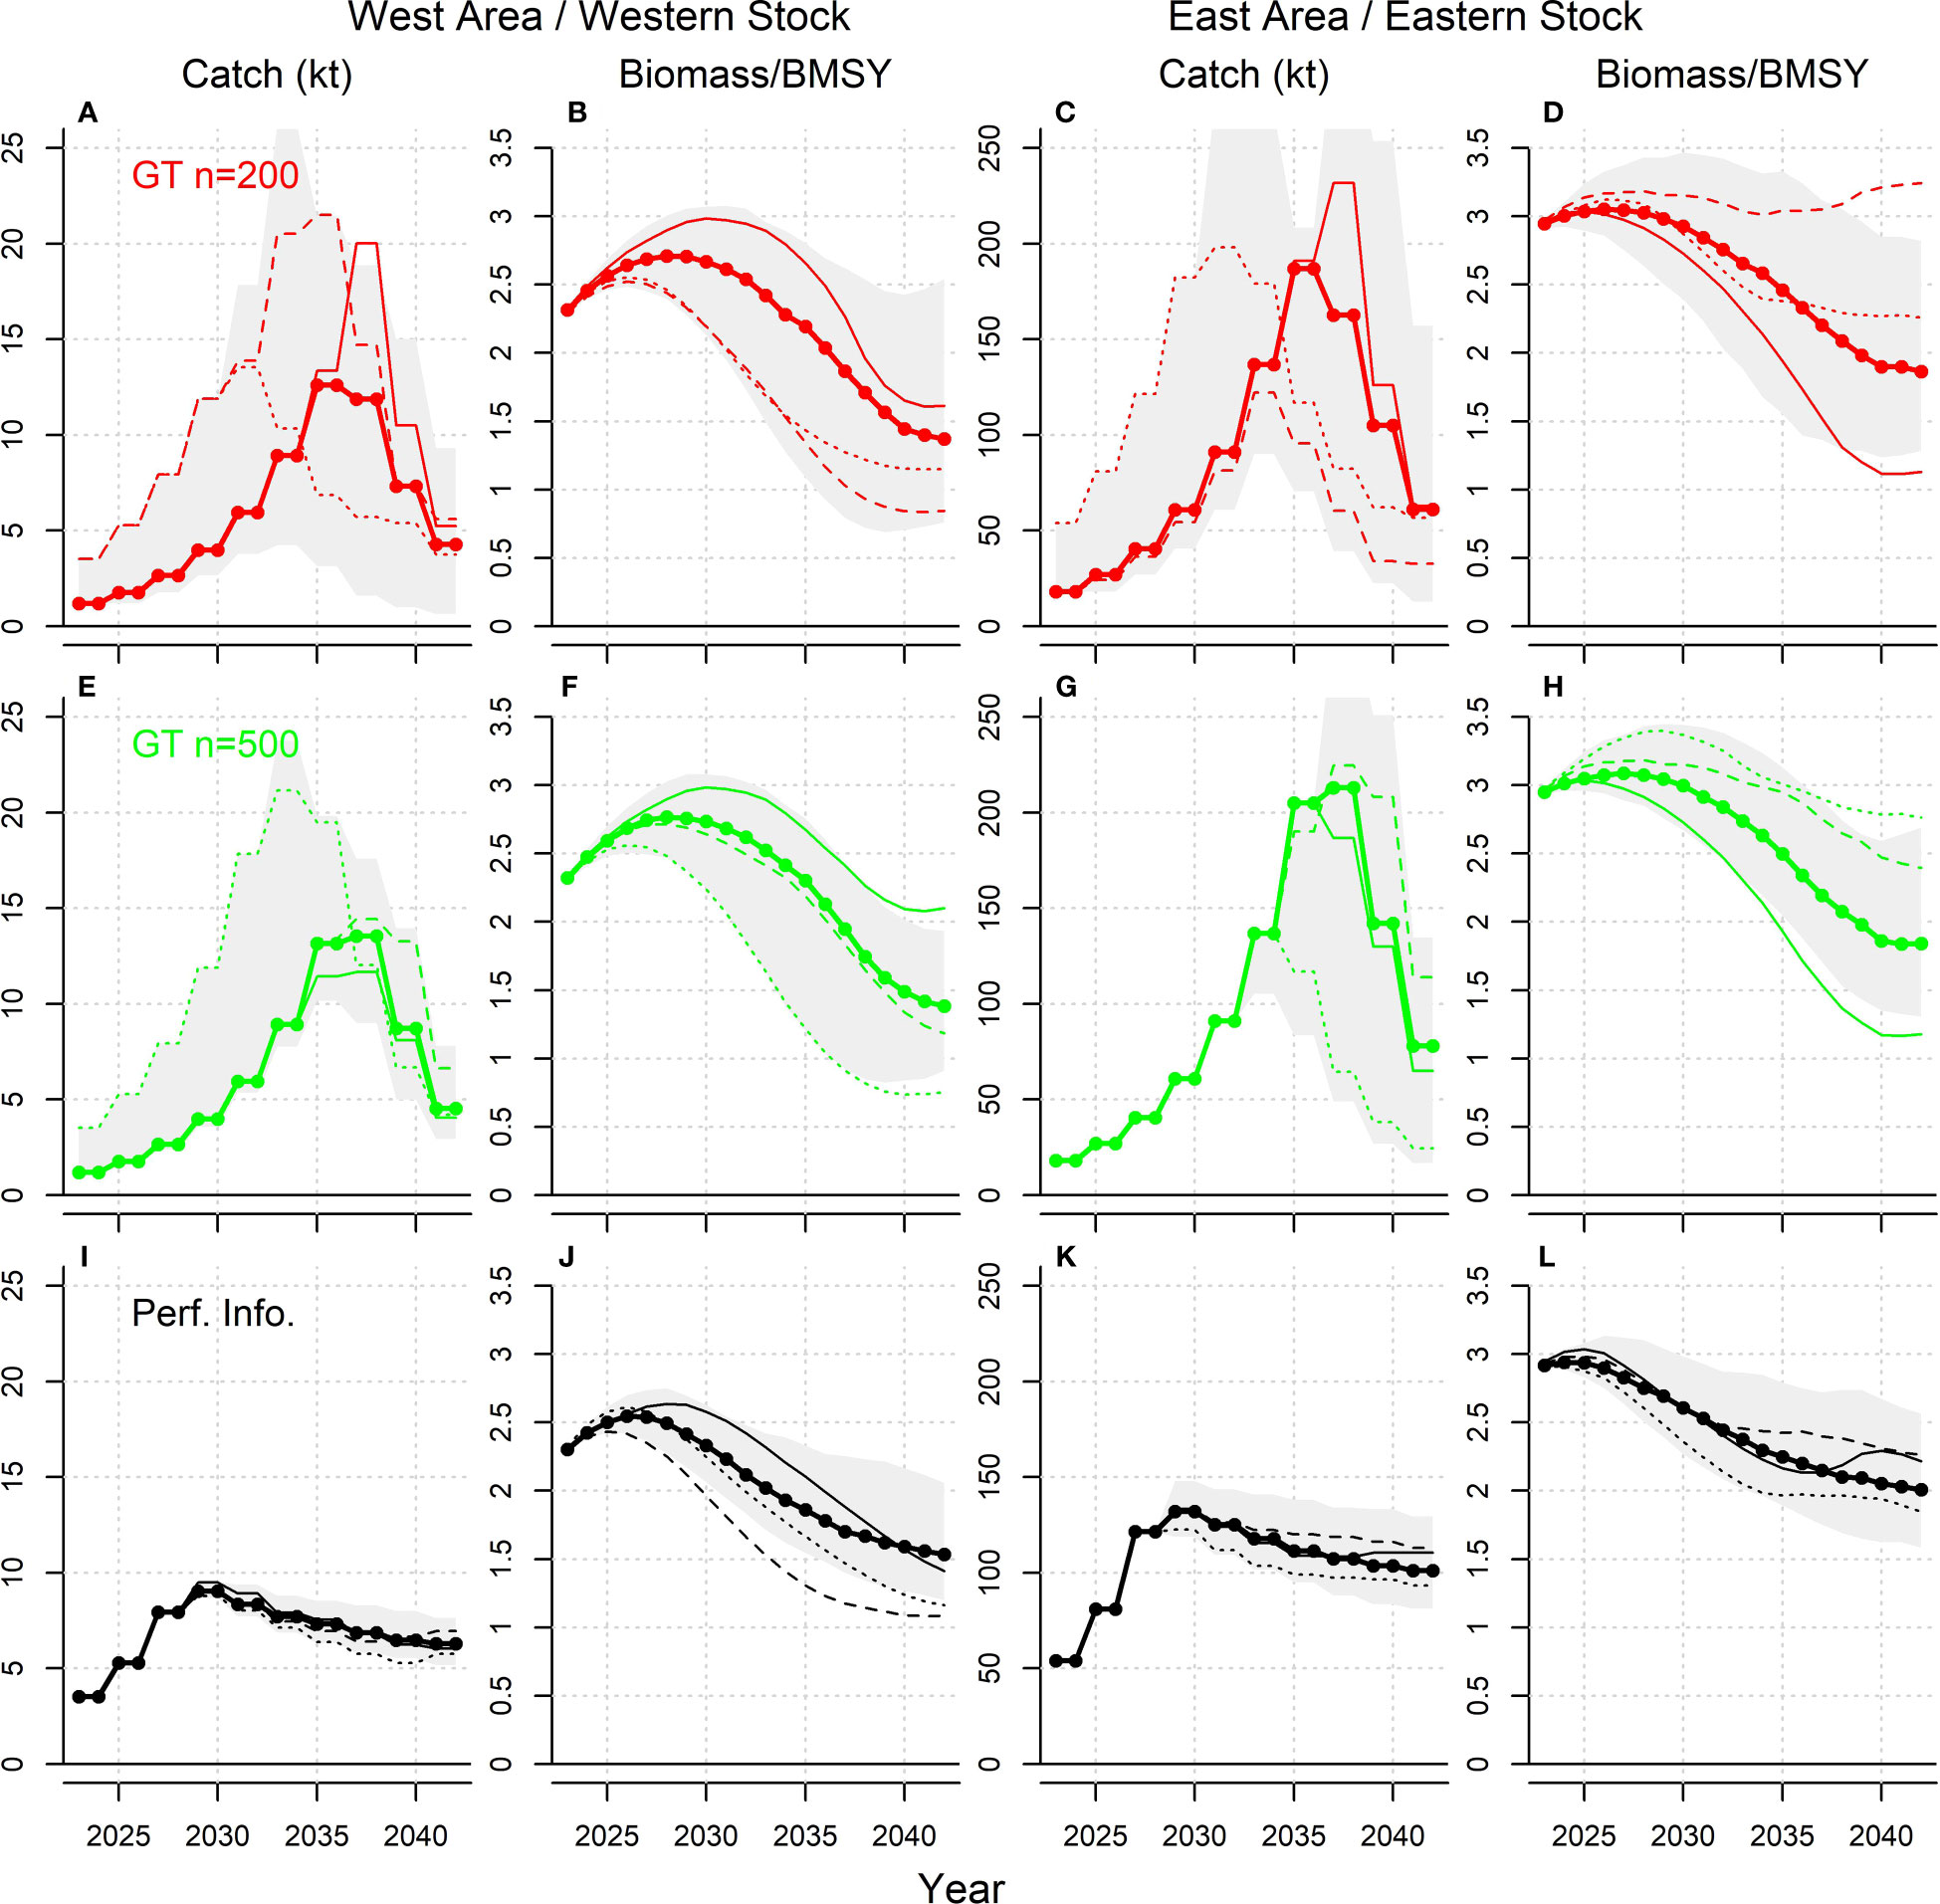
Figure 9 Projections of catch and biomass relative to BMSY for the Reference Case ‘Low abundance’ operating model and releases distributed according to historical electronic tagging releases, for harvest strategies with a target exploitation rate of 4%. The thick line with points represents the median value, the gray shaded area represents the 90% interquantile range (150 simulations), and the three thin lines are three individual simulations. Panels (A–L) show the catch and biomass projections of simulations that have 200 effective tag releases, 500 effective tag releases and perfect information of exploitation rates, respectively.
While there are some differences in scale and magnitude, for all harvest strategies the projected trends in catches and biomass were similar for the East area/eastern stock and the West area/western stock (Figure 8). In general, the pattern in catches and biomass outcomes was very similar among the gene tagging harvest strategies, independent of the number of effective annual tag releases (Figure 8). However, there was greater variability in both annual yield and biomass outcomes, given the lower level of 200 effective tag releases (Figure 9).
In fisheries MSE in general, the most prevalent management performance trade-off among harvest strategies is between resource conservation and yield. We demonstrate the same trade-off in Figure 10. Overall yield performance of the harvest strategies was defined here as the mean annual catch in the first 20 projection years (2023 - 2042). Biomass performance was defined as stock biomass relative to BMSY in the final projection year (2042). The expected (mean) yield and biomass performance of the gene tagging harvest strategies was similar, irrespective of the number of annual effective tag releases (Figure 10). Surprisingly, there was little gain in yield with management using the perfect-information fixed exploitation rate strategy (‘Perf. Inf.’). In the West and East management areas, the expected gain in yield when moving to ‘Perf. Inf.’ was less than 10% and 20%, respectively (Figure 10, right panel).
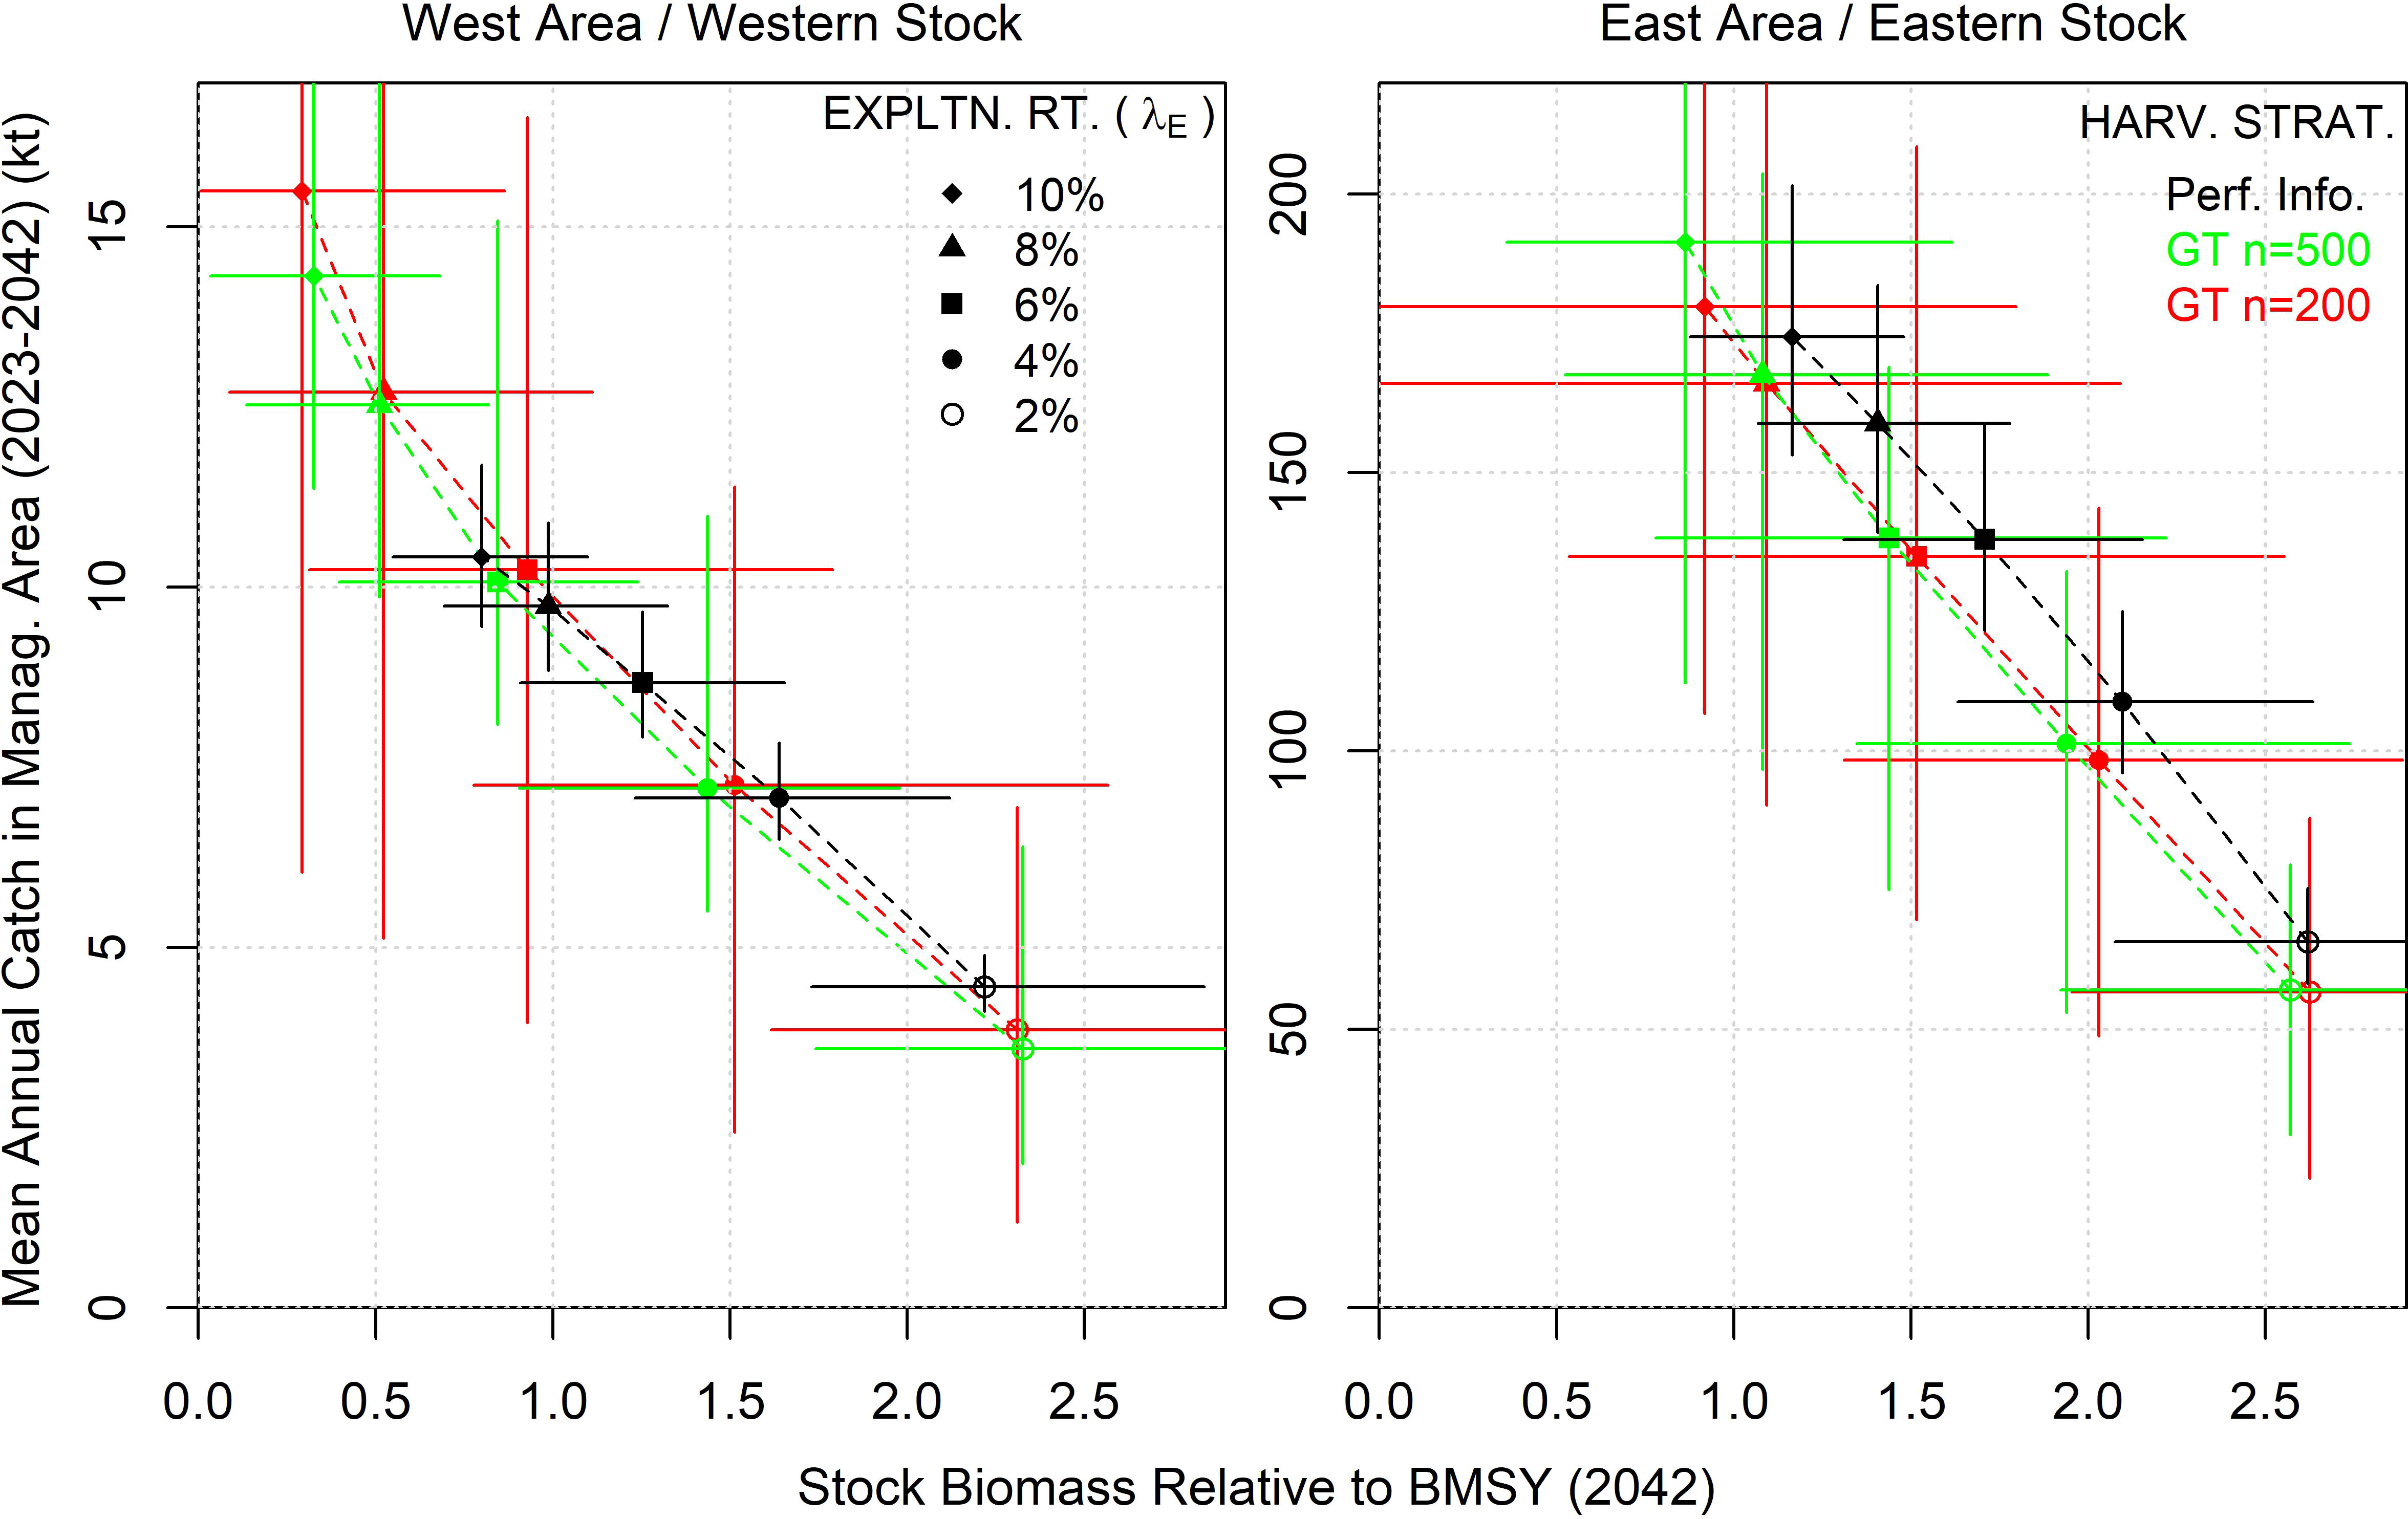
Figure 10 Biomass and yield performance of harvest strategies aiming to fish at constant exploitation rates from 2% to 10% (λE). Results are presented for the ‘Low abundance’ operating model with releases distributed according to historical electronic tags. Harvest strategies are paired and applied in both management areas simultaneously (e.g., the 2% management strategy in the West area was run in tandem with the 2% harvest strategy in the East area). A ‘perfect information’ harvest strategy calculated the TAC from the specified exploitation rate given perfect knowledge of current vulnerable biomass in each management area. Harvest strategies using the gene tagging estimator (GT) were also evaluated given two numbers for effective annual tag releases (n=200 and n=500 per year). Biological management performance is presented as stock biomass at the end of the 20-year projection period (2042) and yield management performance as the average annual catch over that 20-year projection period (2023-2042). Points represent the median value and bars the 90% interquantile range (150 simulations).
Much larger differences could be seen in the lower tail of yield and biomass outcomes (i.e., the 5th percentile, Figure 10). In both management areas and stocks, gene tagging harvest strategies had much more uncertain yield and biomass outcomes than the reference ‘Perfect Information’ harvest strategy. Tag release numbers could impact lower tail outcomes for yield in the West area and biomass of the eastern stock strongly. In the West area, releasing 200 effective tags per year resulted in a 5th percentile of yields that was half that of simulations with 500 effective tags per year (Figure 10, left hand panel). In contrast, eastern stock biomass outcomes could drop to close to zero (stock extirpation) for the higher target exploitation rates in simulations with only 200 effective tag releases per year (Figure 10, right hand panel).
At the higher target exploitation rate levels, there were substantially worse biological outcomes for the western stock (with more steeply declining biomass trends, Figure 8). Gene tagging harvest strategies with target exploitation rates of 8% and 10% differed strongly from the Perfect Information harvest strategy, catching 50% more and depleting the western stock to below half of BMSY after 20 projection years (Figure 10). The lower exploitation rate scenarios indicate that the harvest strategies do reduce catches to reduce biomass declines.
Developing an individual tagging model embedded within the operating models of the Atlantic bluefin tuna MSE framework allowed the performance of a gene tagging estimator to be evaluated subject to complex stochastic seasonal and spatial multi-stock population dynamics. These include stock-, season- and age-specific movement and varying stock mixing depending on the relative abundance and age structure of the eastern and western stocks. In these simulations, tags were released and recaptured from fishing fleets for which spatio-temporal exploitation rate and size-selectivity were estimated from empirical data. It follows that the approach accounts for dynamical processes rigorously, where these can create non-independence in recapture probabilities. An example is higher mark rates in areas with high exploitation, and comparable movement of tags released on similar size fish in the same season and area. The spatial, stochastic nature of the simulations captures other important phenomena that could affect tagging estimators, such as increased tag mixing (homogeneity in mark rates) with tag time-at-liberty.
Using these simulations, it was possible to quantify the resulting bias and precision of a multiyear exploitation rate estimator given varying distributions of tag releases, fishery exploitation rates and effective release numbers. At an intermediate fishery exploitation rate of 6%, effective release numbers of 500 gene tags per year provided relatively precise estimates of exploitation rate (hence abundance assuming catch is reported accurately) with CVs of 15% and 11% for the western and eastern stocks, respectively. This intermediate exploitation rate is somewhat higher than the 4% and 5% exploitation rates for 2019 that were estimated by the Reference Case OM for the eastern and western stocks, respectively. The precision in estimates of exploitation rate increases with the magnitude of exploitation rate, which may be a desirable property, for example, providing higher quality information in situations of overexploitation. Although the alternative operating models spanned the widest range of eastern stock migration into the West area, this did not substantially affect the precision of exploitation rates estimates.
The precision of the tagging estimator compares favorably with recent stock assessments where there is additional uncertainty in estimates due to alternative plausible interpretations of data and model assumptions. For example, the base 2017 VPA stock assessment of eastern bluefin tuna estimated exploitation rate in 2015 with a CV of approximately 16% (80% confidence interval of [0.065, 0.096], ICCAT, 2017). Running this base assessment but removing a single relative abundance index at a time, illustrated that there was additional uncertainty in recent exploitation rate amounting to around 12% (ICCAT, 2017). Additional sensitivity analyses, that examined the impact of alternative plausible model configurations, parameterizations and data, added a further 18% CV to estimates of current exploitation rate.
For the 2021 West bluefin tuna statistical catch-at-age stock assessment, the base model estimated current exploitation rates with a very high precision of approximately 5% (CV). However, simply starting the estimation at varying initial values (a ‘jitter analysis’) led to maximum likelihood estimates of spawning abundance in 2020 that varied with a CV of approximately 15% (ICCAT, 2021). Running the base assessment but removing a single relative abundance index at a time, spanned an additional uncertainty in recent exploitation rate of around 10% (ICCAT, 2021). Unlike the current stock assessment approach, gene tagging could provide estimates of metrics of management interest that do not rely on a complex interpretation of various, often conflicting data.
The tagging estimator tended to provide estimates of exploitation rates that were somewhat positively biased. Harvest strategies typically include tuning parameters that control the aggressiveness of the harvest strategy (i.e., change in catch relative to that in biomass or exploitation rate). Although this was not applied in these analyses, in an MSE setting tuning parameters are adjusted to obtain specified biological or yield performance, thus allowing candidate harvest (target exploitation rate of harvest strategy) strategies to be compared while controlling for one axis of the prevailing yield-biomass trade-off. In a harvest strategy that aims for a fixed exploitation rate, the tuning parameter is typically the target exploitation rate. It follows that it is precision in estimates of the exploitation rate that controls the responsiveness of the strategy to changes in the simulated exploitation rate. This precision is therefore a critical determinant of MP performance. However, a positive bias can be taken into account by a commensurate increase in the target exploitation rate tuning parameter (λE in Equation 1).
These analyses suggest that conventional gene tagging could inform harvest strategies for the East and West Atlantic management areas and provide expected management performance that is not substantially worse than idealized ‘perfect information’ constant exploitation rate management. While expected performance was generally very good, the effective number of releases - the product of the number of tag releases and the genotyping rate of caught fish - has important implications for lower tail, ‘worst case’ management outcomes. It follows that the appropriate investment in such a tagging program should be determined by acceptable levels of risk in terms of yield and biological conservation (among other considerations). This is particularly important because gene tagging harvest strategies that fished more strongly at closer to idealized MSY exploitation rate (i.e., ending with biomass close to BMSY given perfect information) led to over-exploitation and a declining biomass in later projection years. This further emphasizes the importance of closed-loop simulation testing as a tool in management planning that goes beyond an evaluation of merely the accuracy and precision of tagging estimators.
It is clear from this analysis that the extent of investment in tagging depends on management objectives relating to both long term yields, risks to biomass (lower tail) outcomes and stock trajectories (e.g., ICCAT, 2022). Where objectives are less stringent, the tagging programs required may be considerably less intensive. Closed-loop MSE-type analyses of the type presented here are needed since the exploitation rate of the harvest strategy determines the precision of the estimates in future years and hence these feedbacks need to be taken into account.
Some aspects of these simulations could serve to unduly enhance the potential performance of gene tagging estimators and related harvest strategies. On the other hand, performance could be improved with adjustments that were outside the scope of this research. Natural survival can be estimated by the multiyear Brownie model as the number of release years increases. Natural survival was not estimated in this analysis because mis-specification of the point value for natural survival serves only to affect the accuracy of exploitation rate estimates proportionally. For example, a 20% positive bias in the assumed rate of natural survival leads to a 20% reduction in exploitation rate estimates. Since the focus of this research was on harvest strategy performance, consistent biases in exploitation rate estimation may be ignored because harvest strategies are generally tuned to obtain comparable simulated biological or yield outcomes. Given the example above, the target exploitation rate of the harvest strategy using the biased exploitation rate estimator would simply be 20% lower to achieve the same management performance as a harvest strategy using an unbiased exploitation rate estimator.
The simulation exercise assumed that stock-of-origin could be identified accurately for all genotyped fish, and that there was no genotyping error. Error in stock-of-origin would not be expected to impact exploitation rate estimation unless one stock contained a much higher number of tagged fish, a situation for which checks can be made in the simulations and in practice. Similar to bias in the assumed rate of natural survival, genotyping error would be expected to lead to proportional downward bias in estimates of exploitation rate, which, as explained above, may be ignored in the context of harvest strategies that are tuned to performance outcomes. The analyses worked with an idealized model of recapture where the genotyping rate was constant across fleets. If, for example, the recapture program were implemented in Japanese markets, it would be necessary to quantify the fraction of fish exported to the Japanese market by fleet, information that was not available for this analysis.
There may be substantial improvements in the estimation performance of the tagging model and the management performance of the gene tagging harvest strategies given further investigation of more optimal tag release distributions, more advanced tagging models and more sophisticated harvest strategy algorithms that can slow catch increases or respond more rapidly to declining biomass. This analysis adhered to release distributions that have been implemented previously; ultimately all analyses used the historical seasonal/spatial and fleet distribution of electronic tags as the release distribution. There is evidence that this “design” is not ideally balanced with respect to the two stocks, and requires a substantially larger number of tags to be released to obtain comparable precision in western stock estimates. Additional investigation of better performing release distributions might further improve the expected cost-effectiveness of a gene tagging program. Similarly, further investigation could examine alternative sampling designs for genotyping, for example focusing on particular fish sizes and recapture locations. There was evidence that the early, proof-of-concept harvest strategy investigated here, could be less responsive with increased effective release numbers. This may be addressed by modifying the harvest strategy to include algorithms and parameters that control the responsiveness of catch advice, which was central to the refinement of the harvest strategy currently applied in the management of Atlantic bluefin tuna (ICCAT, 2022).
The multiyear Brownie estimator was computationally efficient, but was not age-structured and did not account for incomplete mixing of tags that could be related to age-based movement (the operating models simulate higher stock viscosity for smaller fish that may be more likely candidates for releases). Age-structured tagging estimators might better characterize these aspects, and provide improved estimation performance. Age-based estimates of exploitation rate could also be incorporated into harvest strategies to predict incoming cohort strength, reducing lags in current estimates and improving the reliability of TAC advice. The gene tagging harvest strategies considered in these analyses were deliberately very simple, adjusting TACs based on a target exploitation rate relative to the average of the two most recent exploitation rate estimates from the tagging model. More sophisticated harvest strategy algorithms could account for a trend in exploitation rate and include an adjustable exploitation rate target. Additionally, conventional gene tagging provides information about the stock-of-origin of fish caught by each fleet, allowing for harvest strategies that can account for the relative magnitude of the western and eastern stocks in the calculation of TAC advice.
At first glance, total tagging program costs of $2-2.5M per year may sound prohibitively high. However, the large majority of those costs relate to the recapture program, which could be shared among management organizations of bluefin stocks originating in the Southern and Pacific Oceans. The Atlantic bluefin fishery is estimated to have an end value of around $1Bn per year (Pew, 2020). For a very small percentage of the overall end value of the fishery (less than half a percent), it may be possible to implement robust gene tagging harvest strategies that are fishery-independent, provide independent estimates of natural survival, real-time estimates of stock-of-origin by fleet, and enhance stock assessments with reliable priors for exploitation rate and abundance. Furthermore, such a tagging program could offer rigorous seafood traceability and an opportunity to coordinate real-time exploitation rate estimation at a centralized location (for example in Japan).
The cost-effectiveness of the gene tagging harvest strategies could be presented in terms of the cost and expected management performance of the current status quo stock-assessment approach for management. The costs of the current system of data collection, processing and assessment (including meetings) is not readily available, but it is likely to be of a similar order of magnitude, while the technical process of stock assessment continues to struggle with large uncertainty in stock productivity and natural survival, as well as conflicts among data (e.g., Maunder, 2021). Full comparison of the performance of the stock assessment approach in closed-loop MSE is not feasible in practice because of the numerous subjective decisions regarding model formulation, parameterization and the interpretation of scientific advice by managers.
The complexity of the current stock assessment paradigm makes it accessible to a relatively narrow range of scientists and stakeholders only. Stock assessment requires considerable expertise in implementation and peer review, a large quantity of data and data processing and number of model assumptions, and is often sensitive to alternative plausible values for core parameters that are not well known (e.g., steepness of the stock-recruitment relationship). Considered together, these aspects may not promote confidence in the current stock assessment paradigm as a robust scientific basis for management. In addition, without a harvest control rule, the stock assessment does not provide direct advice on the management action to be taken. If the decision making has not been fully MSE tested, then the robustness of the action is unknown.
Comparatively, harvest strategies using tagging data are relatively straightforward to understand and can follow simple rules for the provision of updated TAC advice. This is a principal motivation behind the current MSE framework for Atlantic bluefin tuna, and the development of harvest strategies for bluefin tuna that set TAC advice using relative abundance indices (both fishery independent surveys and catch rate-based fishery dependent indices). Although much simpler than assessments, index-based harvest strategies must still navigate potential conflicts among indices and require that all indices continue to be collected in the future. If an index-based harvest strategy for Atlantic bluefin tuna is adopted, an extension to this work could evaluate the expected performance of various gene tagging harvest strategies based on established management performance metrics comparatively.
An evaluation of ‘optimal’ release numbers and genotyping rate was carried out to determine the least expensive way to achieve a desired precision in the tagging estimator. At the default assumed values for costs, exploitation rate and required precision, the optimal genotyping rate was between 25% and 35%, equivalent to 62,500 to 87,500 recapture samples per year given annual catches of 250,000 fish. Such a recapture program is considerably larger than those implemented for southern bluefin tuna for the purposes of CKMR and 3-4 times larger than SBT gene-tagging program, and would probably require dedicated laboratories for processing samples. It follows that the simplistic cost model of this analysis could be refined substantially by accounting for costs associated with start-up, fixed overheads, and efficiencies of scale. There is also likely to be considerable variability in release costs by region. Personal communications with scientists and industry members operating on the East coast of the USA suggest that given current discarding levels in those particular fisheries, at-sea releases are much less expensive than the default cost of US$1,000 that we assumed here, and that it would be straightforward to release at least 1,000 fish annually in that region. Extending the model to account for factors that cause overdispersion in the recapture data could inform tactical decisions about tag releases. For example, accounting for schooling of tagged fish could reveal the importance of releasing fish individually at discrete times and locations. An extension to this work might develop a model that can predict the management performance of a gene tagging harvest strategy (e.g., yields, resource conservation risk) given elease numbers and genotyping rate, and thereby allow for a calculation of ‘optimal’ tagging designs that are more management-focused.
This study confirms that conventional gene tagging offers a promising basis for calculating management advice for Atlantic bluefin tuna that may be cheaper, simpler and more robust than the current conventional stock assessment paradigm. Unlike harvest strategies that make use of relative abundance indices, those that use gene-tagging rely on a single fishery-independent data source, and therefore are not susceptible to conflicting data or the lack of continuation of a required index. Genetic tagging programs offer a host of other benefits including seafood traceability, potential estimation of natural survival and stock mixing, and the ability to inform stock assessments where status determination is a priority.
Publicly available datasets were analyzed in this study. This data can be found here: https://github.com/Blue-Matter/ABTGT.
TC: Original concept, manuscript drafting, developed methods, prepared results tables and figures QH: Manuscript drafting, developed methods. ML, AP, DB, AH & NT: Manuscript drafting. All authors contributed to the article and approved the submitted version
This research was funded by the FY21 Bluefin Tuna Research Program of the U.S. National Oceanic and Atmospheric Administration (award number: NA21NMF4720304). The Atlantic bluefin tuna MSE framework was developed under the provision of the ICCAT Atlantic Wide Research Programme for Bluefin Tuna (GBYP), funded by the European Union, several ICCAT CPCs and by other entities (see: http://www.iccat.int/GBYP/en/Budget.htm). The contents of this paper do not necessarily reflect the point of view of ICCAT or other funders and do not anticipate ICCAT future policy in this area.
Authors TC, QH, and AH were employed by the company Blue Matter Science Ltd. The remaining authors declare that the research was conducted in the absence of any commercial or financial relationships that could be construed as a potential conflict of interest.
All claims expressed in this article are solely those of the authors and do not necessarily represent those of their affiliated organizations, or those of the publisher, the editors and the reviewers. Any product that may be evaluated in this article, or claim that may be made by its manufacturer, is not guaranteed or endorsed by the publisher.
The Supplementary Material for this article can be found online at: https://www.frontiersin.org/articles/10.3389/fmars.2023.1210182/full#supplementary-material
Alemany F., Quintanilla L., Velez-Belchí P., García A., Cortés D., Rodríguez J. M., et al. (2010). Characterization of the spawning habitat of Atlantic bluefin tuna and related species in the Balearic Sea (western Mediterranean). Prog. Oceanogr. 86 (1–2), 21–38. doi: 10.1016/j.pocean.2010.04.014
Andreou D., Vacquie-Garcia J., Chucherousset J., Blanchet S., Gozlan R. E., Loot G. (2012). Individual genetic tagging for teleosts: An empirical validation and guideline for ecologists. J. Fish. Biol. 80 (1), 181–194. doi: 10.1111/j.1095-8649.2011.03165.x
Anon. (2021a). Report of the 2021 ICCAT GBYP workshop on close-kin mark recapture for eastern Atlantic bluefin tuna. Collect. Vol. Sci. Pap. ICCAT. 78 (3), 198–211.
Anon. (2021b). Report of the 2021 ICCAT GBYP workshop on electronic tagging for Atlantic bluefin tuna. Collect. Vol. Sci. Pap. ICCAT. 78 (3), 212–229. #Available at: https://www.iccat.int/Documents/CVSP/CV078_2021/n_3/CV078030212.pdf.
Anon. (2021c). “Specifications for MSE trials for Atlantic bluefin tuna. Version 21-03,” in International Commission for the Conservation of Atlantic Tunas, , September 9, 2021. Available at: https://www.iccat.int/GBYP/DOCS/MSE_Trials_Specifications_v21-03.pdf.
Anon. (2022). Atlantic Bluefin Tuna MSE (International Commission for the Conservation of Atlantic tunas). Available at: https://iccat.github.io/abft-mse/ (Accessed August 2022).
Beacham T. D., Wallace C. G., Jonsen K., McIntosh B., Candy J. R., Horst K., et al. (2021). Parentage-based tagging combined with genetic stock identification is a cost-effective and viable replacement for coded-wire tagging in large-scale assessments of marine Chinook salmon fisheries in British Columbia, Canada. Evol. Appl. 14, 1365–1389. doi: 10.1111/eva.13203
Block B. A., Teo S. L. H., Walli A., Boustany A., Stokesbury M. J. W., Farwell C. J., et al. (2005). Electronic tagging and population structure of Atlantic bluefin tuna. Nature 434 (7037), 1121–1127.
Bradford R. W., Hill P., Davies C., Grewe P. (2015). A new tool in the toolbox for large-scale, high throughput fisheries mark-recapture studies using genetic identification. Mar. Freshw. Res 67 (8), 1081–1089. doi: 10.1071/MF14423
Bravington M. V., Skaug H. J., Anderson E. C. (2016). Close-kin mark-recapture. Stat. Sci. 31 (2), 259–274. doi: 10.1214/16-STS552
Brazeal J. L., Weist T., Sacks B. N. (2017). Noninvasive genetic spatial capture-recapture for estimating deer population abundance. J. Wildlife. Management. 81 (4), 629–640. doi: 10.1002/jwmg.21236
Brownie C., Anderson D. R., Burnham K. P., Robson D. S. (1985). Statistical inference from band recovery data: a handbook Vol. 156 (Washington, D.C.: US Fish Wildl. Resour. Publ).
Butterworth D. S., Punt A. E. (1999). Experiences in the evaluation and implementation of management procedures. ICES. J. Mar. Sci. 5, 985–998. doi: 10.1006/jmsc.1999.0532
Carruthers T. R. (2020). Reference Set Operating models for Atlantic Bluefin Tuna assuming priors for Area-Specific Scale and western Stock Mixing. SCRS/2020/018. Available at: https://www.iccat.int/Documents/CVSP/CV077_2020/n_2/CV077020078.pdf (Accessed August 2022).
Carruthers T. R., Butterworth D. S. (2017). ABT-MSE: an R package for Atlantic bluefin tuna management strategy evaluation (Madrid: International Commission for the Conservation of Atlantic Tunas).
Carruthers T. R., Kell L. T., Butterworth D. S., Maunder M. N., Geromont H. F., Walters C., et al. (2015a). Performance review of simple management procedures. ICES. J. Mar. Sci. 73, (2) 464–482. doi: 10.1093/icesjms/fsv212
Carruthers T. R., Kimoto A., Powers J., Kell L., Butterworth D. S., Lauretta M. V., et al. (2015b). Structure and Estimation Framework for Atlantic Bluefin Tuna Operating Models SCRS/2015/179 (Madrid: International Commission for the Conservation of Atlantic Tunas).
Cochrane K. L., Butterworth D. S., De Oliveira J. A. A., Roel B. A. (1998). Management procedures in a fishery based on highly variable stocks and with conflicting objectives: experiences in the South African pelagic fishery. Rev. Fish. Biol. Fisher. 8, 177–214. doi: 10.1023/A:1008894011847
Cormack R. (1964). Estimates of survival from the sighting of marked animals. Biometrika 51, 429–438. doi: 10.1093/biomet/51.3-4.429
Cox S. P., Kronlund A. R., Robert A. (2008). Practical stakeholder-driven harvest policies for groundfish fisheries in British Columbia, Canada. Fish. Res. 94 (3), 224–237. doi: 10.1016/j.fishres.2008.05.006
Diaz G. A., Turner S. C. (2007). Size frequency distribution analysis, age composition, and maturity of western bluefin tuna in the Gulf of Mexico from the US (1981–2005) and JAPANese, (1975–1981) longline fleets. Collect. Vol. Sci. Pap. ICCAT. 60 (4), 1160–1170.
Draghici A. M., Challenger W. O., Bonner S. J. (2021). Understanding the impact of correlation within pair-bonds on Cormack-Jolly-Seber models. Ecol. Evol. 1 (11), 5966–5984. doi: 10.1002/ece3.7329
Fukuda H., Torisawa S., Sawada Y., Takagi T. (2010). Ontogenetic changes in schooling behaviour during larval and early juvenile stages of Pacific bluefin tuna Thunnus orientalis. J. Fish. Biol. 76 (7), 1841–1847. doi: 10.1111/j.1095-8649.2010.02598.x
Galuardi B., Lutcavage M. E. (2012). Dispersal routes and habitat utilization of juvenile Atlantic bluefin tuna, Thunnus thynnus, tracked with mini PSAT and archival tags. PloS One 7 (5), e37829. doi: 10.1371/journal.pone.0037829
GBYP. (2019). ICCAT GBYP Modelling Approaches (MSE details in Sectioni 3.5). Available at: https://www.iccat.int/GBYP/en/modelling.asp.
Grewe P., McDowell J., Walter J., Lauretta M., Gosslien T., Bravington M. V., et al. (2018). Genomic tools demonstrate excellent potential for estimating a census estimate for Atlantic Bluefin Tuna spawning in the Gulf of Mexico (ICES ASC). Available at: http://www.ices.dk/sites/pub/ASC2018/Abstracts/Forms/DispForm.aspx?ID=601.
Hanke A., Guénette S., Lauretta M. (2019). A summary of bluefin tuna electronic and conventional tagging data. Collect. Vol. Sci. Pap. ICCAT. 75 (6), 1587–1621.
Hernández C. M., Richardson D. E., Rypina I. I., Chen K., Marancik K. E., Shulzitski K., et al. (2022). Support for the Slope Sea as a major spawning ground for Atlantic bluefin tuna: evidence from larval abundance, growth rates, and particle-tracking simulations. Can. J. Fish. Aquat. Sci. 79 (5), 814–824. doi: 10.1139/cjfas-2020-0444
Hillary R. M., Bravington M. V., Patterson T. A., Grewe P., Bradford R., Feutry P., et al. (2018). Genetic relatedness reveals total population size of white sharks in eastern Australia and New Zealand. Sci. Rep. 8, 2661. doi: 10.1038/s41598-018-20593-w
Hillary R. M., Preece A. L., Davies C. R. (2019). Performance of a revised candidate MP using all 3 input data sources (CCSBT-ESC/1909/16) (Hobart). Available at: https://www.ccsbt.org/en/system/files/ESC24_16_AU_MPpaper.pdf.
Hillary R. M., Preece A. L., Davies C. R., Kurota H., Sakai O., Itoh T., et al. (2016). A scientific alternative to moratoria for rebuilding depleted international tuna stocks. Fish. Fish. 17, 469–482. doi: 10.1111/faf.12121
Huggins R. M. (1989). Capture-recapture and removal methods for sampling closed populations. Biometrics 45 (1), 153–164.
Ianelli J. (2023). Eastern Atlantic bluefin tuna stock assessment review. Collect. Vol. Sci. Pap. ICCAT. 72 (3), 1022–1030. Available at: https://www.iccat.int/Documents/CVSP/CV079_2022/n_3/CV079031022.pdf.
ICCAT. (2017). Report of the 2017 ICCAT Bluefin Stock Assessment Meeting. Available at: https://www.iccat.int/Documents/SCRS/DetRep/BFT_SA_ENG.pdf.
ICCAT. (2020). ABT-MSE: an R package for Atlantic Bluefin Tuna Management Strategy Evaluation. Available at: https://github.com/ICCAT/abft-mse/tree/master/R_package/ABTMSE.
ICCAT. (2021). Report of the 2021 western bluefin stock assessment meeting. Available at: https://www.iccat.int/Documents/Meetings/Docs/2021/REPORTS/2021_WBFT_SA_ENG.pdf (Accessed August 2022).
ICCAT. (2022). Recommendation by ICCAT establishing a management procedure for Atlantic bluefin tuna to be used for both the western and eastern Atlantic and Mediterranean management areas. 22-09. Available at: https://www.iccat.int/Documents/Recs/compendiopdf-e/2022-09-e.pdf (Accessed May 2023).
Justel-Rubio A., Ortiz M., Parrilla A., Di Natale A., Idrissi M. (2014). Preliminary review of ICCAT bluefin tuna conventional tagging database. Collect. Vol. Sci. Pap. ICCAT. 70 (2), 299–320.
Luikart G., England P. R., Tallmon D., Jordan S., Taberlet P. (2003). The power and promise of population genomics: from genotyping to genome typing. Nat. Rev. Genet. 4 (12), 981–994. doi: 10.1038/nrg1226
Lukacs P. M., Burnham K. P. (2005). Review of capture–recapture methods applicable to noninvasive genetic sampling. Mol. Ecol. 14, 3909–3919. doi: 10.1111/j.1365-294X.2005.02717.x
Lutcavage M. E., Brill R. W., Skomal G. B., Chase B. C., Howey P. W. (1999). Results of pop-up satellite tagging of spawning size class fish in the Gulf of Maine: do North Atlantic bluefin tuna spawn in the mid-Atlantic? Can. J. Fish. Aquat. Sci. 56 (2), 173–177. doi: 10.1139/f99-016
Marcek B. J., Graves J. E. (2014). An estimate of postrelease mortality of school-size bluefin tuna in the U.S. Recreational troll fishery, north American. J. Fish. Manage. 34 (3), 602–608. doi: 10.1080/02755947.2014.902411
Maunder M. (2021). Review of the 2021 West Atlantic bluefin tuna assessment. Collect. Vol. Sci. Pap. ICCAT. 78 (3), 1114–1124.
McDowell J. R., Bravington M., Grewe P. M., Lauretta M., Walter J. F., Baylis S. M., et al. (2022). Low levels of sibship encourage use of larvae in western Atlantic bluefin tuna abundance estimation by close-kin mark-recapture. Sci. Rep. 12 (1), 1–11. doi: 10.1038/s41598-022-20862-9
Pew (2020)Netting billions 2020: A global tuna valuation’. In: The Pew Charitable Trusts. Available at: https://www.pewtrusts.org/en/research-and-analysis/reports/2020/10/netting-billions-2020-a-global-tuna-valuation (Accessed August 2022).
Preece A., Eveson P., Davies C., Grewe P., Hillary R., Bravington M. (2015). “Report on gene-tagging design study,” in Commonwealth Scientific and Industrial Research Organisation (CSIRO) (CCSBT-ESC/1509/18) (Hobart). Available at: https://www.ccsbt.org/en/system/files/resource/en/55c2f198e8f46/ESC20_18_CCSBT_GeneTagDesignStudyReport.pdf.
Preece A. L., Eveson P. J., Grewe P. M., Bradford R., Clear N., Aulich J., et al. (2018). The 2018 SBT gene-tagging program. In: Commonwealth Scientific and Industrial Research Organisation (CSIRO) (CCSBT-OMMP/2006/04). Available at: https://www.ccsbt.org/en/system/files/OMMP11_05_CCSBT_GT2018Program_DataForMPandOM.pdf (Accessed December 2021).
Puncher G. N., Cariani A., Maes G. E., Van Houdt J., Herten K., Cannas R., et al. (2018). Spatial dynamics and mixing of bluefin tuna in the Atlantic Ocean and Mediterranean Sea revealed using next-generation sequencing. Mol. Ecol. Resour. 18 (3), 620–638. doi: 10.1111/1755-0998.12764
Punt A. E., Butterworth D. S., de Moor C. L., De Oliveira J. A. A., Haddon M. (2016). Management strategy evaluation: Best practices. Fish. Fish. 17 (2), 303–334. doi: 10.1111/faf.12104
Richardson D. E., Marancik K. E., Guyon J. R., Lutcavage M. E., Galuardi B., Lam C. H., et al. (2016). Discovery of a spawning ground reveals diverse migration strategies in Atlantic bluefin tuna (Thunnus thynnus). Proc. Natl. Acad. Sci. U.S.A. 113 (12), 3299–3304. doi: 10.1073/pnas.1525636113
Rodríguez-Ezpeleta N., Díaz-Arce N., Walter J. F. III, Richardson D. E., Rooker J. R., Nøttestad L., et al. (2019). Determining natal origin for improved management of Atlantic bluefin tuna. Front. Ecol. Environ. 17 (8), 439–444. doi: 10.1002/fee.2090
Rooker J. R., Arrizabalaga H., Fraile I., Secor D. H., Dettman D. L., Abid N., et al. (2014). Crossing the line: migratory and homing behaviors of Atlantic bluefin tuna. Mar. Ecol. Prog. Ser. 504, 265–276. doi: 10.3354/meps10781
Schwartz M. K., Luikart G., Waples R. S. (2007). Genetic monitoring: as a promising tool for conservation and management. Trends Ecol. Evol. 22, 25–33. doi: 10.1016/j.tree.2006.08.009
Seber G. A. F. (1982). The estimation of animal abundance. 2nd edition (N.Y: Oxford University Press).
Stokesbury M. J. W., Neilson J. D., Susko E., Cooke S. J. (2011). Estimating mortality of Atlantic bluefin tuna (Thunnus thynnus) in an experimental recreational catch-and-release fishery. Biol. Conserv. 144, 2684–2691. doi: 10.1016/j.biocon.2011.07.029
Keywords: mark-recapture, genetics, harvest strategy, estimator, management strategy evaluation, management procedure
Citation: Carruthers TR, Huynh QC, Lauretta MV, Preece AL, Butterworth DS, Hordyk AR and Taylor NG (2023) Evaluating Atlantic bluefin tuna harvest strategies that use conventional genetic tagging data. Front. Mar. Sci. 10:1210182. doi: 10.3389/fmars.2023.1210182
Received: 21 April 2023; Accepted: 17 July 2023;
Published: 09 August 2023.
Edited by:
Francois Bastardie, Technical University of Denmark, DenmarkReviewed by:
Kevin J Hedges, Fisheries and Oceans Canada (DFO), CanadaCopyright © 2023 Carruthers, Huynh, Lauretta, Preece, Butterworth, Hordyk and Taylor. This is an open-access article distributed under the terms of the Creative Commons Attribution License (CC BY). The use, distribution or reproduction in other forums is permitted, provided the original author(s) and the copyright owner(s) are credited and that the original publication in this journal is cited, in accordance with accepted academic practice. No use, distribution or reproduction is permitted which does not comply with these terms.
*Correspondence: Thomas R. Carruthers, dG9tQGJsdWVtYXR0ZXJzY2llbmNlLmNvbQ==
Disclaimer: All claims expressed in this article are solely those of the authors and do not necessarily represent those of their affiliated organizations, or those of the publisher, the editors and the reviewers. Any product that may be evaluated in this article or claim that may be made by its manufacturer is not guaranteed or endorsed by the publisher.
Research integrity at Frontiers
Learn more about the work of our research integrity team to safeguard the quality of each article we publish.