
94% of researchers rate our articles as excellent or good
Learn more about the work of our research integrity team to safeguard the quality of each article we publish.
Find out more
ORIGINAL RESEARCH article
Front. Mar. Sci., 10 August 2023
Sec. Marine Biology
Volume 10 - 2023 | https://doi.org/10.3389/fmars.2023.1204908
 James F. Pilkington1
 Eva H. Stredulinsky2Katherine Gavrilchuk2
 Sheila J. Thornton2
 John K. B. Ford1†
 Thomas Doniol-Valcroze1*†
Understanding habitat use patterns of animal populations across space and time is fundamental to identifying ecological requirements, and informing threat mitigation and conservation strategies. Persistent data gaps tend to occur with cryptic species in difficult-to-access environments, where the use of appropriate monitoring tools is indispensable for detection. Three populations of threatened and endangered killer whales occur year-round in waters off British Columbia, Canada; however, their winter habitat use patterns are not well known. Here we quantify wintertime use of the northern Strait of Georgia by these sympatric killer whale populations, revealing the importance of this previously understudied region. Using a network of passive acoustic monitoring devices deployed over three winter periods, we examine site-specific and regional patterns of occurrence of Bigg’s, and Southern and Northern Resident killer whales. All three populations frequented these waters in nearly every month from November to April, and across all study years. Bigg’s killer whales were detected most frequently, followed by Southern Residents, then Northern Residents. Population-specific differences in site use was apparent, with Southern Resident detections occurring more often than expected off the southwest side of Texada Island, while Northern Residents appeared to favor the east side of Texada Island. Remarkably, the patterns of winter use we observe in this region by Resident killer whale populations have seemingly persisted for at least 50 years. Additionally, we evaluate and discuss the effect of using multiple simultaneous recorders to characterize habitat use patterns. Lastly, we present a data-driven approach for estimating acoustic residence time, describe inter-population differences in winter residency in the northern Strait of Georgia, and discuss implications for critical habitat designation. This study fills important knowledge gaps related to killer whale winter occurrence off western Canada, highlighting the significance of the northern Strait of Georgia for these at-risk populations.
Monitoring the presence and seasonality of multiple animal populations is needed to understand how sympatric species partition their habitat and to inform management actions under an ecosystem-based approach (Pikitch et al., 2004). For populations living in seasonally inaccessible, remote, or otherwise challenging habitats, data collection required for such monitoring can prove extremely difficult. Passive acoustic monitoring (PAM) offers an alternative, cost-effective, and non-invasive surveying method that is becoming a standard practice in ecological research (Sugai et al., 2019). In the marine environment, PAM can be used to detect marine mammals in situations where visual surveys are difficult (Marques et al., 2013) and is commonly used to investigate seasonal and diel trends in occurrence of marine mammals, even in inclement weather and at night (e.g., Norris et al., 1999; Mellinger et al., 2007). Examples of its applications to cetaceans include obtaining information on habitat use by multiple species at a given site (e.g., Marcoux et al., 2017) or by multiple populations of the same species (e.g., blue whales, Barlow et al., 2022), spatial (e.g., Burnham et al., 2019) and temporal (e.g., Todd et al., 2020) segregation of species, and inter-annual variation in habitat use (Rice et al., 2021).
Although PAM instruments can record data continuously without regard to sea-state or visibility, once deployed they are spatially restricted to a defined, though variable, detection radius from their deployment site (unlike surveys from a moving platform; Marques et al., 2013) and the information they provide is typically limited to a single location (e.g., Riera et al., 2019). To achieve greater geographic coverage, studies often deploy multiple recorders. Determining recorder locations requires consideration of study objectives, PAM resources available, and vocal behavior of the species or population of interest, as well as trade-offs between the spatial breadth of acoustic coverage and spatial gaps among recorder detection ranges. Placing recorder sites in closer proximity to one another allows for precise characterization of animal presence in a smaller region (e.g., the Scotian Shelf in Delarue et al., 2022; Frouin-Mouy et al., 2022), whereas placing recorder sites far apart allows for broader spatial coverage, albeit with potentially large spatial gaps (e.g., the Grand Banks of Newfoundland in Delarue et al., 2022). Studies may attempt to maximize detection probability of a particular species or population in a given region by taking into account prior knowledge of population- and/or region-specific behavior (e.g., Hanson et al., 2018). Though it is often difficult for PAM studies to quantify the abundance and movement patterns of individuals in a population (Marques et al., 2013), using multiple recorders can provide insight into how long animals typically reside within a region, which may have important implications for threat exposure and determination of an area’s function and importance.
Killer whales (Orcinus orca), particularly those in the northeastern Pacific, are especially well suited to PAM studies, as previous research has demonstrated that many populations can be reliably distinguished through their distinctive vocalizations and group-specific repertoires of stereotyped calls (Ford, 1991; Yurk et al., 2002; Deecke et al., 2005; Saulitis et al., 2005; Ford et al., 2014; Sharpe et al., 2017). Data collected from autonomous acoustic recorders have therefore been used to document habitat use in areas such as the west coast of Vancouver Island, Canada (Burnham et al., 2016; Riera et al., 2019), the Gulf of Alaska (Yurk et al., 2010; Myers et al., 2021), and the continental shelf of the U.S. west coast (Hanson et al., 2013), and to identify critical habitat in Canadian waters (Ford, 2006; Ford et al., 2017).
Several sympatric populations of killer whales inhabit the coastal waters of the northeastern Pacific (Matkin et al., 1999; Ford et al., 2000; Krahn et al., 2007; Dahlheim et al., 2008; Ford et al., 2014). Within the fish-eating ‘resident’ ecotype, the Northern Resident and Southern Resident killer whale populations (NRKW and SRKW, respectively) do not interbreed or socialize with each other despite their partially overlapping ranges, and are considered genetically and culturally distinct from one another, as well as from other killer whale populations. In addition, the West Coast Transient population of mammal-hunting Bigg’s killer whales (BKW, aka ‘transient ecotype’; Ford et al., 1998) occupy the same waters as these Resident killer whale populations, but are genetically, socially and culturally isolated such that they may qualify as a discrete species (Morin et al., 2010). These three populations are listed under Canada’s Species At Risk Act (NRKW and BKW as ‘threatened’, SRKW as ‘endangered’), which requires the identification of their critical habitat as well as an assessment of anthropogenic threats (Fisheries and Oceans Canada, 2018), ideally using reliable, year-round information on distribution and habitat use. Understanding travel and residency patterns also helps infer the function and importance of different habitats. Obtaining such data for free-ranging cetaceans is difficult due to their cryptic nature, broad spatial ranges and rapid movements in relatively remote areas. Winter distribution in particular constitutes an important gap in knowledge for killer whales in Canadian waters (Ford, 2006; Riera et al., 2013; DFO, 2017) because of the logistical challenges associated with field work at that time of year due to inclement weather and short daylight hours.
Within the inland waters of Washington State and southern British Columbia (BC), collectively known as the Salish Sea, the northern Strait of Georgia (NSoG) is an understudied and potentially important winter habitat for killer whales (Figure 1). Despite not being part of legally designated critical habitat, there is historical evidence that the NSoG is used by Resident and Bigg’s killer whales in winter (e.g., stranded and recovered carcasses: Pike and MacAskie, 1969; opportunistic encounters: Bigg et al., 1976; historical captures for aquaria: Colby, 2018). In more recent decades, opportunistic winter sightings and encounters in the area (DFO Cetacean Research Program, unpubl. data), recovered carcasses (e.g., Center for Whale Research, 2016; Fisheries and Oceans Canada, 2019), as well as biologging data (Hanson et al., 2017), have documented contemporary use of the area by SRKW, and BKW have been increasingly present in the Salish Sea (Shields et al., 2018; Towers et al., 2019). However, because the NSoG area is not as densely populated as the southern Strait of Georgia and the rest of the Salish Sea, it does not receive as much dedicated or opportunistic effort, especially in winter. Here we describe the NSoG’s winter use by three sympatric killer whale populations. Using a fine-scale configuration of multiple passive acoustic recorders to increase the likelihood of killer whale detection across this complex region and a novel data-driven approach to define acoustic encounters, we characterize both site-specific and regional patterns of occurrence and residency, as well as diel, seasonal and interannual trends.
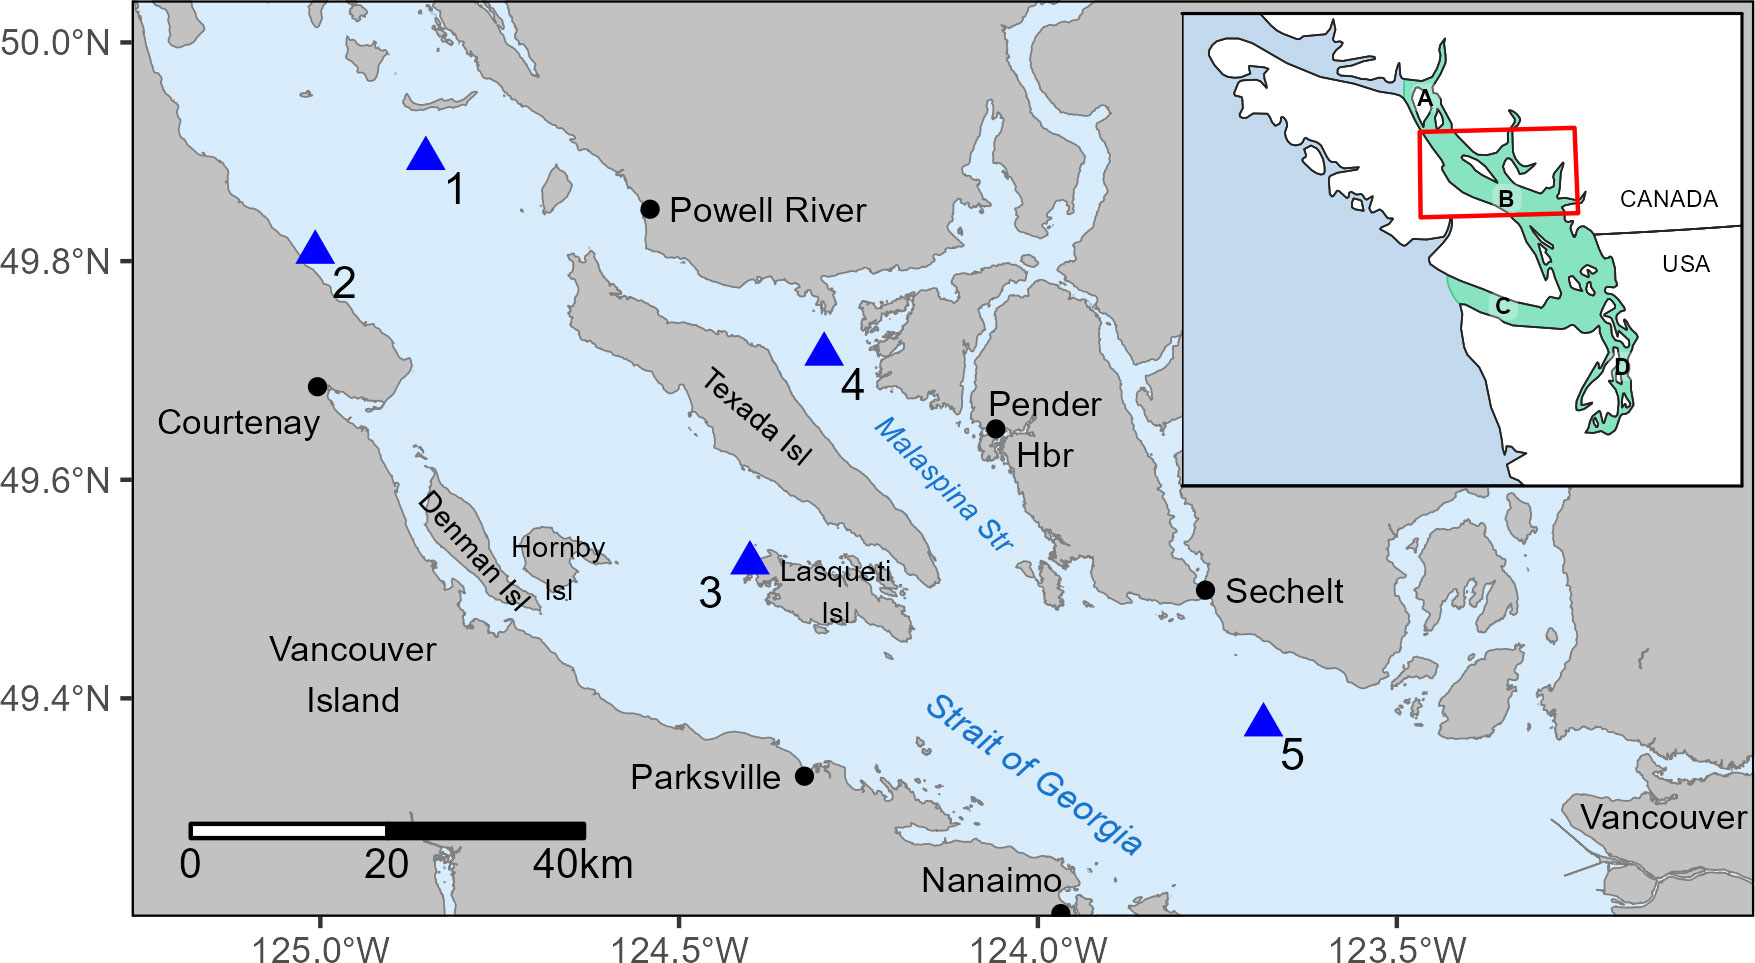
Figure 1 Northern Strait of Georgia study area and locations of PAM recorder sites assessed in this study: (1) Grant Reefs, (2) Kitty Coleman, (3) northwest Lasqueti Island, (4) Sinclair Bank, and (5) McCall Bank. Turquoise polygon in inset map indicates the extent of the Salish Sea, composed of waters around the Discovery Island archipelago (A), the Strait of Georgia (B), Juan de Fuca Strait (C) and Puget Sound (D).
We deployed autonomous archival hydrophone recorders at five different locations throughout the NSoG, providing broad geographic coverage over which to evaluate winter habitat use (Figure 1). Fourteen deployments were conducted at these sites to cover the three winter periods from 2015-2018 (Supplementary Table 1). Herein, we use the terms “recorders” and “sites” interchangeably, and use the term “study year” to refer to a given winter period across calendar years (e.g., the 2016-17 study year refers to the period of November 2016 to April 2017).
All instrument deployments except those at McCall Bank were conducted from a small vessel, by hand, using a custom grapple mooring system that allowed the moorings to be deployed and retrieved manually. The custom mooring consisted of a central concrete block from which the recorder was suspended using a trawl float and a polyvinyl chloride (PVC) protective sheath (made acoustically transparent with large holes). Two 36 m lines running in opposite directions were stretched out across the seafloor from the concrete block, terminating in 5 kg ‘Bruce’-type anchors. Deployments using these grapple moorings had recorder depths of approximately 30-40 m (Supplementary Table 1). The McCall Bank mooring consisted of the recorder in a PVC sheath with an acoustic release, suspended above a weight on the seafloor using a trawl float, resulting in a recorder depth of 220 m.
Three different models of recorder were used throughout the study: SoundTrap 303 HF and SoundTrap STD (Ocean Instruments, nominal sensitivity of -173 dB re 1V/µPa for ‘high-gain’ setting) with extended battery housings, and MicroMARS (long-duration, Desert Start Technologies, MH-33-1 hydrophone, nominal sensitivity of -165dB re 1V/µPa). The technical specifications for these instruments state they have a flat frequency response over the focal band of our study (700 Hz to 12,500 Hz). All instruments were set to record on a duty cycle consisting of 5 min of continuous recording for every 15-min period (5-min record, 10-min pause, repeated), equating to 33% temporal coverage. This particular duty cycle has no impact on the detection of Resident killer whales at the daily resolution, nor on the accuracy of acoustic bout durations (Rand et al., 2022). We assume that our duty cycle has minimal negative effect on the detection of the relatively brief and less frequent bouts that characterize BKW acoustic behavior (effectively similar to some mesoplodon species, as in Stanistreet et al. (2016)); however, subsampling effects have not yet been assessed in the context of BKW specifically. Recorders were set to record 16-bit audio files (MicroMARS: waveform files; SoundTraps: lossless compression retroactively uncompressed to waveform files) at sample frequencies of 25 kHz, 36 kHz, and 48 kHz for the MicroMARS, SoundTrap STD, and SoundTrap HF, respectively.
Recordings were analyzed in a multi-step process, involving: (1) automated detection of potential killer whale tonal signals, (2) manual validation of detections, (3) QA/QC of manually validated detections, (4) manual identification of killer whale groups present in recordings with positively-validated KW detections, and (5) evaluation of the automated detector’s recall (i.e. quantifying false negatives). First, all recordings were processed using the Whistle and Moan Detector in PAMGuard software (Gillespie et al., 2013) to search for tonal sounds that could be killer whales. Echolocation clicks were not assessed in this study. For consistency, all recordings were processed using a 25 kHz sample frequency at 1024 Hz FFT length, and 50% FFT hop, and the detector operated within the user-defined band of 700 Hz to 12,500 Hz. When necessary, recordings made at a higher sample frequency were decimated using the PAMGuard Decimator module within the processing workflow to 25 kHz; this was required for all SoundTrap recordings. During processing it became evident that one of the MicroMARS recorders had a self-noise issue in each of its deployments, where long tonal sweeps were present in all frequencies above 6,000 Hz. This self-noise resulted in unmanageable levels of false positives, so we limited the bandwidth of the detector to frequencies below 6,000 Hz for all deployments. Because killer whale vocalizations are known to have energy extending above 6,000 Hz, we evaluated whether limiting the bandwidth to below 6,000 Hz resulted in missed recordings containing killer whale vocalizations. We analyzed two consecutive months (November and December) of data from a single deployment (AM077) using full-bandwidth detections and detections limited to below 6,000 Hz. We concluded that because no killer whale-positive recordings in our two-month subsample were missed using the 6,000 Hz cut off, this solution had minimal, if any, effect on our results.
The Whistle and Moan Detector does not classify sounds, but rather detects tonal signals meeting particular user-defined criteria; those that fall within the analysis band (previously described), exceed 6 dB SNR, have a minimum length of 15 time slices and a maximum total size of 30 pixels. The detector produces a list of date-time stamps and frequency ranges of detected sounds, as well as the time-frequency contours of the detected sounds, which then require manual classification to determine whether they are sounds made by killer whales. Each of these detections was examined aurally and visually in spectrograms (512 Hz FFT, 50% overlap, Hann window, 30-second duration per screen) by trained analysts using PAMGuard ViewerMode, which allows the user to overlay detections made by the Whistle and Moan detector onto spectrograms. The analysts reviewed and identified each detected sound to species, a potential species, or a sound type (if abiotic). This manual validation of every detection removed all false positives from further analyses. Four different analysts were involved in this detection validation process. To ensure consistency across the different analysts’ datasets, one analyst (JP) also conducted quality control by examining approximately 25% of each deployment’s validated detections (which included all detections identified by the analysts as killer whale or potential killer whale), correcting the analysts’ identification of detections as needed.
After this detection validation stage, all 5-min recordings wherein at least one detection of killer whales or potential killer whales was validated were evaluated in their entirety to identify the groups of killer whales present. This manual assessment was undertaken by one of two analysts (JP, JKBF), trained and experienced in the identification of killer whale discrete call types and acoustic identification of killer whale groupings based on the identification of catalogued stereotyped burst-pulsed vocalizations. These two analysts were shown to have a high-degree of agreement in identifying killer whale groups at various population levels in a prior study, minimizing bias that could be introduced by using multiple analysts for this analysis step. The manual identification of killer whale groups was conducted by aurally and visually examining each recording separately as spectrograms using SpectroPlotter (version 7.0.2, JASCO Applied Sciences, Ltd.) or Amadeus Pro (HairerSoft, version 1.2), based on user preference (512-1024 Hz FFT, 50-75% overlap, Hann window, 30-second duration per screen, zooming in when necessary). The analysts identified each unique call type present in the recordings using digitized discrete call type catalogues for each killer whale population previously observed in the study area: Northern and Southern Resident (Ford, 1987; Ford, 1991), Bigg’s (Ford, 1987; Deecke, 2003), and Offshore killer whales (DFO Cetacean Research Program, unpubl. data). The analysts noted the population(s) of killer whale present in each recording, as well as the acoustic clan(s) and pod(s) for Resident killer whales, as defined by Ford (1991) and Bigg et al. (1990), whenever possible.
For SRKW, due to overlap in the three pods’ repertoires (most notably pods K and L), we allocated a fourth pod category called “L/K” to recordings where L and/or K groups were present but the singular pods could not be distinguished due to the quality and types of call types present. Where calls were of a quality and type that allowed for the differentiation of L and K pods, we noted L pod as present if S02iii or S19 call types were present (but see below regarding individual L87), and we noted K pod as present if there were a high proportion of S16 and S17 or S36 vocalizations relative to other calls, without any S02iii or S19 call types present; if S02iii and S19 calls were also present, then L and K pods were noted as present together. The case of the SRKW individual L87 also presents a unique situation for the interpretation of PAM-derived pod composition. L87 is a lone adult male who travelled predominantly with groups from J pod during at least our first study year, and is presumed to still use his L pod call repertoire. To ensure that the presence of L pod calls in otherwise J-dominated bouts did not inflate the true presence of actual L pod groups using the area, we assessed whether the number and frequency of occurrence of L pod calls amongst otherwise J-pod-only vocalizations could be attributed solely to an individual animal (i.e., L87) or were more likely from an actual group of L pod animals. If it was determined that only a few non-temporally-overlapping vocalizations from the L pod repertoire (primarily S02iii, S19, S18, and S16 call types) were mixed in with predominantly J pod vocalizations, the encounter was logged as only containing J pod, under the assumption that the limited L pod vocalizations present were from L87 and not a group of L pod whales.
To assess the impact that false negatives had on the results, we manually reviewed a random subsample of 5% of daily recordings from all deployments from the first winter of the study for killer whale presence and then calculated recall, defined as:
where refers to true positives (tally of days where both the detector-based methods and the manual review found killer whale vocalizations that could be confidently attributed to population) and FN refers to false negatives (tally of days in which the detector-based methods did not find killer whale vocalizations that could be confidently attributed to population, but the manual analyst did). We computed recall scores for each of the three deployments, as well as for all three deployments combined for a ‘region-wide’ recall.
To mitigate the effect of varying numbers of active recorders in the study area for our analyses, data were limited to months wherein, for most study years, a minimum of three recorders were active (November to April inclusive). Detections of killer whales that could not be confidently identified to population due to low signal-to-noise ratio were not included in analyses, with the exception of our residence models (see Site and regional residency section for details). All analyses and figure generation were undertaken using R programming software (R Core Team, 2021).
To investigate how the number of recorders within the study area informed our interpretation of killer whale occurrence at the regional scale, we examined how the number of unique calendar days with detections changed with increasing numbers of simultaneously active recorder sites. We selected four periods during our study when at least three sites were continuously active: 1) November 2015 to February 2016 (109 effort days; 3 active recorders); 2) January 2017 to February 2017 (45 effort days; 5 active recorders); 3) Dec 2016 to February 2017 (86 effort days; 4 active recorders), and; 4) November 2017 to March 2018 (121 effort days; 4 active recorders). For each of these periods, we calculated the number of days with detections of each population as sites were added step-wise. Sites were added in the order that maximized detection days when pooled with previously-added site(s). Detection days were computed as a percentage of effort days to facilitate comparison across the four periods.
To examine trends in acoustic presence in the study area across years and months, we derived two metrics of detection days per unit effort (DDPUE). We first tabulated the number of unique calendar days with at least one detection as a proportion of unique calendar days when at least one recorder in the study area was active, termed “unique DDPUE”. Because this metric is potentially affected by the number of active recorders in the study area, we also calculated “cumulative DDPUE”, which used the cumulative number of calendar days with detections among all active recorders as a proportion of cumulative effort days among recorders. For example, should 5 recorders be operating for a single day and killer whales were detected on two of the recorders that day, unique DDPUE would be 1 unique detection day/1 unique effort day = 1.0; whereas cumulative DDPUE would be calculated as 2 cumulative detection days/5 cumulative effort days = 0.4. The values of these two metrics were statistically compared across seasons for each population using equality of proportions testing (Agresti, 2007).
To explore the duration for which each population was typically acoustically present, as well as the duration for which they were typically acoustically absent before ‘returning’, we used a mark-recapture approach where we generated lagged detection rates (LDRs) and fit emigration-reimmigration models to predict the probability that a given population detected at time was still acoustically present after a lag of .
It is important to note that these lagged rates used acoustic detections identified to population only, not to individuals, matrilines or pods; therefore, these residence times cannot provide information on animal movement (i.e. physical presence or absence), but simply to acoustic presence or absence of a given population. Time “acoustically present” at a given site or within the region may represent one group from a population remaining physically present and consistently vocal, or interchanging vocalizing groups from the same population.
For this residency analysis, detections of killer whales that could not be confidently identified to population due to low signal-to-noise ratio were not included, unless they were considered close enough in time to a detection with a confirmed population to adopt the proximal detection’s identification. These presumptive identifications were assigned to mitigate underestimating residence times. For each killer whale detection with unclear population identity, if the nearest detection was of BKW and the time lag between the detections was less than 1.5 h, the detection was assumed to be BKW. If the nearest detection was of SRKW or NRKW and the time lag between the detections was less than 3 h, the detection was assumed to be SRKW or NRKW, respectively. Detections of an unknown Resident population were assumed to be of the population from the nearest confirmed Resident detection, if they were within 3 hours of one another. These temporal thresholds were based on typical calling rates and speed of travel of RKW and BKW (see Riera et al., 2013). These thresholds were considered quite conservative, with extremely low probabilities of incorrectly assigning a putative population, as only 0.2% of detections within 1.5 h of confirmed BKW detections were of non-BKW populations, only 0.4% of detections within 3 h of confirmed SRKW detections were of non-SRKW populations, and only 4% of detections within 3 h of confirmed NRKW detections were of non-NRKW populations (see Supplementary Tables 1–3).
An LDR was defined as the probability that the population detected at time is detected at time later, and was estimated as the probability of a detection occurring time units after a given population’s detection at time ( )) multiplied by the probability that a random detection time units later is of the same population [see ‘lagged identification rate’ from Whitehead, 2001)]. The probability of detection,), was calculated as the proportion of detections at time that were followed by detection(s) time units later. The lagged identification rate, ), was calculated as the proportion of pairs of detections time units apart that were of the same population.
where is the number of detections of the given population at time , is the number of detections that were followed by detection(s) time units later, is the number of pairs of detections of the same given population time units apart, and is the number of pairs of detections time units apart. LDRs for each population were calculated for each season hourly (to a maximum of 336 h) at each site, as well as daily (to the maximum time lag within the given season; 2015-16: 131 d, 2016-17: 158 d, 2017-18: 175 d) across all sites, to generate site-specific and regional rates, respectively.
In visual-based movement analyses, an LDR falling to zero suggests permanent emigration from the study area following a detection, whereas a leveling off at large time lags imply that some animals remain within the area, or that either the same or different individuals of the same population return to the area (Whitehead, 2001). However, in our analysis, we can only infer absence and presence in acoustic terms. Acoustic absence may occur due to a population being physically absent from the area, or due to a lack of detected vocal activity from any individuals physically present in the area. Therefore herein we use the term “returning”, not to infer physical movement into the area of interest, but rather to indicate a resuming of acoustic activity after a period of acoustic absence in the given area.
In addition to visual inspection of the LDR over time, we fit a mathematical model to the detection data to estimate residence times at each site and within the study region. We assumed the populations were closed within each study period, and that patterns of acoustic presence and absence could be described using the emigration-reimmigration model from Whitehead (2001), (Equation 6):
where is the expected probability that a member of a given population is still acoustically present in the area after a lag of time units, is the mean residence time (i.e., mean time acoustically present) in the given area and is the mean time acoustically absent before ‘returning’. We also report on the value of , which is the asymptotic value of at large time lags and represents the average probability of detecting a population in the study area at any given time.
The model was fit to our LDR data using nonlinear least squares, where the free parameters of the residence model (i.e., , ) were chosen to minimize the sum of the squares of residuals, using the R ‘nls’ function. Model fits were quantitatively assessed using McFadden’s pseudo-R2 (McFadden, 1974), derived by the R package wzRfun ‘R2nls’ function (Zeviani, 2021), where the coefficient of determination is adjusted for the null model. As such, the R2 values cannot be interpreted as absolute variance explained by the model, but rather as the relative explanatory power gained using the non-linear model over the null. We consider values greater than 0.2 to indicate adequate model fit (as per McFadden, 1979).
To investigate detections as a function of time of day, we calculated the total duration of recordings with detections within a given period of day, as a proportion of the total duration of recording hours that occurred during the given diel period. Diel periods of day, night and twilight were assigned using the R package suncalc (Thieurmel and Elmarhraoui, 2019), where morning and evening twilight periods were combined to form a single diel classification. Detection rates for each diel period were compared via equality of proportions testing (Agresti, 2007).
To explore how different populations used our study area, we tallied the number of observed and expected days with detections at each site over the study period. Expected detection days account for the uneven sampling effort among sites contributing to our observed detections. They were estimated by multiplying the total days of effort at the given site by the expected rate of detection for the given population (total number of detection days for the population in the study divided by the total number of effort days in the study) (e.g., Hanson et al., 2013). Were a population using the study area ‘evenly’ (i.e. time spent at each site was similar), we would not expect to see any significant difference between observed and expected number of days with detections (i.e., the site contributed detection days proportional to the effort it contributed to the study). Should a population preferentially use an area within our study bounds, we would expect to see observed detection days significantly greater than expected at the site(s) within that area. Conversely, if a population uses an area within our study region less frequently relative to other areas within the region, we would expect to see expected detection days significantly greater than observed at the site(s) within that area. Statistically significant differences between the number of observed and expected detection days at each site were determined by Chi-square testing.
The 5% daily subsample resulted in the manual review of 1,925 recordings across the three 2015-16 deployments (AM077, AM078, AM079). Recall at the daily resolution varied by deployment site. Where recall ranges from 0% (missed everything) to 100% (captured everything), the recall scores for each deployment were 82% (n=2/11 detection days missed from the subset), 67% (n=3/9), and 100% (n=0/9) for Grant Reefs, Kitty Coleman, and NW Lasqueti Island sites, respectively. The study region-wide recall for all three 2015-16 deployments combined was 92% (n=2/24).
Over all study years, recorders were active for a total of 494 unique calendar days between November and April. Killer whale detections occurred on 60% (n=298/494) of these days. Detection days, wherein at least one detection occurred at a minimum of one active recorder site, were most numerous for BKW (n=207; 42% of effort days), followed by SRKW (n=96; 19% of effort days), and NRKW (n=39; 8% of effort days). Our first study year (2015-16) had substantially fewer killer whale detection days (n=64/145, 44% of effort days) between November and April than subsequent study years (2016-17: n=113/168, 67% of effort days; 2017-18: n=121/181, 67% of effort days), but also had less effort with respect to number and duration of deployments (see Supplementary Figures 1–3).
SRKW were detected on 96 calendar days between November and April over our study period. These detections included all three SRKW pods. Of detection days where SRKW detections could be confidently identified to pod (n=84; 88% of SRKW days), 90% included J pod (n=76) and 49% included K and/or L pod (n=41), wherein K pod was definitively present at least 15 days, L pod was definitively present at least 7 days, and calling was too ambiguous to distinguish K pod from L pod on 23 days. Multi-pod detections were common: on 28% of SRKW days (n=27), J pod was detected with K and/or L pod, wherein J and K pods were definitively present together at least 5 days, J and L pods were definitively present together at least 3 days, J, K, and L pods were definitively present together at least 2 days, and calling was too ambiguous to distinguish K pod from L pod on 18 days. Of the 14 SRKW days that K and/or L pod was present without J pod, both K and L pod were definitively present together on 1 day; calling on the remainder of days was too ambiguous to determine whether both K and L pod were present or just one of the pods was.
NRKW were detected on 39 calendar days between November and April over our study period. All NRKW detections during that time were identified as A clan, specifically the A05 pod, with one additional A clan detection being too faint to differentiate between A04 or A05 pod. G clan was detected in our study area as well, but those detections occurred outside of our November to April analysis bounds.
The proportion of days with detections generally increased with the number of active sites (Figure 2). The information gained by adding more recorder sites, however, varied among populations, with more information being gained for BKW than for NRKW and SRKW. In some cases, the addition of recorder sites beyond the first one did not contribute much additional data (e.g., Nov 2015 – Feb 2016 for SRKW), which could imply that one site contributed most of the detections, or alternatively that detections were at multiple sites on the same days, therefore not changing the overall number of days with detection. In most cases, however, the curves clearly show the benefits of additional sites in documenting regional presence, with the number of days increasing for 2 and 3 sites before reaching a plateau.
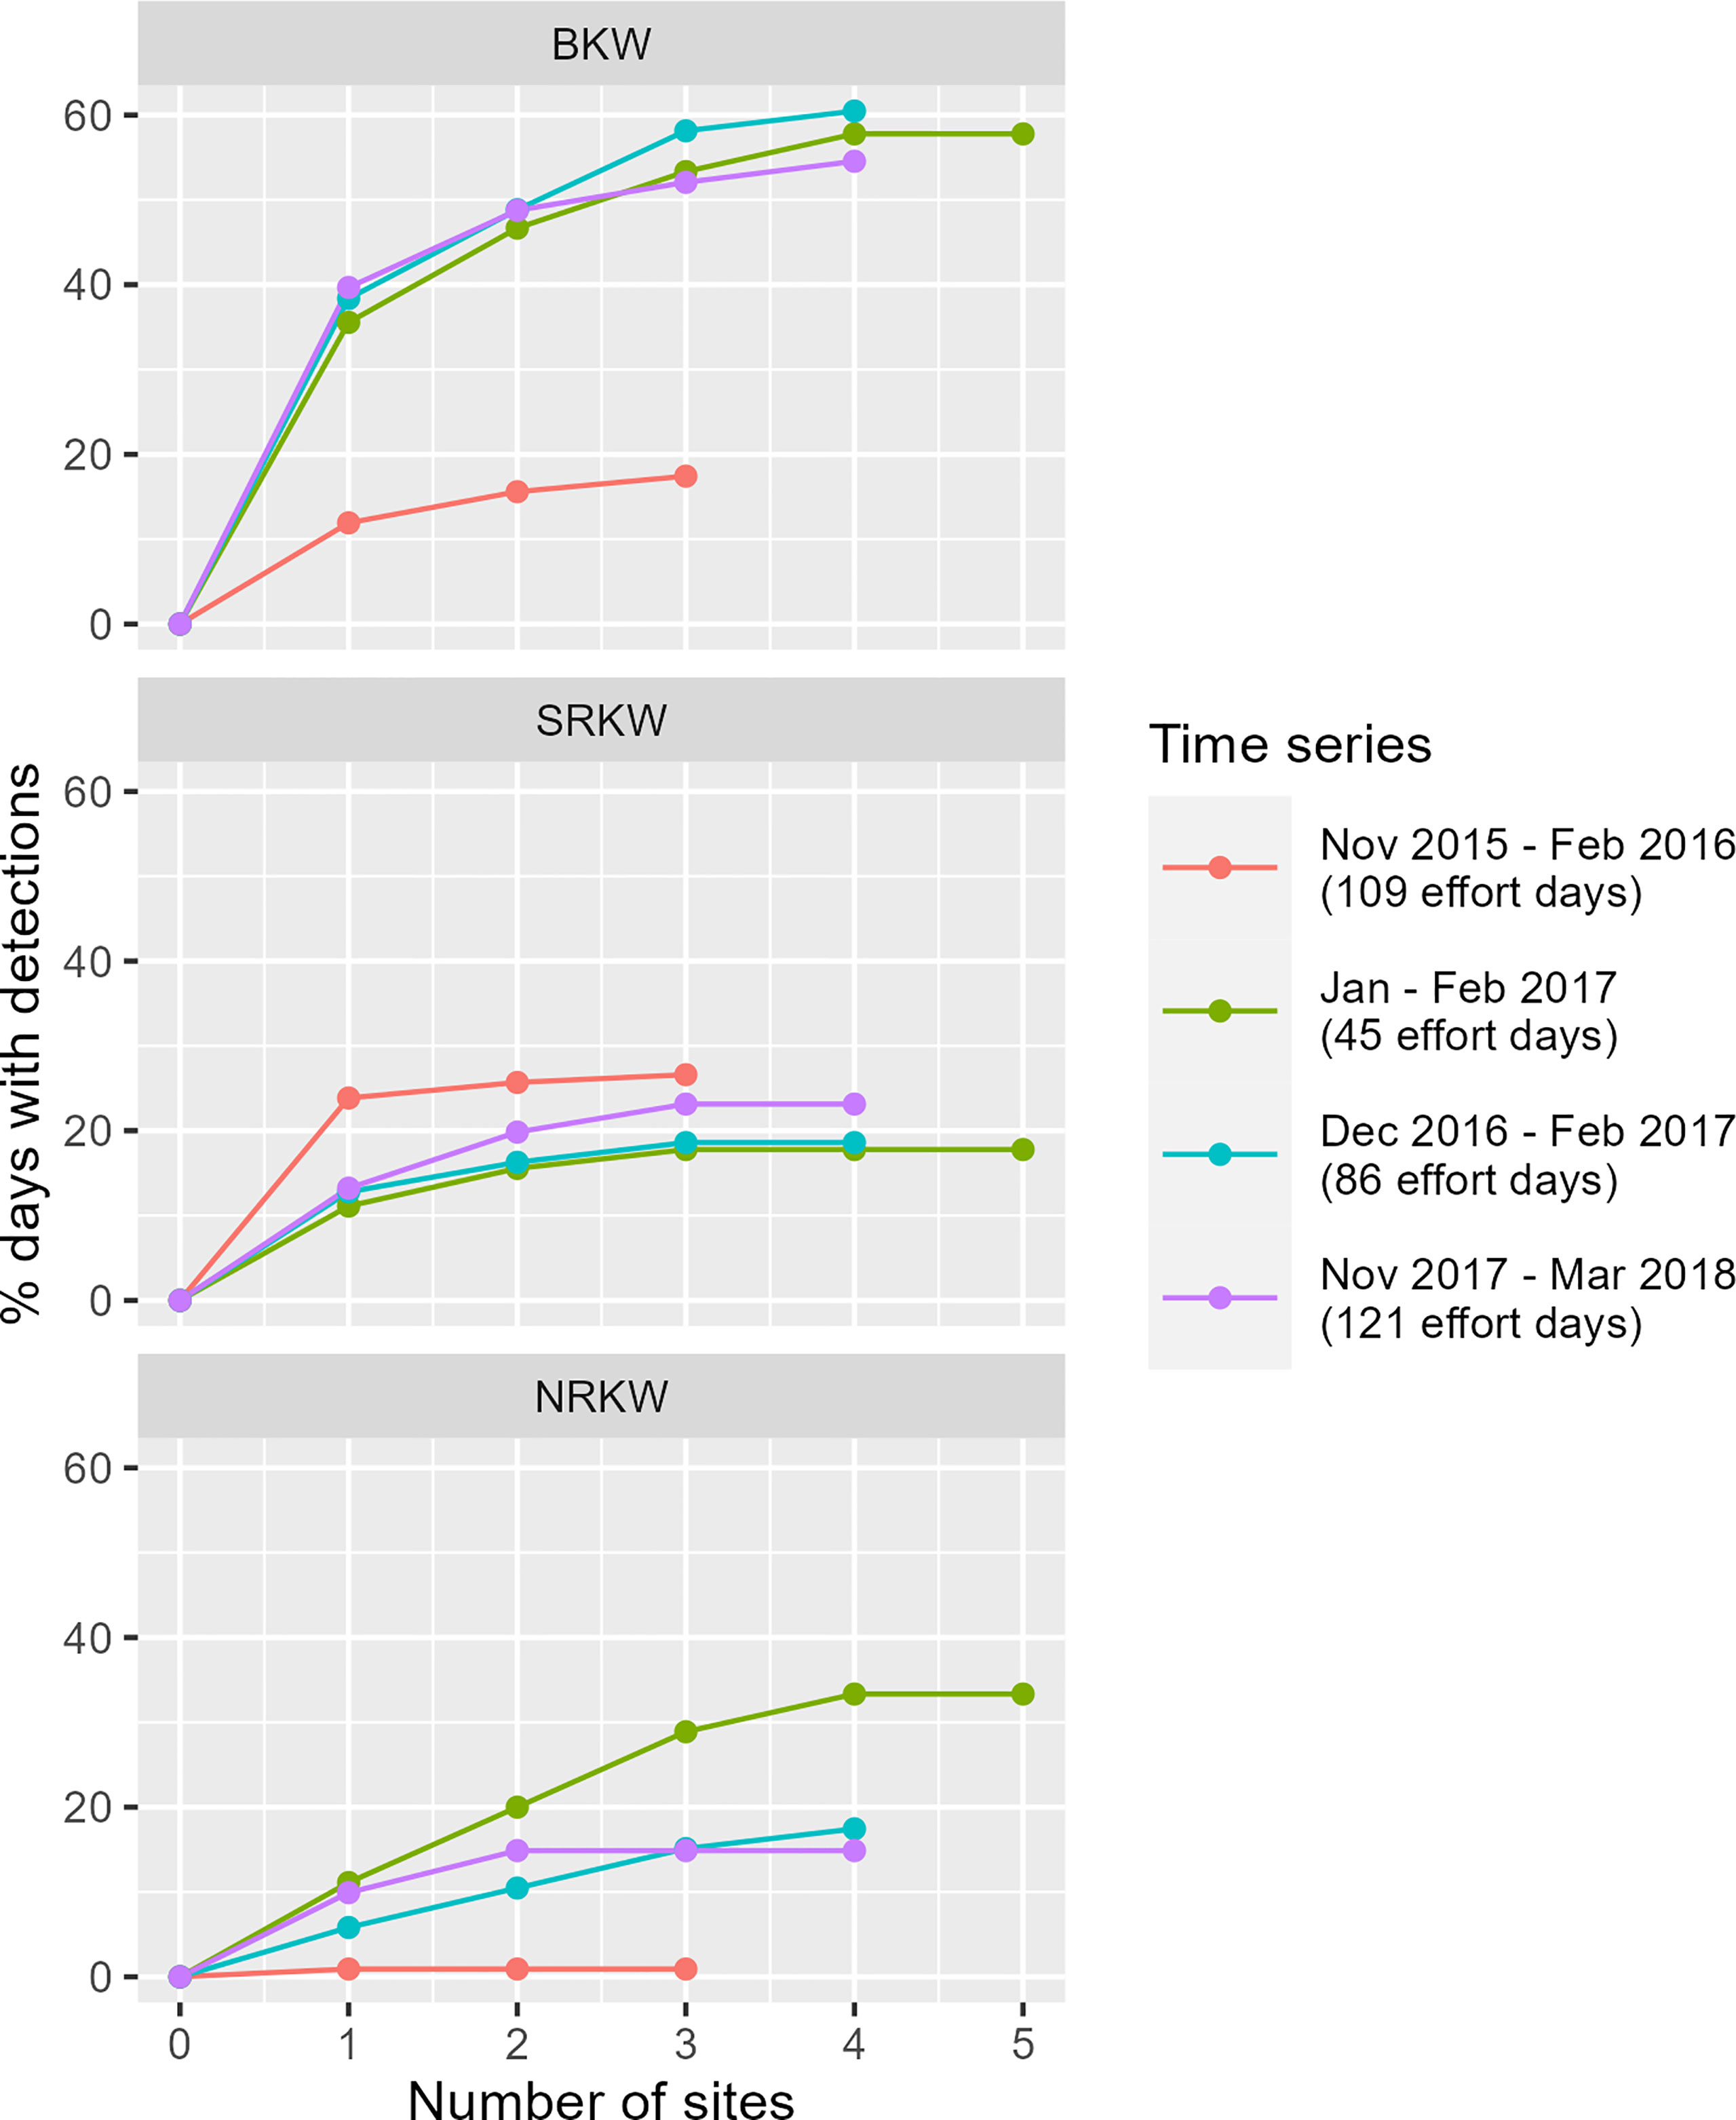
Figure 2 Contribution of active recorder sites to detection days during periods when three or more recorder sites were simultaneously and continuously active in the region. Sites were added step-wise in order maximizing unique DDPUE when pooled with previously added site(s). The x-value at which the curves plateau suggests the number of sites required to accurately capture the acoustic presence of the given population in the region.
Winter acoustic presence of SRKW was generally consistent throughout the study period according to unique DDPUE (χ2 = 1.49, p=0.48), though cumulative DDPUE showed a significant decrease in later study years compared to the first (χ2 = 29.15, p<0.001; Figure 3). This may be due to an actual decrease in acoustic presence in the study area or no-to-little acoustic presence in portions of the study area that saw additional recorder coverage in later study years. Both BKW and NRKW showed significantly greater acoustic presence in the last two study years compared to the first, according to both unique (BKW: χ2 = 40.96, p<0.001; NRKW: χ2 = 15.11, p<0.001) and cumulative DDPUE (BKW: χ2 = 43.57, p<0.001; NRKW: χ2 = 12.42, p=0.002).
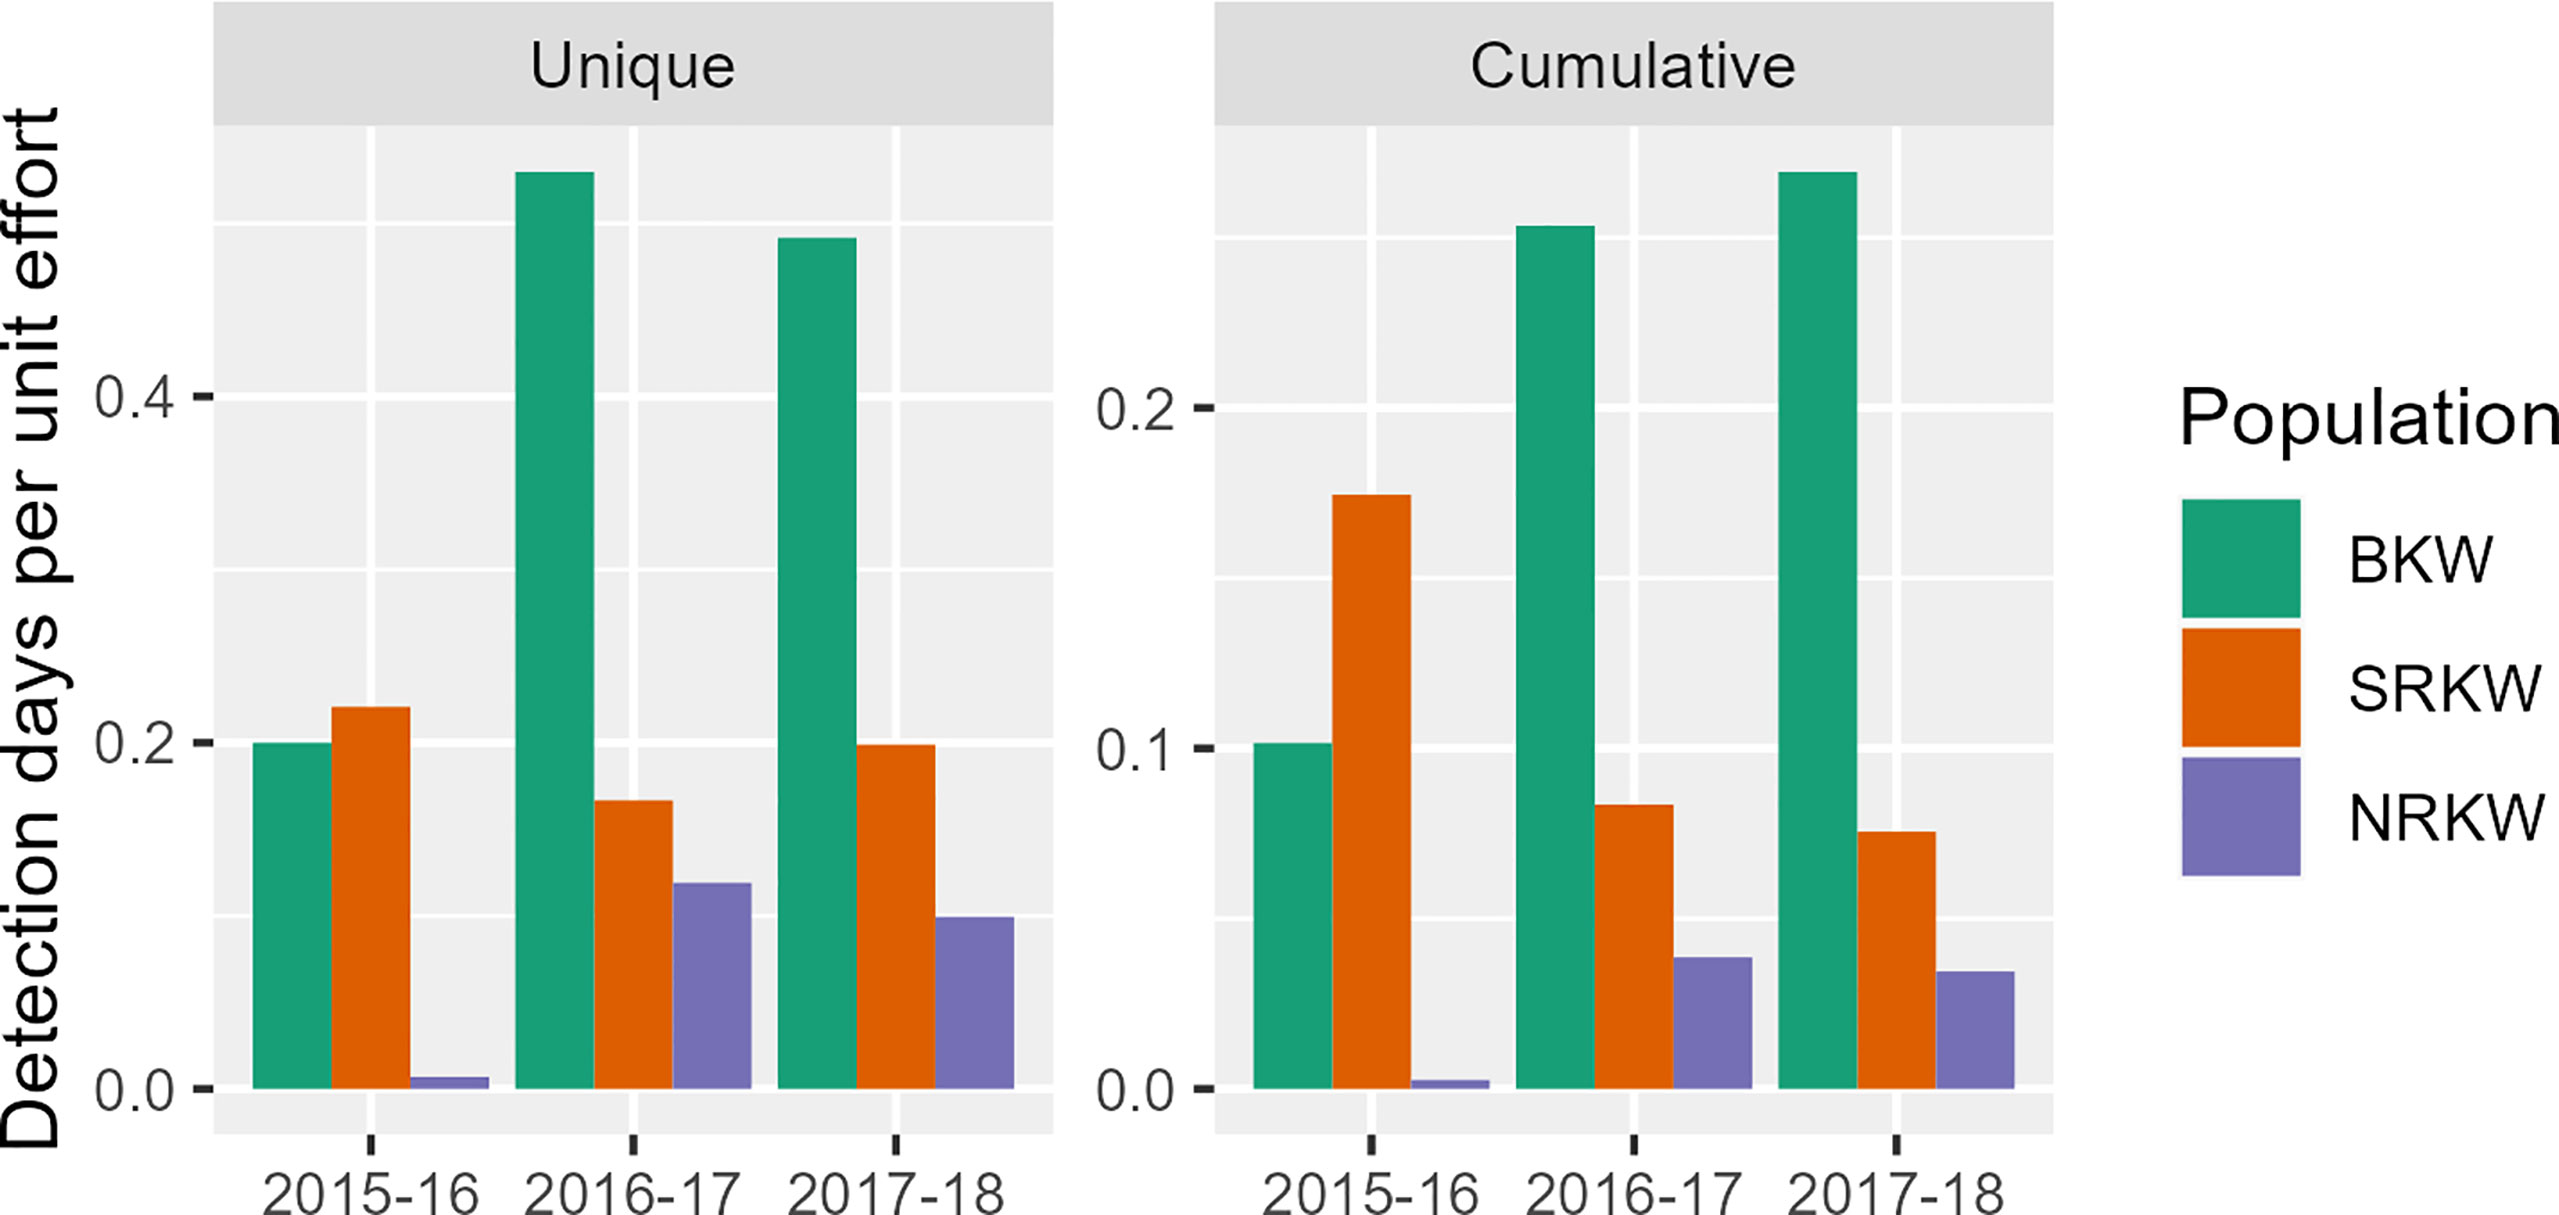
Figure 3 Annual detection days per unit effort for all killer whale populations acoustically detected from Nov-Apr in our study area, as dictated by unique (left) and cumulative (right) derivations of DDPUE.
Each killer whale population showed different seasonal trends in acoustic presence in our study area (Figures 4, 5) NRKW were detected most frequently in February, although their detection rates were highly variable. SRKW were generally more frequently detected earlier in the study year (in late fall, particularly November). BKW were detected relatively consistently throughout the winter months, though cumulative DDPUE suggested that BKW acoustic presence generally increased throughout the study year, to peak in April (Figure 5).
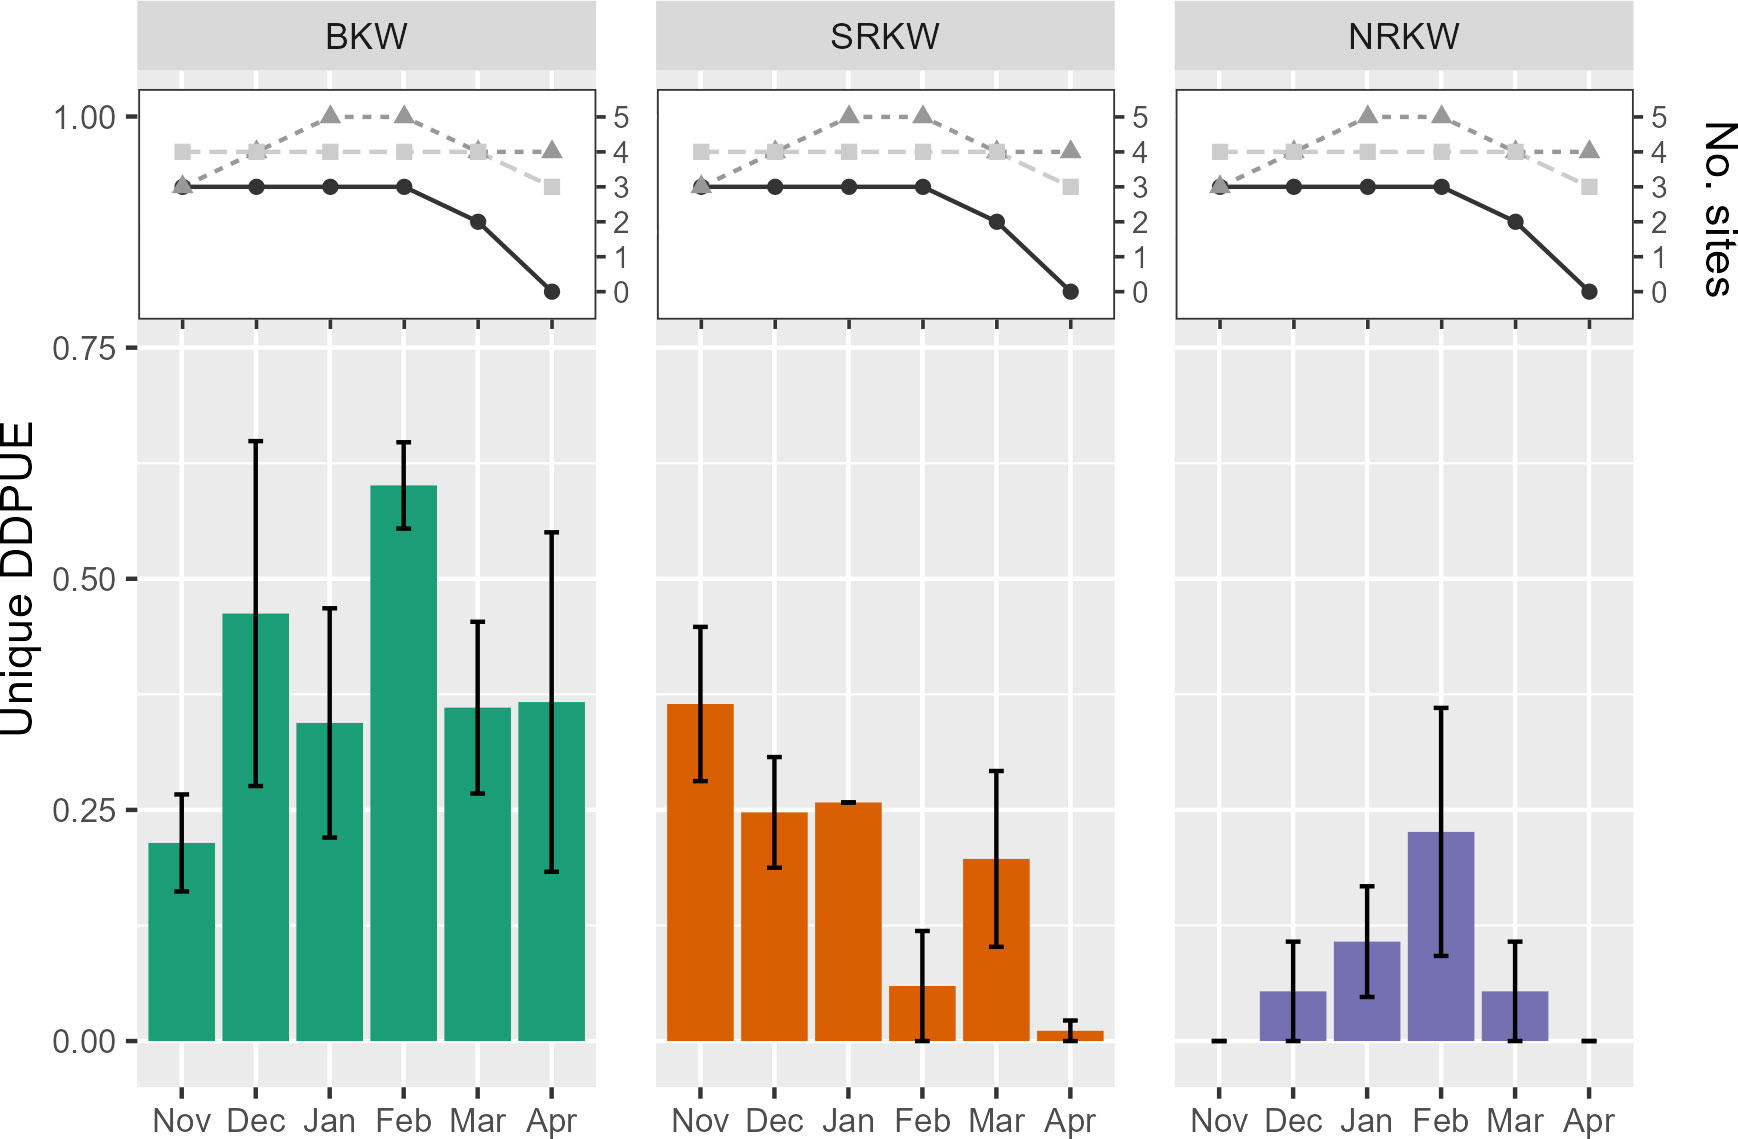
Figure 4 Unique detection days per unit effort for all detected killer whale populations. Bars indicate mean unique DDPUE across study years. Whiskers indicate standard error in unique DDPUE among study years. Number of hydrophones active each month noted in inset graphs, colored by study year: 2015-16 (black), 2016-17 (dark grey), and 2017-18 (light grey).
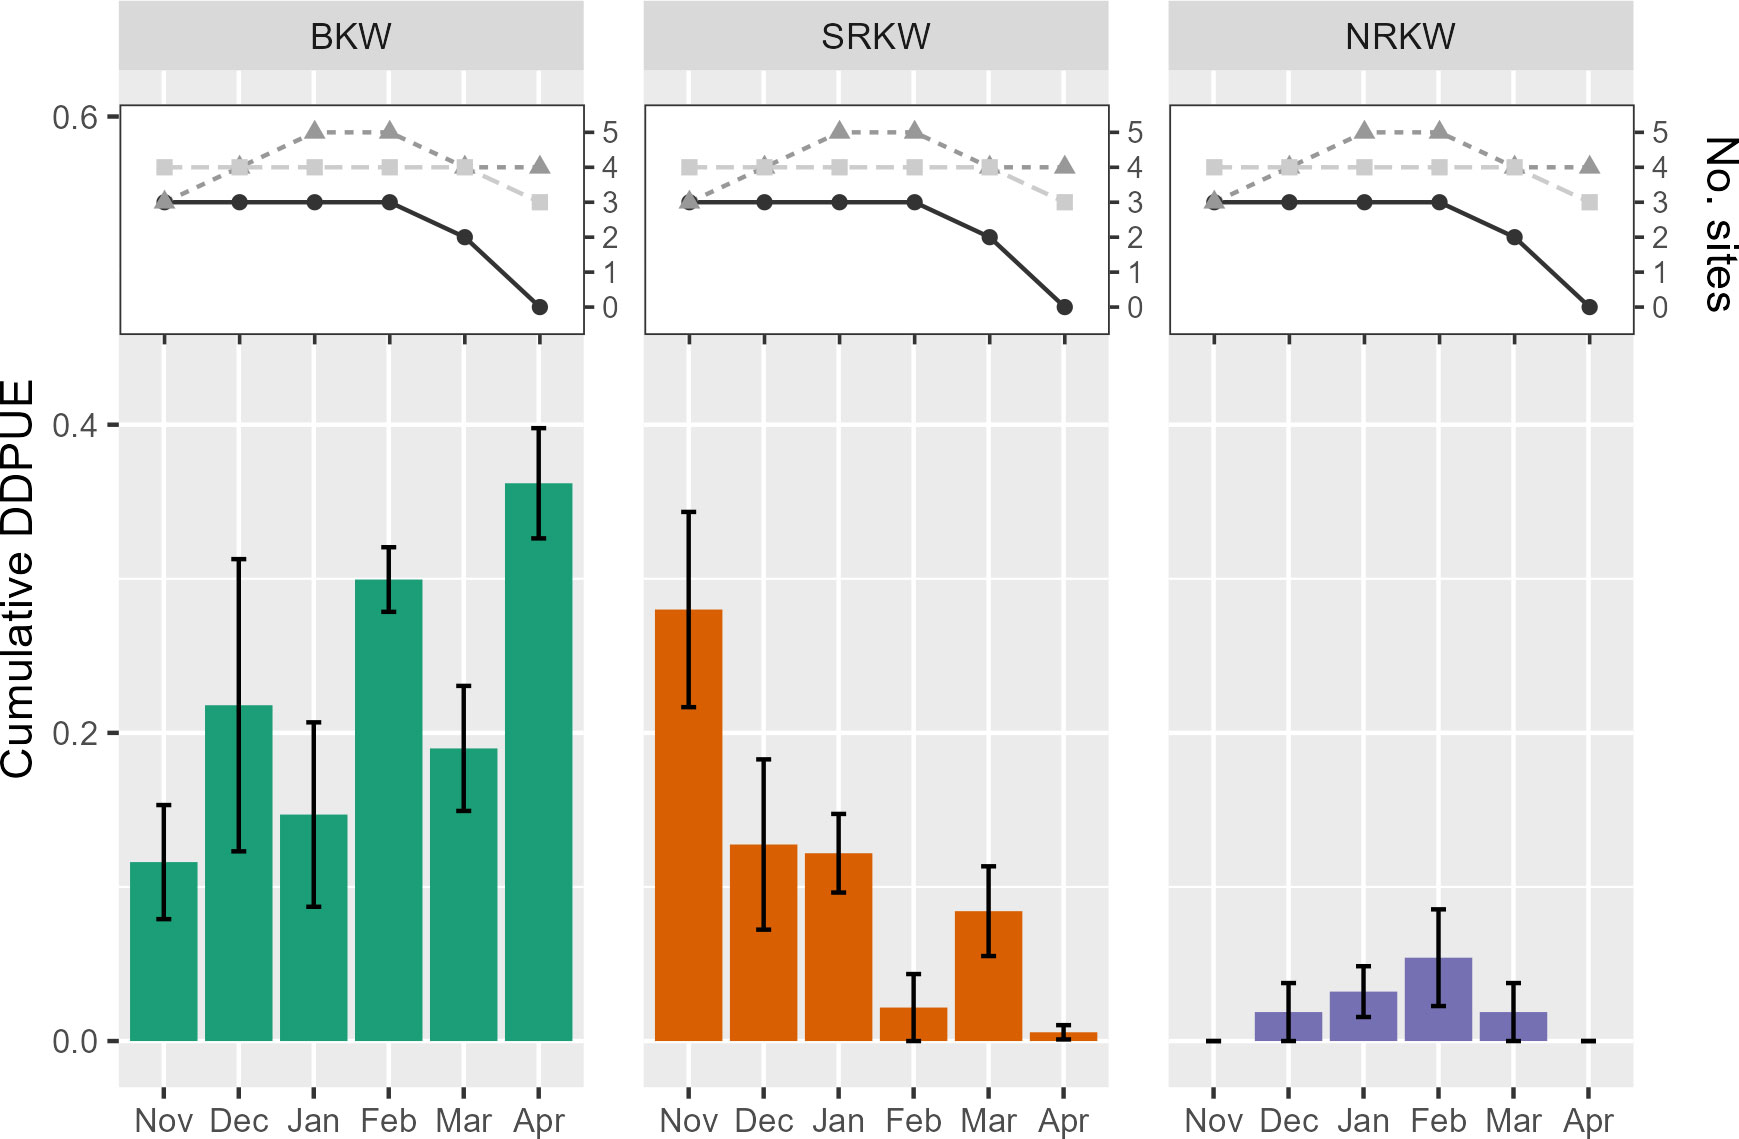
Figure 5 Cumulative detection days per unit effort for all detected killer whale populations. Bars indicate average unique DDPUE across study years. Whiskers indicate standard error in cumulative DDPUE among study years. Number of hydrophones active each month noted in inset graphs, colored by study year: 2015-16 (black), 2016-17 (dark grey), and 2017-18 (light grey).
Our residence models for site-specific LDR showed adequate fit for BKW and SRKW (i.e., better than the null model, with most R2 values above 0.4 or even 0.6); therefore their parameter estimates are considered of adequate confidence (Figure 6; Supplementary Table 2). Models for the NRKW population either did not converge due to paucity of data or showed a weak signal not significantly more informative than a null model.
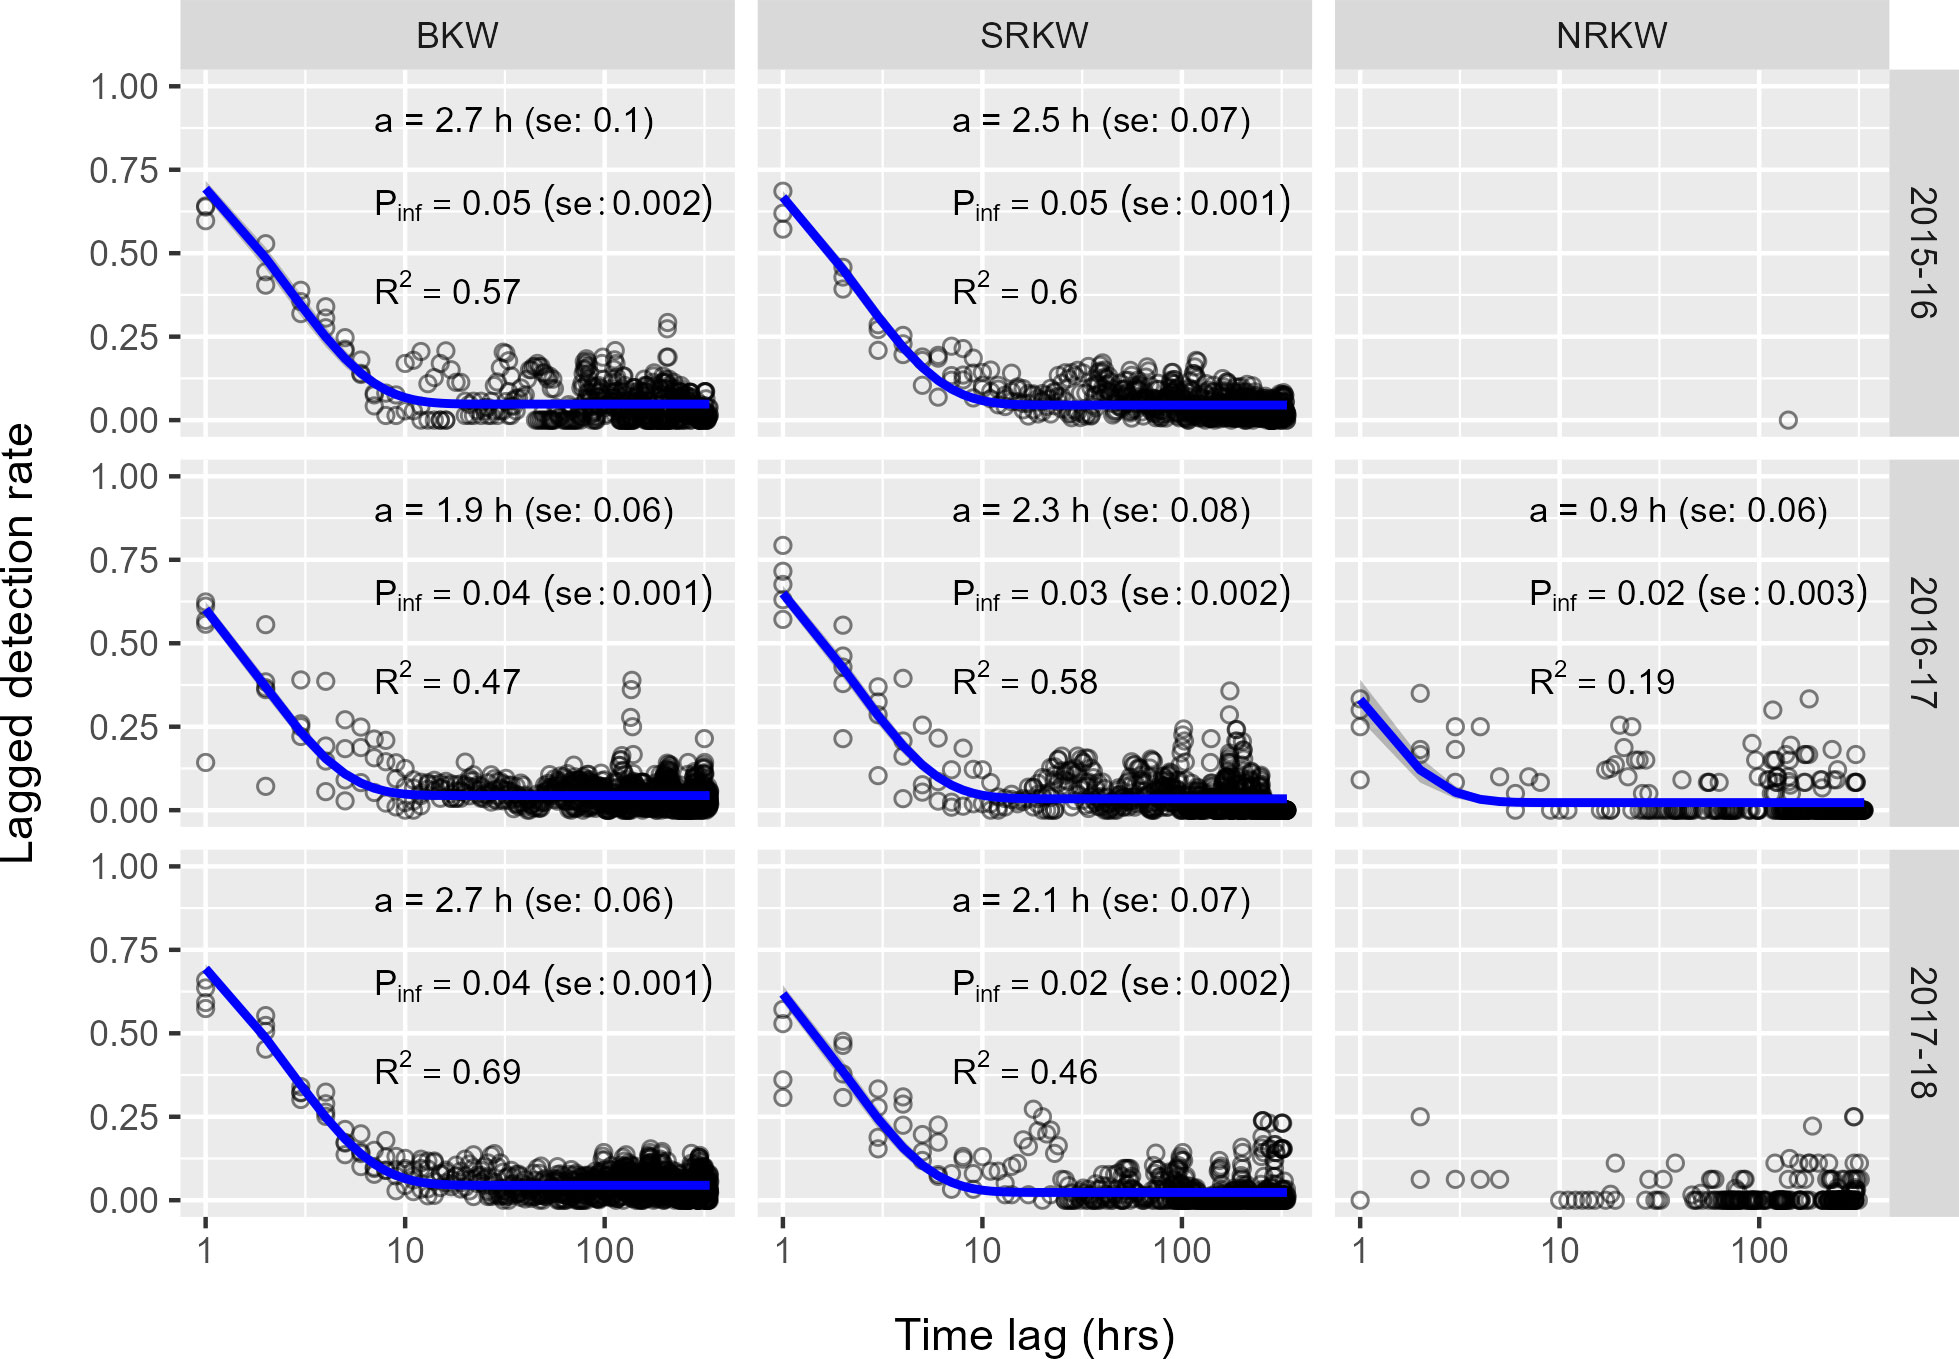
Figure 6 Hourly lagged detection rates at sites (black circles) and LDR values predicted by residence model (blue line) for all sites pooled. Annotations provide model estimates: mean time acoustically present at a given site, a, and the average probability of detecting a population at any given time, Pinf. R2 denotes pseudo-R2 value, where values > 0.2 are considered better fits than the null model. Time lags fitted by model capped at two weeks (336 h). Grey ribbon represents the 95% confidence band of the fitted model. Model fits and estimates not provided for data series for which a model was unable to converge (typically due to paucity of data).
Despite poor model fit, the LDR data show that NRKW exhibited the shortest acoustic residency at our recorder locations, often acoustically present for less than an hour (Figure 6). Variability in our estimates of NRKW residence time among sites was relatively small, with estimated mean residence times ranging from 0.8-1.5 h at a given recorder location. Variability among sites was greater in our estimates of time acoustically absent, where mean time absent before returning ranged from 1-4 days (see Supplementary Table 2). The estimated mean residence time for SRKW at our recorder locations remained relatively consistent over the three study periods, where they were typically acoustically present for roughly two hours at a given site and returned 2-4 days later. Mean BKW residence time at our recorder locations was generally greater than SRKW (roughly 2-3 h), with BKW typically returning to a given site 2-3 days later. These short residence times and longer absences meant that the average probability of detecting each population at any given site, , was low (5% or less). As recorder detection ranges varied among sites and years, depending on the recorder depth and prevailing oceanographic conditions, these estimates are best evaluated as a relative comparison among populations.
Regional residence models and estimates for BKW and SRKW showed adequate fit (Figure 6; Supplementary Table 2). Models for NRKW regional residence had poor fit (R2< 0.20) or could not be fitted. Our PAM detections indicate that the use of our study area as a whole noticeably differed among the three killer whale populations, and also differed from site-specific estimates of residency. At a regional level, the acoustic residence time of NRKW remained relatively stable over the three study periods, where they typically were acoustically detected in the study area for less than one day, returning after roughly 23-26 days, resulting in low , i.e., overall detection probability of 1-2% (Figure 7). SRKW typically were acoustically present in the study area much longer than NRKW, with mean residence times ranging from 2.3 to 8.5 days and LDR values remaining high at large time lags in stark contrast to NRKW. Residence estimates suggest that over the course of the three study periods, SRKW were acoustically present for increasingly shorter continuous periods, but would also return sooner; in 2015-16, SRKW were typically acoustically present in the area for more than one week, returning after roughly 2-2.5 months, while in 2017-18 they typically were present for just over two days in the area, returning roughly 4-6 weeks later, with values of decreasing from 12% in 2015-15 to 5% in 2017-18 (Figure 7).
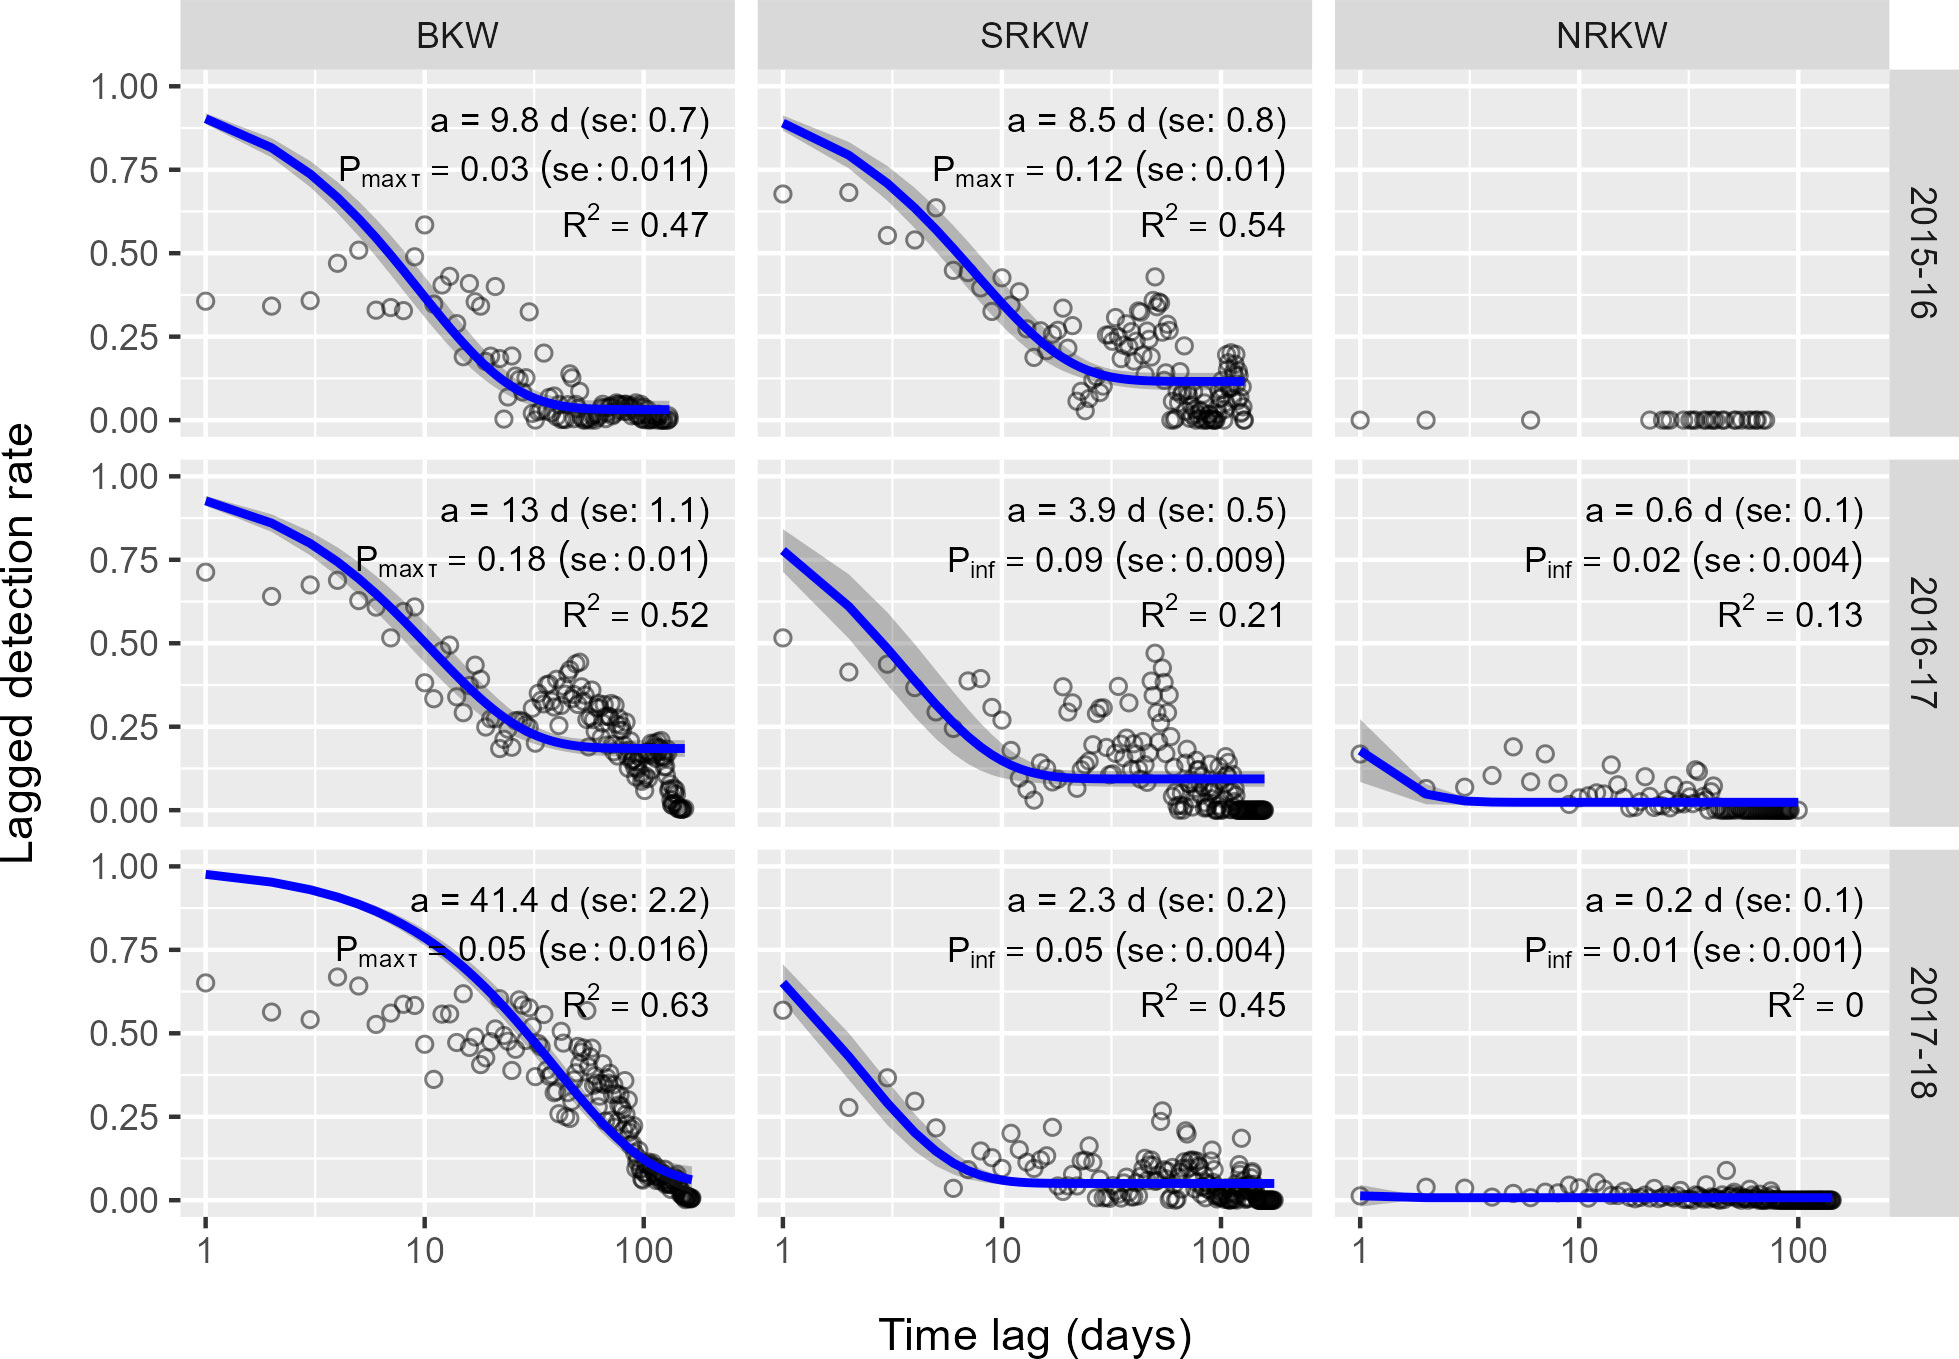
Figure 7 Daily lagged detection rates for the entire study area (black circles) and LDR values predicted by residence model (blue line). Annotations provide model estimates: mean time acoustically present within the study area, a, and the average probability of detecting a population at any given time, Pinf. Models for which Pinf is not reached within the range of observed values instead report Pmax τ, the probability of detecting a population after the maximum time lag observed in the given year. R2 denotes pseudo-R2 value, where values > 0.2 are considered better fits than the null model. Grey ribbon represents the 95% confidence band of the fitted model. Model fits and estimates not provided for data series for which a model was unable to converge (typically due to paucity of data).
BKW detections became increasingly common over the three study periods, and overall BKW regional residence time was the longest of all three populations. LDR values remained high at large time lags and the models suggest that the asymptote was not reached within the observation period. In 2015-16, BKW were generally present in the study area in very few continuous periods of roughly 10 days. During the following winter, their mean residence time increased to approximately 2 weeks, typically returning after 6-8 weeks, and in 2017-18, BKW were often continuously present for well over a month. As a result, values of (in this case, ) ranged from 3 to 18% (Figure 7). There is no prior baseline of residence times for these populations within the study area, which prevents comparison to longer-term norms or trends in usage of the area.
Across the study years, there was no statistically significant difference in detection rates among diel periods for SRKW (χ2 = 4.39, p=0.11) or NRKW (χ2 = 0.51, p=0.77). BKW detection rates varied significantly with time of day (χ2 = 12.17, p<0.01), due solely to differences between daytime and nighttime calling. BKW detection rates were significantly higher at night than during the day for all years of the study, though this difference was only statistically significant in 2017-18.
For each population, at least one recorder site showed significant differences between observed and expected detections (Figure 8). NRKW were detected significantly more than expected at Sinclair Bank, while both SRKW and BKW were detected there significantly less than expected. SRKW were also detected less than expected at McCall Bank and detected significantly more than expected at the Lasqueti Island recorder site.
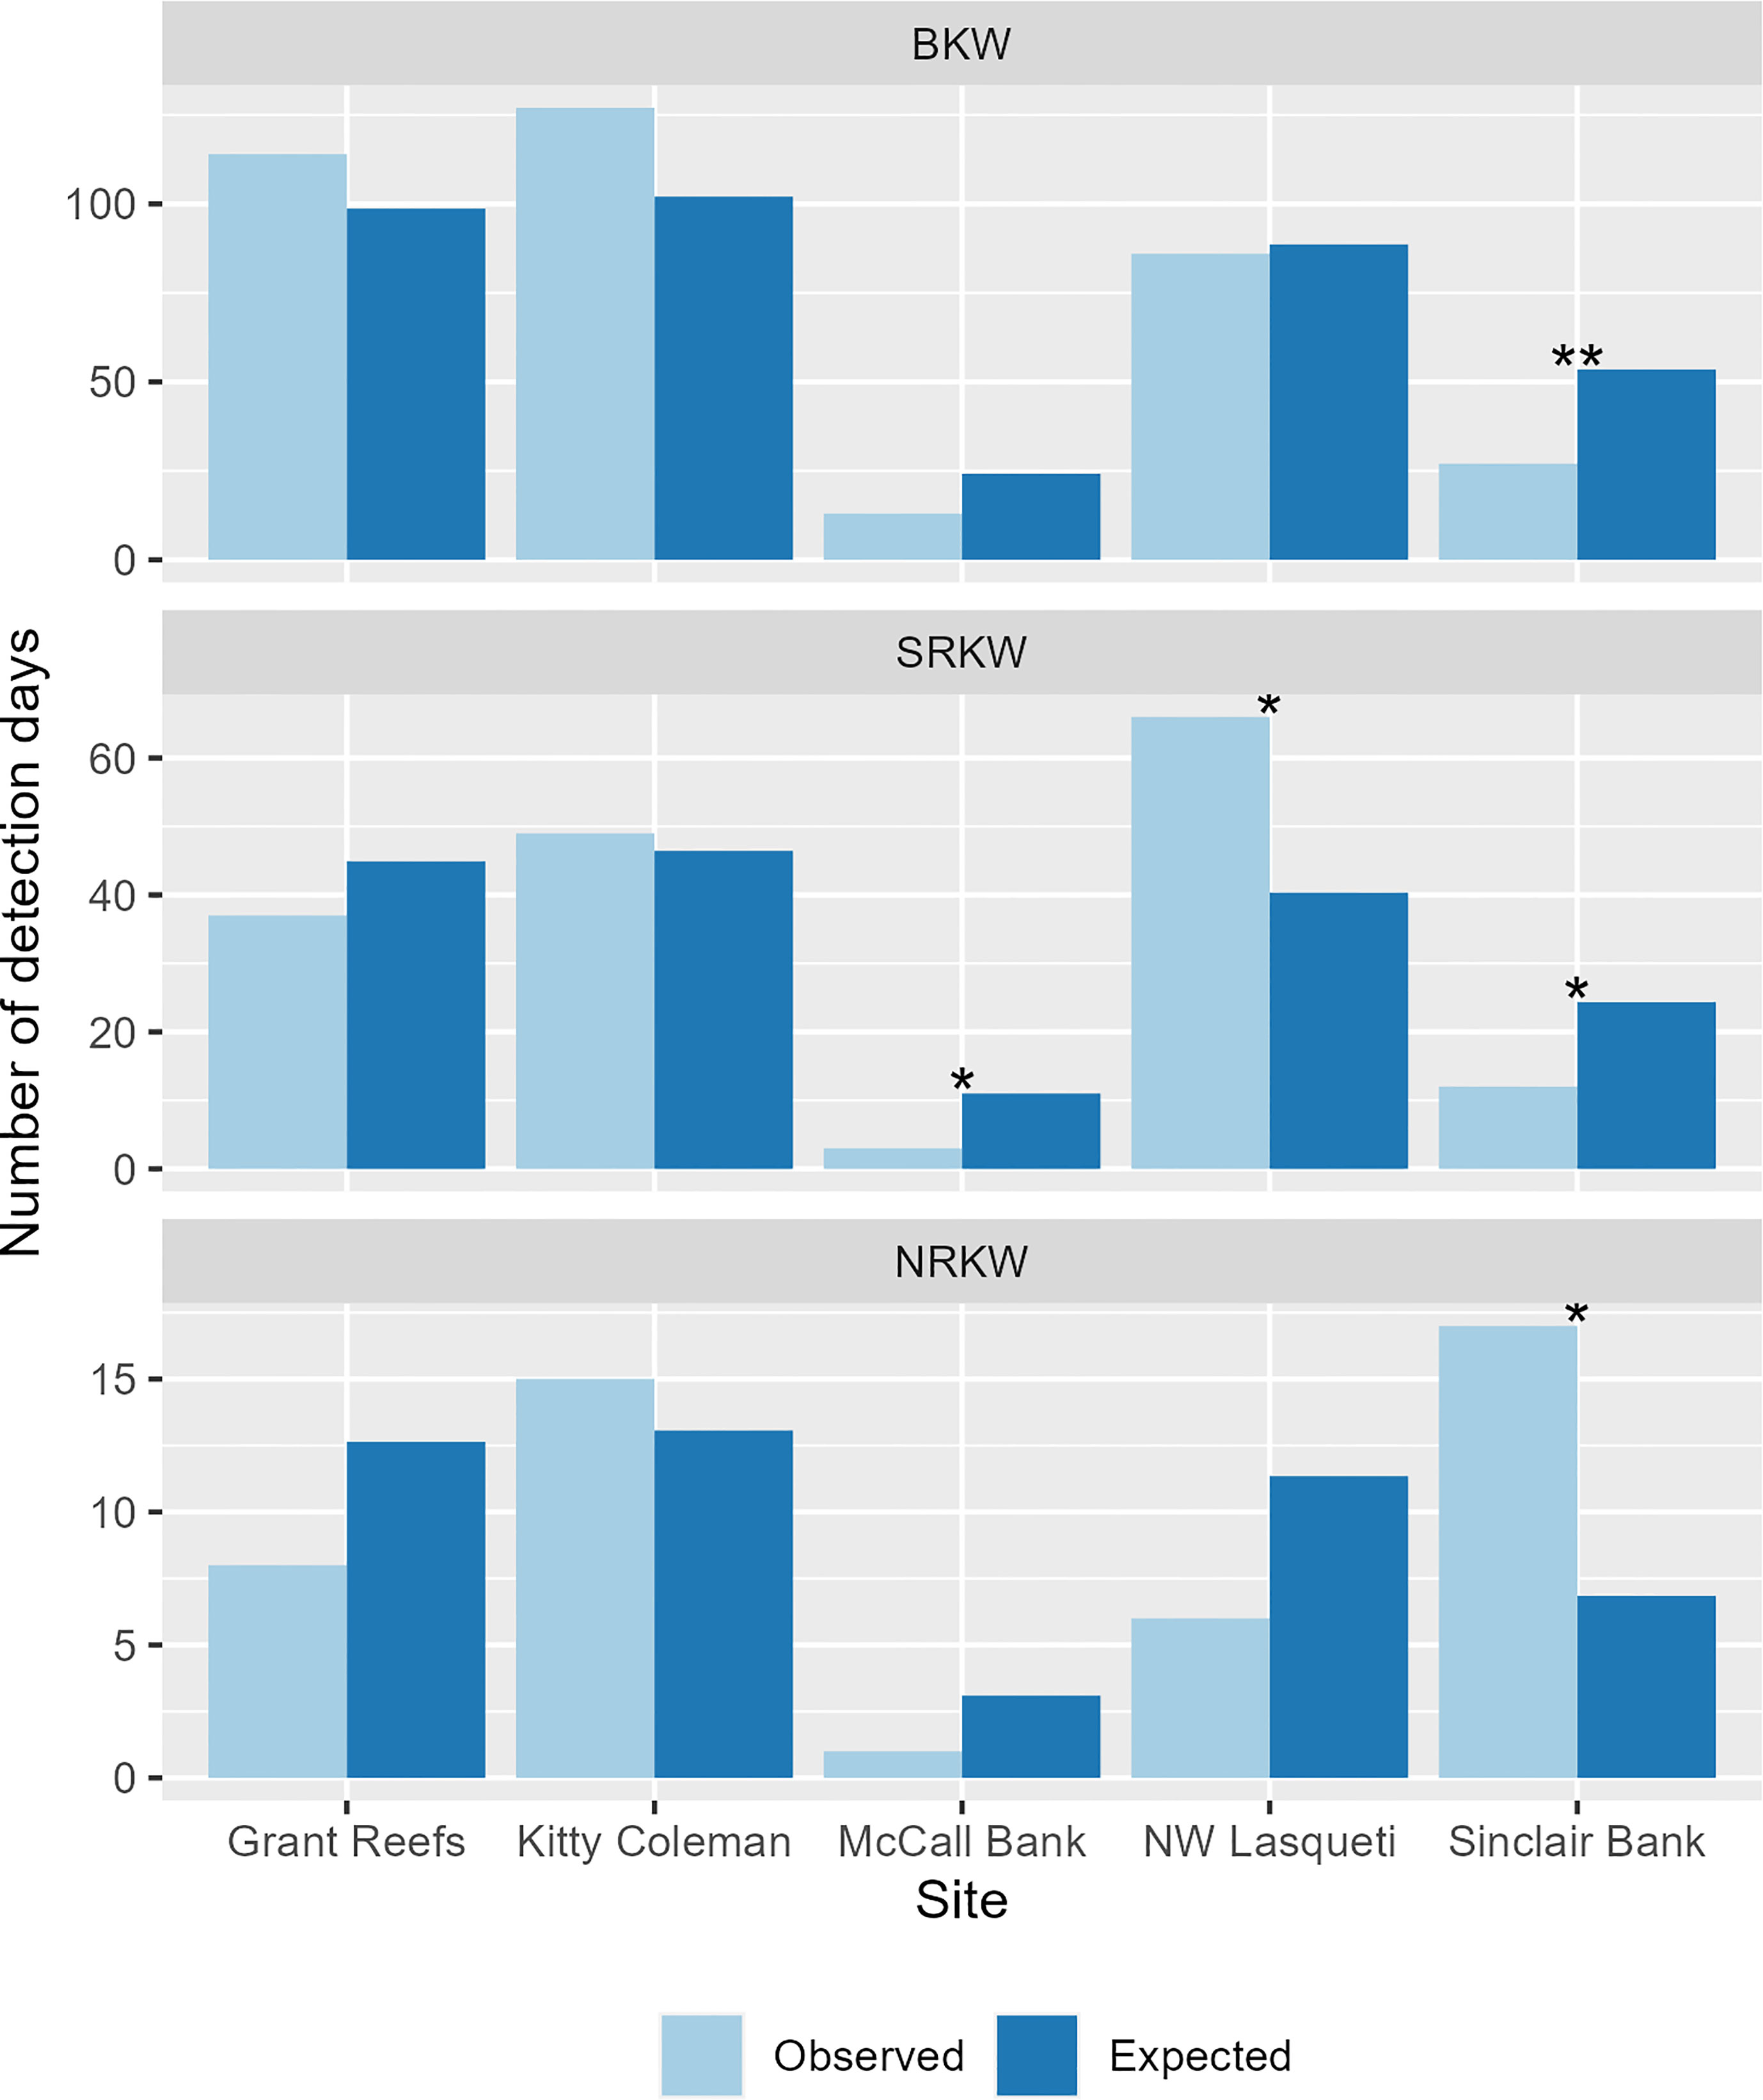
Figure 8 Number of observed and expected detection days at each site. Expected detection days were estimated by multiplying the total days of effort at the given site by the expected rate of detection for the given ecotype (total number of detection days for the ecotype in the study divided by the total number of effort days in the study). Statistically significant differences as determined by Chi-square testing noted with asterisks (* at 0.05 significance level; ** at 0.01 significance level).
Our multi-year PAM analysis shows that all three coastal populations of killer whales in British Columbia visit the northern Strait of Georgia (NSoG) in winter, BKW and SRKW extensively so. This corroborates previous historical and contemporary evidence of killer whales’ winter use of the area and provides a new line of quantitative evidence that the area is a frequently-used winter habitat for endangered SRKW. Although our ability to detect vocalizing whales was good overall (92% at the regional scale), our recall analysis did show that some days with killer whale presence were missed by the automated detector, and this pattern varied by deployment site. In addition to missed detections as a result of methods, it is also important to note that presence of a target species can only be established in PAM studies when animals vocalize and ambient noise levels are such that those vocalizations can be detected at a hydrophone location during the recording period of the duty cycle. Also, there is some evidence that RKW may spend considerably less time vocalizing during winter than in summer (Hanson et al., 2018). As a result, our results represent the minimum level of presence of killer whale populations in the region during our study.
The acoustic residency times and regular visits to the NSoG throughout winter by SRKW found in this study are supported by previous satellite tagging of SRKW. Hanson et al. (2017) identified three high-use areas for SRKW in winter, based on satellite tags deployed from 2012-2016: the west coast of Washington, western Juan de Fuca Strait, and the NSoG. Assuming tagged whales’ movements are reflective of their pod’s, members of J pod moved largely between the western entrance of Juan de Fuca Strait and the NSoG, whereas K and L pods spent most of their time between the western Juan de Fuca Strait and Point Reyes, California (Hanson et al., 2017). Pod-level differences were found in their winter movements and high-use areas, with minimal winter overlap between J pod and K and L pods. J pod spent the majority of their time in winter within the NSoG and western Juan de Fuca Strait, while K and L pod appeared to have a preference for waters off the Washington and Oregon coast, as well as western Juan de Fuca Strait. This same pattern of differential winter use of eastern and southern Vancouver Island waters by SRKW pods was first noted almost 50 years ago (Bigg et al., 1976). Our findings similarly indicate that though all three SRKW pods were present in the NSoG during winter, J pod was present most frequently (90% of SRKW detection days) and K and L pods less so (49% of SRKW detection days).
The prevalence of RKW in the NSoG in winter is likely driven by prey availability. NRKW and SRKW non-winter diet is primarily composed of salmon, with a strong preference for Chinook (Oncorhynchus tshawytscha) (Ford et al., 1998; Ford and Ellis, 2006; Ford et al., 2010; Hanson et al., 2010), which influence RKW seasonal movements (Nichol and Shackleton, 1996; McCluskey, 2006). RKW winter diet appears to remain focused on Chinook salmon (Hanson et al., 2021), therefore it is likely that their winter presence within the NSoG is also linked to the winter presence of Chinook salmon in the region. Within the NSoG, Chinook salmon from several stocks and age classes are present year-round, the majority from local Salish Sea stocks, with a large proportion of fish that appear to remain ‘resident’ to the area (Shelton et al., 2019; Freshwater et al., 2021; Quinn and Losee, 2022). The absolute winter abundance of Chinook in the region has not been estimated; however, the local abundance may remain relatively stable throughout the year, unlike other nearby regions that experience large changes in abundance and likely serve primarily as migratory corridors (e.g., northwest and southwest Vancouver Island, and Juan de Fuca Strait) (Freshwater et al., 2021). As the Strait of Georgia is known to be an important year-round Chinook nursery and rearing ground (Healey, 1983), a large portion of overwintering fish are relatively young (<3 years old) (Healey and Groot, 1987) and therefore smaller in size than the average fish encountered during summer or fall (due to both individual growth and an influx of older migratory fish during summer).
The winter diet of Chinook salmon caught in the NSoG is dominated by Pacific herring (Clupea pallasii) (Strait of Georgia Data Centre, 2021). Although ‘resident’ herring populations and young age-classes of herring reside in the Salish Sea year-round (Taylor, 1964; Hay and McCarter, 1999; Therriault et al., 2009), there is also a large seasonal influx of adult herring into the Salish Sea every fall that persists through the spring. These migratory adult herring spend winter in the Salish Sea and depart the region promptly after spawning in late winter/early spring to return to Vancouver Island’s west coast for the remainder of the spring and summer (Taylor, 1964; Therriault et al., 2009). Herring biomass in the NSoG is the highest of the monitored regions in BC, and has been consistently above average or increasing for the past decade (Boldt et al., 2021). Herring spawning events in the NSoG are recognized as the largest in British Columbia (Hay and McCarter, 2013), and the most consistent in the Strait of Georgia region since the 1990s (Therriault et al., 2009; Fisheries and Oceans Canada, 2021). The diversity of herring age classes, resident populations, and a large seasonal influx of migratory adult herring that stage over winter in the NSoG likely support and influence the presence and distribution of overwintering Chinook salmon in the region, which in turn likely explains the relatively high levels of Resident killer whale winter presence in the region we have documented in this study.
Overwintering Chinook appear to use the Salish Sea throughout winter for feeding (as opposed to migrating) (Maynard, 2019); therefore, their local movements in the region are likely influenced by the distribution and abundance of their prey. As a result, salmon abundance is less likely to be concentrated in predictable migratory bottlenecks, which may mean that Resident killer whales have to travel more extensively throughout the region to increase their likelihood of finding adequate quantities of prey during winter (especially if the whales eat a higher proportion of younger, and therefore smaller, fish in the area in winter; Hanson et al., 2021). This dynamic of whales moving widely and relatively transiently throughout the broader region but returning to the NSoG regularly could explain why Resident killer whale acoustic residency times tended to be relatively brief, but frequent, in the region during our study. It should be noted, however, that we also documented occasions of sustained use of the area by Resident killer whales for prolonged periods. There is a notable lack of available scientific information on the distribution, behavior, energy content, and abundance of Chinook salmon during winter in our study area. Such wintertime studies could provide meaningful insight into explaining the intra- and inter-annual occurrence and movements of Resident killer whales throughout winter here, and potentially lead to an understanding of the causes of inter-annual changes in usage, such as the potential decrease in annual SRKW DDPUE over our three-winter study. An understanding of the energy content of over-wintering Chinook salmon in particular would also improve our knowledge of the winter nutritional budget of Resident killer whales; currently, in-depth analyses of prey energy-density have only been examined for mature spawning-age fish caught in-river for runs not necessarily accessible to Resident killer whales during winter in coastal waters (O’Neill et al., 2014; Lerner and Hunt, 2023).
As with RKW presence in the NSoG, BKW winter presence may also be explained by the relative abundance and seasonal availability of their preferred prey in the region. BKW are highly mobile predators and forage year-round on a variety of marine mammal species in the coastal waters of British Columbia (BC), notably pinnipeds and small cetaceans (Baird and Dill, 1995; Baird and Dill, 1996). BKW seasonal movements and habitat use patterns likely reflect the distribution and seasonal abundance of these prey (Baird and Dill, 1995; Ford et al., 2013; Houghton et al., 2015; Shields et al., 2018). Pacific harbor seals (Phoca vitulina) appear to have recovered to pre-exploitation levels and/or reached carrying capacity within BC (Olesiuk, 2009; DFO, 2022), wherein the largest proportion of the population (42%) is found within the Strait of Georgia (DFO, 2022). Peaks in BKW occurrence correlate spatiotemporally with harbor seal pupping and post-weaning, which occurs from mid-August to late September off southeastern Vancouver Island (Baird and Dill, 1995; Ford et al., 2013). Acoustic presence in the NSoG during winter suggests foraging BKW are likely targeting adult and sub-adult harbor seals during this period. Likewise, the number of Steller sea lion (Eumetopias jubatus) rookeries and year-round haul-out sites in BC has increased, with a greater number of sea lions occurring in BC’s coastal waters in winter than in summer (DFO, 2021). Major year-round Steller sea lion haul-outs are located in the NSoG, including on the east side of Texada Island off Powell River and to the north of Texada Island, and several important winter haul-outs occur on the west side of Texada Island (DFO, 2021). Some of these haul-out locations coincide with areas identified in this study where BKW acoustic presence was greater than expected (Grant Reefs, Kitty Coleman), suggesting BKW may be taking advantage of the seasonal pulse of Steller sea lions in this region. Additionally, recent aerial surveys of over-wintering California sea lions (Zalophus californianus), another known BKW prey source, suggest their population size in BC has increased three-fold over the last decade, with peak seasonal occurrence in the Strait of Georgia in March (DFO, 2023). Of the small cetacean species known to be consumed by BKW, Pacific harbor porpoises (Phocoena phocoena), Dall’s porpoises (Phocoenoides dalli), and Pacific white-sided dolphins (Lagenorhynchus obliquidens), are all present throughout the year in the Strait of Georgia (Jefferson et al., 2016; McMillan et al., 2022). Harbor porpoise abundance is generally greater than Dall’s porpoise, and the two species differ in their timing of peak abundance (McMillan et al., 2022). Harbor porpoises exhibit a seasonal increase in abundance between April and November, peaking in autumn, in waters south of the NSoG (Hall, 2004; McMillan et al., 2022), while Dall’s porpoise abundance peaks in winter months in the same region (McMillan et al., 2022). Pacific white-sided dolphins are seasonally present in the inside coastal waters of BC, exhibiting broad offshore-inshore movement from summer to winter, resulting in peak presence in nearshore waters in BC during winter, including in the Strait of Georgia (Rechsteiner, 2012). The lack of small cetacean winter abundance data in our study area constrains our understanding of why BKW use the NSoG so extensively in winter, and therefore would greatly benefit from studies targeting this data gap.
The acoustic presence of SRKW and BKW in the study area showed roughly inverse trends, both in annual frequency of presence and residence time. While the number of SRKW detection days per unit effort appeared to have declined after the first winter, the number of BKW detection days was markedly higher in the last two winter periods compared to the first. Additionally, the average SRKW acoustic residence time in the study area became progressively shorter over the course of the three winter periods, while the average BKW acoustic residence time increased. Similar negative correlations between SRKW and BKW presence have been observed in the adjacent central Salish Sea in summer months (Shields et al., 2018). Although exploring potential causes of this relationship is beyond the scope of this study, we speculate that potential drivers could be ecotypic displacement (given that RKW and BKW observed in close proximity exhibit avoidance and, rarely, aggression; Ford et al., 2000), and/or indirect interactions between the two ecotypes, where ecosystem conditions impose inverse effects on the presence of each ecotype (Baird et al., 1992). For example, many prey species of BKW in the Salish Sea, such as harbor seals, Dall’s and harbor porpoises, and Pacific white-sided dolphins compete with Chinook salmon for mutual prey such as herring (Heise, 1997; Nichol et al., 2013; Thomas et al., 2022). High local densities of these BKW marine mammal prey may lessen RKW seasonal presence by reducing local Chinook availability, while attracting BKW to the area.
When acoustically present in the study area, NRKW were detected more often than expected in Malaspina Strait, east of Texada Island. NRKW detected in this study were represented only by the A05 pod, which accounts for roughly 5% of the NRKW population (Towers et al., 2020). The A05 pod appears to have an annual tradition of using the NSoG in winter going back to at least 1969 when 13 individuals from the group were the target of a live-capture event in Pender Harbor (off Malaspina Strait) on December 11th that saw the capture of six of the group’s individuals for the aquarium trade (Bigg et al., 1976; Colby, 2018). The A05 pod is consistently observed throughout winter in areas along the mainland coast in our study area and throughout the Discovery Islands archipelago, just north of our study area, including using several beaches in those areas for rubbing (DFO Cetacean Research Program, unpubl. data). This annual tradition of the A05 pod using the NSoG during winter, which has persisted for more than 50 years, highlights the area’s importance to these particular family groups.
The use of the Malaspina Strait area by SRKW and BKW on the other hand was notably infrequent during the study, while SRKW in particular appeared to show a preference for the waters west of Texada Island, as indicated by our Lasqueti Island recorder site. Similar intra- and inter-population patterns of spatial or temporal segregation have been found in several previous studies of killer whales in the North Pacific (Hauser et al., 2007; Yurk et al., 2010; Filatova et al., 2019; Myers et al., 2021). NRKW and SRKW, in particular, have exhibited seasonal segregation off southwestern Vancouver Island, where SRKW are more often found in the area during summer months, and NRKW are more prevalent in winter months (Ford et al., 2017; Riera et al., 2019), as well as apparent spatial (Emmons et al., 2021) and temporal (Rice et al., 2017) differences in habitat use off the west coast of Washington. In the NSoG, sites that were frequented by more than one population rarely experienced temporal acoustic overlap of multiple populations (Supplementary Figures 1–3).
Our PAM analysis revealed no significant difference in detections among times of day for NRKW and SRKW, but significantly more nighttime than daytime detections for BKW. This finding is consistent with previous acoustic studies that have shown similar nocturnal calling behavior in BKW (Deecke, 2003; Newman and Springer, 2008). BKW are thought to be stealth hunters that are not necessarily reliant on visual cues, but rather use passive listening to locate and hunt prey, and can therefore be very effective hunters at night (Barrett-Lennard et al., 1996; Deecke et al., 2013). Successful hunting events by BKW are often followed by substantial vocal activity, with calling rates greater than in any other BKW behavioral state (Deecke, 2003; Deecke et al., 2005; Saulitis et al., 2005; Riesch and Deecke, 2011). Both Deecke (2003) and Newman and Springer (2008) suggest that increased BKW vocal activity in nighttime hours might reflect significant feeding activity occurring during that time. The same may be occurring in our study area, where harbor seals tend to spend less time hauled-out on land during the night than during the day, particularly so in winter (Watts, 1991), and therefore may experience higher rates of predation by BKW at nighttime. Notably, similar trends in seasonal and diel harbor seal haul-out behavior have also been found in other global regions (e.g., Yochem et al., 1987; Hamilton et al., 2014), which may explain the broad geographic range over which similar BKW diel calling patterns have been observed.
Deploying multiple simultaneous recorders in this study initially, and primarily, served the purpose of providing broad spatial coverage of the region to increase the probability of detecting killer whales and to determine which particular areas in the region were used by the animals (e.g., Hanson et al., 2018). However, this approach also allowed us to explore the utility and efficacy of deploying a network of PAM devices to characterize the use of a given region, thus informing study design considerations. Using multiple simultaneous recorders in our study area provided additional information that changed our interpretation of how whales were using the region, but yielded diminishing returns as more recorder sites were added. The most information gained was for BKW, where additional recorders placed further afield captured additional BKW presence at relatively high rates, likely due to their prolonged residence times in the study area, their broad use of the study area, and their general nature to vocalize infrequently. The relatively lower calling rates of BKW suggest that with more recorders deployed over an area, one is more likely to capture a BKW vocal bout, should they use the area somewhat ubiquitously. Conversely, for the more vocal SRKW and NRKW populations, two recorders strategically positioned within the region would be expected to capture presence adequately, particularly for SRKW, which appeared to use the study region quite extensively on a daily scale. For populations that preferentially use a portion of a study area (which may be the case for NRKW on the east side of Texada Island), a greater number of recorders may be initially advantageous to identify these high use site(s) and capture their presence, but would not be expected to yield significantly more detections thereafter.
Although beneficial, using multiple simultaneous recorders can make it difficult to find a single metric to characterize a population’s use of an entire region, particularly if the number of recorders active in the region varies over the course of the study. Our first metric, the “unique DDPUE”, provides the proportion of days wherein a given population was detected, irrespective of the number of recorders that detected them, as an indicator of regional presence. Its advantage is that values may be interpreted in absolutes, as an indication of acoustic presence in an area (e.g., SRKW were acoustically present 25% of the time that there was some degree of effort in December). However, changes in the value of this metric could reflect either a true pattern (e.g., the population is using the sites more), or could reflect changes in the number of active sites (e.g., adding an site that the animals use as well). To mitigate this, we also calculated “cumulative DDPUE” to infer relative changes or trends in acoustic presence while accounting for variable effort over time. It is effectively a product of the proportion of effort days wherein detection(s) occurred (i.e., unique DDPUE) and the average proportion of recorders contributing to a given detection day, therefore allowing inference about the breadth of daily presence within the study area (i.e., whether animals are typically present at one or more recorder sites in a given day). Although providing complementary information, this metric does not distinguish frequency of occurrence and extent of occurrence (i.e., a value of 0.5 could indicate that the animals were present 100% of the time on 50% of the recorders or that they were present 50% of the time on 100% of the recorders).
Previous approaches to define killer whale ‘acoustic encounters’ have relied on reasonable but theoretical thresholds, estimated by typical speed of travel, ecotypic-specific calling rates and approximated site-specific detection ranges (Riera et al., 2013). Here, we propose a data-driven, mark-recapture approach to quantitatively describe the duration of killer whale acoustic encounters. This approach provides estimates of acoustic residency that are not reliant on theoretical assumptions, and has the additional advantages of being able to estimate the duration of acoustic absence (before ‘returning’), be flexibly applied to different recorder locations without site-specific parameterization, and can provide estimates at various spatial scales (i.e., site-specific or regional estimates of acoustic residency). While this data-driven approach was informative at the site-level, the use of multiple recorders in relatively close proximity to one another also improved our ability to characterize the use of the entire study area. This revealed that regional residence times for each population were much longer (on the scale of days to weeks, rather than hours) than they were at the site-specific scale, especially for BKW. Therefore this configuration of recorders, in combination with the mark-recapture approach using acoustic detections, allowed us to bridge the gap between shorter-duration encounters at smaller spatial scales, and the broader-scale residency patterns within the NSoG region. The geographic scope of this analysis could be broadened further to also include concurrent PAM efforts in Puget Sound and off southern Vancouver Island to describe SRKW winter residency of the entire Salish Sea region over the study period.
In this study, we provide multi-year evidence showing that three killer whale populations use the northern Strait of Georgia off Canada’s west coast during the winter season. This contributes to addressing the long-standing knowledge gaps related to killer whale winter habitat use patterns in BC waters, particularly in an understudied region. Our findings, when combined with several other lines of evidence (e.g., satellite tagging: Hanson et al., 2017; opportunistic sightings: Bigg et al., 1976; Olson et al., 2018), demonstrate that SRKW rely on the entirety of the Salish Sea year-round. Winter use of the NSoG by SRKW, notably J pod members, has persisted for at least 50 years, suggesting this area is of enduring importance to the population, supporting annual life-history functions.
To date, available information on SRKW habitat use and advice to management to inform threat mitigation and other conservation measures for this population has been primarily focused on summer. Our data offer a strong line of scientific evidence to advise recovery efforts to protect SRKW throughout winter months. Management measures aimed at mitigating threats to SRKW, including fisheries closures and vessel slowdown zones, have been focused in established SRKW critical habitat during summer. However, protection efforts may be particularly crucial during the winter period when foraging opportunities for Chinook salmon are reduced compared to the summer season, as reflected in the seasonal decline of SRKW body condition (Fearnbach et al., 2020; Stewart et al., 2021). Additional management options, such as the expansion of SRKW critical habitat protection under Canada’s Species At Risk Act to include the waters of the NSoG, greater consideration for acoustic mitigation and the implementation of fisheries management measures that consider the seasonally important areas and prey described herein, may therefore be important for the recovery of this population.
Our findings provide a clear scientific basis with which to evaluate spatiotemporal overlap between at-risk killer whales and anthropogenic threats in the NSoG. For example, noise exposure risks from naval practices exist in the NSoG, with two military practice areas periodically active throughout the year in the region. The whales’ regular presence here increases the probability of negative interactions, and indeed our data revealed periods where both killer whales and military sonar were detected simultaneously or in close temporal proximity. Continued acoustic monitoring in areas of importance for these at-risk populations, especially during periods of lower visual effort, will be of high value for their science-based conservation and management.
The data is now published in a publically accessible online repository at the following link: https://open.canada.ca/data/en/dataset/9dab95ae-9fc1-4996-a56e-ce4b98377978.
Ethical review and approval was not required for the animal study because passive acoustic monitoring, by definition, is conducted without any direct or indirect interactions with the study subjects.
JF and JP were responsible for the conception and design of the study. JP undertook the maintenance, deployment and retrieval of all recording devices used for this study. ES assisted in instrument deployment and retrieval. JP and JF performed acoustic analysis of recordings, validation of detections, and data entry. All authors contributed to the data analysis design and the interpretation of results. ES performed the statistical analyses, and generated manuscript tables and figures. ES, JP, KG and TD-V wrote sections of the manuscript. All authors read and approved the submitted version.
This work was primarily funded by the Species-at-Risk Program at Fisheries and Oceans Canada, with additional support from Canada’s Oceans Protection Plan Marine Environmental Quality program.
We thank Robin Abernethy, Caitlin Birdsall, Graeme Ellis, Kai Meyer, Lisa Spaven and Brianna Wright for their assistance in the deployment and retrieval of recorders used in this study. Additionally, we are very grateful to Ali Bowker, Kai Meyer and Miguel Neves dos Reis for contributing to the acoustic analysis of detections and data entry for this study. Thanks to Cameron Freshwater for discussions and suggestions regarding winter presence of Chinook salmon in the Strait of Georgia. Thank you also to Christie McMillan and the reviewers for providing comments on earlier versions of this manuscript.
The authors declare that the research was conducted in the absence of any commercial or financial relationships that could be construed as a potential conflict of interest.
All claims expressed in this article are solely those of the authors and do not necessarily represent those of their affiliated organizations, or those of the publisher, the editors and the reviewers. Any product that may be evaluated in this article, or claim that may be made by its manufacturer, is not guaranteed or endorsed by the publisher.
The Supplementary Material for this article can be found online at: https://www.frontiersin.org/articles/10.3389/fmars.2023.1204908/full#supplementary-material
Agresti A. (2007). An introduction to categorical data analysis. 2nd ed (New York, NY: John Wiley & Sons), 38.
Baird R. W., Abrams P. A., Dill L. M. (1992). Possible indirect interactions between transient and resident killer whales: implications for the evolution of foraging specializations in the genus Orcinus. Oecologia 89, 125–132. doi: 10.1007/BF00319024
Baird R. W., Dill L. M. (1995). Occurrence and behaviour of transient killer whales: seasonal and pod-specific variability, foraging behaviour, and prey handling. Can. J. Zool. 73, 1300–1311. doi: 10.1139/z95-154
Baird R. W., Dill L. M. (1996). Ecological and social determinants of group size in transient killer whales. Behav. Ecol. 7, 408–416. doi: 10.1093/beheco/7.4.408
Barlow D. R., Klinck H., Ponirakis D., Holt Colberg M., Torres L. G. (2022). Temporal occurrence of three blue whale populations in New Zealand waters from passive acoustic monitoring. J. Mammal. 104, 29–38. doi: 10.1093/jmammal/gyac106
Barrett-Lennard L., Ford J. K. B., Heise K. A. (1996). The mixed blessing of echolocation: differences in sonar use by fish-eating and mammal-eating killer whales. Anim. Behav. 51, 553–565. doi: 10.1006/anbe.1996.0059
Bigg M. A., MacAskie I., Ellis G. (1976). Abundance and movements of killer whales off eastern and southern Vancouver Island with comments on management (Ste. Anne de Bellevue, Quebec: Arctic Biological Station), 20.
Bigg M. A., Olesiuk P. F., Ellis G. M., Ford J. K. B., Balcomb K. C. (1990). Social organization and genealogy of resident killer whales (Orcinus orca) in the coastal waters of British Columbia and Washington State. Rep. Int. Whaling Commun. 12, 383–405.
Boldt J., Javorski A., Chandler P. E. (2021). State of the physical, biological and selected fishery resources of Pacific Canadian marine ecosystems in 2020. DFO Can. Tech. Rep. Fish. Aquat. Sci. 3434. doi: 10.23849/npafctr17/1.7
Burnham R. E., Duffus D. A., Mouy X. (2019). The presence of large whale species in Clayoquot Sound and its offshore waters. Cont. Shelf Res. 177, 15–23. doi: 10.1016/j.csr.2019.03.004
Burnham R. E., Palm R. S., Duffus D. A., Mouy X., Riera A. (2016). The combined use of visual and acoustic data collection techniques for winter killer whale (Orcinus orca) observations. Global Ecol. Cons. 8, 24–30. doi: 10.1016/j.gecco.2016.08.001
Center for Whale Research (2016) J32 preliminary necropsy report. Available at: https://www.whaleresearch.com/j32-report (Accessed February 20, 2023).
Colby J. M. (2018). Orca: how we came to know and love the Ocean’s greatest predator (New York, NY: Oxford University Press).
Dahlheim M. E., Schulman-JaNiger A., Black N., Ellifrit D. K. (2008). Eastern temperate North Pacific offshore killer whales (Orcinus orca): occurrence, movements, and insights into feeding ecology. Mar. Mammal Sci. 24, 719–729. doi: 10.1111/j.1748-7692.2008.00206.x
Deecke V. B. (2003). The vocal behaviour of transient killer whales (Orcinus orca): communicating with costly calls (PhD. St. Andrews, Scotland: University of St. Andrews).
Deecke V. B., Ford J. K., Slater P. J. (2005). The vocal behaviour of mammal-eating killer whales: communicating with costly calls. Anim. Behav. 69, 395–405. doi: 10.1016/j.anbehav.2004.04.014
Deecke V. B., Shapiro A. D., Miller P. J. (2013). “Killers in the dark—Acoustic evidence for night-time predation by mammal-eating killer whales (Orcinus orca) in Alaska,” in 166th meeting of the acoustical society of america (San Francisco, CA: Journal of the Acoustical Society of America).
Delarue J. J.-Y., Moors-Murphy H., Kowarski K. A., Davis G. E., Urazghildiiev I. R., Martin S. B. (2022). Acoustic occurrence of baleen whales, particularly blue, fin, and humpback whales, off eastern Canad-2017. Endanger. Species Res. 47, 265–289. doi: 10.3354/esr01176
DFO (2017). “Action plan for the northern and southern resident killer whale (Orcinus orca) in Canada,” in DFO species at risk act action plan series, 33.
DFO (2021). “Trends in abundance and distribution of Steller sea lions (Eumetopias jubatus) in Canada,” in DFO can. Sci. Advis. Sec. Sci. Advis. Rep, vol. 2021/035. , 8.
DFO (2022). “Stock assessment of Pacific harbour seals (Phoca vitulina richardsi) in Canada in 2019,” in DFO can. Sci. Advis. Sec. Sci. Advis. Rep, vol. 2022/034. , 10.
DFO (2023). “California seal lion abundance estimation in Canad-21,” in DFO can. Sci. Advis. Sec. Sci. Advis. Rep.
Emmons C. K., Hanson M. B., Lammers M. O. (2021). Passive acoustic monitoring reveals spatiotemporal segregation of two fish-eating killer whale Orcinus orca populations in proposed critical habitat. Endanger. Species Res. 44, 253–261. doi: 10.3354/esr01099
Fearnbach H., Durban J. W., Barrett-Lennard L. G., Ellifrit D. K., Balcomb K. C. (2020). Evaluating the power of photogrammetry for monitoring killer whale body condition. Mar. Mammal Sci. 36, 359–364. doi: 10.1111/mms.12642
Filatova O. A., Shpak O. V., Ivkovich T. V., Volkova E. V., Fedutin I. D., Ovsyanikova E. N., et al. (2019). Large-scale habitat segregation of fish-eating and mammal-eating killer whales (Orcinus orca) in the western North Pacific. Polar Biol. 42, 931–941. doi: 10.1007/s00300-019-02484-6
Fisheries and Oceans Canada (2018). “Recovery strategy for the Northern and Southern resident killer whales (Orcinus orca) in Canada,” in DFO species at risk act recovery strategy series, 84.
Fisheries and Oceans Canada (2019) Necropsy results: Southern Resident Killer Whale J34. Available at: https://www.pac.dfo-mpo.gc.ca/fm-gp/mammals-mammiferes/whales-baleines/j34-eng.html (Accessed February 20, 2023).
Fisheries and Oceans Canada (2021) Herring spawn density, general location and spawn index of mature spawning biomass. Available at: https://www.arcgis.com/apps/dashboards/c1812e5d016e47fbbab0deff33c50ea (Accessed March 3, 2023).
Ford J. K. B. (1987). A catalogue of underwater calls produced by killer whales (Orcinus orca) in British Columbia. DFO Can. Data Rep. Fish. Aquat. Sci. 633, 165.
Ford J. K. B. (1991). Vocal traditions among resident killer whales (Orcinus orca) in coastal waters of British Columbia. Can. J. Zool. 69, 1454–1483. doi: 10.1139/z91-20
Ford J. K. B. (2006). An assessment of critical habitats of resident killer whales in waters off the Pacific coast of Canada. DFO Can. Sci. Adv. Sec. Res. Doc. 2006/072, 34.
Ford J. K. B., Ellis G. M. (2006). Selective foraging by fish-eating killer whales Orcinus orca in British Columbia. Mar. Ecol. Prog. Ser. 316, 185–199. doi: 10.3354/MEPS316185
Ford J. K. B., Ellis G. M., Balcomb K. C. (2000). Killer whales: the natural history and genealogy of Orcinus orca in British Columbia and Washington State. (Vancouver: University of British Columbia Press).
Ford J. K. B., Ellis G. M., Barrett-Lennard L. G., Morton A. B., Palm R. S., Balcomb K. C. (1998). Dietary specialization in two sympatric populations of killer whales (Orcinus orca) in coastal British Columbia and adjacent waters. Can. J. Zool. 76, 1456–1471. doi: 10.1139/z98-08
Ford J. K. B., Pilkington J. F., Reira A., Otsuki M., Gisborne B., Abernethy R. M., et al. (2017). Habitats of special importance to resident killer whales (Orcinus orca) off the West Coast of Canada. DFO Can. Sci. Advis. Sec. Res. Doc. 2017/035, 57.
Ford J. K. B., Stredulinsky E. H., Ellis G. M., Durban J. W., Pilkington J. F. (2014). Offshore killer whales in Canadian Pacific waters: distribution, seasonality, foraging ecology, population status and potential for recovery. DFO Can. Sci. Advis. Sec. Res. Doc. 2014/088, 55.
Ford J. K. B., Stredulinsky E. H., Towers J. R., Ellis G. M. (2013). Information in support of the identification of critical habitat for transient killer whales (Orcinus orca) off the west coast of Canada. DFO Can. Sci. Advis. Sec. Res. Doc. 2012/155, 46.
Ford J. K. B., Wright B. M., Ellis G. M., Candy J. R. (2010). Chinook salmon predation by resident killer whales: seasonal and regional selectivity, stock identity of prey, and consumption rates. DFO Can. Sci. Advis. Sec. Res. Doc. 2009/101, 43.
Freshwater C., Anderson S. C., Beacham T. D., Luedke W., Wor C., King J. (2021). An integrated model of seasonal changes in stock composition and abundance with an application to Chinook salmon. PeerJ 9, e11163. doi: 10.7717/peerj.11163
Frouin-Mouy H., Mouy X., Pilkington J., Küsel E., Nichol L., Doniol-Valcroze D., et al. (2022). Acoustic and visual cetacean surveys reveal year−round spatial and temporal distributions for multiple species in northern British Columbia, Canada. Sci. Rep. 12, 19272. doi: 10.1038/s41598-022-22069-4
Gillespie D., Caillat M., Gordon J., White P. (2013). Automatic detection and classification of odontocete whistles. J. Acoust. Soc Am. 134, 2427–2437. doi: 10.1121/1.4816555
Hall A. (2004). Seasonal abundance, distribution and prey species of harbour porpoise (Phocoena phocoena) in southern Vancouver Island waters (MSc. Vancouver, Canada: University of British Columbia).
Hamilton C. D., Lydersen C., Ims R. A., Kovacs K. M. (2014). Haul-out behaviour of the world’s northernmost population of harbour seals (Phoca vitulina) throughout the year. PloS One 9, e86055. doi: 10.1371/journal.pone.0086055
Hanson M. B., Baird R. W., Ford J. K. B., Hempelmann-Halos J., Van Doornik D. M., Candy J. R., et al. (2010). Species and stock identification of prey consumed by endangered southern resident killer whales in their summer range. Endanger. Species Res. 11, 69–82. doi: 10.3354/esr00263
Hanson M. B., Emmons C. K., Ford M. J., Everett M., Parsons K., Park L. K., et al. (2021). Endangered predators and endangered prey: Seasonal diet of Southern Resident killer whales. PloS One 16, e0247031. doi: 10.1371/journal.pone.0247031
Hanson M. B., Emmons C. K., Ward E. J., Nystuen J. A., Lammers M. O. (2013). Assessing the coastal occurrence of endangered killer whales using autonomous passive acoustic recorders. J. Acoust. Soc Am. 134, 3486–3495. doi: 10.1121/1.4821206
Hanson M. B., Ward E. J., Emmons C. K., Holt M. M. (2018). “Modeling the occurrence of endangered killer whales near a U.S. Navy Training Range in Washington State using satellite-tag locations to improve acoustic detection data,” in Northwest fisheries science center, final report for U.S. Navy under MIPR number N00070-17MP-4C419, 33.
Hanson B. M., Ward E. J., Emmons C. K., Holt M. M., Holzer D. M. (2017). “Assessing the movements and occurrence of Southern Resident Killer Whales relative to the U.S. Navy’s Northwest Training Range Complex in the Pacific Northwest,” in Northwest fisheries science center, final report for U.S. Navy under MIPR N00070-15-MP-4C363, 23.
Hauser D. D., Logsdon M. G., Holmes E. E., VanBlaricom G. R., Osborne R. W. (2007). Summer distribution patterns of southern resident killer whales Orcinus orca: core areas and spatial segregation of social groups. Mar. Ecol. Prog. Ser. 351, 301–310. doi: 10.3354/meps07117
Hay D. E., McCarter P. B. (1999). Age of sexual maturation and recruitment in Pacific Herring. DFO Can. Stock Ass. Sec. Res. Doc. 99/175, 42.
Hay D. E., McCarter P. B. (2013). Herring spawning areas of British Columbia: a review, geographical analysis and classification. Can. MS Rep. Fish. Aquat. Sci. 2019, 17.
Healey M. C. (1983). Coastwide distribution and migration patterns of stream- and ocean-type Chinook salmon, Oncorhynchus tshawytscha. Can. Field Nat. 97, 427–433.
Healey M., Groot C. (1987). “Marine migration and orientation of ocean-type Chinook and sockey salmon,” in Common strategies of andromous and catadromous fishes. Eds. Dadswell M. J. K., Moffit R. J., C.M., Saunders R. L. (Bethesda, MD: American Fisheries Society), 298–312.
Heise K. (1997). Diet and feeding behaviour of Pacific white-sided dolphins (Lagenorhynchus obliquidens) as revealed through the collection of prey fragments and stomach content analysis. Rep. Int. Whaling Commun. 47, 807–815.
Houghton J., Baird R. W., Emmons C. K., Hanson M. B. (2015). Changes in the occurrence and behavior of mammal-eating killer whales in southern British Columbia and Washington Stat–2010. Northwest Sci. 89, 154–169. doi: 10.3955/046.089.0207
Jefferson T. A., Smultea M. A., Courbis S. S., Campbell G. S. (2016). Harbor porpoise (Phocoena phocoena) recovery in the inland waters of Washington: estimates of density and abundance from aerial survey–2015. Can. J. Zool. 94, 505–515. doi: 10.1139/cjz-2015-0236
Krahn M. M., Herman D. P., Matkin C. O., Durban J. W., Barrett-Lennard L., Burrows D. G., et al. (2007). Use of chemical tracers in assessing the diet and foraging regions of eastern North Pacific killer whales. Mar. Environ. Res. 63, 91–114. doi: 10.1016/j.marenvres.2006.07.002
Lerner J. E., Hunt B. P. V. (2023). Seasonal variation in the lipid content of Fraser River Chinook Salmon (Oncorhynchus tshawytscha) and its implications for Southern Resident Killer Whale (Orcinus orca) prey quality. Sci. Rep. 13. doi: 10.1038/s41598-023-28321-9
Marcoux M., Ferguson S. H., Roy N., Bedard J. M., Simard Y. (2017). Seasonal marine mammal occurrence detected from passive acoustic monitoring in Scott Inlet, Nunavut, Canada. Polar Biol. 40, 1127–1138. doi: 10.1007/s00300-016-2040-9
Marques T. A., Thomas L., Martin S. W., Mellinger D. K., Ward J. A., Moretti D. J., et al. (2013). Estimating animal population density using passive acoustics. Biol. Rev. 88, 287–309. doi: 10.1111/brv.12001
Matkin C. O., Ellis G. M., Saulitis E., Barrett-Lennard L., Matkin D. (1999). Killer whales of southern alaska (Homer, Alaska: North Gulf Oceanic Society), 96.
Maynard J. (2019)Winter Chinook fishing: the essentials. In: Island fisherman magazine. Available at: https://islandfishermanmagazine.com/winter-chinook-fishing-the-essentials/ (Accessed February 27, 2023).
McCluskey S. M. (2006). Space Use Patterns and Population Trends of Southern Resident Killer Whales (Orcinus orca) in Relation to Distribution and Abundance of Pacific Salmon (Oncorhynchus spp.) in the Inland Marine Waters of Washington State and British Columbia (MSc. Seattle, USA: University of Washington).
McFadden D. (1974). “Conditional logit analysis of qualitative choice behavior,” in Economic theory and mathematical economics. Frontiers in econometrics. Ed. Zarembka P. (New York, NY: Academic Press), 105–142.
McFadden D. (1979). “Quantitative methods for analyzing travel behavior of individuals: some recent developments,” in Behavioral travel modelling. Eds. Hensher D. A., Stopher P. R. (London, UK: Croom Helm), 279–318.
McMillan C., Keppel E. A., Spaven L. D., Doniol-Valcroze T. (2022). Preliminary report on the seasonal abundance and distribution of cetaceans in the southern Salish Sea in response to TMX recommendations 5 and 6 (Year 1). DFO Can. Tech. Rep. Fish. Aquat. Sci. 3474, 33.
Mellinger D. K., Stafford K. M., Moore S. E., Dziak R. P., Matsumoto H. (2007). An overview of fixed passive acoustic observation methods for cetaceans. Oceanography 20, 36–45. doi: 10.5670/oceanog.2007.03
Morin P. A., Archer F. I., Foote A. D., Vilstrup J., Allen E. E., Wade P., et al. (2010). Complete mitochondrial genome phylogeographic analysis of killer whales (Orcinus orca) indicates multiple species. Genome Res. 20, 908–916. doi: 10.1101/gr.102954.109
Myers H. J., Olsen D. W., Matkin C. O., Horstmann L. A., Konar B. (2021). Passive acoustic monitoring of killer whales (Orcinus orca) reveals year-round distribution and residency patterns in the Gulf of Alaska. Sci. Rep. 11, 1–14. doi: 10.1038/s41598-021-99668-0
Newman K., Springer A. M. (2008). Nocturnal activity by mammal-eating killer whales at a predation hot spot in the Bering Sea. Mar. Mammal Sci. 24, 990–999. doi: 10.1111/j.1748-7692.2008.00236.x
Nichol L. M., Hall A. M., Ellis G. M., Stredulinsky E., Boogaards M., Ford J. K. B. (2013). Dietary overlap and niche partitioning of sympatric harbour porpoises and Dall’s porpoises in the Salish Sea. Prog. Oceanogr. 115, 202–210. doi: 10.1016/j.pocean.2013.05.016
Nichol L. M., Shackleton D. M. (1996). Seasonal movements and foraging behaviour of northern resident killer whales (Orcinus orca) in relation to the inshore distribution of salmon (Oncorhynchus spp.) in British Columbia. Can. J. Zool. 74, 983–991. doi: 10.1139/z96-111
Norris T. F., McDonald M., Barlow J. (1999). Acoustic detections of singing humpback whales (Megaptera novaeangliae) in the eastern North Pacific during their northbound migration. J. Acoust. Soc Am. 106, 506–514. doi: 10.1121/1.427071
Olesiuk P. F. (2009). An assessment of population trends and abundance of harbour seals (Phoca vitulina) in British Columbia. DFO Can. Stock Ass. Sec. Res. Doc. 99/33, 71.
Olson J. K., Wood J., Osborne R. W., Barrett-Lennard L., Larson S. (2018). Sightings of southern resident killer whales in the Salish Sea 1976-2014: the importance of a long-term opportunistic dataset. Endanger. Species Res. 37, 105–118. doi: 10.3354/esr00918
O’Neill S. M., Ylitalo G. M., West J. E. (2014). Energy content of Pacific salmon as prey of northern and southern resident killer whales. Endanger. Species Res. 25, 265–281. doi: 10.3354/esr00631
Pike G. C., MacAskie I. B. (1969). Marine mammals of british columbia. Fisheries Res. Board Canada Bull. 171, 54.
Pikitch E. K., Santora C., Babcock E. A., Bakun A., Bonfil R., Conover D. O., et al. (2004). Ecosystem-based fishery management science. Science 305, 346–347. doi: 10.1126/science.1098222
Quinn T. P., Losee J. P. (2022). Diverse and changing use of the Salish Sea by Pacific salmon, trout, and char. Can. J. Fish. Aquat. Sci. 79, 1003–1021. doi: 10.1139/cjfas-2021-0162
R Core Team (2021) R: A language and environment for statistical computing. Available at: https://www.R-project.org/.
Rand Z. R., Wood J. D., Oswald J. N. (2022). Effects of duty cycles on passive acoustic monitoring of southern resident killer whale (Orcinus orca) occurrence and behavior. J. Acoust. Soc Am. 151, 1651–1660. doi: 10.1121/10.0009752
Rechsteiner E. (2012). Resting metabolism, energetics, and seasonal distribution of Pacific white-sided dolphins (MSc. Vancouver, Canada: University of British Columbia).
Rice A., Debich A. J., Širović A., Oleson E. M., Trickey J. S., Varga L. M., et al. (2021). Cetacean occurrence offshore of Washington from long-term passive acoustic monitoring. Mar. Biol. 168, 136. doi: 10.1007/s00227-021-03941-9
Rice A., Deecke V. B., Ford J. K., Pilkington J. F., Oleson E. M., Hildebrand J. A. (2017). Spatial and temporal occurrence of killer whale ecotypes off the outer coast of Washington State, USA. Mar. Ecol. Prog. Ser. 572, 255–268. doi: 10.3354/meps12158
Riera A., Ford J. K., Ross Chapman N. (2013). Effects of different analysis techniques and recording duty cycles on passive acoustic monitoring of killer whales. J. Acoust. Soc Am. 134, 2393–2404. doi: 10.1121/1.4816552
Riera A., Pilkington J. F., Ford J. K. B., Stredulinsky E. H., Chapman N. R. (2019). Passive acoustic monitoring off Vancouver Island reveals extensive use by at-risk Resident killer whale (Orcinus orca) populations. Endanger. Species Res. 39, 221–234. doi: 10.3354/esr00966
Riesch R., Deecke V. B. (2011). Whistle communication in mammal-eating killer whales (Orcinus orca): further evidence for acoustic divergence between ecotypes. Behav. Ecol. Sociobiol. 65, 1377–1387. doi: 10.1007/s00265-011-1148-8
Saulitis E. L., Matkin C. O., Fay F. H. (2005). Vocal repertoire and acoustic behavior of the isolated AT1 killer whale subpopulation in southern Alaska. Can. J. Zool. 83, 1015–1029. doi: 10.1139/z05-089
Sharpe D. L., Castellote M., Wade P. R., Cornick L. A. (2017). Call types of Bigg’s killer whales (Orcinus orca) in western Alaska: using vocal dialects to assess population structure. Bioacoustics 28, 74–99. doi: 10.1080/09524622.2017.1396562
Shelton A. O., Satterthwaite W. H., Ward E. J., Feist B. E., Burke B. (2019). Using hierarchical models to estimate stock-specific and seasonal variation in ocean distribution, survivorship, and aggregate abundance of fall run Chinook salmon. Can. J. Fish. Aquat. Sci. 76, 95–108. doi: 10.1139/cjfas-2017-0204
Shields M. W., Hysong-Shimazu S., Shields J. C., Woodruff J. (2018). Increased presence of mammal-eating killer whales in the Salish Sea with implications for predator-prey dynamics. PeerJ 6, e6062. doi: 10.7717/peerj.6062
Stanistreet J. E., Nowacek D. P., Read A. J., Baumann-Pickering S., Moors-Murphy H. B. (2016). and van parijs, SEffects of duty-cycled passive acoustic recordings on detecting the presence of beaked whales in the northwest Atlantic. M.J. Acoust. Soc Am. 140, EL31–EL37. doi: 10.1121/1.4955009
Stewart J. D., Durban J. W., Fearnbach H., Barrett-Lennard L. G., Casler P. K., Ward E. J., et al. (2021). Survival of the fattest: linking body condition to prey availability and survivorship of killer whales. Ecosphere 12, 1–20. doi: 10.1002/ecs2.3660
Strait of Georgia Data Centre (2021) Adult salmon diet program: Chinook stomach contents result-2021). Available at: https://maps.sogdatacentre.ca/apps/3bf948b4920d4a2c96c568e4ca98cb98/explore (Accessed March 3, 2023).
Sugai L. S. M., Silva T. S. F. S., Riberio J. W. Jr., Llusia D. (2019). Terrestrial passive acoustic monitoring: review and perspectives. BioScience 69, 15–25. doi: 10.1093/biosci/biy147
Taylor F. H. C. (1964). Life history and present status of British Columbia herring stocks. Fisheries Board Canada Bull. 143, 81.
Therriault T. W., Hay D. E., Schweigert J. F. (2009). Biologic overview and trends in pelagic forage fish abundance in the Salish Sea (Strait of Georgia, British Columbia). Mar. Ornithology 37, 3–8.
Thieurmel B., Elmarhraoui A. (2019) suncalc: compute sun position, sunlight phases, moon position and lunar phase. R package version 0.5.0. Available at: https://CRAN.R-project.org/package=suncalc.
Thomas A. C., Deagle B., Nordstrom C., Majewski S., Nelson B. W., Acevedo-Gutierrez A., et al. (2022). Data on the diets of Salish Sea harbour seals from DNA metabarcoding. Sci. Data 9, 68. doi: 10.1038/s41597-022-01152-5
Todd N. R. E., Cronin M., Luck C., Bennison A., Jessopp M., Kavanagh A. S. (2020). Using passive acoustic monitoring to investigate the occurrence of cetaceans in a protected marine area in northwest Ireland. Estuar. Coast. Shelf S. 232, 106509. doi: 10.1016/j.ecss.2019.106509
Towers J. R., Pilkington J. F., Gisborne B., Wright B. M., Ellis G. M., Ford J. K. B., et al. (2020). Photo-identification catalogue and status of the northern resident killer whale population in 2019. DFO Can. Tech. Rep. Fish. Aquat. Sci. 3371, 69.
Towers J. R., Sutton G. J., Shaw T. J. H., Malleson M., Matkin D., Gisborne B., et al. (2019). Photo-identification catalogue, population status, and distribution of Bigg’s killer whales known from coastal waters of British Columbia, Canada. DFO Can. Tech. Rep. Fish. Aquat. Sci. 3311, 299.
Watts P. (1991). Hauling out behaviour of harbour seals (Phoca vitulina richardsi), with particular attention to thermal constraints (PhD. Vancouver, Canada: University of British Columbia).
Whitehead H. (2001). Analysis of animal movement using opportunistic individual identifications: application to sperm whales. Ecology 82 (5), 1417–1432. doi: 10.2307/2679999
Yochem P. K., Stewart B. S., DeLong R. L., DeMaster D. P. (1987). Diel haul-out patterns and site fidelity of harbor seals (Phoca vitulina richardsi) on San Miguel Island, California, in autumn. Mar. Mammal Sci. 3, 323–332. doi: 10.1111/j.1748-7692.1987.tb00319.x
Yurk H., Barrett-Lennard L., Ford J. K. B., Matkin C. O. (2002). Cultural transmission within maternal lineages: vocal clans in resident killer whales in southern Alaska. Anim. Behav. 63, 1103–1119. doi: 10.1006/anbe.2002.3012
Yurk H., Filatova O., Matkin C. O., Barrett-Lennard L. G., Brittain M. (2010). Sequential habitat use by two resident killer whale (Orcinus orca) clans in Resurrection Bay, Alaska, as determined by remote acoustic monitoring. Aquat. Mamm. 36, 67–78. doi: 10.1578/AM.36.1.2010.67
Zeviani W. M. (2021) wzRfun: Walmes Zeviani’s collection of functions. R package version 0.95. Available at: http://leg.ufpr.br/~walmes/pacotes/wzRfun.
Keywords: passive acoustic monitoring, habitat use, residence, Strait of Georgia, killer whale, Orcinus orca
Citation: Pilkington JF, Stredulinsky EH, Gavrilchuk K, Thornton SJ, Ford JKB and Doniol-Valcroze T (2023) Patterns of winter occurrence of three sympatric killer whale populations off eastern Vancouver Island, Canada, based on passive acoustic monitoring. Front. Mar. Sci. 10:1204908. doi: 10.3389/fmars.2023.1204908
Received: 13 April 2023; Accepted: 21 July 2023;
Published: 10 August 2023.
Edited by:
Olga Filatova, University of Southern Denmark, DenmarkReviewed by:
Rebecca Cohen, Cornell University, United StatesCopyright © 2023 Pilkington, Stredulinsky, Gavrilchuk, Thornton, Ford and Doniol-Valcroze. This is an open-access article distributed under the terms of the Creative Commons Attribution License (CC BY). The use, distribution or reproduction in other forums is permitted, provided the original author(s) and the copyright owner(s) are credited and that the original publication in this journal is cited, in accordance with accepted academic practice. No use, distribution or reproduction is permitted which does not comply with these terms.
*Correspondence: Thomas Doniol-Valcroze, dGhvbWFzLmRvbmlvbC12YWxjcm96ZUBkZm8tbXBvLmdjLmNh
†These authors share senior authorship
Disclaimer: All claims expressed in this article are solely those of the authors and do not necessarily represent those of their affiliated organizations, or those of the publisher, the editors and the reviewers. Any product that may be evaluated in this article or claim that may be made by its manufacturer is not guaranteed or endorsed by the publisher.
Research integrity at Frontiers
Learn more about the work of our research integrity team to safeguard the quality of each article we publish.