
95% of researchers rate our articles as excellent or good
Learn more about the work of our research integrity team to safeguard the quality of each article we publish.
Find out more
ORIGINAL RESEARCH article
Front. Mar. Sci. , 08 August 2023
Sec. Marine Megafauna
Volume 10 - 2023 | https://doi.org/10.3389/fmars.2023.1200986
This article is part of the Research Topic Population Structure and Connectivity of Marine Turtles in the Pacific and Indian Oceans View all 14 articles
 Christine A. Madden Hof1,2*
 Caitlin Smith1,2Simon Miller3Kita Ashman2
 Kathy A. Townsend1
 Justin Meager4
The current rate of decline in the globally significant western Pacific hawksbill turtle nesting population on Milman Island on the northern Great Barrier Reef (neQLD) suggests that it could be functionally extinct within a decade. Yet a poor understanding of the relative importance and spatial distribution of threats to this population has been a major impediment to recovery actions. For the first time, we assess all threats to the neQLD stock using a combination of a post-hatchling dispersal model, new satellite tracking of post-nesting migrations and a comprehensive review of existing data. We overlay migration routes and foraging areas from the satellite tracking data with spatially referenced threat layers to analyse threat exposure. We found all tracked hawksbills remained in Australian waters, with migration to foraging areas in Queensland including western Cape York to western Torres Strait (n = 8), and eastern Cape York to eastern Torres Strait (n = 5). These results underscore the critical importance of foraging habitats in Queensland (particularly western Queensland) to the Millman Island nesting population. In contrast, the Lagrangian post-hatchling dispersal model predicted a concentration of turtles in the Torres Strait to Gulf of Papua region, with most final positions in Australian waters (63%), followed by Papua New Guinea (31%), Solomon Islands (3%), Indonesia (2%), Vanuatu (0.49%), New Caledonia (1%). Even though 37% of post-hatchling turtles were predicted to recruit to foraging areas outside of the Australian Exclusive Economic Zone (EEZ), none of the 25 turtles tracked left the Australian EEZ (13 in this study and 12 previously). This suggests that survival to breeding is low for turtles outside of the Australian EEZ, but other explanations are discussed. No single pervasive threat was identified in the threat risk assessment however, fisheries (bycatch/ghost gear) interactions, direct harvesting and climate change were considered to have the potential to impede recovery or result in further decline in the population. Fisheries and harvesting should be the priorities for immediate management actions. The lack of spatial protection in foraging habitats in western Queensland was identified as a major policy gap requiring immediate attention if this population’s trajectory is to be reversed and remain one of western Pacific’s strongholds.
A goal of conservation biology is to identify and assess the magnitude of actual or potential impacts on populations to inform management decisions and to guide recovery actions. Yet for many marine species, threat assessments are often confined to a single impact such as fisheries bycatch (Riskas et al., 2016), artificial lighting (Kamrowski et al., 2012) or climate change (Fuentes et al, 2010), or examine multiple threats but only for a single protected area (see Hays et al., 2019). However, populations of marine wildlife rarely face single threats, nor are populations of marine wildlife likely to be confined to a single protected area. Numerous studies have also shown that the cumulative effect of multiple impacts can be greater than the sum of its parts (e.g. seagrass, Grech et al., 2011); coral reefs, Magris et al., 2018). Spatially explicit risk assessments provide a tangible resource to support place-based management decisions such as fisheries regulations and marine park zoning, and thereby can help to bridge the divide that often exists between research and conservation success.
In the case of highly migratory marine turtles, threat assessments are also often constrained to limited geographical locations (e.g. Fuentes et al., 2020) and/or to habitat defined by post-nesting migrations (e.g. Hart et al., 2018). However, marine turtles characteristically have long and geographically complex life histories that often span multiple ocean basins and jurisdictional boundaries (Hays and Scott, 2013), especially during the long-distance pelagic post-hatchling dispersal and reproductive migrations. Few studies have also assessed the spatial requirements of these different life stages (e.g. Lamont et al., 2015) and the vulnerability of sea turtle species to multiple threats (e.g. Cuevas et al., 2019). Where ontogenetic habitat shifts expose marine turtles to a mosaic of shifting and overlapping threats no peer reviewed studies (that we are aware) have spatially assessed multiple risks to turtle populations at the scale of the population and across life history stages.
Hawksbill turtles (Eretmochelys imbricata) are listed as critically endangered globally by the IUCN Red List (Mortimer and Donnelly, 2008). The north-east Queensland (neQld) stock was once considered one of the world’s largest hawksbill populations (Loop et al., 1995; Meylan and Donnelly, 1999; Limpus and Miller, 2008) but is now regionally listed as endangered (by the Nature Conservation Act 1992, Qld). A recent population assessment of the nesting population at Milman Island reported a continued 58% decline and predicted that it may be functionally extinct as soon as 2032 if the current trajectory continues (Bell et al., 2020). The Milman Island population is presumed to be representative of the greater neQld stock and the larger south-western Pacific population in general (Loop et al., 1995; Limpus and Miller, 2008; Limpus, 2009). Despite these reported and projected losses, threats to the viability of this hawksbill population and greater south-west Pacific hawksbill populations remain unresolved (refer Mortimer and Donnelly, 2008; Kinch and Burgess, 2009; Lam et al., 2011; Wallace et al., 2011; Humber et al., 2014) with unrestricted legal and illegal take reported to persist relatively unabated which continues to threaten these populations (Kinch and Burgess, 2009; Lam et al., 2011; Wallace et al., 2011; Humber et al., 2014; CITES Secretariat, 2019). While many contemporary threats such as bycatch in active fisheries or predation by exotic and native predators are being actively managed where known (e.g. Torres Strait Regional Authority, 2017), research suggests historical and contemporary take is likely causing rapid and ongoing declines of nesting females in this stock, but other factors (e.g. plastic pollution, ghost net entanglement, harvesting of juveniles) may be acting on earlier life history stages and/or on foraging populations dispersed across its geographical range (Bell et al., 2020).
Breeding migrations are known to occur between south-western Pacific rookeries and north-east Australian foraging grounds including from Vanuatu, New Caledonia, Solomon Islands and Papua New Guinea (PNG) (Fitzsimmons and Limpus, 2014; Hamilton et al., 2015; Vargas et al., 2016; Bell and Jensen, 2018; Hamilton et al., 2021). Other western Pacific hawksbill genetic stocks also forage in Australian waters (Bell and Jensen, 2018; Hamilton et al., 2021; Madden Hof, unpublished data). Historical flipper tag studies suggest that the neQld stock’s geographical range likely extends to only the neighbouring countries of southern Indonesia and PNG (Bell et al., 2020). However, this is based on sparse (3/22) historical tag recoveries (Barr et al., 2021), of a beach-washed adult hawksbill in southern Indonesia (in 1994), and two others caught by traditional fishing (one ~ 20 km out from Daru (in 1997) and the other reported from Tube village (about 20 km southwest from Daru; in 2000) (DES Queensland Turtle Conservation Database), with the latter two likely caught within the bounds of the Torres Strait Treaty. More recently, a hawksbill turtle tracking study revealed all but one (7/8) of the Torres Strait post-nesting females migrate and forage within the Torres Strait with all remaining within Australian waters (Barr et al., 2021). The true extent of critical habitat for the neQld stock is currently lacking but is urgently needed to inform critical species recovery actions including threat mitigation and management if the current population trajectory is to be reversed.
The main legislative protections for the neQld hawksbill population are provided by a marine park network and by their status as threatened species at state and Commonwealth level. Milman Island is protected to the highest State and Commonwealth Marine Park level (classified as a National Park “Scientific” and “Preservation”). In the state of Queensland the status of hawksbill turtles was up listed from “vulnerable” to “endangered” in 2017. At a Commonwealth level, they are listed as “vulnerable” and high-level threat assessment was undertaken for the multispecies Recovery Plan for Marine Turtles in Australia in 2017. The priority threats identified were marine debris entanglement, international take (outside of Australia’s jurisdiction), terrestrial predation (pig, dog, and goanna) and climate change, although it was recognised that further research was required.
Here we analyse cumulative threats to the neQld hawksbill turtle population across life history stages (nesting, post-hatchling dispersal, migratory routes, and foraging areas) using a spatially explicit risk assessment approach. New spatial layers of habitat suitability are first derived from satellite tracking of post-nesting migrations and a Lagrangian post-hatchling dispersal model. We then overlay available spatial layers of threats to spatially assess risks. Finally we analyse existing spatial protection measures and provide recommendations for actions to halt the decline of this internationally significant population.
Milman Island (143.015833°E, -11.168889°S) is located approximately 23 km off the mainland in the remote far northern section of the Great Barrier Reef (GBR), Queensland, Australia (Figure 1). Whilst much of the neQld stock nests across the Torres Strait, Milman Island was selected as Queensland’s primary index nesting beach for monitoring long-term variability of the neQld stock, and thus acts to represent multiple hawksbill nesting sites over a large spatial area in northern Queensland (Bell et al., 2020). It supports year-round hawksbill turtle nesting, with a peak in Austral summer months.
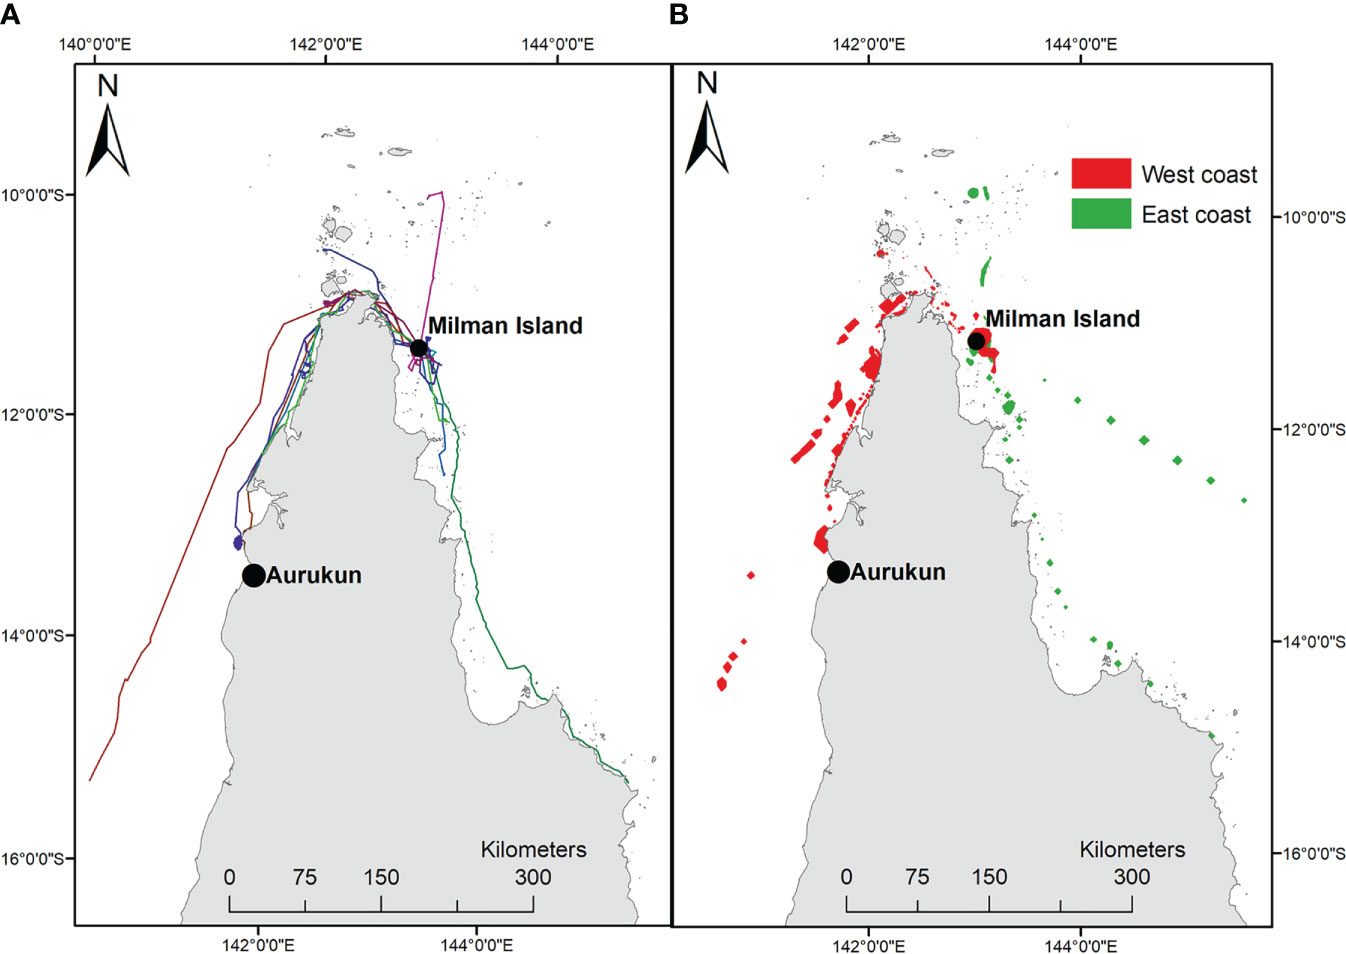
Figure 1 Location of Milman Island, in north east Australia. (A) the 13 satellite tracks; (B) 95% UD home range east vs west.
Hawksbill geographical distribution for each life stage was quantified using multiple methods. For migration and foraging ground distribution, Fastloc-GPS satellite tags were attached directly to 13 sexually mature nesting female individuals, while post-hatchling and “lost year” distribution was identified using ocean current modelling. Hatchling production, males and younger foraging cohorts were not modelled.
Thirteen Fastloc-GPS satellite tags (SPLASH10-BF, Wildlife Computers, Seattle, Washington, USA) were attached to four primary (first time flipper tagged) and nine recaptured (previously flipper tagged) nesting hawksbill turtles on Milman Island during the 26 January – 8 February of the 2015-2016 and 2016-2017 nesting seasons (Figure 1A; Table SM1). This work was conducted under the Queensland Department of Agriculture Animal Ethics approval number: SA 2015/11/526. Because of the long term saturation tagging nesting monitoring program in place at Milman Island, a mix of primary and recaptured hawksbills were satellite tagged to represent, a) different aged breeders ranging in size (curved carapace length, CCL) from 75.1 to 84.4 cm (mean +/- s.d., 79.22 +/- 3.11 cm)), and b) possible different (historical) migratory paths and foraging grounds over space and time.
After measuring the CCL, applying numbered titanium flipper tags (Limpus, 1992; Limpus and Miller, 2008), satellite tags were attached between the two anterior central scutes (as per Godley et al., 2002). The carapace was cleaned with acetone and lightly sandpapered before attaching the tag using quick-setting two-part epoxy resin (Sika AnchorFix®-3+, Sika Australia Pty Ltd). The epoxy was sanded smooth, and a final coat of anti-fouling paint (Micron66) was applied over the already primed and painted tags. The tethered turtles were released (no longer than 24 hours after capture) when the epoxy had completely cured.
The Argos satellite system (http://www.argos-system.org/) was used to relay the Fastloc-GPS location data and Wildlife Computer Portal to store the received data. GPS satellite tags were fixed with either copper or stainless-steel wet/dry sensors (of which neither yielded better results over the other, pers comm. Lay, 2018). Four tags repetition rate was programmed at 15 second intervals and the other 9 tags with a 30 second nominal repetition rate. The tag battery life was considered similar, as they were all limited to 500 transmissions per day. Preliminary filtering of all tracks was conducted in the Wildlife Computer Portal and exported for further analysis in R (version 4.1.2). High quality locations were included from both Argos-only and Fastloc GPS fixes. For Argos positions only location classes 3 or 2 were included, which corresponds to an estimated error ± 500 m (https://www.argos-system.org/manual/3-location/34_location_classes.htm). For FastLoc GPS positions only locations with more than 3 satellite fixes were included, which corresponds to an estimated 95% of positions within 724 m. Turtle locations were then filtered to remove duplicates. Finally, unrealistic swimming speeds were removed using the ‘sdafilter’ in the Argosfilter package of R. Briefly, the maximum speed threshold was calculated as the upper 99% quantile from the high-quality FastLoc positions (Shimada et al., 2012).
We then estimated the 95% utilisation distribution (UD) of foraging areas using biased random bridge models, by using the adehabitatHR package of R with parameters from Shimada (Shimada, 2015). This method accounts for serial autocorrelation between turtle positions (Benhamou, 2011).
Foraging behaviour was determined from post-nesting tracks using hidden Markov models fitted to continuous time correlated random walk trajectories using the ‘crawl’ and ‘momentuHMM’ packages. Post-nesting migration was defined as directed and sustained movement away from the nesting area (following Barr et al., 2021). Continuous movement trajectories were fit using informative priors for each positional error class and hidden Markov models estimated probable behavioural state using movement step length and turning angles. The optimal number of states for each turtle was determined by comparing the AIC of different models and the most probable behavioural state for each position and turtle was assigned using the Viterbi algorithm (McClintock and Michelot, 2018). Behavioural states were then visualised and checked in qGIS. Individual turtles foraging and migration UDs were combined into a post-nesting (inter-nesting, migrating, and foraging) 95% UD for use in threat assessment (see below). Migratory paths were buffered (700 m) to account for positional error before plotting as a likely migratory corridor life history phase.
Indicative locations of potential post-hatchling distribution were identified using the Connie 3.0 ocean current modelling (CSIRO Connectivity Interface, https://connie.csiro.au/; Run 15/3/21). In refining and as an extension to (Hoenner et al., 2016) methodology, parameters of the model included: Milman Island as the ‘source’ of the particles (hatchlings), ocean current data for Australasia–South-East Asia bioregion at 0.1° x 0.1° blocks, an ocean surface depth of 1–5m (as this is the closest to the surface that the model considers), all years available (2003-2007) and a release period of 120 days from 15 January – 15 February to coincide with the likely peak hatchling emergence period (Dobbs et al., 2010). A two-phase complex behaviour model was chosen based on the (limited) hatchling active swimming and likely migration behaviour studies (Chung et al., 2009; Booth et al., 2019) in that, unlike other species, hawksbill hatchlings only tend to swim in a ‘frenzy’ for about the first hour, then over 6 or so days float inactively for 15-17 hours/day, dispersed with active swimming for the remaining 7-9 hours/day. In using the two studies, average swimming speeds (tethered and non-tethered) is estimated between 0.14 – 0.28 m/sec. As such, we used a random horizontal propulsion (active swimming) of 0.28m/sec over 6 days for Phase I, followed by a passive distribution (migration) for 114 days (Phase II) to model cumulative exposure (likely post-hatchling home range) and final distribution (likely post-hatchling dispersal). In addition, we recreated the Connie3 final distribution (end point latitude and longitude) dispersal model overlaid with exclusive economic zoning (EEZ) to count the number and proportion of data points intersecting within each EEZ layer as an indicator of post-hatchling distribution between countries in the first few months, which without further knowledge of directional movement and settlement may be at best, indicative of the early “lost years”.
Threats to the neQld hawksbill stock were first identified from the following sources: the Recovery Plan for Marine Turtles in Australia, 2017 (Commonwealth of Australia, 2017), the Queensland Government’s Marine Turtle Conservation Strategy 2018, the StrandNET database (Queensland Government marine wildlife stranding program: data from 2009-2014) and the Queensland Government species prioritisation plan (Back on Track). For each identified threat, a spatial layer or raw dataset was sourced to represent threats spatially at the finest scale available. Where suitable spatial layers were not available, qualitative assessments were undertaken to investigate the threat posed to the neQld stock. Risk was assessed using the likelihood-consequence tables from the Recovery Plan for Marine Turtles in Australia, based on both quantitative and qualitative data available at the time of this study. The resulting risk matrices are provided in Table 1. If threats were considered low, they were evaluated and described but not included in the broader analysis. Only risks rated high to very-high were further evaluated in detail in this study. Area-based protection measures were also assessed.
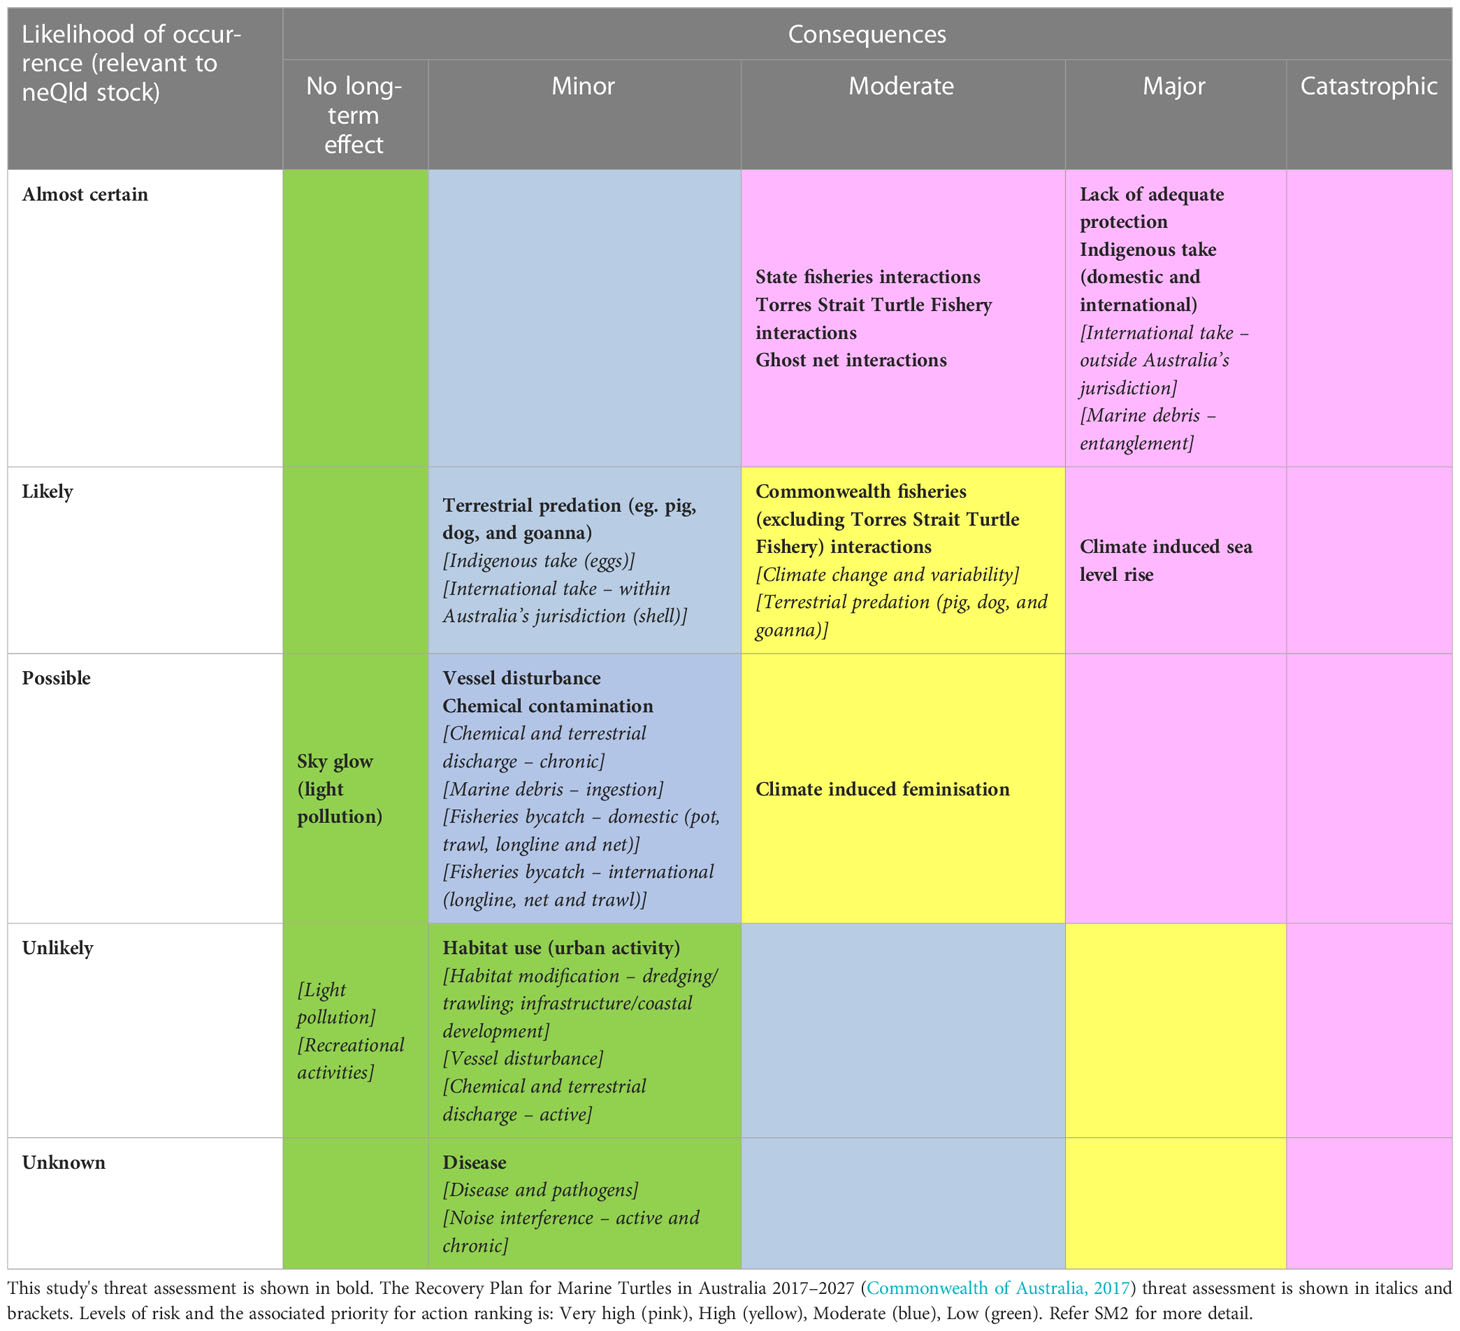
Table 1 Threat assessment.
A spatial risk assessment was then undertaken for post-nesting turtles in ESRI ArcGIS (version 10.8.1). For the 13 individual turtles with satellite tracking data, the post-nesting 95% UDs (as defined above) were combined into a single polygon spatial layer and divided between east vs west coast Queensland (for some analyses). Where possible, high and very high-risk threats were converted into spatial layers and were individually overlaid with the combined 95% UD layer to quantify threat pressure on migration and foraging grounds of post-nesting neQld stock hawksbill turtles. These layers overlapped the turtle spatial data in time and space. These layers were clipped to the UD polygon to calculate geospatial statistics of the area for each critical threat. For raster datasets, zonal statistics were used.
We used WorldClim modelled climate projection temperature data under the Coupled Model Intercomparison Project Phase 6 projection (CMIP6-IPSL-CM6A-LR subset, downloaded from https://www.worldclim.org/data/index.html; Accessed 12/05/2021), to investigate climate change induced feminisation. This data was used as a proxy for sand nest temperatures as it uses blended land and sea surface air temperatures. Previous studies have indicated that both sea surface temperature and air temperature are strongly correlated with sand temperature in north-east Australia and the Torres Strait, and are the best proxy indicators of nest sand temperature in this region (Fuentes et al., 2009; Fuentes et al., 2010). Furthermore, CMIP6 data has been used in recent studies to accurately characterise future sea turtle nesting beach temperatures required for conservation management under different climate change scenarios (Butt et al., 2016). Detailed information on the methods and experimental design of CMIP6 data is given in Eyring et al. (2016).
Using hawksbill turtle pivotal sex determining threshold of 29.2°C (Dobbs et al., 2010) and the CMIP6 data, mean minimum and maximum nesting beach temperatures (using monthly values averaged over 20-year periods) were calculated for two time periods (2021-2040 and 2061-2080), and examined under two climate scenarios (worst-case SSP585 and conservative SSP370 scenarios). We used CMIP6 data at the spatial resolution of 25 kilometre grids which gave the best coverage of nesting beach locations. At this resolution, each nesting beach fell into a single 25 kilometre grid, enabling the extraction of a single value for mean minimum and maximum temperatures for each nesting beach location in each time period and climate scenario.
For the period 2005-2020, publicly available data of annual fishing effort and hawksbill turtle interactions reported in both Commonwealth and State commercial fisheries was collated from Protected Species Interaction Reports (AFMA, 2021) and fisheries logbooks (AFMA, 2020; Queensland Open Data Portal, 2020; Queensland Department of Agriculture and Fisheries, 2021). As such, all fisheries including Queensland’s East Coast Inshore Fishery (ECIF) (gillnet and ringnet only), Gulf of Carpentaria Inshore Fishery (GoCIF) (gillnet and ringnet only), East Coast Otter Trawl Fishery (ECOTF), East Coast and GoC Crab Fishery, Commonwealth’s Eastern Tuna and Billfish Fishery (ETBF), the Torres Strait Prawn Fishery (TSPF), and the Northern Prawn Fishery (NPF) were assessed. Due to uncertainty in species identification and/or incomplete reporting (Riskas et al., 2016), data was included for all fisheries to have recorded either a hawksbill or an unidentified (or unspecified) turtle interaction in an area that overlaps with the likely neQld stock distribution. Due to the uncertainty in the fate of released turtles we did not differentiate between turtles reported to have been released alive or dead. Further, because unidentified turtles may include hawksbill turtles as well as other turtle species found within the fishery’s area of operation, we calculated the proportion of hawksbill turtles out of the total identified turtles for each fishery and applied that proportion to the unidentified turtles to estimate the potential total number of reported hawksbill interactions (herein referred to as adjusted hawksbill interactions). However, we caution that this is an estimate and the actual proportion of the unidentified turtles that were hawksbills may differ within vessels in a fishery and between fisheries. Bycatch per unit effort (BPUE; caught per day/per shot/per 1000 hooks effort) of hawksbills and the adjusted hawksbill interactions, and all marine turtles combined was calculated for each fishery.
Using QFISH (qfish.qld.gov.au; Accessed 12/04/2021) we calculated days fished (based on 30-minute reporting grid raster cells, categorised into quantiles) within the post-nesting hawksbill UD. Due to varying methods of data collection and validation in the different jurisdictions, data was only standardised to common time periods and reporting metrics (days/hooks etc.), not by vessel power, season, or other categories.
Given the marked difference between reported and actual bycatch rates as evidenced in the ETBF and because Australian Government and other studies document underreporting of interactions occurring within Queensland and other Australian fisheries (Commonwealth of Australia, 2018; GBRMPA, 2019; Course et al., 2020; Commonwealth of Australia, 2021), we also calculated two coarse extrapolations using fishery observer and electronic monitoring data where available. These extrapolations were made to give a generalised comparison of actual versus possible bycatch rates in full acknowledgement that observed interactions and accuracy of BPUE reporting rates could differ between fisheries, and hence we caution against misinterpretation and overuse. To calculate potential monitored BPUE and absolute hawksbills caught for the entire study period (2005-2019), we applied the difference between the BPUE rates for the ETBF prior to independent data validation via electronic monitoring (2012-2015) and post electronic monitoring (2016-2018) to the ECIF and GoCIF. To cross-check these results we also extrapolated the number of observed turtle interactions per fishing day in the ECIF from the Queensland Fishery Observer Program (FOP) from 2006 to 2012 (on the Queensland east coast) to the ECIF and GoCIF effort levels to give an estimate of the total number of marine turtle interactions (all species). We applied the proportion of reported hawksbill turtle interactions in the two fisheries to give an estimate of the extrapolated number of hawksbill turtles.
To assess discarded, abandoned or lost fishing gear or “ghost net” interaction and risk, we used combined components of Wilcox et al. (2013) estimated areas of concentrated ghostnet fishing effort (i.e. the likely number of tracked ghost nets based on final locations of actual observed onshore nets) and the predicted threat to turtles from ghostnets (i.e. the highest probability of a turtle-net encounter), to calculate the likelihood and number of ghost net tracks hawksbills would encounter within their home range.
The Torres Strait Turtle Fishery boundary was used as a proxy for likely harvest interaction by calculating the area of fishery overlap with the post-nesting UD. Because legal (primarily) turtle harvests are considered high in Australia and Papua New Guinea (in the top three globally) (Humber et al., 2014; Senko et al., 2022a; Table SM5), the recreated Connie3 final distribution dispersal model with overlaid exclusive economic zoning was also used to assess the proportion of likely harvest interactions with post hatchling hawksbills per country, acknowledging other threats (e.g. marine pollution) are likely and will compound these interactions.
Traditional harvest of eggs for human consumption and clutch predation by terrestrial animals were considered jointly to account for the cumulative impacts of egg loss (Department of Environment and Science, 2021). The Atlas of Living Australia predator sightings (https://www.ala.org.au/; Accessed 3 March 2021, refer SM4 for species), and Torres Strait Regional Authority reported data (2017) were used to create a combined terrestrial animal and traditional harvest spatial layer to examine the distribution of predation at important nesting locations (ranked as low, medium, high and very high). The Torres Strait Regional Authority (2017) predation survey however did not include the most heavily populated western and inner Torres Strait Islands and was only based on varying one-nine day surveys predominantly in November and February (months of lowest track counts), so not representative of breeding season (or the highest track count peak (2-5 times higher) of December and March) (Torres Strait Regional Authority, 2017). Using quantified (non-peak breeding season) clutch predation and total recorded nest percentages, the percentage of clutch loss and likely number of clutches lost to predation at 14 (to standardise survey days), 30 and 60 days (approximate breeding season) was also re-created.
Excluding all other categories, only marine “no-take” reserves (IUCN I and II categories; (Grech et al., 2014) were used from the Marine Collaborative Australian Protected Areas Database (CAPAD, 2020) for the protection analysis. Dedicated Indigenous Protected Areas (IPA) were combined with IPA CAPAD, 2020 IPA category and included as a separate layer. Areas and percentage of protection in the post-nesting UD was calculated.
Using available data, it was possible to assess and map an indicative sample of the neQld stock across all life history stages (nesting, post-nesting migration and foraging, and post-hatchling dispersal) (Figure 2).
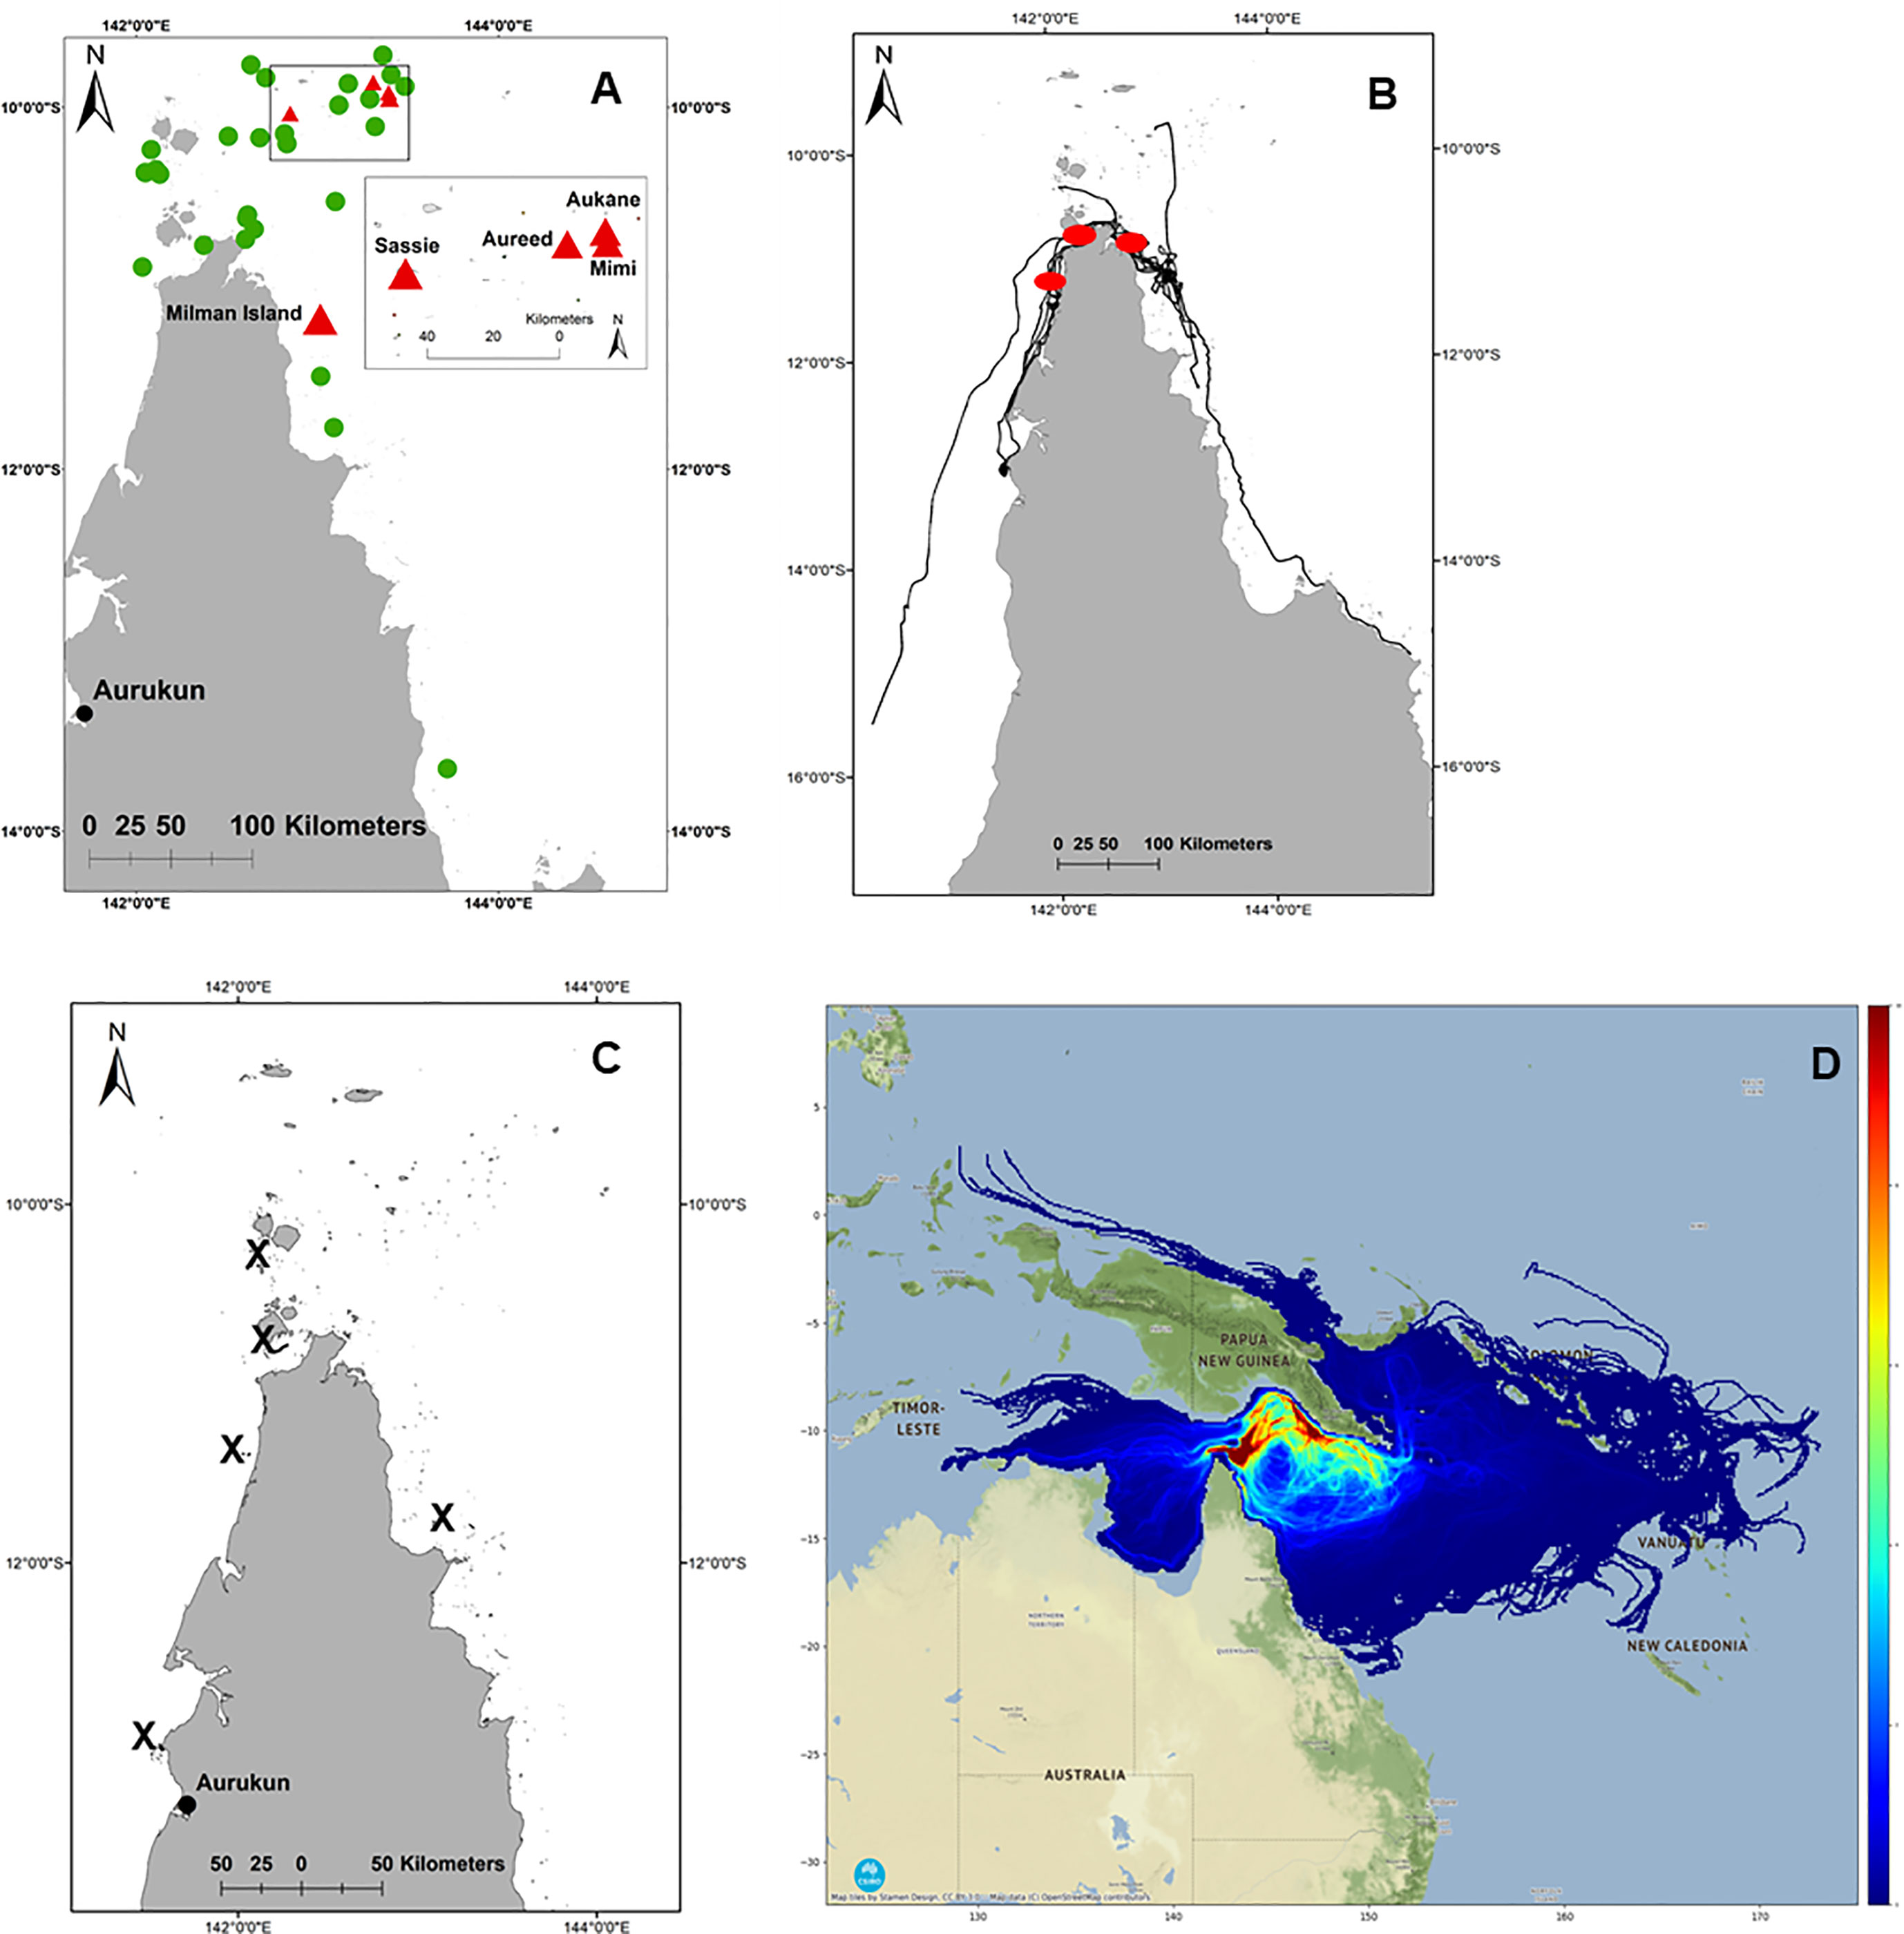
Figure 2 neQld stock life history. (A) important (green) and critical (red) nesting sites; (B) migration corridor (red dots where >5 migratory tracks overlap); (C) key foraging ground locations (shown as X); (D) post-hatchling cumulative exposure as modelled by CONNIE 3 (red shading where greatest likelihood of modelled dispersal) (Credit: CSIRO).
All known nesting habitat has been mapped previously (Limpus, 2009; Commonwealth of Australia, 2017), however recent aerial surveys (supported by ground-truthed track and nest count data) from the Torres Strait during the 2016-2017 nesting season (Torres Strait Regional Authority, 2017) indicated that a revision of important nesting habitat was needed. Based on this Torres Strait study, Aukane (Au Kein), Sassie, Mimi and Aureed Islands combined accounted for 43.3% of the total hawksbill tracks recorded in the Torres Strait (presented here in Islands in greatest to lowest order of ground-truthed tracks). Along with Milman Island off east Cape York, these sites were elected and plotted as the five critical nesting habitats (as per habitat critical to the survival of a species guidelines, refer Commonwealth of Australia, 2017), with eight other key nesting sites (Bak, Bara, Kebi Kein, Smol Muri, Ullu, Warral, Yauk, Zuizin) (Figure 2A).
Of the thirteen adult females tracked from Milman Island, five migrated to foraging areas on the east coast of Queensland (one within eastern Torres Strait), and eight to the west coast (two within western Torres Strait) (Table SM1; Figure 1). Migration overlapped (>5 tracks) in the waters of north-western west Cape York, from Skardon River to just south of Crab Island and between Seisha and Prince of Wales in Torres Strait, and in north-eastern east Cape York from Albany to Milman Islands (Figure 2B). Only two of the thirteen tracked turtles foraging ground (15.34%) were in a similar locality, adjacent to the township of Aurkun on the western Cape of Queensland, which was also used as a migratory route by one other hawksbill (Table SM1; Figure 1A).
Foraging areas were identified for twelve of the thirteen turtles and ranged from 0.03 km2 to 4.5 km2. The final turtle (166711) undertook a post-nesting migration of 700 km before the tag stopped transmitting in the south-east Gulf of Carpentaria, prior to the turtle reaching the foraging ground. The total 95% post-nesting UD of the turtles tracked in this study equated to an area of 4,721 km2, noting that this is of course an underestimate of the true size of the area used by the nesting population because home range sizes are expected to increase with sample size. Overall, the tracked turtles spent about 75% of their time on the west coast of Queensland and about 25% on the east coast (Figure 1B), which represented a total (95% UD) area of 3,525 km2 and 1,196 km2 on the west and east coasts respectively. The likely migratory corridors are shown in Figure 2B. Foraging grounds are shown in Figure 2C.
Based on 120 days at sea, the cumulative exposure of hatchling dispersion revealed post-hatchling hawksbills are highly likely to be concentrated within and between the Torres Strait, Gulf of Papua, and the Coral Sea, from western Torres Strait to the northeast coast of Shelburne Bay, across the Coral Sea to the coast adjacent to Port Moresby in southwestern PNG (Figure 2D). The model predicts post-hatchling hawksbills final distribution is primarily within Australia (62.73%), followed by PNG (31.21%), Solomon Islands (3.28%), Indonesia (1.96%), even as far as Vanuatu (0.49%) and New Caledonia (0.34%) (Figure 3; raw numbers in Table SM2).
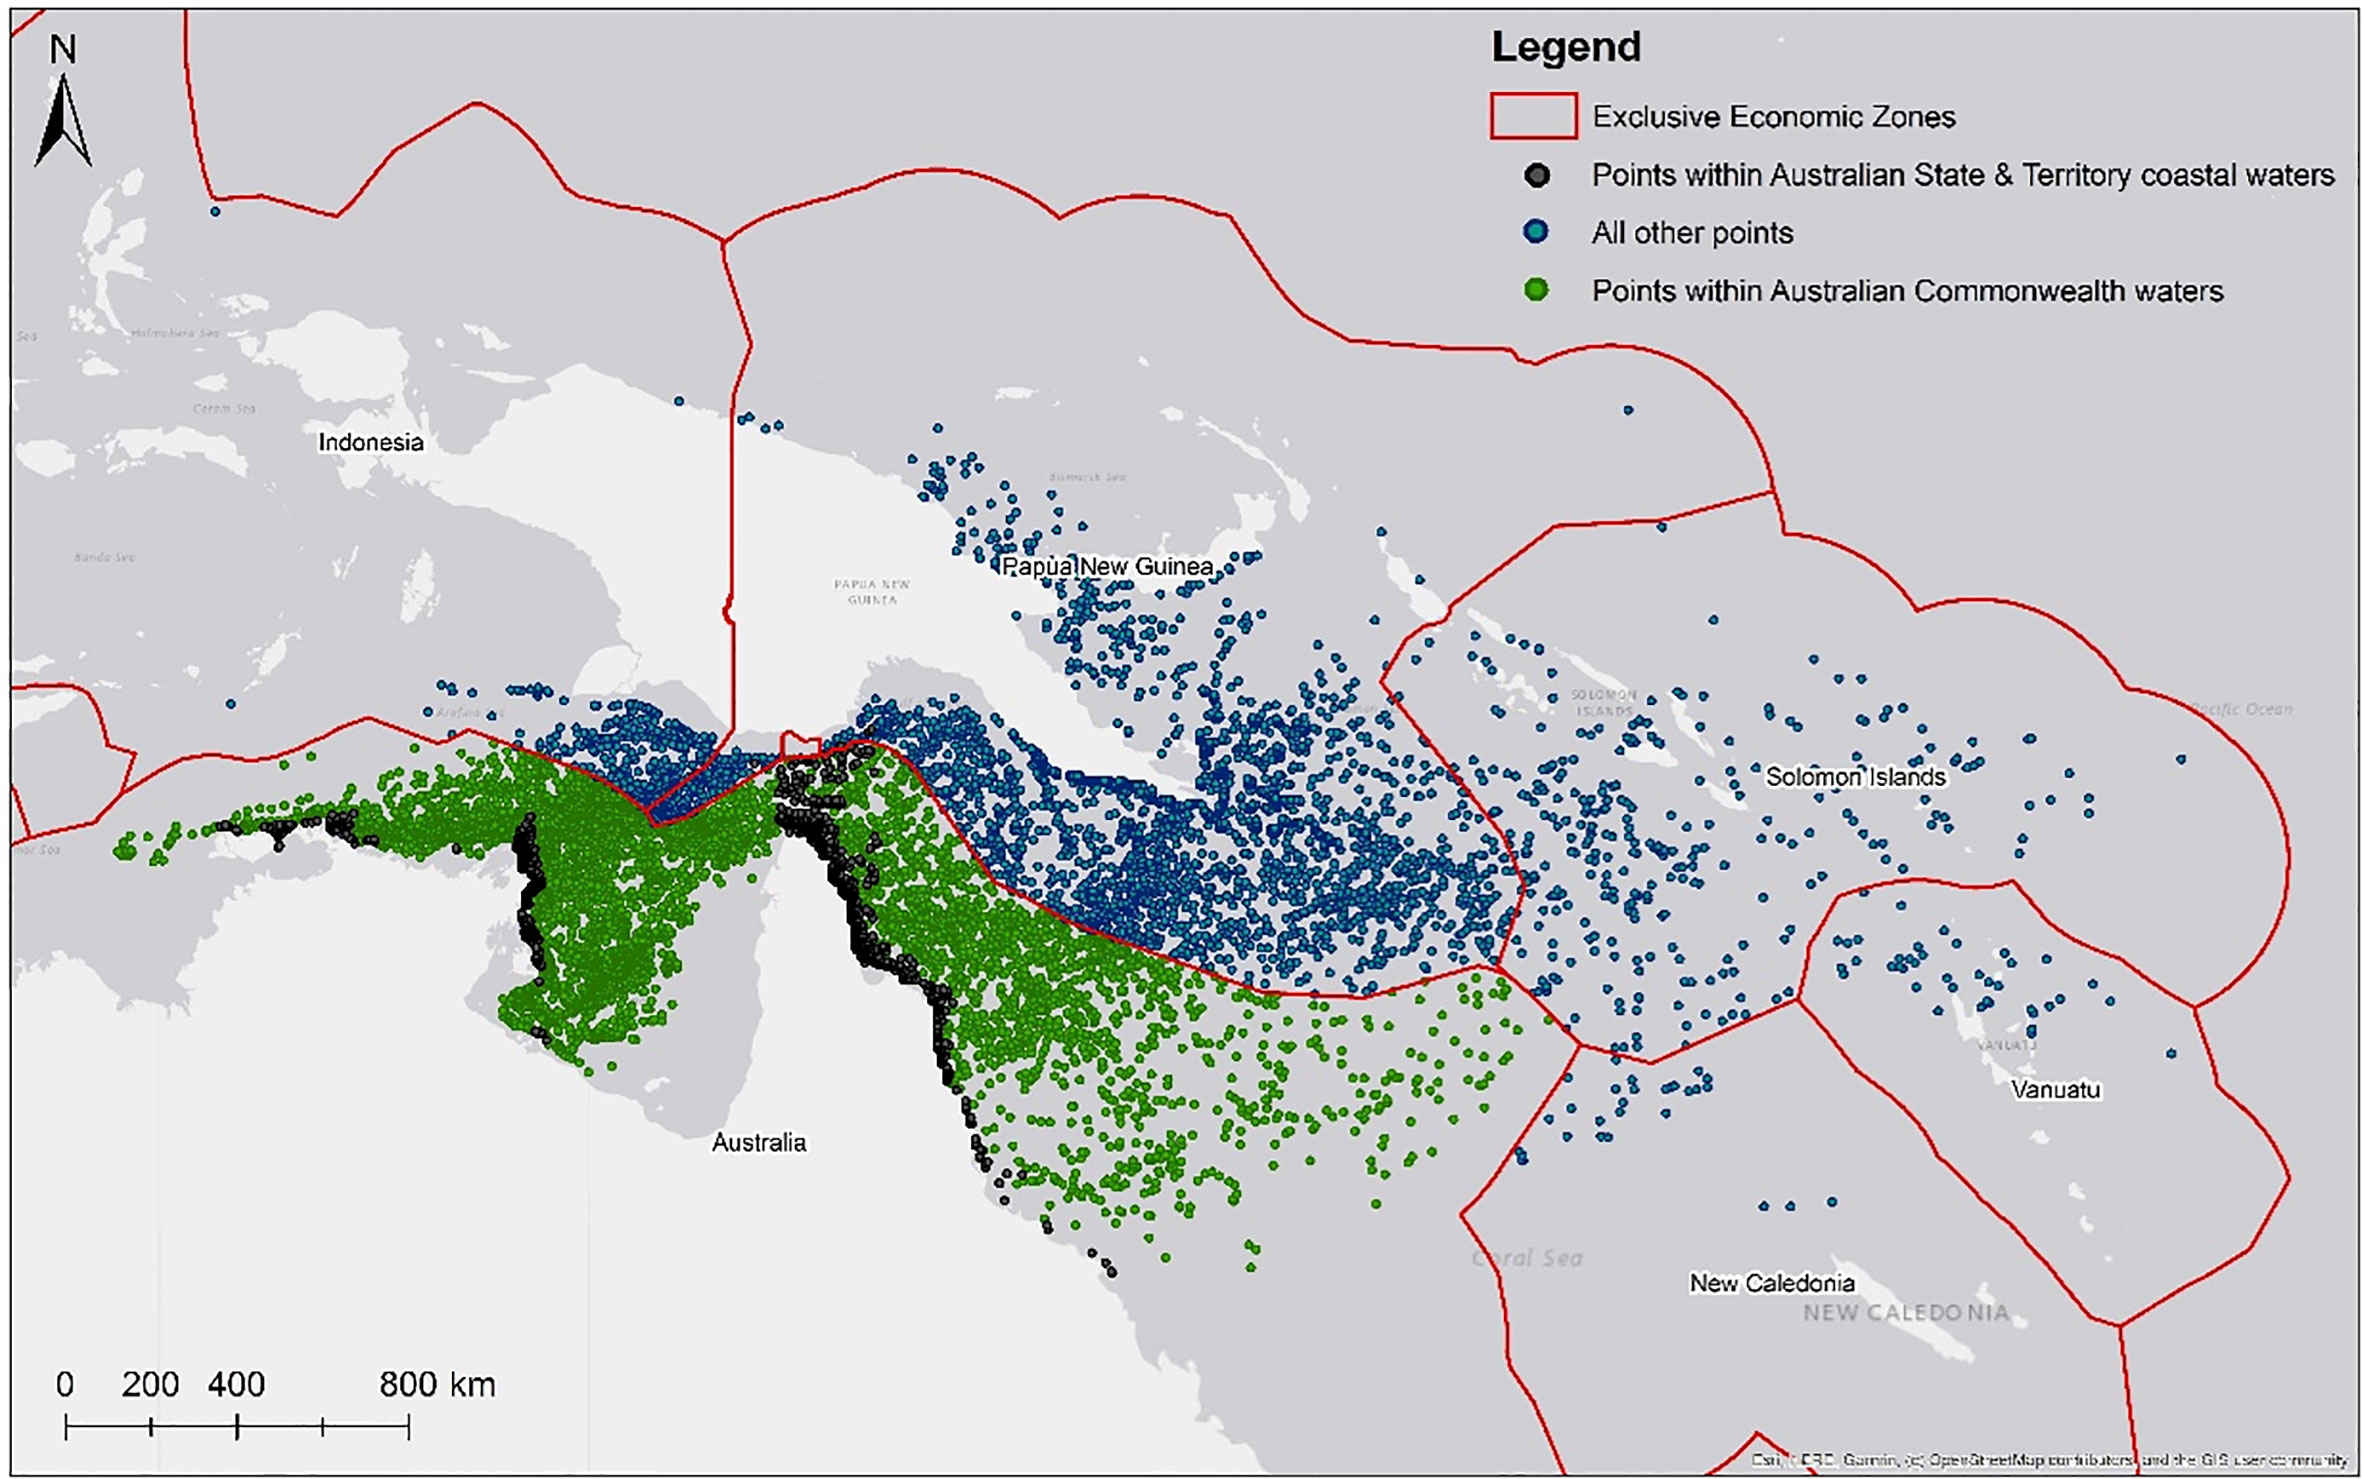
Figure 3 Likely first “lost-year” distribution within predicted [count] of likely encounters per exclusive economic zones (EEZ). Coloured dots refer to points within Australian State and Territory coastal waters (black), Australian Commonwealth Waters (green), all others (blue).
The risk assessment using likelihood-consequence tables identified the lack of spatial protection, State and Torres Strait fisheries interactions, ghost net interactions, Indigenous take (domestic and international) and climate induced sea level rise threats as very high risk, and Commonwealth (excluding Torres Strait) fisheries interactions and climate-induced feminisation threats were reassessed as high risk (Table SM2). These are presented in more detail below.
CMIP6 modelled climate projection temperature data indicated a similar increase in temperature under both emission scenarios (conservative and extreme: Table 2). The conservative scenario predicted higher temperatures at nesting beaches for the 2021-2040 period than the extreme scenario, while the extreme scenario predicted higher temperatures for the 2061-2080 period than under the conservative scenario. Modelled maximum temperatures for both periods (2021-2040 and 2061-2080) were above the pivotal thermal threshold (29.2°C) at all investigated hawksbill nesting beaches. Modelled minimum temperatures across all key nesting sites were not greater than 27.1°C (within male production temperatures). However, minimum modelled temperatures under an extreme emissions scenario for period 2061-2080 at four nesting beaches were within 0.2°C and 0.3°C of the pivotal thermal threshold (Aukane: 29.0°C, Zuizin: 28.9°C, Mimi: 29.0°C, Bourke: 29.0°C). The same four nesting beaches modelled maximum temperatures well above upper thermal mortality thresholds (>35.4°C). At these beaches, even under a conservative emissions scenario for this time period, minimum temperatures remain high (28.6°C) but likely still male producing.
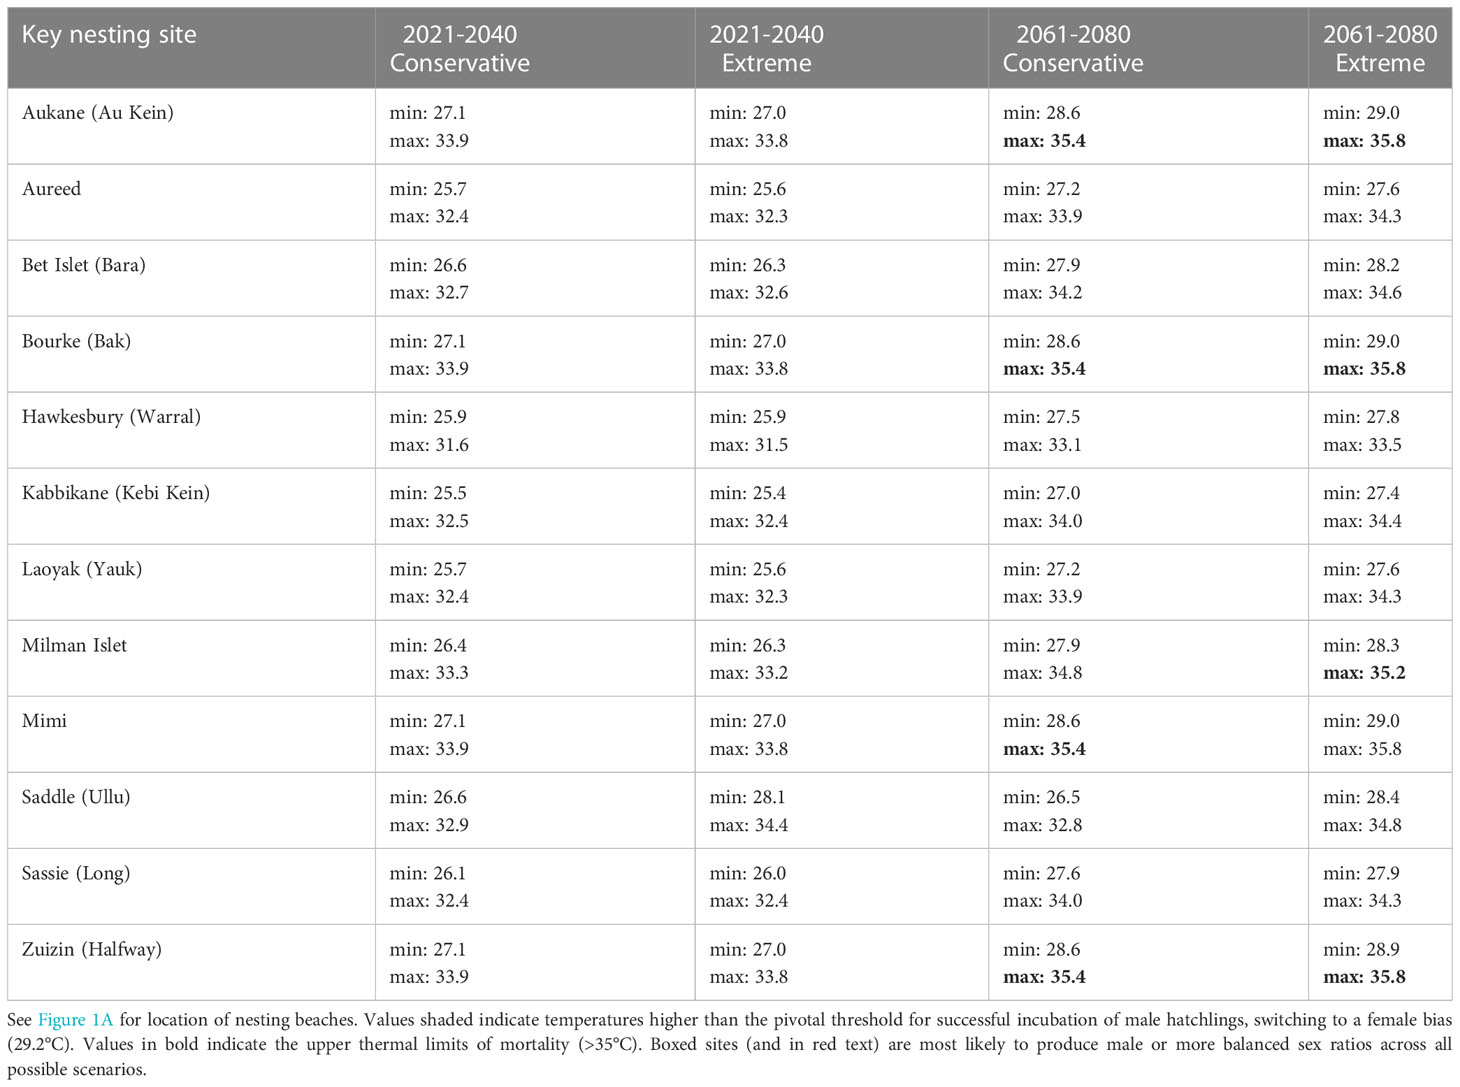
Table 2 CMIP6 modelled climate projection temperature data of minimum and maximum mean temperatures (°C) for hawksbill turtle nesting areas in northeast Australia for two time periods (2021-2040 and 2061-2080) under conservative and extreme emissions scenarios.
Where reporting was available (not all years across all fisheries) from 2005-2020, absolute numbers of annual marine turtle interactions (all species) were highest in the ECIF and GoCIF (1,591; 114 average/yr), the ETBF (765; 85 average/yr) and NPF (636; 71 average/year) and the lowest in the East Coast and GoC Crab fishery (9; 1 average/yr) (Table SM3A). Over this 15-year period, hawksbills were reported as a small component of bycatch in each individual fishery ranging from 0% in ECOTF to 11.1% in the East Coast and GoC crab fisheries. Potential hawksbill interactions (reported hawksbill turtles plus adjusted hawksbill interactions) ranged between 0% in the ECOTF to 13.3% in the TSPF (Table SM3B). In the period 2012-2019 where all reported fisheries data were available, bycatch of hawksbills and potential hawksbill interactions equated to 2% and 2.8% (38-52 absolute or 5-7 average/year) respectively. For hawksbills alone, bycatch was the highest in the ETBF (18; 2 average/yr) followed by the ECIF & GoCIF (9; 1 average/yr) and NPF (8; 1 average/yr), with the lowest in East Coast Trawl (0/yr) (Table SM3C). Extrapolated data from the Queensland Fisheries Observer Program indicates that 651 hawksbill turtles may have been caught as bycatch in the ECIF and GoCIF combined during the period 2005-2019 (Table SM3D).
Turtle BPUE trends differed by fishery (Figure 4), with increases in turtle BPUE in the ETBF from 2016 onwards corresponding with the introduction of electronic monitoring, increasing approximately 9-fold from 0.002 turtles per 1000 hooks (or 66 absolute turtles; 16.5 turtles/yr) in the period pre-electronic monitoring (2012-2015) to 0.019 turtles per 1000 hooks (or 454 absolute turtles; 151.3 turtles/yr) in the period with electronic monitoring (2016-2018). Of particular note, the number of dead turtles reported also drastically increased from 8 to 67. For hawksbill and adjusted hawksbill interactions, BPUE increased almost 5-fold between the period pre-electronic monitoring (2012-2015) and with electronic monitoring (2016-2018) (0.00007 to 0.00041 per 1000 hooks) (Table SM3E). BPUE increases are not reflected in other fisheries, with the ECIF and GoCIF interestingly showing a general negative trend in BPUE throughout the study period (Figure 4). If extrapolated using the magnitude of increase in reported hawksbill and adjusted hawksbill interactions BPUE prior to and during electronic monitoring implementation as observed in the ETBF (5.9x increase), BPUE for the ECIF and GoCIF, which does not have independent observation, may be approximately 0.0015 in the 2005-2019 period (versus the 0.0003 reported in 2005-2019) with 150-162 (versus 25-27 reported) hawksbills caught as bycatch (Table SM3F).
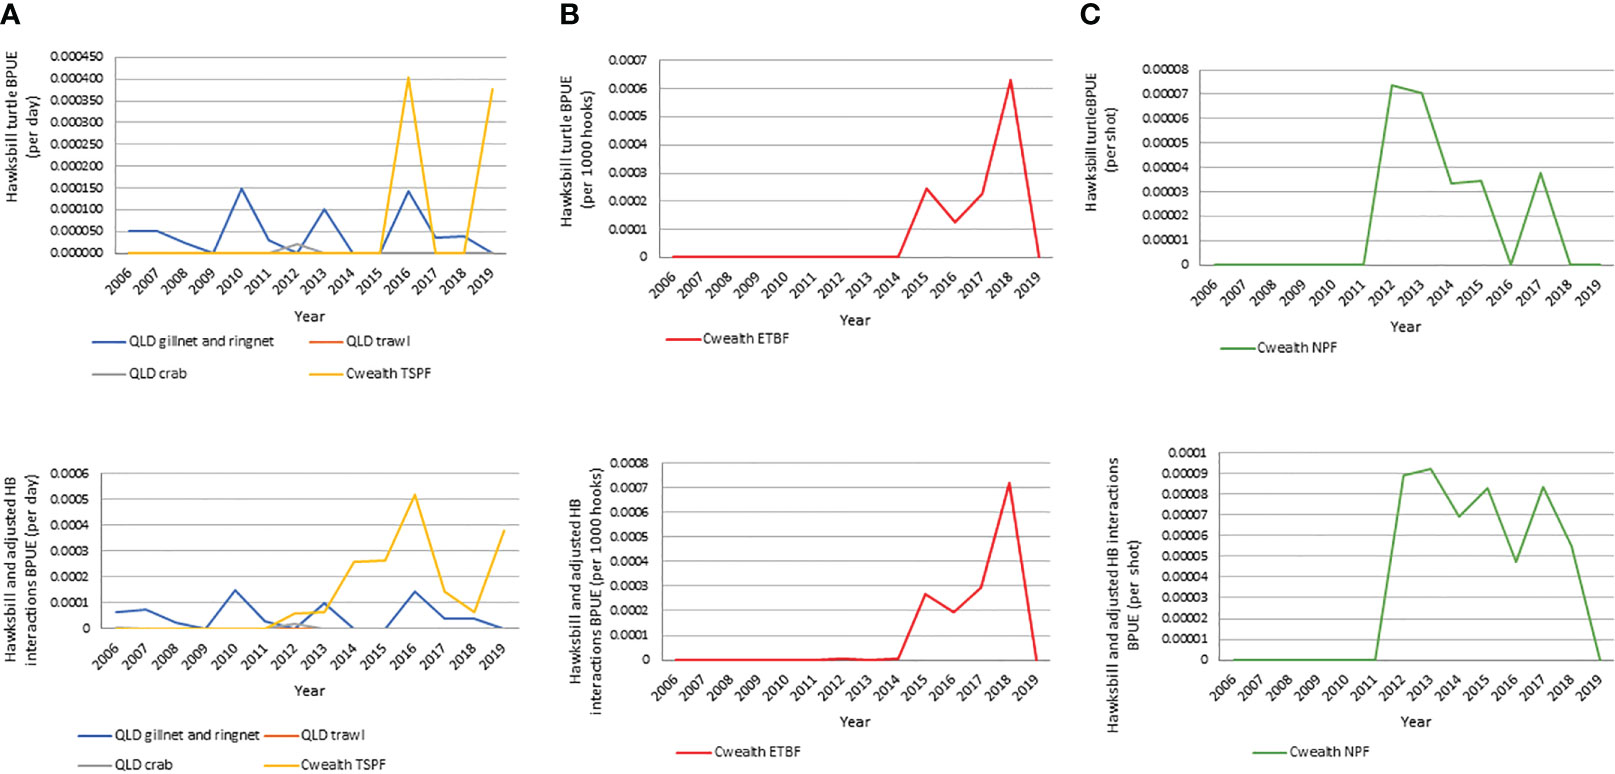
Figure 4 Reported hawksbill and unspecified turtle bycatch per unit effort (BPUE) for hawksbill and hawksbill including unspecified turtles for all fisheries. (A) all state and Commonwealth TSP; (B) ETBF; (C) NPF.
Overall, these results indicate that ETBF and the gillnet and ringnet components of the ECIF and GoCIF, likely pose the greatest risk to hawksbill turtles, followed by the NPF and TSPF. However, given the relatively small effort footprints of the east-coast fisheries (ETBF and ECIF) in relation to the distribution of the neQld hawksbill population, all bycatch cannot be attributed to the neQld hawksbill stock. Further, hawksbills on the east coast of Queensland have mixed foraging populations (e.g. Bell and Jensen, 2018), which means a genetic analysis of bycatch is required to accurately estimate bycatch of neQld hawksbills.
The total area of the post-nesting UD within the ECIF and GoCIF is 2026 km2, an underestimate as it excludes reporting cells that we were unable to collect data from due to privacy law. The total days fished in the post-nesting UD is estimated to be around 4990 days/year over multiple licences. The mean number of days fished in each grid cell equated to 1022 days fished per year (where days fished = days fished by all fishers with a licence in that cell). The greatest (very high) exposure of gillnet and ring net fishing pressure of 1814 days fished/year within post-nesting UD was found off the coastline of Aurukun to the north west of Norman Creek, and off the coast between Mapoon and Nanum of West Cape York (Figure 5). Not all data was available for eastern Cape York because there were < 5 licences active in reporting grid. While most effort in ECIF is from Cairns south, we note that large mesh netting is likely off the coast between Starcke and Cape Melville around the Howick Group of Islands, north to the Claremont Isles and around the inshore areas off the coast of Lockhart where fishing effort is distributed.
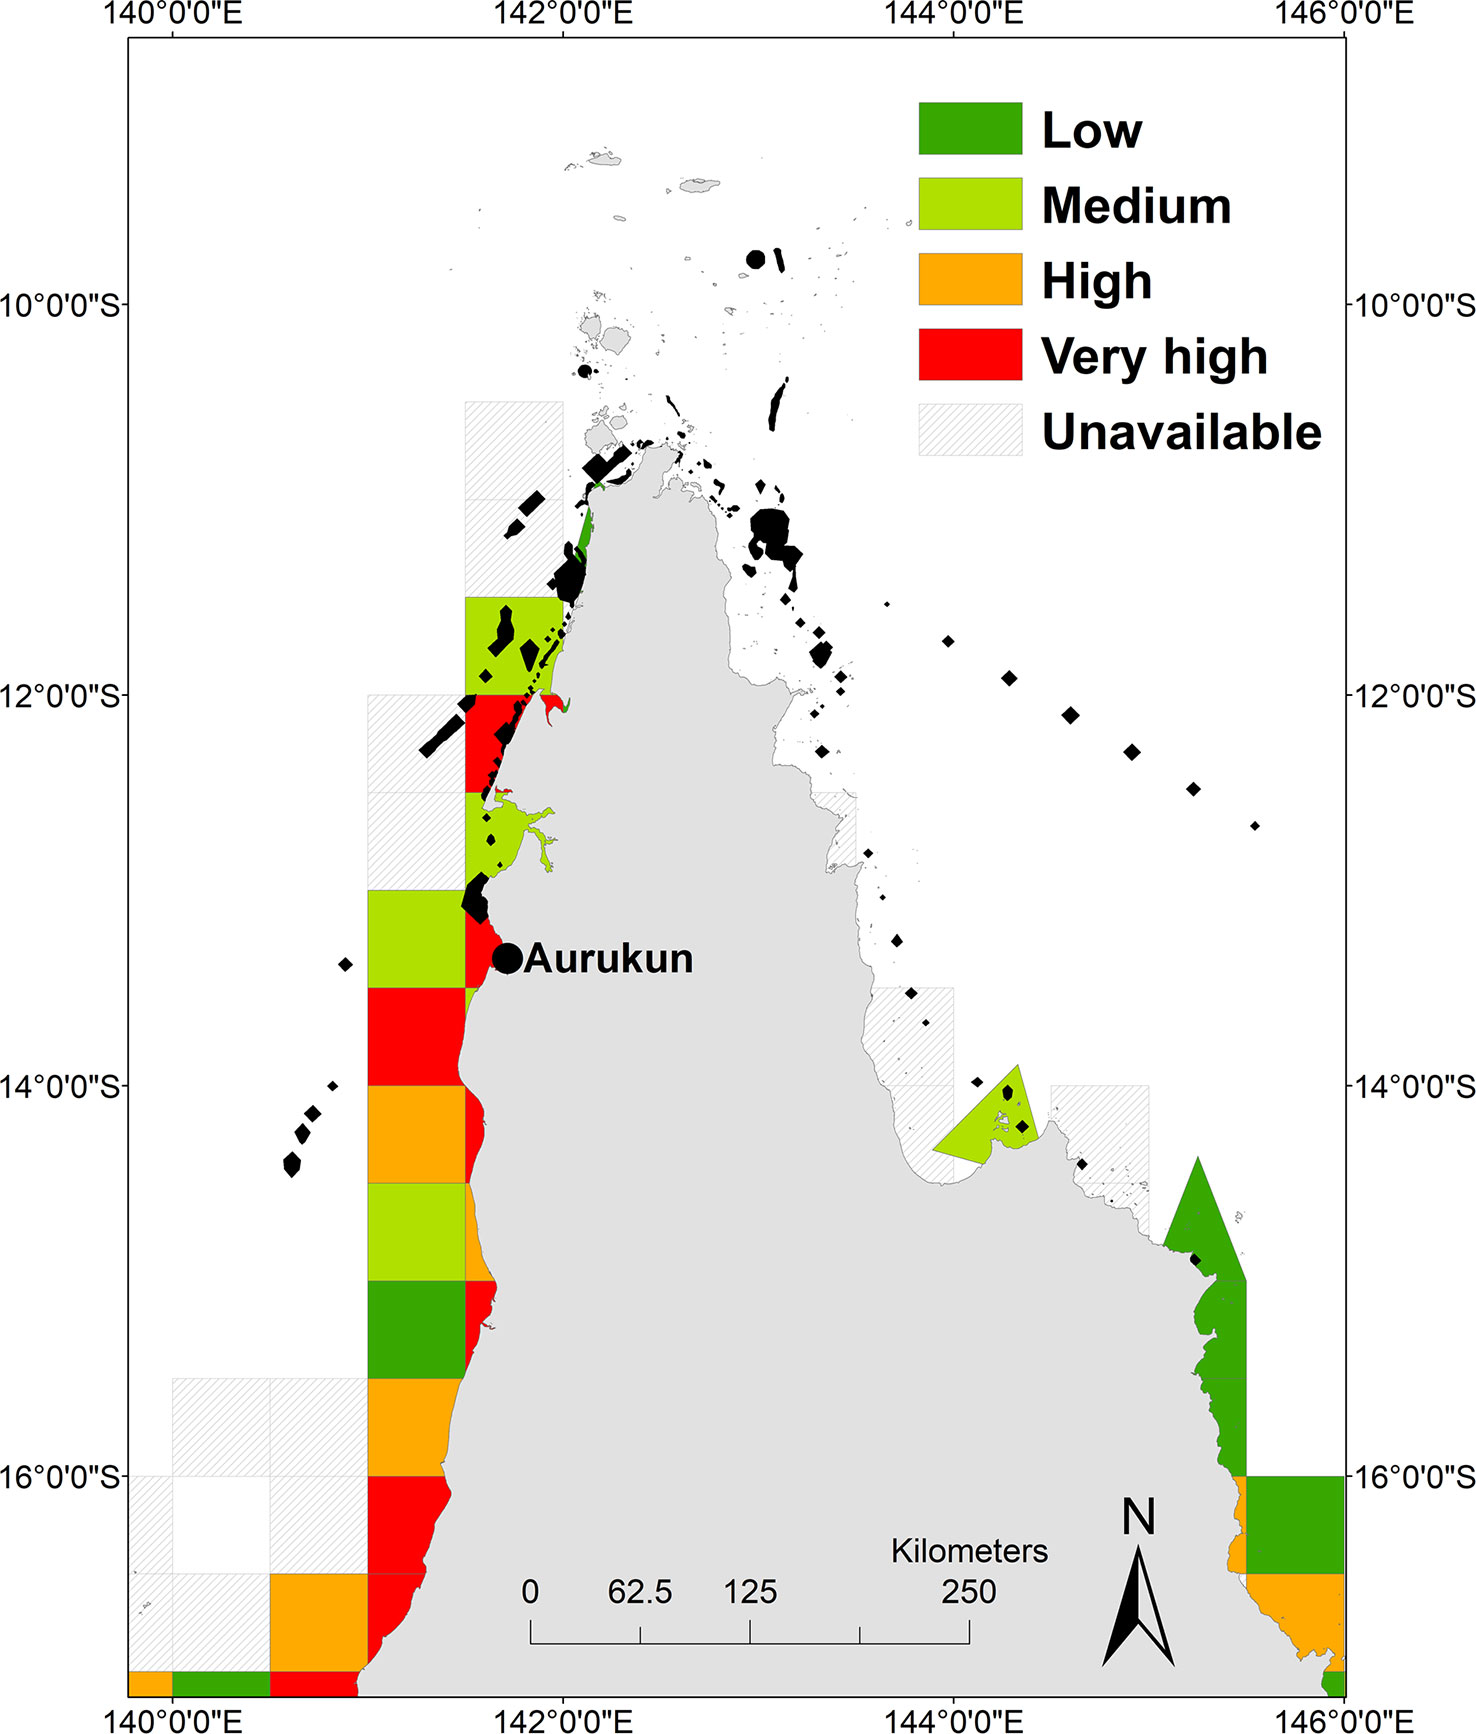
Figure 5 Heat map of gillnet and ringnet fishing pressure. Low (20-164), medium (165-456), high (457-1607) and very high (1604-5137) days of exposure overlaid with hawksbill post nesting home range (black polygons).
Using StrandNET, for which a cause of death was available, fishery bycatch and entanglement accounted for 63% (29/46) of all hawksbill turtle strandings, with 26/29 occurring at 11° and 12° latitude south blocks (east Cape York) in the vicinity of gillnet and ringnet reporting grids where no data was available. We note that StrandNet mortalities also include entanglement from illegal netting and discarded gear.
The total number of ghost nets simulated particle drift tracks in the post-nesting UD was 54,365 (+/- 8064 SD). A mean of 4942 ghost net tracks that overlapped with the post-nesting UD (Figure 6). The highest ghost net track count (8001-9000) was found off the north coast of Mapoon from the Wenlock to the Jackson Rivers, which overlaps with the highest risk of turtle-net encounter off the coastline north of Aurukun to the waters north west of Norman Creek, and between Mapoon and Nanum of West Cape York (Figure 6).
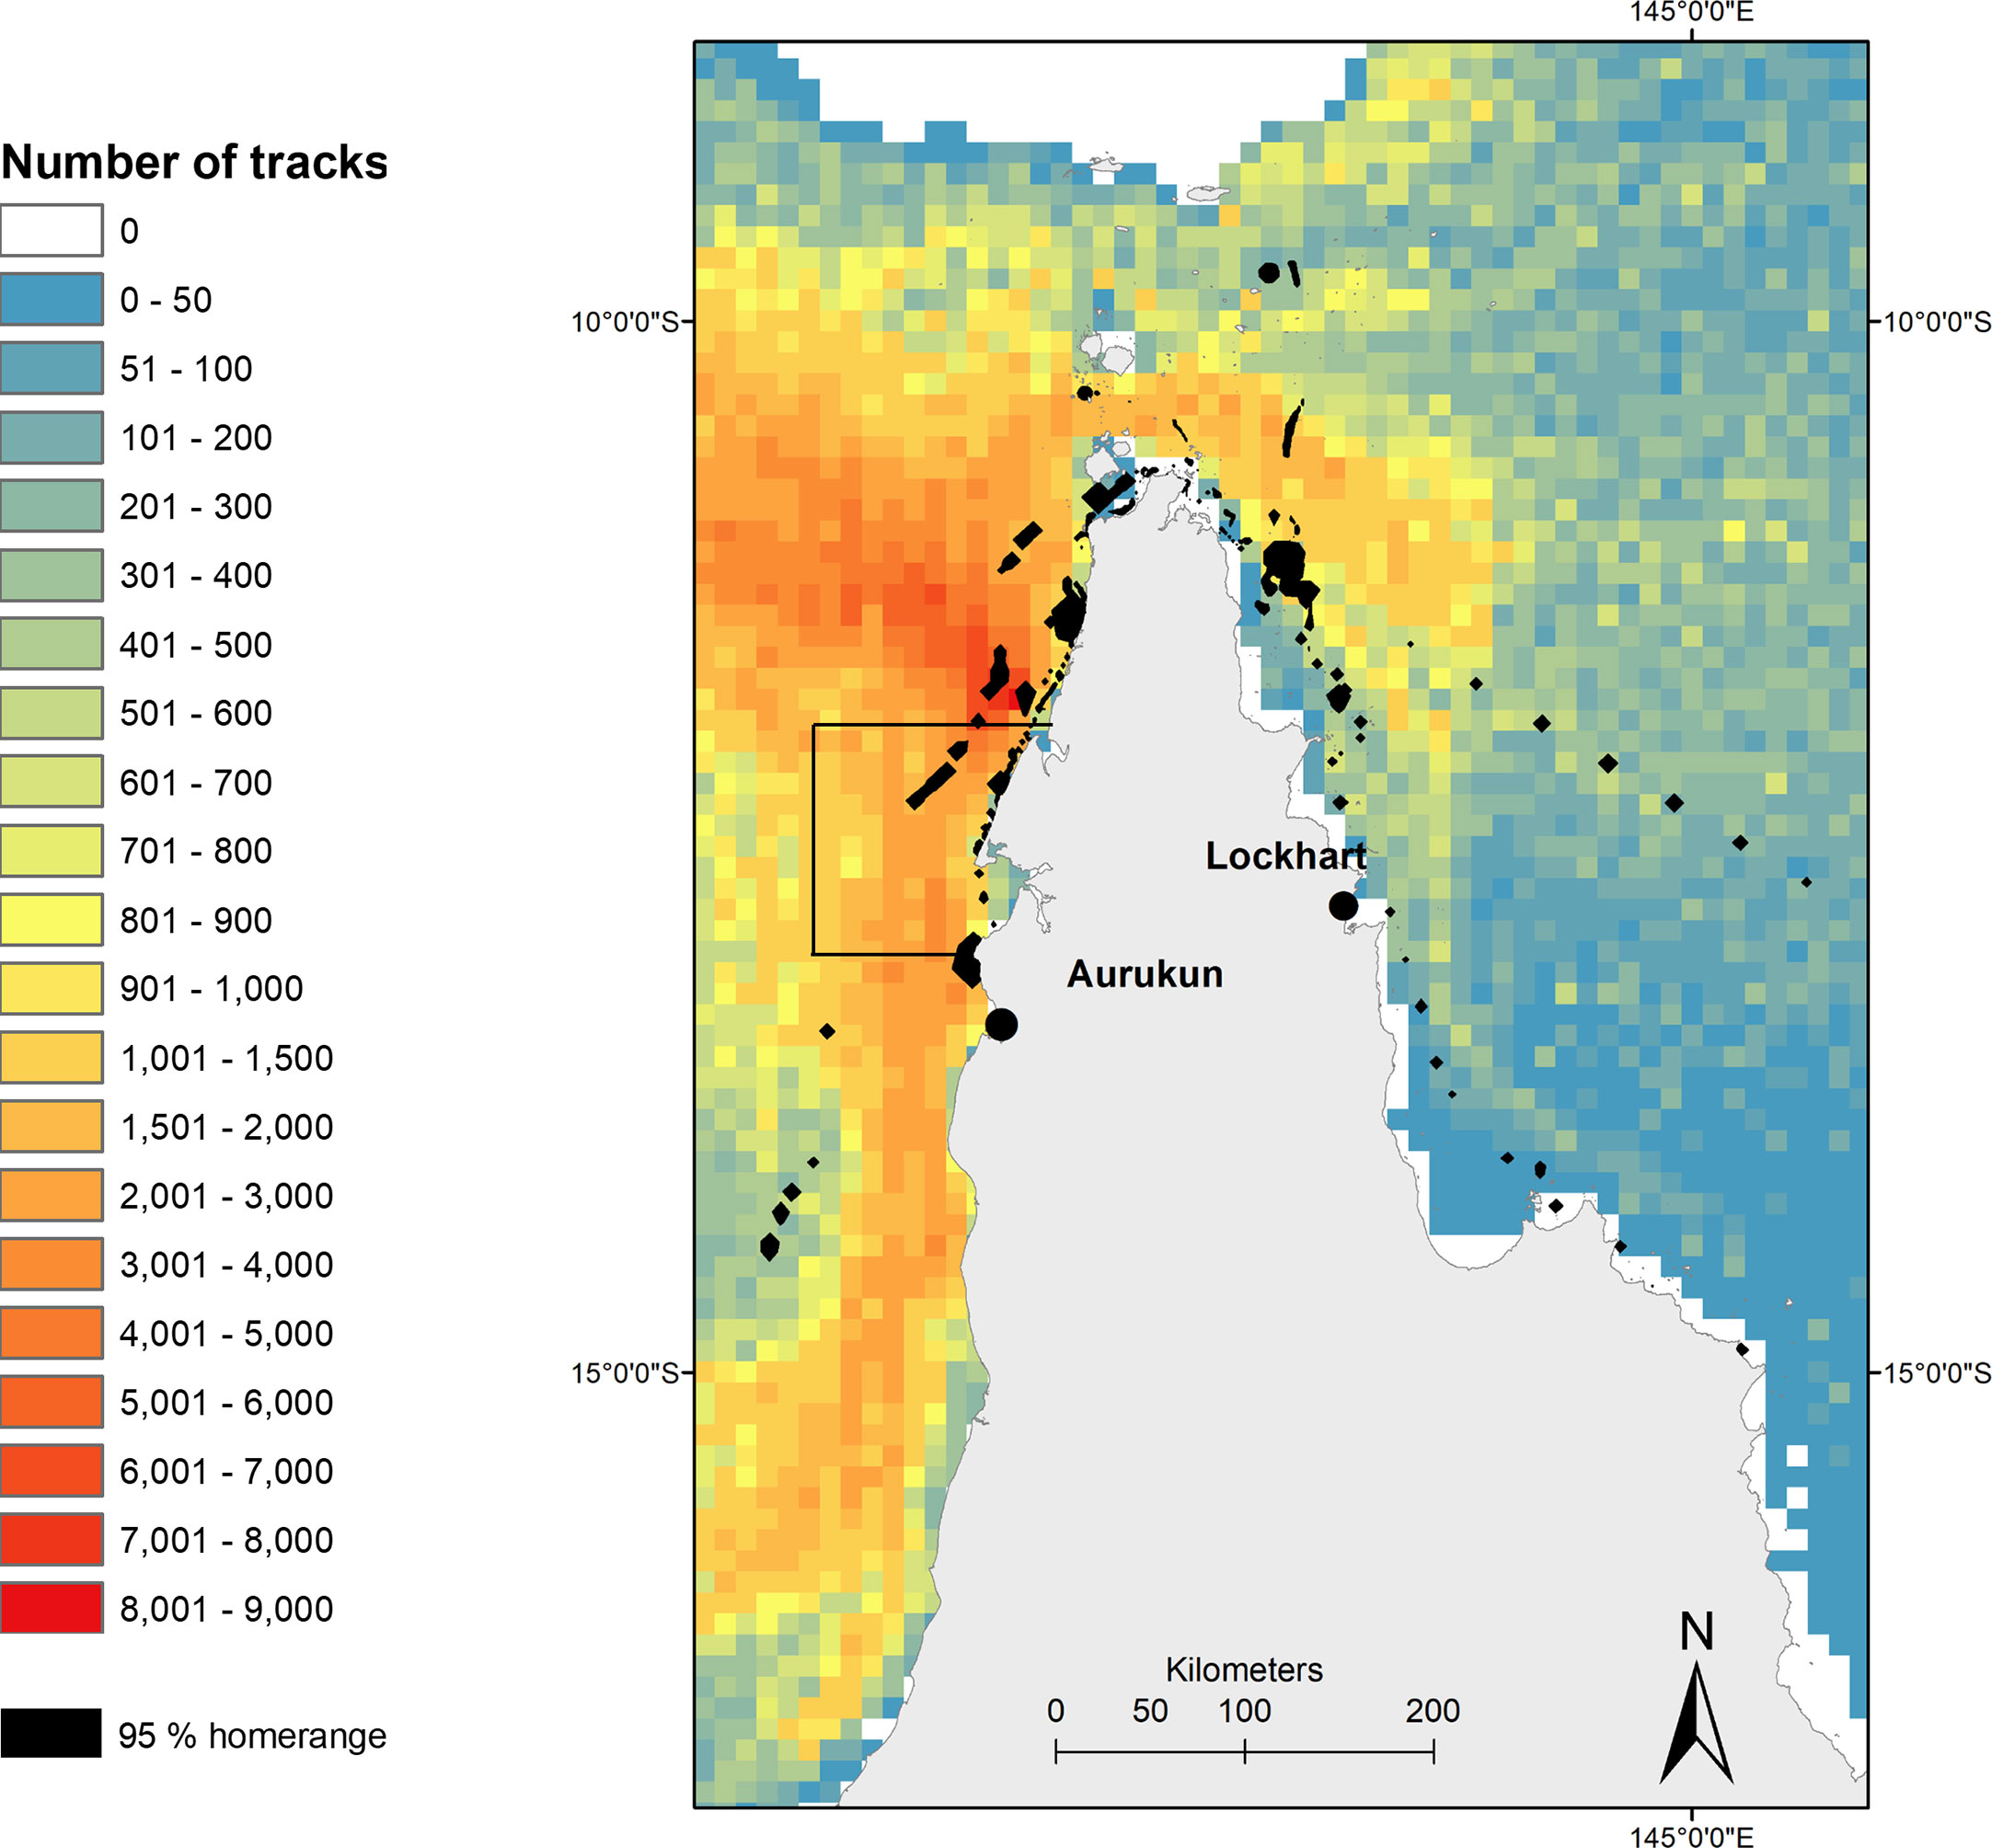
Figure 6 Heatmap of potential ghost net tracks in northern Queensland based on daily particle releases and net length found along the Queensland coastline. Black box denotes most ‘at-risk’ turtle-net encounter area (from Wilcox et al., 2013), overlaid with hawksbill post nesting home range (black polygons). Ghost net data provided by Wilcox et al., 2013.
Of the modelled post-hatchling distribution proportion in Australia (62.73%), the probability of hawksbill hatchling dispersal in the State of Queensland is 0.01% (4,149 points), Northern Territory 0.001% (693 points), and none in western Australia, with the balance in Commonwealth waters 99.99% (70,511,516 points) (Figure 3; Table SM2). Hatchling dispersal probability was next highest in PNG (31.21%; 35,084,374 points) followed by other neighbouring countries in declining probability of Solomon Islands (3,682,993 points), Indonesia (2,198,683 points), Vanuatu (550,678 points) and New Caledonia (386,106 points) (Table SM2). Further an estimated 305.33 km2 is utilised by post-nesting UD (10.84%) within the Torres Strait Fishery boundary, areas available to harvesters including Papua New Guineans under the Torres Strait Treaty. This is relevant given the ongoing take of hawksbill turtles for their meat and eggs continues throughout north eastern Australia (Commonwealth of Australia, 2017; Table SM5) and Papua New Guinea (Opu, 2018) within the neQld stock likely geographical range, and likely considered a major source of mortality (Commonwealth of Australia, 2017).
For this study in the absence of any other data, where clutch predation could be quantified for central island Torres Strait (Torres Strait Regional Authority, 2017), total clutch loss to predators (pigs, goannas, scrub fowl and humans) was estimated at 16.9% (95/556) with human harvest accounting for most of the predation recorded (Table SM4). Extrapolated over 14, 30 and 60 days respectively, 181, 388, 776 clutches may be lost to predation (Table SM4). Consideration of other known predators to turtles, such as cats and foxes, combined with ALA data, clutch predation was considered low in critical nesting sites of Milman, Aukane, Aureed, Sassie and none recorded on Mimi, but shows Islands where multi-species predation is present (Figure 7). Islands with most predators were Albany, Bara, Cap, Yauk, Guiya, Ullu and Saunders. Of these, Bara and Ullu are key nesting sites with >100 track counts (Torres Strait Regional Authority, 2017).
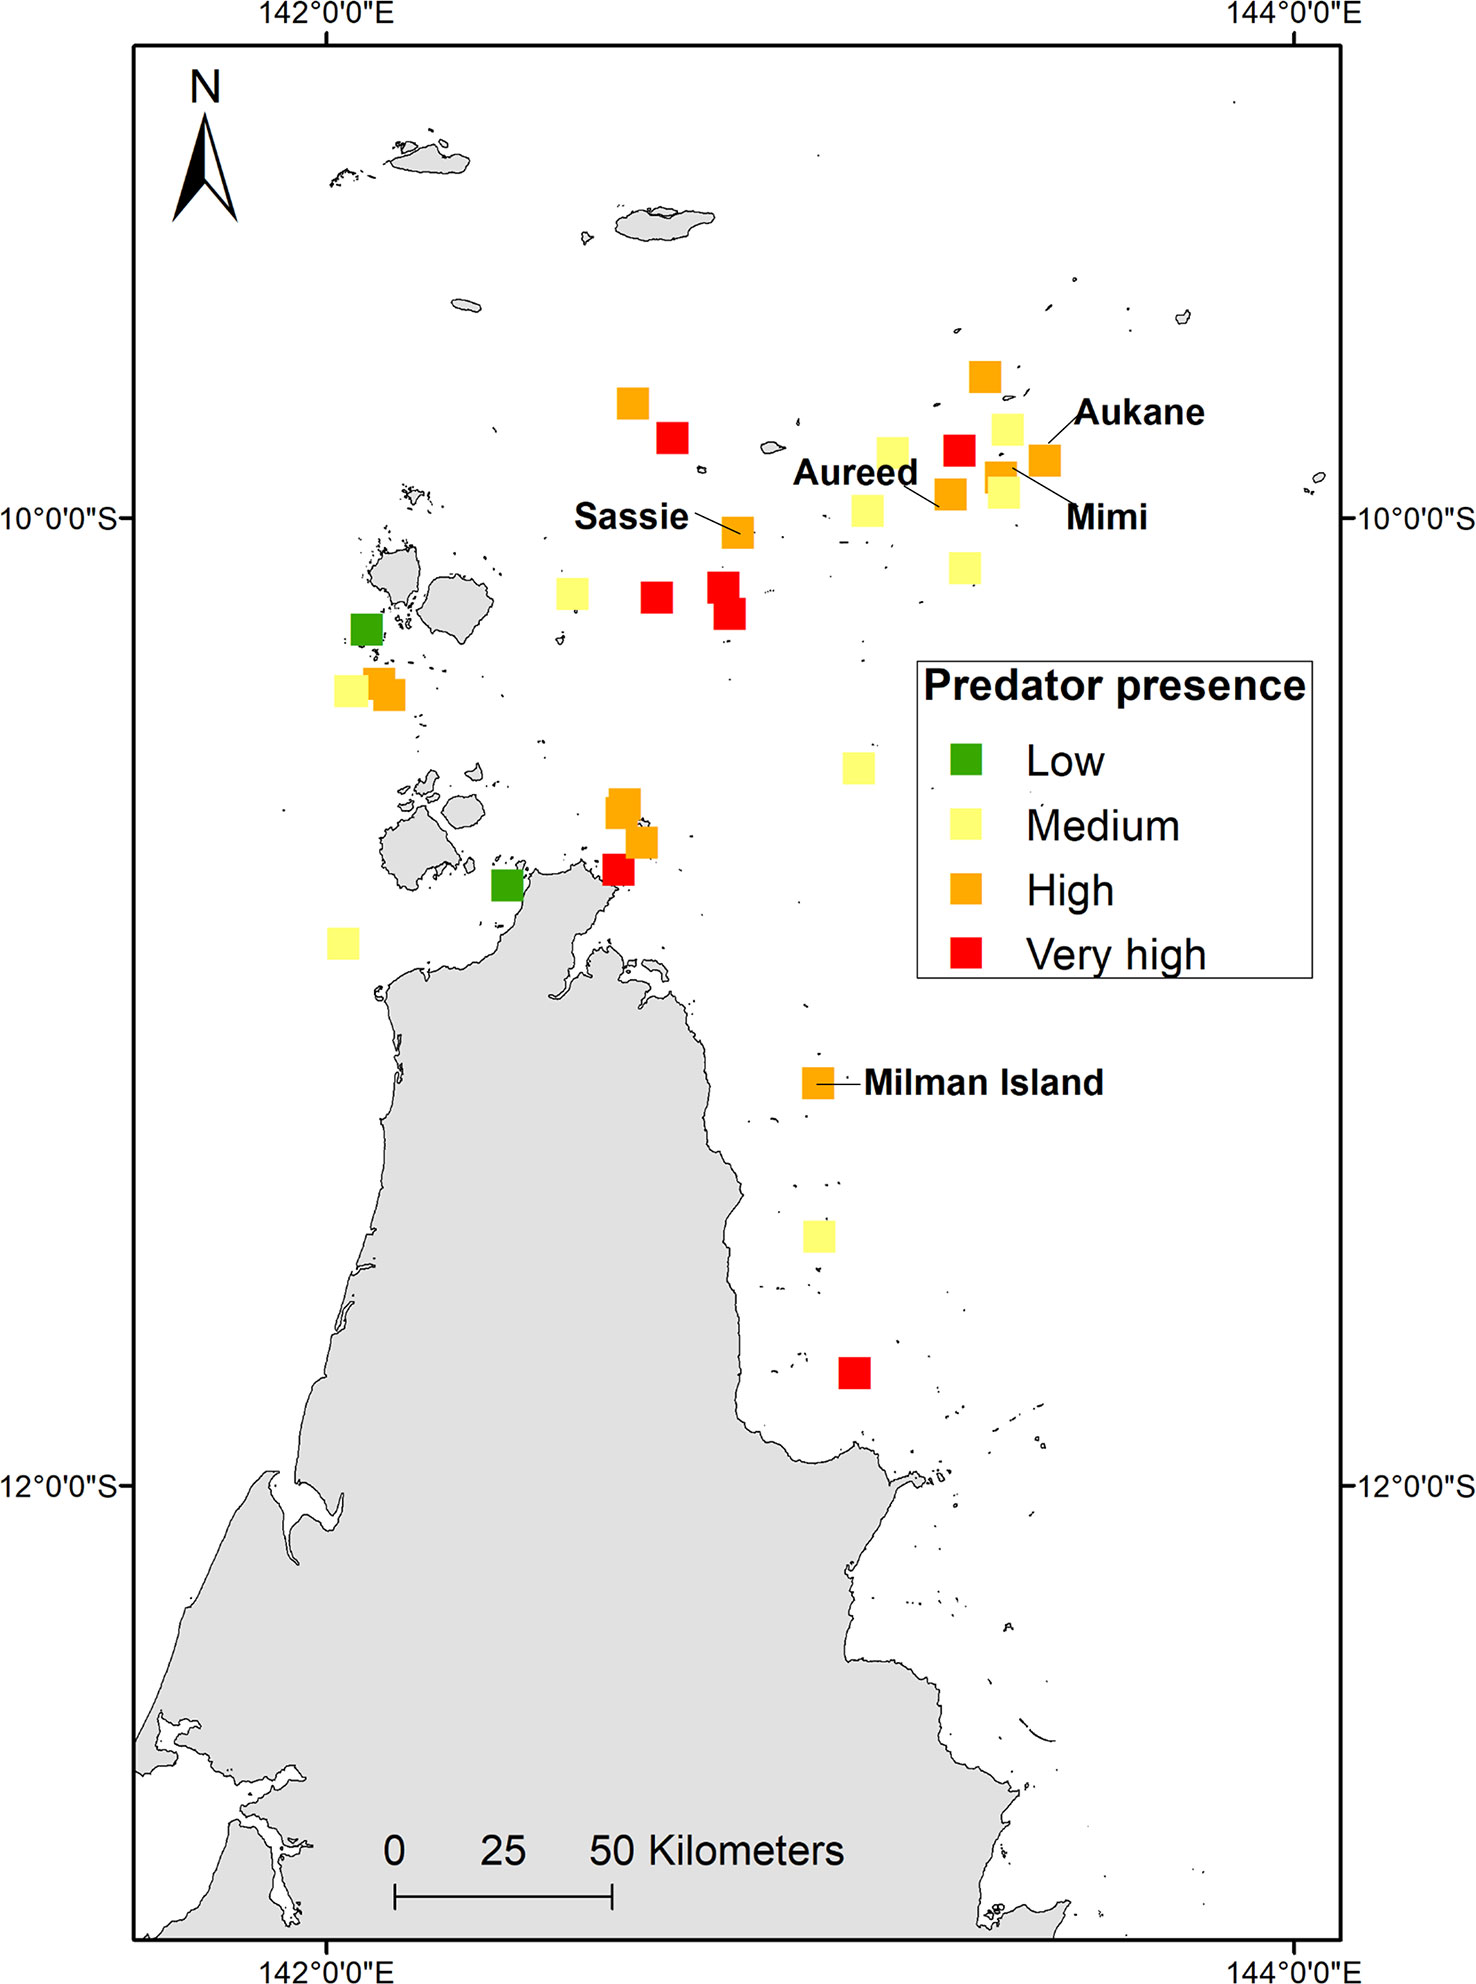
Figure 7 Combined multi-species (terrestrial animals including foxes/dingoes, pigs, goannas/monitors, crocodiles, cats, scrub fowl and traditional human harvest) predators on key nesting beaches. Low = 0, Medium = 1, High =2, Very High = 3.
Post-nesting home range protection is 28.9% (raw numbers in SM2), with 26% of this protection in overlapping GBR (Coast) (Qld) (DES) and GBR (Commonwealth) (GBRMPA) Marine Parks. This is compared to only 0.8% of the foraging home range protected by GBR marine parks. Although hawksbills travel within Commonwealth waters, only 2.9% of their home range is protected by Commonwealth Marine Reserves.Similarly, 0.001% of hawksbill post-nesting home range is included within designated Indigenous Protected Areas (IPA). However, all protection is only afforded to just over one quarter of the post-nesting home range used by hawksbill turtles, and those primarily utilising the east coast of Queensland and GBRMP Marine Reserves. The adult females that reside and make up 75% of the post-nesting home range on the western side of Queensland are only 1.9% protected by DAWE Marine Reserves (none in State waters) in their west coast post-nesting home range, as there is limited marine park protection within Torres Strait or Gulf of Carpentaria (Figure 8).
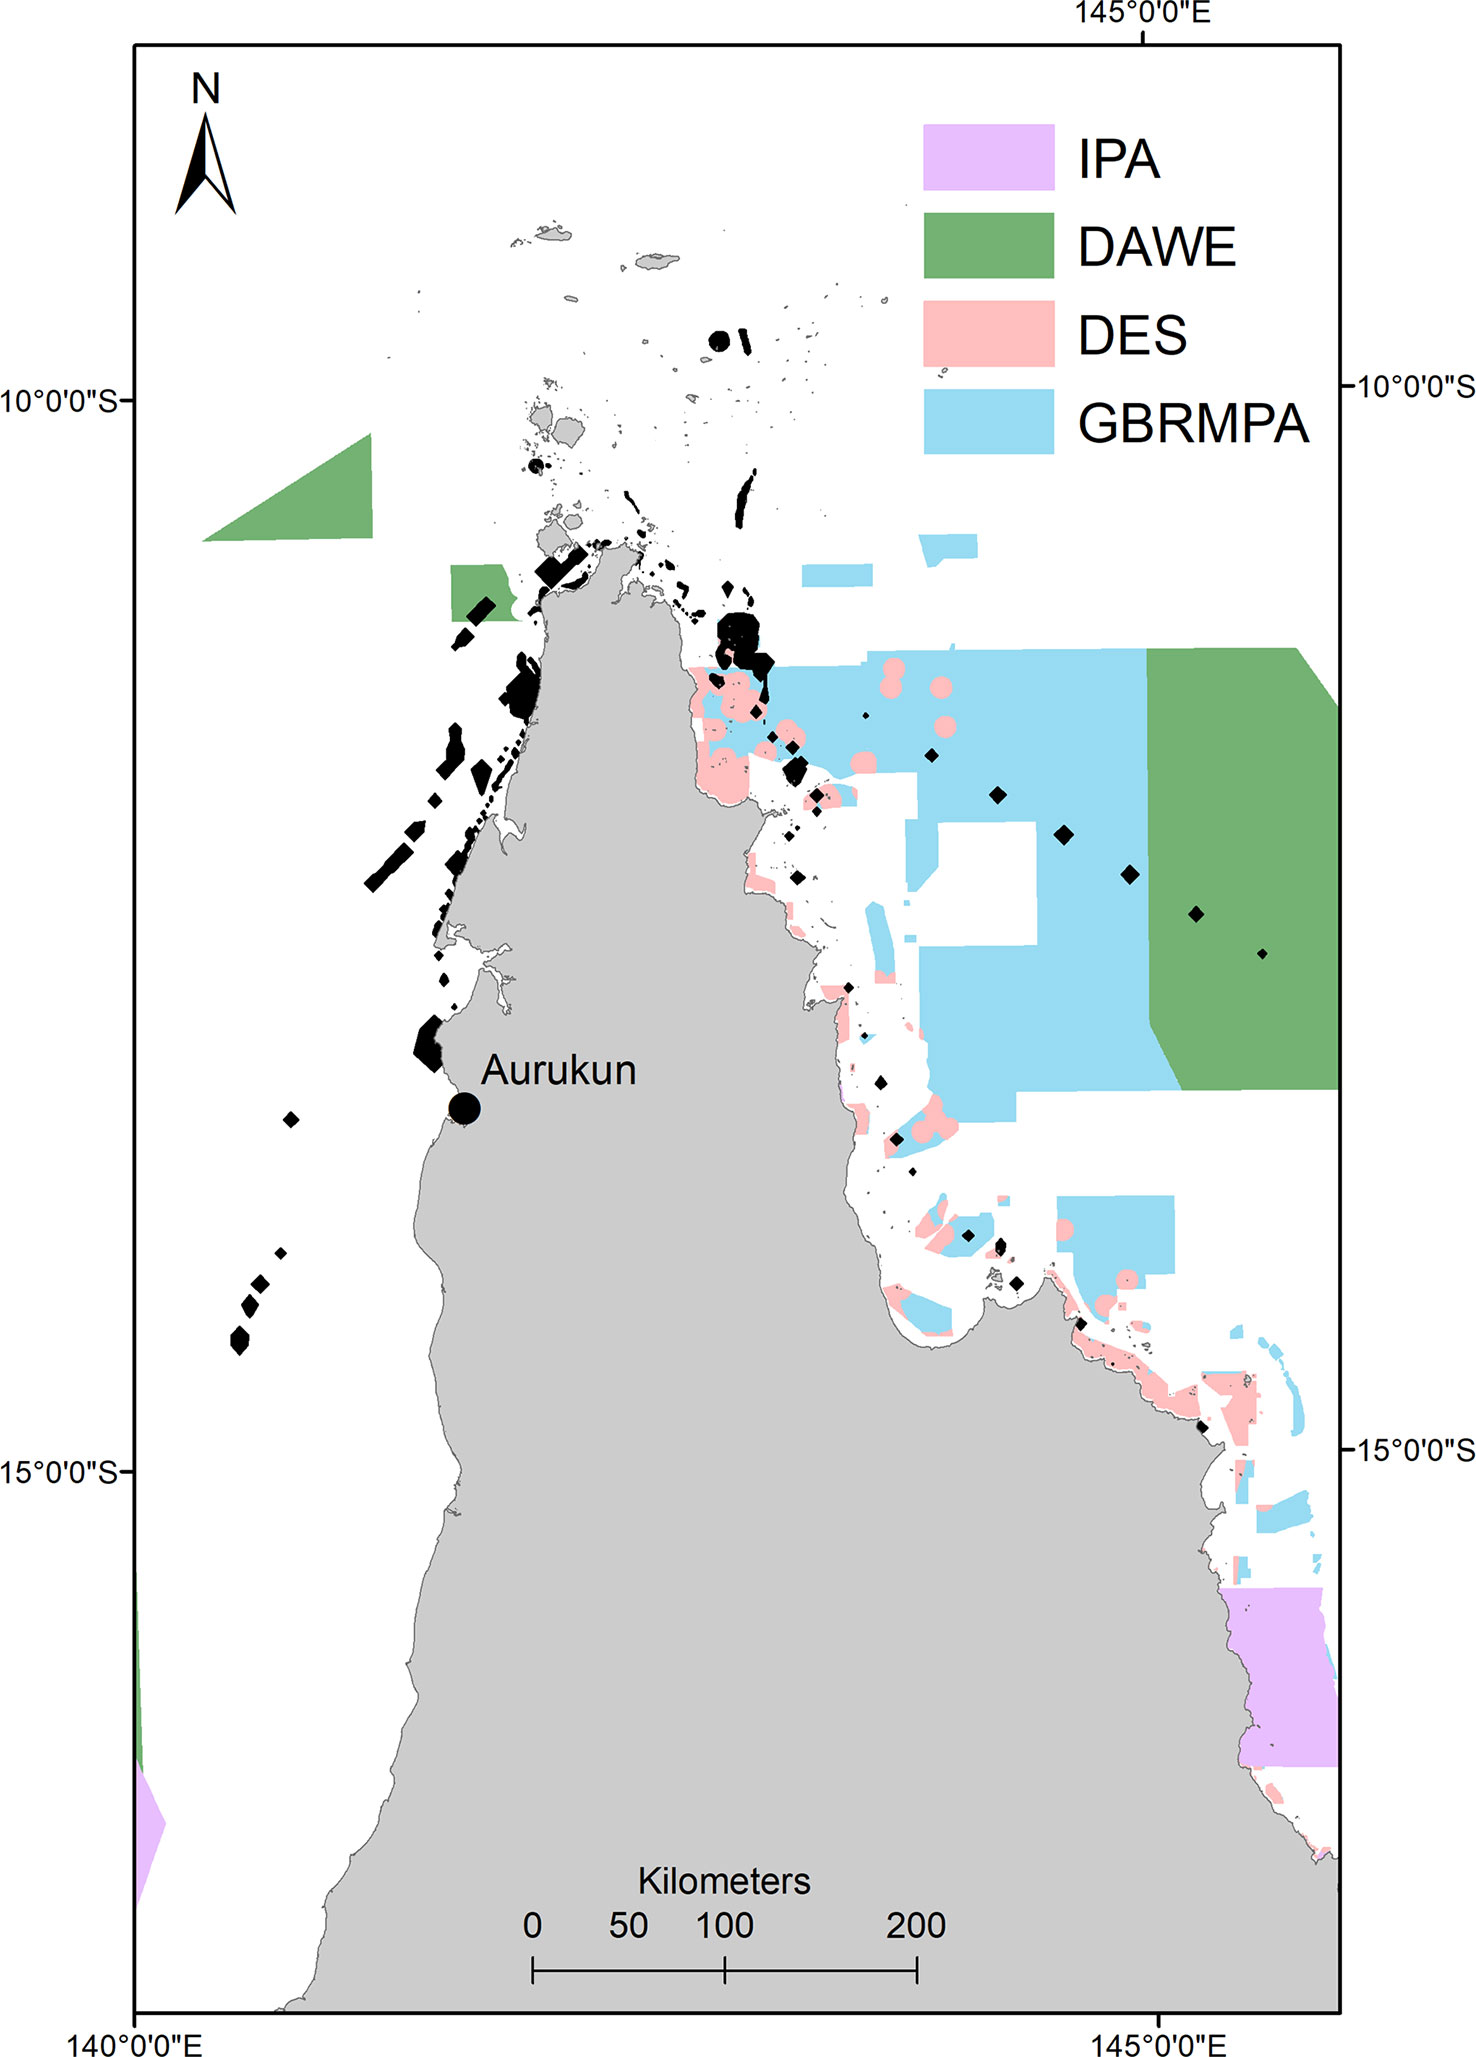
Figure 8 Marine reserve (IUCN category I and II) and Indigenous Protected Area overlaid with hawksbill post nesting home range (black polygons). IPA, Indigenous Protected Area; DAWE, Department of Environment, Agriculture and Water (Commonwealth Government of Australia); GBRMPA, Great Barrier Reef Marine Park Authority (Commonwealth Government of Australia); DES, Department of Environment and Science (Queensland Government).
Our systematic review and risk analysis did not identify a single, pervasive threat to the Milman Island nesting population or the greater neQld stock for targeted management action. However, after eliminating risks ranked as negligible to the survival of the stock (e.g. sky glow and chemical contamination), climate change, harvest (including eggs), ghost-net interactions and fisheries were ranked as high to very high risks to the stock. Although the mortality from each of these threats could be considered small in isolation, it is important to prioritise any feasible actions that reduce mortality of a small, endangered population that is perhaps only a decade from extinction (Bell et al., 2020). It is also sensible to apply the precautionary principle for threats with high uncertainty but potentially significant consequences, especially when they are likely to occur.
The post-hatchling dispersal modelling suggests that while most turtles remained on the Australian shelf, neQld hawksbills were likely to settle in foraging areas in other countries including Papua New Guinea and Indonesia. While this aligns with historical tag returns (Miller et al., 1998; Limpus and Miller, 2008), it also stands in contrast with the fact that none of the 13 turtles tracked in this study, nor the 12 neQld hawksbill turtles tracked in previous studies left the Australian shelf, and all returned to foraging areas in the state of Queensland (Barr et al., 2021; I. Bell unpublished data). This suggests that survival to nesting is low outside of Australian waters, or where turtle fisheries are allowed (e.g. Torres Strait Treaty) and where illegal take is known to continue (LaCasella et al., 2021). It is also possible that the discrepancy between the post-hatchling dispersal modelling results and the foraging areas identified for adult females is because of developmental migration (senus Bolten et al., 1998), although there is no evidence of developmental migration for this population from tag recoveries (reviewed by Limpus and Miller, 2008) or for hawksbill turtles elsewhere in northern Queensland (Bell et al., 2012). Genetic studies linking breeding and foraging hawksbills in their distributed range (e.g. the Torres Strait and PNG) will further inform the disparity between post-hatchling and reproductive female dispersal. Nevertheless, the results emphasise the importance and need for strong protection of the neQld hawksbills that remain in Australia’s jurisdictional waters. Even though Cape York Peninsula and Torres Strait are undoubtedly strongholds for the last remnants of this endangered genetic stock, there are no marine protected areas in coastal waters of western Cape York or in Torres Strait.
Considerable uncertainty also remains in the bycatch rates from net fisheries that overlap with core hawksbill foraging habitat, such as the GoCIF fishery and the northern sector of the ECIF fishery, both likely a key source and pose a sizeable risk to the neQld hawksbill stock. Ghost net hotspots also generally overlap with the GoCIF raising additional risk to this stock’s foraging hawksbills. The Commonwealth trawl fisheries overlap with the range of the post-hatchling dispersal and post-nesting migration, and continued low rates of hawksbill and high rates of unidentified turtle bycatch in these fisheries suggest that they pose a small but ongoing risk. Even though overall bycatch was the highest in the ETBF over the last 5 years (Table SM3), a large proportion of this is likely to be from other genetic stocks.
The new post-nesting tracking data analysed in this paper reinforces earlier results (Gaos, 2011; Hoenner et al., 2016; Barr et al., 2021), in that Milman Island nesters meander along their migratory routes and show fidelity to multiple small foraging grounds with little collective preference or specificity towards a singular/particular foraging ground. We acknowledge that tracking additional individuals is likely to identify additional foraging and migratory habitat but argue that the habitats identified to date are unquestionably important to this endangered stock.
Overall, most tracked nesters to date migrate to foraging grounds on western Cape York and Torres Strait (western Queensland). Although this should be further investigated by genetic studies on the foraging grounds identified in our study, hawksbills nesting elsewhere in the region, such as Solomon Islands, north-eastern Arnhem and PNG, have not been tracked to foraging grounds in western Cape York and Torres Strait (Hoenner et al., 2016; Hamilton et al., 2021); Madden Hof, unpublished data), further supporting the contention that most hawksbills in western Queensland are likely to be from the neQld population. This is further backed by a foraging genetic study published in Queensland revealing ~84% of hawksbill turtles on the Howick Island group (located around Cape Flattery, east Cape York Peninsula) are from the Solomon Islands stocks, with only ~14% contributed from neQld (Bell and Jensen, 2018). Meaning any intervention in eastern Queensland will support multi-stocks, but in western Queensland primarily the neQld stock. Given greater residence in western Queensland, greater intervention and protection efforts in this area is likely to be required to rebuild this stock.
Without concerted effort in Australia to reduce known threats, the neQld population may face a similar fate to other species like the eastern Pacific leatherbacks (Ábrego et al., 2020), Vaquitas (Jaramillo-Legorreta et al., 2007), the Yangtze River dolphin baiji (Turvey et al., 2007) amongst several other species known to become unviable or extinct in the wild. However, recovery is possible (e.g. Solomon Island hawksbill stock, (Hamilton et al., 2015); humpback whales, (Bejder et al., 2016)) where guidance to inform threat mitigation or measures to reform population trajectories are enacted.
Given that the negative impacts of climate change are already being observed at marine turtle nesting beaches of north Queensland (Jensen et al., 2018), preparing for this eventuality and abating all other threats should be a management priority for the neQld stock. Temperatures within the region of the neQld stock have increased at 0.10-0.15°C/decade over the past 55 years (Australian Government Bureau of Meteorology, 2018). Whilst hawksbill foraging populations throughout the GBR are already skewed to a [natural] higher female ratio (~3 females:1 male; (Limpus, 2009; Bell et al., 2012), a rise in regional incubation temperatures will likely cause additional female sex ratio skewing, and increased risk of reduced hatchling production during periods when nest temperatures exceed lethal temperatures 34°C+ (Dobbs et al., 2010).
Acknowledging that hawksbills nest year-round and while unlikely, if they were able to rapidly adapt to rising temperatures by altering their peak nesting period to cooler months, this study suggests that sex ratio output may already be skewing towards an increase in female production at neQld stock nesting beaches. Predicted temperatures under both conservative and extreme emission scenarios (2021-2080) are likely to facilitate all female producing populations at many key nesting sites including Aukane, Bourke, Mimi and Zuizin. Whereas the most likely nesting beaches to produce males or a more balanced sex ratio under climate projected temperatures are Aureed, Kebi Kein, Yauk and Warral. As both Aukane and Aureed are reported to have high nesting density, early assessment (e.g. Staines et al., 2020; Patrício et al., 2021) to determine realised sex ratios, and intervention (e.g. Smith et al., 2021) to reduce and maintain temperatures, along with protection, should be prioritised for both of these critical nesting sites.
Notwithstanding sea level rise inundation (assessed in this study as coastal erosion but thwart with resolution limitations as it completely covered all key nesting habitats in Torres Strait; Table SM2), of similar climate change concern is the changes in reproductive periodicity, shifts in latitudinal ranges, and changes in foraging success which are all expected in a hawksbills marine life history phase (Patrício et al., 2021), requiring additional research and action relating to the neQld stock.
The neQld stock utilises habitats that have the potential to interact with three Queensland and three Commonwealth managed fisheries. Significant under-reporting of turtle interactions by commercial fishers is likely in all relevant Queensland and Commonwealth fisheries with the exception of the ETBF post-2015 when electronic monitoring was implemented. The absolute and BPUE values reported and those estimated within this study are therefore likely to be a minimum record of turtle bycatch within the study periods. Considered collectively, all fisheries pose a small but cumulative bycatch threat to the neQld hawksbill populations. However, should those fisheries that have no independent observation of catches (Queensland managed fisheries – ECIF & GoCIF, ECOTF and the crab fishery) exhibit the same increases to reported turtle catch as the ETBF when electronic monitoring was introduced, the number of hawksbill turtles’ interaction in commercial fisheries could be much higher. While individually, the ETBF, ECIF and GoCIF, TSPF and NPF expose hawksbills to the greatest bycatch threat, mixed hawksbill stocks confound these results except in western Queensland where the neQld stock is likely to dominate and the GoCIF and NPF fisheries are concentrated.
The presence of electronic monitoring and independent observers in the ETBF, NPF and TSP fisheries have provided a higher degree of confidence in bycatch and BPUE calculations for hawksbills. However, scientific observer coverage (2-5%) and electronic footage monitoring review (10%) (ABARES, 2017; AFMA, 2019) of fishing trips per year is low and increases the uncertainty and accuracy of reporting, as demonstrated by continued and in some cases, increasing records of unspecified turtles. The absence of such programs in Queensland fisheries, in particular the ECIF and GoCIF, suggests that estimates should be treated with caution and as underestimates. Extrapolated bycatch data for the gillnet and ringnet fisheries (between 150-162 hawksbills in the period 2005-2019) and estimates based upon historical observed interaction rates in the Queensland FOP (of 651 hawksbill turtles in the period 2005-2019) suggest this fishery may in fact be having a greater impact - in particular, in western Queensland waters from Aurukun to Mapoon, and although mixed stocks, the inshore areas opposite Starcke to Cape Melville and Lockhart. Gillnet fisheries totalled 4990 days/year fished in the home range of hawksbills, with the greatest fishing pressure off west Cape York north of Aurukun, highlighting GoCIF as a key source of risk to the neQld hawksbill stock. GoCIF was also assessed as a high risk to hawksbill turtles in a separate study (Jacobsen et al., 2021).
Overall, species identification, presumed under-reporting and lack of independent fisheries observers in Queensland fisheries are ongoing issues. The coastline north of Aurukun in particular is remote with low rates of compliance monitoring by fisheries patrols, and there have been numerous well publicised cases of illegal fishing from foreign fishing vessels on Cape York and Torres Strait. There is clearly a significant overlap between turtles and fisheries effort that underscores the urgency for better reporting and management plans and there is a clear need for greater scrutiny of fishing effort in hawksbill home ranges.
Whilst the use of turtle exclusion devices (TEDs) has been mandatory since 2001, significantly reducing the capture and mortality of marine turtles in Commonwealth and Queensland trawl fisheries (Brewer et al., 2006), this study found that interactions in the TSPF and NPF remain an ongoing threat to hawksbill (and unspecified turtles). Because hawksbills were reported to be most susceptible to drowning (Limpus, 2009), additional oversight of the application/use of TEDs, species identification training and other bycatch mitigation strategies should be priorities for managers. LEDs attached to fishing nets has proven effective to reduce marine turtle entanglements overseas, but there is no evidence to date that they reduce hawksbill turtle catches (e.g. Gautama et al., 2022; Senko et al., 2022b).
Ghost nets continue to present a serious threat to hawksbills with a hotspot generally overlapping with the GoCIF. With most of the ghost net drift trajectories on the west Cape York (where more than three quarters of the satellite tracked turtles migrate to reach their foraging grounds), it is highly probable and supportive of Wilcox et al., 2013 assessment (of 32.8% hawksbills caught in ghosts nets), that the neQld stock hawksbills are being negatively impacted by ghost nets and are particularly vulnerable along the waters adjacent to Aurukun north to around Crab Island. Considering post-hatchling distribution is highly likely within the net track paths of the Northern Territory and western Queensland, ghost nets may pose an additional threat to earlier life history phases. Ghost net retrieval and records are monitored and kept by indigenous ranger communities of the Western Cape York Threat Abatement Alliance, but additional support is required including international efforts to address use and disposal within the Timor Arafura Seas before entry into the Gulf of Carpentaria and Torres Strait.
Hawksbill turtle harvesting continues in PNG with take (legal and illegal) within the Torres Strait Treaty boundary (Commonwealth of Australia, 2010). There is also a noted ATSI preference for hawksbills eggs (Commonwealth of Australia, 2017), and outside of the limited TSRA study (2017), an unquantified number of hawksbill eggs are collected from rookeries throughout Cape York Queensland and the Torres Strait. Turtle take has previously been considered unsustainable (cited p.123, Commonwealth of Australia, 2010).
Highlighted by this study, where we do know over half of the uninhabited islands of the Torres Strait are traditionally harvested for hawksbill eggs in the central Torres Strait island clusters (exclusive of the heavily populated western and inner Torres Strait (Torres Strait Regional Authority, 2017), and combined with (a small proportion of) terrestrial predation of exotic and native animals already reaching beyond 16.9% of hawksbill clutches outside of peak emergence, the take of hawksbill turtles and their eggs by indigenous communities within Australian and other western Pacific countries (such as PNG) is more than likely hindering the neQld stock recovery. This is notwithstanding the greater harvest accessibility likely yet lack of knowledge or any robust scientific assessment of “lost year” (0-20 year) migration within northern Australia. In this review where harvest levels are quantified and considered high, particularly at key nesting sites e.g. Bara and Ullu, interventions (e.g. Madden Hof et al., 2019) or protection (e.g. no-take areas or seasonal closures) should be considered. Similarly on low clutch loss but medium-high density islands such as Milman, Aukane, Aureed, Sassie and Mimi, full protection should be implemented. Whilst management through non-binding agreements directed towards the sustainable utilisation of marine turtles (including, Traditional Use of Marine Resource Agreements (TUMRAs) within GBRMP management and Conservation Agreements (Indigenous Land Use Agreements) under the Nature Conservation Act 1994), could be improved, understanding the social, cultural and economic drivers behind ‘take’ is fundamental in improving the coexistence between humans and hawksbills, and where loss is considered high, other non-consumptive uses should be explored (Mancini et al., 2011; Liles et al., 2015). As there is evidence of a continued illegal international trade of tortoiseshell and/or whole hawksbill turtles within the Arafura Sea to Coral Sea Region (Commonwealth of Australia, 2010; Department of Environment and Science, 2021), inadequate monitoring and enforcement of trade regulation by signatory States (including Australia, PNG and Indonesia) under the Convention of Trade in Endangered Species (CITES) (Barr et al., 2021) requires attention – particularly improving cooperative implementation of CITES Resolution (adopted at CoP19, November 2022).
A conservation target in Queensland is to provide strong habitat protection for at least 70% of nesting sites for each genetic stock, whereas it has been estimated that only <30% of neQld hawksbill rookeries are protected (Department of Environment and Science, 2021). Our study supports this finding. Although Milman Island and its surrounding waters are highly protected, other nesting sites are overlooked. No hawksbill foraging grounds have been listed as ‘critical habitat’ under the Commonwealth’s Recovery Plan for Marine Turtles in Australia, 2017 or by the EPBC Act, which would afford legislative protection. With under 3% of the post-nesting hawksbill UD protected by Australia’s National Representative System of Marine Protected Areas (NRSMPA), only up to 28.9% within primarily east Queensland Marine Parks and with trivial protection afforded to hawksbills within the Torres Strait and the Gulf of Carpentaria (1.9%), hawksbills migratory routes and foraging areas remain mostly unprotected.
With the ability to link to the NRSMPA and the NCA existing legislative frameworks, the neQld stock critical habitat should be identified under the EPBC Act and integrated into the marine bioregional planning process as Biologically Important Areas. Complementary protection (similar to the GBR Marine Parks) should then be afforded to hawksbills home ranges within the Gulf of Carpentaria by State Government and Commonwealth Governments – particularly the area from Aurkun to southern Crab Island. Under customary law, and the TUMRA, ILUA or IPA processes, greater protection of the critical nesting, post-hatchling, migratory and foraging area of the neQld is also urgently required in the Torres Strait. This could also be reflected in stronger conservation measures adopted under the Torres Strait Treaty to curtail harvesting activities (Articles 14 and 20) for the conservation of hawksbills.
Without concerted attention and focus to address cumulative threats and provide protection in the Torres Strait and of the northern coastal waters of west Cape York, it is reasonable to suggest extirpation is likely within the next few decades.
Migratory species such as marine turtles, present specific management challenges, but supported by knowledge of their habitat use and ranging behaviour within all phases of their life history, threat mitigation is possible. For the first time, the neQld stock life history is presented, and relative threat exposure is assessed to pinpoint and offer conservation and protection measures to reverse its likely population trajectory towards extirpation. At no stage is a hawksbill turtle free of predation, fishery interaction or climate change impacts amongst other simultaneous threats. Supported by this study, the cumulative take of hawksbill turtles in northern Australia (and surrounding western Pacific countries) should be considered non-sustainable (Department of Environment and Science, 2021). Urgent protection of post-nesting home ranges, consideration of gillnet and ringnet effort reduction particularly in western Queensland, the introduction of additional bycatch mitigation in all impacting fisheries, deployment of predation reduction mechanisms, employment of climate intervention strategies, and the declaration of critical habitats including “no-take” zones or moratoriums could all collectively be enacted within north-east Australian and cross border with PNG. This is a matter of urgency given the size of the critically endangered population, if the once described “world’s largest” hawksbill stock is to avoid extinction. The suggested cumulative response could simultaneously include:
A. Providing protection to Aukane, Aureed, Sassie and Mimi Island rookeries that are comparable to Milman Island (including a buffered in-water/inter-nesting zone);
B. Further climate assessment and intervention to likely long-term male producing nesting beaches of Aukane and Aureed;
C. Seasonal closure protection from egg take at all critical nesting beaches, and Bara and Ullu Islands;
D. Defining nesting, migration, and foraging grounds as Biologically Important Areas and as EPBC Act ‘critical habitat’ under the EPBC Act (as a requirement of the Recovery Plan);
E. Declaring marine protected areas (or other similar mechanisms) for critical hawksbill habitat within the Gulf of Carpentaria, particularly from Aurkun to southern Crab Island, and increasing customary law management and Torres Strait Treaty (conservation measure) protection in the Torres Strait; and,
F. Urgently re-introducing independent monitoring in all fisheries that interact or that are likely to interact with the neQLD stock, and mandate bycatch reduction measures and/or gillnet regulations to reduce interactions with hawksbill turtles.
The datasets presented in this study can be found in online repositories. The names of the repository/repositories and accession number(s) can be found in the article/Supplementary Material.
The animal study was conducted under the Queensland Government Department of Agriculture Animal Ethics approval number: SA 2015/ 11/526.
CM conceptualised and designed the study and organised access to all datasets. CM undertook all the field work and performed the threat assessments. CM, CS, SM, KA, and JM performed the statistical and spatial analyses. CM wrote the first draft of the manuscript. CS, SM, and JM contributed to writing sections of the manuscript. All authors contributed to manuscript revision, read, and approved the submitted version.
Funding was provided by the World Wide Fund for Nature, its donors and sponsors, the University of the Sunshine Coast, and through Wildlife Computers generous donation of 10 satellite trackers.
We would like to acknowledge Dr. Ian Bell and the Queensland Government’s Department of Environment and Science for their ongoing support, and both theirs and the Apudthama Indigenous Rangers contribution to the satellite tracking field work. Without them this project would not have been a reality. We greatly appreciated the remote transportation from the Apudthama Rangers, NPA Cape York Coast Guard, John Charlton’s Strait Runner and Queensland Parks and Wildlife Service Reef Ranger. We also thank the Sea Turtle Foundation and Western Cape Turtle Threat Abatement Alliance for their field work assistance. To Dr. Ben Gilby, Kevin Lay, Dr. Martin Taylor, Dr. Michelle Ward and Dr. Ben Gilby we thank you for your spatial data and analysis assistance.
JM contributed to this article as an independent researcher and is now affiliated with GHD Pty Ltd Australia.
The authors declare that the research was conducted in the absence of any commercial or financial relationships that could be construed as a potential conflict of interest.
All claims expressed in this article are solely those of the authors and do not necessarily represent those of their affiliated organizations, or those of the publisher, the editors and the reviewers. Any product that may be evaluated in this article, or claim that may be made by its manufacturer, is not guaranteed or endorsed by the publisher.
The Supplementary Material for this article can be found online at: https://www.frontiersin.org/articles/10.3389/fmars.2023.1200986/full#supplementary-material
ABARES. (2017). Fishery status report: Torres strait prawn fishery. Available at: http://data.daff.gov.au/data/warehouse/9aam/fsrXXd9abm_/fsr17d9abm_20170929/18_FishStatus2017TorresStraitPrawn_1.0.0.pdf.
Ábrego M. E., Acuña-Perales N., Alfaro-Shigueto J., Azócar J., Barragán Rocha A. R., Baquero A., et al. (2020). Enhanced, coordinated conservation efforts required to avoid extinction of critically endangered Eastern pacific leatherback turtles. Sci. Rep. 10, 1–14. doi: 10.1038/s41598-020-60581-7
AFMA. (2019). AFMA submission for reassessment of the Eastern tuna and billfish fishery (Canberra: Australian Fisheries Management Authority).
AFMA. (2020). Reported annual fishing effort from commonwealth fisheries logbooks. Available at: https://data.gov.au/dataset/ds-dga-b36304ae-4e15-4d5c-abe2-097a57a05b25/details.
AFMA. (2021). Protected species interaction reports. Available at: https://www.afma.gov.au/sustainability-environment/protected-species-management/protected-species-interaction-reports.
Australian Government Bureau of Meteorology. (2018). Commonwealth of australia. Available at: http://www.bom.gov.au/climate/current/annual/aus/2018/.
Barr C. E., Hamann M., Shimada T., Bell I., Limpus C. J., Ferguson J. (2021). Post-nesting movements and feeding ground distribution by the hawksbill turtle (Eretmochelys imbricata) from rookeries in the Torres strait. Wildl. Res. 48 (7), 598–608. doi: 10.1071/WR20183
Bejder M., Johnston D. W., Smith J., Friedlaender A., Bejder L. (2016). Embracing conservation success of recovering humpback whale populations: evaluating the case for downlisting their conservation status in Australia. Mar. Policy 66, 137–141. doi: 10.1016/j.marpol.2015.05.007
Bell I., Jensen M. P. (2018). Multinational genetic connectivity identified in western pacific hawksbill turtles, eretmochelys imbricata. Wildl. Res. 45 (4), 307–315. doi: 10.1071/WR17089
Bell I. P., Meager J. J., Eguchi T., Dobbs K. A., Miller J. D., Madden Hof C. A. (2020). Twenty-eight years of decline: nesting population demographics and trajectory of the north-east Queensland endangered hawksbill turtle (Eretmochelys imbricata). Biol. Conserv. 241, 108376. doi: 10.1016/j.biocon.2019.108376
Bell I., Schwarzkopf L., Manicom C. (2012). High survivorship of an annually decreasing aggregation of hawksbill turtles, eretmochelys imbricata, found foraging in the northern great barrier reef. Aquat. Conserv.: Mar. Freshw. Ecosyst. 22 (5), 673–682. doi: 10.1002/aqc.2245
Benhamou S. (2011). Dynamic approach to space and habitat use based on biased random bridges. PLOS ONE 6 (1), e14592. doi: 10.1371/journal.pone.0014592
Bolten A. B., Bjorndal K. A., Martins H. R., Dellinger T., Biscoito M. J., Encalada S. E., et al. (1998). Transatlantic developmental migrations of loggerhead sea turtles demonstrated by mtDNA sequence analysis. Ecol. App. 1–7. doi: 10.1890/1051-0761(1998)008[0001:TDMOLS]2.0.CO;2
Booth D. T., Oñate-Casado J., Rusli M. U., Stewart T. (2019). Towing a float decreases swim speed but does not affect swimming behavior during offshore swimming in Sea turtle hatchlings. Chelonian Conserv. Biol. 18 (1), 112–115. doi: 10.2744/CCB-1350.1
Brewer D., Heales D., Milton D., Dell Q., Fry G., Venables B., et al. (2006). The impact of turtle excluder devices and bycatch reduction devices on diverse tropical marine communities in australia’s northern prawn trawl fishery. Fish. Res. 81, 176–188. doi: 10.1016/j.fishres.2006.07.009
Butt N., Whiting S., Dethmers K. (2016). Identifying future sea turtle conservation areas under climate change. Biol. Conserv. 204, 189–196. doi: 10.1016/j.biocon.2016.10.012
CAPAD. (2020). Collaborative australian protected areas database – marine. commonwealth of australia (Australia: Geoscience). Available at: https://portal.ga.gov.au/metadata/framework/collaborative-australian-protected-areas-database-capad-2020-marine/e9a89e81-fddd-4593-be57-1787cd0ed7a5.
Chung F. C., Pilcher N. J., Salmon M., Wyneken J. (2009). Offshore migratory activity of hawksbill turtle (Eretmochelys imbricata) hatchlings, i. quantitative analysis of activity, with comparisons to green turtles (Chelonia mydas). Chelonian Conserv. Biol. 8 (1), 28–34. doi: 10.2744/CCB-0715.1
CITES Secretariat. (2019). “Status, scope and trends of the legal and illegal international trade in marine turtles, its conservation impacts, management options and mitigation priorities,” in Eighteenth meeting of the CITES Conference of the Parties, CoP18 Inf 18.
Commonwealth of Australia. (2010). The Torres strait: bridge and border - the senate: foreign affairs, defence and trade references committee. (Canberra: Commonwealth of Australia).
Commonwealth of Australia. (2017). Recovery plan for marine turtles in Australia 2017-2027. (Canberra: Commonwealth of Australia) p. 154.
Commonwealth of Australia. (2018). Assessment of the Queensland East coast inshore fin fish fishery. (Canberra: Commonwealth of Australia).
Commonwealth of Australia. (2021). Assessment of the Queensland East coast otter trawl fishery. (Canberra: Commonwealth of Australia).
Course G. P., Pierre J., Howell B. K. (2020). What’s in the Net? Using camera technology to monitor, and support mitigation of, wildlife bycatch in fisheries. Published by WWF.
Cuevas E., de los Ángeles Liceaga-Correa M., Uribe-Martínez A. (2019). Ecological vulnerability of two sea turtle species in the gulf of Mexico: an integrated spatial approach. Endangered Species Res. 40, 337–356. doi: 10.3354/esr00984
Department of Environment and Science. (2021). Queensland Marine turtle conservation strategy (2021–2031). (Brisbane: Queensland Government).
Dobbs K. A., Miller J. D., Limpus C., Landry A. J. (2010). Hawksbill turtle hatchling sex ratios and incubation and pivotal temperatures from milman island, great barrier reef, Australia. Mar. Turtle Newslett. 128, 12–16.
Eyring V., Bony S., Meehl G. A., Senior C. A., Stevens B., Stouffer R. J., et al. (2016). Overview of the coupled model intercomparison project phase 6 (CMIP6) experimental design and organization. Geosci. Model. Dev. 9, 1937–1958. doi: 10.5194/gmd-9-1937-2016
Fitzsimmons N. N., Limpus C. J. (2014). Marine turtle genetic stocks of the indo-pacific: identifying boundaries and knowledge gaps. Indian Ocean Turtle Newslett. 20, 64.
Fuentes M. M. P. B., Hamann M., Limpus C. J. (2010). Past, current and future thermal profiles of green turtle nesting grounds: implications from climate change. J. Exp. Mar. Biol. Ecol. 383, 56–64. doi: 10.1016/j.jembe.2009.11.003
Fuentes M. N., Wildermann T. B., Gandra Domit C. (2020). Cumulative threats to juvenile green turtles in the coastal waters of southern and southeastern Brazil. Biodivers. Conserv. 29, 1783–1803.
Fuentes M. M. P. B., Maynard J. A., Guinea M., Bell I. P., Werdell P. J., Hamann M. (2009). Proxy indicators of sand temperature help project impacts of global warming on sea turtles in northern Australia. Endangered Species Res. 9 (1), 33–40. doi: 10.3354/esr00224
Gaos A. R. (2011). Spatial ecology of hawksbill turtles (Eretmochelys imbricata) in the eastern pacific ocean Vol. 9 (USA: Faculty of San Diego State University). doi: 10.3389/fmars.2022.837447
Gautama D. A., Susanto H., Riyanto M., Wahju R. I., Osmond M., Wang J. H. (2022). Reducing sea turtle bycatch with net illumination in an Indonesian small-scale coastal gillnet fishery. Front. Mar. Sci. 9 (November). doi: 10.3389/fmars.2022.1036158
GBRMPA. (2019). Great barrier reef outlook report 2019 (Townsville: Great Barrier Reef Marine Park Authority).
Godley B. J., Richardson S., Broderick A. C., Coyne M. S., Glen F., Hays G. C. (2002). Long-term satellite telemetry of the movements and habitat utilisation by green turtles in the Mediterranean. Ecography 25, 352–362. doi: 10.1034/j.1600-0587.2002.250312.x
Grech A., Coles R., Marsh H. (2011). A broad-scale assessment of the risk to coastal seagrasses from cumulative threats. Mar. Policy 35 (5), 560–567. doi: 10.1016/J.MARPOL.2011.03.003
Grech A., Edgar G. J., Fairweather P., Pressey R. L., Ward T. J. (2014). “Australian Marine protected areas,” In Austral ark: the state of wildlife in Australia and New Zealand. A. Stow, N. Maclean, & G. I. Holwell (Eds.), Cambridge University Press (CUP). 582–599. doi: 10.1017/CBO9781139519960.029
Hamilton R. J., Bird T., Gereniu C., Pita J., Ramohia P. C., Walter R., et al. (2015). Solomon Islands largest hawksbill turtle rookery shows signs of recovery after 150 years of excessive exploitation. PloS One 10 (4), 1–16. doi: 10.1371/journal.pone.0121435
Hamilton R. J., Desbiens A., Pita J., Brown C. J., Vuto S., Atu W., et al. (2021). Satellite tracking improves conservation outcomes for nesting hawksbill turtles in Solomon islands. Biol. Conserv. 261, 109240. doi: 10.1016/J.BIOCON.2021.109240
Hart K. M., Iverson A. R., Benscoter A. M., Fujisaki I., Cherkiss M. S., Pollock C., et al. (2019). Satellite tracking of hawksbill turtles nesting at buck island reef national monument, US virgin islands: inter-nesting and foraging period movements and migrations. Biol. Conserv. 229, 1–13.
Hays G. C., Bailey H., Bograd S. J., Bowen W. D., Campagna C., Carmichael R. H., et al. (2019). Translating marine animal tracking data into conservation policy and management. Trends Ecol. Evol. 34 (5), 459–473. doi: 10.1016/j.tree.2019.01.009
Hays G. C., Scott R. (2013). Global patterns for upper ceilings on migration distance in sea turtles and comparisons with fish, birds and mammals. Funct. Ecol. 27 (3), 748–756. doi: 10.1111/1365-2435.12073
Hoenner X., Whiting S. D., Hamann M., Limpus C. J., Hindell M. A., McMahon C. R. (2016). High-resolution movements of critically endangered hawksbill turtles help elucidate conservation requirements in northern Australia. Mar. Freshw. Res. 67 (8), 1263–1278. doi: 10.1071/MF15013
Humber F., Godley B. J., Broderick A. C. (2014). So excellent a fishe: a global overview of legal marine turtle fisheries. Diversity Distrib. 20 (5), 579–590. doi: 10.1111/ddi.12183
Jacobsen I., Walton L., Lawson A. (2021). Gulf of carpentaria inshore fishery level 2 ecological risk assessment [species of conservation concern]. (State of Queensland, Brisbane, Queensland: Technical Report).
Jaramillo-Legorreta A., Rojas-Bracho L., Brownell R. L., Read A. J., Reeves R. R., Ralls K., et al. (2007). Saving the vaquita: immediate action, not more data. Conserv. Biol. 21 (6), 1653–1655. doi: 10.1111/j.1523-1739.2007.00825.x
Jensen M. P., Allen C. D., Eguchi T., Bell I. P., LaCasella E. L., Hilton W. A., et al. (2018). Environmental warming and feminization of one of the largest Sea turtle populations in the world. Curr. Biol. 28 (1), 154–159.e4. doi: 10.1016/j.cub.2017.11.057
Kamrowski R. L., Limpus C., Moloney J., Hamann M. (2012). Coastal light pollution and marine turtles: assessing the magnitude of the problem. Endangered Species Res. 19, 85–98. doi: 10.3354/esr00462
Kinch J., Burgess E. A. (2009). An assessment of the trade in hawksbill turtles in Papua new Guinea. TRAFFIC Bull. 22 (2), 62–72.
LaCasella E. L., Jensen M. P., Madden Hof C. A., Bell I. P., Frey A., Dutton P. H. (2021). Mitochondrial DNA profiling to combat the illegal trade in tortoiseshell products. Front. Mar. Sci. 7 (January). doi: 10.3389/fmars.2020.595853
Lam T., Ling X., Takahashi S., Burgess E. A. (2011). Market forces: an examination of marine turtle trade: a TRAFFIC East Asia report.
Lamont M., Putman N., Fujisaki I., Hart K. M. (2015). Spatial requirements of different life-stages of the loggerhead turtle (Caretta caretta) from a distinct population segment in the northern gulf of Mexico. Herpetol. Conserv. Biol. 10 (1), 26–43.
Lay (2018). Kevin lay, personal communication (Redmond, Washington, United States: Wildlife Computers).
Liles M. J., Peterson M. J., Lincoln Y. S., Seminoff J. A., Gaos A. R., Peterson T. R. (2015). Connecting international priorities with human wellbeing in low-income regions: lessons from hawksbill turtle conservation in El Salvador. Local Environ. 20 (11), 1383–1404. doi: 10.1080/13549839.2014.905516
Limpus C. J. (1992). Estimation of tag loss in marine turtle research. Wildl. Res. 19 (4), 457–469. doi: 10.1071/WR9920457
Limpus C. J. (2009). A biological review of Australian marine turtles: 3. hawksbill turtle, eretmochelys imbricata (Linnaeus). (DERM, The State of Queensland: Environmental Protection Agency). Available at: http://www.derm.qld.gov.au/services_resources/item_details.php?item_id=200005.
Limpus C., Miller J. (2008). Australian Hawksbill turtle population dynamics project (Environmental Protection Agency).
Loop K. A., Miller J. D., Limpus C. J. (1995). Nesting by the hawsbill turtle (Eretmochelys imbricata) on milman island, great barrier reef, Australia. Wildl. Res. 22 (2), 241–252. doi: 10.1071/WR9950241
Madden Hof C. A., Shuster G., McLachlan N., McLachlan B., Giudice S., Limpus C., et al. (2019). Protecting nests of the critically endangered south pacific loggerhead turtle Caretta caretta from goanna varanus spp. predation. Oryx 54 (3), 323–331. doi: 10.1017/S0030605318001564
Magris R. A., Grech A., Pressey R. L. (2018). Cumulative human impacts on coral reefs: assessing risk and management implications for brazilian coral reefs. Diversity 10 (2), 1–14. doi: 10.3390/d10020026
Mancini A., Senko J., Borquez-Reyes R., Póo J. G., Seminoff J. A., Koch V. (2011). To poach or not to poach an endangered species: elucidating the economic and social drivers behind illegal Sea turtle hunting in Baja California sur, Mexico. Hum. Ecol. 39 (6), 743–756. doi: 10.1007/s10745-011-9425-8
McClintock B. T., Michelot T. (2018). momentuHMM: r package for generalized hidden Markov models of animal movement. Methods Ecol. Evol. 9 (6), 1518–1530. doi: 10.1111/2041-210X.12995
Meylan A., Donnelly M. (1999). Status justification for listing the hawksbill turtle (Eretmochelys imbricata) as critically endangered on the 1996 IUCN red list of threatened animals. Chelonian Conserv. Biol. 3 (2), 200–224.
Miller J. D., Dobbs K. A., Limpus C. J., Mattocks N., Landry A. M. (1998). Long-distance migrations by the hawksbill turtle, eretmochelys imbricata, from north-eastern Australia. Wildl. Res. 25 (1), 89–95. doi: 10.1071/WR96086
Mortimer J., Donnelly M. (2008). “IUCN red list: hawksbills turtle (Eretmochelys imbricata),” in Marine turtle specialist group 2008, IUCN red list status assessment.
Opu J. (2018). An assessment of marine turtle exploitation in Papua new Guinea: final report prepared for the secretariat of the pacific regional environmental programme. (Apia, Samoa, SPREP).
Patrício A. R., Hawkes L. A., Monsinjon J. R., Godley B. J., Fuentes M. M. P. B. (2021). Climate change and marine turtles: recent advances and future directions. Endangered Species Res. 44, 363–395. doi: 10.3354/esr01110
Queensland Department of Agriculture and Fisheries. (2021). QFISH. Available at: https://qfish.fisheries.qld.gov.au/.
Queensland Open Data Portal. (2020). Queensland Open data portal. Available at: https://www.data.qld.gov.au/dataset/total-number-of-species-of-conservation-interest-interactions-with-released-conditions.
Riskas K. A., Fuentes M. M. P. B., Hamann M. (2016). Justifying the need for collaborative management of fisheries bycatch: a lesson from marine turtles in Australia. Biol. Conserv. 196, 40–47. doi: 10.1016/j.biocon.2016.02.001
Senko J. F., Burgher K. M., Mancha-Cisneros M., Godley B. J., Kinan-Kelly I., Fox T., et al. (2022a). Global patterns of illegal marine turtle exploitation. Glob Change Biol. 00, 1–15. doi: 10.1111/gcb.16378
Senko J. F., Peckham S. H., Aguilar-Ramirez D., Wang J. H. (2022b). Net illumination reduces fisheries bycatch, maintains catch value, and increases operational efficiency. Curr. Biol. 32 (4), 911–918.e2. doi: 10.1016/j.cub.2021.12.050
Shimada T. (2015). Spatial ecology and conservation of sea turtles in coastal foraging habitat: PhD thesis (Queensland, Australia: James Cook University).
Shimada T., Jones R., Limpus C., Hamann M. (2012). Improving data retention and home range estimates by data-driven screening. Mar. Ecol. Prog. Ser. 457, 171–180. doi: 10.3354/meps09747
Smith C., Booth D., Crosby A., Miller J., Staines M., Versace H., et al. (2021). Trialling seawater irrigation to combat the high nest temperature feminisation of green turtle chelonia mydas hatchlings. Mar. Ecol. Prog. Ser. 667, 177–190. doi: 10.3354/meps13721
Staines M. N., Booth D. T., Madden Hof C. A., Hays G. C. (2020). Impact of heavy rainfall events and shading on the temperature of sea turtle nests. Mar. Biol. 167 (12), 1–11. doi: 10.1007/s00227-020-03800-z
Torres Strait Regional Authority. (2017). Torres Strait hawksbill turtle monitoring project report: nest to ocean turtle protection program 2016-17. (Australian Government, Torres Strait).
Turvey S. T., Pitman R. L., Taylor B. L., Barlow J., Akamatsu T., Barrett L. A., et al. (2007). First human-caused extinction of a cetacean species? Biol. Lett. 3 (5), 537–540. doi: 10.1098/rsbl.2007.0292
Vargas S. M., Jensen M. P., Ho S. Y. W., Mobaraki A., Broderick D., Mortimer J. A., et al. (2016). Phylogeography, genetic diversity, and management units of hawksbill turtles in the indo-pacific. J. Heredity 107 (3), 199–213. doi: 10.1093/jhered/esv091
Wallace B. P., DiMatteo A. D., Bolten A. B., Chaloupka M. Y., Hutchinson B. J., Abreu-Grobois F. A., et al. (2011). Global conservation priorities for marine turtles. PloS One 6 (9), e24510. doi: 10.1371/journal.pone.0024510
Keywords: hawksbill, migration, satellite-tracking, threat exposure, spatial use
Citation: Madden Hof CA, Smith C, Miller S, Ashman K, Townsend KA and Meager J (2023) Delineating spatial use combined with threat assessment to aid critical recovery of northeast Australia’s endangered hawksbill turtle, one of western Pacific's last strongholds. Front. Mar. Sci. 10:1200986. doi: 10.3389/fmars.2023.1200986
Received: 05 April 2023; Accepted: 15 June 2023;
Published: 08 August 2023.
Edited by:
Mark Meekan, University of Western Australia, AustraliaReviewed by:
Eduardo Cuevas, Universidad Autónoma de Baja California, MexicoCopyright © 2023 Madden Hof, Smith, Miller, Ashman, Townsend and Meager. This is an open-access article distributed under the terms of the Creative Commons Attribution License (CC BY). The use, distribution or reproduction in other forums is permitted, provided the original author(s) and the copyright owner(s) are credited and that the original publication in this journal is cited, in accordance with accepted academic practice. No use, distribution or reproduction is permitted which does not comply with these terms.
Disclaimer: All claims expressed in this article are solely those of the authors and do not necessarily represent those of their affiliated organizations, or those of the publisher, the editors and the reviewers. Any product that may be evaluated in this article or claim that may be made by its manufacturer is not guaranteed or endorsed by the publisher.
Research integrity at Frontiers
Learn more about the work of our research integrity team to safeguard the quality of each article we publish.