
94% of researchers rate our articles as excellent or good
Learn more about the work of our research integrity team to safeguard the quality of each article we publish.
Find out more
REVIEW article
Front. Mar. Sci., 05 January 2024
Sec. Marine Fisheries, Aquaculture and Living Resources
Volume 10 - 2023 | https://doi.org/10.3389/fmars.2023.1199076
This article is part of the Research TopicDesign Change to Fishery Independent Surveys: When to Adjust and How to Account For ItView all 14 articles
 Meagan N. Schrandt1*
 Timothy C. MacDonald2Brent L. Winner1David A. Blewett3
 Richard Paperno4
 Gregory V. Onorato1
 David A. Gandy5Theodore S. Switzer1
Development of Florida’s marine Fisheries-Independent Monitoring (FIM) program began in 1985, and it initiated long-term monitoring in Tampa Bay in 1989 with the purpose of providing timely fishery-independent data and analyses to fishery managers for the conservation and protection of the species that support Florida’s fisheries. Over time, the program expanded sampling in other Florida estuaries. Data from this monitoring program are integral to the assessment and management of numerous state and federally managed fishes, so long-term consistency is of paramount importance, but sampling design modifications have been necessary over time. This review presents three case studies in which the estuarine component of the FIM program was changed to address emerging data needs in management of Florida’s fishery resources, while maintaining standardization and consistency with long-term surveys statewide. In the first case study, survey changes increased the amount of data on juvenile common snook, Centropomus undecimalis, on the Gulf of Mexico and Atlantic coasts and improved indices of abundance, survival estimates, and age-length keys for state management purposes. In the second case study, the FIM program improved estimates of abundance of juvenile reef fishes by initiating a complementary survey that expanded FIM sampling to new regions of the Florida Gulf coast and targeted a unique habitat (polyhaline seagrass beds along estuarine shoal habitats) not previously sampled in the standard long-term survey. In the third case study, the FIM program addressed a data limitation for regional management of spotted seatrout, Cynoscion nebulosus, by initiating seasonal sampling in western Florida. In each case study, the standard long-term survey design was modified to include sampling of new and unique areas and habitats, providing valuable data on estuarine fish assemblages that support analyses at the broader, ecosystem level. Survey amendments were designed to maintain standardization and consistency, all with limited additional funding. The success of these survey modifications was the result of several key factors: mission-focused programmatic goals, geographically dispersed laboratories, standardized protocols, ongoing critical analysis of the data, grant award success, and high-level data management. Although each case study originated with a survey expansion, all were followed by survey reductions or streamlining, so expansion and reduction scenarios are presented in this review. Regardless of these modifications, the mission of the FIM program remains the same: to provide timely data and analysis for the use of fishery managers, including state and federal partners.
Saltwater fishing in Florida employed almost 90,000 people and had an economic impact of almost $13 billion in 2020 (https://myfwc.com/conservation/value/saltwater-fishing/). Appropriate and timely management is critical to sustaining not only the saltwater fishery but also the economy that prospers from it. Researchers and managers have traditionally monitored changes in fish stocks with catch and effort data derived from commercial and recreational fisheries. Analysis of these fishery-dependent data provide valuable information on the status of fish stocks, but changes, including changes in vessel types, fleet size, fishing gear, or methods of operation, can make fishery-dependent data difficult to interpret (Ultang, 1977). Management actions (e.g., closed seasons, changes in size or bag limits, fluctuations in market values) and changes in fishing behavior further bias the utility of fishery-dependent catch data in assessing trends in abundance through time (Bryan and McCarthy, 2015; Smith et al., 2015; SEDAR, 2018). Long-term fishery-independent monitoring, which targets juvenile and subadult fishes that have not been subjected to fishing pressure, can provide less biased estimates of trends in fish stocks than fishery-dependent sampling (Myers and Cadigan, 1993). Changes in juvenile abundance within a season can be attributed to natural mortality, immigration, emigration, or recruitment. Shifts in juvenile abundance can also be used to forecast changes in the adult stock, allowing implementation of necessary modifications to harvest regulations before the fish have fully recruited to the fishery (Goodyear, 1985). Multispecies, multihabitat, long-term monitoring programs are also valuable in documenting ecosystem changes, evaluating the effects of natural and anthropogenic disturbances, and making management decisions (e.g., Coull, 1985; Wolfe et al., 1987; Stevens et al., 2016; Schrandt and MacDonald, 2020; Schrandt et al., 2021a).
In 1985, staff from what would become the Florida Fish and Wildlife Conservation Commission’s (FWC) Fish and Wildlife Research Institute (FWRI) began planning for the marine Fisheries-Independent Monitoring (FIM) program after suspecting declines in the population of an important recreational and commercially harvested species, red drum, Sciaenops ocellatus, in Gulf of Mexico estuarine and offshore waters. Originally, the idea was to focus the program on the juvenile life stage of red drum. However, early leaders in the program recognized the importance of ecological surveys and sampling was instead designed to assess multispecies population trends in multiple estuarine habitats across a range of life history stages. From its inception until 1996, the program underwent extensive gear and procedural developments to refine the sampling design. During that period, many gear types (e.g., drop nets, entangling nets, purse seines, beach seines, haul seines, roller frame, and otter trawls) and sampling approaches (i.e., fixed-station vs. directed sampling vs. stratified-random, day vs. night, seasonal vs. monthly sampling) were assessed and kept, modified, or discarded. In 1996, the program finalized its main sampling-gear types (21.3-m center-bag seines, 183-m haul seines, 6.1-m otter trawls) and sampling design (stratified-random, monthly, and daytime), which have remained consistent through time and geographic expansion. The final sampling design was reviewed and approved that year by a team of outside scientific experts in fishery management from the American Fisheries Society (https://fisheries.org/).
Dedicated funding for the FIM program began with a $400,000 special appropriation by the Florida Legislature in 1986 and a recurring, small ($260,000) federal Sportfish Restoration grant in 1987. In 1988, additional funding became available from a second, recurring special appropriation through the Florida Legislature. Since 1995, the program has been largely funded through the sale of Florida’s saltwater fishing licenses and by competitive grant awards (e.g., National Estuary Program, National Park Service, Florida water management districts, U.S. Army Corps of Engineers) that have allowed it to address knowledge gaps related to habitats (e.g., inshore reefs, polyhaline seagrasses, tidal tributaries), management actions (e.g., water withdrawals, dredging and filling), stock boundaries (Northwest Florida), and geographic locations (e.g., Sarasota Bay, Everglades National Park, Florida Bay). With additional funding from sales of the Florida saltwater fishing license, the program rapidly expanded into geographically dispersed estuaries (Figure 1). Sampling began in Tampa Bay (TB) and Charlotte Harbor (CH; 1989), then expanded to the northern Indian River Lagoon (NIRL; 1990), Cedar Key (CK; 1996), the southern IRL (SIRL; 1997), Apalachicola Bay (AP; 1998), and Northeast Florida (JX; 2001). The FIM program also expanded to offshore habitats in 2008 to address key limitations in available data on groundfish assemblages (Matheson et al., 2017; Christiansen et al., 2022b; see Pollack et al. (submitted) in this issue for trawling surveys) as well as reef fish assemblages and their habitats (Keenan et al., 2022; Thompson et al., 2022; Switzer et al., 2023).
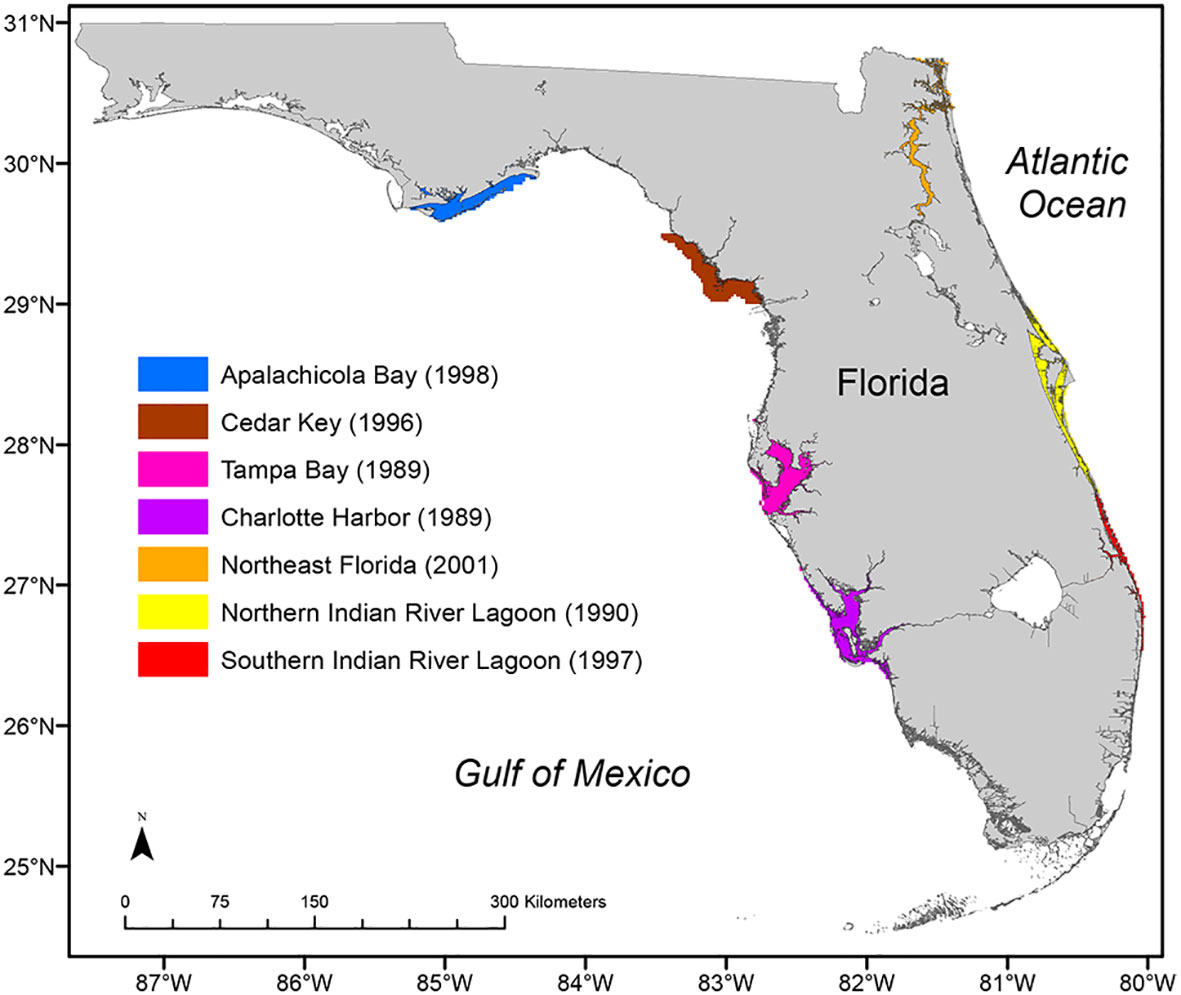
Figure 1 The six Florida estuaries with long-term Fisheries-Independent Monitoring (FIM) surveys through 2023. The Indian River Lagoon is one estuarine system but is sampled separately for logistics, so it is depicted as two colors (yellow and red). The first year of long-term monitoring for each estuary is noted in parentheses.
Although the FIM program has successfully expanded (e.g., geography, habitats) and continues to provide timely, accurate data integral to the assessment and management of fisheries, there have been challenges and some facets of the program had to be scaled back to free up resources for necessary expansions. Like many long-term monitoring programs, it has struggled with long-term funding and has had to respond to deficits due to stagnant funding coupled with inflation. Thus, the program relies on grants, most of which are short-term and competitive, for approximately half of its funding. The FIM program, therefore, has had to address specific grant objectives while maintaining broad programmatic consistency. Additionally, the program has had to address maintaining statewide standardization, new and changing technologies, evolving management needs, and staffing shortages and retention issues. Regardless of the challenges, the program has maintained its original mission of providing timely data and analysis for fishery managers, including state, federal, and nongovernment partners. Given these challenges, we will discuss three case studies, each aiming to improve size-structured abundance estimates and other data for various species, from the estuarine component of the FIM program that exemplify processes used to inform sampling survey modifications, expansions, and contractions to meet emerging fishery management needs for the state of Florida. The FIM program’s mission-focused programmatic goals, geographically dispersed field laboratory model, standardized protocols, continual analysis of data, successful grant award record, and stable, yet adaptable, database design, have been significant features in the program’s ability to adapt to changing fishery and ecological priorities and budgetary deficiencies to maintain long-term data collections.
The three case studies highlighted herein leveraged the standard FIM sampling protocols, database design, and logistics, ensuring data comparability with the long-term FIM program while reducing start up and continuation costs by 50-70%. The standard FIM design samples 7 estuaries, Apalachicola Bay (AP), Cedar Key (CK), Tampa Bay (TB), and Charlotte Harbor (CH) on the Gulf coast, and northeast Florida (JX), northern Indian River Lagoon (NIRL), and southern Indian River Lagoon (SIRL) (Figure 1) on the Atlantic coast, with 3 gear types. A center-bag seine (21.3-m x 2.0-m with 3.2-mm mesh) is deployed to sample in both bay (~140 m2/set) and river (~68 m2/set) habitats to a water depth of 1.8-m. A haul seine (183-m x 3.0-m with 38-mm mesh) is set in bay habitats (~4120 m2/set) in depths ≤2.5 m. An otter trawl (6.1-m with a 3.2-mm mesh bag liner) is deployed to sample bay (~1440 m2/set) and river (~720 m2/set) habitats between 1.0 and 7.6 m deep. The sampling universe within each estuary generally encompasses waters from the mouth of the estuary through the tidally influenced portion of major rivers. The FIM program is a multispecies survey to assess the diverse number of economically important species in Florida waters and, therefore, the design is not optimized around a specific metric. Strata are defined based on space (approximately homogenous biological and water quality ‘zones’ within each estuary) and habitat (i.e., presence or absence of submerged aquatic vegetation, and presence or absence of overhanging shoreline vegetation like mangroves). Early data analyses suggested species assemblages differed among these habitat strata.
The FIM sampling design is stratified-random, has a monthly periodicity, and samples are collected during daylight hours. Monthly sampling effort in each stratum for each estuary is proportional to the total number of potential sampling sites available but weighted toward important habitats like vegetated habitats. The total number of samples collected each month is ultimately a function of funding. The primary objective is to monitor annual, not monthly, trends so statistical power to detect annual trends is greater than power to detect monthly trends. Site-selection for the standard FIM stratified-random sampling design is cell-based. The sampling universe within each estuary is divided into cells (185 m × 185 m), with each cell assigned binary values for whether each combination of gear and strata is likely to be available for sampling. Cells are then selected in a stratified random manner, without replacement, for sampling each month.
Common snook, Centropomus undecimalis (hereafter referred to as snook), are one of Florida’s most sought-after game fishes for inshore anglers. While commercial harvest of snook in Florida has been illegal since 1957, recreational fishing is not, and pressure and landings in the recreational fishery have increased dramatically in recent decades (Munyandorero et al., 2020). Snook populations in Florida have been subject to several stressors, including extreme cold-weather events, degradation of habitat, and northward expansion of the Gulf coast population, warranting diligent management and stringent regulations to maintain populations and a sustainable inshore fishery statewide (Stevens et al., 2016; Adams et al., 2019; Purtlebaugh et al., 2020). Since 1996 the FIM program has monitored snook abundance for fishery management using the 21.3-m center-bag seine to collect small juvenile snook (<100 mm SL, standard length) and the 183-m haul seine to collect larger snook (>300 mm SL). Data from the FIM program were previously used in FWC stock assessments and updates (e.g., 2012, 2013, 2015) but stock-assessment analysts desired better estimates of juvenile snook (100–300 mm SL) abundance, survival, and growth for age-based models used in the assessment. In early 2013, the program was tasked with developing a sampling design to improve collections of juvenile snook that would refine Florida’s snook stock assessment. Challenges in addressing this need included the species’ protracted spawning period, its highly variable growth rate, and its geographic distribution and identified stock differences (Taylor et al., 2000; Trotter et al., 2012; Young et al., 2014). Therefore, the main objective for this modification to the statewide program was to provide improved data (abundance, age, and distribution) on juvenile snook for stock assessments, while complementing and enhancing existing fishery monitoring efforts.
The objective to provide improved data on juvenile snook was addressed in three phases—evaluation, reconnaissance, and gear testing—before the modified sampling design was implemented, in 2016.
Evaluation phase.—In the evaluation phase, pertinent scientific articles on juvenile snook (i.e., life history, ecology, distribution) were reviewed, and existing FIM survey data (from short- and long-term studies) were analyzed and summarized to identify gaps in the data already being provided for management purposes. Before selecting gear types, the age and approximate size range were first defined for snook that were already being collected. Snook of >300 mm SL were well represented in the haul seine collections and those <100-mm SL were well represented in the center-bag seine collections, but those of 100–300 mm SL were not as well represented in either gear, especially in the southern estuaries (Charlotte Harbor and Southern Indian River Lagoon). Combining FIM data with those from other FWRI surveys, it was then determined that the general size range of age-0, age-1, and age-2+ snook was approximately <100 mm, 100–300 mm, and >300 mm SL, respectively, but multiple ages were present within the age-1 and age-2+ size ranges (Figure 2). This information was used to design a gear-testing study in which the results would be used in modifying the long-term survey design. Gear-testing included a range of gear types that could effectively sample the range of sizes of juvenile snook.
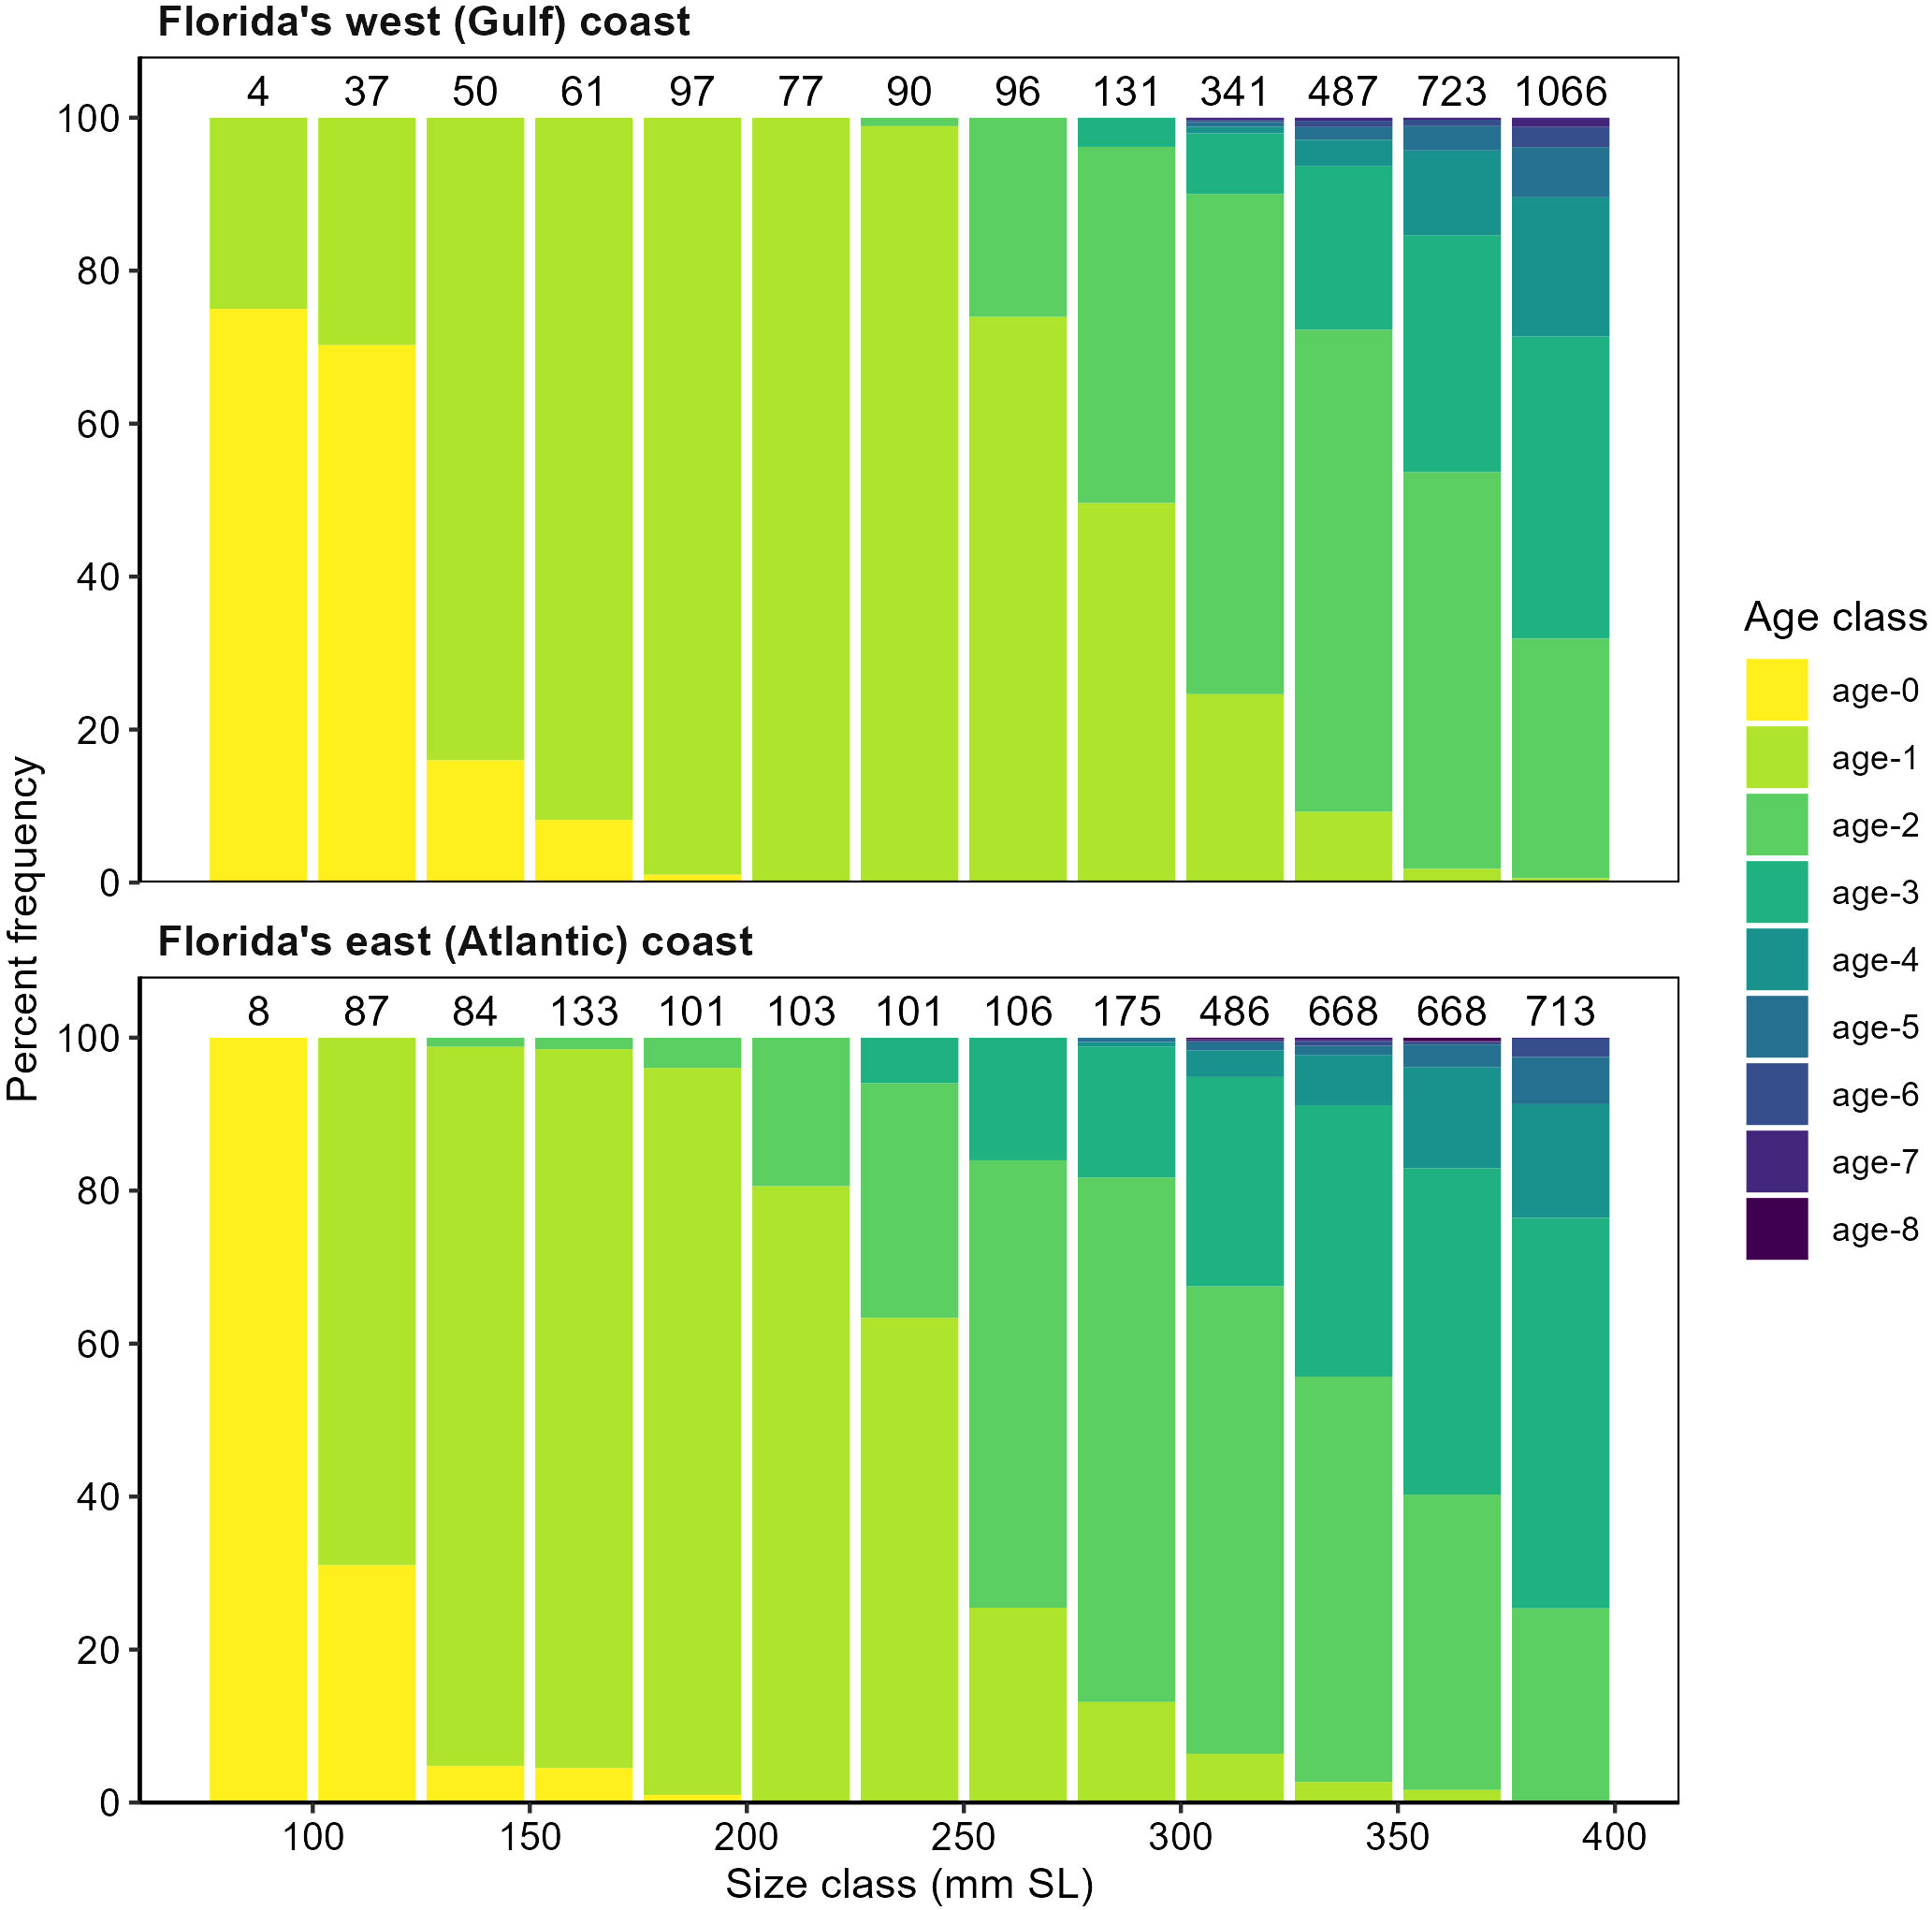
Figure 2 Percent frequency of size at age for juvenile common snook, Centropomus undecimalis, from all FWC-FWRI studies (i.e., life history 1986–1996, 183-m haul seine 1996–2012, electrofishing 2011–2012, 21.3-m and 40-m seines 2014–2015) on the Gulf and Atlantic coasts of Florida. The number of individuals aged in each size class is listed above each bar. The horizontal axis has been truncated at 400 mm SL to emphasize the sizes-at-age for juvenile snook; the entire database contains fish to 1200 mm SL.
The evaluation phase also indicated that, while snook occur almost statewide, the distribution closely approximates that of mangroves (Marshall, 1958), i.e., they are primarily distributed along Florida’s southern coastlines, from Cape Canaveral on the Atlantic coast to Tarpon Springs on the Gulf coast (Gilmore et al., 1983; Rivas, 1986; Winner et al., 2010; Stevens et al., 2016; Purtlebaugh et al., 2020). Therefore, gear-testing focused on TB and CH on the Gulf coast, and the IRL on the Atlantic coast, regions in which the FIM program already had an existing long-term monitoring survey. Snook spawning has been documented from April through December in Florida waters, and FIM data indicate that juvenile snook are present year-round in the sampled estuaries (Winner et al., 2010), so gear could be tested at any time of year. Snook geospatial distributions were also evaluated to determine which areas were used by juvenile snook in each estuary. Tidal tributaries (i.e., tidal creeks and rivers) represent primary nursery areas for snook and other species in many of the estuarine systems in Central and South Florida (Peters et al., 1998; Wilson et al., 2022), and their proximity to snook spawning grounds (i.e., ocean inlets and passes) influences juvenile recruitment into tidal tributaries (Wilson et al., 2022). Main-stem and backwater tidal tributaries (i.e., smaller tributaries, embayments, and coastal ponds) bordered by mangrove and salt marsh provide juveniles ample forage and protection from predators (McMichael et al., 1989; Brame et al., 2014).
Reconnaissance phase.—Using information from the evaluation phase, we conducted reconnaissance trips using various gear types and sampling a variety of regions and habitat types. Reconnaissance was crucial for establishing the sampling universe and gear types for the final, gear-testing, phase. Haul seines of different lengths (9–183 m) and mesh sizes (3.2–38.1 mm stretch mesh) were evaluated during these reconnaissance trips. Sampling extended into geospatial areas not included in the standard FIM long-term survey design, including the bays and tidal tributaries of TB, CH, and the IRL (Figure 3). Reconnaissance trips identified juvenile snook nursery areas in waterbodies with small geospatial footprints (backwater areas and tidal tributaries); these areas, although included in the FIM universe, were undersampled because of their small geospatial extent in comparison to the rest of the sampling universe. Additionally, nursery areas were identified in two riverine systems (St. Lucie and Loxahatchee rivers) of the SIRL that had not been included in the standard FIM design.
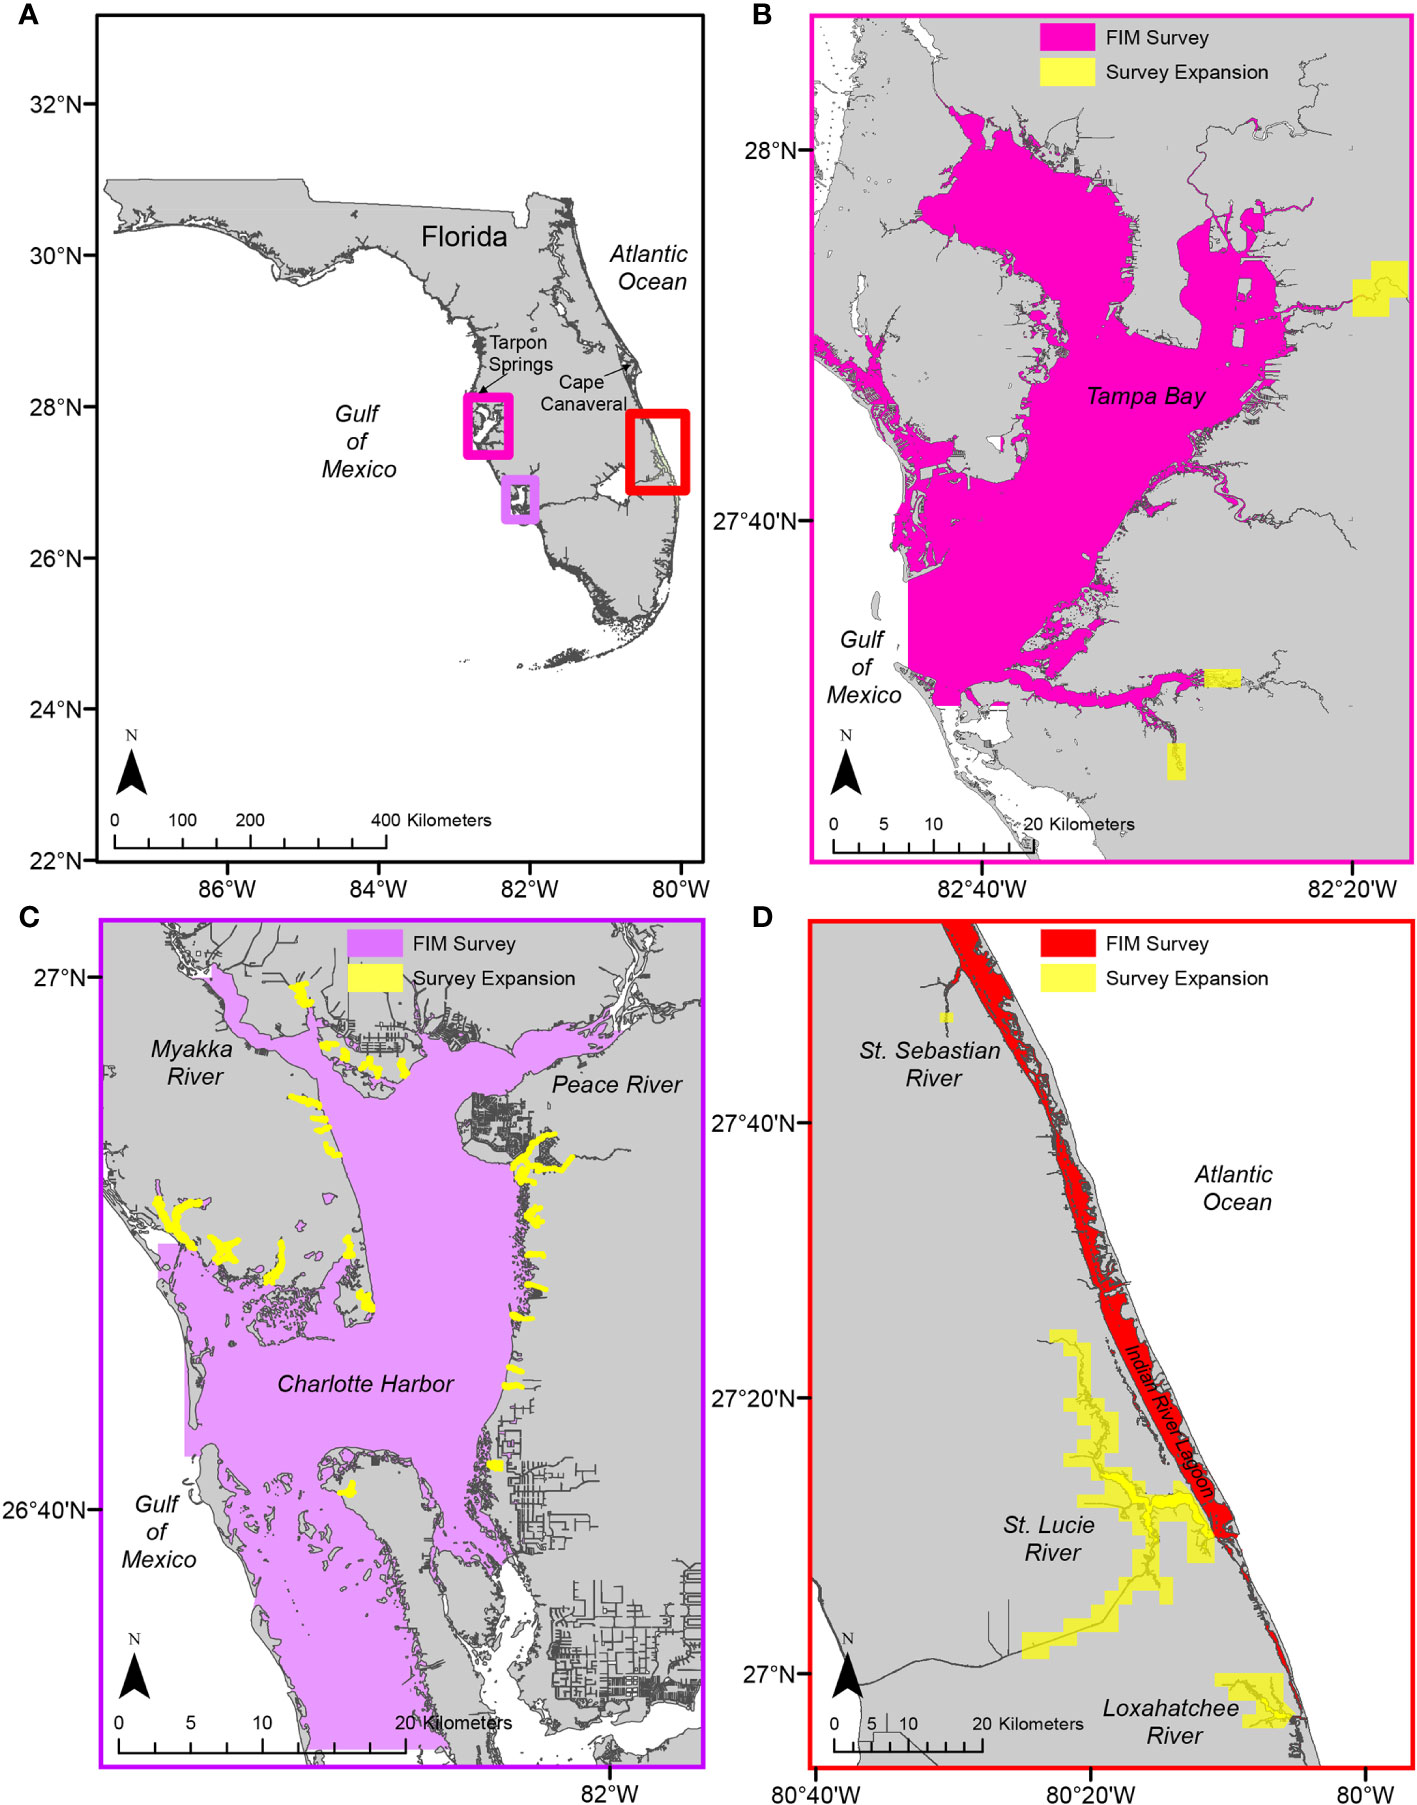
Figure 3 The Fisheries-Independent Monitoring (FIM) program modified its long-term monitoring survey in three estuaries, represented by the small rectangles in (A) and individual panels in (B–D), to increase data collection of juvenile common snook, Centropomus undecimalis. Survey expansion efforts focused on backwater and tidal tributaries of rivers in Tampa Bay (B), tidal tributaries in Charlotte Harbor (C), and three rivers in the Indian River Lagoon (D).
Gear-testing phase.—Based on findings from the evaluation and reconnaissance phases, two seine types (21.3-m and 40-m) were selected for the gear-testing phase. The 21.3-m center-bag seine has been used in the standard FIM survey since 1989 and provides the majority of FIM data on juvenile snook. The 40-m center-bag seine (with 25-mm stretch mesh) was an experimental seine configuration that covered more shoreline per sample and had a larger mesh size (i.e., different size selectivity) than the 21.3-m seine. The seines were tested from July 2014 through June 2015 in all three estuarine systems (TB, CH, IRL). A sampling universe that included these backwater embayments, tidal tributaries, and the two riverine systems in the SIRL (Figure 3) was created for each estuarine system. Sampling sites were randomly selected, and effort was stratified by waterbody type (main stem, backwater, or tidal tributary/creek). Both seine types were set at each randomly selected sampling site. Each seine was deployed from the stern of the boat, arched out along the shoreline, with the center bag falling 5–6 m from the shore. All fish and selected invertebrate species captured were identified to the lowest possible taxonomic level, counted, and a random sample of at least 10 individuals were measured.
During the gear-testing phase, 1,872 seine samples were collected from the three estuaries, capturing 2,315 juvenile snook: 1,285 age-0, 714 age-1, and 316 age-2+. In all three estuaries, catch-per-unit-effort of age-1 and age-2 snook was similar between the 21.3-m and 40-m seines (Figures 4, 5). The 21.3-m seine collected age-0 snook, which were largely absent from the 40-m seine collections, supplementing and improving age-0 indices of abundance available for stock assessments. In addition, the 21.3-m seine accounted for more than 95% of the overall catch and had a greater taxonomic diversity of fishes than did the 40-m seine (TB: 21.3-m seine, 93 taxa; 40-m seine, 50 taxa; CH: 21.3-m, 70 taxa; 40-m, 43 taxa; IRL: 21.3-m, 163 taxa; 40-m, 94 taxa). These findings indicated that the 21.3-m seine could provide data for juvenile snook, while improving data available for age-0 snook and for a variety of other estuarine fish species.
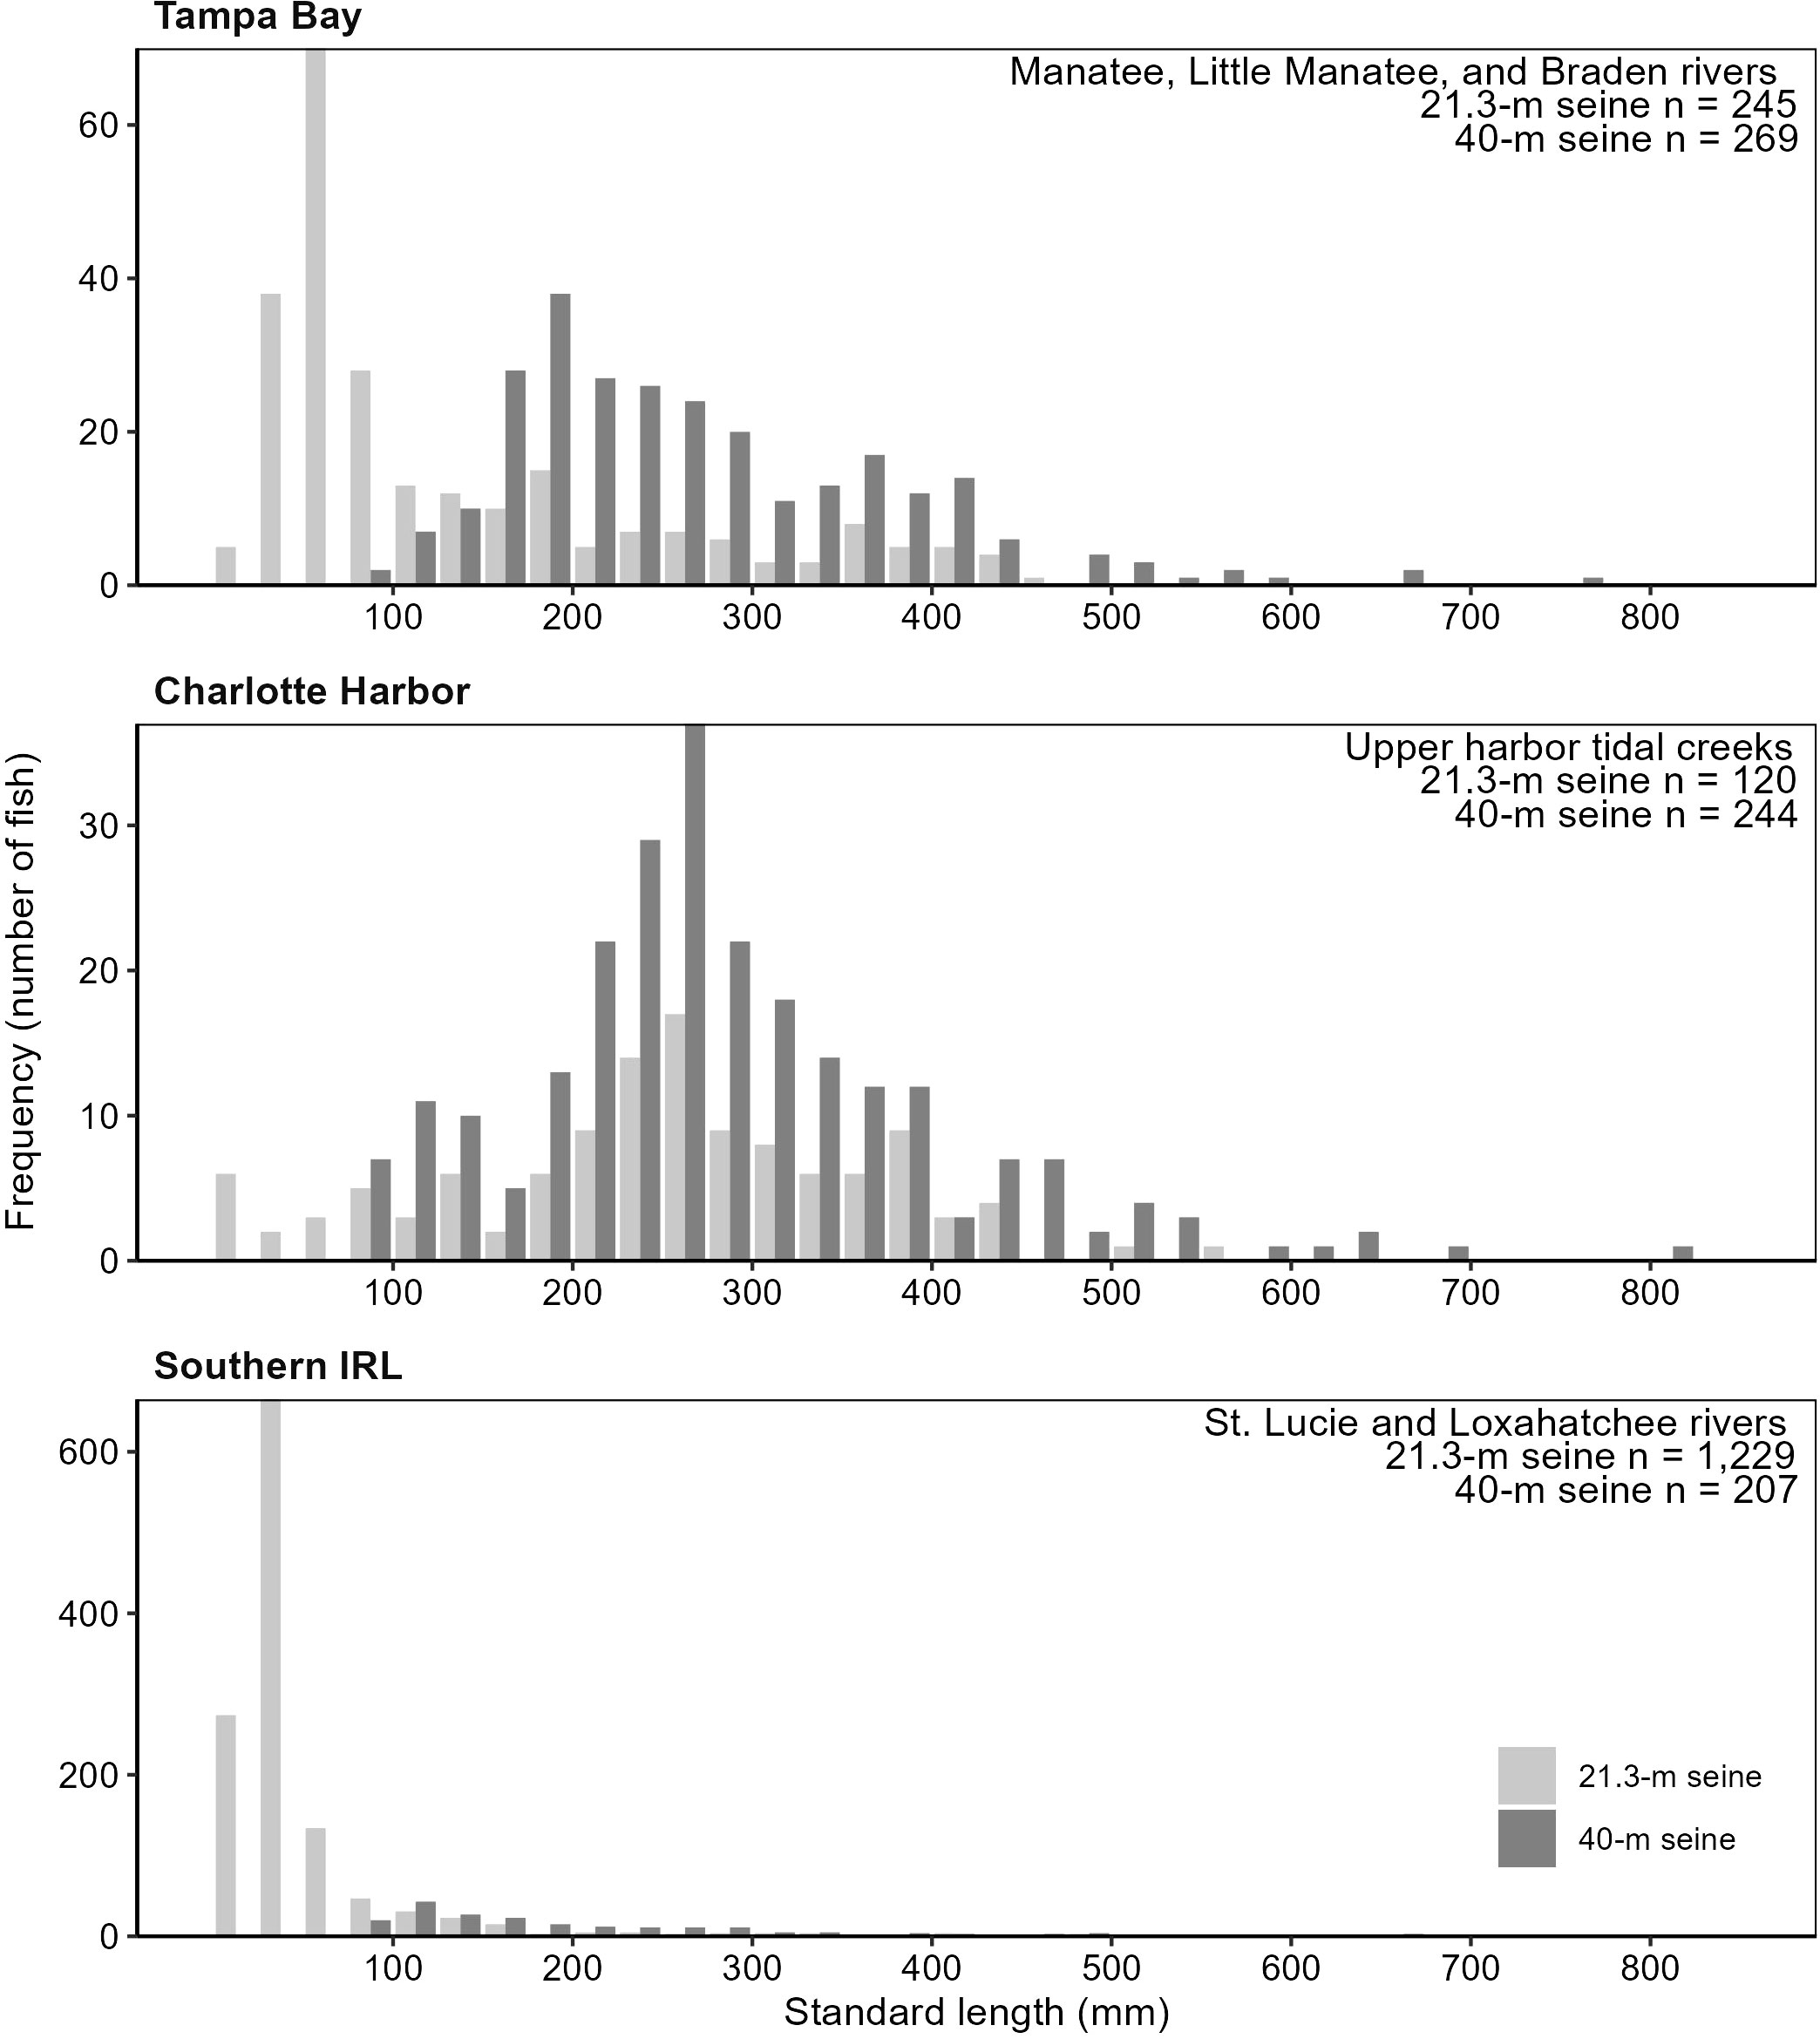
Figure 4 Length frequencies of common snook, Centropomus undecimalis, by estuary and gear type, collected during Florida’s Fisheries-Independent Monitoring (FIM) gear testing, 2014–2015.
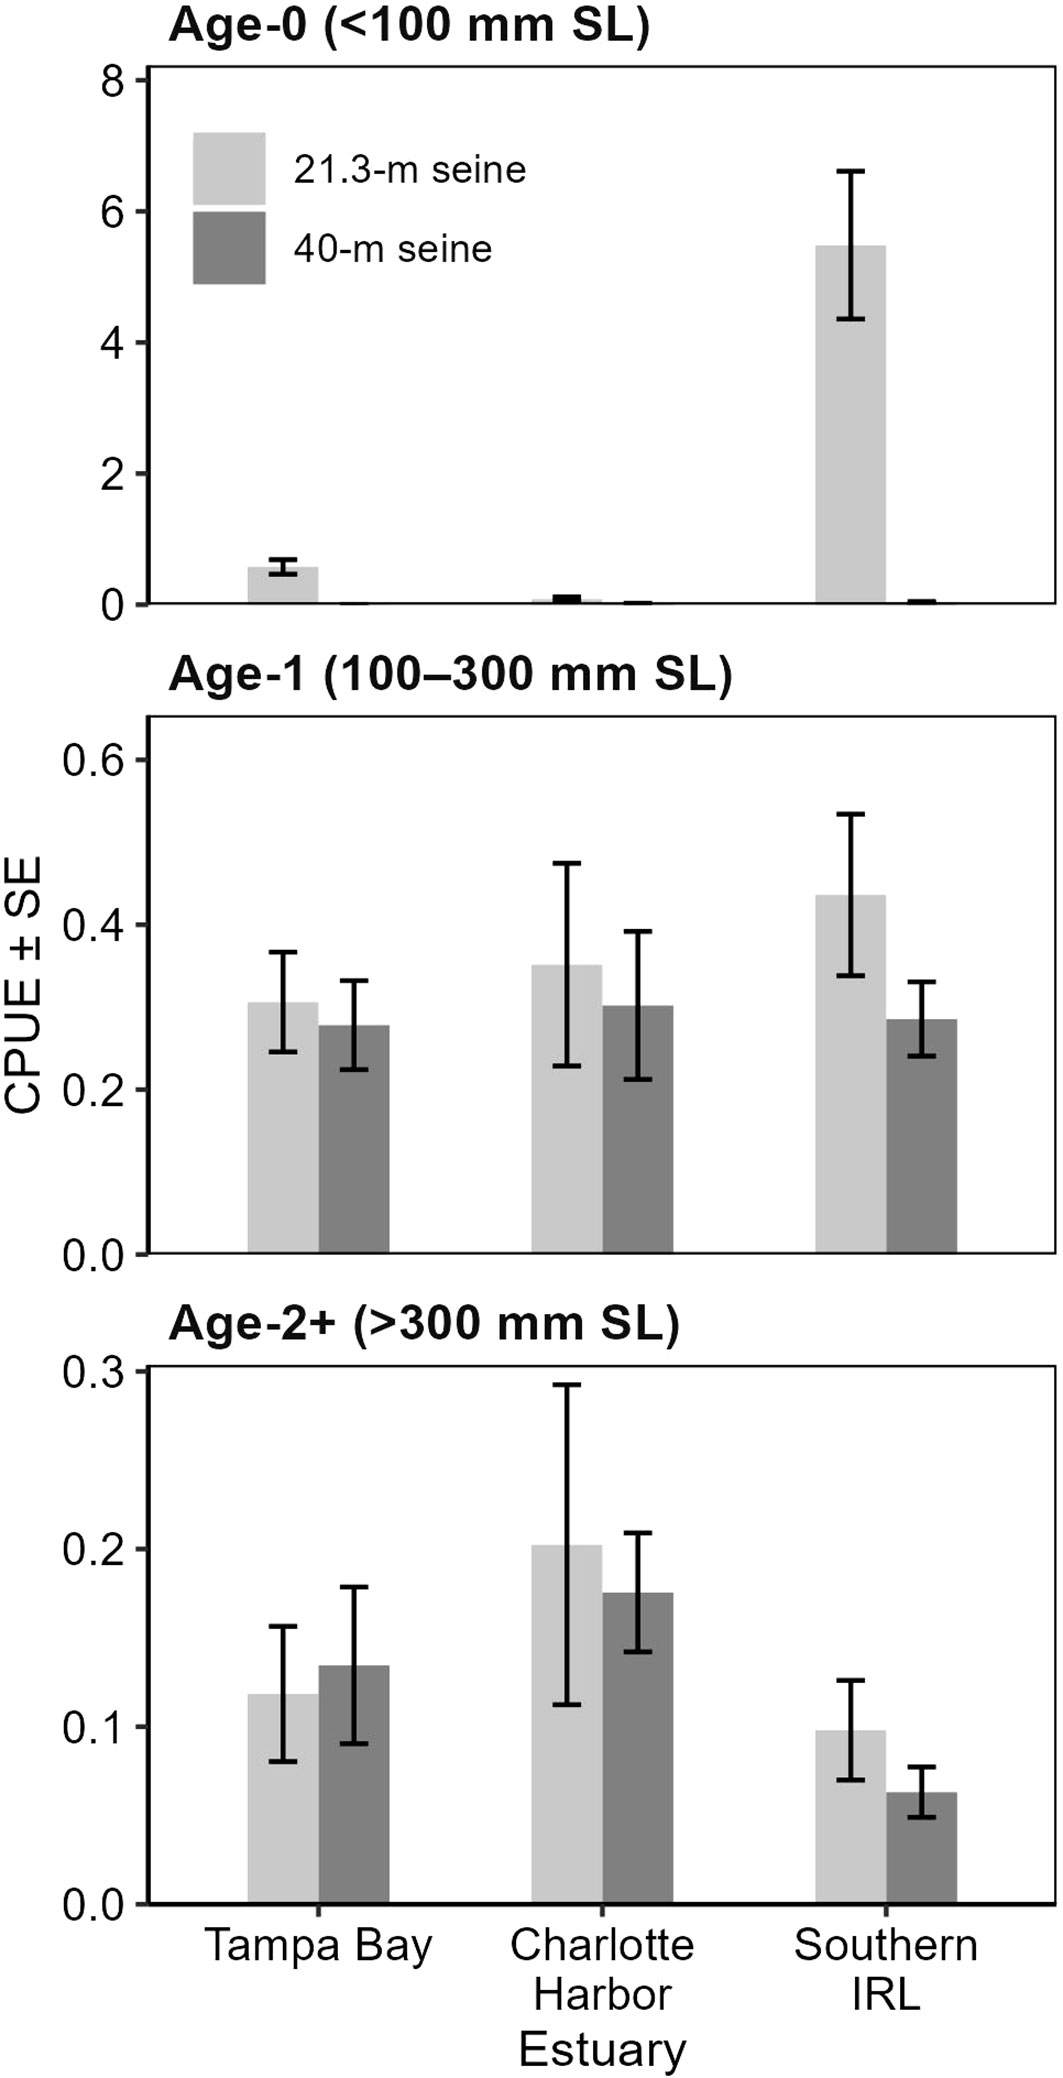
Figure 5 Mean catch-per-unit-effort (CPUE; fish per 100 m2) ± SE of common snook, Centropomus undecimalis, by estuary and gear type, collected during Florida’s Fisheries-Independent Monitoring (FIM) gear testing, 2014–2015. Approximate ages were assigned based on snook length.
The gear-testing phase also confirmed juvenile snook preference for these areas with small geospatial footprints (backwater and tidal tributaries). Within rivers, both age-0 and juvenile snook used similar areas; they were both collected at higher abundance in backwater riverine areas and smaller tidal tributaries than in main-stem areas. Juvenile snook were collected with the 21.3-m seine during all months, confirming the efficacy of monitoring the youngest life-history stages of this species with a year-round monthly sampling design. Collectively, results from the evaluation, reconnaissance, and gear-testing phases indicated that a geographic expansion of sampling with the 21.3-m seine into backwater riverine areas and smaller tidal tributaries would provide the necessary juvenile snook data, and improve the age-0 snook data that stock assessment needed.
In January 2016 FIM modified the design of its long-term monitoring survey to facilitate collection of data that better address the needs of juvenile snook as identified by stock assessment analysts. Additional monthly sampling effort with the 21.3-m seine was allocated in each of the three estuarine systems, establishing these previously undersampled water bodies with small geospatial footprints (i.e., backwater and tidal tributaries; Figure 3) as a geospatial stratum within the FIM sampling universe. Sampling effort was apportioned among the estuarine systems based on results from the gear-testing phase and the data already provided by the standard long-term FIM survey design. In Tampa Bay, data on juvenile snook were provided from the existing river sampling, but to refine these data and supply adequate biological samples the sampling effort was increased in backwater and smaller tidal tributaries by eight seine hauls per month. In Charlotte Harbor, the existing tidal tributary sampling in the standard FIM program had not been providing sufficient data, so sampling effort was increased by 30 seine hauls per month, distributed among 27 tidal creeks that had been undersampled in the standard FIM design. In the Indian River Lagoon, existing sampling was not providing sufficient data, so sampling effort was increased by 24 seine hauls per month, which increased sampling in the St. Sebastian River and added two river systems (St. Lucie and Loxahatchee rivers) that had not been included in the standard FIM design. To improve age-and-growth estimates for juvenile snook used in state stock assessments, randomization procedures for retaining snook ≥100 mm SL for biological sample collection were also established with this modified survey design.
Stock assessment analysts’ desire for juvenile snook abundance and age data were met by expanding sampling with an existing gear type (21.3-m seine) into undersampled waterbodies that had very small geospatial extents. Data from the reconnaissance and gear-testing phases of the present study were immediately used in snook stock assessments (Munyandorero et al., 2020). The modified sampling design also improved indices of abundance of age-0 snook and strengthened snook age–length keys with the collection of additional individuals for age-and-growth analyses. Furthermore, valuable fish community data, including other managed species, have been collected under the modified design. In addition to supporting stock-assessment needs, these data are being consulted for restoration and conservation efforts in Florida (Stevens et al., 2022; Wilson et al., 2022).
The geographically inclusive scope of the FIM program was instrumental to the success of this amended sampling design. And without the earlier data from each of the estuaries, developing and implementing the snook survey modification would have been cost-prohibitive. The two rivers added into the IRL are outside the standard FIM survey design; without the earlier survey in the IRL and the existence of a field laboratory adjacent to these rivers, they could not have been included in the amended sampling design. The annual sample size (n=744) for this survey is greater than the number of collections made annually at the average FIM field laboratory. The funding for the development, deployment, and maintenance of this survey was provided by a continuing grant from Florida’s Snook Stamp program. Because of the FIM program’s extensive network of field laboratories, existing data, standardized procedures, database, and infrastructure, this survey was implemented for less than 1/3 of the funding that would have been necessary to establish and maintain a new field laboratory.
After five years (2016–2020) of level funding that did not account for increased operational costs, the FIM program revisited the juvenile snook survey design in 2020. The overall goal was to examine spatial and temporal data in hopes of identifying ways in which sampling might be reduced without compromising critical management data needs, thereby reducing costs. Data analyses indicated that spatial sampling reductions could not be implemented without affecting data quality and the long-term data sets.
Survey data were also examined for monthly trends in each of the estuarine systems to identify months during which abundance of juvenile snook was low, such that effort might be reduced or eliminated. Abundance trends of other economically important species (e.g., red drum and spotted seatrout, Cynoscion nebulosus) were also examined to ensure that any reduction of effort would not compromise data on those species. Four sampling scenarios were examined to assess possible effects on survey data: 6-month (Sep–Feb), 7-month (Sep–Mar), 8-month (Aug–Mar), and 9-month (no sampling during March, May, or July, which results in bimonthly sampling during months when snook abundance is low in 21.3-m seines). The 9-month scenario minimized negative effects on the long-term data while providing an adequate reduction (25%, 333 annual net hauls) in sampling effort and was implemented in 2021. The 9-month scenario encompassed the traditional recruitment window for snook and covered recruitment windows for red drum and spotted seatrout.
Reef fishes in the Gulf of Mexico and western Atlantic Ocean support multibillion-dollar recreational and commercial fisheries. Many of these species are estuarine-dependent (e.g., Koenig and Coleman, 1998; Nagelkerken et al., 2001; Nagelkerken et al., 2002; review by Gillanders et al., 2003; Casey et al., 2007; Switzer et al., 2012; Lefcheck et al., 2019), juveniles occupying estuarine habitats, and mature fish occupying offshore reef habitats. Managing these fisheries is complex, and management is more effective when indices of juvenile abundance are available for use in predicting recruitment to the fishery. Predicting the strength of recruitment to the fishery, in turn, allows managers to better assess outcomes from management actions (Hansen et al., 2015). Under its standard long-term sampling design, the FIM program captured highly variable numbers of juveniles of estuarine-dependent reef species, resulting in highly variable indices of juvenile abundance (Switzer et al., 2012; Flaherty-Walia et al., 2015; Switzer et al., 2015). Therefore, the standard long-term estuarine survey undersampled a preferred juvenile habitat: polyhaline (salinity >18) seagrass beds, and researchers and managers recommended improving indices of juvenile abundance for reef species (Switzer et al., 2012; Flaherty-Walia et al., 2015). The FIM program needed a survey that better sampled juvenile (estuarine-dependent) reef fishes to carry out its mission of providing timely and accurate data for fishery management. Toward that end, results from existing FIM data for the eastern Gulf of Mexico were used to inform the design of a complementary FIM survey aiming to improve the ability to characterize the abundance of juvenile gag, Mycteroperca microlepis, (Casey et al., 2007; Switzer et al., 2015) and other estuarine-dependent and seagrass-associated reef fishes by targeting the preferred polyhaline seagrass habitat. Work in Charlotte Harbor was instrumental in developing the survey, as Casey et al. (2007) documented that juvenile gag were collected mainly between April and December in habitats with ≥50% seagrass cover. Relative abundance of gag was also about 2.9 times as great on shoals as that near mangrove and beach shorelines (Casey et al., 2007). This information was used, in part, in the successful proposal for a much larger award for monitoring reef fishes along Florida’s Gulf coast. The FIM program in 2008 initiated this complementary survey (hereafter, the West Florida Shelf Inshore [WI] survey) to extend its standard, long-term monitoring survey to deep seagrass habitats found in estuaries already sampled by the FIM program and in adjacent estuaries not sampled by the FIM program (Figure 6). The main objective of the WI survey was to provide data to improve estimates of abundance of juvenile estuarine-dependent reef fish in the eastern Gulf of Mexico to inform federal reef fish assessments and management decisions.
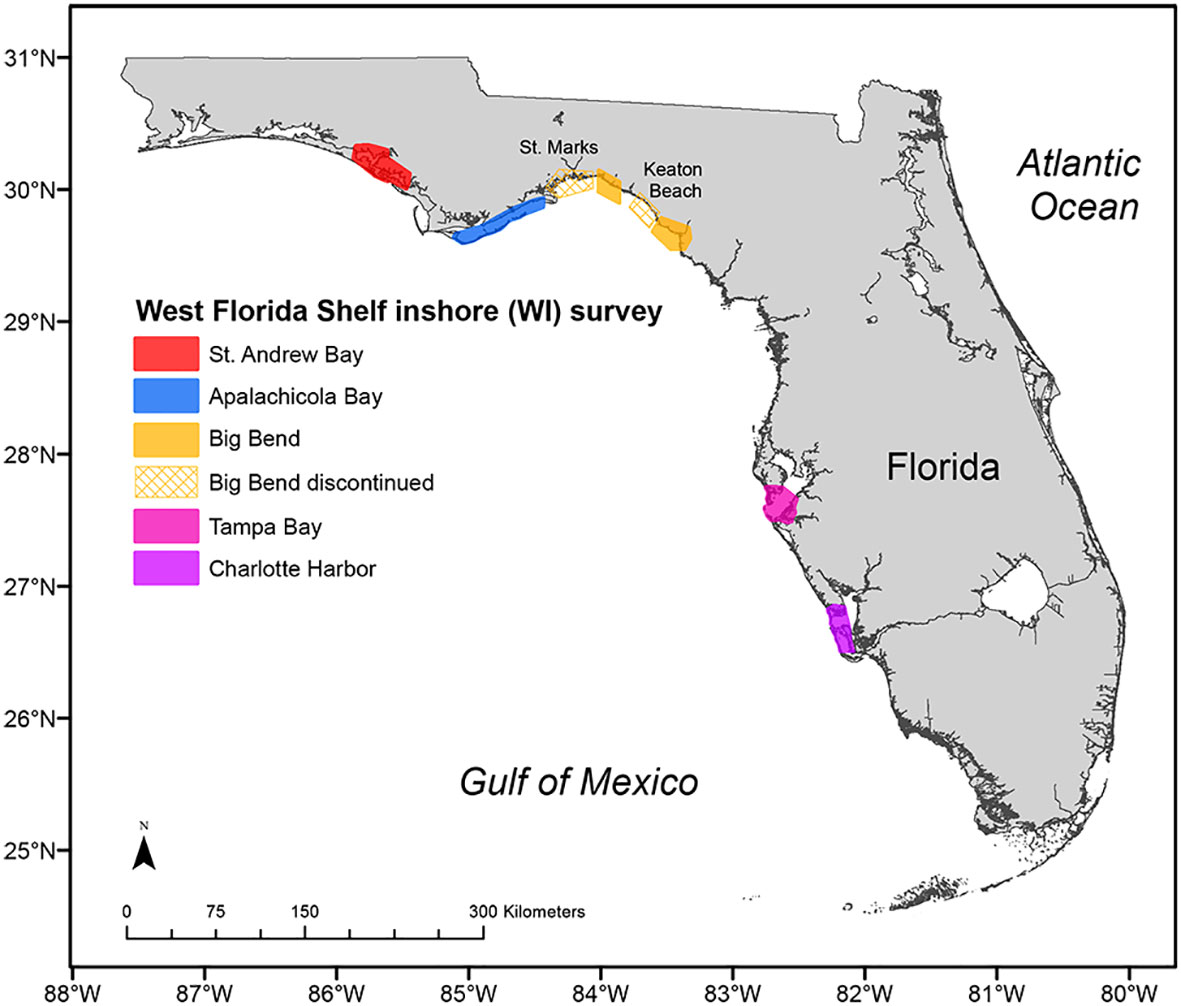
Figure 6 Five estuaries sampled for the West Florida Shelf Inshore (WI) survey to collect data for estimating juvenile reef fish abundances. The survey began in 2008 in all color-coded geographic areas; the two areas with hashed fill are Keaton Beach and St. Marks, where sampling for the WI survey was discontinued after 2008 and 2018, respectively.
Implementing the WI survey in 2008 did not change the standard long-term estuarine monitoring survey, but rather complemented it by expanding the sampling universe to include habitats that had been undersampled in all estuaries. Specifically, the complementary WI survey targets polyhaline seagrass habitats within estuaries already sampled by the FIM program (AP, TB, CH) and in Saint Andrew (SA) and Big Bend (BB), estuaries adjacent to AP and CK, respectively. Within these estuaries, the WI sampling universe was defined by sampling cells (185 m × 185 m) with polyhaline seagrass habitats. Cells were then stratified by space, and sites were randomly selected. Within estuaries already sampled by the FIM program (AP, TB, CH), the WI universe covers ~224 sq km (ranging from 5–10% of the standard FIM estuarine universe) that were previously undersampled by the standard long-term survey. In the new, adjacent estuaries (SA, BB), the WI universe is ~221 square kilometers. Implementing the WI survey also required the development of new sampling protocols. The WI survey initially used two types of standard inshore FIM sampling gear: the 6.1-m otter trawl and the 183-m haul seine. The 6.1-m otter trawl procedures for WI sampling follow standard FIM otter trawl protocols with two important modifications. First, the trawl must sample a path with ≥50% cover of submerged aquatic vegetation (confirmed before gear deployment). Second, the trawl is towed for half the distance (0.1 nautical mile at 1.2 kts; ca. 5-min tow) of a standard FIM bay trawl (0.2 nautical miles) to effectively sample smaller seagrass beds, reduce algae bycatch, and ensure standardized trawl samples in the WI survey. Additional details regarding 6.1-m otter trawl sampling in the WI survey can be found in Switzer et al. (2012); Flaherty-Walia et al. (2015) and Schrandt et al. (Schrandt et al., 2018; Schrandt et al., 2021b).
The 183-m haul seine deployments for the WI survey were also modified from the standard FIM inshore sampling survey. Under standard FIM protocols, the 183-m haul seines are deployed by boat and set in a rectangular shape along shorelines, where the seine’s wings are pulled together along the water’s edge or along a shore type that prevents reaching the water’s edge (e.g., vegetation). Under WI sampling protocols, haul seines are deployed by boat in a rectangular shape along shallow shoals (in 0–1.0 m of water) usually >100 m from a persistent shoreline where the difference between the wing depth (depth at which the ends of the net were pulled together along the shoal, the shallowest portion of the deployment) and the bag depth (depth at the bag of the haul seine, the deepest portion of the deployment) is at least 0.5 m (De Angelo et al., 2014).
Other than these procedural changes, WI sampling followed standard FIM sampling procedures practiced statewide, wherein, for all, all fish and macroinvertebrates are identified and counted, providing as much continuity as possible between the complementary WI survey and the standard long-term survey. This also ensures that data are available for assessment of other taxa that are not estuarine-dependent reef fish and for ecosystem management-type assessments.
After the WI survey was initiated in 2008, the survey underwent a series of assessments and amendments to improve efficiency, reduce variability stemming from sampling or observation error, and improve statistical power to detect changes in abundance over time. With the completion of the initial grant and loss of the original funding source, these assessments and subsequent modifications were paramount to balancing workloads with reduced funding and the critical data needs for stock assessments and fisheries managers. The first changes, in 2009 and 2016, focused on reducing variability in the abundance estimates of various reef species by discontinuing sampling 1) during the months in which reef fishes do not actively recruit to the estuaries and habitats of interest and 2) in areas in which reef fish are not recruiting to the seagrass beds in numbers large enough to provide statistically powerful indices of juvenile abundance. This meant changing the sampling months from May–November to June–November, corresponding to the approximate months of the seagrass growing season (Zieman and Zieman, 1989), and discontinuing sampling in an unproductive area (Keaton Beach) in the Big Bend (Table 1; Figure 6). In 2019, sampling was discontinued in another area of the Big Bend (St. Marks; Table 1; Figure 6) as a cost-saving measure and to reduce redundancy in the survey. Information for nearly all species of interest was being obtained from the other two Big Bend sampling areas, which had trends similar to those in St. Marks, suggesting some redundancy in the sampling design (unpublished data).
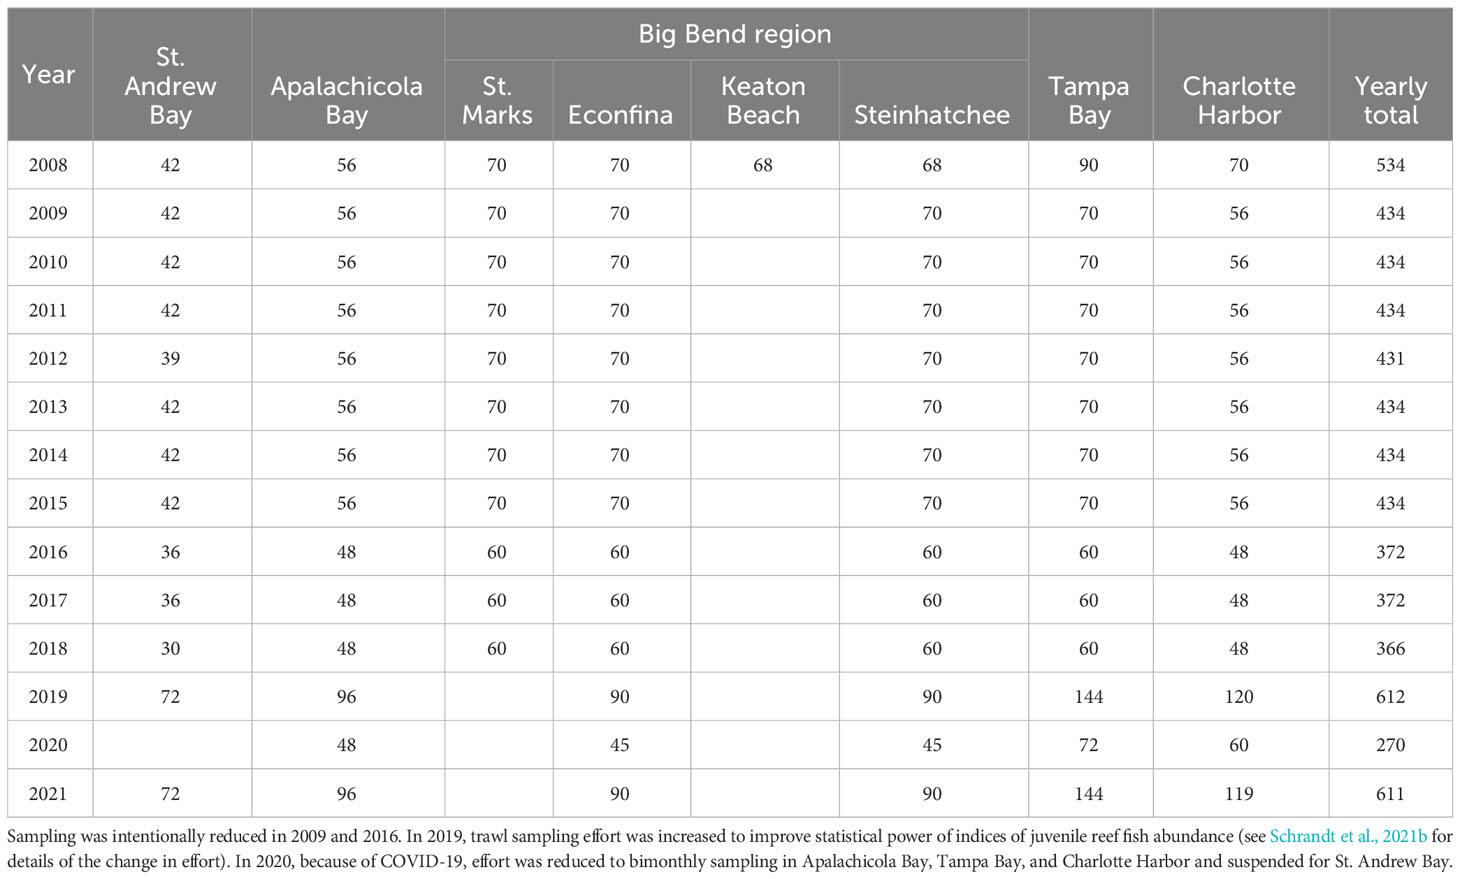
Table 1 Summary of annual 6.1-m otter trawl effort (number of net hauls) in the five estuaries sampled by the West Florida Shelf Inshore (WI) survey along the Gulf coast of Florida, USA.
With even more reductions in funding for the work, critical assessments focused on further streamlining the survey while still being able to provide statistically powerful indices of abundance for stock assessments and managers. Therefore, all available WI data were used to compare catches between the two gear types and to conduct simulations to estimate the statistical power of each type of gear to detect changes in abundance for seven species (Schrandt et al., 2021b). The study concluded that the 6.1-m otter trawl was more efficient than the haul seine in collecting many of the reef species and that other data were similar between the two gear types. Furthermore, a modest increase in sample size of the otter trawl would achieve statistical power to track changes in abundance (Schrandt et al., 2021b). After much consideration, WI haul seine sampling was discontinued in all estuaries and the sample size for trawls was increased in 2019.
The FIM program’s WI survey added a new habitat to a long-term survey design that addressed an evolving stock assessment need (i.e., less variable, more powerful indices of juvenile abundance); the habitat addition capitalized on a new grant funding award and complemented the long-term survey. Subsequent modifications to the WI survey design were necessary to meet stock assessment needs as funding sources changed and overall funding was reduced. The complementary WI survey was able to be seamlessly added to estuarine sampling efforts after habitat and location reconnaissance and gear-testing for a new deployment technique had been completed. The WI survey has expanded the estuaries and habitats sampled under the long-term estuarine survey. A comparison of fish communities sampled via haul seines in the long-term survey and those sampled in the WI survey documented differences in fish communities between the seagrass habitat along shorelines and the shoal seagrass habitat, away from the shorelines (De Angelo et al., 2014), indicating that the haul seines in the WI survey were providing information that was not being obtained with the FIM standard estuarine inshore survey. Furthermore, they noted that shoal habitats had greater densities of several estuarine-dependent reef fish species, like gag, gray snapper, Lutjanus griseus, and lane snapper, L. synagris.
In 2019, results from additional gear comparisons and power simulations (Schrandt et al., 2021b) led to discontinuing WI haul seine sampling, which was the largest and potentially most impactful change made to the survey. Although this change resulted in the end of a time series for haul seine data in polyhaline seagrass beds along Florida’s Gulf coast, it resulted in the continuance and enhancement of the program’s trawl time series. The routine analysis of data and the geographic extent of the long-term FIM program were critical to the implementation of this survey design. Without routine analysis of data from the long-term FIM program survey, supporting documentation for the awarded grant would not have existed. Additionally, the cost of the grant would have been excessive had the program not been able to leverage established surveys. All amendments were considered exhaustively, and all available data were used to inform the FIM program’s decisions, with minimal data loss and prioritizing the continuity of new survey data with the earlier data. Ultimately, the decisions to focus the survey over space and time and to streamline to a single gear type allowed the FIM program to provide better indices of juvenile abundance. For example, the polyhaline seagrass survey has reduced variability and coefficients of variation for catch-per-unit-effort for gray snapper (Flaherty-Walia et al., 2015). The WI survey has also improved abundance estimates for young-of-the-year gag and reduced coefficients of variation for young-of-the-year gag when WI data were combined with data from the standard long-term estuarine survey (Switzer et al., 2015). Furthermore, 6.1-m otter trawl abundance estimates for seven reef fish species of interest were greater for the WI survey, which sampled deep polyhaline seagrass beds, than for the long-term monitoring survey, which had not sampled such habitat (Figure 7). Finally, the WI survey has greater statistical power to discern trends in time-series of abundance data for juvenile reef fishes (Schrandt et al., 2021b).
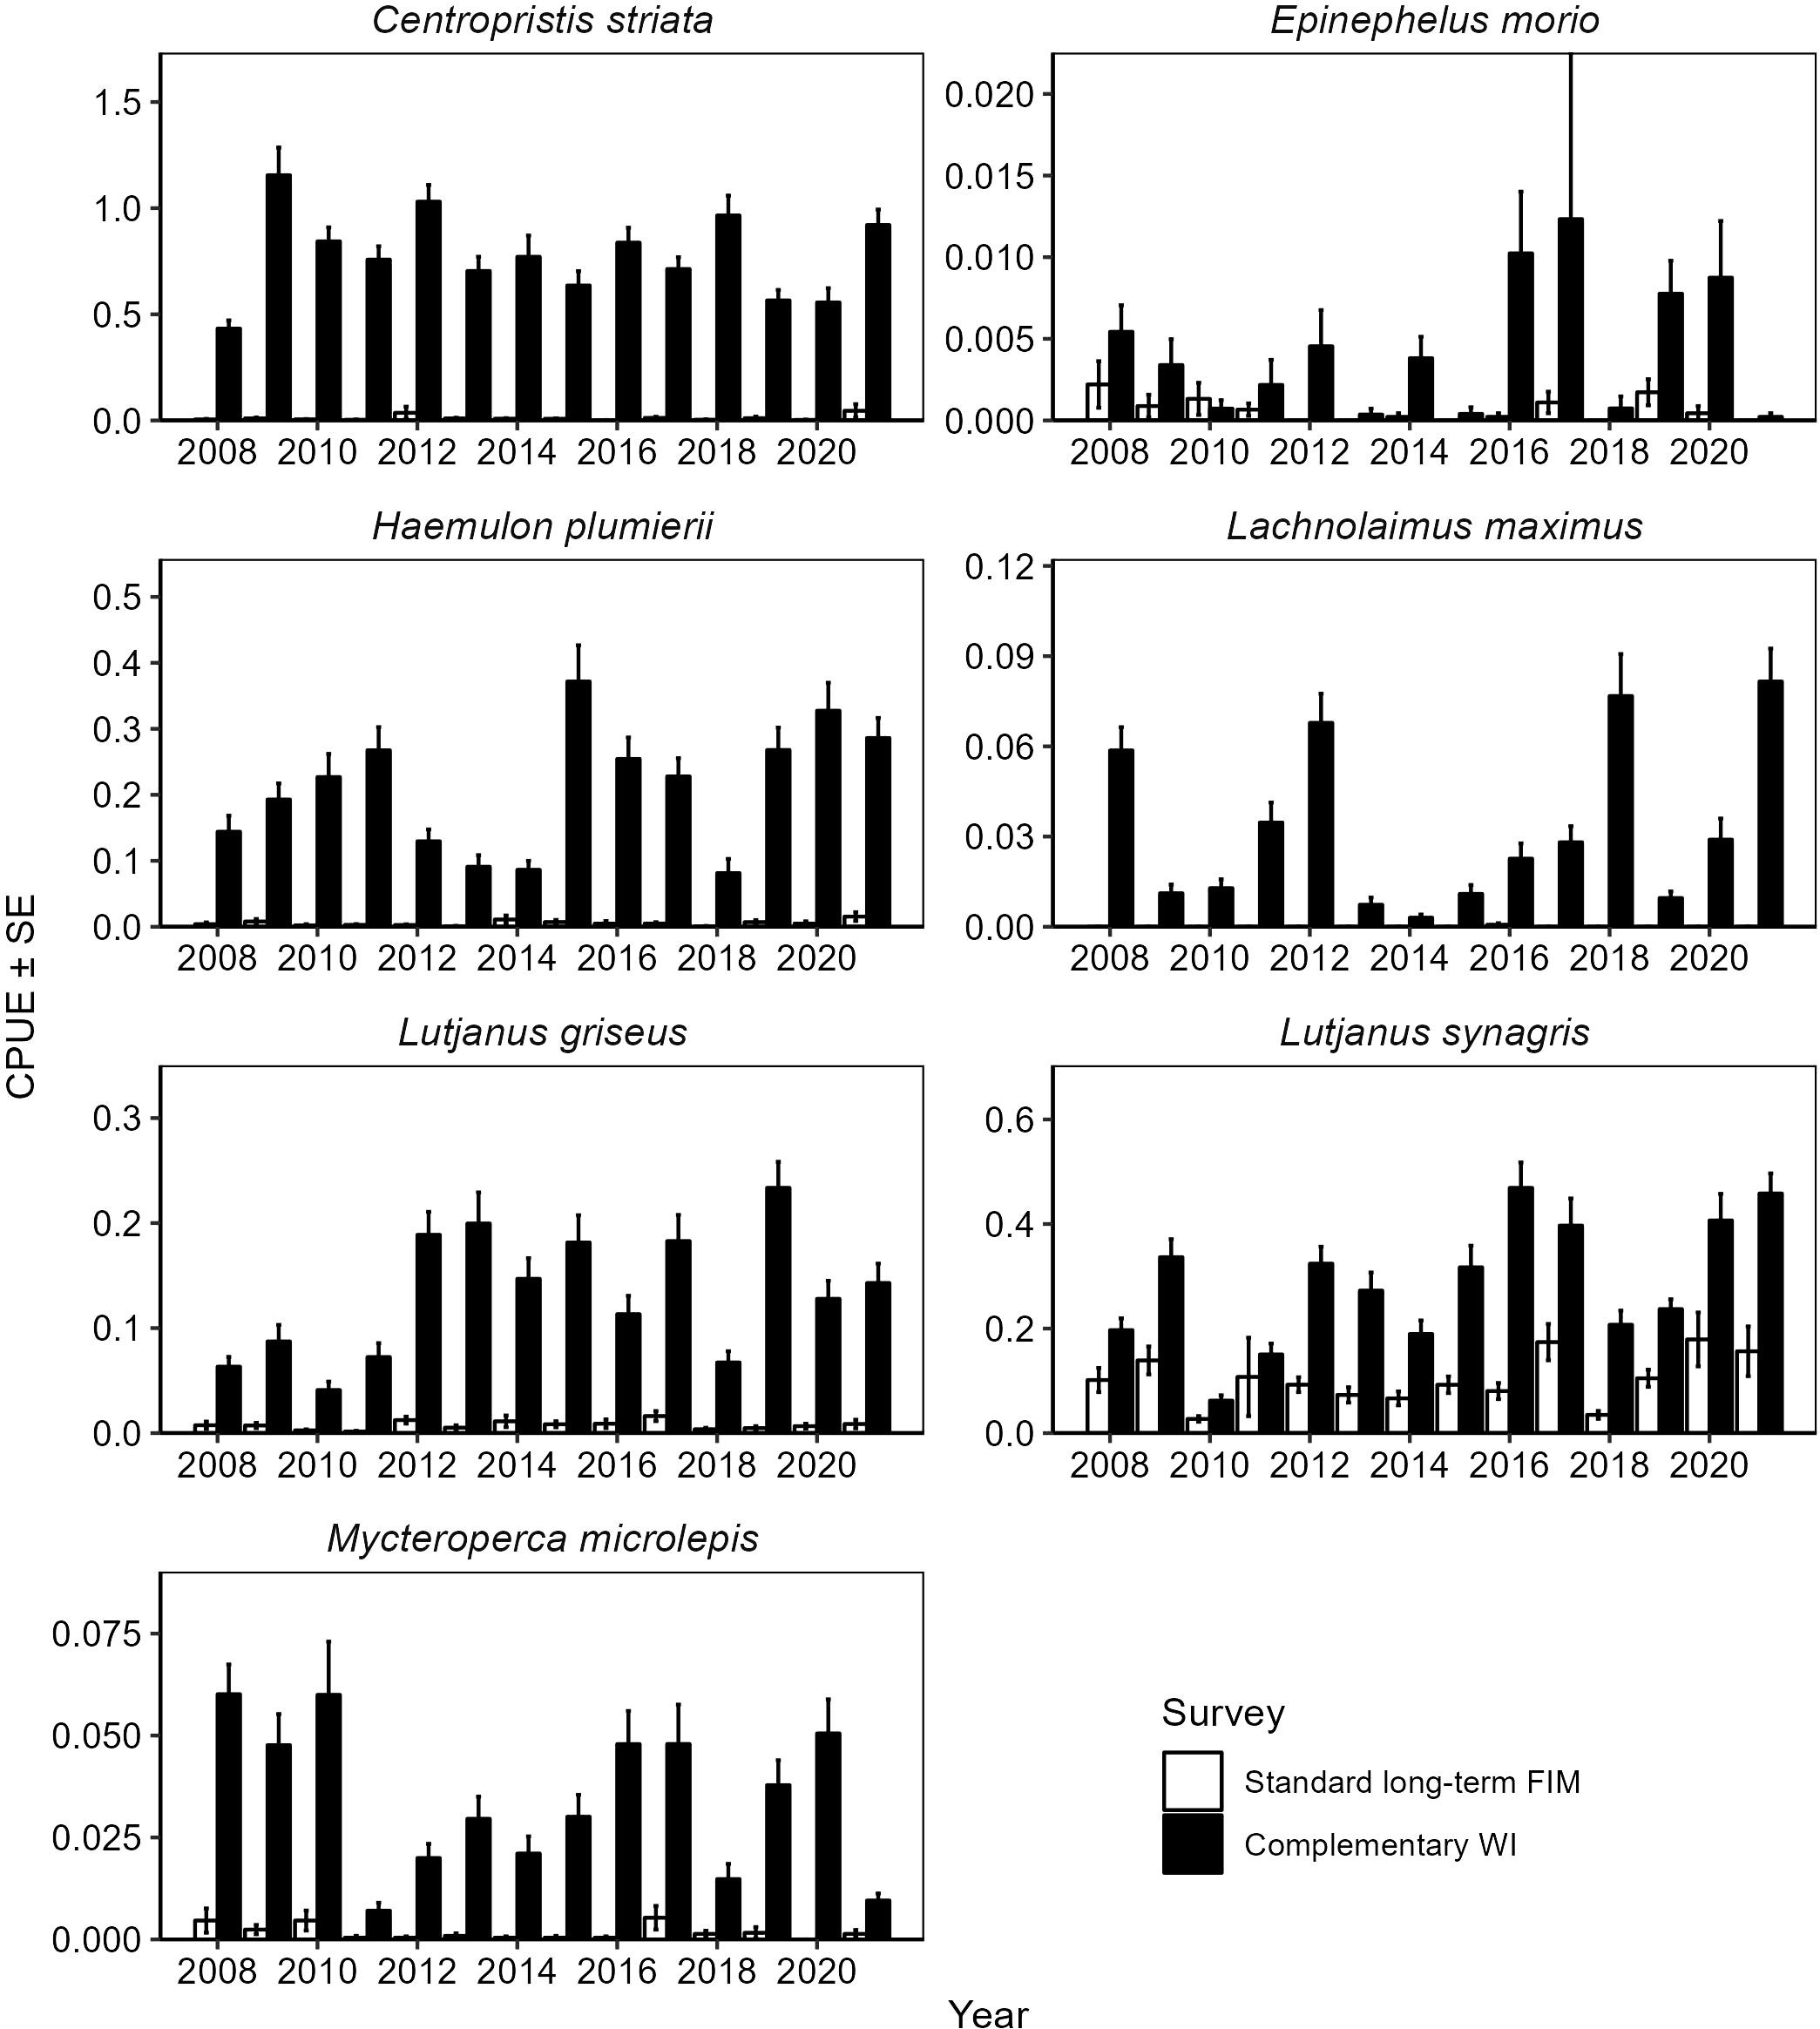
Figure 7 Mean catch-per-unit-effort (CPUE; fish per 100 m2) ± SE for estuarine-dependent reef fishes collected in 6.1-m otter trawls in the fishery-independent long-term monitoring survey and the complementary West Florida Shelf Inshore (WI) survey. The data presented here include catch data for five estuaries (St. Andrew Bay, Apalachicola Bay, the Big Bend region, Tampa Bay, and Charlotte Harbor) from June through November for each year from 2008 through 2021. All five estuaries are sampled under the WI survey, but only Apalachicola Bay, Tampa Bay, and Charlotte Harbor are sampled under the long-term monitoring survey.
Statistically powerful indices of juvenile abundance can help fishery managers make better informed decisions in forecasting and managing Gulf of Mexico reef fish stocks and allow for the opportunity to assess connectivity between the juvenile fish populations using estuarine habitats and their adult counterparts using offshore reef habitats. In addition to data on juvenile reef fish provided by the WI survey, the FIM program has expanded to conduct offshore sampling in both reef (Keenan et al., 2022; Switzer et al., 2023) and nonreef environments throughout the eastern Gulf (Matheson et al., 2017; Christiansen et al., 2022b). Combined, data from these comprehensive surveys of reef fish populations—juveniles through adults—have already proven critical to assessing managed reef fish populations (see SEDAR (2018) for an example for gray snapper).
Spotted seatrout is an estuarine-dependent, economically important species throughout its U.S. range, which encompasses the Atlantic and Gulf coasts from Cape Cod, MA, southward through Texas (Tabb, 1966; Brown-Peterson and Thomas, 1988; Bortone, 2003). In Florida, in the mid-1990s, net limitation regulations and declines in catch rates led the spotted seatrout fishery, traditionally both commercial and recreational, to shift to almost exclusively recreational, with approximately 98% of the state harvest coming from the recreational fishery (Murphy et al., 2011; Addis et al., 2017). The FWC has managed the spotted seatrout fishery with bag, gear, and slot limits across management regions that have changed over time. From 2012 to 2019, four regions were used: Northwest (northern Gulf coast), Southwest (southern Gulf coast), Southeast (southern Atlantic coast), and Northeast (northern Atlantic coast). Ongoing, standard long-term FIM sampling surveys existed in each of these regions. In 2020, FWC configured five management regions (Figure 8), with input from stakeholders, that aligned with evidence of genetic breaks in Florida (Seyoum et al., 2018). One of these newly created management regions, Western Panhandle, did not have a standard FIM survey in place, resulting in data limitations in abundance estimates. The FIM survey design for this region needed to address several spotted seatrout metrics: data for age-and-growth determination, and abundance data for three size classes of spotted seatrout (young-of-the-year, pre-fishery, and fishery). Additionally, the survey design would need to address other species, managed and unmanaged, and provide data for ecosystem-management assessments (e.g., Schrandt and MacDonald, 2020; Schrandt et al., 2021a; zu Ermgassen et al., 2021), as are standard for all FIM program surveys. Ideally, the implemented sampling design would collect data consistent with data collected in other estuaries sampled by the FIM program. A final, important consideration was that less than 20% of the annual funding needed to establish a traditional FIM survey in just one estuary was available for surveys in this new region, which includes six main estuaries (St. Joseph Bay, St. Andrew Bay, Choctawhatchee Bay, Santa Rosa Sound, Pensacola Bay, and Perdido Bay). The main objective of the Western Panhandle survey was to address the data limitations by providing data for abundance and age-and-growth information for multiple size and age classes of spotted seatrout to inform the state stock assessment and management decisions.
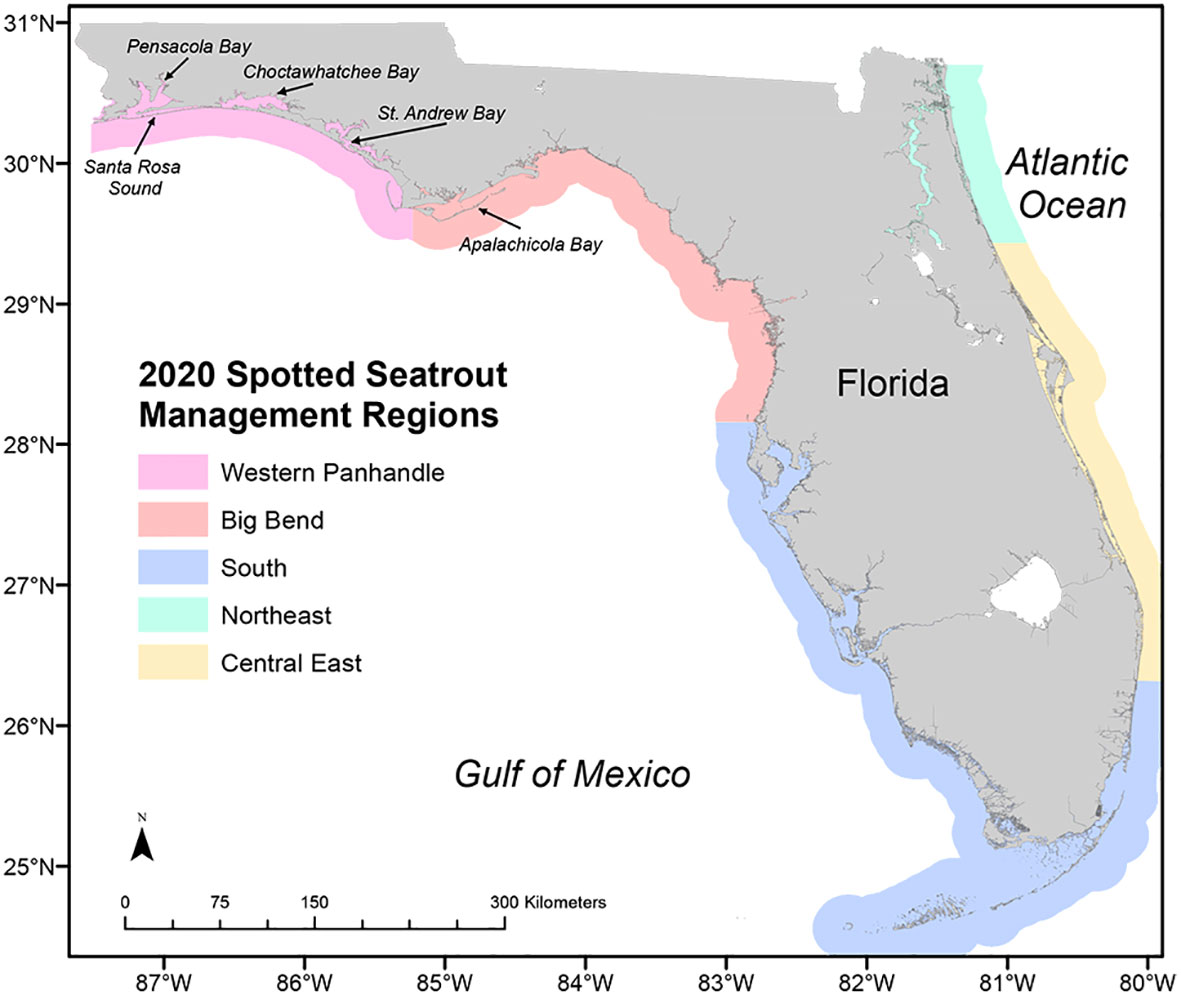
Figure 8 Map of five fishery management regions for spotted seatrout, Cynoscion nebulosus, established in 2020. Apalachicola Bay, one of the Fisheries-Independent Monitoring (FIM) program’s long-term monitoring estuaries, is the FIM laboratory closest to the Western Panhandle management region established in 2020. The FIM program began sampling efforts in the Western Panhandle to support data collection for the new management region.
Data from two nontraditional FIM surveys were available from the new spotted seatrout management region: 1) a short-term, seasonal (June–December) reconnaissance survey from 2017–2019 in four western Panhandle estuaries (St. Andrew Bay, Choctawhatchee Bay, Santa Rosa Sound, and Pensacola Bay; Figure 8); and 2) a relatively long-term, seasonal (June–November) West Florida Shelf Inshore survey (WI; see section 4) from 2008 to the present day, that targets polyhaline seagrass beds in St. Andrew Bay. There were also standard long-term FIM survey and WI survey data available from Apalachicola Bay, an estuary immediately east of the Western Panhandle region (Figure 8). Data from those two surveys were examined to determine a suitable, cost-effective sampling design to address data needs for stock assessment and ecosystem management purposes in the Western Panhandle. These analyses included examining monthly spotted seatrout length-frequency and abundance between gear types, survey designs, and estuaries.
Monthly length-frequency distributions for spotted seatrout were compared between the two gear types (21.3-m seines and 6.1-m otter trawls) that targeted age-0 (<100 mm SL) spotted seatrout in two sampling areas (Western Panhandle and Apalachicola Bay) to discern differences between gear types and regions, identify monthly differences, and assist in assessing appropriate months in which to survey the population. Spotted seatrout <100 mm SL were collected with both gear types between June and November (Figure 9) and there were no visually identifiable differences in the range of sizes sampled between gear types or areas.
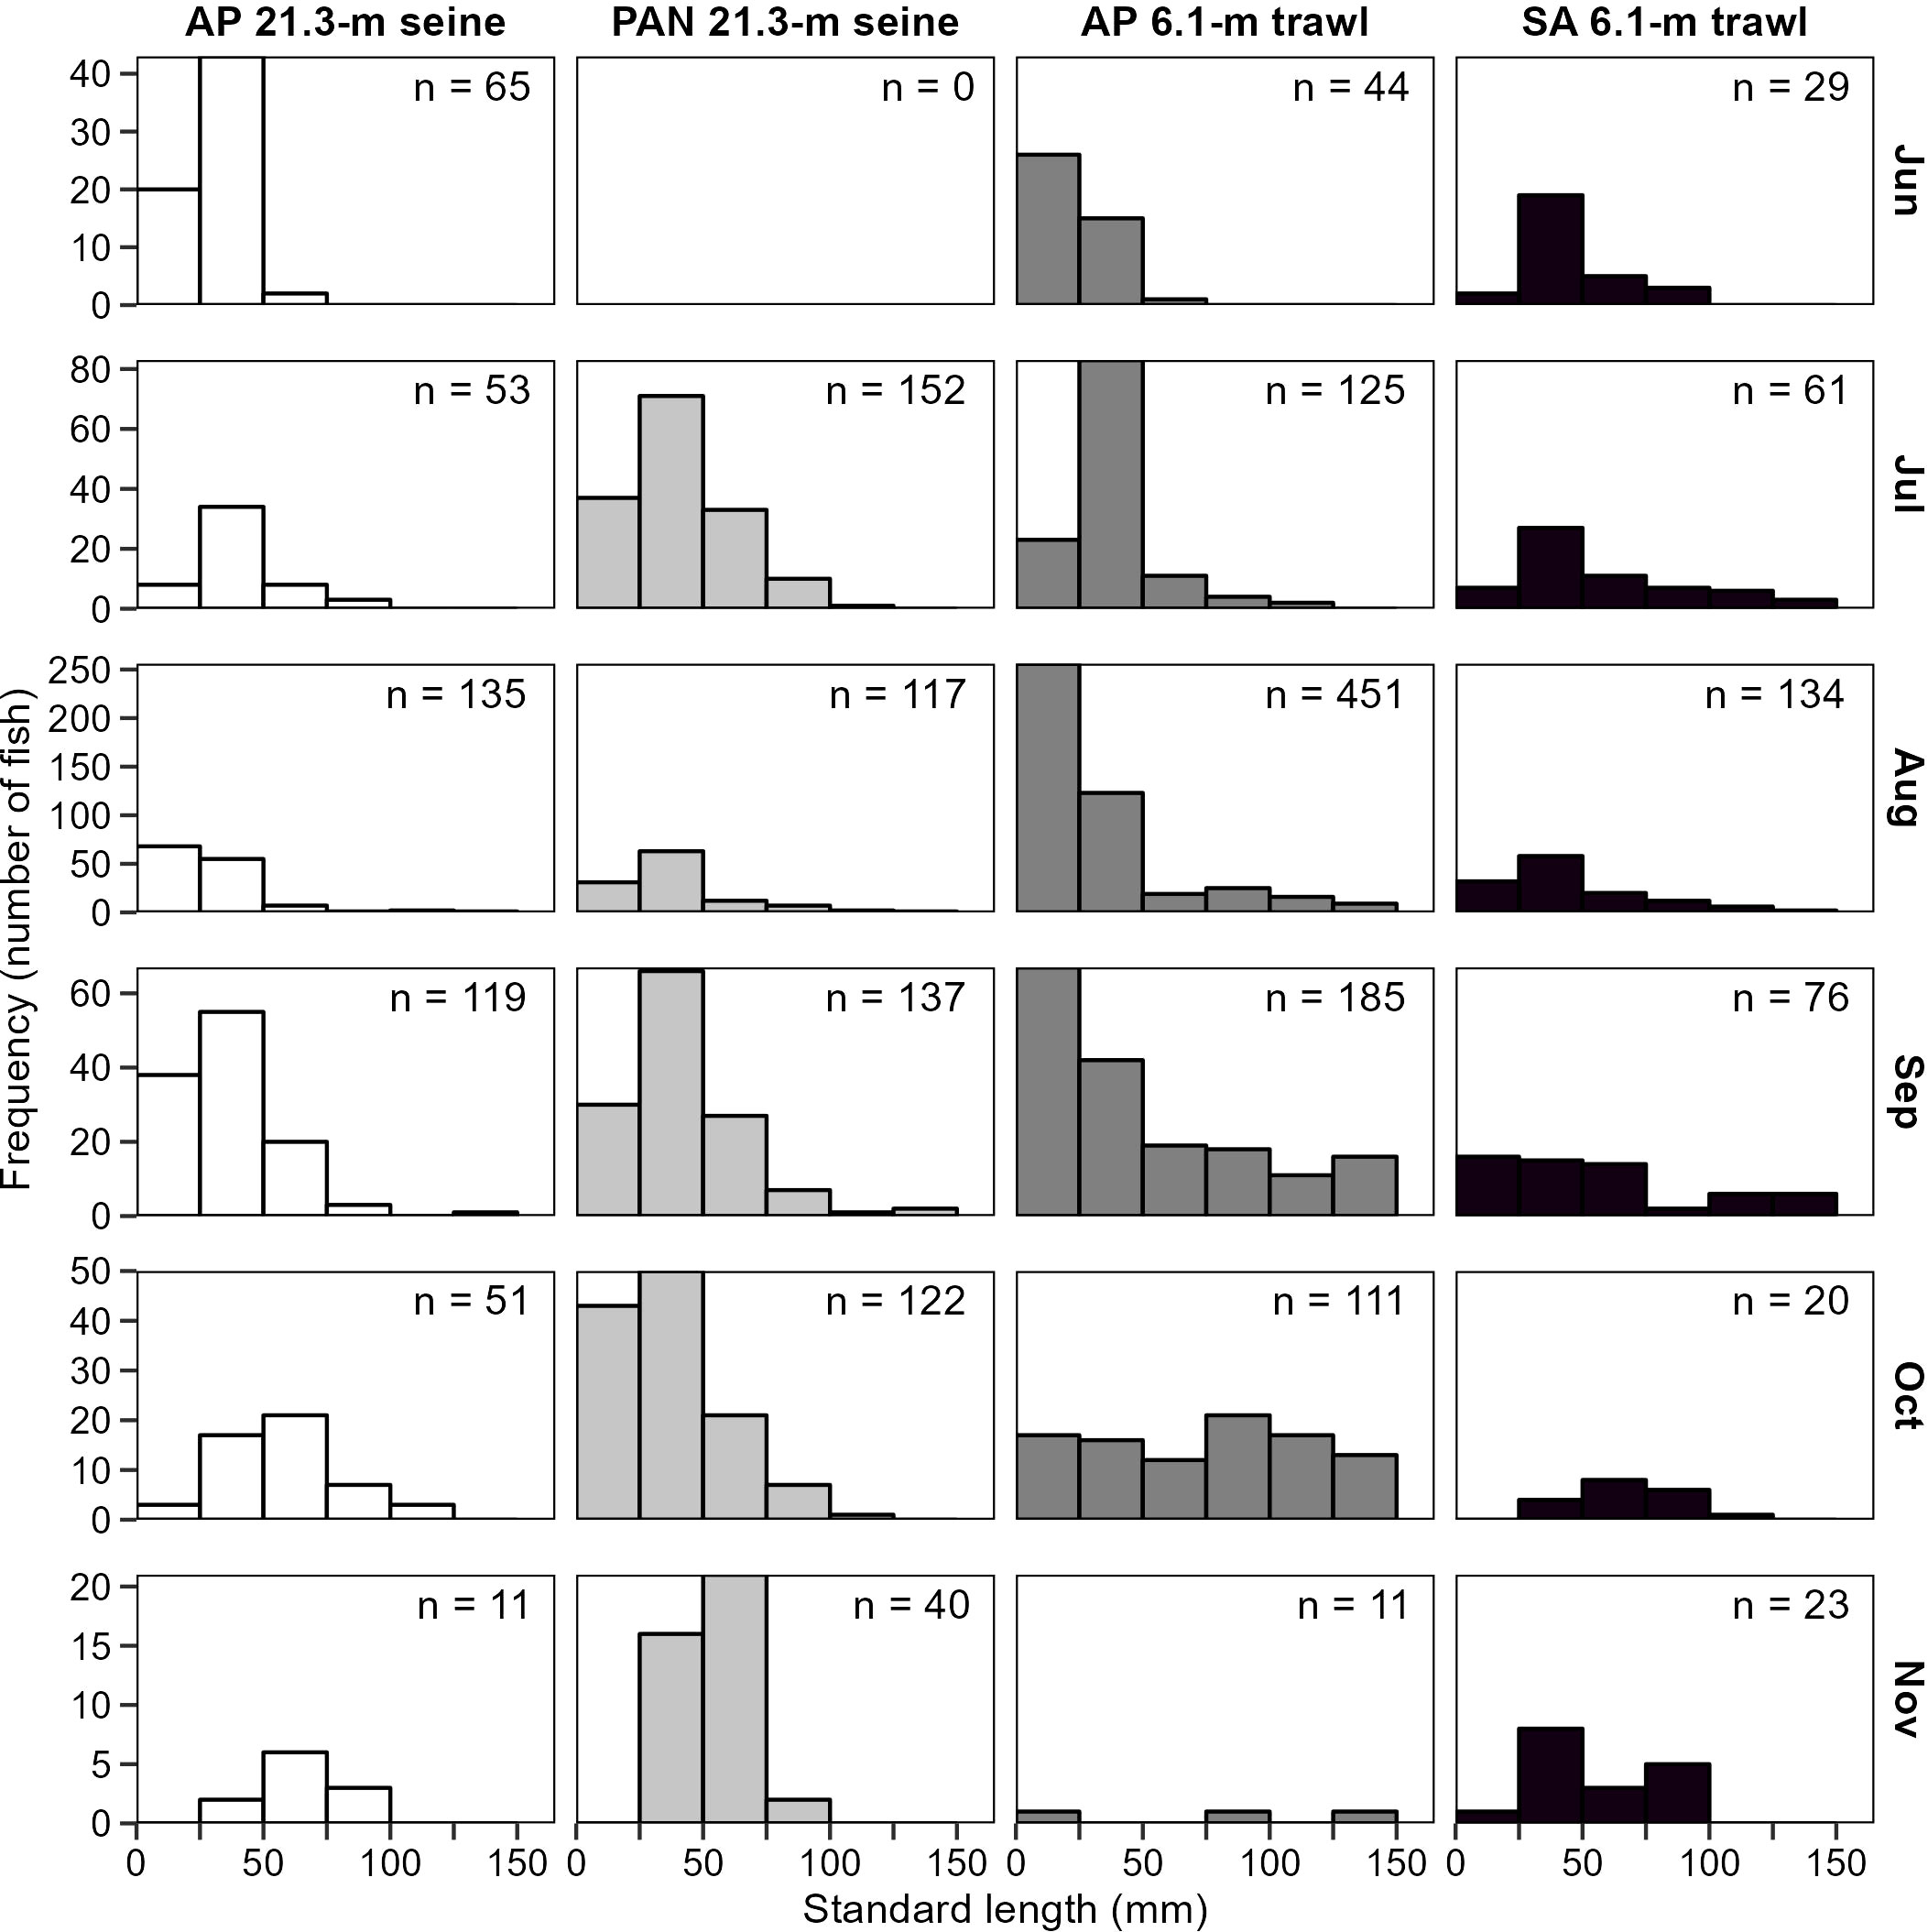
Figure 9 Size distribution of spotted seatrout, Cynoscion nebulosus, collected from 21.3-m seines from Apalachicola Bay (AP) and the Western Panhandle region (PAN) during the reconnaissance survey and from 6.1-m otter trawls during the West Florida Shelf Inshore (WI) survey. Data from 2017–2019 were analyzed. Fish >150 mm SL were collected but the x-axis has been truncated to emphasize sizes that represent the majority of the catch (age-0).
Monthly abundance plots were prepared for each estuary for the two gear types that target age-0 (<100 mm SL) spotted seatrout (21.3-m seines and 6.1-m otter trawls) to compare trends between gear types and estuaries, determine what estuaries should be sampled, and assist in assessing appropriate survey months. Monthly abundance trends for the seines in Apalachicola Bay were similar to the monthly abundance trends for the otter trawls in St. Andrew and Apalachicola bays (Figure 10), with low abundance in June, peak abundance in August, and then a decline to very low abundance by November. Reconnaissance sampling with 21.3-m seines in the Western Panhandle region demonstrated little variation between months, and monthly trends were not in agreement with the seine or trawl data from Apalachicola Bay, or with the otter trawl data from St. Andrew Bay. Although the seines in the Western Panhandle reconnaissance survey included seagrass bed habitats like the other surveys, the sample size within seagrass beds might not have been large enough to allow monthly trends to be discerned, which may explain this lack of agreement between surveys.
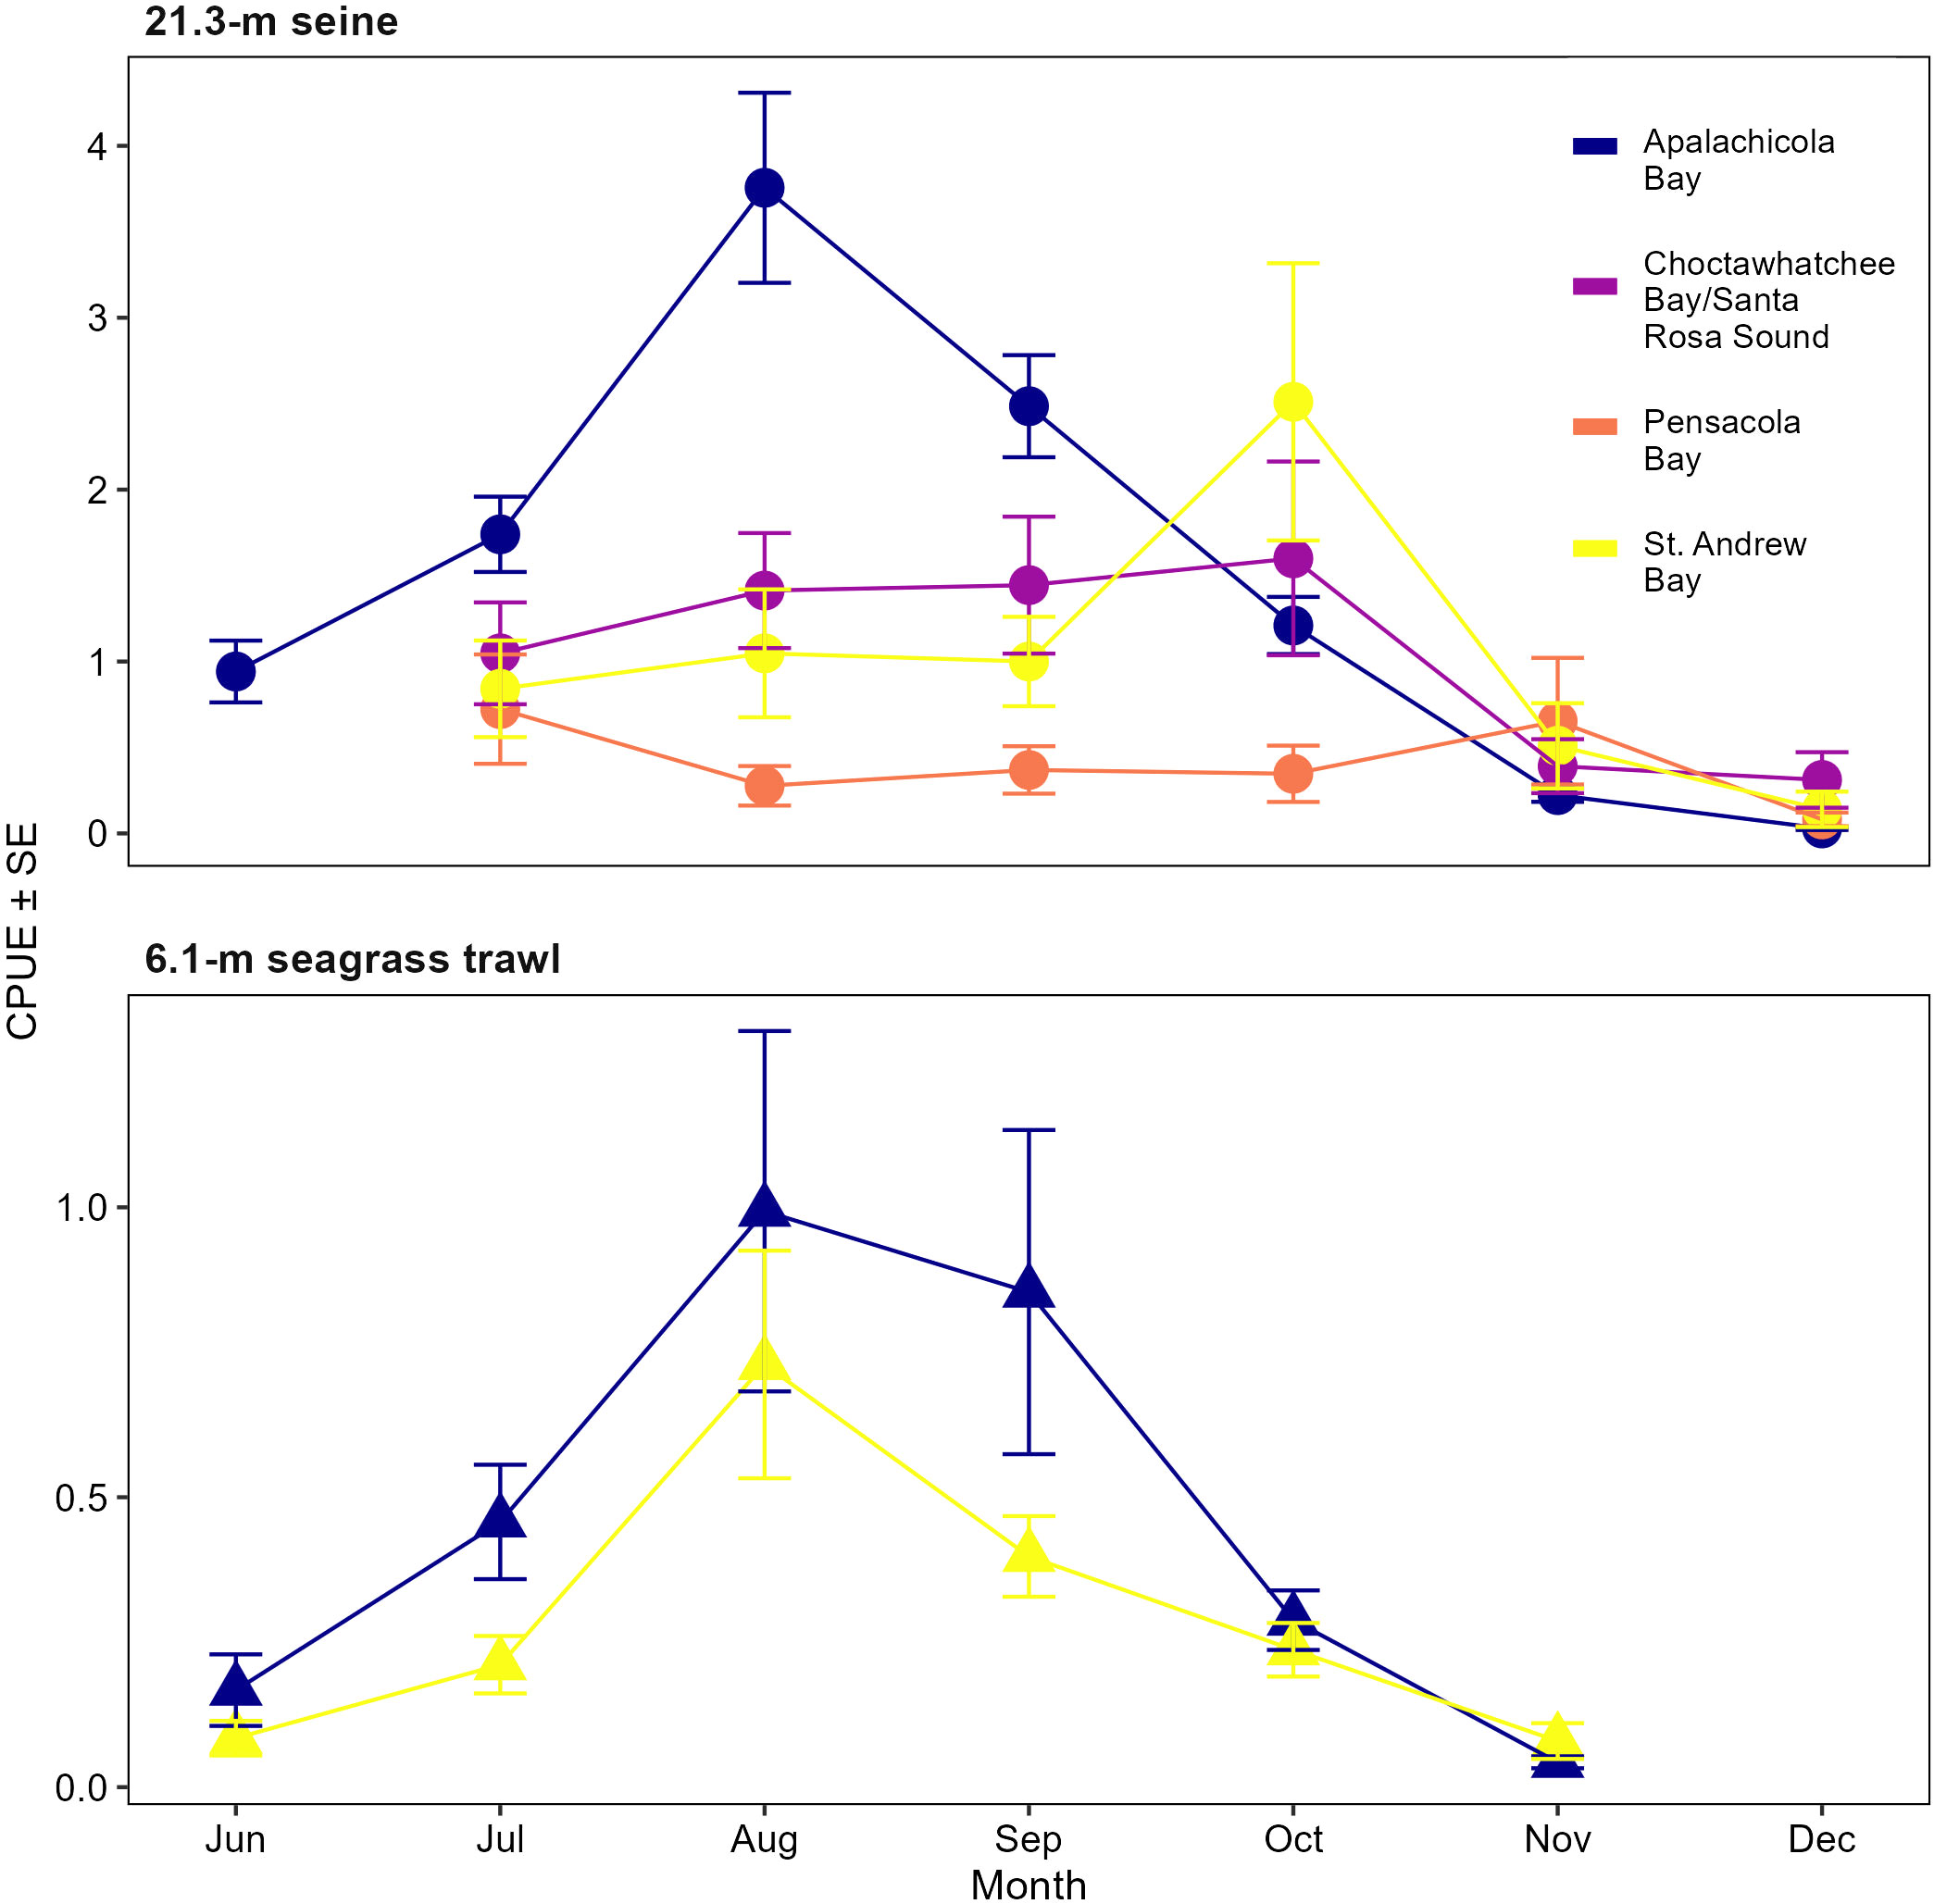
Figure 10 Monthly mean catch-per-unit-effort (CPUE) ± SE for all sizes of spotted seatrout, Cynoscion nebulosus, collected by the FIM program sampling surveys. CPUE for the 21.3-m seine data is expressed as number of fish per haul and represents long-term FIM sampling in Apalachicola Bay (2001–2019) and reconnaissance sampling from 2017 to 2019 in the Western Panhandle (St. Andrew Bay, Choctawhatchee Bay/Santa Rosa Sound, and Pensacola Bay). CPUE for the 6.1-m otter trawls is expressed as number of fish per 100 m2 and represents the West Florida Shelf Inshore (WI) survey conducted from June through November (2008–2019) in Apalachicola and St. Andrew bays.
The assessment of pre-fishery (100–325 mm SL) and fishery (326–415 mm SL) sized spotted seatrout in the Western Panhandle was necessary for stock assessments. Available data collected before 2020 consisted of limited fishery-dependent data for a few metrics (age, growth, sex proportions, and maturity), but no abundance data. The Western Panhandle region had never been sampled with the 183-m haul seine, but length-frequency and abundance data from Apalachicola Bay were available and were assessed to refine the survey design for this gear type. Pre-fishery and fishery sized spotted seatrout were collected regularly (Figure 11) and were most abundant in 183-m haul seine samples in Apalachicola Bay between July and February.
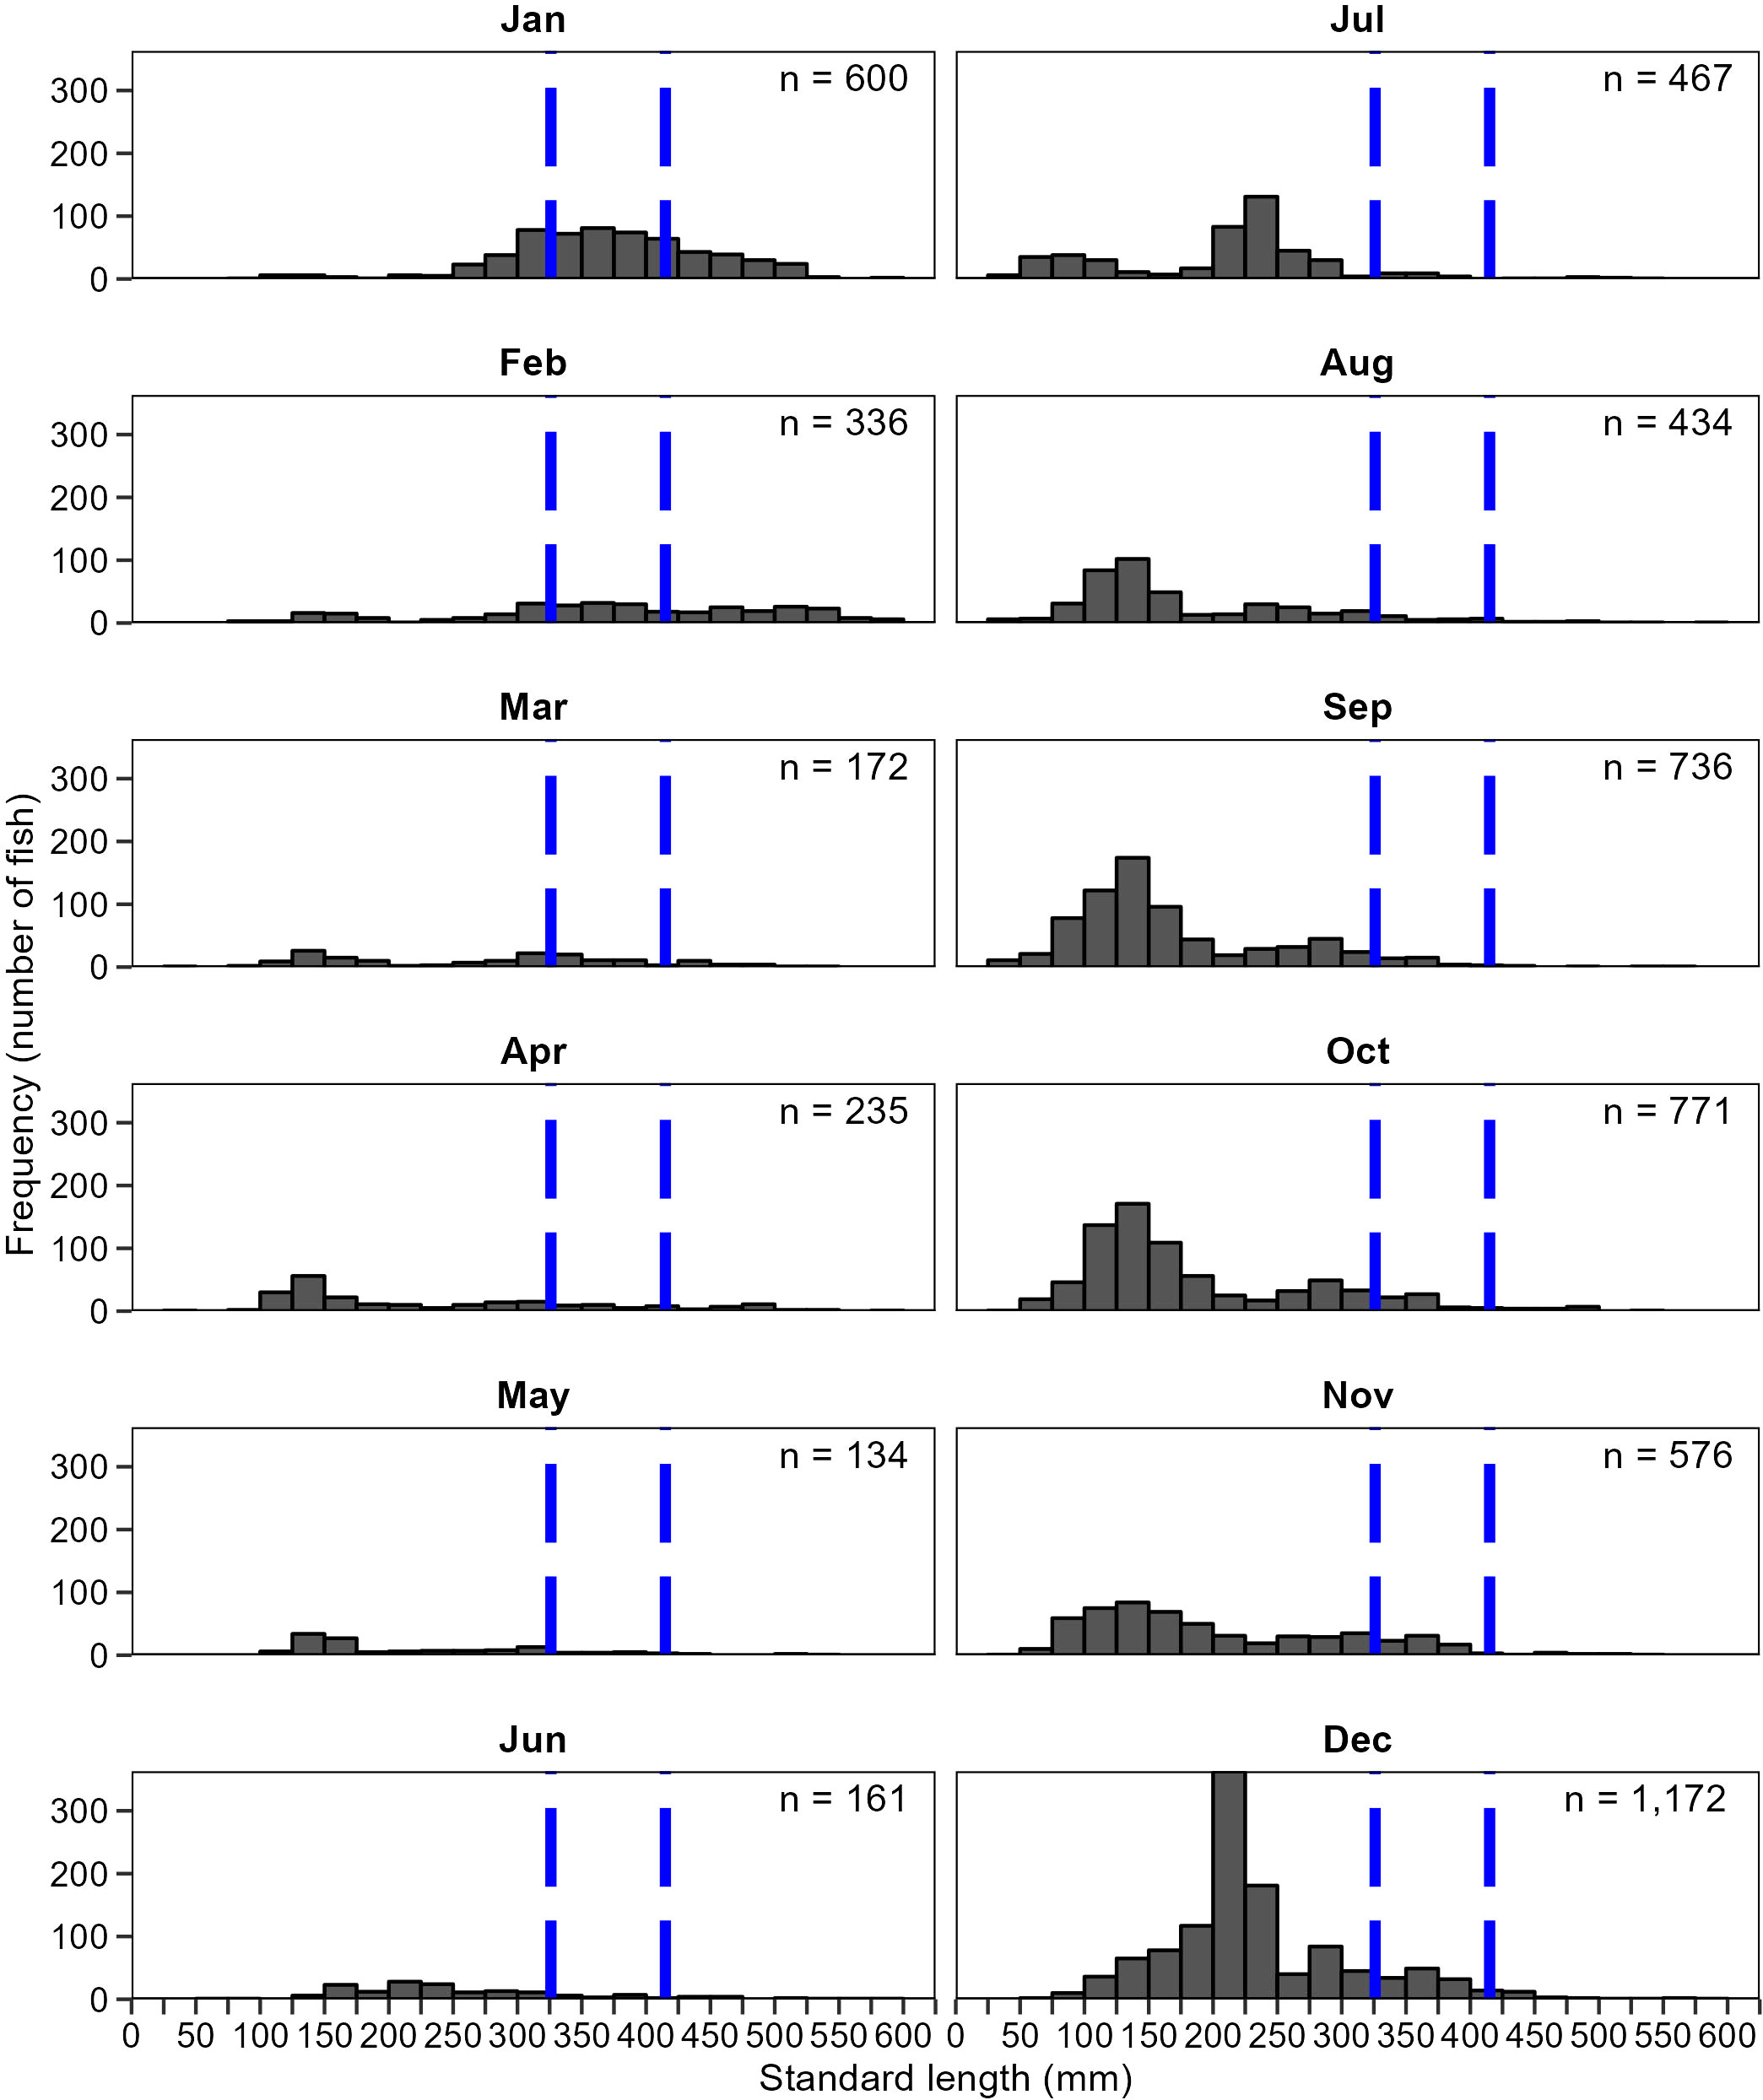
Figure 11 Size distribution of spotted seatrout, Cynoscion nebulosus, collected by month with 183-m haul seines, 2001–2019 in Apalachicola Bay. Fish to the left of the blue vertical bar are age-0 (<100 mm SL) and pre-fishery (100–326 mm SL). Fish between 326 mm and 415 mm SL are fish within the fishery, and fish larger than 415 mm SL are post-fishery fish. Age-0 and post-fishery spotted seatrout are not efficiently collected by this gear.
In June 2020, a seasonal survey with monthly sampling was initiated to provide spotted seatrout data for the newly created Western Panhandle region. Sampling in two estuaries (Choctawhatchee Bay and Santa Rosa Sound) would be combined with the WI survey in St. Andrew Bay to assess spotted seatrout in the region. Pensacola Bay, a Western Panhandle region estuary sampled during the reconnaissance survey, was not included in the survey design because funding was inadequate. The survey design used two gear types: 6.1-m otter trawls (all three estuaries) and 183-m haul seines (Choctawhatchee Bay and Santa Rosa Sound, only).
The 6.1-m otter trawl was chosen to sample young-of-the-year spotted seatrout, rather than the 21.3-m seine that is used in estuaries with standard long-term FIM surveys. The WI survey trawls collected the same size animals with similar monthly trends as the 21.3-m seine in Apalachicola Bay and these trends mirrored trends in other estuaries sampled by the FIM program (Kupschus, 2003), whereas the monthly abundances from the 21.3-m seine reconnaissance sampling in the Western Panhandle varied little between months (Figure 10). By using the WI survey with 6.1-m trawls, the St. Andrew Bay WI survey data immediately provided a 13-year (2008–2020) data set for spotted seatrout in this newly established region. Using the WI survey protocol in the Western Panhandle had the additional benefit of extending the FIM program’s WI survey into two additional estuaries (Choctawhatchee Bay and Santa Rosa Sound). Although abundance of spotted seatrout from trawls in June and November was less than that from trawls from July through October, those months were retained to ensure full comparability with WI surveys, which sample from June through November, in other estuaries.
The need to initiate a 183-m haul seine survey in the Western Panhandle region (Choctawhatchee Bay and Santa Rosa Sound) was identified as soon as the new management region was designated. The 183-m haul seine is the only standard FIM gear type that addresses two critical size classes of spotted seatrout (pre-fishery and fishery). Spotted seatrout catch data from Apalachicola Bay were used to establish the sampling period, June–December (Figure 12). The almost complete overlap in months with the 6.1-m otter trawl survey was economically fortuitous. Sampling with two gear types during fewer multiday events is less expensive than conducting more single-gear-type multiday events.
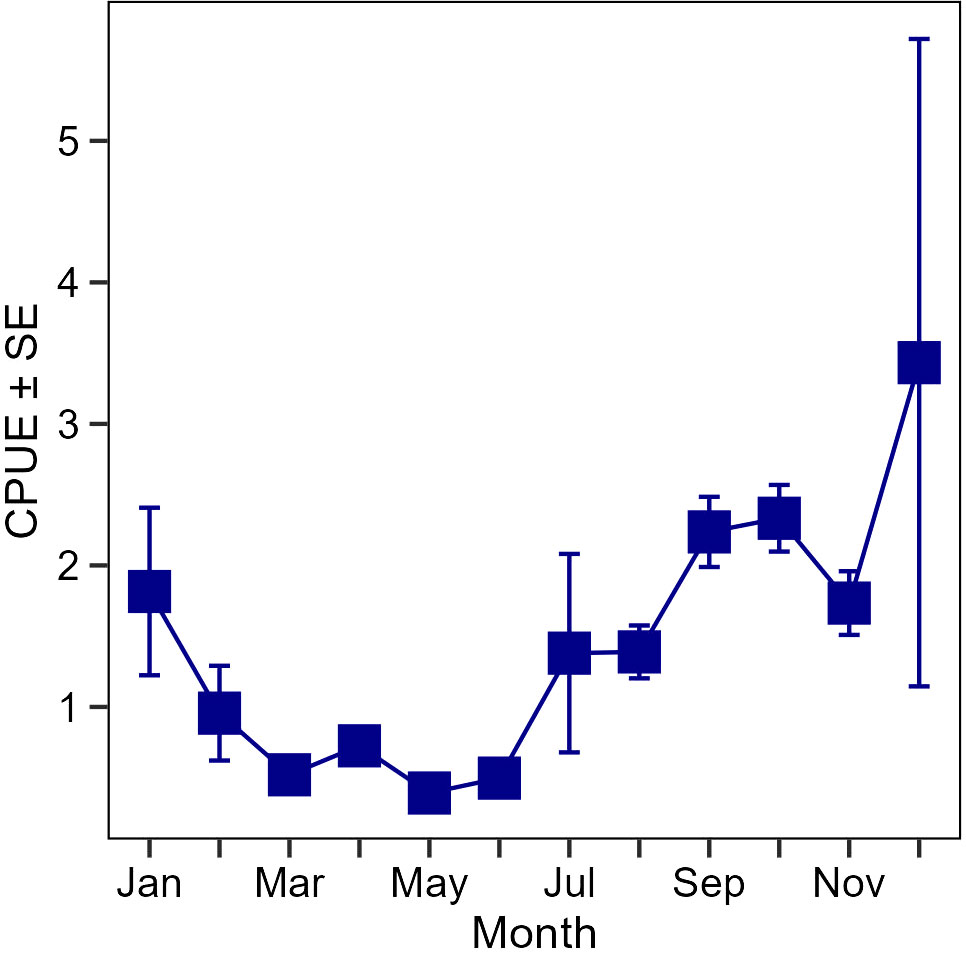
Figure 12 Monthly mean catch-per-unit-effort (CPUE; number of fish per haul) ± SE for all sizes of spotted seatrout, Cynoscion nebulosus, collected in Apalachicola Bay, 2001–2019, by the FIM program’s long-term 183-m haul seine survey.
All gear deployments in the Western Panhandle region follow standard FIM sampling protocols and all fish and selected invertebrate species captured are identified to the lowest possible taxonomic level, counted, and a random sample of at least 10 individuals is measured. Although the data for this region are not year-round as for the estuaries that have been monitored long-term, following the same sampling protocol allows comparisons of data for estuaries in the region and statewide for months sampled by all surveys (June–November). This ensures that the data are available and appropriate for assessment of other taxa and for ecosystem management-type assessments.
This case study represents a situation in which the FIM program was able to implement a monitoring survey in unsampled estuaries to provide timely and accurate data for state fisheries managers after an existing management region was split into two. The location of the split created a new region (Western Panhandle) without long-term fishery survey data. Although the establishment of a full FIM survey in the Western Panhandle region would have been preferred, adequate funding to initiate a full survey was not available or appropriated. Funding to provide the necessary data had to be reallocated from a federal Sportfish Restoration grant that had a slight surplus in 2020 ($150k). Continued funding was maintained by trimming other surveys; slight reductions were made to the juvenile snook survey (case study 1) and the standard FIM trawling survey (not case study 2, WI) was reduced by half. Standard FIM trawls mostly collect data on ecologically important taxa although some loss of data on managed species (especially blue crab, Callinectes sapidus and pink shrimp, Farfantepenaeus duorarum) occurred. The available funds, about 33% of what it currently costs to maintain a FIM field laboratory, shaped the final survey design, limiting it to seasonal sampling with just two of the three standard FIM program sampling gear types. By retaining trawls rather than one type of seine in the Western Panhandle, the FIM program was able to increase the geographic scope of data available for assessing juvenile reef fish (case study 2). And despite funding limitations, the survey immediately provided data for management of spotted seatrout in the Western Panhandle. The Western Panhandle management zone was specific to spotted seatrout; adequate data on other managed species (e.g., red drum and sheepshead, Archosargus probatocephalus) and ecologically important species, that would have been provided by a full FIM survey, were not necessary from this zone at the time. As Florida’s fishery managers continue to consider management zone changes for various species, however, re-evaluation of the adequacy of the FIM program survey design within management geographic boundaries and fiscal stagnation is an ongoing challenge and necessity. The cost to establish even this limited sampling survey in the Western Panhandle region would have far exceeded the available funding without leveraging the resources from an established long-term FIM program in an adjacent estuary, Apalachicola Bay.
The FIM program had data to develop a survey design for the Western Panhandle: reconnaissance data from this region, long-term traditional FIM data from Apalachicola Bay (an estuary immediately east of the Western Panhandle), and 13 years of WI survey data from an estuary within the new region. Without these data, at least a year of reconnaissance would have been necessary for developing a survey design and four years would have been necessary before enough data would have been available to incorporate into the state stock assessment for spotted seatrout. The 183-m haul seine would have been included in the new survey whether data had been available or not; the necessary pre-fishery and fishery data could only have been obtained with the 183-m haul seine. Having long-term data available for the haul seine from an adjacent estuary was beneficial in cost-effectively determining when sampling was done. The selection of the 6.1-m otter trawl with the WI survey design to collect young-of-the-year spotted seatrout was not an obvious choice, as this gear type has not been used to assess spotted seatrout in any other FIM program estuary. After data had been analyzed and the alternatives discussed with the FWC stock assessment analysts, it was determined that the trawl was the best alternative. Maintaining standard FIM protocols in the survey for this new region further ensures the utility of these data in assessing stock of other species, comparisons among estuaries, and ecosystem management analyses. The data being developed by this survey meet the needs for spotted seatrout stock assessment in this region. The Western Panhandle sampling design, which lacked a full suite of FIM gear types and called for only limited seasonal sampling, addressed only some of the fishery data needs for this region. The design and implementation of the Western Panhandle survey relied on analysis of previously collected data and the geographically dispersed laboratories of the long-term FIM program, without which adapting FIM surveys to address this critical state management need would have been much more difficult and time-consuming. It is hoped that at some point, a full, traditional FIM survey can be established in the Western Panhandle region to support management of additional species.
The three case studies discussed herein document only a handful of the changes the FIM program has had to implement to its long-term monitoring survey design in response to emerging management needs and funding fluctuations. In the first case study, the FIM program was able to provide improved data (abundance estimates and age-length keys) on juvenile snook for the state stock assessments by modifying its existing long-term monitoring survey to include areas and habitats historically under sampled in the long-term monitoring survey. The complementary WI survey in the second case study improved available data and statistical power to detect changes in abundance of juvenile reef fish species to inform management and expanded FIM ecosystem sampling into areas and habitats not previously addressed by the program. The third case study showcased how the FIM program was able to quickly adapt to develop and implement an appropriate survey design to address data limitations caused by the creation of a new management region for spotted seatrout. In each case, the FIM program had to revisit sampling design to adjust for realities of funding. Using the data already collected by the FIM program, the program was able to adapt existing monitoring plans, rather than initiate entirely new surveys, to maximize effectiveness and efficiency. All survey modifications were essential to address management needs and each modification considered the balance between monitoring costs and meeting the programmatic mission (Caughlan and Oakley, 2001; Strayer and Smith, 2003), to provide timely data and analysis for fisheries management for the conservation and protection of Florida’s fisheries. The FIM program will continue to capitalize on its flexibility to address changing management needs in the future (e.g., snook, spotted seatrout).
Although dedicated surveys may often be the most effective approach for addressing emerging data needs for a particular species, the FIM program has generally focused on implementing design modifications into the existing long-term survey design as opposed to creating new surveys. For example, rather than creating independent surveys for juvenile snook or spotted seatrout, the FIM program leveraged the existing dispersed geographical model with field laboratories throughout the state to inform survey designs and implement enhancements to the long-term monitoring survey (e.g., additional areas, habitats, seasonal survey effort). Although species-specific surveys could have been implemented, enhancing the existing multispecies long-term monitoring survey to incorporate habitats and areas important to the species of interest better addressed the statewide FIM program mission. Multispecies surveys are also beneficial because they are more cost-effective for long-term monitoring programs and provide data for species that may not currently be assessed, but eventually may be (e.g., Gulf flounder, Paralichthys albigutta; sheepshead). Cost-effectiveness though, needs to be balanced with the collection of statistically powerful data (Nieman et al., 2021). Managers and decision makers need to be able to reliably understand fluctuations in species abundance over time (Wauchope et al., 2019) and depending on the species, decades of data may be needed to reliably detect trends in abundance (White, 2019). The FIM program has considered this as well when implementing survey design changes, as evident by the statistical power simulations conducted for the WI survey prior to amending the design in 2019. Furthermore, all modified and new designs follow statewide standardized procedures to collect biological and environmental data to produce an ecological dataset that is comparable among estuaries.
Shortfalls in funding will always restrict the scope of a long-term monitoring program. To address funding issues, the FIM program has frequently had to consider reducing staff, closing field labs, and sample reductions. Admittedly, a large portion of the FIM program budget is dedicated to data collection and design optimization, and staff workloads are ever-expanding as data collection increases. Throughout the program’s history, it has had to critically evaluate processes to streamline data collection and improve data management, reporting, and analyses. Proactively recognizing and budgeting for these needs in the future will help the FIM program better consider all costs, beyond data collection, associated with long-term ecological monitoring (Caughlan and Oakley, 2001).
The FIM program has a strong (up to 50% of the budget) reliance on grant funding to conduct long-term fishery independent monitoring and produce robust ecological datasets. The program has been fortunate to apply for and receive grant funding to implement new or complementary surveys to address emerging needs and specific questions that cannot be directly addressed through the long-term monitoring survey design. Although these grants represent a temporary increase in funding, they also create the need for additional balancing. Before funding is received there is an additional workload required for researching various funding opportunities and writing proposals within the bounds of the research foci. In response to the grant award, a long-term monitoring program needs to address specific questions and provide specific deliverables for grant requirements, within the context of the broader program. Furthermore, additional grants do not always equate to additional staff, so the program must further maximize efficiency, while also managing what can be widely fluctuating budgeting as awards start and end. A dependence upon grant funding also creates a challenge as grants frequently require additional data (e.g., GIS shapefiles/layers, video camera data, acoustic data) and analyses (e.g., multi-metric indices) be incorporated into the existing database and workflow. A final consideration with grant funding is that when the funding ends, the program may be faced with evaluating and modifying survey designs to maintain critical data needed for fishery management decisions despite a reduction in funding.
Since the FIM program’s inception, it has had to balance any changes in the long-term survey design with maintaining critical long-term time series, addressing management needs, funding, and staff changes. For all three case studies highlighted here, as well as other programmatic amendments over the years, the FIM program has learned to improvise to meet changing needs but also to make sure that data resulting from sampling reductions, modifications, and expansions, are compatible to other aspects of FIM sampling throughout Florida. This consistency among data is critical to maintaining long-term time series and allowing for statewide data comparisons. Before a survey is modified, programs should review the knowledge on the species and ecosystems of interest, summarize and analyze data from earlier surveys, leverage data from adjacent systems as best as possible, conduct reconnaissance trips with various gear configurations to inform design and gear selection, and test different gear types based on the previous work so that the data can be used to evaluate survey design. We suggest that survey changes examine multiple options to best determine which option provides the necessary data, minimizes any compromising of data quality, and ideally, provides ecosystem-level data rather than single-species data, so that program data will have broader application.
One key application of FIM data requiring careful consideration of long-term consistency is the generation of indices of relative abundance for stock assessment. A key assumption of fishery independent indices is that changes in relative abundance through time represent actual changes in the stock being assessed, and not changes in survey design; therefore, it is important to consider what analytical approaches can be applied to maintain long-term time series prior to considering change in survey design. There are various ways to account for or address changes in survey design, although the approaches used are likely to vary with the species of interest or the particular assessment models being fit. Most commonly, analysts account for changes in survey design through standardization techniques (e.g., generalized linear models, generalized additive models (e.g., Switzer et al., 2012; Bacheler et al., 2022) that can adjust for resultant changes while retaining the maximum amount of data possible. For example, if sample size is increased and samples are collected in a new geographic location, or spatial sampling zone, within an existing sampled estuary (e.g., Section 3: Juvenile common snook), the stock assessment model can account for the change by including zone as a factor in the model. Similarly, if additional samples are collected within an existing sampled zone, as opposed to a new zone, the increase in sample size refines the model by reducing variation in estimates. When sampling designs are changed to the point where previous data may not fully align with the new design, analysts may consider either truncating the time series or developing a split index. Alternately, one could censure the data to resolve potential temporal or spatial mismatch. For example, if a time series is reduced from monthly to bimonthly sampling, one could remove the months that are no longer sampled from the previous data to yield one continuous time series of commonly sampled months. It is also important to consider any potential changes to length composition data. For example, if sampling is no longer conducted during periods corresponding to peak juvenile recruitment, or gear modifications are implemented that alter the size selectivity of a particular sampling gear, the assessment model would need to be adjusted (e.g., Christiansen et al., 2022a). In each scenario, the fundamental action while using the data in subsequent analyses is exploration of the data to determine how to account for changes in survey design. Ideally, there is also an open dialogue between those collecting the data and those using the data in various analyses, like the FIM program and the stock assessment analysts, so that they can work collaboratively to address survey design changes. To that end, the FIM program has invested significant effort in examining available data to make decisions that keep the long-term data as consistent and comparable as possible.
Key factors in the success of the statewide FIM program and its ability to adapt to funding shifts and management decisions are 1) its mission-focused programmatic goals, 2) geographically dispersed laboratories, 3) standardized protocols, 4) ongoing critical analysis of the data, 5) grant award success, and 6) high-level data management. The mission and objectives established for the program 30 years ago allow survey design changes to be considered within the realm of the programmatic mission. The geographically dispersed laboratories throughout the state ensure that standardized survey data exist for sites near a new area or for any new management-critical species. It also allows the FIM program to easily conduct reconnaissance sampling—and even long-term sampling—in estuaries adjacent to long-term survey sites at a fraction of the cost of establishing a full survey in such an estuary. The standardized sampling protocols ensure that sampling completed anywhere in the state can be readily implemented in a new estuary and that the data allow comparison between regions. Ongoing analysis of data provides insights that help identify deficiencies in stock assessments and survey design modifications that address management needs. The FIM program’s ability to achieve success in its grant proposals has been instrumental for pilot studies, field reconnaissance, and implementation of survey design modifications. Finally, high-level data management is critical to the FIM program’s success in ensuring that the data are available for analyses and other uses. Ultimately, these key characteristics of the FIM program have made possible successful data sharing, products, and publications (www.myfwc.com/research/saltwater/fim/), which are vital to the program’s grant award success.
Often, the greatest expenses in the budget of a monitoring program are related to data collection, so it is not surprising that the first considerations of monitoring costs focused on optimizing sampling design (Caughlan and Oakley, 2001). But the focus on data collection and design optimization often leads to the neglect of other critical aspects, such as training, quality assurance, reporting, scientific oversight, and, fundamentally, data management (Caughlan and Oakley, 2001). Data management is fundamental to any long-term monitoring program (Burns et al., 2018), especially since one characteristic of long-term monitoring programs is the continued collection and availability of consistent data over time. Ensuring that data are available for analysis requires use of detailed and comprehensive procedures to manage the data (Fancy and Bennetts, 2012). Data management must be one of the critical components of a long-term monitoring program’s budget (Caughlan and Oakley, 2001). For example, successful long-term monitoring programs for U.S. national parks use 25–30% of the monitoring budget for data management, assessment, and reporting (Graber et al., 1993; Mulder et al., 1999). A practical way to budget for data management and integrate it into long-term ecological monitoring programs is to adopt standard and comprehensive procedures for data management (Sutter et al., 2015), including metadata, database design overview, data verification and editing procedures, archival procedures, data summaries, reporting schedules and formats, and describing potential analyses (Oakley et al., 2003). The three survey design modifications highlighted herein could be folded into the FIM database structure with only minor changes to the database back-end and front-end because the database was designed to be structured, yet flexible. Collection under FIM data and survey protocols ensured that data were readily available for analyses for stock assessments and fishery managers. This is not always the case, however, as grant awards often collect streams of data (e.g., acoustic tags) that are new to the FIM database, something that must be accounted for in budgeting. Another component of data management that is key to data integrity, accessibility, and use of data is clearly assigned roles for database management and front-end software development (Oakley et al., 2003; Sutter et al., 2015). Though the FIM program does not have a dedicated database manager, it has maintained long-term database needs through scientific staff with this skill set. For the long term, however, this is inadequate. High-level data management is essential to continued accessibility of FIM data and data products for fishery management analyses, ecosystem analyses, and program changes, such as the three case studies presented here. And the FIM program is still growing, and database management is an increasingly critical program area that needs to be directly budgeted in future grant proposals (~25%).
MS, GO, and TS originally discussed and planned the review, which was further developed in collaboration with TM, RP, BW, DB, and DG. MS, TM, RP, BW, DB, and DG wrote the manuscript. GO designed and formatted the maps and MS formatted the figures. All authors were involved in at least one of the three case studies and contributed to manuscript text, figures, and revisions. All authors contributed to the article and approved the submitted version.
This research was supported by funding from the State of Florida saltwater recreational fishing licenses and snook permits, from the U.S. Department of Commerce, National Oceanic and Atmospheric Administration, National Marine Fisheries Service (grant numbers NA08NMF4720645 and NA09NMF4330152), by funding from the U.S. Department of the Interior, U.S. Fish and Wildlife Service, Federal Aid for Sportfish Restoration (grant numbers F14AF00328, F15AF01222, F16AF00898, F17AF00932, F18AF00281, F18AF00665, F19AF00105, F19AF00210, and F20AF00167), and by funding from the National Fish and Wildlife Foundation Gulf Environmental Benefit Fund (grants numbers FL 40624, FL 45766, FL 50347, FL 54269, and FL 58101).
We thank the staff of the Florida Fish and Wildlife Conservation Commission’s Fish and Wildlife Research Institute’s Fisheries Independent Monitoring (FIM) program for their continued dedication to field sampling and data collection. A special thanks to R.H. McMichael Jr. for having the vision for and dedication to the development of the FIM program; this rigorous statewide program would not have been possible without him.
The authors declare that the research was conducted in the absence of any commercial or financial relationships that could be construed as a potential conflict of interest.
All claims expressed in this article are solely those of the authors and do not necessarily represent those of their affiliated organizations, or those of the publisher, the editors and the reviewers. Any product that may be evaluated in this article, or claim that may be made by its manufacturer, is not guaranteed or endorsed by the publisher.
The statements, findings, views, conclusions, and recommendations contained in this document are those of the authors and do not necessarily reflect the views of the U.S. Department of the Interior or the U.S. Department of Commerce and should not be interpreted as representing the opinions or policies of the U.S. government. Mention of trade names or commercial products does not constitute their endorsement by the U.S. government.
Adams D. H., Tremain D. M., Paperno R., Sonne C. (2019). Florida lagoon at risk of ecosystem collapse. Science 365, 991–992. doi: 10.1126/science.aaz0175
Addis D. S., Allen S., Herdter E., Mahmoudi B., Muller R. G., Munyandorero J., et al. (2017). Florida’s inshore and nearshore species: 2017 status and trends report. In House Report 2017-005. (St. Petersburg, FL: Florida Fish and Wildlife Conservation Commission, Fish and Wildlife Research Institute).
Bacheler N. M., Gregalis K. C., Gillum Z. D., Pickett E. P., Schobernd C. M., Schoebernd Z. H., et al. (2022). Using stationary video data to infer relative abundance and distribution of four Seriola species along the southeast United States Atlantic coast. Fish. Res. 249, 106238. doi: 10.1016/j.fishres.2022.106238
Brame A. B., McIvor C. C., Peebles E. B., Hollander D. J. (2014). Site fidelity and condition metrics suggest sequential habitat use by juvenile common snook. Mar. Ecol. Prog. Ser. 509, 255–269. doi: 10.3354/meps10902
Brown-Peterson N. J., Thomas P. (1988). Differing reproductive life histories between temperate and subtropical groups of Cynoscion nebulosus. Cont. Mar. Sci. 30, 71–78.
Bryan M. D., McCarthy K. (2015). Standardized catch rates for red grouper from the United States Gulf of Mexico vertical line and longline fisheries. SEDAR42-AW-02. SouthEast Data, Assessment, and Review (North Charleston, South Carolina: SouthEast Data, Assessment, and Review).
Burns E. L., Tennant P., Dickman C. R., Gillespie G., Green P. T., Hoffmann A., et al. (2018). Making monitoring work: Insights and lessons from Australia’s long term ecological research network. Austral. Zool. 39, 755–768. doi: 10.7882/AZ.2018.030
Casey J. P., Poulakis G. R., Stevens P. W. (2007). Habitat use by juvenile Gag, Mycteroperca microlepis (Pisces: Serranidae), in subtropical Charlotte Harbor, Florida (USA). Gulf Carib. Res. 19, 1–9. doi: 10.18785/gcr.1901.01
Caughlan L., Oakley K. L. (2001). Cost considerations for long-term ecological monitoring. Ecol. Ind. 1, 123–134. doi: 10.1016/S1470-160X(01)00015-2
Christiansen H. M., Solomon J. J., Switzer T. S., Brodie R. B. (2022a). Assessing the size selectivity of capture gears for reef fishes using paired stereo-bated remote underwater video. Fish. Res. 249, 106234. doi: 10.1016/j.fishres.2022.106234
Christiansen H. M., Tyler-Jedlund A. J., Switzer T. S., Keenan S. F., Stahl S. D. (2022b). Potential implications of excluding live-bottom habitat from a bottom-trawl survey in the eastern Gulf of Mexico. N. Am. J. Fish. Man. 42, 893–905. doi: 10.1002/nafm.10775
Coull B. C. (1985). The use of long-term biological data to generate testable hypotheses. Estuaries 8, 84–92. doi: 10.2307/1351859
De Angelo J. A., Stevens P. W., Blewett D. A., Switzer T. S. (2014). Fish assemblages of shoal-and shoreline-associated seagrass beds in eastern Gulf of Mexico estuaries. Trans. Am. Fish. Soc 143, 1037–1048. doi: 10.1080/00028487.2014.911209
Fancy S. G., Bennetts R. E. (2012). “Institutionalizing an effective long-term monitoring program in the US National Park Service,” in Design and analysis of long-term ecological monitoring studies. Eds. Gitzen R. A., Millspaugh J. J., Cooper A. B., Licht D. S. (Cambridge, MA, USA: Cambridge University Press), 481–497.
Flaherty-Walia K. E., Switzer T. S., Winner B. L., Tyler-Jedlund J. A., Keenan S. F. (2015). Improved ability to characterize recruitment of gray snapper in three Florida estuaries along the Gulf of Mexico through targeted sampling of polyhaline seagrass beds. Trans. Am. Fish. Soc 144, 911–926. doi: 10.1080/00028487.2015.1054516
Gillanders B. M., Able K. W., Brown J. A., Eggleston D. B., Sheridan P. F. (2003). Evidence of connectivity between juvenile and adult habitats for mobile marine fauna: an important component of nurseries. Mar. Ecol. Prog. Ser. 247, 281–295. doi: 10.3354/meps247281
Gilmore R. G., Donahoe C. J., Cooke D. W. (1983). Observations on the distribution and biology of the common snook, Centropomus undecimalis (Bloch). Fla. Sci. 46, 313–336. Available at: https://www.jstor.org/stable/24320342.
Goodyear C. P. (1985). Relationship between reported commercial landings and abundance of young striped bass in Chesapeake Bay, Maryland. Trans. Am. Fish. Soc 114, 92–96. doi: 10.1577/1548-8659(1985)114<92:RBRCLA>2.0.CO;2
Graber D. M., Haultain S. A., Fessenden J. E. (1993). “Conducting a biological survey: a case study from Sequoia and Kings Canyon national parks,” in Proceedings of the Fourth Conference on Research in California’s National Parks, vol. 9 . Eds. Veirs S. D. Jr., Stohlgren T. J., Schonewald-Cox C. (Orick, California: U.S. Department of the Interior National Park Service Transactions and Proceedings Series), 17–35.
Hansen J. A., Carpenter S. R., Gaeta J. W., Hennessy J. M., Vander Zander M. J. (2015). Predicting walleye recruitment as a tool for prioritizing management actions. Can. J. Fish. Aquat. Sci. 72, 661–672. doi: 10.1139/cjfas-2014-0513
Keenan S., Switzer T., Knapp A., Weather E., Davis J. (2022). Spatial dynamics of the quantity and diversity of natural and artificial hard bottom habitats in the eastern Gulf of Mexico. Cont. Shelf Res. 233, 104633. doi: 10.1016/jcsr.2021.104633
Koenig C. C., Coleman F. C. (1998). Absolute abundance and survival of juvenile gags in sea grass beds of the northeastern Gulf of Mexico. Trans. Am. Fish. Soc 127, 44–55. doi: 10.1577/1548-8659(1998)127<0044:AAASOJ>2.0.CO;2
Kupschus S. (2003). Development and evaluation of statistical habitat suitability models: an example based on juvenile spotted seatrout. Cynoscion nebulosus. Mar. Ecol. Prog. Ser. 265, 197–212. doi: 10.3354/meps265197
Lefcheck J. S., Hughes B. B., Johnson A. J., Pfirrmann B. W., Rasher D. B., Smyth A. R., et al. (2019). Are coastal habitats important nurseries? A meta-analysis. Conserv. Lett. 12 (4), e12645. doi: 10.1111/conl.12645
Marshall A. R. (1958). A survey of the snook fishery of Florida, with studies of the biology of the principal species, Centropomus undecimalis (Bloch) (Miami, FL, USA: Florida State Board of Conservation, Marine Research Laboratory). Technical Series no. 22.
Matheson R. E. Jr., Flaherty-Walia K. E., Switzer T. S., McMichael R. H. Jr (2017). The importance of time of day in structuring demersal ichthyofaunal assemblages on the West Florida Shelf. Bull. Mar. Sci. 93 (2), 407–437. doi: 10.5343/bms.2016.1047
McMichael R. H. Jr., Peters K. M., Parsons G. R. (1989). Early life history of the snook, Centropomus undecimalis, in Tampa Bay, Florida. N.E. Gulf Sci. 10, 113–125. doi: 10.18785/negs.1002.05
Mulder B. S., Noon B. R., Spies T. A., Raphael M. G., Palmer C. J., Olsen A. R., et al. (1999). The strategy and design of the effectiveness monitoring program for the Northwest Forest Plan. PNW-GTR-437 (Portland, OR, USA: USDA Forest Service, Pacific Northwest Station).
Munyandorero J., Trotter A. A., Stevens P. W., Muller R. G. (2020). The 2020 stock assessment of common snook, Centropomus undecimalis. In House Report 2020-004 (St. Petersburg, FL, USA: Florida Fish and Wildlife Conservation Commission, Fish and Wildlife Research Institute), 147.
Murphy M. D., Chagaris D., Addis D. (2011). An assessment of the status of spotted seatrout in Florida waters through 2009. In-House Report 2011-002. (St. Petersburg, FL, USA: Florida Fish and Wildlife Conservation Commission, Fish and Wildlife Research Institute).
Myers R. A., Cadigan N. G. (1993). Is juvenile mortality in marine demersal fish variable? Can. J. Fish. Aq. Sci. 50, 1591–1598. doi: 10.1139/f93-180
Nagelkerken I., Kleijnen S., Klop T., van den Brand R. A. C. J., de la Morinière E. C., van der Velde G. (2001). Dependence of Caribbean reef fishes on mangroves and seagrass beds as nursery habitats: a comparison of fish faunas between bays with and without mangroves/seagrass beds. Mar. Ecol. Prog. Ser. 214, 225–235. doi: 10.3354/meps214225
Nagelkerken I., Roberts C. V., van der Velde G., Dorenbosch M., van Riel M. C., de la Morinière E. C., et al. (2002). How important are mangroves and seagrass beds for coral-reef fish? The nursery hypothesis tested on an island scale. Mar. Ecol. Prog. Ser. 244, 299–305. doi: 10.3354/meps244299
Nieman C. L., Pendleton R. M., Kenney G. H., Solomon C. T. (2021). Evaluation and optimization of a long-term fish monitoring program in the Hudson River. Ecol. Indicat. 133, 108344. doi: 10.1016/j.ecolind.2021.108344
Oakley K. L., Thomas L. P., Fancy S. G. (2003). Guidelines for long-term monitoring protocols. Wildl. Soc Bull. 31 (4), 1000–1003. Available at: https://www.jstor.org/stable/3784444.
Peters K. M., Matheson R. E. Jr., Taylor R. G. (1998). Reproduction and early life history of the common snook, Centropomus undecimalis (Bloch), in Florida. Bull. Mar. Sci. 62, 509–529.
Purtlebaugh C. H., Martin C. W., Allen M. S. (2020). Poleward expansion of common snook Centropomus undecimalis in the northeastern Gulf of Mexico and future research needs. PloS One 15 (6), e0234083. doi: 10.1371/journal.pone.0234083
Rivas L. R. (1986). Systematic review of the perciform fishes of the genus Centropomus. Copeia 1986 (3), 579–611. doi: 10.2307/1444940
Schrandt M. N., MacDonald T. C. (2020). Long-term stability of the faunal community of a subtropical estuary: evaluating disturbances in the context of interannual variability. Estuaries Coasts 43, 347–359. doi: 10.1007/s12237-019-00684-1
Schrandt M. N., MacDonald T. C., Sherwood E. T., Beck M. W. (2021a). A multimetric nekton index for monitoring, managing and communicating ecosystem health status in an urbanized Gulf of Mexico estuary. Ecol. Ind. 123, 1–10. doi: 10.1016/j.ecolind.2020.107310
Schrandt M. N., Shea C. P., Kurth B. N., Switzer T. S. (2021b). Amending survey design to improve statistical inferences: monitoring recruitment of juvenile reef fish in the eastern Gulf of Mexico. Fish. Res. 241, 106015. doi: 10.1016/j.fishres.2021.106015
Schrandt M. N., Switzer T. S., Stafford C. J., Flaherty-Walia K. E., Paperno R., Matheson R. E. Jr. (2018). Similar habitats, different communities: fish and large invertebrate assemblages in eastern Gulf of Mexico polyhaline seagrasses relate more to estuary morphology than latitude. Estuar. Coast. Shelf. Sci. 213, 217–229. doi: 10.1016/j.ecss.2018.08.022
SEDAR (SouthEast Data, Assessment, and Review) (2018). SEDAR 51 – Gulf of Mexico gray snapper stock assessment report (North Charleston, SC, USA: SEDAR).
Seyoum S., McBride R. S., Tringali M. D., Villanova V. L., Puchutulegui C., Gray S., et al. (2018). Genetic population structure of the spotted seatrout (Cynoscion nebulosus): simultaneous examination of the mtDNA control region and microsatellite marker results. Bull. Mar. Sci. 94, 47–71. doi: 10.5343/bms.2017.1060
Smith M. W., Goethel D., Rios A., Isley J. (2015). Standardized catch rate indices for Gulf of Mexico gray triggerfish (Balistes capriscus) landed during 1993-2013 by the commercial handline fishery. SEDAR43-WP-05. SouthEast Data, Assessment, and Review (North Charleston, South Carolina).
Stevens P. W., Blewett D. A., Boucek R. E., Rehage J. S., Winner B. L., Young J. M., et al. (2016). Resilience of a tropical sport fish population to a severe cold event varies across five estuaries in southern Florida. Ecosphere 7 (8), e01400. doi: 10.1002/ecs2.1400
Stevens P. W., Paperno R., Beal J. L., MacDonald T. C., Miller H. N., Klarmann P. A., et al. (2022). Identification of fish habitat hotspots for use in prioritizing conservation and restoration projects in coastal rivers. Environ. Biol. Fishes 106, 221–235. doi: 10.1007/s10641-022-01226-8
Strayer D. L., Smith D. R. (2003). A guide to sampling freshwater mussel populations. Am. Fish. Soc Mon. 8, 1–103.
Sutter R. D., Wainscott S. B., Boetsch J. R., Palmer C. J., Rugg D. J. (2015). Practical guidance for integrating data management into long-term ecological monitoring projects. Wildl. Soc Bull. 39 (3), 451–463. doi: 10.1002/wsb.548
Switzer T. S., Keenan S. F., Stevens P. W., McMichael R. H. Jr., MacDonald T. C. (2015). Incorporating ecology into survey design: monitoring the recruitment of age-0 gags in the eastern Gulf of Mexico. N. Am. J. Fish. Man. 35, 1132–1143. doi: 10.1080/02755947.2015.1082517
Switzer T. S., Keenan S. F., Thompson K. A., Shea C. P., Knapp A. R., Campbell M. D., et al. (2023). Integrating assemblage structure and habitat mapping data into the design of a multispecies reef fish survey. Mar. Coast. Fish.: Dynam. Manage. Ecosys. Sci. 15 (4), e10245. doi: 10.1002/mcf2.10245
Switzer T. S., MacDonald T. C., McMichael R. H. Jr., Keenan S. F. (2012). Recruitment of juvenile gags in the eastern Gulf of Mexico and factors contributing to observed spatial and temporal patterns of estuarine occupancy. Trans. Am. Fish. Soc 141, 707–719. doi: 10.1080/00028487.2012.675913
Tabb D. C. (1966). The estuary as a habitat for spotted seatrout, Cynoscion nebulosus. Am. Fish. Soc Spec. Publ. 3, 58–67.
Taylor G. R., Wittington J. A., Grier H. J. (2000). Age growth, maturation and protandric sex reversal in the common snook Centropomus undecimalis, from the east and west coasts of South Florida. Fish. Bull. 98, 612–624.
Thompson K. A., Switzer T. S., Christman M. C., Keenan S. F., Gardner C. L., Overly K. E., et al. (2022). A novel habitat-based approach for combining indices of abundance from multiple fishery-independent video surveys. Fish. Res. 247, 106178. doi: 10.1016/j.fishres.2021.106178
Trotter A. A., Blewett D. A., Taylor R. G., Stevens P. W. (2012). Migrations of common snook from a tidal river with implications for skipped spawning. Trans. Am. Fish. Soc 141, 1016–1025. doi: 10.1080/00028487.2012.675903
Ultang O. (1977). Methods of measuring stock abundance other than by use of commercial catch and effort data (Rome: FAO). FAO Fisheries Technical Paper No. 176.
Wauchope H. S., Amano T., Sutherland W. J., Johnston A. (2019). When can we trust population trends? A method for quantifying the effects of sampling interval and duration. Methods Ecol. Evol. 10 (12), 2067–2078. doi: 10.1111/2041-210X.13302
White E. R. (2019). Minimum time required to detect population trends: the need for long-term monitoring programs. BioScience 69 (1), 40–46. doi: 10.1093/biosci/biy144
Wilson J. K., Stevens P. K., Blewett D. A., Boucek R., Adams A. J. (2022). A new approach to define an economically important fish as an umbrella flagship species to enhance collaborative stakeholder–management agency habitat conservation. Environ. Biol. Fishes 106 (2), 237–254. doi: 10.1007/s10641-022-01214-y
Winner B. L., Blewett D. A., McMichael R. H. Jr., Guenther C. B. (2010). Relative abundance and distribution of common snook along shoreline habitats of Florida estuaries. Trans. Am. Fish. Soc 139, 015079. doi: 10.1577/T08-215.1
Wolfe D. A., Champ M. A., Flemer D. A., Mearns A. J. (1987). Long-term biological data sets: their role in research, monitoring, and management of estuarine and coastal marine systems. Estuaries 10, 181–193. doi: 10.2307/1351847
Young J. M., Yeiser B. G., Whittington J. A. (2014). Spatiotemporal dynamics of spawning aggregations of common snook on the east coast of Florida. Mar. Ecol. Prog. Ser. 505, 227–240. doi: 10.3354/meps10774
Zieman J. C., Zieman R. T. (1989). The ecology of the seagrass meadows of the west coast of Florida: a community profile. US ( Department of the Interior, Fish and Wildlife Service, Research and Development) 85 (7).
zu Ermgassen P. S. E., DeAngelis B., Gair J. R., zu Ermgassen S., Baker R., Daniels A., et al. (2021). Estimating and applying fish and invertebrate density and production enhancement from seagrass, salt marsh edge, and oyster reef nursery habitats in the Gulf of Mexico. Estuaries Coasts 44, 1588–1603. doi: 10.1007/s12237-021-00935-0
Keywords: Centropomus undecimalis, Cynoscion nebulosus, data management, fishery management, funding limitations, long-term monitoring, sampling design
Citation: Schrandt MN, MacDonald TC, Winner BL, Blewett DA, Paperno R, Onorato GV, Gandy DA and Switzer TS (2024) Sampling design modifications to a fishery-independent monitoring survey balance the maintenance of long-term data with emerging management needs and funding limitations. Front. Mar. Sci. 10:1199076. doi: 10.3389/fmars.2023.1199076
Received: 02 April 2023; Accepted: 21 August 2023;
Published: 05 January 2024.
Edited by:
Kyle Shertzer, NOAA Southeast Fisheries Science Center, United StatesReviewed by:
Marcel Reichert, Retired, Charleston, SC, United StatesCopyright © 2024 Schrandt, MacDonald, Winner, Blewett, Paperno, Onorato, Gandy and Switzer. This is an open-access article distributed under the terms of the Creative Commons Attribution License (CC BY). The use, distribution or reproduction in other forums is permitted, provided the original author(s) and the copyright owner(s) are credited and that the original publication in this journal is cited, in accordance with accepted academic practice. No use, distribution or reproduction is permitted which does not comply with these terms.
*Correspondence: Meagan N. Schrandt, TWVhZ2FuLlNjaHJhbmR0QE15RldDLmNvbQ==
Disclaimer: All claims expressed in this article are solely those of the authors and do not necessarily represent those of their affiliated organizations, or those of the publisher, the editors and the reviewers. Any product that may be evaluated in this article or claim that may be made by its manufacturer is not guaranteed or endorsed by the publisher.
Research integrity at Frontiers
Learn more about the work of our research integrity team to safeguard the quality of each article we publish.