 Se-Yong Song
 Yoo-Jun Kim
 Eun-Joo Lee
 Sang-Wook Yeh
 Jae-Hun Park
 Young-Gyu Park
- 1Institute of Ocean and Atmospheric Sciences, Hanyang University, Ansan, Republic of Korea
- 2Atmosphere and Ocean Research Institute, The University of Tokyo, Kashiwa, Chiba, Japan
- 3Department of Ocean Sciences, Inha University, Incheon, Republic of Korea
- 4Department of Marine Sciences and Convergence Technology, Hanyang University, Ansan, Republic of Korea
- 5Ocean Circulation Research Center, Korea Institute of Ocean Science and Technology, Busan, Republic of Korea
The northwestern part of the East/Japan Sea (EJS) is a region with large sea surface temperature (SST) variability and is known as a hotspot of marine heatwaves (MHW) stress for marine environments that peaked in boreal winter (January-February-March). This could have profound impacts on the marine ecosystems over the EJS. Here, we used a set of high-resolution satellite and reanalysis products to systematically analyze the spatiotemporal SST variations and examine their linkage to a large-scale mode of climate variability, such as the Arctic Oscillation (AO). The results show that AO-related wind forcing modulates the SST variability over the EJS via the oceanic dynamic adjustment processes. In particular, the abnormally warm SSTs in the northwestern part of the EJS are driven by the anomalous anticyclonic eddy-like circulation and Ekman downwelling during a positive AO phase. This physical linkage between a positive AO and the abnormally warm SST could be conducive to MHW occurrences in the EJS as in the extremely positive AO event during the winter of 2020. These results have implications that the MHW occurrences in the EJS could be amplified by natural climate variability along with long-term SST warming.
1 Introduction
The East/Japan Sea (hereafter, EJS) is located in the northwestern Pacific and includes a semi-enclosed marginal sea surrounded by Korea, Japan, and Russia. The sea surface temperature (SST) variability in the EJS shows a wide range of temporal periods from interannual to interdecadal timescales (Park and Chung, 1999; Park, 2000; Kim et al., 2004; Minobe et al., 2004; Shimada and Kawamura, 2006; Yeh et al., 2010; Jeong et al., 2022). Indeed, there are several physical processes that affect the SST variability in the EJS including: local wind forcing (Minobe et al., 2004; Shimada and Kawamura, 2006), East Asian monsoon (Yeh et al., 2010; Jeong et al., 2022), and the Tsushima Warm Current (TWC) transport (Kim et al., 2004). In addition, it has been reported that the spatiotemporal variability of chlorophyll-a concentration and the fish catch in the EJS is closely associated with its SST variations (Park et al., 2020; Kim et al., 2022; Park et al., 2022). In spite of a wealth of studies, it is still valuable to examine the physical mechanisms that lead to the SST variability in the EJS.
Meanwhile, the wintertime SST variability in the EJS is associated with the Arctic Oscillation (hereafter, AO) (Park and Chu, 2006; Lee and Park, 2019). The AO is the most dominant mode of wintertime atmospheric circulation characterized by a meridional seesaw-like pattern in the sea level pressure (SLP) between the Arctic and the mid-latitude Northern Hemisphere along with a quasi-zonally symmetric structure (Thompson and Wallace, 1998). The AO index is typically defined as the first leading empirical orthogonal function (EOF) mode of SLP anomalies poleward of 20°N (Thompson and Wallace, 2000). The AO significantly influences surface temperature including climate extreme events such as cold surge (Thompson and Wallace, 1998; Gong et al., 2001; Jeong and Ho, 2005). Furthermore, AO could affect the SST variations in the EJS by altering the East Asian winter monsoon intensity via the modulation of the Siberian High (Park and Chu, 2006), but their physical mechanism still remains unclear (Wang et al., 2022).
MHWs refer to discrete prolonged extreme oceanic warm water events that persist for days to months and extend up to thousands of kilometers (Hobday et al., 2016; Oliver et al., 2020). Prominent MHW events have been observed around the EJS in the recent years (Choi et al., 2022; Lee et al., 2022; Wang et al., 2022). Because of a faster ocean surface warming rate than other ocean basins (Belkin, 2009; Wu et al., 2012), MHW events are projected to be more prolonged and have frequently occurred in East Asian Marginal Seas, including the EJS, since 1982 (Li et al., 2019; Yao et al., 2020). This results in serious threat to marine biodiversity (Oliver et al., 2019; Smale et al., 2019; Guo et al., 2022; Smith et al., 2022). Also, the EJS is a hotspot of MHW stress, which significantly influences the marine environment (Marin et al., 2021). Particularly, the MHW intensity in the northwestern part of the EJS peaked in winter (Wang et al., 2022). Given their potential ecological impacts, it is important to understand the physical mechanisms leading to the MHW event in the EJS to improve MHW predictability (Holbrook et al., 2020). This would provide guidance to regional decision-makers so they can strategize ways to adapt to MHW events (Holbrook et al., 2020; Jacox et al., 2022). Thus, this study aims to investigate the physical mechanisms linking the AO with the wintertime SST variation along with the MHW occurrence in the EJS.
This paper is organized as follows. The datasets and methods used in this study are introduced in Section 2. Section 3 describes an analysis of the impact of the AO on the wintertime SST variability and MHW occurrences in the EJS. A summary and discussion are provided in Section 4.
2 Data and methods
2.1 Datasets
The satellite-derived daily SST data were obtained using the National Oceanic and Atmospheric Administration (NOAA) Optimum Interpolation SST (OISST) version 2.1 software (Reynolds et al., 2007; Huang et al., 2021). This has significantly improved data quality due to corrected satellite SST biases (as compared to version 2) since January 1, 2016. This is a 0.25° x 0.25° SST product on a regular global grid based on Advanced Very High-Resolution Radiometer (AVHRR) infrared satellite data and in situ measurements (ship, buoy, and Argo float) with daily temporal coverage beginning in late 1981 to the present. Also, we utilized the daily SST data obtained from the Copernicus Marine Environmental Monitoring Service (CMEMS) based on the satellite data and in situ observations by the Operational Sea Surface Temperature and Sea Ice Analysis (OSTIA) (Donlon et al., 2012). We used the reprocessed OSTIA SST product with a horizontal resolution of 0.05° x 0.05° from 1982 to 2020. Unless stated otherwise, results described in this paper used the OSTIA dataset. Although the OISST products are widely used to investigate the SST and marine heatwave variations due to their high spatial resolution and long-term temporal coverage (Oliver et al., 2018; Holbrook et al., 2019; Jacox et al., 2022; Song et al., 2023), it may contains the SST bias due to high cloud coverage and data gaps over most offshore regions.
To delineate the role of the AO in the wintertime SST variation in the EJS, monthly oceanic and atmospheric reanalysis datasets are used as follows. The fifth generation of the European Centre for Medium-Range Weather Forecast (ECMWF) reanalysis produce datasets (ERA5), with a horizontal resolution of 0.25° x 0.25°, was used to analyze the atmospheric circulation and heat flux fields (Hersbach et al., 2020). The ocean reanalysis system 5 (ORAS5) dataset provided by the ECMWF ocean analysis-reanalysis system was used to investigate the ocean vertical structure and circulation patterns (Zuo et al., 2018). As the systematic production of ocean reanalysis, the ORAS5 is consistent with the ERA5 in that it uses the same SST records to constrain its surface boundary conditions (Hersbach et al., 2020). This may contribute to the physical consistency between the ORAS5 and ERA5 in which both are undertaken from ECMWF (Zuo et al., 2019). We estimated the wind stress curl from the ORAS5 wind stress data as follows:
where τ is the wind stress, and x and y are the east and north directions for longitude and latitude, respectively. Here, the anomalies were obtained by subtracting the climatology from 1982 to 2020 from the total field. Unless stated otherwise in the text, the results included a linear trend. To test the statistical significance, we use a two-tailed student t-test at a given confidence level.
2.2 Definition of the SST and AO indices
To quantify the SST variability in the EJS, we defined the SST index as the area-weighted average of SST over the northwestern part of the EJS (37°-42°N, 127.5°-134.5°E), referred to as the EJSSST index. As the grid cell area is proportional to the cosine of the latitude for a rectangular grid, we used the area-weighted average to calculate the EJSSST index as follows:
where SSTi is each grid SST value over the northwestern part of the EJS (37°-42°N, 127.5°-134.5°E), N is the number of grid pixel, and ai is the area at each grid pixel. We used the wintertime seasonal mean AO index calculated from the EOF analysis. Following the method in Thompson and Wallace (2000), we defined the wintertime (January-February-March, hereafter JFM) mean AO index as the first EOF principal component time series using the JFM mean SLP anomalies poleward of 20°N for the base period from 1982 to 2020. The leading EOF mode is characterized by a seesaw-like pattern, which is featured by the opposite atmospheric SLP anomalies between the Arctic and the mid-latitudes (Supplementary Figure 1). The positive (negative) AO years were defined as the cases when the JFM seasonal mean AO index is greater (less) than 0.8 (-0.8) standard deviations (Table 1). To further investigate the extreme AO event in the 2020 JFM on a daily time scale, we also used the daily AO index downloaded from NOAA Climate Prediction Center. It is important to note that the AO has the largest variability and has a pronounced impact on surface climate in the Northern Hemisphere extratropics during JFM (Thompson and Wallace, 2000). Furthermore, the AO and EJSSST indices have a statistically significant relationship during JFM (r = 0.58 where r is a simultaneous correlation coefficient with a linear trend), which is slightly larger than that during December-to-February (DJF) (i.e., r = 0.54). Therefore, we aim to investigate the role of the AO in the SST variation over the northwestern part of the EJS during JFM.
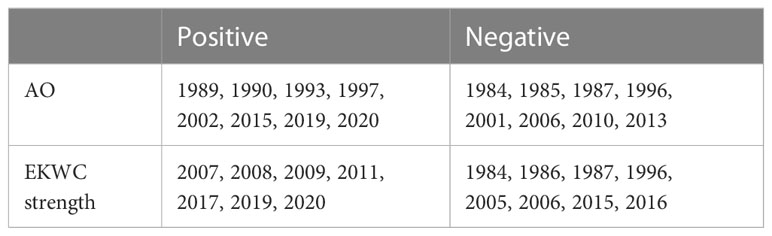
Table 1 Composite years for the AO and EKWC strength positive and negative events based on the threshold of 0.8 standard deviations from 1982 to 2020.
2.3 Definition of MHWs
MHW events are often defined when daily SST exceeds a seasonally varying climatological 90th percentile threshold for at least five consecutive days (Hobday et al., 2016). The climatological 90th percentile threshold was calculated from the daily SST within an 11-day window centered on each calendar day and then smoothed by a 31-day moving average. Based on this definition, we detect MHWs in satellite-derived SST daily datasets from the reprocessed OSTIA product for each grid point based on the climatological mean from 1982 to 2020. Consecutive events within two days apart are classified as the same MHW event. For each MHW event, we quantify its duration as the number of days from onset to end date. Then, we calculated the MHW days as the total number of MHW days for each JFM season from 1982 to 2020.
3 Results
3.1 Wintertime SST variability in the East/Japan Sea and AO
In boreal winter, the SST variation in the EJS is affected by the East Asian Winter Monsoon (EAWM). The EAWM is primarily driven by the thermal contrast between the cold Asian continent and the adjacent warm oceans (Wang, 2006). In the lower troposphere, the Siberian High and Aleutian Low induce the cold and dry northwesterly winds over the EJS (Figure 1A). The spatial pattern of the climatological (1982-2020) mean wintertime (JFM) SST shows a sharp meridional gradient along with the subpolar front at about 40°N in the EJS (Figure 1B).
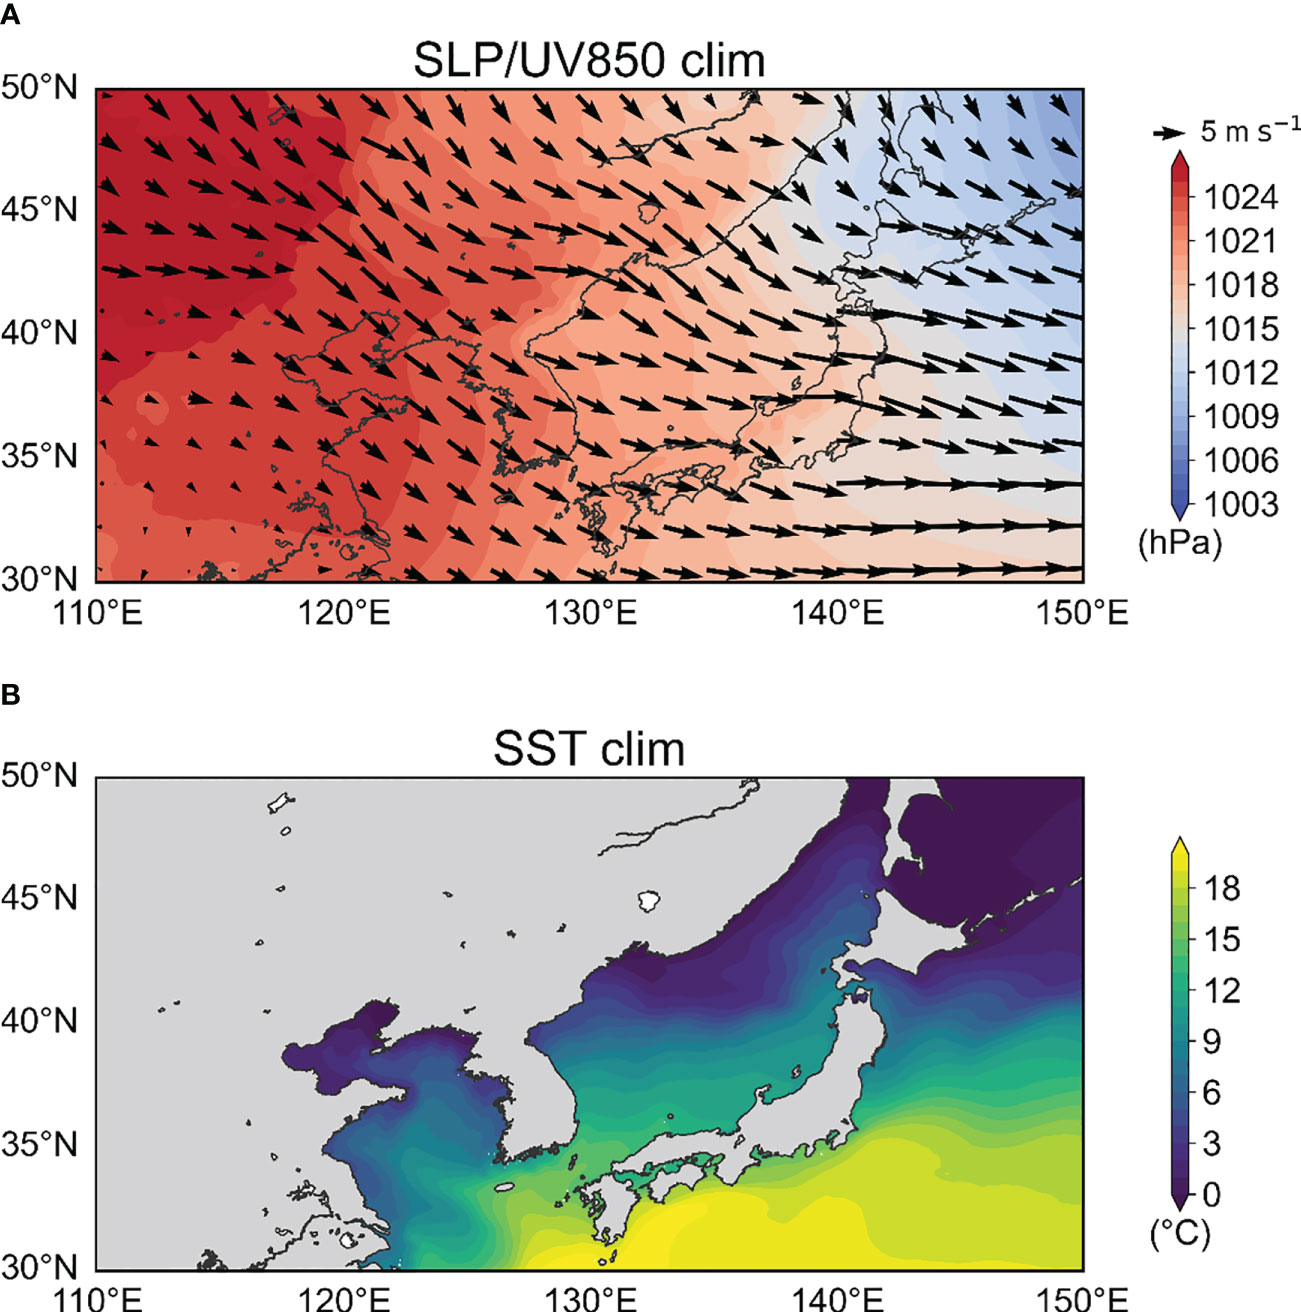
Figure 1 Climatological wintertime mean of the (A) sea level pressure (SLP) (shading, hPa) and 850-hPa wind (vector, m s-1), and (B) sea surface temperature (SST) (shading, °C).
Next, we investigated the temporal and spatial characteristics of the SST variability in the EJS. Figure 2A shows the spatial distribution of the wintertime SST standard deviation during JFM from 1982 to 2020. The maximum SST standard deviation above 1.5°C is located in the northwestern part of the EJS (Figure 2A), which is consistent with a previous study that analyzed a long-term (1891-2005) period of SST variation using three different SST datasets (Yeh et al., 2010). This is indicative of the robustness of the results independent of the analyzed period and datasets. The largest interannual SST variability around the East Korean Bay could be associated with the surface wind variability during boreal winter (Park and Chu, 2006). Since the MHW intensity is largely explained by the local SST variability (Oliver et al., 2018), the East Korean Bay exhibits a distinct seasonal variation of MHW intensity that peaked in boreal winter (Wang et al., 2022). In addition, the large SST standard deviation region around the East Korean Bay is known as a hotspot of MHW stress for marine environments (Marin et al., 2021).
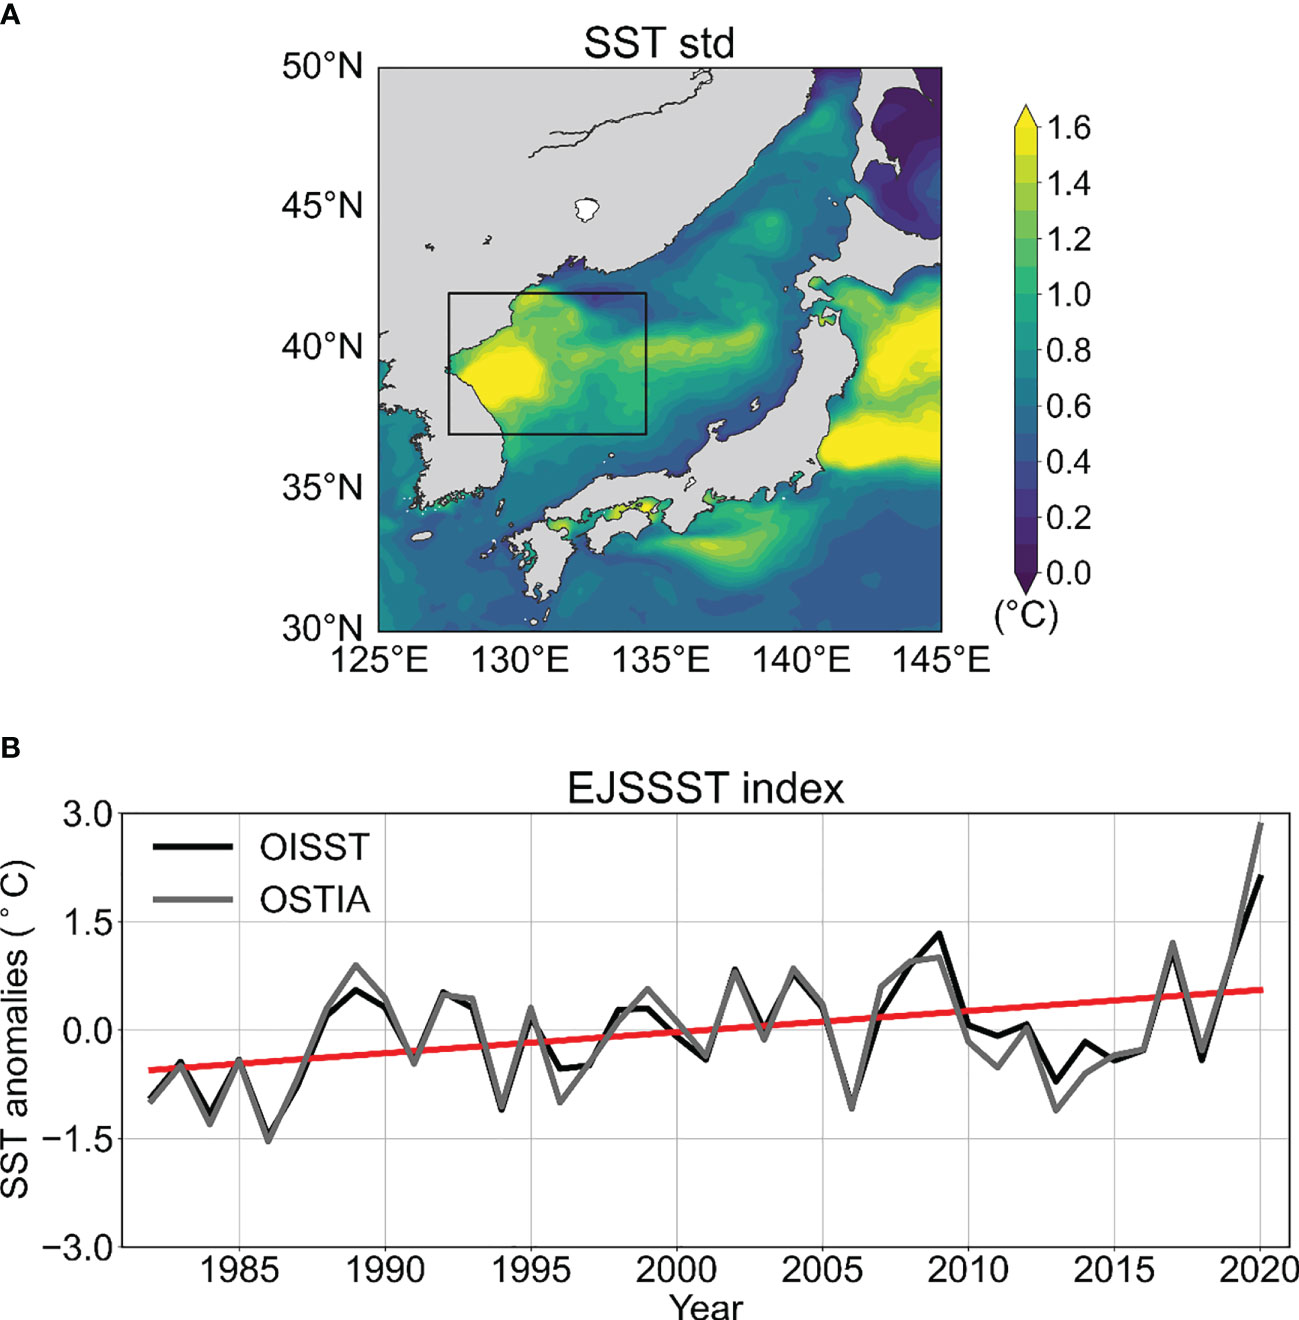
Figure 2 (A) Standard deviation map of the wintertime SST (°C). The black box indicates the northwestern part of the EJS (37°-42°N, 127.5°-134.5°E) to define the EJSSST index. (B) Time series of the EJSSST index obtained from the OISST (black line, °C) and OSTIA (grey line, °C) datasets from 1982 to 2020. The red line in (B) denotes the linear trend of EJSSST index obtained from the OSTIA dataset.
Then, we quantified the temporal variation of the EJSSST index estimated from the OISST and OSTIA datasets from 1982 to 2020, respectively (Figure 2B). While there is the mean SST bias of about 0.5 °C from the two different datasets as in 1996 and 2013, they show quite similar temporal variations with a simultaneous correlation coefficient of about 0.97. Note that the mean SST bias could be originated from the different sources of the data. The time series of the EJSSST index exhibited a large variability on interannual timescales and showed a long-term warming trend of about 0.29°C/decade, which was statistically significant at the 95% confidence interval (Figure 2B).
To investigate the relationship between the AO and the EJSSST variability, we first analyzed the regression map of SSTs during JFM with respect to the AO and EJSSST indices (Figures 3A, B). The spatial distributions of regressed SST fields are quite similar between the AO and EJSSST indices and are characterized by a positive SST anomaly centered in the northwestern part of the EJS and eastern side of Japan (Figures 3A, B). In addition, a significant positive correlation between the AO and EJSSST indices was observed during JFM for 1982-2020 (Figure 3C). This implies that the EJSSST tends to be anomalously warm (cold) during JFM with a positive (negative) phase of AO. The simultaneous correlation coefficient between the AO and EJSSST indices is 0.58 with a linear trend, which is statistically significant at the 99% confidence level. Note that the simultaneous correlation coefficient is even larger with the value of 0.59 when we removed the linear trend from the AO and EJSSST indices. It is important to note that the correlation does not imply causality, and the EJSSST variation could be affected by other physical processes including a local wind forcing, EAWM intensity, and the intensity of TWC transport. A statistical relationship indicates that the AO may be one of various physical factors to drive the EJSSST variation. Figures 4A, B display the composited SST anomalies (SSTAs) in the EJS with respect to either a positive or a negative AO index based on 0.8 (-0.8) standard deviations, respectively (Table 1). Similar to the results in Figure 3, the anomalous warm (cold) SSTs are prevalent in the northwestern part of the EJS during a positive (negative) AO phase (Figures 4A, B). The magnitudes of SSTAs are maximized around the East Korean Bay, where the large SST variability is observed during JFM (Figure 2A). Notably, the SST anomaly around the East Korean Bay is significant in the AO positive and negative phase, respectively, but the SST anomaly around the Japan coast is mostly significant in the AO negative phase (Figure 4). This result indicates that AO could be conducive to SST variations over the northwestern part of the EJS.
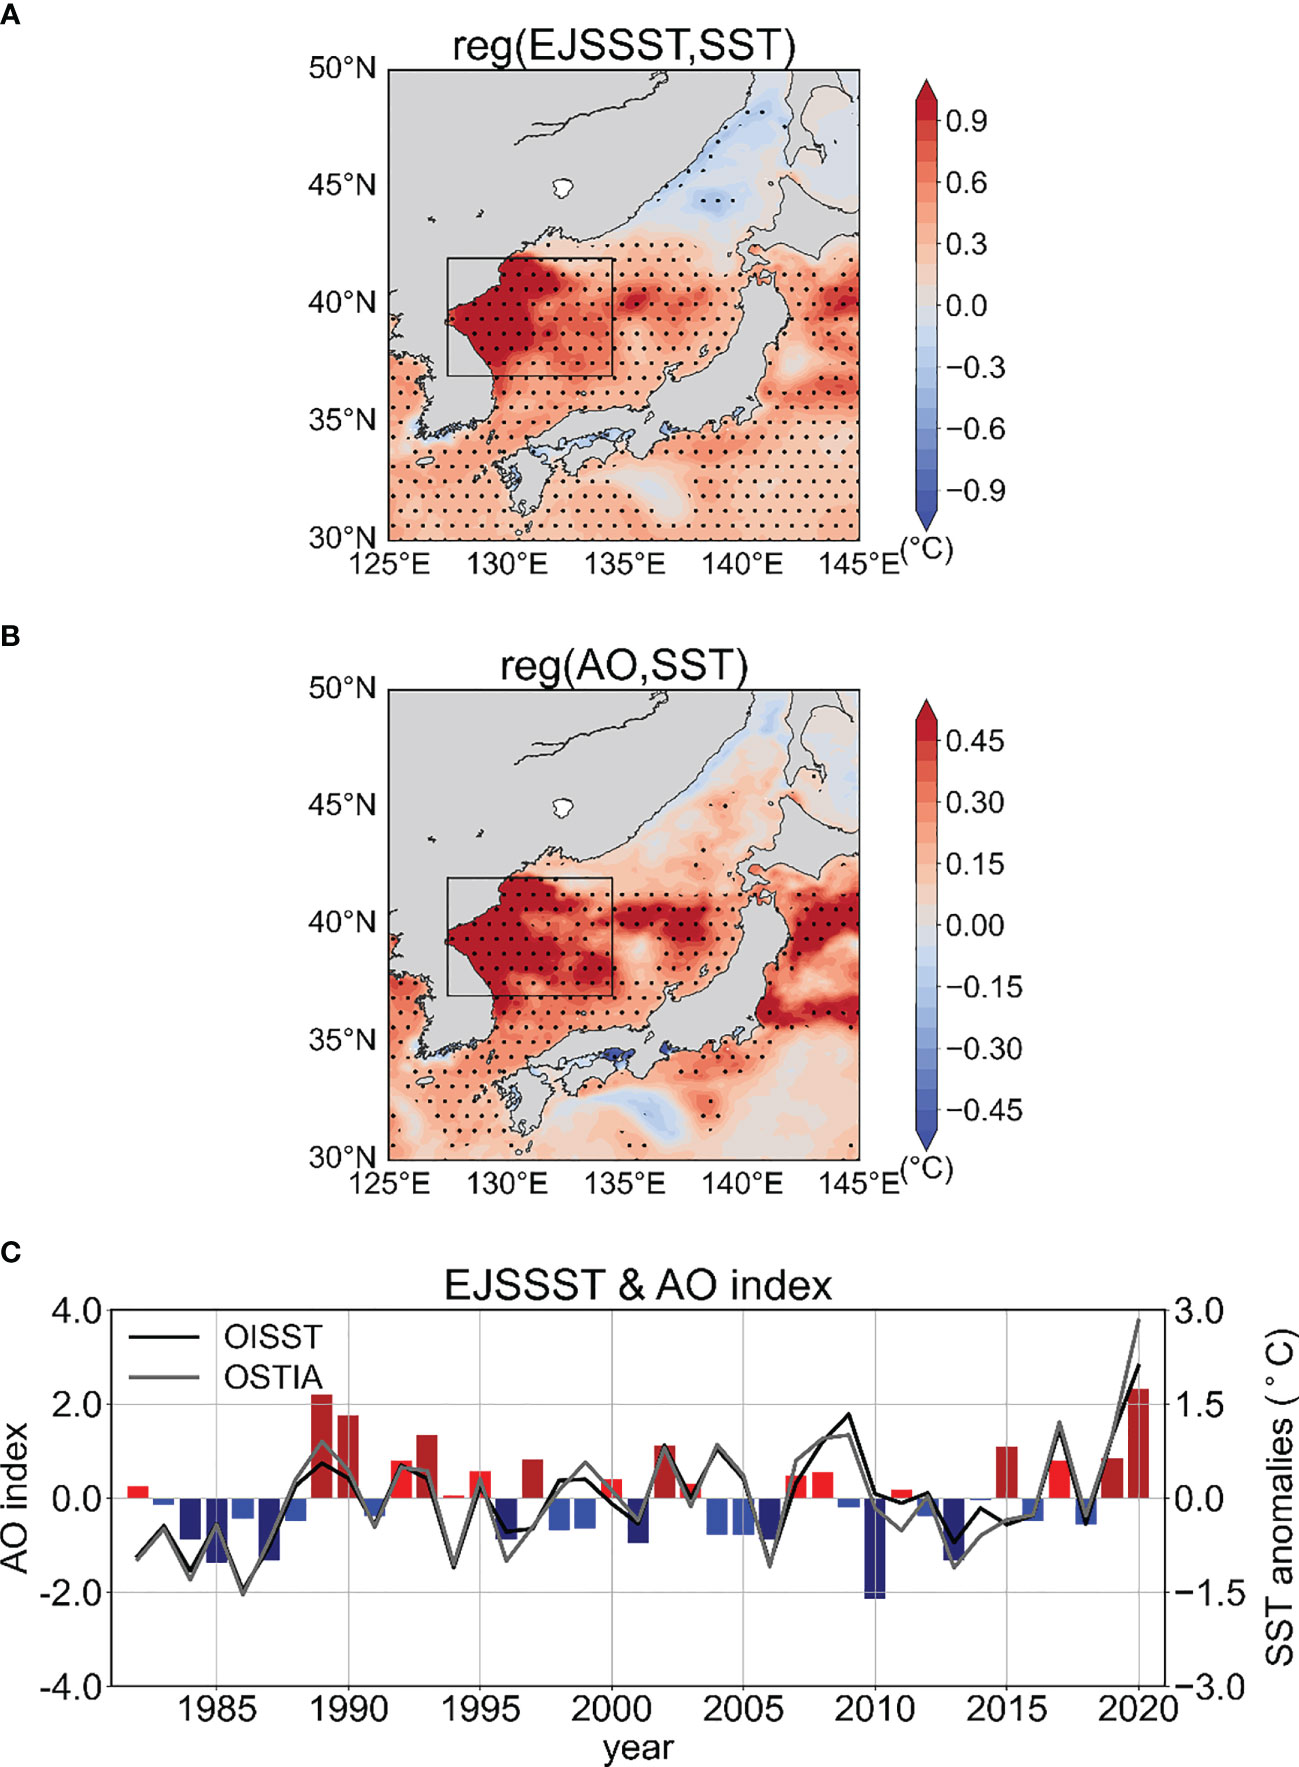
Figure 3 Regression map of the wintertime SST anomalies (shading, °C) onto the standardized (A) EJSSST and (B) AO index. The black dot denotes the values with a statistical significance at the 90% confidence level based on the student’s t-test. (C) Time series of the AO (bars, in left y-axis) and the EJSSST (black and grey line, in right y-axis) indices from 1982 to 2020. The dark red and blue bars indicate the AO positive and negative year based on the threshold of 0.8 standard deviations from 1982 to 2020.
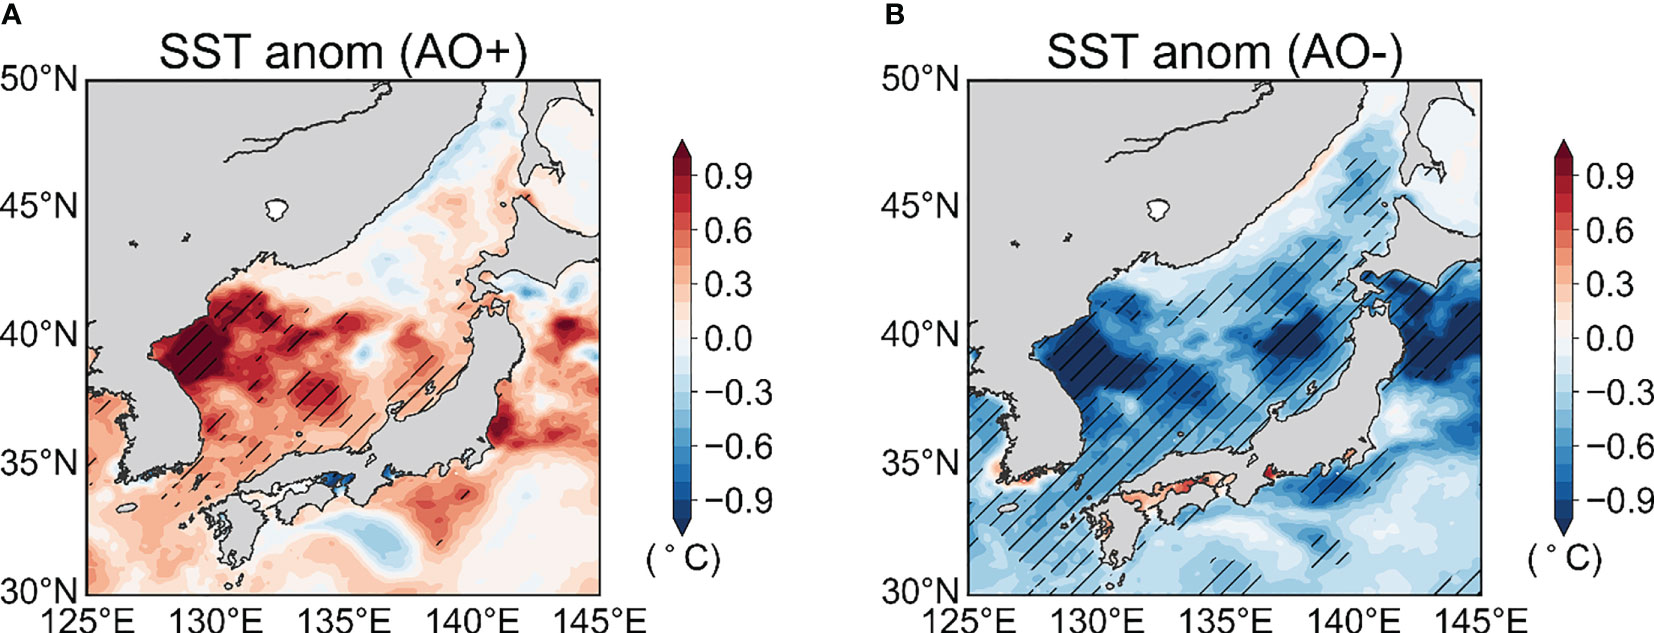
Figure 4 Composite map of the wintertime SST anomalies (shading, °C) based on the (A) AO positive and (B) AO negative years. The black hatching denotes the values with the statistical significance at the 90% confidence level based on the student’s t-test.
3.2 Physical mechanisms on the AO-SST relationship in the East/Japan Sea
To investigate the physical mechanisms of how the AO influences the EJS SST variations, we analyzed the composite patterns for atmospheric circulation. Figure 5 shows the composited atmospheric circulation patterns with respect to the AO phase. During a positive AO phase, the negative geopotential height at 850-hPa (Z850) anomalies are evident over the Arctic region, and opposite patterns are distinct over the mid-latitudes (Figure 5A). There is a typical Arctic-midlatitude seesaw structure of the AO (Thompson and Wallace, 1998). To a large extent, the atmospheric circulation anomalies in the lower troposphere during a negative AO phase are nearly symmetric compared to those during a positive AO phase. This pattern provides anomalous surface easterlies (westerlies) over the EJS (Figures 5A, B), leading to the weakening (strengthening) of the northwesterly winds (see also Figure 1A) during a positive (negative) AO phase. This is in line with a negative relationship between the AO and East Asian winter monsoon reported in previous studies (Gong et al., 2001; Jeong and Ho, 2005).
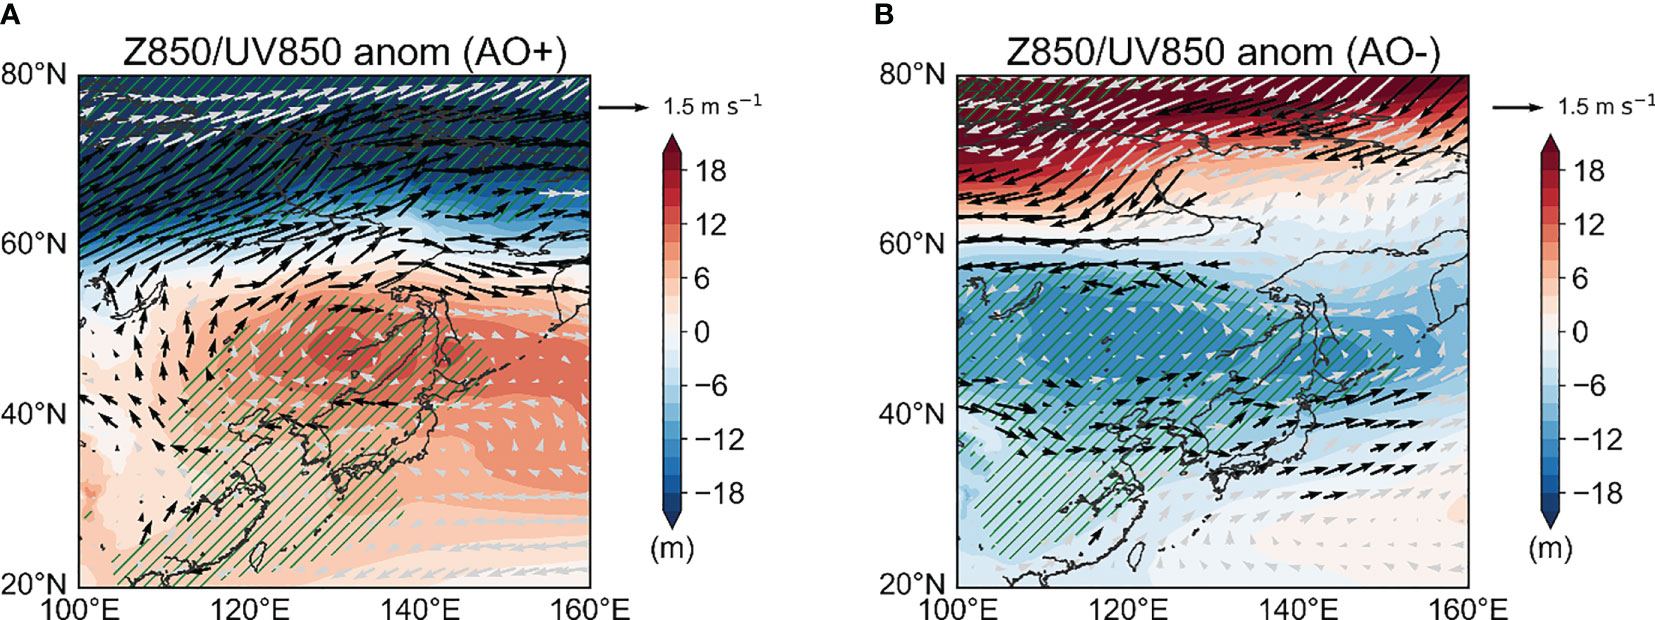
Figure 5 Composite map of the wintertime 850-hPa geopotential height (shading, m) and 850-hPa wind (vector, m s-1) anomalies based for the (A) AO positive and (B) AO negative years. The green hatching and black vectors denote the values with the statistical significance at the 90% confidence level based on the student’s t-test.
However, there are some differences in the anomalous atmospheric circulation patterns in the midlatitude. The center of the composited Z850 anomalies over Northeast China is shifted westward with a more zonally elongated shape in the AO negative phase compared to that in the AO positive phase (Figures 5A, B). This gives rise to distinct wind anomalies at 850-hPa during the AO negative phase, particularly over the EJS and the eastern side of Japan. This asymmetric feature of AO may be related to the nonlinear impact of AO on extratropical surface climate (Son et al., 2012).
Surface wind forcing is important for the SST variation in the EJS through the modulation of the air-sea heat flux exchange, oceanic horizontal and vertical advection, and oceanic mixing. Then, we analyzed the air-sea heat flux exchange to understand the physical processes responsible for the EJSSST changes related to the AO phase. Figure 6 shows the spatial patterns of the net surface heat flux (NHF). Climatologically, the EJS loses heat into the atmosphere during JFM (Figure 6A). However, a long-term energy balance indicates that surface heat loss into the atmosphere is balanced by the heat supply of the ocean current, such as the TWC (Hirose et al., 1996; Han and Kang, 2003). During a positive (negative) AO phase, anomalous heat gain (loss) is observed over the northeastern part of the EJS (Figures 6B, C). This is mostly due to the anomalous heat flux changes by the latent and sensible heat flux (Supplementary Figure 2). However, it is not well-matched with the spatial distribution of the SST anomalies related to the AO (see Figures 4A, B). Indeed, the northwestern part of the EJS has seen little change in the NHF anomalies with respect to the AO phase (Figures 6B, C; see also Supplementary Figure 2), implying that the air-sea heat flux exchanges due to the AO could not directly cause the SST variation in the northwestern part of the EJS.
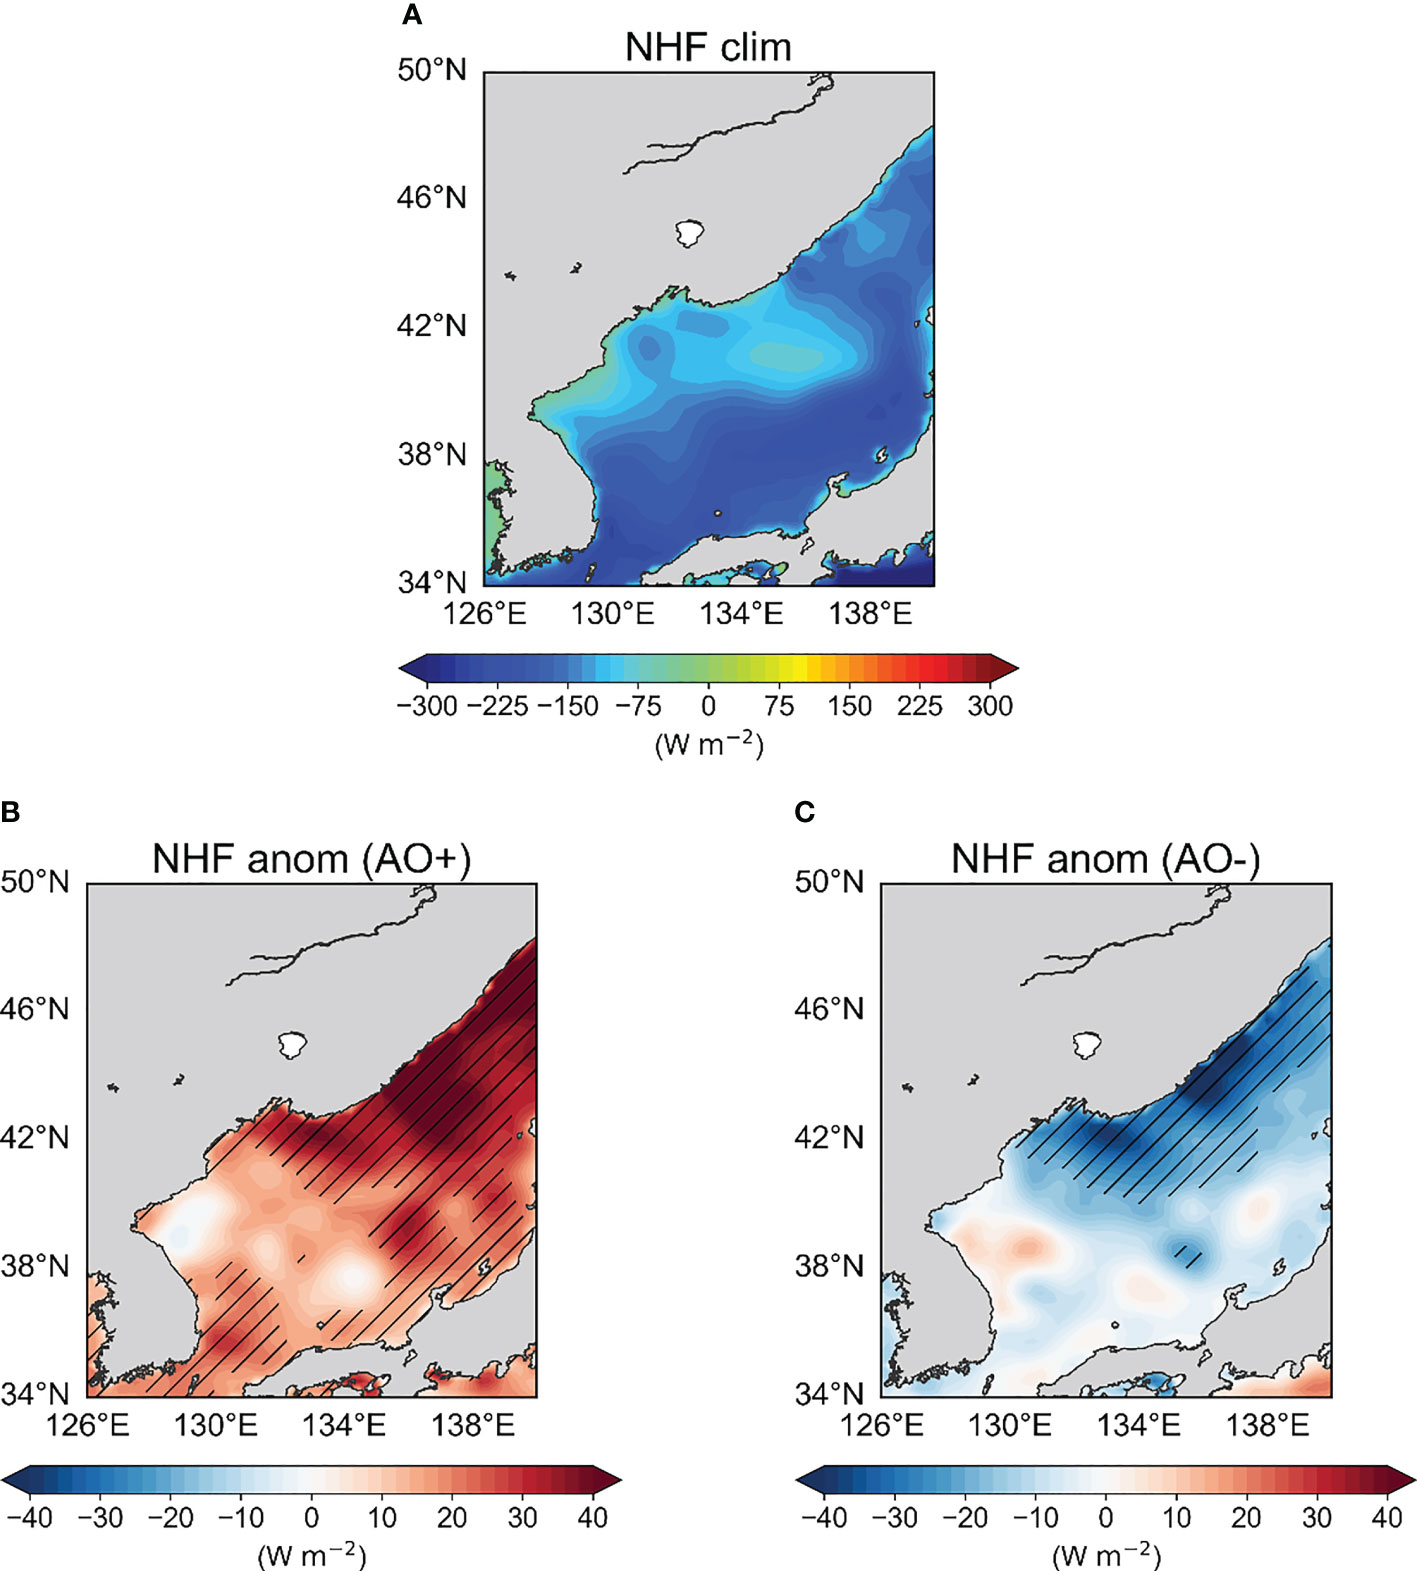
Figure 6 Climatological wintertime mean of the (A) net surface heat flux (NHF) (shading, W m-2). Positive (negative) sign denotes that the ocean gains (losses) heat from the atmosphere. Composite map of the wintertime NHF anomalies (shading, W m-2) based on the (B) AO positive and (C) AO negative years. The black hatching denotes the values with the statistical significance at the 90% confidence level based on the student’s t-test.
Surface wind stress curl forcing also causes the SST variations in the EJS via the Ekman pumping processes (Chu et al., 1998; Yoon et al., 2005; Choi et al., 2022; Jeong et al., 2022). Figure 7A shows the climatological mean of the wind stress curl fields estimated from the ORAS5 dataset for 1982-2020. The climatological surface wind stress curl pattern is characterized by a dipole-like structure from the south of Vladivostok to the East Korean Bay during JFM (Figure 7A). During a positive (negative) AO phase, the negative (positive) wind stress curl anomaly around the East Korean Bay is dominant (Figures 7B, C). Also, there are the positive (negative) wind stress curl anomaly to the south of Vladivostok and the negative (positive) wind stress curl anomaly to the west of Hokkaido during a positive (negative) AO phase. Given that the vertical Ekman pumping velocity is directly proportional to the horizontal wind stress curl (Kraus and Businger, 1994), the anticyclonic (cyclonic) wind stress curl anomaly induces anomalous downwelling (upwelling) around the East Korean Bay during a positive (negative) AO phase. These processes contribute to the anomalous SST warming (cooling) around the East Korean Bay in a positive (negative) phase of the AO (Figure 4). This result suggests that the Ekman pumping response to the regional wind stress curl pattern induced by the AO plays a key role to induce the SST variations in the northwestern part of the EJS.
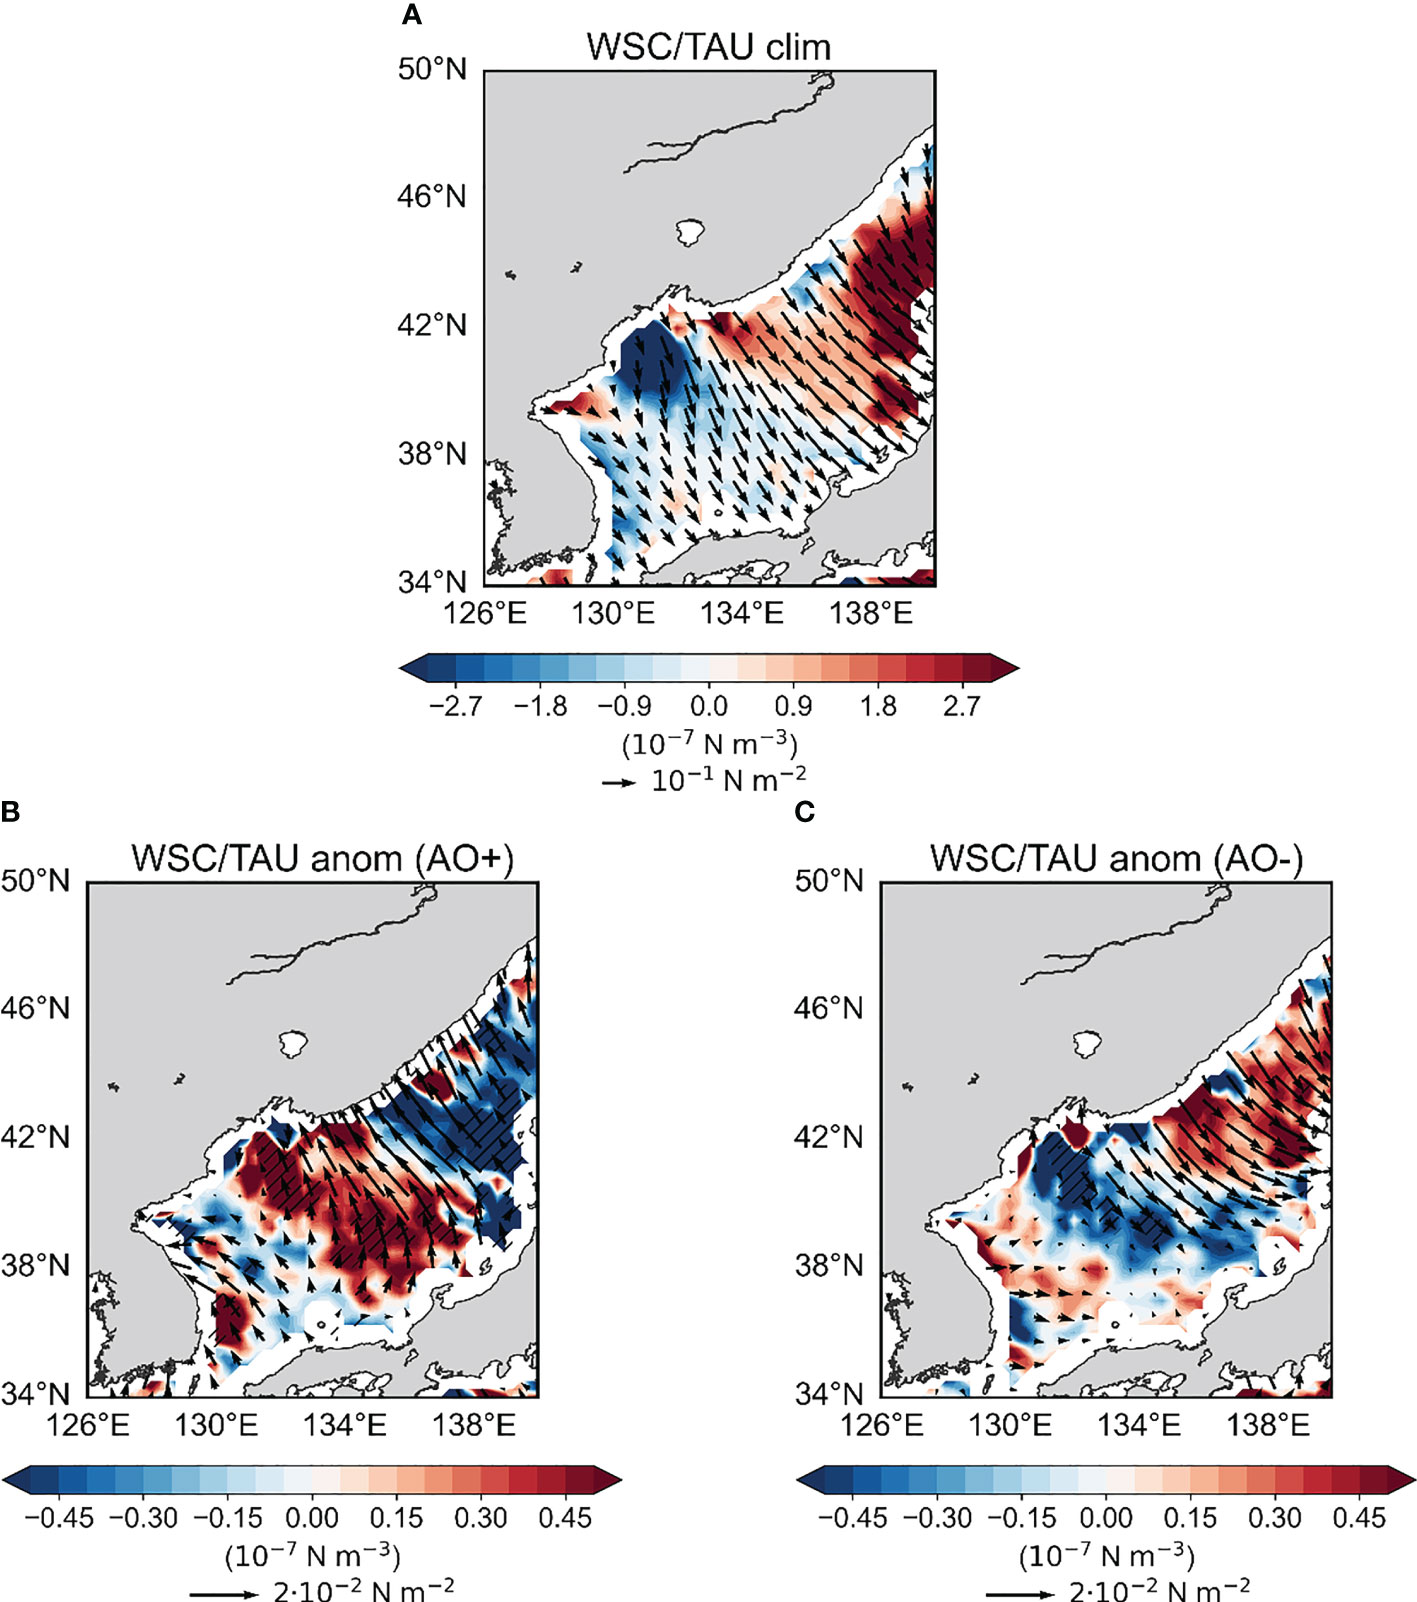
Figure 7 Climatological wintertime mean of the (A) wind stress (vector) and wind stress curl (shading). Positive (negative) sign denotes the cyclonic (anticyclonic) wind stress curl. Composite map of the wintertime wind stress (vector) and wind stress curl (shading) anomalies based on the (B) AO positive and (C) AO negative years. The black hatching denotes the values with a statistical significance at the 90% confidence level based on the student’s t-test.
In addition to oceanic vertical advection, we further examine the changes in horizontal ocean circulation patterns with respect to the AO phase. Figure 8A displays the climatological mean sea surface height (SSH) and surface current pattern estimated from the ORAS5 data from 1982 to 2020. The East Korean warm current (EKWC) originated from TWC is evident along the eastern coast of Korea (Figure 8A). The EKWC provides warm and saline water into the EJS, and it starts to separate at approximately 37°N (Cho and Kim, 1996; Pak et al., 2019). During an AO positive (negative) phase, the significant anticyclonic (cyclonic) eddy-like circulation anomaly is observed along the eastern coast of Korea along with positive (negative) SSH anomalies (Figures 8B, C). These oceanic responses are mainly driven by the AO-related regional wind stress curl anomaly as shown in Figure 7. The eddy-like feature is strongly developed near the East Korean Bay, Ulleung Basin, and the western side of Japan and shows a nearly symmetric feature for the AO phase (Figures 8B, C). Moreover, the spatial distribution of composited SSH anomalies is well-matched with that of composited SSTAs (Figure 4) near the East Korean Bay and the western side of Japan.
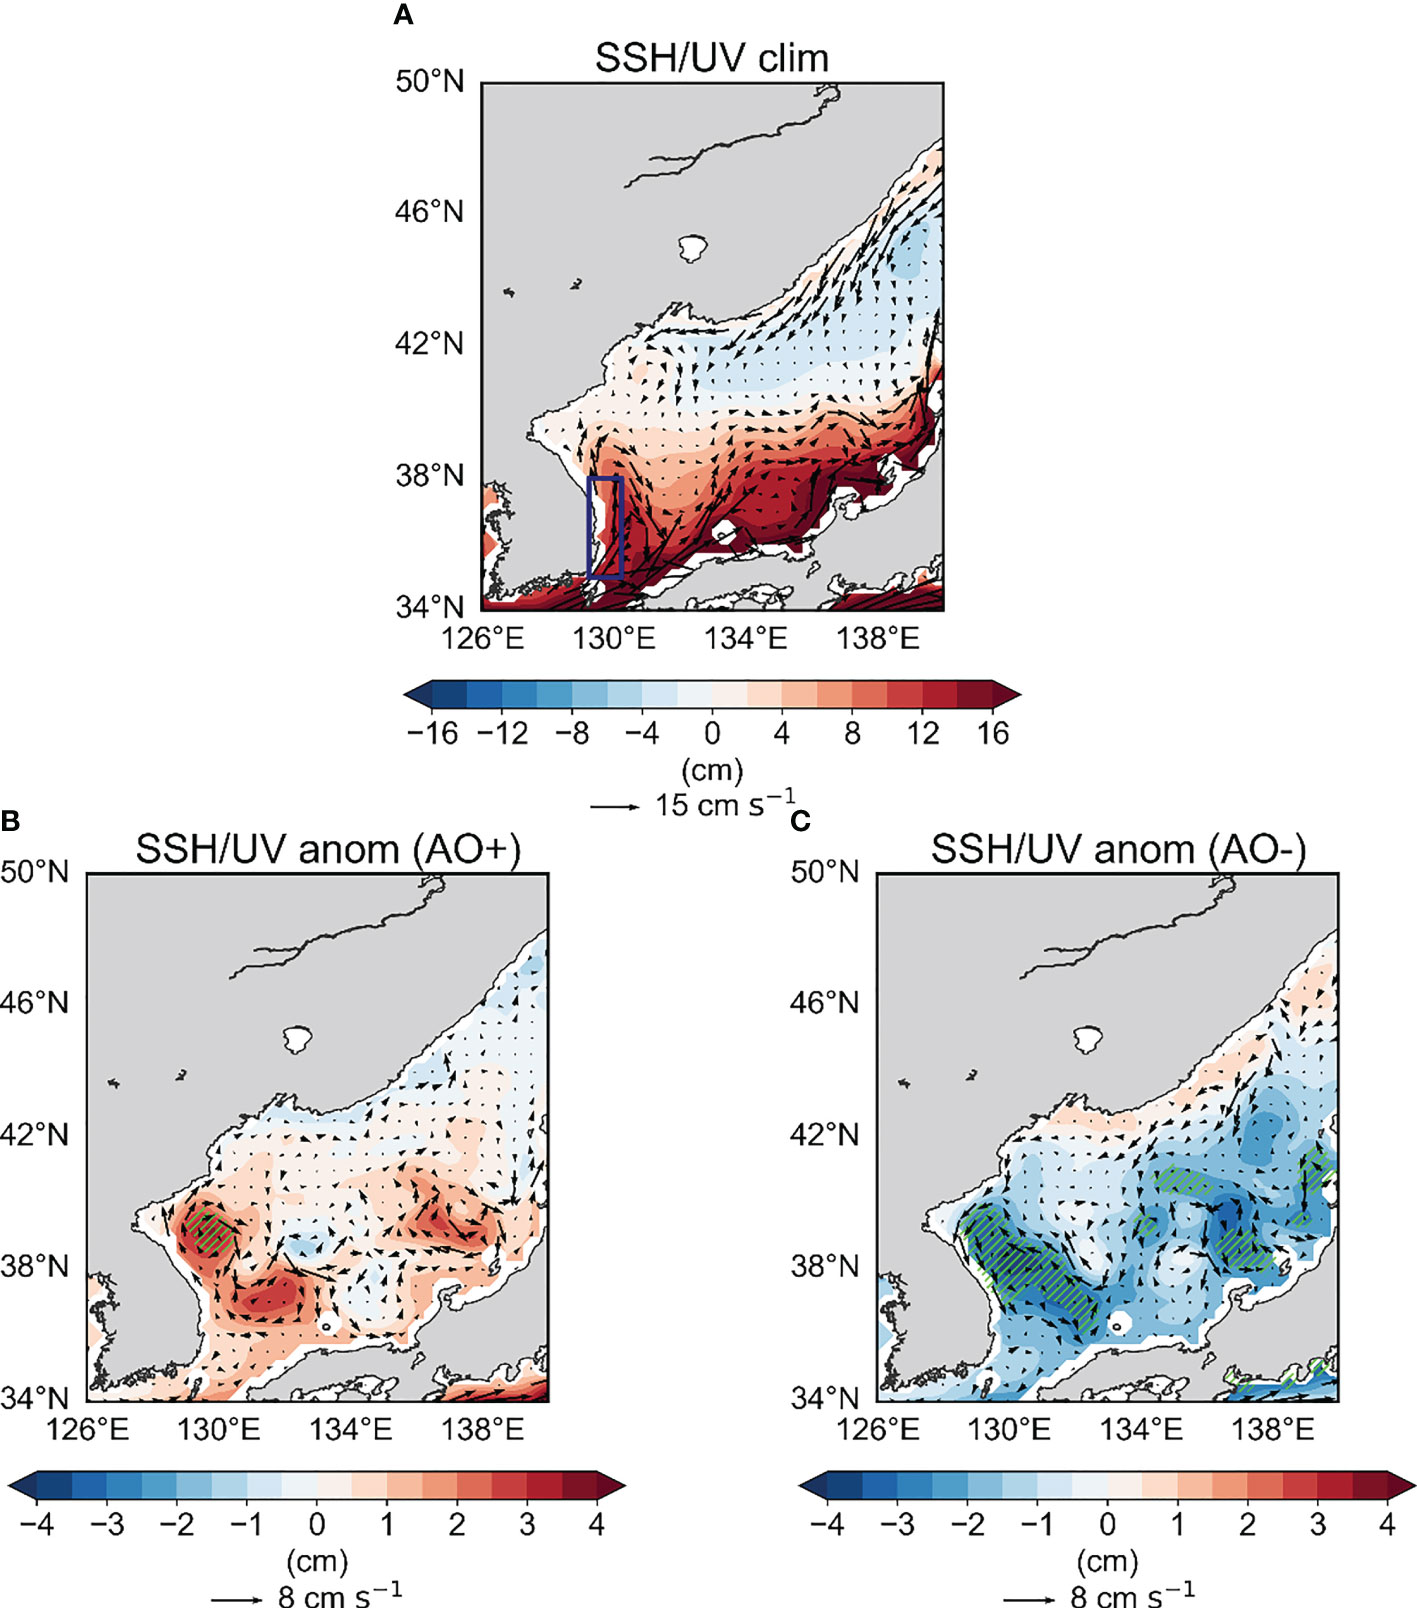
Figure 8 Climatological wintertime mean of the (A) sea surface height (shading, cm) and surface current (vector, cm s-1). The blue box in (A) denotes the region where the climatological meridional surface current exhibits the distinct northward flow. Composite map of the wintertime sea surface height (shading, cm) and surface current (vector, cm s-1) anomalies based on the (B) AO positive and (C) AO negative years. The light green hatching denotes values with statistical significance at the 90% confidence level based on the student’s t-test.
The AO could affect the EKWC variability through the modulation of the surface wind forcing (Kim et al., 2022). Subsequently, the EKWC variability plays a role to induce the SST variations in the EJS along with the changes in the ocean circulation and eddies (Choi et al., 2018; Pak et al., 2019). To explore this physical linkage, we calculated the EKWC strength index as the meridional surface current averaged over 129.25°-130.25°E, 35°-38°N where the climatological northward flow is distinct along the east coast of Korean Peninsula (Figure 8A). The EKWC strength index is dominant on interannual timescales along with its intensified trend of about 0.62 cm s-1 decade, which is statistically significant at the 95% confidence level (Supplementary Figure 3). In addition, a positive relationship between the AO and EKWC strength index (r = 0.41 where r is a simultaneous correlation coefficient with a linear trend) is observed, and it could be explained by the weakening (strengthening) of the climatological northwesterly winds along the east coast of Korea during a positive (negative) AO phase (Kim et al., 2022; Figure 7). Then, we investigate how the EKWC strength is associated with the surface ocean circulation patterns in the EJS. Figure 9 shows the composite map of SSH and surface current fields during JFM with respect to the EKWC strength index. Here, the positive (negative) EKWC strength years were defined as the cases when the JFM seasonal mean EKWC strength index is greater (less) than 0.8 (-0.8) standard deviations above (below) its mean value (Table 1). An eddy-like feature is strongly developed along the east coast of Korea and there is a nearly symmetric pattern in the SSH and surface current fields with respect to the EKWC phase (Figures 9A, B). The anticyclonic (cyclonic) eddy-like circulation anomaly is observed when the EKWC strength is stronger (weaker) than its climatological state. This indicates that the variability of EKWC strength is associated with the changes in the ocean circulation and eddies along the east coast of Korea. Thus, we argued that the AO-related wind forcing could contribute to the eddy-like circulation anomaly around the East Korean Bay (Figures 8B, C) through the modulation of the regional wind stress curl pattern and the EKWC strength.
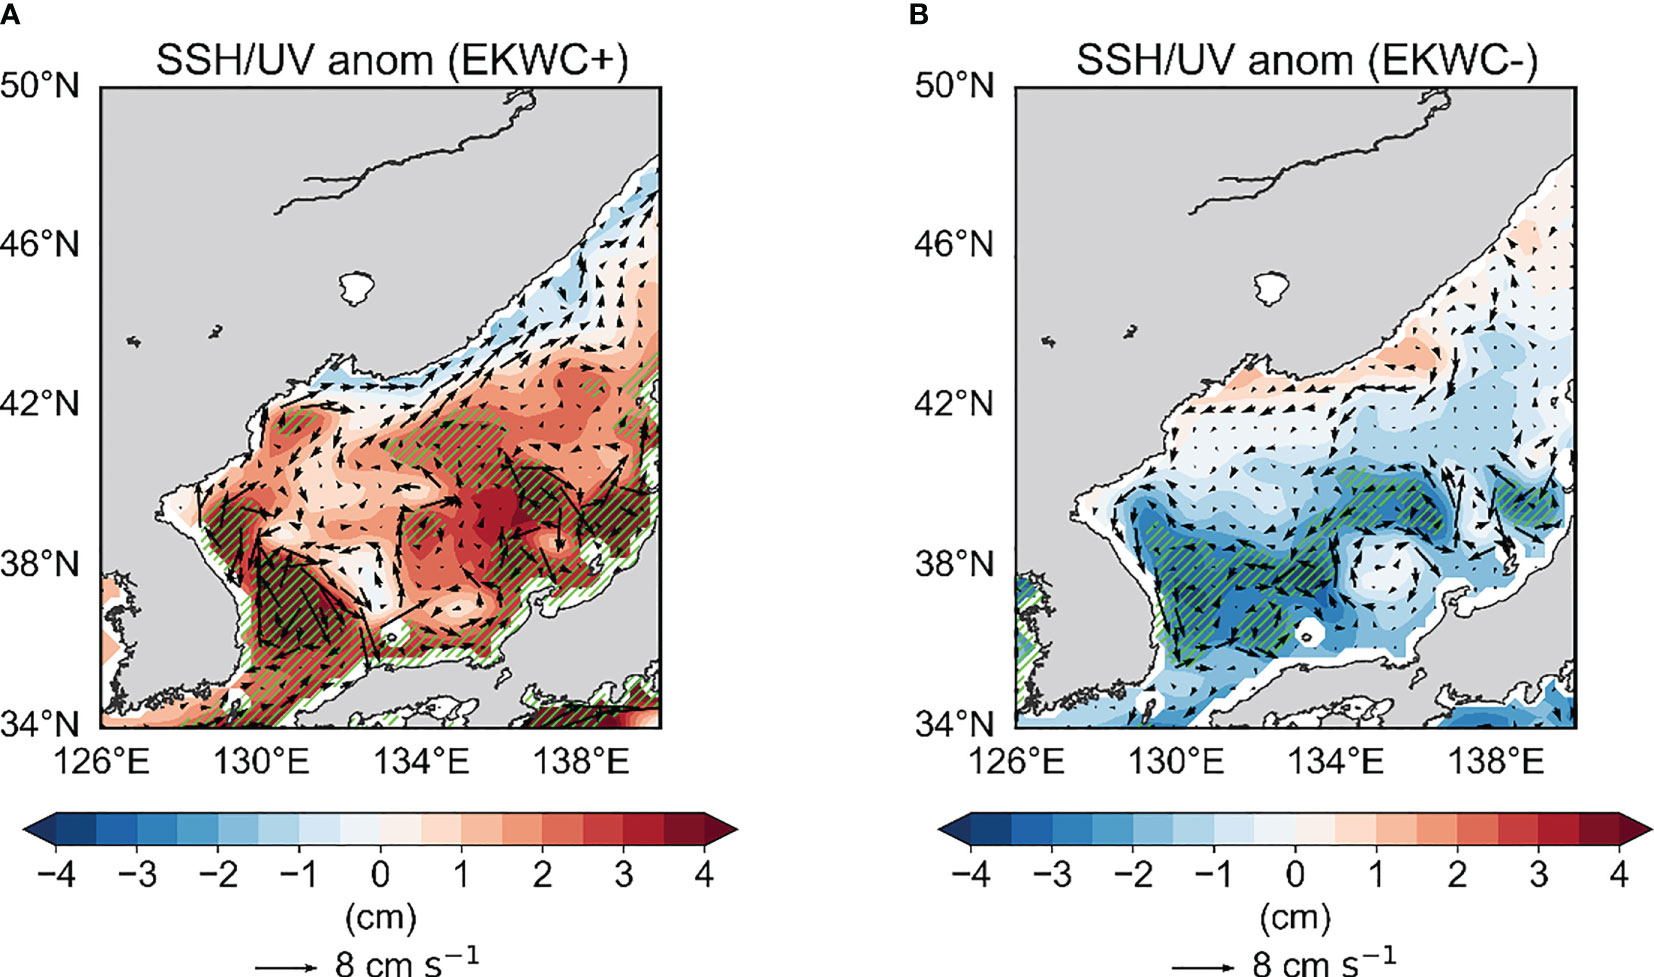
Figure 9 Composite map of the wintertime sea surface height (shading, cm) and surface current (vector, cm s-1) anomalies based on the (A) EKWC strength positive and (B) EKWC strength negative years. The light green hatching denotes values with statistical significance at the 90% confidence level based on the student’s t-test.
To further examine the role of eddy-like circulation anomaly in the SST variations in the EJS, we analyzed the vertical structure of ocean temperature structure with respect to the AO from the surface to 163 m. Along with the eddy-like circulation anomaly, the ocean temperature anomaly shows a vertically homogeneous structure within the upper 163 m around the East Korean Bay (Figure 10). Furthermore, we analyzed the composite map of monthly time-depth ocean temperature anomalies horizontally averaged over the northwestern part of the EJS (37°-42°N, 127.5°-134.5°E) between positive and negative AO years, respectively (Figure 11). It is evident that the anomalous warm ocean temperature anomalies are found from surface to the depth of a few hundred meters in JFM during positive AO years and then surface warming propagates into the subsurface with a maximum peak during the late summer (Figure 11A). A similar evolution of the cold ocean temperature anomalies can be found during negative AO years (Figure 11B), implying that SST leads to the subsurface temperature with a lagged time. This implies that the anticyclonic eddies with warm and saline core water occurred near the East Korean Bay (Supplementary Figure 4), which is characterized by the warm mesoscale ocean eddies. Note that a nearly symmetric pattern with warm (cold) and saline (fresh) water around the East Korean Bay is observed during a positive (negative) AO phase (Figure 10; Supplementary Figure 4). In other words, these oceanic eddy-like responses are associated with the anomalous SST warming (cooling) around the East Korean Bay during a positive (negative) AO phase (Figure 4). Along with the warming structure reaching the subsurface, the local intensification of the anticyclonic eddy-like circulation could induce persistent anomalous SST warming (Miyama et al., 2021). Further, these conditions would be conducive to the MHW occurrences over the northwestern part of the EJS. Thus, we argued that the eddy-like circulation response to the regional wind stress curl pattern is also responsible for the SST variation related to the AO.
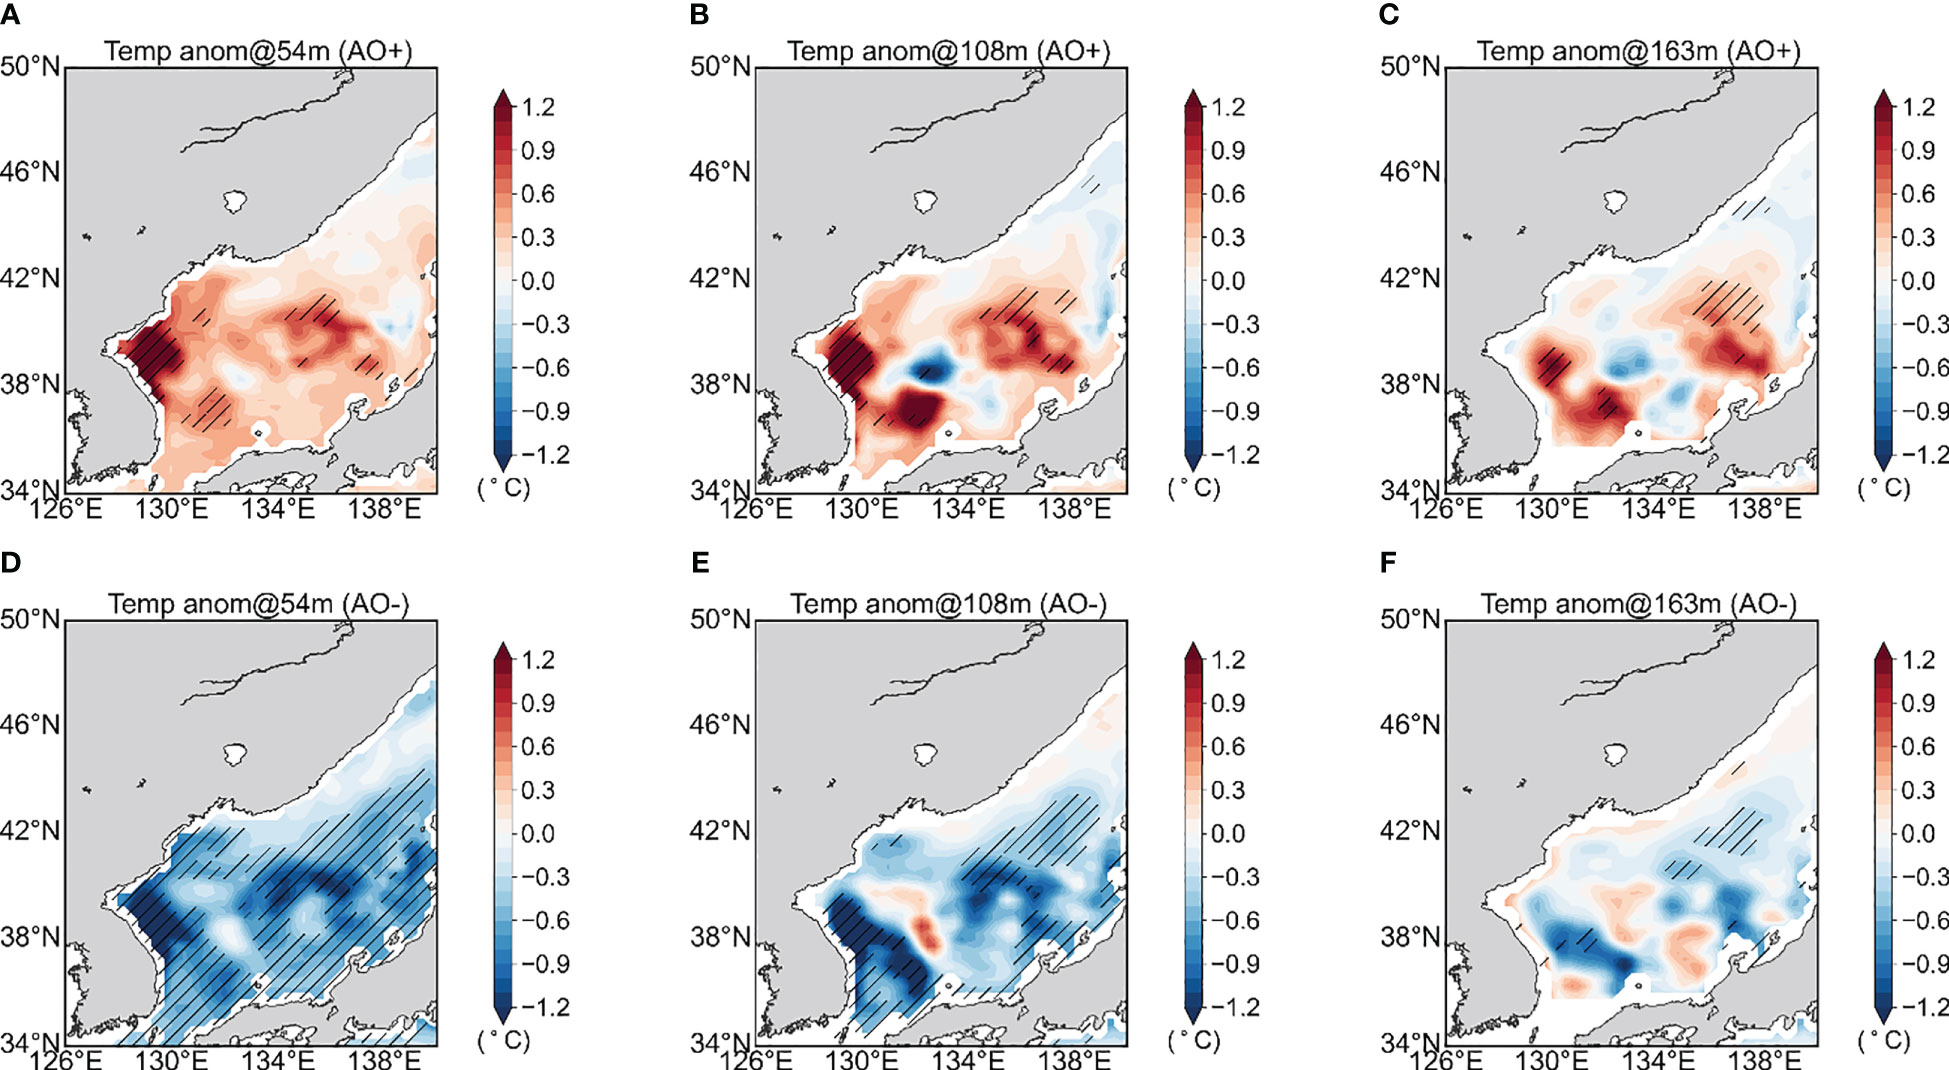
Figure 10 Composite map of the wintertime ocean potential temperature anomalies at (A) 54 m, (B) 108 m, and (C) 163 m based on the AO positive years. (D-F) As in (A-C), but for the AO negative years. The black hatching denotes the values with the statistical significance at the 90% confidence level based on the student’s t-test.
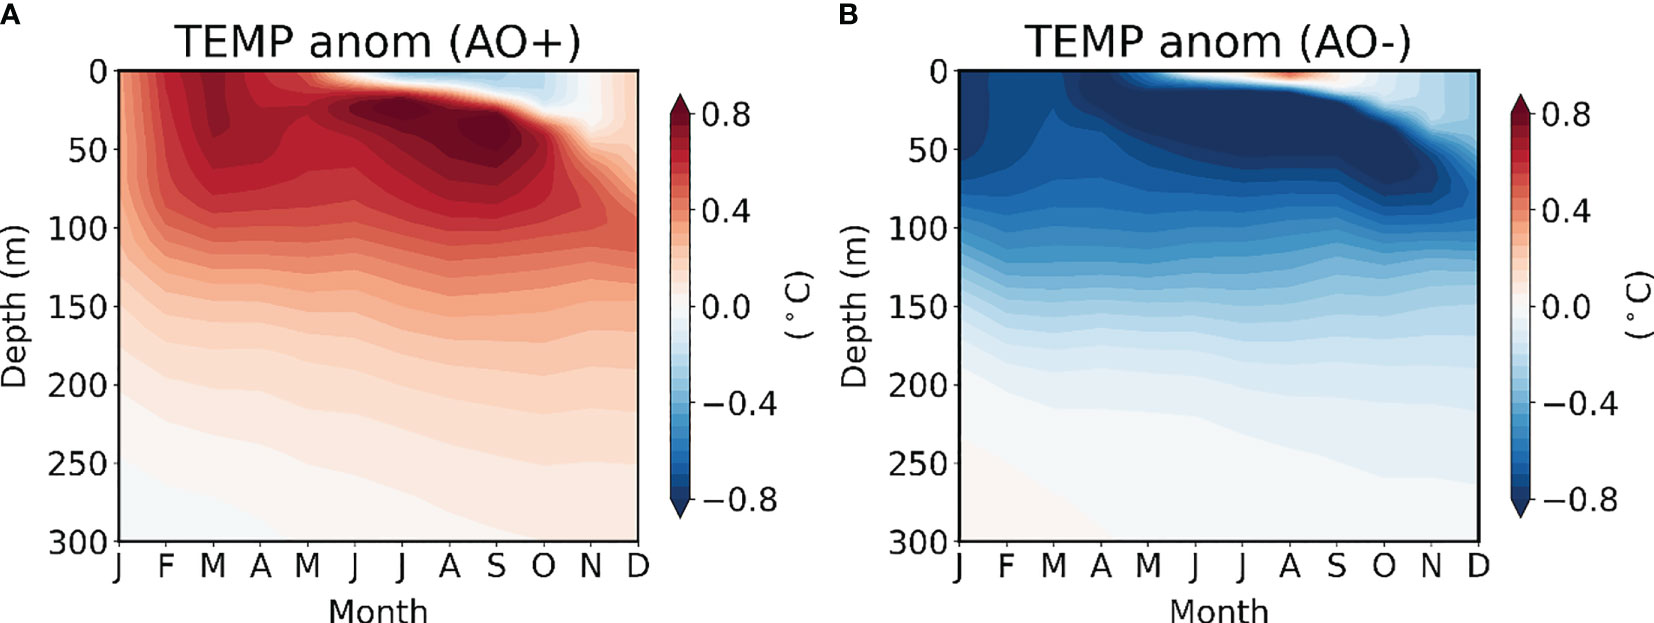
Figure 11 Composite map of monthly time-depth ocean temperature anomalies (shading, °C) horizontally averaged over the northwestern part of the EJS (37°-42°N, 127.5°-134.5°E) based on the (A) AO positive and (B) AO negative years.
3.3 AO and MHW occurrence in the East/Japan Sea
We argued that the negative wind stress curl anomaly induces the SST warming via the oceanic-dynamic adjustment with the anomalous anticyclonic eddy-like circulation pattern around the East Korean Bay during a positive AO phase. If this SST warming lasts for more than a few days above the critical thresholds, it could result in the occurrence of MHW events. This would lead to devastating impacts on marine ecosystems including the primary productivity in the EJS (Park et al., 2022; Smith et al., 2022).
To quantitatively analyze the linkage between the AO and MHW occurrences in the EJS, we calculated the MHW days that occurred in JFM from 1982 to 2020. The climatological wintertime MHW occurrences in the EJS exhibits the maximum values around the East Korean Bay (Figure 12A). On average, the MHW occurrences averaged over the northwestern part of the EJS (black box in Figure 2A) were about 5.3 days during JFM for 1982-2020. We found a striking difference in the wintertime MHW occurrences over the EJS according to the AO phase (Figures 12B, C). The MHW occurrence averaged over the northwestern part of the EJS (37°-42°N, 127.5°-134.5°E) in the AO positive (negative) phase is about 12.5 days (0.5 days), suggesting that the AO positive phase could be a favorable condition to induce a frequent occurrence in the MHW days around the East Korean Bay. This can also be verified by the simultaneous correlation coefficient between the AO and MHW days averaged over the northwestern part of the EJS (37°-42°N, 127.5°-134.5°E) that exhibits about 0.51 and 0.53 with and without a linear trend, respectively, which is statistically significant at the 99% confidence level.
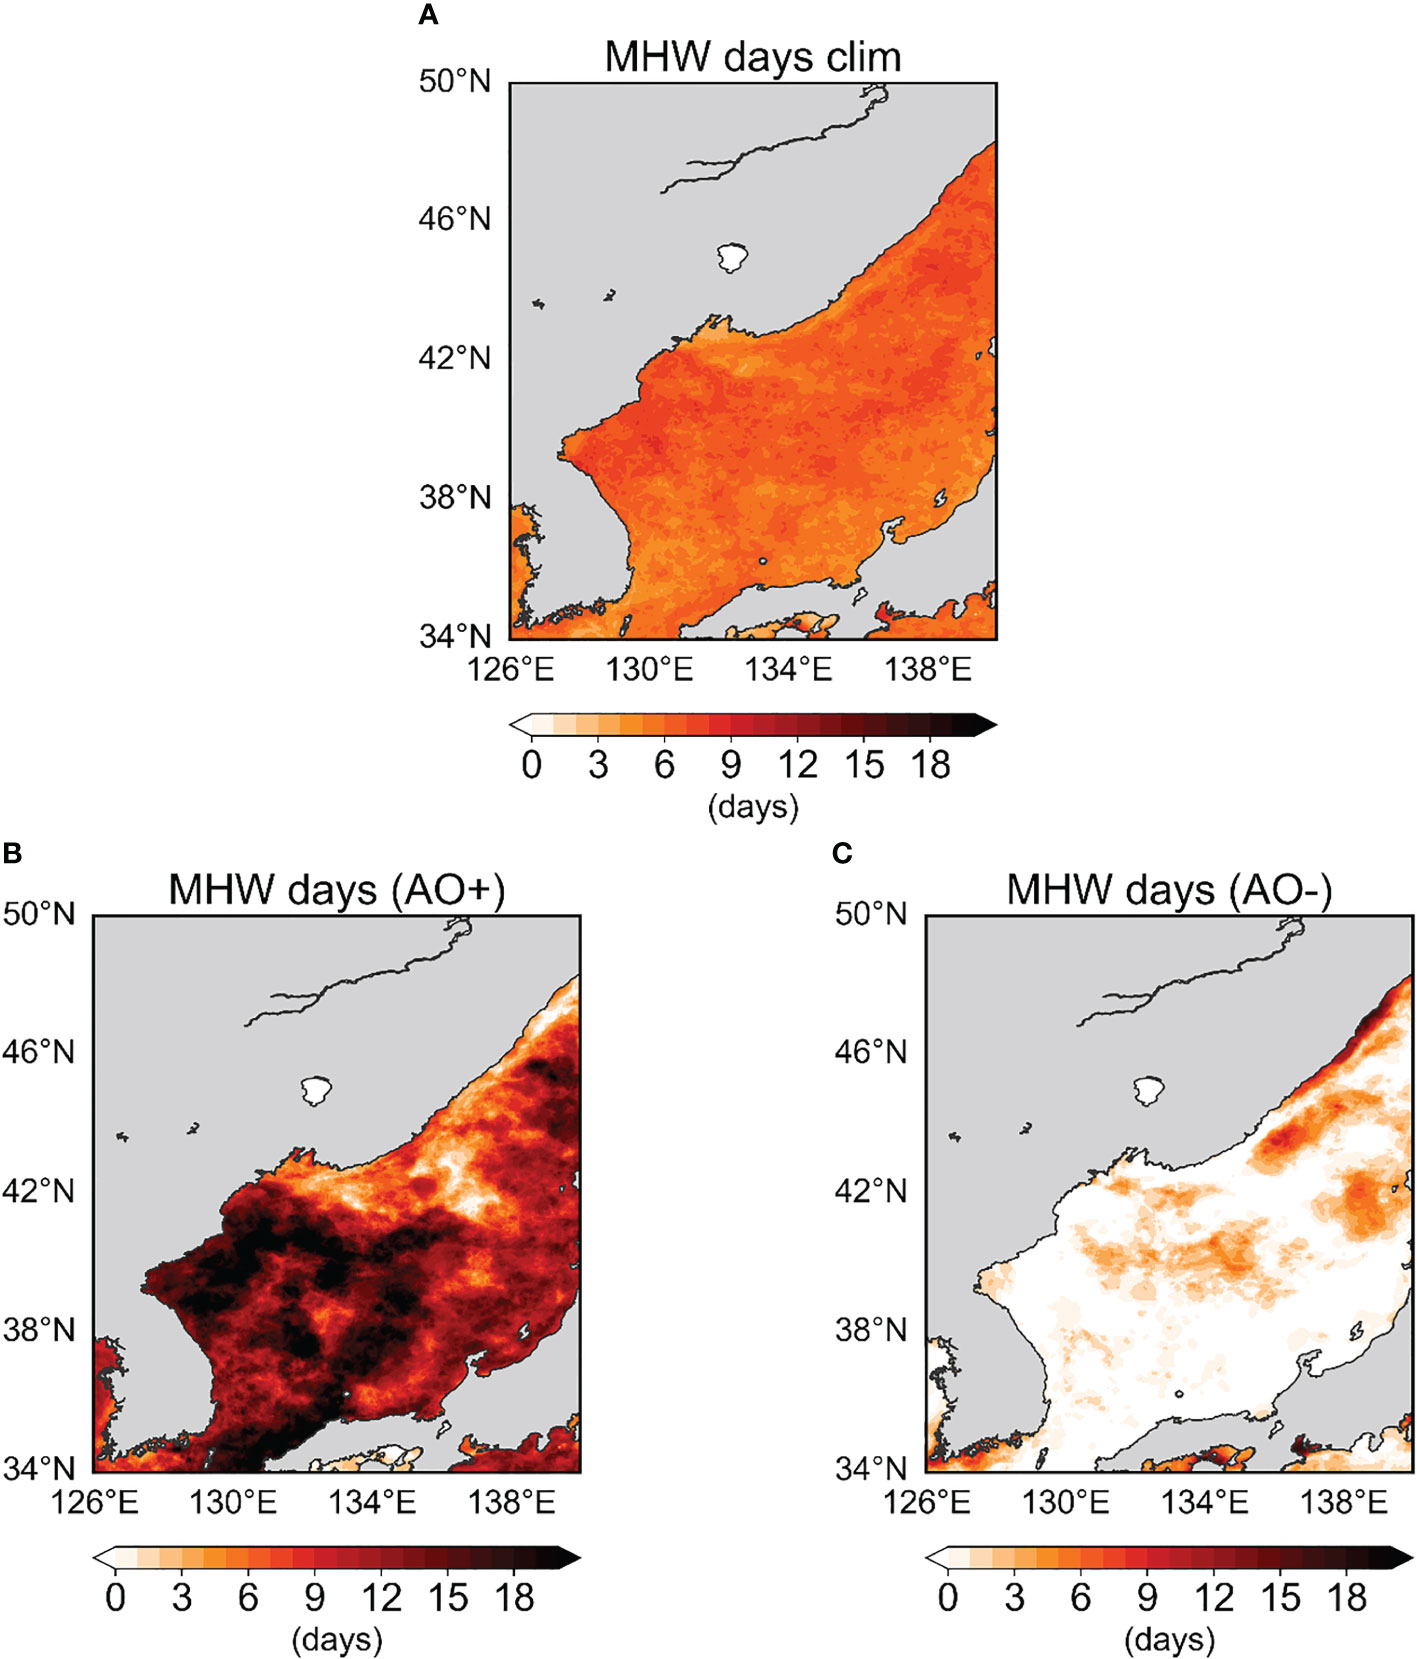
Figure 12 Climatological wintertime mean of the (A) MHW days (shading, days). Composite map of the wintertime MHW days (shading, days) based on the (B) AO positive and (C) AO negative years.
In particular, an extreme MHW event in the EJS was observed in the 2020 JFM (Figure 13A; see also Figure 2B). The regionally averaged SSTAs in the northwestern part of the EJS were more than 2.8°C warmer than the climatological mean value concurrent with an extremely intense positive AO event from January 2020 to March 2020 (Figures 13B, C). This could be explained by the distinct anticyclonic eddy-like circulation anomaly around the East Korean Bay due to the AO (Figure 13D). It is noteworthy that the importance of the eddy-like circulation in the local SST warming and MHW occurrence has previously been reported near the coast of Hokkaido (Miyama et al., 2021). These results suggest that a positive AO event could be conducive to the MHW occurrences over the northwestern part of the EJS via the oceanic-dynamic adjustment process.
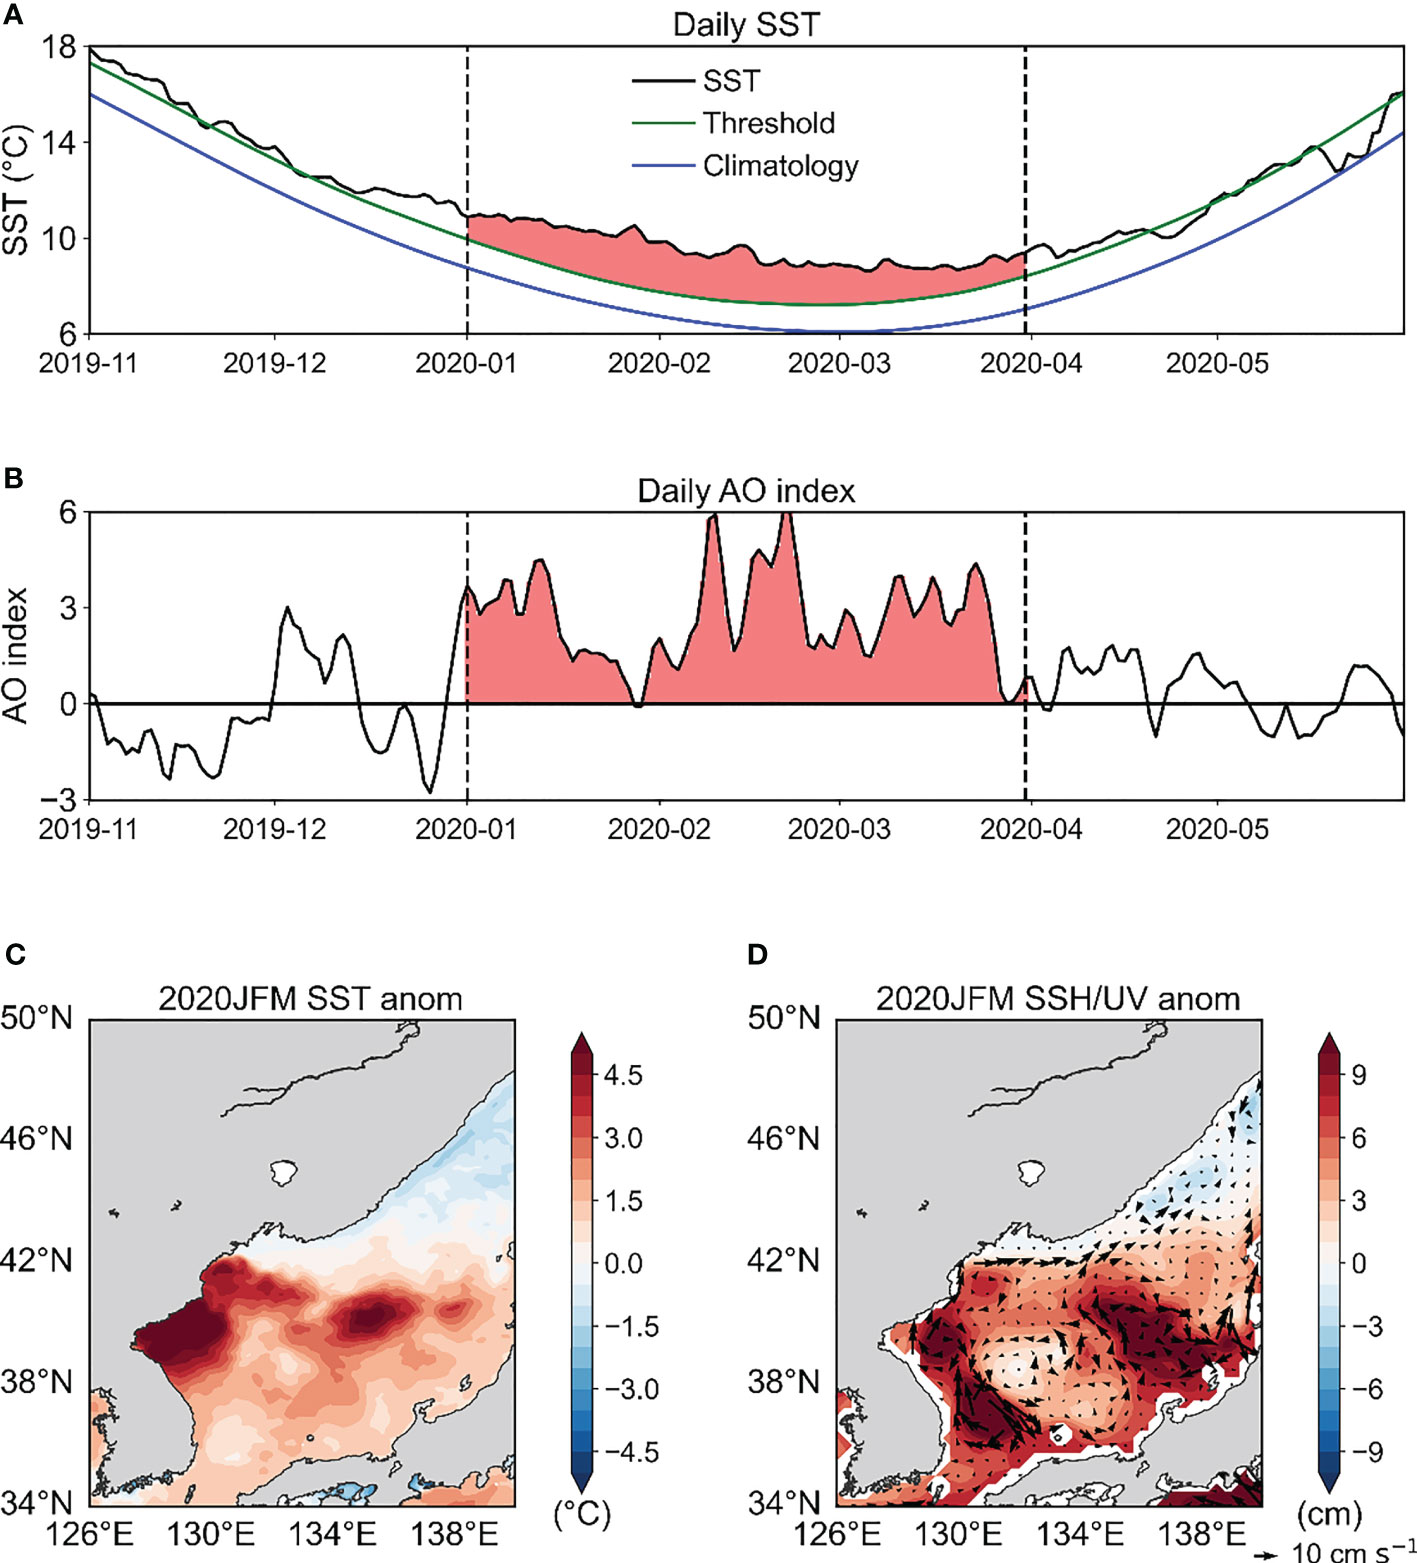
Figure 13 Time series of the daily (A) SST averaged over the northwestern part of the EJS (37°-42°N, 127.5°-134.5°E) (black line, °C) and (B) AO index from November 2019 to May 2020. The green and blue lines in (A) indicate the climatological mean and 90th percentile threshold used to define the MHW event, respectively. The vertical black dotted line and shading in red in (A, B) are indicative of the period from 1 January 2020 to 31 March 2020. Composite map of the 2020 JFM (C) SST anomalies (shading, °C) and (D) sea surface height anomalies (shading, cm) and surface current anomalies (vector, cm s-1).
4 Summary and discussion
In this study, we investigated the relationships between changes in the AO and SST variation and MHW events over the northwestern part of the EJS. The SST around the East Korean Bay during JFM shows anomalous warm (cold) temperatures with respect to the AO positive (negative) phase. This AO-EJSSST relationship cannot be explained by the air-sea heat flux exchange because the NHF anomalies show little change around the East Korean Bay. Further analysis shows that the oceanic-dynamic adjustment is important for the impacts of AO on the EJSSST. The regional wind stress curl pattern related to the AO leads to eddy-like circulation anomalies along with the anomalous Ekman pumping in the northwestern part of the EJS. In particular, the anomalous anticyclonic eddy-like circulation and Ekman downwelling during a positive AO phase could be conducive to the abnormally warm SSTs along with increased MHW occurrences in this region. Thus, we argued that the oceanic-dynamic response to regional wind stress curl patterns is responsible for the physical linkage between the AO and EJSSST.
The relatively low correlation coefficient of 0.58 between the AO and EJSSST indices could be due to the non-stationary relationship of AO-EJSSST. According to a previous study (Lee and Park, 2019), the AO has a significant influence on the SST variation in the EJS after 2005 and it might be due to a higher variability of the AO than that before 2005. Indeed, the correlation coefficient between the AO and EJSSST index has been increased from 0.46 during 1982-2005 to 0.73 during 2006-2020 (Table 2). In addition, the AO-EKWC relationship is also statistically significant at the 95% confidence level after 2006. This result suggests that enhanced connection of AO-EJSSST could be associated with the strengthening of AO-EKWC relationship after 2005. The AO-related wind forcing leads to the anomalous Ekman downwelling (upwelling) around the East Korean Bay during a positive (negative) AO phase (Supplementary Figure 5), but the relationship of Ekman pumping velocity averaged in the northwestern part of the EJS and EJSSST is relatively weak (Supplementary Figure 6). This may explain why the correlation of the AO and EJSSST indices is relatively low (r = 0.58) although it is statistically significant at the 99% confidence level (Figure 3C; see also Table 2). Therefore, it is further necessary to examine the various environmental factors affecting the EJSSST variation in a complex manner.
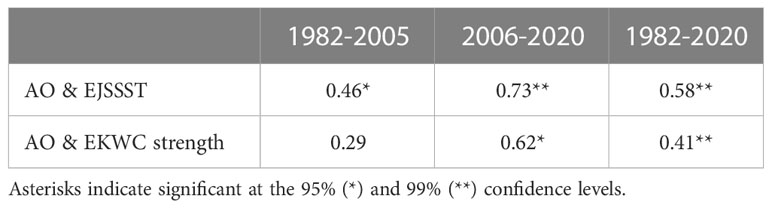
Table 2 The correlation coefficient between the AO and EJSSST indices and the AO and EKWC strength indices during JFM for the period 1982-2005, 2006-2020 and 1982-2020.
The effect of AO modulation on the wintertime SST variability in the northwestern part of the EJS is also supported by the catastrophic MHW event recorded in the 2020 JFM. The abnormally high SST in the EJS was concurrent with the extremely positive AO event during the winter of 2020 (Figures 13A-C). However, it should be noted that anomalous SSTs much warmer than the 90th percentile threshold were already prevalent in early December (Figure 13A). This suggests that the mechanisms for the development, maintenance, and decay of MHW, which depend on the climatological systems and their configurations, may be different. For example, in addition to climate modes, the SST variation in the EJS is associated with the ocean currents, such as the TWC and EKWC. In particular, it is known that the strength and pathway of these oceanic currents are likely to impact SST variations via the modulation of the ocean circulation and eddies (Choi et al., 2018; Pak et al., 2019). Also, there are seasonal differences in the driving mechanisms for MHWs over the northwestern part of the EJS. While the summer MHWs are primarily driven by the air-sea heat flux exchange (Choi et al., 2022; Lee et al., 2022), the winter MHWs are mainly affected by the oceanic dynamic adjustment process as suggested in this study. Therefore, a comprehensive understanding of the MHW physical processes across a range of spatial and temporal scales is required.
Further, the MHW days averaged over the northwestern part of the EJS have a positive relationship with the EJSSST index over the period 1982-2020. A simultaneous correlation coefficient between two variables is 0.83 and 0.80 with and without a linear trend, respectively, which is statistically significant at the 99% confidence level. This result indicates that the increased MHW days in the northwestern part of the EJS over the past several decades might be associated with the mean SST warming. Thus, it is imperative to examine whether the mean SST warming is resulted from natural variability, anthropogenic forcing, or their combined influences. This would provide guidance to better constrain the future changes in the MHW event over the northwestern part of the EJS.
Data availability statement
The original contributions presented in the study are included in the article/Supplementary Material. Further inquiries can be directed to the corresponding author.
Author contributions
Conceptualization: SYS, YJK, EJL, SWY, and JHP. Methodology, and visualization: SYS, YJK, and EJL. Writing draft: SYS. Review and editing: SWY, JHP and YGP. Supervision: SWY. All authors discussed the results and contributed to the article.
Funding
This work was funded by the project “Investigation and prediction system development of marine heatwave around the Korean Peninsula originated from the subarctic and western Pacific (20190344)” from the Ministry of Oceans and Fisheries, Korea.
Acknowledgments
We are deeply grateful to Dr. Kiyoshi Tanaka (The University of Tokyo) for helpful comments and discussions and thank you for the two reviewers and editor who greatly improve the quality of the manuscript.
Conflict of interest
The authors declare that the research was conducted in the absence of any commercial or financial relationships that could be construed as a potential conflict of interest.
Publisher’s note
All claims expressed in this article are solely those of the authors and do not necessarily represent those of their affiliated organizations, or those of the publisher, the editors and the reviewers. Any product that may be evaluated in this article, or claim that may be made by its manufacturer, is not guaranteed or endorsed by the publisher.
Supplementary material
The Supplementary Material for this article can be found online at: https://www.frontiersin.org/articles/10.3389/fmars.2023.1198418/full#supplementary-material
References
Belkin I. M. (2009). Rapid warming of large marine ecosystems. Prog. Oceanog. 81, 207–213. doi: 10.1016/j.pocean.2009.04.011
Cho Y.-K., Kim K. (1996). Seasonal variation of the East Korea warm current and its relation with the cold water. La mer 34, 172–182.
Choi W., Bang M., Joh Y., Ham Y.-G., Kang N., Jang C. J. (2022). Characteristics and mechanisms of marine heatwaves in the East Asian marginal seas: regional and seasonal differences. Remote Sens. 14, 3522. doi: 10.3390/rs14153522
Choi B.-J., Cho S. H., Jung H. S., Lee S.-H., Byun D.-S., Kwon K. (2018). Interannual variation of surface circulation in the Japan/East Sea due to external forcings and intrinsic variability. Ocean Sci. J. 53, 1–16. doi: 10.1007/s12601-017-0058-8
Chu P. C., Chen Y., Lu S. (1998). Temporal and spatial variabilities of Japan Sea surface temperature and atmospheric forcings. J. Oceanog. 54, 273–284. doi: 10.1007/BF02751702
Donlon C. J., Martin M., Stark J., Roberts-Jones J., Fiedler E., Wimmer W. (2012). The operational sea surface temperature and sea ice analysis (OSTIA) system. Remote Sens. Environ. 116, 140–158. doi: 10.1016/j.rse.2010.10.017
Gong D. Y., Wang S. W., Zhu J. H. (2001). East Asian Winter monsoon and Arctic oscillation. Geophys. Res. Lett. 28, 2073–2076. doi: 10.1029/2000GL012311
Guo X., Gao Y., Zhang S., Wu L., Chang P., Cai W., et al. (2022). Threat by marine heatwaves to adaptive large marine ecosystems in an eddy-resolving model. Nat. Climate Change 12, 179–186. doi: 10.1038/s41558-021-01266-5
Han I.-S., Kang Y.-Q. (2003). Supply of heat by tsushima warm current in the East Sea (Japan Sea). J. oceanog. 59, 317–323. doi: 10.1023/A:1025563810201
Hersbach H., Bell B., Berrisford P., Hirahara S., Horányi A., Muñoz-Sabater J., et al. (2020). The ERA5 global reanalysis. Q. J. R. Meteorol. Soc. 146, 1999–2049. doi: 10.1002/qj.3803
Hirose N., Kim C.-H., Yoon J.-H. (1996). Heat budget in the Japan Sea. J. Oceanog. 52, 553–574. doi: 10.1007/BF02238321
Hobday A. J., Alexander L. V., Perkins S. E., Smale D. A., Straub S. C., Oliver E. C., et al. (2016). A hierarchical approach to defining marine heatwaves. Prog. Oceanog. 141, 227–238. doi: 10.1016/j.pocean.2015.12.014
Holbrook N. J., Scannell H. A., Sen Gupta A., Benthuysen J. A., Feng M., Oliver E. C., et al. (2019). A global assessment of marine heatwaves and their drivers. Nat. Commun. 10, 1–13. doi: 10.1038/s41467-019-10206-z
Holbrook N. J., Sen Gupta A., Oliver E. C., Hobday A. J., Benthuysen J. A., Scannell H. A., et al. (2020). Keeping pace with marine heatwaves. Nat. Rev. Earth Environ. 1, 482–493. doi: 10.1038/s43017-020-0068-4
Huang B., Liu C., Freeman E., Graham G., Smith T., Zhang H.-M. (2021). Assessment and intercomparison of NOAA daily optimum interpolation sea surface temperature (DOISST) version 2.1. J. Climate 34, 7421–7441. doi: 10.1175/JCLI-D-21-0001.1
Jacox M. G., Alexander M. A., Amaya D., Becker E., Bograd S. J., Brodie S., et al. (2022). Global seasonal forecasts of marine heatwaves. Nature 604, 486–490. doi: 10.1038/s41586-022-04573-9
Jeong J. H., Ho C. H. (2005). Changes in occurrence of cold surges over East Asia in association with Arctic oscillation. Geophys. Res. Lett. 32, 85–93. doi: 10.1029/2005GL023024
Jeong Y., Nam S., Kwon J.-I., Uppara U., Jo Y.-H. (2022). Surface warming slowdown with continued subsurface warming in the East Sea (Japan Sea) over recent decades, (2000-2014). Front. Mar. Sci. 173. doi: 10.3389/fmars.2022.825368
Kim Y., Kang Y., Lee S., Jung H., Lee C., Kim S., et al. (2022). Potential impact of late 1980s regime shift on the collapse of walleye Pollock catch in the Western East/Japan sea. front. Mar. Sci. 9, 802748. doi: 10.3389/fmars.2022.802748
Kim K., Kim K.-R., Kim Y.-G., Cho Y.-K., Kang D.-J., Takematsu M., et al. (2004). Water masses and decadal variability in the East Sea (Sea of Japan). Prog. Oceanog. 61, 157–174. doi: 10.1016/j.pocean.2004.06.003
Kraus E. B., Businger J. A. (1994). Atmosphere-ocean interaction (Oxford, UK: Oxford University Press).
Lee K.-J., Kwon M., Kang H.-W. (2022). Record-breaking high temperature in July 2021 over East Sea and possible mechanism. Atmosphere 32, 17–25. doi: 10.14191/Atmos.2022.32.1.017
Lee E.-Y., Park K.-A. (2019). Change in the recent warming trend of sea surface temperature in the East Sea (Sea of Japan) over decades, (1982–2018). Remote Sens. 11, 2613. doi: 10.3390/rs11222613
Li Y., Ren G., Wang Q., You Q. (2019). More extreme marine heatwaves in the China seas during the global warming hiatus. Environ. Res. Lett. 14, 104010. doi: 10.1088/1748-9326/ab28bc
Marin M., Feng M., Phillips H. E., Bindoff N. L. (2021). A global, multiproduct analysis of coastal marine heatwaves: distribution, characteristics, and long-term trends. J. Geophys. Res.: Oceans 126, e2020JC016708. doi: 10.1029/2020JC016708
Minobe S., Sako A., Nakamura M. (2004). Interannual to interdecadal variability in the Japan Sea based on a new gridded upper water temperature dataset. J. Phys. Oceanog. 34, 2382–2397. doi: 10.1175/JPO2627.1
Miyama T., Minobe S., Goto H. (2021). Marine heatwave of sea surface temperature of the oyashio region in summer in 2010–2016. Front. Mar. Sci. 7, 576240. doi: 10.3389/fmars.2020.576240
Oliver E. C., Benthuysen J. A., Darmaraki S., Donat M. G., Hobday A. J., Holbrook N. J., et al. (2020). Marine heatwaves. Annu. Rev. Mar. Sci. 13, 1–30. doi: 10.1146/annurev-marine-032720-095144
Oliver E. C., Burrows M. T., Donat M. G., Sen Gupta A., Alexander L. V., Perkins-Kirkpatrick S. E., et al. (2019). Projected marine heatwaves in the 21st century and the potential for ecological impact. Front. Mar. Sci. 6, 734. doi: 10.3389/fmars.2019.00734
Oliver E. C., Donat M. G., Burrows M. T., Moore P. J., Smale D. A., Alexander L. V., et al. (2018). Longer and more frequent marine heatwaves over the past century. Nat. Commun. 9, 1–12. doi: 10.1038/s41467-018-03732-9
Pak G., Kim Y. H., Park Y.-G. (2019). Lagrangian Approach for a new separation index of the East Korea warm current. Ocean Sci. J. 54, 29–38. doi: 10.1007/s12601-018-0059-2
Park W.-S. (2000). Interannual and interdecadal variations of sea surface temperature in the East Asian marginal seas. Prog. Oceanog. 47, 191–204. doi: 10.1016/S0079-6611(00)00036-7
Park S., Chu P. C. (2006). Interannual SST variability in the Japan/East Sea and relationship with environmental variables. J. oceanog. 62, 115–132. doi: 10.1007/s10872-006-0038-6
Park K., Chung J. Y. (1999). Spatial and temporal scale variations of sea surface temperature in the East Sea using NOAA/AVHRR data. J. oceanog. 55, 271–288. doi: 10.1023/A:1007872709494
Park K.-A., Park J.-E., Kang C.-K. (2022). Satellite-observed chlorophyll-a concentration variability in the East Sea (Japan sea): seasonal cycle, long-term trend, and response to climate index. Front. Mar. Sci 9. doi: 10.3389/fmars.2022.807570
Park J.-E., Park K., Kang C.-K., Kim G. (2020). Satellite-observed chlorophyll-a concentration variability and its relation to physical environmental changes in the East Sea (Japan Sea) from 2003 to 2015. Estuar. Coasts 43, 630–645. doi: 10.1007/s12237-019-00671-6
Reynolds R. W., Smith T. M., Liu C., Chelton D. B., Casey K. S., Schlax M. G. (2007). Daily high-resolution-blended analyses for sea surface temperature. J. Climate 20, 5473–5496. doi: 10.1175/2007JCLI1824.1
Shimada T., Kawamura H. (2006). Satellite observations of sea surface temperature and sea surface wind coupling in the Japan Sea. J. Geophys. Res.: Oceans 111. doi: 10.1029/2005JC003345
Smale D. A., Wernberg T., Oliver E. C., Thomsen M., Harvey B. P., Straub S. C., et al. (2019). Marine heatwaves threaten global biodiversity and the provision of ecosystem services. Nat. Climate Change 9, 306–312. doi: 10.1038/s41558-019-0412-1
Smith K. E., Burrows M. T., Hobday A. J., King N. G., Moore P. J., Sen Gupta A., et al. (2022). Biological impacts of marine heatwaves. Annu. Rev. Mar. Sci. 15, 119–145. doi: 10.1146/annurev-marine-032122-121437
Son H. Y., Park W., Jeong J. H., Yeh S. W., Kim B. M., Kwon M., et al. (2012). Nonlinear impact of the Arctic oscillation on extratropical surface air temperature. J. Geophys. Res.: Atmospheres 117. doi: 10.1029/2012JD018090
Song S.-Y., Yeh S.-W., Kim H., Holbrook N. J. (2023). Arctic Warming contributes to increase in northeast pacific marine heatwave days over the past decades. Commun. Earth Environ. 4, 25. doi: 10.1038/s43247-023-00683-y
Thompson D. W., Wallace J. M. (1998). The Arctic oscillation signature in the wintertime geopotential height and temperature fields. Geophys. Res. Lett. 25, 1297–1300. doi: 10.1029/98GL00950
Thompson D. W., Wallace J. M. (2000). Annular modes in the extratropical circulation. part I: month-to-month variability. J. Climate 13, 1000–1016. doi: 10.1175/1520-0442(2000)013<1000:AMITEC>2.0.CO;2
Wang D., Xu T., Fang G., Jiang S., Wang G., Wei Z., et al. (2022). Characteristics of marine heatwaves in the Japan/East Sea. Remote Sens. 14, 936. doi: 10.3390/rs14040936
Wu L., Cai W., Zhang L., Nakamura H., Timmermann A., Joyce T., et al. (2012). Enhanced warming over the global subtropical western boundary currents. Nat. Climate Change 2, 161–166. doi: 10.1038/nclimate1353
Yao Y., Wang J., Yin J., Zou X. (2020). Marine heatwaves in china's marginal seas and adjacent offshore waters: past, present, and future. J. Geophys. Res.: Oceans 125, e2019JC015801. doi: 10.1029/2019JC015801
Yeh S.-W., Park Y.-G., Min H., Kim C.-H., Lee J.-H. (2010). Analysis of characteristics in the sea surface temperature variability in the East/Japan Sea. Prog. Oceanog. 85, 213–223. doi: 10.1016/j.pocean.2010.03.001
Yoon J.-H., Abe K., Ogata T., Wakamatsu Y. (2005). The effects of wind-stress curl on the Japan/East Sea circulation. Deep Sea Res. Part II: Top. Stud. Oceanog. 52, 1827–1844. doi: 10.1016/j.dsr2.2004.03.004
Zuo H., Balmaseda M. A., Mogensen K., Tietsche S. (2018). “OCEAN5: the ECMWF ocean reanalysis system and its real-time analysis component,” in European Centre for medium-range weather forecasts reading (UK: : ECMWF).
Keywords: SST variability, marine heatwaves, East/Japan Sea, Arctic Oscillation, oceanic dynamic adjustment
Citation: Song S-Y, Kim Y-J, Lee E-J, Yeh S-W, Park J-H and Park Y-G (2023) Wintertime sea surface temperature variability modulated by Arctic Oscillation in the northwestern part of the East/Japan Sea and its relationship with marine heatwaves. Front. Mar. Sci. 10:1198418. doi: 10.3389/fmars.2023.1198418
Received: 01 April 2023; Accepted: 13 June 2023;
Published: 28 June 2023.
Edited by:
Kyung-Ae Park, Seoul National University, Republic of KoreaReviewed by:
Yang Ding, Ocean University of China, ChinaJing Ma, Nanjing University of Information Science and Technology, China
Copyright © 2023 Song, Kim, Lee, Yeh, Park and Park. This is an open-access article distributed under the terms of the Creative Commons Attribution License (CC BY). The use, distribution or reproduction in other forums is permitted, provided the original author(s) and the copyright owner(s) are credited and that the original publication in this journal is cited, in accordance with accepted academic practice. No use, distribution or reproduction is permitted which does not comply with these terms.
*Correspondence: Sang-Wook Yeh, c3d5ZWhAaGFueWFuZy5hYy5rcg==