 Joseph J. Bizzarro
 John C. Field
 Jarrod A. Santora
 K. Alexandra Curtis3
 Brian K. Wells
95% of researchers rate our articles as excellent or good
Learn more about the work of our research integrity team to safeguard the quality of each article we publish.
Find out more
ORIGINAL RESEARCH article
Front. Mar. Sci. , 15 September 2023
Sec. Marine Ecosystem Ecology
Volume 10 - 2023 | https://doi.org/10.3389/fmars.2023.1195000
Quantifying trophic relationships of marine species is fundamental to the construction and performance of ecosystem models, development of effective ecosystem-based fisheries management strategies, and support of trait-based approaches to ecological risk assessment. Accounting for food web dynamics in taxonomically diverse ecosystems, such as the California Current Large Marine Ecosystem (CCLME), is especially challenging because of the sheer number of trophic linkages and their inherent variability. Consequently, analyses that can inform the most appropriate means of aggregating species or other taxonomic groups into assemblages or guilds are critical to reducing system complexity for modeling and management, particularly when data are limited. To provide a methodological approach that is globally applicable in such cases, we define trophic guilds within biogeographic regions of the CCLME, compare results among these regions, and discuss ecological and management implications. Within each biogeographic region, predator guilds were clearly demarcated by foraging habitat (benthic, nearshore pelagic, offshore pelagic), scale of foraging movements, and trophic position. Furthermore, trophic guilds were distinctive for each region, with species composition and the noted ecological characteristics largely driving guild structure. Predator species that are reliant on continental slope and offshore foraging habitat, such as adult Pacific Hake, have diets that are representative of these areas and are similar throughout the CCLME. Generally, larger, more mobile predators that typically feed in deeper offshore waters, including swordfish, sea lions, and sharks clustered together in multiple bioregions along the coast; all reliant primarily on fishes and squids. Throughout bioregions, groundfishes preyed on benthic invertebrates (e.g., decapods, amphipods, polychaetes), while shelf-oriented pelagic predators, including smaller salmon, preyed on pelagic invertebrates (e.g., euphausiids, copepods, gelatinous zooplankton). A large number of forage taxa that are well represented in this study have dynamics largely dependent on oceanographic conditions at a regional scale (e.g., decapods), basin scale (e.g., copepods), or a combination of both (e.g., euphausiids, Northern Anchovy). Such distinctions indicate that spatial and temporal scales of coherence of predators and prey also must be considered in development of ecosystem models and evaluation of management strategies. Our study quantifies the spatial coherence of predator guilds integrated over decades within and across bioregions of the CCLME, providing an improved understanding of regional ecosystem functioning. The analytical approach we developed may be easily extended to address similar ecological and ecosystem based fisheries management priorities in other marine regions.
Quantitative information concerning trophic relationships of marine species is fundamental to the construction and performance of ecosystem models, development of effective ecosystem-based fisheries management (EBFM) strategies, and support of emerging trait-based approaches to ecological risk assessment (Ainsworth et al., 2010; Foden et al., 2013; Livingston et al., 2017; Richards et al., 2022). Ecosystem models can augment single-species models by enabling the evaluation of a broad range of interactions and dynamics that single species models are less capable of addressing, particularly with respect to competition, predation (e.g., natural mortality), and the role of environmental variability. Failing to account adequately for trophic interactions can lead to an underestimation of overall mortality of prey species and overestimation of the potential system yield (Smith et al., 2015; Savoca et al., 2021). Additionally, ecosystems are complex and highly variable, often precluding predictability even with extensive data (Frid et al., 2006; Collie et al., 2016). Especially in regions where predator-prey dynamics are poorly understood, creative efforts are needed to estimate trophic relationships better as a basis for EBFM. Likewise, trait-based approaches can improve the power of ecological risk assessments to identify species or populations most likely to suffer adverse consequences from other anthropogenic disturbances (e.g., fishing gear interactions, climate change), supporting more effective conservation planning (Foden et al., 2013; Richards et al., 2022).
The determination of trophic guilds is one means to improve our understanding of predator-prey relationships. Guilds are functional groups of species that exploit the same type of resources in a similar way (Stroud et al., 2015). Trophic guilds are widely used in ecological literature as a representative way to summarize food habits data for large groups of species (Hargreaves et al., 2017). Ecosystem models, including Models of Intermediate Complexity (MICE), EcoPath with Ecosim, and Atlantis, also typically require consolidation of trophic information to address data limitations (Fulton et al., 2011; Punt et al., 2016). Organizing species into functional groupings can provide a more precise estimate of resource use than single-species evaluations and may improve the accuracy of ecosystem models (Yodzis and Winemiller, 1999; Metcalf et al., 2008). Guild-based food web models also can inform more comprehensive indicators or system-level analogues to more traditional single species fishery reference points. Such models can thereby be used to monitor changes in food webs and ecosystem structure as a consequence of fishing for ecosystem assessments (Gaichas et al., 2012; Sarrazin et al., 2021; Kritzer et al., 2023). The characterization of guilds also can be useful in understanding variability in structure and stability of trophic relationships across biogeographic regions (Elliot et al., 2007). By grouping species with similar resource use into guilds, well sampled guild members may serve as proxies for others that are poorly sampled in space or time, thereby addressing data gaps.
Several direct management benefits can be attained through the consolidation of predators into guilds, with direct application to EBFM and conservation planning. Management of fisheries continues to be focused on individual taxa, with advances toward EBFM being effective but rare (Skern-Mauritzen et al., 2016; Townsend et al., 2019). By considering predator taxa collectively within guilds that use similar resources, management strategies or decisions (such as the level of fishing mortality allowed on forage species) can be more readily evaluated in terms of ecosystem effects (Gaichas et al., 2011; Smith et al., 2011; Pikitch et al., 2014). Information on predator guilds can similarly be used to support more effective assessment and prioritization for management of other foraging-related impacts on threatened, endangered, and protected living marine resources (Richards et al., 2022). Further, quantifying the spatial extent of guilds provides context for evaluating the geographic footprint of environmental influences and management actions on guild members. Finally, ecosystem-based approaches require the application of indicators to consider the current state of the ecosystem and its members and to judge the success of implemented management actions (Williams et al., 2021). By consolidating predators into guilds and quantifying the importance (magnitude) of each guild to their prey taxa, assessments can be developed to better represent ecosystem function.
Food habits databases are important resources to support EBFM objectives. These databases have been compiled and used by fisheries organizations around the globe, and especially in the North Atlantic (Cook and Bundy, 2010; Pinnegar, 2014; ICES, 2022; Northeast Fisheries Science Center, 2022). Most consist of stomach contents data for commercially and ecologically important fishes, but databases containing stable isotope, fatty acid, and DNA diet data and a diverse suite of taxa throughout the food web also recently have been compiled (e.g., Scientific Committee on Antarctic Research, 2022). Robust, long-term data sets for abundant, trophic generalist species, such as Atlantic Cod (Gadus morhua; Link et al., 2009; Holt et al., 2019) are especially important because the diets of these species can reflect distribution and abundance of forage species (Link, 2004). For example, a diet database spanning nine decades (1930−2018) was compiled for the Barents Sea population of Atlantic Cod, and was used to assess temporal variability in diet composition (Pinnegar, 2014; Townhill et al., 2021). Consumption by Atlantic Cod also has been used to estimate abundance, distribution, and length frequencies of Northern Shrimp (Pandalus borealis; Lilly and Parsons, 1991) and distribution of Capelin (Mallotus villosus) (Fahrig et al., 1993) in the northwestern Atlantic. Studies that incorporate a suite of predators can further improve estimates of prey biomass (Ng et al., 2021) and can determine factors that lead to prey switching (Smith and Smith, 2020). By leveraging food habits databases to evaluate trophic relationships in a multispecies context, we can advance our understanding of food web dynamics and improve decision-making tools for resource management. Further, establishing a link between environmental conditions and ecosystem dynamics is especially important for the CCLME given the increasing variability and unpredictability of this system (Wells et al., 2017; Warzybok et al., 2018; Santora et al., 2020). To address trophic data limitations and support management objectives, we designed and created a relational database for various marine predators inhabiting the CCLME (i.e., Bizzarro et al., 2023; California Current Trophic Database, CCTD: https://oceanview.pfeg.noaa.gov/cctd/).
The goal of this study was to characterize trophic guilds for a taxonomically diverse suite of cephalopods, fishes, and marine mammals within and among recognized biogeographic regions of the CCLME by leveraging the CCTD. This effort provides a methodological approach to estimate predator-prey characteristics in limited data situations that can impart context about the spatial scale of ecosystem functionality and management. We focused our study on trophic relationships within the specified spatial context to: 1) develop a statistical approach to consolidate predators into guilds, 2) examine the spatial foraging scale of those predators, and 3) identify prey taxa that are dominant drivers of trophic guild structure and composition. We conclude by discussing the ecological and management implications of our results, and the general applicability of our approach to any marine ecosystem with sufficient trophic data.
The CCTD presently consists of 24 distinct data sets collected throughout the CCLME (with the exception of the region south of the U.S.-Mexican border) during 1967–2019, including National Marine Fisheries Service (NMFS) surveys and directed trophic studies by NMFS scientists, graduate students, and academic researchers. The CCTD contains diet composition data collected from stomach content (squids, fishes, cetaceans) and scat (pinnipeds) samples for 105,694 individuals among 143 marine predator taxa, comprising squids (n=5), elasmobranchs (n=13), bony fishes (n=118), and marine mammals (n=7). Multiple years of data are available for nearly all predator taxa, with extensive time series available for some species (e.g., California Sea Lion, Zalophus californianus; Pacific Hake, Merluccius productus; Chinook Salmon, Oncorhynchus tshawytscha). Further details concerning the development, structure, and contents of the CCTD are provided in Bizzarro et al. (In press). This analysis initially included all stomach or scat samples in the CCTD with spatial (latitude, longitude) information and taxonomic identification at the species- or subspecies-level (n=134, collectively referred to as species herein for convenience); however, only species with sufficient sample sizes, as described below, were advanced for trophic guild analysis.
The CCLME is an Eastern Boundary Upwelling System with relatively cool, nutrient-rich water transported from southern Vancouver Island to Baja California Sur, Mexico (Hickey, 1979; Hickey, 1998; Checkley and Barth, 2009). Within the confines of this study, the CCLME was divided into three biogeographic regions (Pacific Northwest, Central California, Southern California), which we refer to throughout as ‘bioregions’, based on documented faunal breaks among marine organisms, and especially fishes, at Point Conception, California (Briggs, 1974; Horn et al., 2006) and Cape Mendocino, California (Figure 1; Tolimieri and Levin, 2006; King et al., 2011; Gottscho, 2016). The faunal break at Point Conception is considered to be more distinct, largely as a result of temperature discontinuities to the north and south (Valentine, 1966; Horn et al., 2006). By contrast, the physical structure of coastal promontories off Cape Mendocino and their influence on oceanography (e.g., upwelling) cause a subtler faunal break within the same general temperature regime (Hess et al., 2011). For this reason, the Cape Mendocino region typically is included in the Oregonian biogeographic province, which extends north to Dixon Entrance at the Canada-U.S. border, whereas Point Conception marks the boundary between the Oregonian and Californian provinces (Figure 1; Horn et al., 2006). Point Conception and Cape Mendocino serve as landmarks of faunal divergence; however, they are spatially fixed and therefore do not incorporate dynamism in marine species distributions. For this reason, the southern boundary of the Oregonian Province is best described as a transition zone that spans a broad region from southern to central California (33.0°−36.3°N) (Briggs and Bowen, 2012).
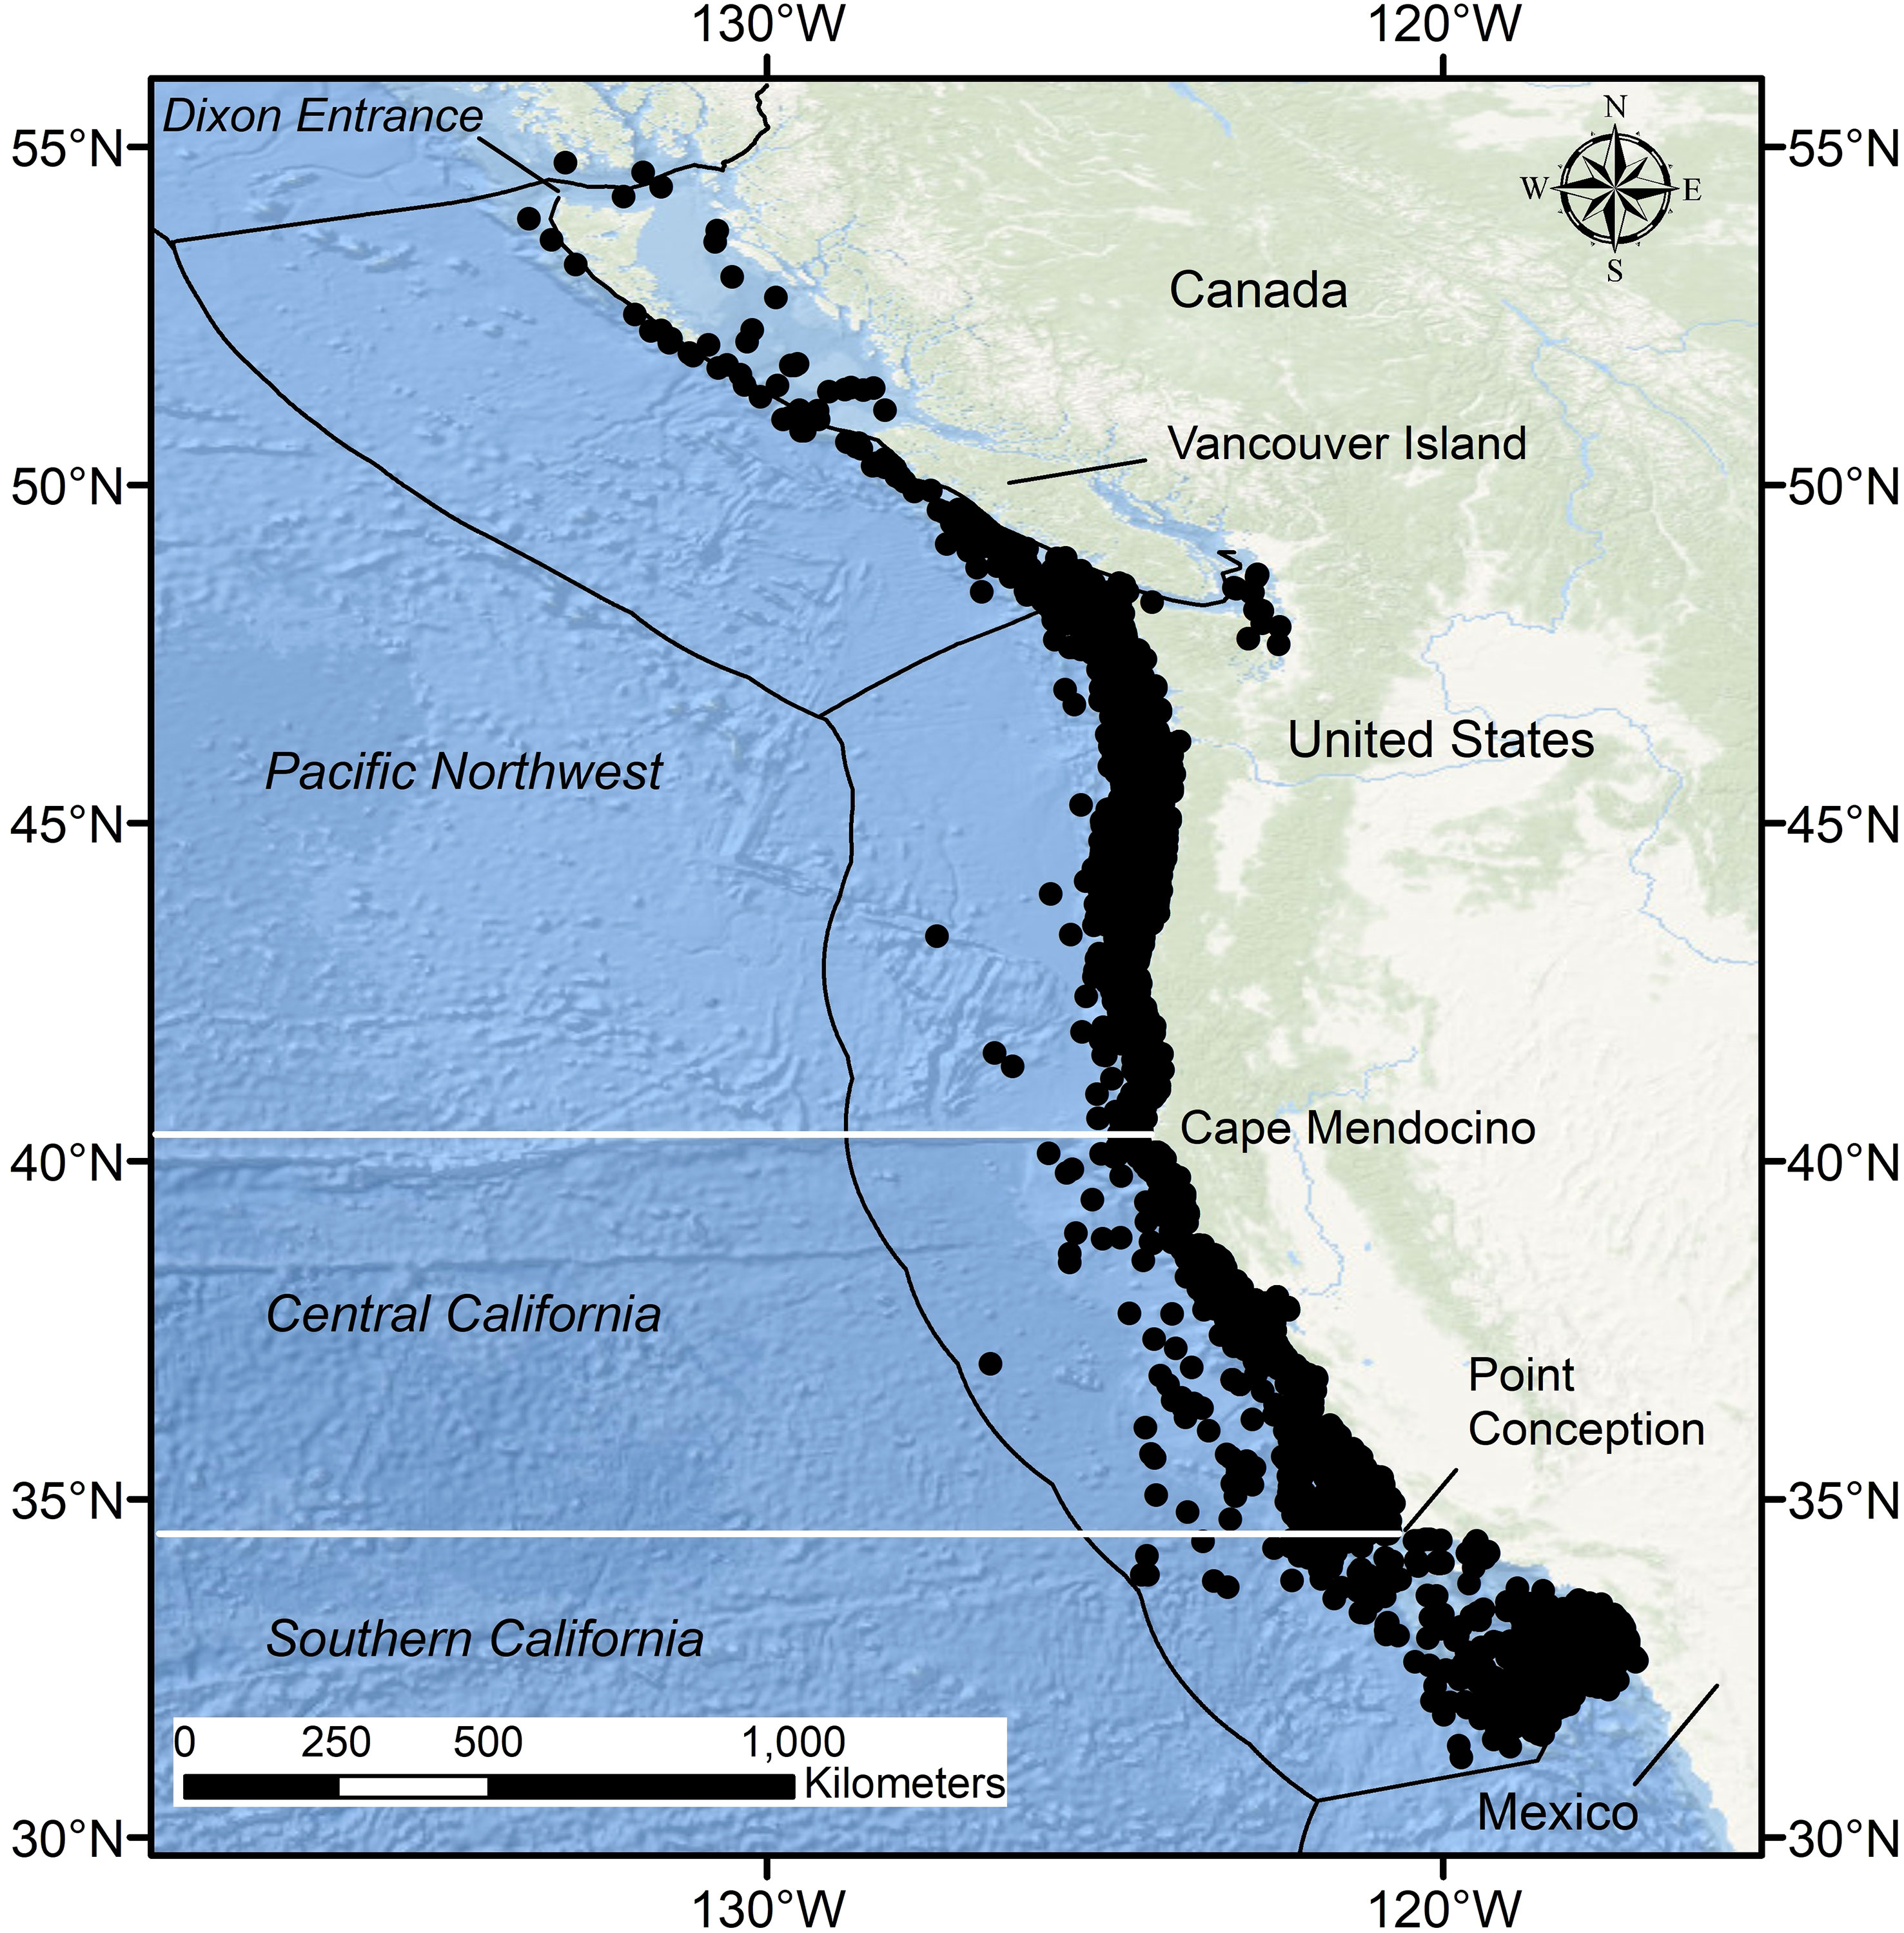
Figure 1 Locations of sample collections among bioregions within Oregonian (Pacific Northwest, Central California) and Californian (Southern California) Provinces of the greater California Current Large Marine Ecosystem. Dixon Entrance is considered the northern boundary of the Oregonian Province whereas the Californian Province extends from Cape Mendocino south to Baja California Sur. Horizontal white lines indicate boundaries between bioregions. Black lines depict national exclusive economic zone boundaries.
All predator species except pinnipeds were assigned to the bioregion in which they were sampled. Diet information for pinnipeds came from scat samples collected at haulouts and rookeries, in contrast to stomach data collected directly from individual predators. Therefore, telemetry studies were used to inform potential areas covered during foraging trips. Pacific Harbor Seals (Phoca vitulina richardii) are considered to be central-place foragers that exhibit strong spatial and temporal site fidelity and have relatively small-scale foraging movements (Suryan and Harvey, 1998; Grigg et al., 2012). Their scat samples therefore were assigned to the region where they were collected. Scat samples for Northern Fur Seals (Callorhinus ursinus) and California Sea Lions collected from the Channel Islands also largely represent central-place foraging behavior, but with larger-scale foraging movements than those of Pacific Harbor Seals. Movement patterns of Northern Fur Seals are poorly documented in the CCLME; however, the foraging region for individuals sampled at San Miguel Island, where all scats used in this study were collected, is likely divided between Central California and Southern California bioregions (Sharon R. Melin, NMFS, Alaska Fisheries Science Center, pers. comm.). Northern Fur Seal samples were therefore attributed to both bioregions. California Sea Lion diet composition data are mainly derived from adult females sampled in the Channel Islands (Melin et al., 2012a; Lowry et al., 2022). Adult females from San Clemente and San Nicolas Island typically forage within the Southern California Bight and were therefore assigned to the Southern California bioregion. Adult female California Sea Lions sampled at San Miguel Island may forage as far north as Monterey Bay (Briscoe et al., 2018; Sharon R. Melin, NMFS, Alaska Fisheries Science Center, pers. comm.). Samples from San Miguel Island consequently were assigned to both Central California and Southern California bioregions. A relatively small number (n=357) of California Sea Lion scat samples were collected from haulouts off Central California and retained in this region.
Diet composition of each species was estimated using the compound Geometric Index of Importance (GII, Assís, 1996), calculated on an individual basis with 32 generalized prey categories (Table S1). Several different prey groupings were evaluated, with the final number and composition of categories chosen to retain important sources of dietary variability at generalized taxonomic levels while minimizing redundancy among prey categories (e.g., fish, clupeid). The available metrics for each individual predator for occurrence, numerical estimates, and gravimetric estimates (volume, weight), represented as percentage values (%O, %N, %G; Hyslop, 1980), were summed and divided by the square root of the number of metrics incorporated, for example:
GII estimates then were converted to percentages to account for the potential influence of predator size and feeding behavior on prey weight and prey number, respectively, such that percent GII for prey category i of an individual predator is pGIIi = GIIi/ΣGIIi. The great majority of species (87.3%) had diet composition for all three metrics, and all species had at least occurrence and either numerical or gravimetric estimates. Comparisons of weight and volume indices among all individuals of each species with both types of data yielded highly correlated results (ρ > 0.90); therefore, volumetric data were used when weight data were unavailable. Empty stomachs and blank scat samples were excluded from calculations and analyses.
Dietary changes during growth and development are nearly universal in fishes, and indeed most marine predators more generally. In fishes and cephalopods, which constitute most of the predator species included in this study, a dietary shift also occurs with respect to the size spectrum of available prey (Gerking, 1994; Sharf et al., 2000). Determining the size or developmental stage when significant dietary shifts occur is an important but often overlooked aspect of guild analysis (Benoit et al., 2021). Classification and Regression Trees (CART) therefore were constructed for each species of predator that was consistently measured to determine if significant length-based dietary variation was evident. When multiple types of length measurements (e.g., standard length, fork length, total length for fishes) were available for a given species, we selected the one with the greatest sample size as the basis for analysis and converted other length estimates using published literature (preferentially) or with equations from FishBase (Froese and Pauly, 2022). Length data were not directly available for marine mammals because diet estimates were based on scat samples instead of stomach samples taken from sacrificed individuals.
CART analysis was conducted separately for all measured individuals of each species using the “diet” package in the software program R (Kuhnert and Duffy, 2013; R Core Team, 2020) and all prey categories that contributed > 1% to mean %GII estimates (after Kuhnert et al., 2012; Portner et al., 2017). After the contributions of rare prey categories were removed, any samples with aggregate %GII values< 50% were dropped from analysis. Ten-fold cross validation was performed on the full decision tree, which was then pruned to a size that minimized the predicted cross-validated error rate. After Breiman et al. (1984), we selected the least complex pruned tree within one standard error of the tree with the minimum cross-validation error rate (i.e., 1-standar error). Relatively large sample sizes were used as thresholds for the initial (e.g., 50% of all measured individuals) and subsequent (e.g., 25% of all measured individuals) length splits but smaller sample sizes were attempted if no decision tree was generated. The complexity parameter, which is used to control the size of the decision tree and to select the optimal tree size, was set at the default value of 0.01. If significantly different length classes were determined using this relatively conservative evaluation criteria, each was advanced for subsequent tests of sample size sufficiency (described below; e.g., smaller individuals = Chinook Salmon A, larger individuals = Chinook Salmon B). If not, data were pooled across lengths (e.g., Chinook Salmon). We refer to the resulting mixture of species-length- and species-level classes collectively as species-length classes.
Length composition of species-length classes that were included in trophic guild analysis varied within and across bioregions. In all regions, predator lengths across taxa covered similar ranges in magnitude, but representation of different size classes varied. Median length of predators collected in the Pacific Northwest with length information ranged from 11 cm fork length (FL, Chinook Salmon A) to 72 cm total length (TL, Lingcod, Ophiodon elongatus), with a minimum length of 4 cm TL for Pacific Hake and a maximum length of 112 cm TL for Lingcod (Table 1); however Pacific Harbor Seals, which were not measured, reach ~1.5-2.0 m in length. Median length of measured predators in Central California was highly variable, ranging from 8 cm FL (Chinook Salmon A) to 177 cm FL (Short-Beaked Common Dolphin, Delphinus delphis delphis) (Table 2). The smallest (Pacific Hake A, 3 cm FL) and largest (Blue Shark, Prionace glauca, 249 cm FL) measured individuals differed by more than 2 orders of magnitude. The smallest and largest median predator length were documented in Southern California. Large, pelagic species were well represented, with several species having median lengths > 100 cm (n=7) and maximum lengths > 200 cm (n=6). Additionally, unmeasured pinnipeds (Northern Fur Seal, California Sea Lion) mostly consisted of adults that reach maximum sizes > 200 cm. The Southern California region also comprised several species of small, demersal nearshore fishes (e.g., Rock Wrasse, Halichoeres semicinctus; Garibaldi, Hypsypops rubicundus) (Table 3).
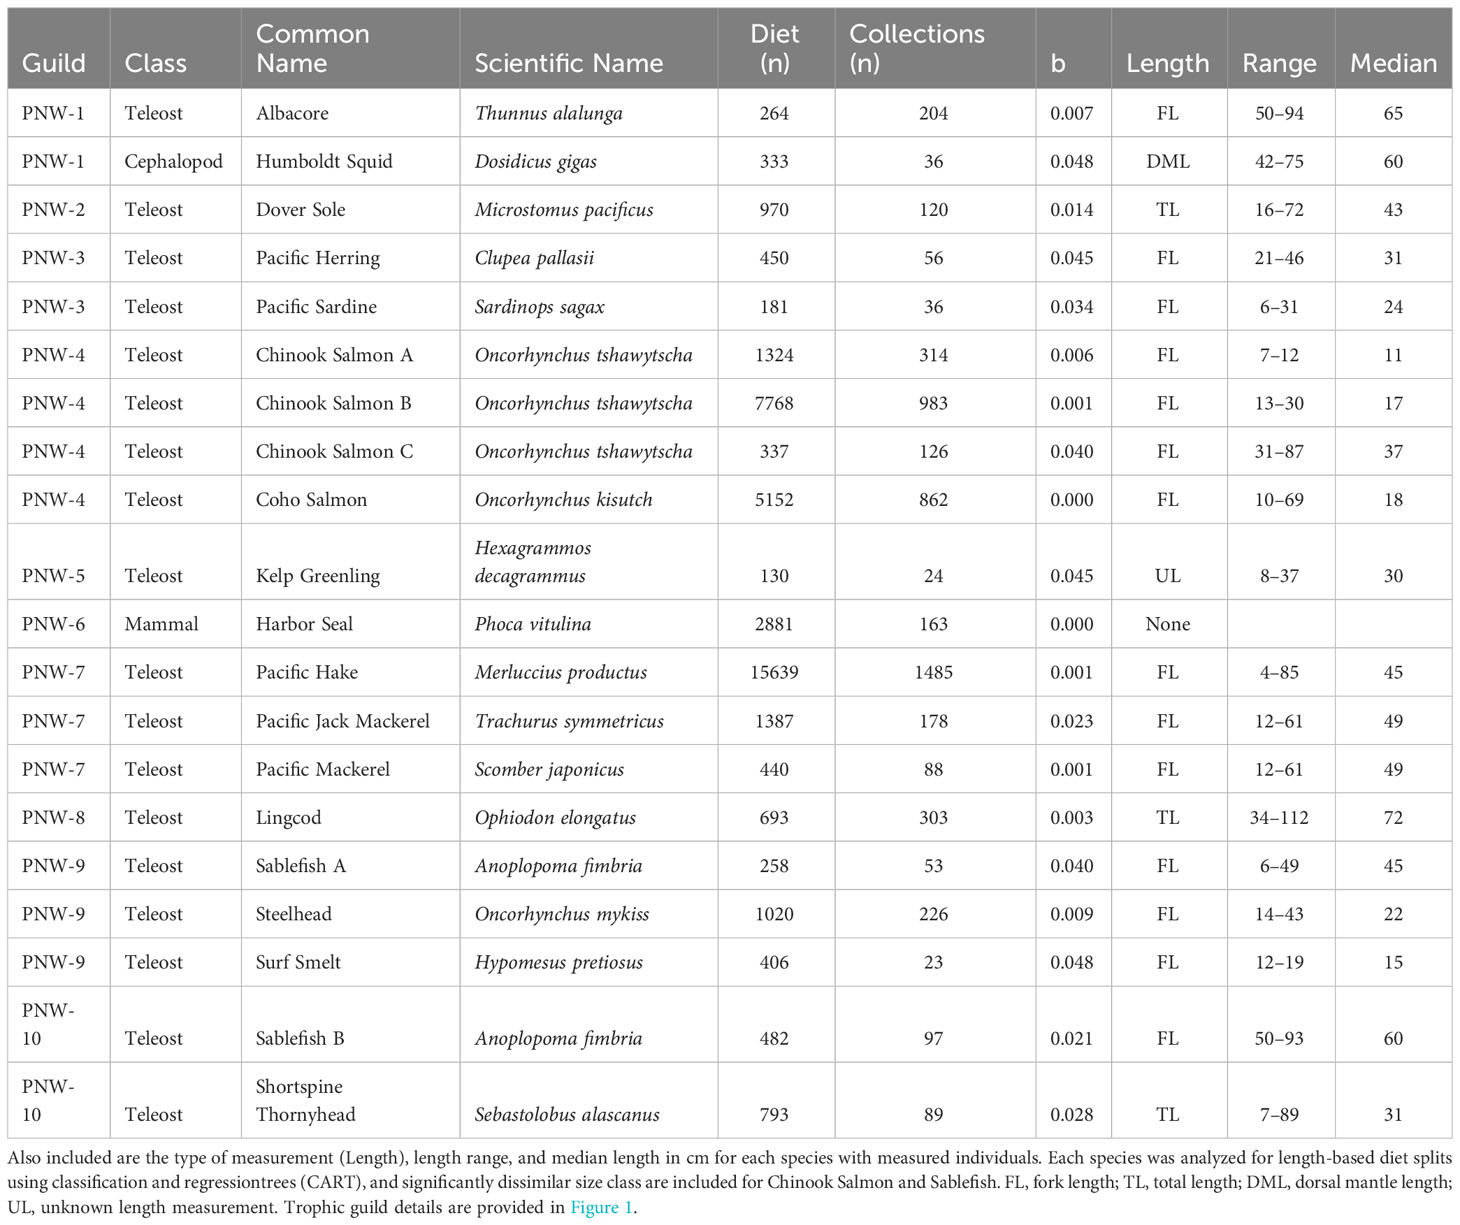
Table 1 Trophic guild (Guild), number of stomach (Cephalopods, Teleosts) or scat (Mammals) samples (i.e., Diet), and field collections (i.e., Collections) for species with sufficient sample sizes for Pacific Northwest trophic guild analysis based on regression of taxon accumulation curve endpoints (b< 0.05, see Methods for details).
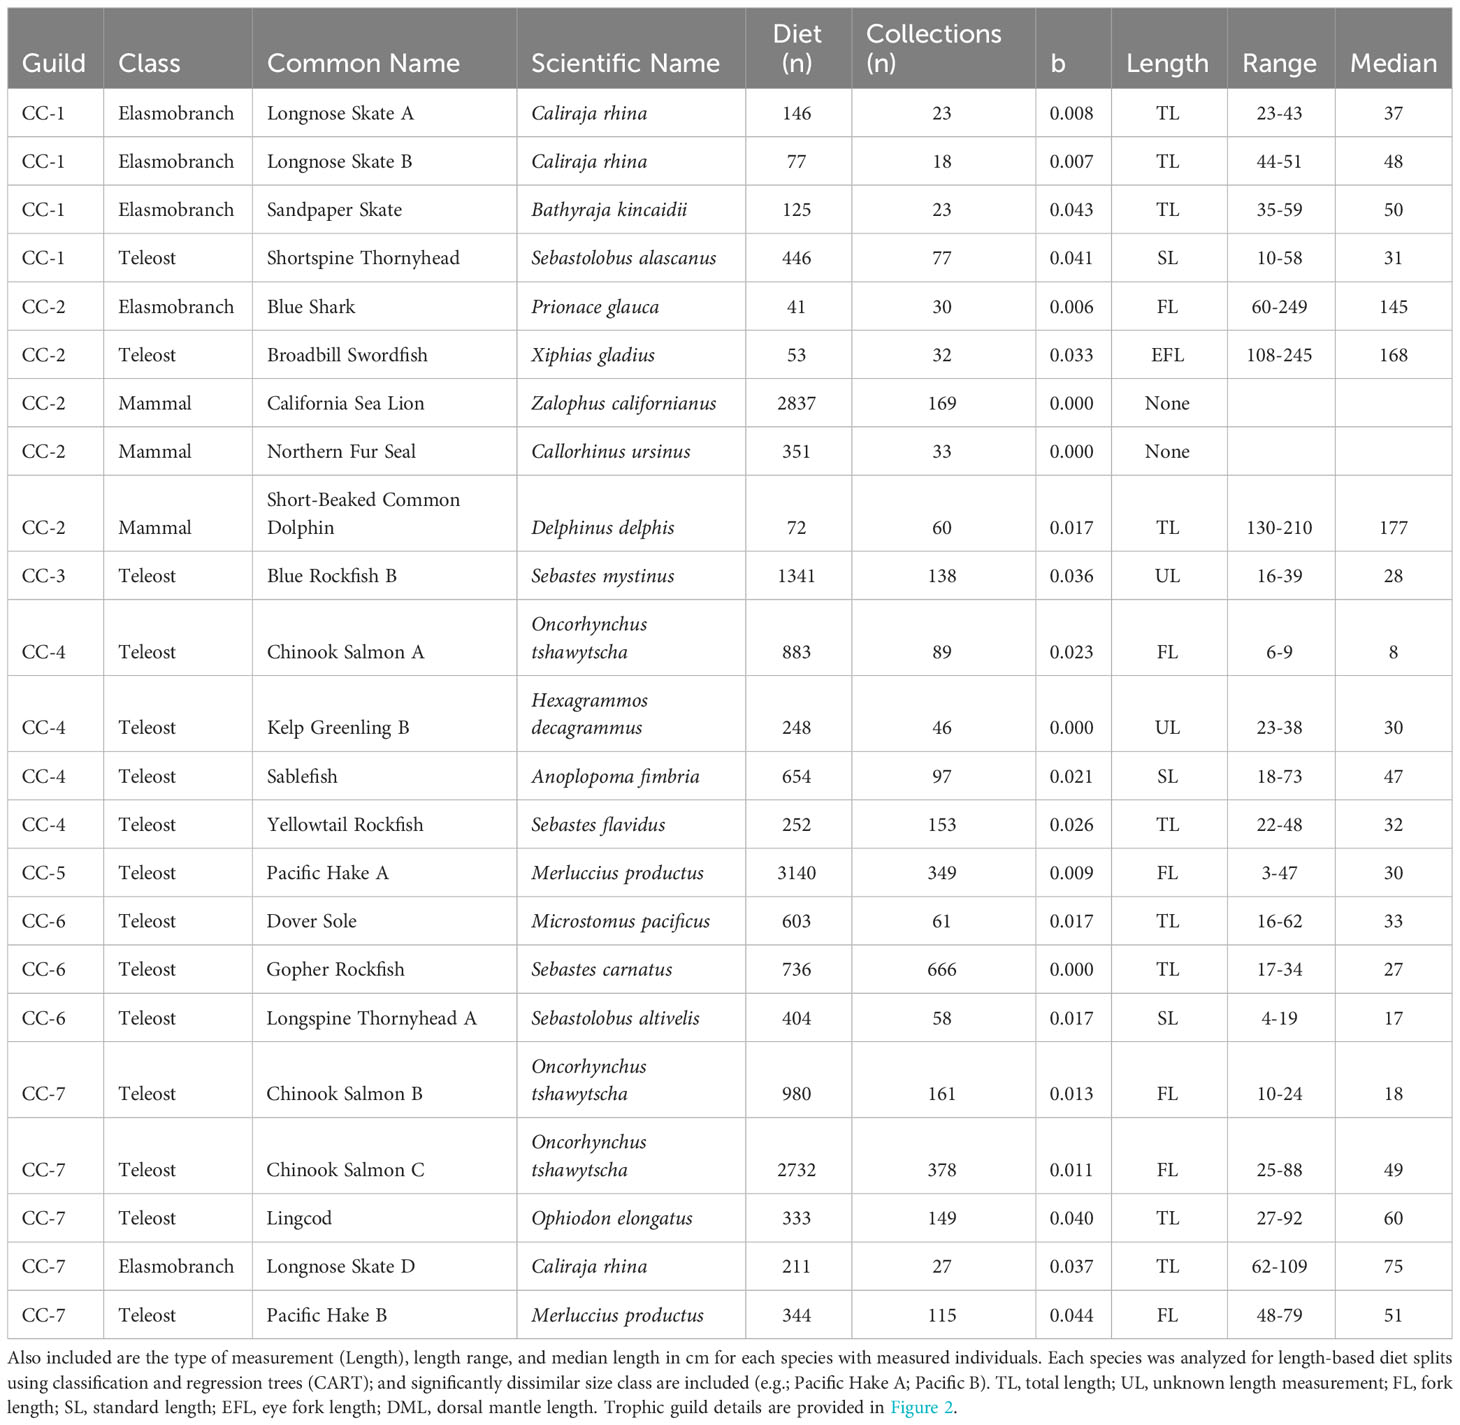
Table 2 Trophic guilds (Guilds), number of stomach (Elasmobranchs, Teleosts) or scat (Mammals) samples (i.e., Diet), and field collections (i.e., Collections) for species with sufficient sample sizes for Central California trophic guild analysis based on regression of taxon accumulation curve endpoints (b< 0.05, see Methods for details).
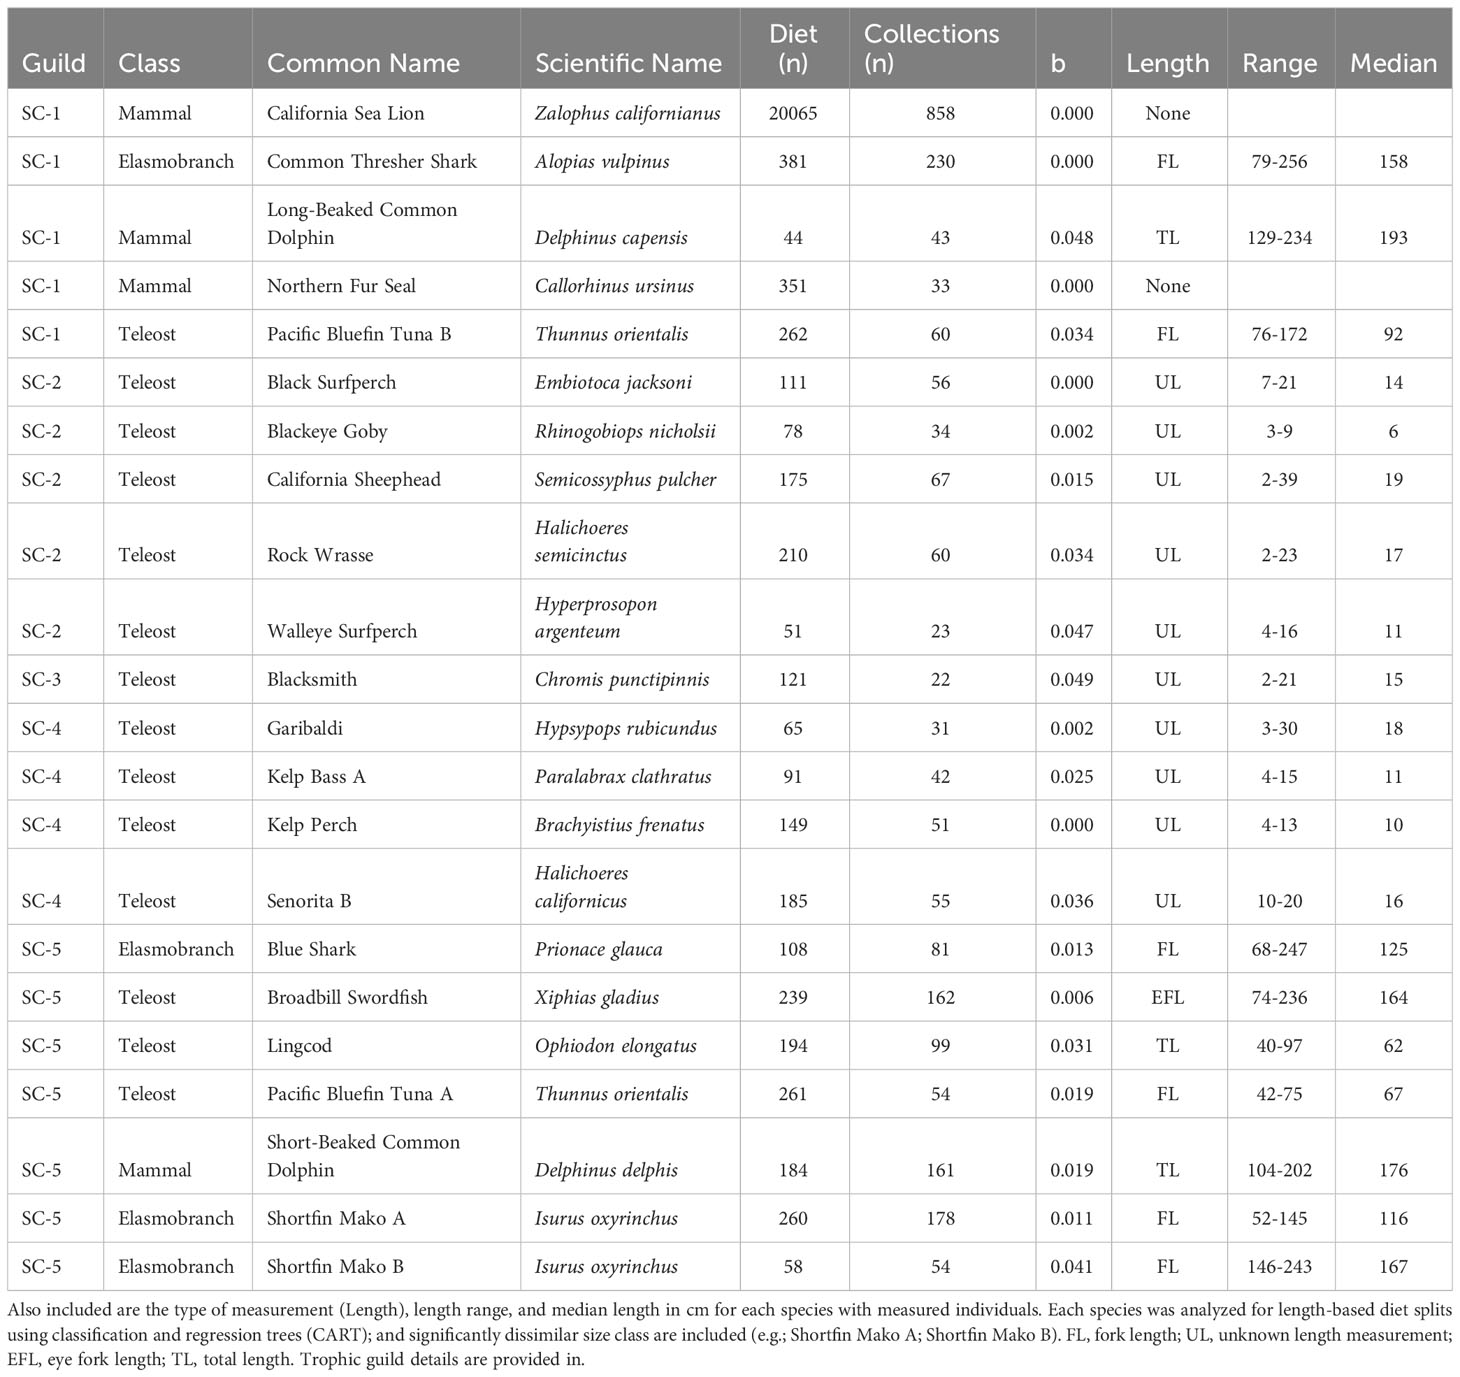
Table 3 Trophic guild (Guild), number of stomach (Elasmobranchs, Teleosts) or scat (Mammals) samples (i.e., Diet), and field collections (i.e., Collections) for species with sufficient sample sizes for Southern California trophic guild analysis based on regression of taxon accumulation curve endpoints (b< 0.05, see Methods) for details).
Sample size sufficiency was evaluated using species accumulation (i.e., rarefaction, or cumulative prey) curves (Ferry and Cailliet, 1996; Gotelli and Colwell, 2001). For this and subsequent analyses, prey data for each species were pooled by collection to avoid pseudoreplication associated with sampling multiple individuals from the same collection event (e.g., trawl catch) (Grüss et al., 2020). Any samples collected on the same date and at the same location (i.e., latitude/longitude) and depth with the same gear type constituted a collection event. We plotted the number of unique prey categories as a function of the number of randomly selected stomach or scat sample collections to determine if enough samples were collected to adequately describe the diet of each species-length class. Prey curves were generated using R (R Core Team, 2020) and the Vegan Community Ecology package (Oksanen et al., 2020). As sample size increases, the addition of new prey categories decreases until the curve approaches an asymptote, at which point it is assumed that enough samples have been collected to precisely describe the diet (Hurturbia, 1973). To objectively evaluate this criterion, a linear regression was conducted on the final four randomly selected stomach or scat sample collections following (Bizzarro et al., 2007; Bizzarro et al., 2009), who determined that the curve had reached an acceptable asymptote if the slope of the linear regression was b< 0.05. All species and species-length classes with adequate sample size were advanced for trophic guild analysis. If all length classes of a species were insufficiently sampled, data were pooled and reevaluated to determine if the aggregate data set could be used. The only criterion used to determine the inclusion of a species-length class in the predator assemblage of a bioregion was sample size sufficiency. Because their membership represents variable inclusion of species-length classes, the structure, composition, and predatory roles of trophic guilds are therefore not directly comparable across bioregions.
The number of individual samples and sample collections differed substantially among adequately sampled species-length classes and across bioregions. In the Pacific Northwest, the number of stomach or scat samples varied from 130 (Kelp Greenling, Hexagrammos decagrammus) to 15,639 (Pacific Hake), with the number of collections ranging from 23 (Surf Smelt, Hypomesus pretiosus) to 1,485 (Pacific Hake) (Table 1). Sample sizes of Central California species-length classes generally were smaller than those of the Pacific Northwest, with the number of diet samples and collections ranging from 53 to 3,140 (Broadbill Swordfish, Xiphias gladius-Pacific Hake A) and 18 to 666 (Longnose Skate, Caliraja rhina-Gopher Rockfish, Sebastes carnatus), respectively (Table 2). Sample sizes of Southern California species-length classes generally were the lowest among bioregions, except for California Sea Lion, which had disproportionately large numbers of diet samples (n=20,065) and collections (n=858) (Table 3).
We used correspondence analysis to associate species-length classes with each other and with prey groups in ordination space. Correspondence analysis, or reciprocal averaging, is an unconstrained ordination technique that compares the correspondence between samples and variables using the chi-square metric, which is appropriate for univariate, or Gaussian, relationships with environmental gradients, such as diet composition data (ter Braak, 1985). This dual scaling procedure produces an ordination plot in which samples and variables are positioned to reflect their co-dependency. Instead of maximizing the amount of variance explained by the ordination, as in principal components analysis, correspondence analysis maximizes the correspondence (i.e., inertia) between sample scores and variable scores (Digby and Kempton, 1987). Correspondence analysis can therefore be described as an eigenanalysis of a chi-square distance matrix. Correspondence analysis also disregards double-absences, which can heavily influence the Euclidean distance metric that is the basis for principal components analysis (Legendre and Legendre, 1998). For these reasons, correspondence analysis is commonly used in ecological research (van Dam et al., 2021).
Diet composition data were evaluated and modified prior to correspondence analysis to address potential biases and sensitivities. Individual-based %GII data were summed by collection, as previously described, and square-root transformed to minimize the effect of differential numbers of individuals among collections. Because correspondence analysis is sensitive to the inclusion of rare variables (Legendre and Legendre, 1998), only prey categories with ≥ 2% contribution by either frequency of occurrence or mean %GII were included. Collections with aggregate totals of< 50% GII subsequently were removed as previously described for CART analysis.
Correspondence analysis was conducted for each bioregion using all species-length classes with sufficient sample size and the vegan package in R (Oksanen et al., 2020; R Core Team, 2020). An additional correspondence analysis was generated for all species that were represented in multiple bioregions. For this comparison, all region-specific species-length class distinctions among bioregions were retained. Predator and prey loadings on the first three factorial axes were used for subsequent analysis and display. Three-dimensional ordinations were chosen because they provide greater separation among samples than two-dimensional biplots, and because use of more than three axes complicates display and interpretation. Individual sample scores from correspondence analysis were grouped by species-length classes and averaged to calculate (mean) centroids.
K-means clustering, using 3-dimensional centroid values generated from correspondence analysis, was used to group species-length classes into trophic guilds. This iterative, non-hierarchical clustering technique assigns each sample to one of k-clusters based on their nearest Euclidean distance to the mean of the clusters. K-means is the most common non-hierarchical clustering approach used in ecological research, including comparisons of resource use (Pineda-Munoz and Alroy, 2014; D’Andrea et al., 2019; Goodbody-Gringley et al., 2019). It is sensitive to outliers, which are typically removed prior to analysis (Legendre and Legendre, 1998). This bias, however, is mainly associated with analyses that contain many replicates for each group. In such cases, a few spurious points could highly influence the overall group mean. Our use of group centroids instead of individual-based correspondence analysis scores should mitigate this issue while enabling us to include all species with sufficient sample sizes in analysis.
The number of clusters (i.e., trophic guilds) for each bioregion and the overall regional comparison was determined based on evaluation of k-means cluster scree plots depicting within-cluster dissimilarity and average silhouette width. Average silhouette width is a measure of how similar an object is to its own cluster (cohesion) compared to other clusters (separation) (Rousseeuw, 1987). Average silhouette width ranges from −1 to +1, where a high value indicates that the clustering configuration is appropriate. Within-cluster dissimilarity declines monotonically as the number of clusters increases. An abrupt leveling off (i.e., elbow) to the scree plot provides an indication of the number of clusters to retain. Maximum average silhouette was the primary determinant of the number of clusters, with within-cluster dissimilarity considered supplementally.
The relative influence of prey categories on the determination of trophic guilds and differences in diet composition among guilds was evaluated to facilitate interpretation of results. The prey groups that were most influential in separating trophic guilds based on correspondence analysis were identified by 1) calculating the three-dimensional Euclidean distance among prey loadings and trophic guild centroids (sqrt[(x1-x2)2 + (y1-y2)2 + (z1-z2)2])/2), 2) taking the reciprocal of this value so that magnitude is positively related to proximity instead of distance, and 3) standardizing values on a percentage basis for each prey category. Although trophic guild analysis is useful to indicate prey groups that best separate and distinguish predator species, it does not reliably characterize diet composition among guilds. Mean %GII was therefore calculated for each member of a trophic guild and then averaged to estimate guild-specific diet composition. Prey influence and diet composition results are presented graphically for comparison with results of multivariate analyses.
Seventeen species (15 teleosts, one marine mammal, one cephalopod) had sufficient sample sizes for inclusion in Pacific Northwest trophic guild analysis (Table 1). Species comprised benthic fishes associated with nearshore (e.g., Surf Smelt, Kelp Greenling) and offshore (e.g., Shortspine Thornyhead, Sebastolobus alascanus; Dover Sole, Microstomus pacificus) habitats, pelagic species ranging from forage fishes (e.g., Pacific Herring, Clupea pallasii; Pacific Sardine, Sardinops sagax) to mid (e.g., Pacific Mackerel, Scomber japonicus; Chinook Salmon) and upper (e.g., Albacore, Thunnus alalunga) trophic level predators, and the predominantly nearshore Pacific Harbor Seal. Only two species, Chinook Salmon (A, B, and C) and Sablefish (Anoplopoma fimbria; A and B), were represented by distinct length classes indicating significant dietary shifts with increasing size (Table 1).
Six trophic guilds and four singletons were distinguished among 20 species-length classes of marine predators off the Pacific Northwest (Figure 2A). Three ordination axes explained similar percentages (CA1 = 9.8%, CA2 = 9.6%, CA3 = 7.8%, Overall=27.2%) of the total variance (inertia = 5.49). Dover Sole, Lingcod, Harbor Seal, and Kelp Greenling plotted distinctly in ordination space in proximity to echinoderms, bivalves, and polychaetes, octopus, jawless fishes and salmon, and a variety of benthic forage (e.g., gastropods, amphipods), respectively (Figures 2A, B). Guilds comprising several species were associated with euphausiids (Pacific Hake, Pacific Mackerel, Pacific Jack Mackerel) and with fish groups, decapods, and insects (Chinook Salmon A-C, Coho Salmon). Sablefish less than 50 cm FL were strongly associated with copepods and to a lesser extent, mysids and other prey (Figure 2A). Larger Sablefish were associated with a variety of benthic fauna (e.g., amphipods, isopods, decapods), reflecting different foraging habitats between intraspecific length classes. A forage fish guild (Pacific Herring, Pacific Sardine) exhibited relatively weak associations with a variety of pelagic forage. Albacore and Humboldt Squid clustered into a guild based largely on their strong correspondence with oegopsid squids.
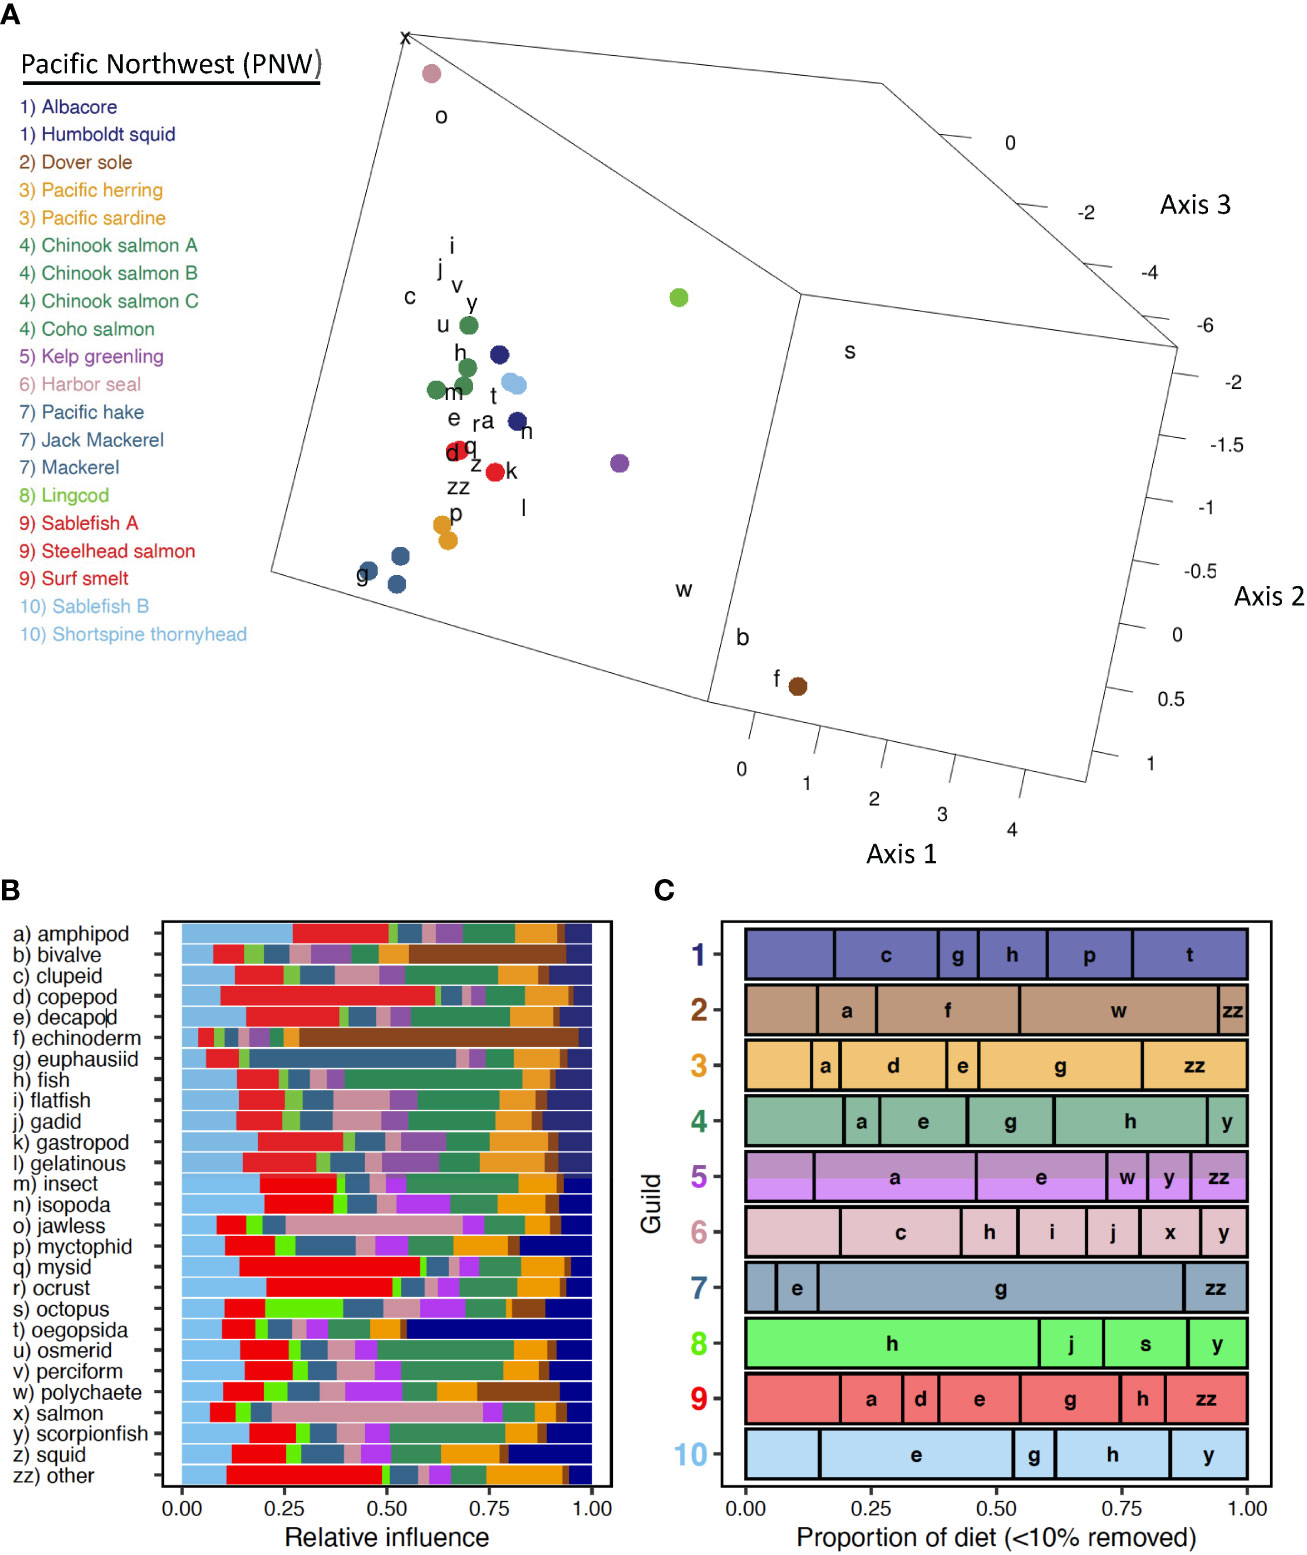
Figure 2 Pacific Northwest. (A) Centroid loadings and (color-coded) trophic guilds among 20 predator species-length groups and corresponding loadings of generalized prey categories off the Pacific Northwest based on Correspondence Analysis and K-Means Cluster Analysis of diet composition data using 32 generalized prey categories; (B) relative influence of each prey category in the diet composition of each Pacific Northwest trophic guild based on nearest neighbor analysis of prey loadings, colors correspond to those of A; (C) averaged diet composition among 10 Pacific Northwest predator guilds. Prey taxa that contributed ≥ 10% to diet composition of at least one guild are included. Prey taxa that did not meet this criterion were grouped into a catch all (minor prey) prey category.
Guild-specific diet composition estimates reflect considerable dietary differences among relatively uncommon prey groups and more subtle differences among crustacean and fish groups (Figure 2C). Consumption of echinoderms and polychaetes was greater for the Dover Sole than for other guilds. Amphipods were abundant in the diet of Dover Sole but contributed most substantially to the diet of Kelp Greenling. Cephalopod prey was poorly represented among guilds; however, oegopsid squids and octopus were important supplemental prey for the Albacore-Humboldt Squid guild and for Lingcod, respectively (Figure 2C). Among crustacean groups, euphausiids were most prominent in the guild consisting of Pacific Hake and mackerels. The forage fish guild exhibited the greatest reliance on copepods but also consumed relatively large quantities of euphausiids (Figure 2C). Decapods were eaten in low proportions among guilds but were more significant for the large Sablefish and Shortspine Thornyhead guild and for Kelp Greenling (Figure 2C). Fishes dominated the diets of Lingcod, Harbor Seal, and the Albacore-Humboldt Squid guild, and piscivory was evident in all guilds and singletons except Dover Sole. Lingcod consumed greater proportions of benthic (e.g., gadid, scorpionfish) fishes and had a higher proportion of unidentified fishes, whereas the other two guilds consumed more pelagic fishes (e.g., clupeid, salmon; Figure 2C). Other prey and aggregated minor prey groups, consisting mainly of other crustaceans and gelatinous zooplankton, contributed substantially to the diets of Sardine-Herring and Steelhead-Sablefish A-Surf Smelt guilds.
Eighteen species, comprising a somewhat more taxonomically diverse assemblage of predators (12 teleosts, three marine mammals, three elasmobranchs) than were incorporated off the Pacific Northwest, had sufficient sample sizes for inclusion in Central California guild analysis (Table 2). Most were benthic (e.g., Longnose Skate, Lingcod; Longspine Thornyhead, Sebastolobus altivelis) or bentho-pelagic (e.g., Pacific Hake; Blue Rockfish, Sebastes mystinus; Yellowtail Rockfish, S. flavidus) fishes; however, several upper trophic level pelagic predators also were included (e.g., Blue Shark, Broadbill Swordfish, California Sea Lion, Short-Beaked Common Dolphin). Six species exhibited significant length breaks by CART analysis and were represented by length classes, including three classes each of Chinook Salmon and Longnose Skate (Table 2).
Twenty-three species-length classes of elasmobranchs (n=5), teleosts (n=15), and marine mammals (n=3) were partitioned into seven Central California trophic guilds (Figure 3A). Similar proportions of inertia were explained among the first three ordination axes (CA1 = 10.2%, CA2 = 9.1%, CA3 = 7.6%), accounting for 26.9% of the overall inertia (6.64). Small Pacific Hake (Guild CC-5) and large Blue Rockfish were isolated from other guilds and singletons in ordination space and reflected associations with euphausiids and with gelatinous zooplankton and algae, respectively (Figures 3A, B). The correspondence between algae and large Blue Rockfish was pronounced, especially when compared to other guilds and singletons (Figure 3B). Two guilds of benthic mesopredators were identified. One guild consisting of Longnose Skate (A, B), Sandpaper Skate (Bathyraja kincaidii), and Shortspine Thornyhead, was most closely associated with decapods, whereas the other guild of Dover Sole, Gopher Rockfish (Sebastes carnatus), and small Longspine Thornyhead was distinguished by consumption of isopods, polychaetes, bivalves, and echinoderms (Figure 3A, B). A large guild of upper trophic level pelagic species (Guild CC-2: Blue Shark, Broadbill Swordfish, California Sea Lion, Northern Fur Seal, Short-Beaked Common Dolphin) exhibited strong correspondence with myopsid and oegopsid squid and several fish groups (e.g., Clupeiforms, Beloniformes, Argentiniforms; Figures 3A, B). Two guilds composed of a mixture of pelagic and benthic fishes, which did not group as tightly together as other guilds, reflected associations with fish groups (e.g., flatfish, scorpionfish, myctophids; Guild CC-7: Chinook Salmon B, C; Lingcod, Longnose Skate D, Pacific Hake B) and with lower trophic level forage (e.g., mysids, insects, gastropods; Guild CC-4: Chinook Salmon A, Kelp Greenling B, Sablefish, Yellowtail Rockfish). Three species were represented by multiple length classes (Longnose Skate, Chinook Salmon, Pacific Hake). Differences among length classes in guild membership were apparent (Figure 2A), indicating intraspecific length-based dietary variation.
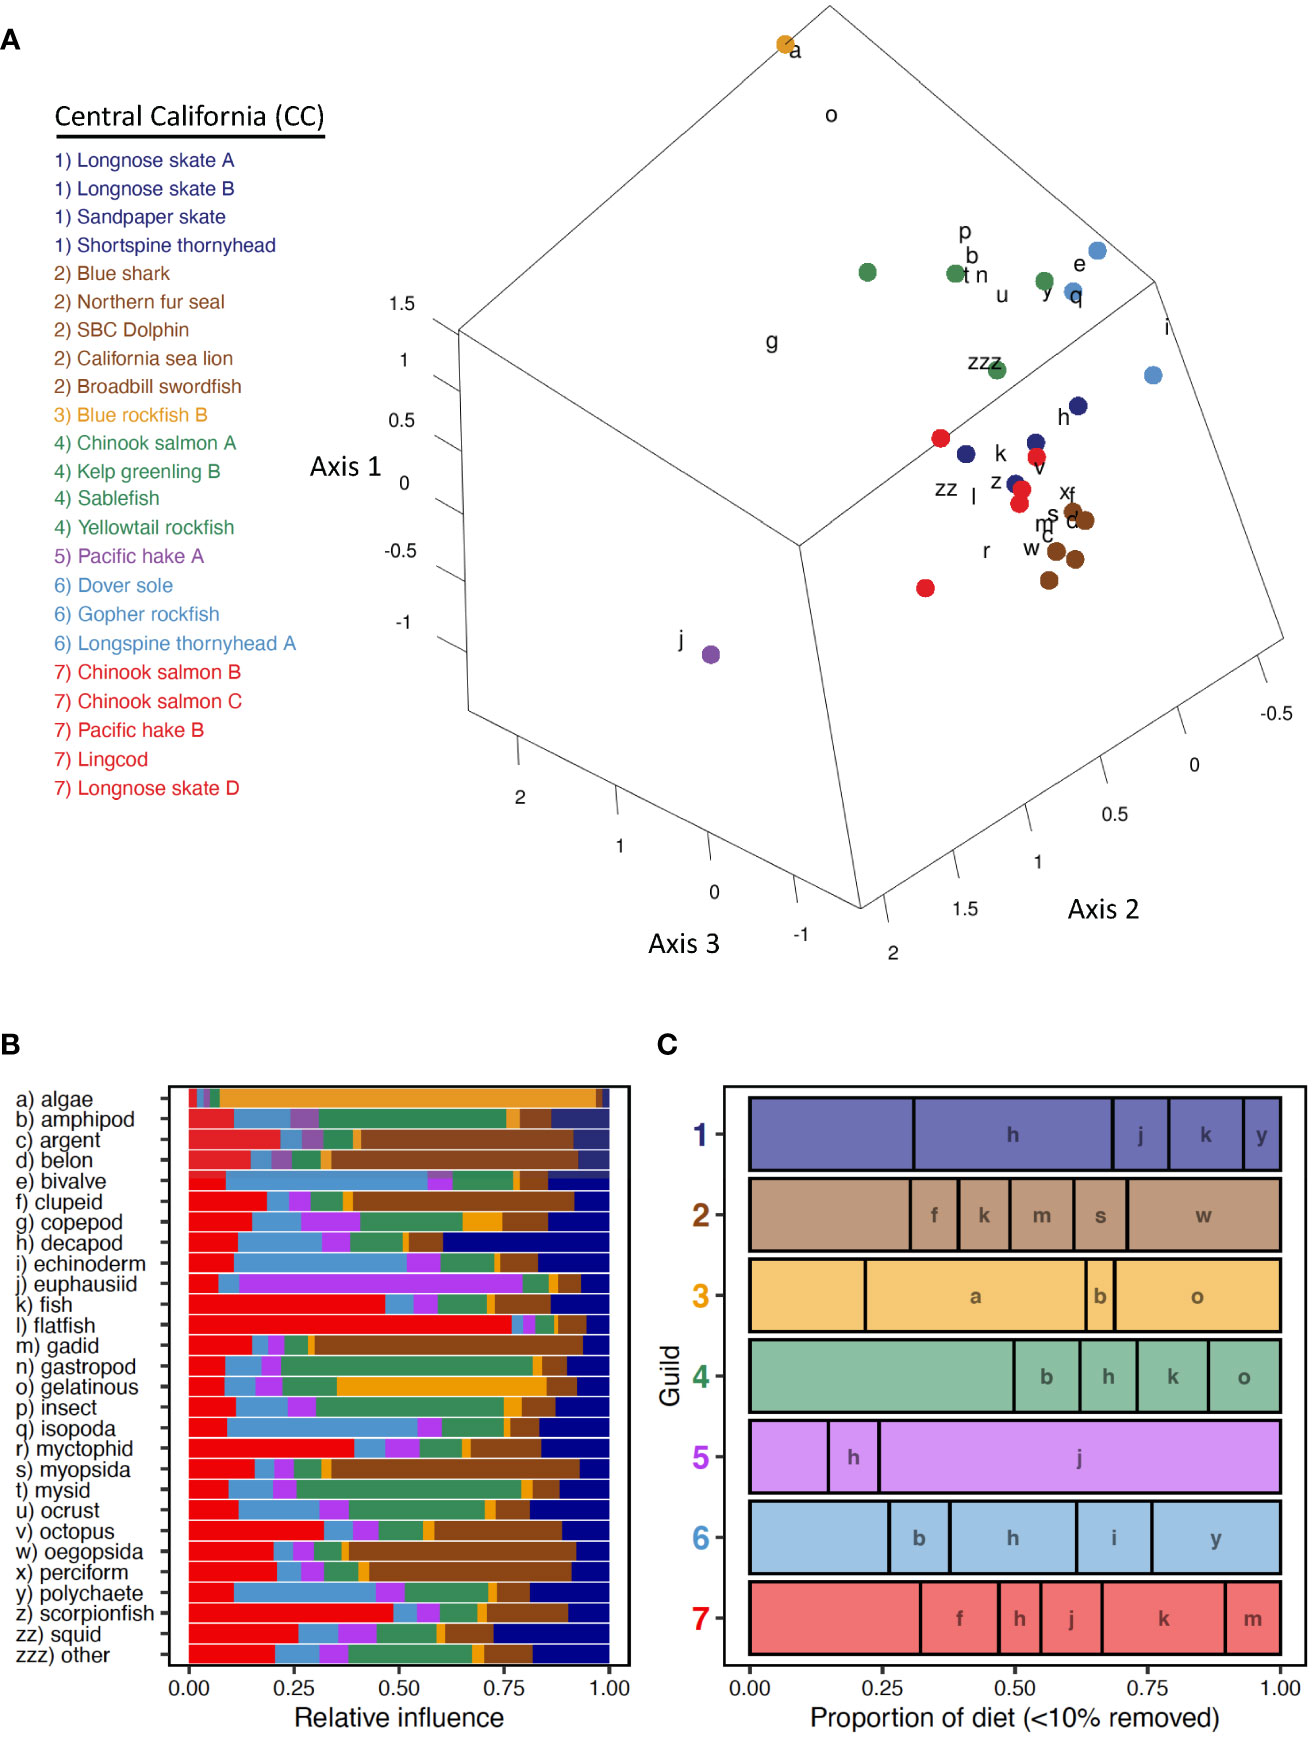
Figure 3 Central California. (A) Centroid loadings and (color-coded) trophic guilds among 23 predator species-length groups and corresponding loadings of generalized prey categories off Central California based on Correspondence Analysis and K-Means Cluster Analysis of diet composition data using 32 generalized prey categories; (B) relative influence of each prey category in the diet composition of each Central California trophic guild based on nearest neighbor analysis of prey loadings, colors correspond to those of A; (C) averaged diet composition among 7 Central California predator guilds. Prey taxa that contributed ≥ 10% to diet composition of at least one guild are included. Prey taxa that did not meet this criterion were grouped into a catch all (minor prey) prey category. Prey categories are color-coded according to general taxonomy (e.g., crustaceans=orange, red; fishes=green, blue).
Differences in diet composition were evident among Central California trophic guilds and singletons, with a high proportion of minor prey categories included (< 10%GII). The diet of the smaller size class of Pacific Hake was dominated by euphausiids, whereas euphausiids were relatively unimportant among other trophic guilds (Figure 3C). Similarly, myopsid and oegopsid squids were consumed in much greater abundance by the guild of upper trophic level pelagic predator (Guild CC-2) than by others, and algae consumption was largely restricted to large Blue Rockfish (Figure 3C). Decapods were most important to diets of skates and Shortspine Thornyhead but were consumed by all guilds and singletons except the guild of upper trophic level pelagic predators (Figure 3C). Gelatinous zooplankton were ingested in high proportions by large Blue Rockfish and were among the most important prey items in the diverse prey spectrum of the Chinook Salmon A, Kelp Greenling B, Sablefish, and Yellowtail Rockfish guild (Figure 3C). Consumption of polychaetes and echinoderms was prevalent in the benthic guild consisting of Dover Sole, Gopher Rockfish, and small Longspine Thornyhead (Figure 3C). Clupeids, gadids, and unidentified fishes were consumed in relatively high proportions by the guild of upper trophic level pelagic predators (Guild CC-2) and the more piscivorous guild of benthic and pelagic fishes (Guild CC-7) (Table 2, Figure 3C). The diet of the other guild of benthic and pelagic fishes (Guild CC-4) was highly diverse and comprised a 42.8% contribution by minor prey categories, especially insects (8.7%), other crustaceans, other (7.7%), and scorpionfishes (5.5%).
Southern California included the most species among bioregions (n=20) and had a similar taxonomic composition as the Central California region (13 teleosts, four marine mammals, three elasmobranchs) (Table 3). The available fauna for analysis, unlike that of other regions, was dominated by pelagic, upper trophic level predators (e.g., Shortfin Mako, Isurus oxyrinchus; Pacific Bluefin Tuna, Thunnus thynnus; Northern Fur Seal) and benthic and benthopelagic kelp-forest fishes (e.g., California Sheephead, Semicossyphus pulcher; Kelp Bass, Paralabrax clathratus; Señorita, Oxyjulis californica). Length classes were included for four fishes but only two of them (Pacific Bluefin Tuna, Shortfin Mako) were represented by more than one class (Table 3).
Five trophic guilds were characterized among 22 species-length classes of fishes and marine mammals in Southern California (Figure 4A). Three CA axes explained 34.4% of the total inertia (4.04). Most of this total was associated with CA1 (19.9%), with similar proportions explained by CA2 (7.7%) and CA3 (6.9%). Three main groupings were evident in ordination space, consisting of upper trophic level pelagic species (with the exception of Lingcod), nearshore kelp-bed species, and Blacksmith (Figure 4A). Two pelagic guilds (Guild SC-1, Guild SC-5, Table 1), each composed of a mix of elasmobranchs, teleosts, and marine mammals, separated based on differential associations with fish and cephalopod prey groups (Figures 4A, B). Length classes of Mako Shark grouped together with small Bluefin Tuna (Guild SC-5), whereas large Bluefin Tuna were included separately in Guild SC-1 (Figure 4A). One of two guilds of nearshore mesopredators was strongly associated with a variety of benthic forage (e.g., bivalve, amphipod, polychaete) and algae (Guild SC-2, Table 3) whereas the other guild corresponded to a diet of mysids and other crustaceans (Guild SC-4, Table 3, Figures 3A, B). The diet of Blacksmith, dominated by gelatinous zooplankton and copepods, was distinct from that of other guilds (Figures 4A, B).
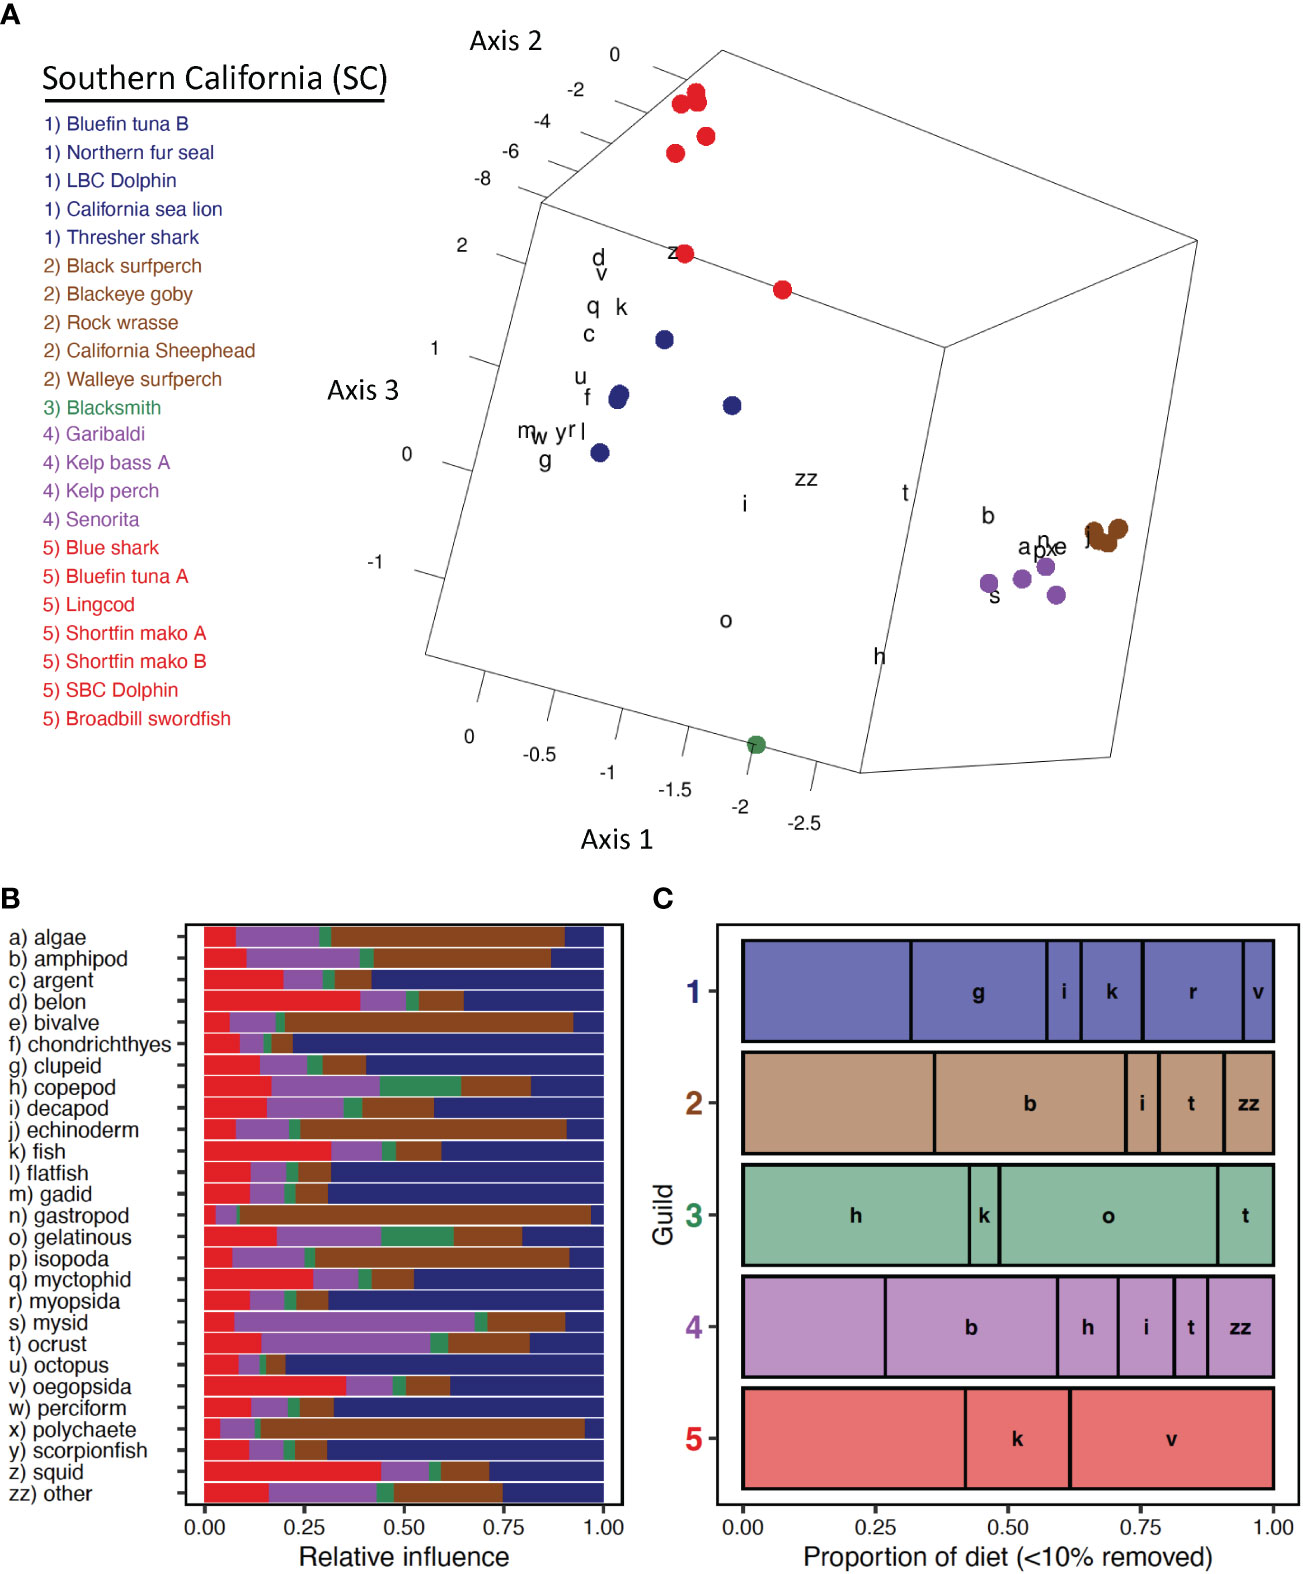
Figure 4 Southern California. (A) Centroid loadings and (color-coded) trophic guilds among 22 predator species-length groups in Southern California and corresponding loadings of generalized prey categories based on Correspondence Analysis and K-Means Cluster Analysis of diet composition data using 32 generalized prey categories; (B) relative influence of each prey category in the diet composition of each trophic guild based on nearest neighbor analysis of prey loadings, colors correspond to those of A; (C) averaged diet composition among 5 predator guilds. Prey taxa that contributed ≥ 10% to diet composition of at least one guild are included. Prey taxa that did not meet this criterion were grouped into a catch all (minor prey) prey category. Prey categories are color-coded according to general taxonomy (e.g., crustaceans=orange, red; fishes=green, blue).
Interguild dietary variability reflected foraging habitats of constituent members and their relative separation in ordination space. Two trophic guilds of mostly upper trophic level pelagic predators were distinguished. Guild SC-1, consisting of California Sea Lion, Common Thresher Shark, Long-Beaked Common Dolphin, Northern Fur Seal, and large Pacific Bluefin Tuna, consumed relatively high proportions of nearshore squids (myopsids), clupeids, and gadids (Figure 4C). Guild SC-5, comprising Blue Shark, Broadbill Swordfish, Lingcod, small Pacific Bluefin Tuna, Short-Beaked Common Dolphin, and small and large Shortfin Mako, reflected more oceanic foraging patterns, with relatively high proportions of offshore squid (oegopsid), unidentified fishes, and beloniforms. Diet composition of nearshore kelp bed fish guilds (Guild SC-2, Guild SC-4, Table 3) was similar, reflecting small proportional differences among crustacean groups, the incorporation of minor amounts of gelatinous zooplankton in Guild SC-4, and differential use of several minor prey groups (e.g., algae, bivalves, echinoderms) (Table 3, Figure 4C). Diet composition of Blacksmith was composed largely of similar amounts of gelatinous zooplankton and copepods (Figure 4C).
Eleven species, comprising 29 species-length classes, were represented in multiple bioregions. Teleosts were the dominant predator group (n=8 species) with marine mammals (California Sea Lion, Short-Beaked Common Dolphin) and elasmobranchs (Blue Shark) also included. Only one species (Lingcod) had sufficient sample sizes to enable representation for all three bioregions. Nearly half of the species and species-length classes included in regional comparisons were from Central California (n=14). Southern California species-length classes (n=5) were relatively underrepresented compared to those from the more northern bioregions.
Among species with representation in multiple bioregions, trophic guild composition was largely driven by intraspecific dietary similarity, with secondary distinctions evident by length and habitat (Figure 5A). Bioregion appeared to have little influence on guild structure relative to these factors. For example, of eight guilds, half comprised single species. Additionally, nine of the eleven species used in biogeographic guild analysis were limited to a single guild. Exceptions were evident for Pacific Hake and Chinook Salmon and associated length categories, which were included in multiple trophic guilds (Figure 5A). Four upper trophic level pelagic species (Blue Shark, Broadbill Swordfish, Short-Beaked Common Dolphin, California Sea Lion), consisting of two length classes each from Central and Southern California, formed a distinct guild that was strongly associated with a variety of fish and cephalopod groups (Figures 5A, B). The smallest length classes of Chinook Salmon from the Pacific Northwest and Central California formed a guild associated with copepods and insects. Medium length classes of Chinook Salmon from these regions were incorporated into different guilds. Stronger correspondence to fish groups and differential use of primarily crustacean forage (e.g., euphausiids, decapods) distinguished the largest length group of Central California Chinook Salmon from medium sized Chinook Salmon in both regions and from large individuals in the Pacific Northwest (Figures 5A, B). Pacific Hake from the Pacific Northwest and individuals< 48 cm FL from Central California corresponded much more strongly with euphausiids than larger Pacific Hake individuals from Central California (Figures 5A, B).
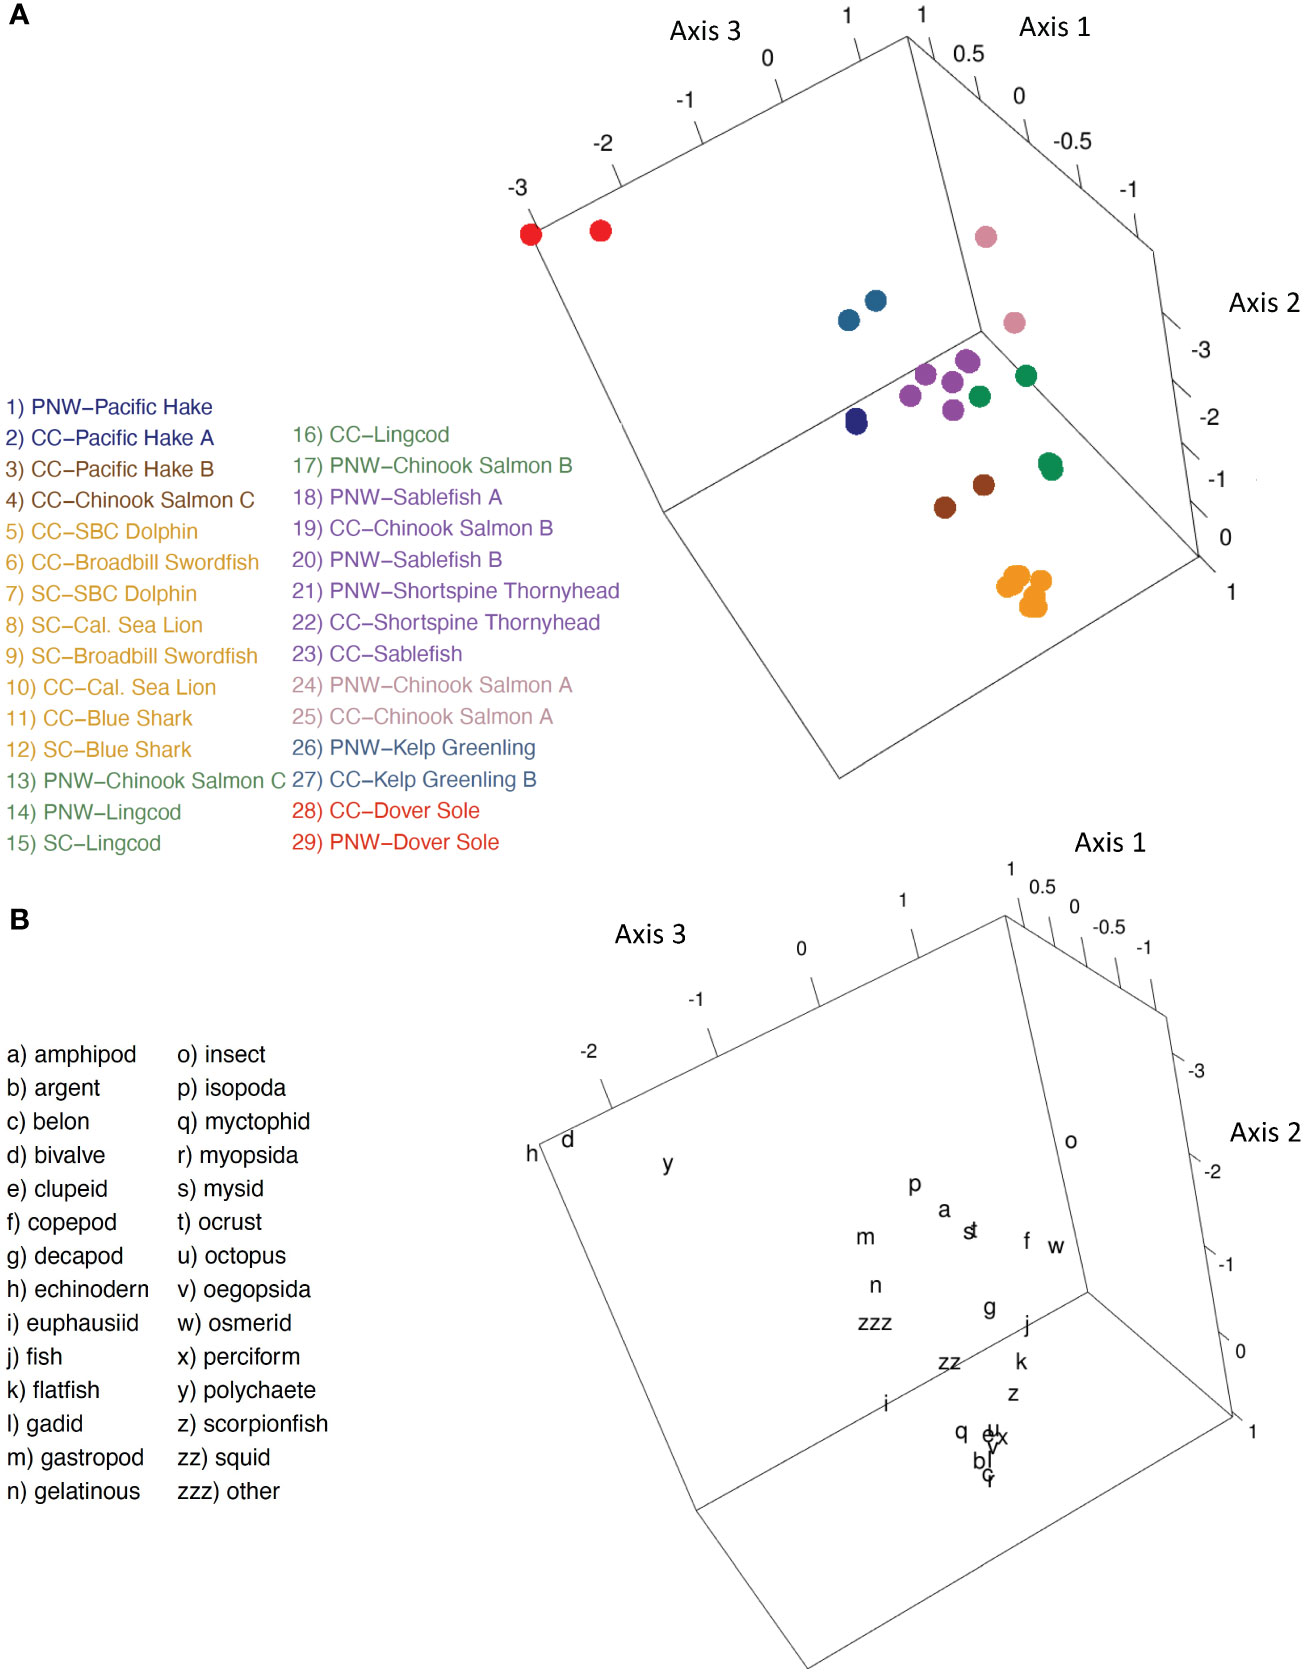
Figure 5 Regional Comparison. (A) Centroid loadings and (color-coded) trophic guilds among 29 predator species-length groups that are represented in at least two bioregions based on Correspondence Analysis and K-Means Cluster Analysis of diet composition data using 32 generalized prey categories; (B) corresponding loadings of generalized prey taxa.
Regional comparisons indicated spatial consistency in diets of benthic-oriented fishes and highly mobile, upper trophic level predators, but greater spatial variability among length classes of Chinook Salmon and Pacific Hake. A guild consisting of four upper trophic level pelagic predators that mainly foraged offshore had spatially consistent diets between Central California and Southern California Bight. Additionally, predators within this guild grouped closely relative to those of other guilds (Figure 5A). Shelf-foraging Chinook Salmon, however, exhibited stronger size-based variation in guild membership than region-based variation (Figure 5A). For instance, relatively small Chinook Salmon from Central California and the Pacific Northwest formed their own guild, and medium-sized Chinook Salmon also grouped together in a separate guild (Figure 5A). The largest size classes of salmon from these regions exhibited different guild membership, although size composition was similar (Tables 1, 2). Evidence for Pacific Hake, which exhibit annual latitudinal migrations, daily vertical migrations, and increasing mobility with size, was inconclusive because of different length groupings between regions. Specifically, two length classes of Pacific Hake from Central California and another pooled length population of Pacific Hake were divided between two guilds (Figure 5A). Additionally, benthic species with relatively limited foraging movements, largely grouped together regardless of region, including single-species groups (i.e., Kelp Greenling, Dover Sole, Lingcod).
We quantified guild structure and composition for a diverse array of predators based on diet composition data within bioregions of the CCLME. Within each region, predator guilds were demarcated by foraging habitat (benthic, nearshore pelagic, offshore pelagic), scale of foraging movements, and trophic position. Furthermore, trophic guilds were distinctive for each bioregion, with species composition and the described ecological characteristics largely driving guild structure. Though our outcomes are driven by the timing and location of predator sampling collections and the predators included in the analysis, our trophic guild characterization provides a rigorous basis for parameterizing and evaluating food web or ecosystem models of the CCLME, and for developing appropriate management strategies. The methodology developed here can also be applied to similar ends in other systems with sufficient trophic data.
As EBFM and assessment needs grow, appropriately parameterized models informed by process-oriented studies are needed to support management strategy evaluations and to better understand uncertainty of their outcomes (Collie et al., 2016; Townsend et al., 2019; Koehn et al., 2020). However, data on spatiotemporal variability in trophic interactions are sparse and often a limiting aspect of model development, validation and application (Coll et al., 2016; Collie et al., 2016). Our motivation behind developing regional trophic guilds is to provide direction for simplifying and populating ecosystem models with quantified guilds to reduce limitations associated with individual taxa and trophic data. Our results are also more broadly applicable to reducing system complexity to inform monitoring and management.
In the CCLME, we are fortunate that several long-term ecosystem monitoring studies have quantified the spatiotemporal variability of forage taxa and associated biophysical drivers within and among bioregions. Ralston et al. (2015) showed that the relative abundance and species composition of the micronektonic forage assemblage off central California in late Spring varies substantially over time in response to variability in transport and productivity regimes, with different groups of forage taxa responding more or less synchronously to ecosystem drivers from year to year. Thompson et al. (2019) demonstrated that offshore and slope forage taxa such as clupeids and engraulids that synchronously vary in abundance and availability with large-scale oceanographic conditions are spatiotemporally coherent throughout the CCLME. In contrast, small pelagic taxa are more restricted and reliant on local conditions, and are coherent at the bioregional scale (Friedman et al., 2018). Friedman et al. (2018) and Auth et al. (2018) similarly demonstrated that shelf forage species assemblages, inclusive of juvenile flatfishes, smelt, and juvenile rockfishes, are consistent at the scale of the bioregion, and that their availability is tied to local temperatures and upwelling productivity and transport. Assessment of the role of basin-scale and regional environmental conditions on biodiversity of coastal pelagic species and juvenile groundfish taxa highlights the importance of regional ecosystem shifts due to compression of thermal habitat (Santora et al., 2020; Schroeder et al., 2022). Our study contextualizes this knowledge base by quantifying the spatial coherence of predator guilds integrated over decades of diets sampled within and across bioregions, providing an improved understanding of regional ecosystem functioning that may be easily extended to modeling studies and management strategies to address uncertainties surrounding novel ecosystem management problems.
Pelagic predator species that are mobile and reliant on continental slope and offshore foraging habitats have diets that are representative of these areas, and typically have similar diets across the CCLME. Large-scale oceanographic processes, such as ENSO or PDO, should be considered dominant drivers of variability when constructing food web or ecosystem models involving such species. Samples from the Pacific Northwest indicate Pacific Hake and Jack Mackerel represent a guild that is distinguished by relatively high consumption of euphausiids, typically available along the outer continental shelf and slope (Buckley and Livingston, 1997; Emmett et al., 2006). Migratory guilds observed in Central California demonstrate similar patterns to the Pacific Northwest region. Namely, larger Pacific Hake rely on a suite of juvenile groundfish (e.g., flatfish), other small pelagic prey, and euphausiids whereas smaller Pacific Hake feed predominantly on euphausiids. Across the CCLME, larger Pacific Hake in Central California and those in the Pacific Northwest grouped together whereas smaller Pacific Hake in Central California aligned with a different trophic guild. Therefore, the migratory fraction of Pacific Hake is eating similarly throughout the CCLME (Dorn, 1995). Some large, mobile predator species group together both among and across regions, including Short-Beaked Common Dolphin, Blue Shark, and Broadbill Swordfish. In contrast, the association of another major pelagic predator, California Sea Lion, varies by region, grouping with a less oceanic guild of predators in Southern California that also includes Common Thresher Shark, Long-Beaked Common Dolphin, Northern Fur Seal, and large Pacific Bluefin Tuna. Nevertheless, at the system-wide scale, California Sea Lion groups with the other large pelagic predators. It is unclear whether the separation of large pelagic predators into two guilds in Southern California is due to a larger number of predator species allowing finer distinctions, or to a shift in available prey resulting in greater diet differentiation. The former seems more likely, given how closely large pelagic predators group in the cross-region biplot. This grouping also suggests similar feeding habits for these predators over both southern and Central California regions on a diverse array of pelagic prey, including gadids, perciforms, beloniforms, clupeids, myopsid squid, and oegopsid squid (e.g., Melin et al., 2012a; Preti et al., 2012; Thompson et al., 2019; Lowry et al., 2022).
Benthic and demersal fishes and pelagic fishes foraging on the shelf had diets representative of prey species availability at the bioregional scale. Therefore, regional-scale oceanographic drivers (e.g., upwelling) and models should be considered rather than ecosystem-wide models for these species, and ecosystem monitoring and management must be scaled appropriately. These predators mainly split into guilds based on established differential use of invertebrates. For example, off Central California, groundfishes such as large Kelp Greenling, Yellowtail Rockfishes, and large Sablefish formed a guild of bentho-pelagic foragers (Laidig et al., 1997; Chiu et al., 2021), whereas more benthic-oriented groundfishes exhibited a strong reliance on decapods (i.e., Sandpaper Skates, small and medium-sized Longnose Skates, Shortspine Thornyhead; Buckley et al., 1999; Bizzarro et al., 2007) or consumed a diverse variety of benthic invertebrates (i.e., Dover Sole, Longspine Thornyhead, Gopher Rockfish; Buckley et al., 1999; Loury et al., 2015). Groundfishes did not always form distinct guilds within bioregions, sometimes grouping with other types of fishes. For instance, Juvenile Chinook salmon off Central California also associated with the first groundfish guild, indicative of a similar bentho-pelagic foraging behavior and the influence of general prey categories (e.g., decapods, fishes) that artificially inflated interspecific dietary similarity. Two more guilds off Central California consisted of a mixture of benthic and pelagic fishes that also grouped largely because of shared generalized prey groups. In contrast, dietary differences among predators were much more pronounced for the Southern California predators, with kelp forest fishes forming three guilds that were highly distinct from the larger, upper-trophic level pelagic species of this region. Length-based shifts from crustaceans and other invertebrates to fishes are commonly reported among groundfishes and salmonids, including Sablefish (Laidig et al., 1997; Buckley et al., 1999), skates (Bizzarro et al., 2007; Wetherbee et al., 2012), and salmon (Miller and Brodeur, 2007; Daly et al., 2009). In this study, intraspecific species-length classes often were associated with different guilds within bioregions. In comparisons among bioregions, however, groundfishes grouped by species regardless of length-classes. In total, these findings suggest shelf and benthic-oriented predators are more reliant on variability at the bioregional scale and management should make choices with this consideration.
Ubiquitous forage taxa were particularly important for a variety of established guilds and individual predators. Euphausiids represent an important forage taxon across the Pacific Northwest and off Central California, specifically for Pacific Hake, salmon, and Jack Mackerel. As diets of large Pacific Hake are generally coherent across the CCLME, variability in krill abundance and distribution may result in variability in Pacific Hake dynamics including growth, migration, and foraging patterns (Dorn, 1995; Buckley and Livingston, 1997). Decapods were particularly important to groundfishes (e.g., Sablefish, Shortspine Thornyhead, skates, Kelp Greenling) and salmon off the Pacific Northwest and Central California. These predator diets were generally coherent at the bioregional scale; therefore, it is likely that variability in decapod availability reflects locally spawning adults and environmental conditions, and that regional environmental variability affects trophic interactions that depend on decapods (Hannah, 1995; Draper, 2022). Clupeids were a particularly important forage group off the Pacific Northwest, supporting highly mobile predators including Humboldt Squid and Albacore. Interestingly, clupeid dynamics, especially in recent years, are typically consistent across the CCLME such that the response of clupeids in the south to forcing is ultimately likely to be observed in the north (Fiechter et al., 2015; Thompson et al., 2019). In the Southern California region, important diet items of large, mobile predators were indicative of their nearshore (e.g., myopsida, clupeids, gadids) or offshore (e.g., oegopsida, beloniforms) foraging habitats. In shallow coastal waters, amphipods were significant prey to many benthic-orientated feeders.
Many of the prey taxa with strong influence on predator diets and guilds in this study have population dynamics that are dominated by environmental variability that reflects basin-scale conditions such as ENSO (e.g., clupeids, gadids; Dorn, 1995; Fiechter et al., 2015; Malick et al., 2020) and regional upwelling dynamics, including upwelling phenology, relaxation, and productivity (e.g, euphausiids, decapods, gadids; Hannah, 2011; Santora et al., 2012, 2020; Checkley and Barth, 2009; Auth et al., 2018). These dynamics, though out of our management control, should be considered in the development of ecosystem models and management strategies by including the scales of their variability and the likely effects on trophic guilds. It is noteworthy that the ‘fish’ and ‘minor’ prey taxa groups are well represented in nearly every predator species-length class we examined. We argue it is imperative that we consider the role of environment and potential management choices on influential, individual forage taxa as well as the biodiversity of the preyscape.
This study includes prey taxa that are directly or indirectly linked to management choices and should be considered in model development and management strategy evaluations. For fish prey that strongly drive association of particular trophic guilds, including clupeids, salmon, and gadids, management strategies should include a module for how choices can affect the availability of each prey taxon. For example, juvenile salmon are influenced by freshwater and ocean periods that should be considered collectively to evaluate their roles on juvenile salmon at sea (Friedman et al., 2019). Although climate variability drives a large fraction of recruitment variability for juvenile stages of nearly all species along the U.S. West Coast, the abundance of juvenile stages of forage species also is closely tied to management objectives and reference points for adult spawning biomass (Field et al., 2010; Moore, 2013). Similarly, decapod availability may be tied to management of adult crabs and shrimp because reduction in regional decapod populations (e.g., pandalid shrimp, Dungeness crab) by fisheries could potentially result in reductions in decapod availability to predators.
In the absence of high resolution and long time series data for many individual predators and their foraging habits, generalizations and simplified guilds may offer sound alternatives for developing or improving ecosystem models, particularly highly aggregated models such as MICE that estimate how the system responds to both expected and unanticipated shocks. Indeed, using data-rich guild members as proxies for others with limited or no data is one of the most important applications of guild analysis for fisheries research and management (Austen et al., 1994). Possibly as a result of unquantified variability in the timing, range, and frequency of data collection for constituent members of guilds among bioregions (Tables S2-4), there was evidence of some degree of interspecific dietary variation among species and/or size classes within trophic guilds. Consequently, good proxy species for feeding guilds inferred from this work, and generally applicable regardless of study location, include those that have large sample sizes, long time series, and diets that are highly characteristic of their trophic guild (i.e., species that plot close to the group centroid in ordination space). For instance, Coho Salmon in the Pacific Northwest and Common Thresher Shark in Southern California are good proxies for their respective guilds (Tables 1, 3, S2, S4, S5, S7), whereas Yellowtail Rockfish off Central California is likely not (Tables 2, S3, S6). In guilds that are tightly clustered, such as the cross-region pelagic predator guild, any species may serve as a good indicator. In this particular case, the long, sample-intensive, quarterly time series available for California Sea Lions may serve as an excellent basis for understanding and monitoring broader pelagic predator dynamics. Continued sampling of species that are characteristic of trophic guilds, as well as those species that have long time series and are thought to be of high importance with respect to interactions with managed species (e.g., California Sea Lion), should be prioritized. The collection of this type of data can better identify individual species and trophic guilds that can best represent dynamic responses to resource variability in future ecosystem modeling endeavors.
Our results may inform ecosystem models seeking to find a balance between overly complex and simplistic representations of trophic interaction and energy flow in marine ecosystems. This includes providing guidance concerning the appropriate delineation of guilds based on commonalities in foraging preferences, with insights regarding the spatial extent to which predator food habits or prey preferences might be shared. Furthermore, guidance with respect to the minimal level of ontogenetic distinction of prey preferences in ecosystem components for models that include age or stage-based life histories (e.g., Ecosim, Atlantis) is informed by our CART analysis. The ability to better quantify robust functional groups and identify where covariation in feeding preferences might be expected is critically important for the development of effective ecosystem models. It also is of similar importance for trait-based ecological risk assessment approaches to evaluate how different upper trophic level predators may respond to a broad suite of potential future ecosystem perturbations (e.g., climate variability, climate change) and fishery removals of different components of the forage community.
Future work to evaluate shared temporal patterns of forage utilization among predators will further improve our ability to predict and adapt management to the trophic effects of natural and anthropogenic perturbations. For example, resource switching or shifting behaviors that are shared among predators will have a stronger impact on prey populations and thus on other management considerations than independent temporal dietary variability among predators. In a comparative analysis of high latitude marine ecosystem models in the North Pacific and North Atlantic Oceans, Megrey et al. (2009) suggest common external factors often act synchronously on guilds or functional groups within ocean basins, but are often out of phase among ocean basins. Future ecosystem model validation efforts will require that models mimic resource switching or shifting behaviors to effectively inform managers of the ecosystem consequences of such shifts in the face of climate variability and change.
The incorporation of diet composition data from 64 species length-classes and our analytical approach resolved trophic guilds of marine predators across bioregions of the CCLME. However, we provide some caveats and limitations associated with our study for consideration.
The extent of predator species used for analysis, and specifically their diet estimates, establishes similarity space in ordinations and highly influences guild structure. The addition of more predators with variable diet compositions would therefore probably modify our trophic guild estimates. For instance, large pelagic predators that grouped together in Central California were split between two guilds with the addition of more species in Southern California. Past studies have demonstrated that differing approaches to taxonomic aggregation at both the predator and the prey level can lead to inconsistent results with respect to ecosystem model outcomes and inferred management advice (Forrest et al., 2015), so continued improvement on the current results through the addition of predators should be a priority. We do, however, provide axis loadings for all species-length classes in each of our bioregions and distance comparisons to guild centroids so that those interested can better understand the structure of guilds and determine especially characteristic species length-classes (i.e., closest to guild centroid) for guilds with multiple predators (Tables S5-7).
Some predators are represented primarily by one component of the population that has different feeding habits than the remainder of the population. Consequently, it is essential that results be interpreted and applied with an eye to what component of a predator population was sampled. For example, diet data for California Sea Lion predominantly originated from nursing females foraging from Channel Islands rookeries (Melin et al., 2012a; Lowry et al., 2022). Subadult and adult males of the same species migrate north during the non-breeding season, where they have access to prey species that are not available within foraging range of the rookeries.
Additional potential biases in sample collection may also influence diet and thus guild analysis results. Diet composition estimates of fishes based on stomach contents are known to underestimate the contributions of soft-bodied prey, such a gelatinous zooplankton and polychaetes (Brodeur et al., 2021). In addition, especially for fishes that are trophic generalists, the timing and locations of sample collections may highly influence diet estimates within and among bioregions. In the case of pinnipeds (Pacific Harbor Sea, California Sea Lion, and Northern Fur Seal), samples were collected in the form of scats from haul-outs and rookeries. Resulting diet data may be skewed towards prey that are available for consumption in the vicinity of shore-based collection locations, overemphasizing the importance of nearshore prey, particularly for pinnipeds that foraging trip durations longer than a day (i.e., California Sea Lions and Northern Fur Seals). However, telemetry for these species from San Nicolas and San Miguel Islands supports the coastal nature of most of their foraging habits (Melin et al., 2012b; Briscoe et al., 2018).
Some types of coastal marine predators were not represented in this dataset. Among those are baleen whales, beaked whales, seabirds, and marine turtles. In some cases, these omissions are the result of life histories and population sizes that make sample collection difficult or unlikely, such as the relatively small population sizes and deep-diving behavior of beaked whales. In other cases, institutional biases underlie the omission of a taxon, as is the case for seabirds, for which NMFS does not typically collect diet data. Additional data sets from academic researchers and graduate students were provided on a voluntary basis. Unfortunately, no sources of raw food habitat data for seabirds could be secured to offset the lack of sampling by NMFS.
Temporal variability was not considered when estimating trophic guilds because of sample size limitations; however, seasonal and interannual dietary shifts are commonly reported among marine predators in the CCLME, including several from this study (e.g., Pacific Hake, Buckley and Livingston, 1997; Common Thresher Shark, Preti et al., 2004; Sandpaper Skate, Rinewalt et al., 2007; California Sea Lion, Lowry et al., 2022). Changes in the relative abundance and availability of (especially pelagic) forage during different oceanographic conditions has been demonstrated to drive temporal shifts in diet composition (Brodeur and Pearcy, 1992; Thayer et al., 2014). Therefore, the timing of sample collection, especially for predators with short time series, likely influenced our estimates of diet composition and thereby guild structure.
Trait-based prey characterization, such as functional groupings by habitat or morphology, can complement traditional taxonomic prey identification by pinpointing additional sources of dietary variability and by uncovering dietary trends and signatures that may be overlooked by taxonomic classification (Spitz et al., 2014; Green et al., 2022). We hoped to incorporate foraging habitats of predators into trophic guild analysis but lacked adequate sample sizes.
The use of generalized prey classes was necessary because of uneven levels of taxonomic identification in the source data. Although a large number of classes (32) was selected based on model comparisons, the use of generalized prey classes results in overestimates of dietary similarity. Combined with a lack of foraging habitat information, these prey generalizations occasionally result in predator groupings that are not sympatric in nature, such as Lingcod grouping with large pelagic predators in Southern California. Prey size is another important consideration when comparing predator diets that could not be incorporated into this study because of sample size limitations. Such information would have been useful for more refined estimates of trophic guild structure and composition among bioregions.
The great majority of our predator length class diet estimates were based on a synthesis of occurrence (presence/absence), numerical, and gravimetric (weight, volume), metrics, but for some species, only occurrence and one other metric were available. This inconsistency may have slightly influenced estimates of diet composition among predator species length-classes.
We defined distinct biogeographic trophic guilds for the majority of the CCLME, associating a suite of marine predators with their primary prey groups, and investigating the degree of interregional trophic coherence for species-length classes that occurred in multiple regions. In addition to an improved ecological understanding of trophic relationships in the CCLME, our statistical approach can be replicated in any global marine ecosystem with sufficient diet composition data. Consolidating trophic information, through estimation of guilds can improve our understanding of predator-prey relationships and reduce data limitations on ecosystem models. The resulting improvements in accuracy, precision, and completeness of resource use estimates over single-species information can, in turn, improve model accuracy and forecast skill. By considering guilds, we can evaluate indirect cost and benefits of management actions, consider the spatial extent (coherence) of expected results from management actions, and develop improved ecosystem indicators that capitalize on shared trophic relationships.
This study leveraged the California Current Trophic Database (CCTD), which contains food habits data for 143 predator taxa, to address emerging EBFM needs in the CCLME. We anticipate using the CCTD, combined with oceanographic data, for future studies that address key knowledge gaps in our understanding of CCLME trophodynamics. Investigating environmental drivers of prey switching and comparing predator diets to survey data are two such endeavors. If diet composition of predators can be related to environmental conditions and tracked by surveys, ecological surprises such as recent whale entanglements and seabird population declines may become more predictable (Santora et al., 2021). Understanding covariation in time of predator diets within guilds is another instrumental step towards making more efficient use of limited data, by enabling predators with long time series or low sample collection overhead to act as proxies for more data-poor species in predicting, monitoring, and assessing impacts of management decisions. The numerous prey data in the CCTD also afford opportunities for expanding our knowledge of predator-prey interactions and the determination of important foraging areas, which can help to advance EBFM and other management objectives related to marine conservation. For instance, characterizing multispecies functional responses, or predator consumption rates as a function of variable prey densities, can support improved estimates of consumptive removals, energy transfer among trophic levels, and natural mortality of prey. Investigations of benthic-pelagic coupling and the determination of regions of high productivity and predator diversity, such as submarine canyon heads, can help advance our understanding of how habitat and environmental conditions combine to influence bottom-up processes. Our hope is that this study will be among the first of many that build on recent advancements in the availability of quantitative, individual-based trophic data for marine predators in the CCLME to advance our understanding of ecosystem dynamics.
Publicly available datasets were analyzed in this study. These data can be found here: Bizzarro, J., Dewitt, L., Wells, B., Curtis, A., Santora, J., Field, J. (2023). California Current Trophic Database (CCTD) [Online]. Available at: Marine Data Archive https://doi.org/10.14284/597.
BW conceived the overall idea, and BW, JB, JF, JS, and KC developed objectives and general approach. All data necessary for this study were previously collected and archived in the database (i.e., CCTD) described above. JB analyzed the data. JB led the writing of the manuscript, with major contributions by BW and JF, and edits and revisions by BW, JF, JS, and KC. All authors contributed to the article and approved the submitted version.
We thank those that contributed food habits data, including: Kerim Aydin, Bonnie Basnett, Alicia Billings, Jennifer Chiu, Elizabeth Daly, Heidi Dewar, Blake Feist, Jeff Harding, Tom Laidig, Erin Loury, Sharon Melin, Tony Orr, and Antonella Preti. Ric Brodeur, Dave Ebert, Scott Hamilton, Laurel Lam, Geoff Lang, Mark Lowry, Catherine Nickels, Megan Sabal, Jameal Samhouri, Owyn Snodgrass, Rick Starr and countless other staff, students, and volunteers worked to develop the food habits data sets that were contributed. We appreciate correspondence and conversations with David Hess regarding multivariate analysis and our statistical approach and Elan Portner and Heidi Dewar regarding CART analysis and dietary similarity and trophic guild structure of southern California predators. NMFS-SWFSC provided funding for this project through the Center Ecosystem Science Committee.
The authors declare that the research was conducted in the absence of any commercial or financial relationships that could be construed as a potential conflict of interest.
All claims expressed in this article are solely those of the authors and do not necessarily represent those of their affiliated organizations, or those of the publisher, the editors and the reviewers. Any product that may be evaluated in this article, or claim that may be made by its manufacturer, is not guaranteed or endorsed by the publisher.
The Supplementary Material for this article can be found online at: https://www.frontiersin.org/articles/10.3389/fmars.2023.1195000/full#supplementary-material
Ainsworth C. H., Kaplan I. C., Levin P. S., Mangel M. (2010). A statistical approach for estimating fish diet compositions from multiple data sources: Gulf of California case study. Ecol. Appl. 20, 2188–2202. doi: 10.1890/09-0611.1
Assís C. A. (1996). A generalized index for stomach contents analysis in fish. Scient. Marina 60, 385–389.
Austen D. J., Bayley P. B., Menzel B. W. (1994). Importance of guild concept to fisheries research and management. Fisheries 19, 12–18. doi: 10.1577/1548-8446(1994)019%3C0012:IOTGCT%3E2.0.CO;2
Auth T. D., Daly E. A., Brodeur R. D., Fisher J. L. (2018). Phenological and distributional shifts in ichthyoplankton associated with recent warming in the northeast Pacific Ocean. Global Change Biol. 24, 259–272. doi: 10.1111/gcb.13872
Benoit D. M., Jackson D. A., Chu C. (2021). Partitioning fish communities into guilds for ecological analyses: an overview of current approaches and future directions. Can. J. Fish. Aquat. Sci. 78, 984–993. doi: 10.1139/cjfas-2020-0455
Bizzarro J., Dewitt L., Wells B., Curtis A., Santora J., Field J. (2023). California Current Trophic Database (CCTD). In: Marine data archive (Accessed 23 March 2023).
Bizzarro J. J., Robinson H. J., Rinewalt C. S., Ebert D. A. (2007). Comparative feeding ecology of four sympatric skate species off central California, USA. Environ. Biol. Fish. 80, 197–220. doi: 10.1007/s10641-007-9241-6
Bizzarro J. J., Santora J. A., Curtis K. A., Field J. C., Wells B. K. A multipredator trophic database for the California Current Large Marine Ecosystem. Sci. Data. 10, 496. doi: 10.1038/s41597-023-02399-2
Bizzarro J. J., Smith W. D., Castillo-Géniz J. L., Ocampo-Torres A., Márquez-Farías J. F., Hueter R. E. (2009). The seasonal importance of small coastal sharks and rays in the artisanal elasmobranch fishery of Sinaloa, Mexico. Pan-Am. J. Aquat. Sci. 4, 513–531.
Breiman L., Friedman J., Stone C. J., Olshen R. A. (1984). Classification and regressiontrees (Belmont, CA: Wadsworth International Group).
Briggs J. C., Bowen B. W. (2012). A realignment of marine biogeographic provinces with particular reference to fish distributions. J. Biogeog. 39, 12–30. doi: 10.1111/j.1365-2699.2011.02613.x
Briscoe D. K., Fossette S., Scale K. L., Hazen E. L., Bograd S. J., Maxwell S. M., et al. (2018). Characterizing habitat suitability for a central-place forager in a dynamic marine environment. Ecol. Evol. 8, 2788–2801. doi: 10.1002/ece3.3827
Brodeur R. D., Buckley T. W., Lang G. M., Draper D. L., Buchanan J. C., Hibpshman R. E. (2021). Demersal fish predators of gelatinous zooplankton in the Northeast Pacific Ocean. Mar. Ecol. Prog. Ser. 658, 89–104. doi: 10.3354/meps13489
Brodeur R. D., Pearcy W. G. (1992). Effects of environmental variability on trophic interactions and food web structure in a pelagic upwelling system. Mar. Ecol. Prog. Ser. 84, 101–119. doi: 10.3354/meps084101
Buckley T. W., Livingston P. A. (1997). Geographic variation in the diet of Pacific hake, with a note on cannibalism. California Cooperat. Ocean. Fish. Investigat. Rep. 38, 53–62.
Buckley T. W., Tyler G. E., Smith D. M., Livingston P. A. (1999). Food habits of some commercially important groundfish off the coasts of California, Oregon, Washington, and British Columbia. NOAA Technical Memorandum. NMFS-AFSC-102 (Washington, DC: NOAA).
Checkley J. D.M., Barth J. A. (2009). Patterns and processes in the California Current system. Prog. Oceanog. 83, 49–64. doi: 10.1016/j.pocean.2009.07.028
Chiu J., Bizzarro J. J., Starr R. (2021). Trophic ecology of the Yellowtail Rockfish, Sebastes flavidus, during a marine heatwave. PloS One 16 (5), e0251499. doi: 10.1371/journal.pone.0251499
Coll M., Steenbeek J., Sole J., Palomera I., Christensen V. (2016). Modelling the cumulative spatial–temporal effects of environmental drivers and fishing in a NW Mediterranean marine ecosystem. Ecol. Model. 331, 100–114. doi: 10.1016/j.ecolmodel.2016.03.020
Collie J. S., Botsford L. W., Hastings A., Kaplan I. C., Largier J. L., Livingston P. A., et al. (2016). Ecosystem models for fisheries management: finding the sweet spot. Fish Fish. 17, 101–125. doi: 10.1111/faf.12093
Cook A. M., Bundy A. (2010). “The Food Habits Database: an update, determination of sampling adequacy and estimation of diet for key species,” in Canadian technical report of fisheries and aquatic science 2884 (Dartmouth, Nova Scotia: Fisheries and Oceans Canada).
Daly E. A., Brodeur R. D., Weitkamp L. A. (2009). Ontogenetic shifts in diets of juvenile and subadult coho and Chinook salmon in coastal marine waters: important for marine survival? Trans. Am. Fish. Soc. 138, 1420–1438. doi: 10.1577/T08-226.1
D’Andrea R., Riolo M., Ostling A. M. (2019). Generalizing clusters of similar species as a signature of coexistence under competition. PloS Comput. Biol. 15, e1006688. doi: 10.1371/journal.pcbi.1006688
Digby P. G. N., Kempton R. A. (1987). Multivariate analysis of ecological communities (London: Chapman and Hall).
Dorn M. W. (1995). The effects of age composition and oceanographic conditions on the annual migration of Pacific whiting, Merluccius productus. California Cooperat. Ocean. Fish. Investigat. Rep. 36, 97–105.
Draper D. L. (2022). Food habit variability of arrowtooth flounder (Atheresthes stomias) along the US west coast. Fish. Res. 248, 106205. doi: 10.1016/j.fishres.2021.106205
Elliot M., Whitfield A. K., Potter I. C., Blaber S. J., Cyrus D. P., Nordlie F. G., et al. (2007). The guild approach to categorizing estuarine fish assemblages: a global review. Fish Fish. 8, 241–268. doi: 10.1111/j.1467-2679.2007.00253.x
Emmett R., Krutzikowsky G. K., Bentley P. (2006). Abundance and distribution of pelagic piscivorous fishes in the Columbia River plume during spring/early summer 1998–2003: relationship to oceanographic conditions, forage fishes, and juvenile salmonids. Prog. Oceanog. 68, 1–26. doi: 10.1016/J.POCEAN.2005.08.001
Fahrig L., Lilly G. R., Miller D. S. (1993). Predator stomachs as sampling tools for prey distribution: Atlantic cod (Gadus morhua) and capelin (Mallotus villosus). Can. J. Fish. Aquat. Sci. 50, 1541–1547. doi: 10.1139/f93-175
Ferry L. A., Cailliet G. M. (1996). Sample size and data analysis: are we characterizing and comparing diet properly? Gutshop 1996, 71–80.
Fiechter J., Rose K. A., Curchitser E. N., Hedstrom K. S. (2015). The role of environmental controls in determining sardine and anchovy population cycles in the California Current: Analysis of an end-to-end model. Prog. Oceanog. 138, 381–398. doi: 10.1016/j.pocean.2014.11.013
Field J. C., MacCall A. D., Bradley R. W., Sydeman W. J. (2010). Estimating the impacts of fishing on dependent predators: a case study of the California Current. Ecol. Appl. 20, 2223–2236. doi: 10.1890/09-0428.1
Foden W. B., Butchart S. H. M., Stuart S. N., Vié J.-C., Akçakaya H. R., Angulo A., et al. (2013). Identifying the world’s most climate change vulnerable species: a systematic trait-based assessment of all birds, amphibians and corals. PloS One 8, e65427. doi: 10.1371/journal.pone.0065427
Forrest R. E., Savina M., Fulton E. A., Pitcher T. J. (2015). Do marine ecosystem models give consistent policy evaluatios? A comparison of Atlantis and Ecosim. Fish. Res. 167, 293–312. doi: 10.1016/j.fishres.2015.03.010
Frid C. L. J., Odette O. A. L., Scott C. L. (2006). Ecosystem-based management of fisheries: is science limiting? ICES J. Mar. Sci. 63, 1567–1572. doi: 10.1016/j.icesjms.2006.03.028
Friedman W. R., Martin B. T., Wells B. K., Warzybok P., Michel C. J., Danner E. M., et al. (2019). Modeling composite effects of marine and freshwater processes on migratory species. Ecosphere 10, e02743. doi: 10.1002/ecs2.2743
Friedman W. R., Santora J. A., Schroeder I. D., Huff D. D., Brodeur R. D., Field J. C., et al. (2018). Environmental and geographic relationships among salmon forage assemblages along the continental shelf of the California Current. Mar. Ecol. Prog. Ser. 596, 181–198. doi: 10.3354/meps12598
Froese R., Pauly D. (2022) FishBase. Available at: www.fishbase.org (Accessed 24 July 2022).
Fulton E. A., Link J. S., Kaplan I. C. (2011). Lessons in modelling and management of marine ecosystems: the Atlantis experience. Fish Fish. 12, 171–188. doi: 10.1111/j.1467-2979.2011.00412.x
Gaichas S. K., Aydin K. Y., Francis R. C. (2011). What drives dynamics in the Gulf of Alaska? Integrating hypotheses of species, fishing, and climate relationships using ecosystem modeling. Can. J. Fish. Aquat. Sci. 68, 1553–1578. doi: 10.1139/f2011-080
Gaichas S., Gamble R., Fogarty M., Benoît H., Essington T., Fu C., et al. (2012). Assembly rules for aggregate-species production models: simulations in support of management strategy evaluation. Mar. Ecol. Prog. Ser. 459, 275–292. doi: 10.3354/meps09650
Goodbody-Gringley G., Eddy C., Pitt J. M., Chequer A. D., Smith S. R. (2019). Ecological drivers of invasive lionfish (Pterois volitans and Pterois miles) distribution across mesophotic reefs in Bermuda. Front. Mar. Sci. 6. doi: 10.3389/fmars.2019.00258
Gotelli N., Colwell R. K. (2001). Quantifying biodiversity: procedures and pitfalls in the measurement and comparison of species richness. Ecol. Lett. 4, 379–391. doi: 10.1046/j.1461-0248.2001.00230.x
Gottscho A. D. (2016). Zoogeography of the San Andreas Fault system: Great Pacific Fracture Zones correspond with spatially concordant phylogeographic boundaries in western North America. Biol. Rev. 91, 235–254. doi: 10.1111/brv.12167
Green S. J., Brookson C. B., Hardy N. A., Crowder L. B. (2022). Trait-based approaches to global change ecology: moving from description to prediction. Proc. R. Soc. B: Biol. Sci. 289, 20220071. doi: 10.1098/rspb.2022.0071
Grigg E. K., Allen S. G., Craven-Green D. E., Klimley A. P., Markowtiz H., Elliott-Fisk D. L. (2012). Foraging distribution of Pacific harbor seals (Phoca vitulina richardii) in a highly impacted estuary. J. Mammal. 93, 282–293. doi: 10.1644/11-MAMM-A-128.1
Grüss A., Thorson J. T., Carroll G., Ng E. L., Holsman K. K., Aydin K., et al. (2020). Spatio-temporal analyses of marine predator diets from data-rich and data-limited systems. Fish Fish. 21, 718–739. doi: 10.1111/faf.12457
Hannah R. W. (1995). Variation in geographic stock area, catchability and natural mortality of ocean shrimp (Pandalus Jordani): some new evidence for a trophic interaction with Pacific hake (Merluccius productus). Can. J. Fish. Aquat. Sci. 52, 1018–1029. doi: 10.1139/f95-100
Hannah R. W. (2011). Variation in the distribution of ocean shrimp (Pandalus jordani) recruits: links with coastal upwelling and climate change. Fish. Oceanograph.20, 305–311. doi: 10.1111/j.1365-2419.2011.00585.x
Hargreaves D., Buckland A., Sheaves M. (2017). Trophic guild concept: factors affecting within-guild consistency for tropical estuarine fish. Mar. Ecol. Prog. Ser. 564, 175–186. doi: 10.3354/meps11955
Hess J. E., Vetter R. D., Moran. P. (2011). A steep genetic cline in yellowtail rockfish, Sebastes flavidus, suggests regional isolation across the Cape Mendocino faunal break. Can. J. Fish. Aquat. Sci. 68, 89–104. doi: 10.1139/F10-131
Hickey B. M. (1979). The California Current System - hypotheses and facts. Prog. Oceanog. 8, 191–279. doi: 10.1016/0079-6611(79)90002-8
Hickey B. M. (1998). “Coastal oceanography of Western North American from the tip of Baja California to Vancouver Island,” in The sea, vol. 11 . Eds. Robinson A. R., Brink K. H. (New York: John Wiley and Sons), 345–393.
Holt R. E., Bogstad B., Durant J. M., Dolgov A. V., Ottersen G. (2019). Barents Sea cod (Gadus morhua) diet composition: Long-term interannual, seasonal, and ontogenetic patterns. ICES J. Mar. Sci. 76, 1641–1652. doi: 10.1093/icesjms/fsz082
Horn M. H., Allen L. G., Lea. R. N. (2006). “Biogeography’,” in The ecology of marine fishes: California and adjacent waters. Eds. Allen L. G., Pondella D. J., Horn M. H. (Berkeley: University of California Press), 3–25.
Hurturbia J. (1973). Trophic diversity measurement in sympatric predatory species. Ecology 54, 885–890. doi: 10.2307/1935684
Hyslop E. J. (1980). Stomach contents analysis – a review of methods and their application. J. Fish Biol. 17, 411–429. doi: 10.1111/j.1095-8649.1980.tb02775.x
ICES (2022) Data portal – Fish stomach content data. Available at: www.ices.dk/data/data-portals/Pages/Fish-stomach.aspx (Accessed 13 March 2022).
King J. R., Agostini V. N., Harvey C. J., McFarlane G. A., Foreman M. G., Overland J. E., et al. (2011). Climate forcing and the California Current ecosystem. ICES J. Mar. Sci. 68, 1199–1216. doi: 10.1093/icesjms/fsr009
Koehn L. E., Essington T. E., Levin P. S., Marshall K. N., Anderson L. G., Bundy A., et al. (2020). Case studies demonstrate capacity for a structured planning process for ecosystem-based fisheries management. Can. J. Fish. Aquat. Sci. 999, 1–19. doi: 10.1139/cjfas-2019-0202
Kritzer J. P., Tang Y., Chen Y., Costello C., Gaichas S., Nies T., et al. (2023). Advancing multispecies fishery management in China: Lessons from international experience. Aquacul. Fish. 8, 351–362. doi: 10.1016/j.aaf.2021.11.004
Kuhnert P., Duffy L. (2013) Diet: performs an analysis of diet data using univariate trees. R package version 1.0.0. Available at: www.github.com/pkuhnert/diet (Accessed 11 Novemeber 2021).
Kuhnert P. M., Duffy L. M., Young J. W., Olson R. J. (2012). Predicting fish diet composition using a bagged classification tree approach: a case study using yellowfin tuna (Thunnus albacares). Mar. Biol. 159, 87–100. doi: 10.1007/s00227-011-1792-6
Laidig T. E., Adams P. B., Samiere W. M. (1997). “Feeding habits of sablefish, Anoplopoma fimbria, off the coasts of Oregon and California,” in Biology and management of sablefish, Anoplopoma fimbria. NOAA Technical Report NMFS 130. Eds. Wilkins M., Saunders M. (Washington, DC: NOAA), 65–80.
Lilly G. R., Parsons D. G. (1991). “Distributional patterns of the northern shrimp (Pandalus borealis) in the Northwest Atlantic as inferred from stomach contents of cod (Gadus morhua),” in International council for exploration of the sea CM 1991/K, vol. 41. (ICES - ICES Council Meeting Papers 1991).
Link J. S. (2004). Using fish stomachs as samplers of the benthos: Integrating long-term and broad scales. Mar. Ecol. Prog. Ser. 269, 265–275. doi: 10.3354/meps269265
Link J. S., Bogstad B., Sparholt H., Lilly G. R. (2009). Role of atlantic cod in the ecosystem. Fish Fish. 10, 58–87. doi: 10.1111/j.1467-2979.2008.00295.x
Livingston P. A., Aydin K., Buckley T. W., Lang G. M., Yang M.-S., Miller B. S. (2017). Quantifying food web interactions in the North Pacific – a data-based approach. Environ. Biol. Fish. 100, 443–470. doi: 10.1007/s10641-017-0587-0
Loury E., Bros S. M., Starr R. M., Ebert D. A. (2015). Trophic ecology of the gopher rockfish Sebastes carnatus inside and outside of Central California marine protected areas. Mar. Ecol. Prog. Ser. 536, 229–241. doi: 10.3354/meps11420
Lowry M. S., Nehasil S. E., Moore J. E. (2022). Spatio-temporal diet variability of the California sea lion Zalophus californianus in the southern California Current Ecosystem. Mar. Ecol. Prog. Ser. 69, 1–21. doi: 10.3354/meps14096
Malick M. J., Hunsicker M. E., Haltuch M. A., Parker-Stetter S. L., Berger A. M., Marshall K. N. (2020). Relationships between temperature and Pacific hake distribution vary across latitude and life-history stage. Mar. Ecol. Prog. Ser. 639, 185–197. doi: 10.3354/meps13286
Megrey B. A., Link J. S., Hunt G. L. Jr., Moksness E. (2009). Comparative marine ecosystem analysis: applications, opportunities, and lessons learned. Prog. Oceanog. 81, 2–9. doi: 10.1016/j.pocean.2009.04.002
Melin S. R., Orr A. J., Harris J. D., Laake J. L., DeLong R. L. (2012a). California sea lions: an indicator for integrated ecosystem assessment of the California Current System. California Cooperat. Ocean. Fish. Investigat. Rep. 53, 140–152.
Melin S. R., Sterling J. T., Ream R. R., Towell R., Zeppelin T., Orr A. J., et al. (2012b). “A tale of two stocks: Studies of northern fur seals breeding at the northern and southern extent of the range,” in Alaska fisheries science center (AFSC) quarterly report april-june 2012, 1–11.
Metcalf S. J., Dambacher J. M., Hobday A. J., Lyle J. M. (2008). Importance of trophic information, simplification and aggregation error in ecosystem models. Mar. Ecol. Prog. Ser. 360, 25–36. doi: 10.3354/meps07394
Miller T. W., Brodeur R. D. (2007). Diet and trophic relationships among dominant marine nekton in the northern California Current ecosystem. Fish. Bull. 105, 548–559.
Moore J. E. (2013). Management reference points to account for direct and indirect impacts of fishing on marine mammals. Mar. Mammal Sci. 29, 446–473. doi: 10.1111/j.1748-7692.2012.00586.x
Ng E. L., Deroba J. J., Essington T. E., Grüss A., Smith B. E., Thorson J. T. (2021). Predator stomach contents can provide accurate indices of prey biomass. ICES J. Mar. Sci. 78, 1146–1159. doi: 10.1093/icesjms/fsab026
Northeast Fisheries Science Center (2022) Food habits database (FHDBS). Available at: www.fisheries.noaa.gov/inport/item/8083 (Accessed 13 March 2022).
Oksanen J., Blanchet F. G., Friendly M., Kindt R., Legendre P., McGlinn D., et al. (2020) ‘vegan: community ecology package. R package version 2.5-7’. Available at: https://CRAN.R-project.org/package=vegan (Accessed 13 March 2022).
Pikitch E. K., Rountos K. J., Essington T. E., Santora C., Pauly D., Watson R., et al. (2014). The global contribution of forage fish to marine fisheries and ecosystems. Fish Fish. 15, 43–64. doi: 10.1111/faf.12004
Pineda-Munoz S., Alroy J. (2014). Dietary characteristics of terrestrial mammals. Proc. R. Soc. B 281, 20141173. doi: 10.1098/rspb.2014.1173
Pinnegar J. K. (2014) DAPSTOM–An integrated database & portal for fish stomach records. Version 4.7. Available at: https://www.cefas.co.uk/data-and-publications/fish-stomach-records/ (Accessed 6 March 2021).
Portner E. J., Polovina J. J., Choy C. A. (2017). Patterns in micronekton diversity across the North Pacific Subtropical Gyre observed from the diet of longnose lancetfish (Alepisaurus ferox). Deep-Sea Res. Part 1 125, 40–51. doi: 10.1016/j.dsr.2017.04.013
Preti A., Smith S. E., Ramon D. A. (2004). Diet differences in the thresher shark (Alopias vulpinus) during transition from a warm-water regime to a cool-water regime off California-Oregon 1998–2000. California Cooperat. Ocean. Fish. Investigat. Rep. 45, 118–125.
Preti A., Soykan C. U., Dewar H., Wells R. J. D., Spear N., Kohin S. (2012). Comparative feeding ecology of shortfin mako, blue, and thresher sharks in the California Current. Environ. Biol. Fish. 95, 127–146. doi: 10.1007/2Fs10641-012-9980-x
Punt A. E., MacCall A. D., Essington T. E., Francis T. B., Hurtado-Ferro F., Johnson K. F., et al. (2016). Exploring the implications of the harvest control rule for Pacific sardine, accounting for predator dynamics: a MICE model. Ecol. Modeling 337, 79–95. doi: 10.1016/j.ecolmodel.2016.06.004
Ralston S., Field J. C., Sakuma K. M. (2015). Long-term variation in a central California pelagic forage assemblage. J. Mar. Syst. 146, 26–37. doi: 10.1016/j.jmarsys.2014.06.013
R Core Team (2020) R: A language and environment for statistical computing (R Foundation for Statistical Computing). Available at: www.R-project/org/ (Accessed 23 February 2021).
Richards C., Cooke R., Bowler D. E., Boerder K., Bates A. E. (2022). Species’ traits and exposure as a future lens for quantifying seabird bycatch vulnerability in global fisheries. Avian Conserv. Ecol. 17, 34. doi: 10.5751/ACE-02033-170134
Rinewalt C. S., Ebert D. A., Cailiet G. M. (2007). The feeding habits of the sandpaper skate, Bathyraja kincaidii (Garman 1908) in central California: seasonal variation in the diet linked to oceanographic conditions. Environ. Biol. Fish. 80, 147–163. doi: 10.1007/s10641-007-9218-5
Rousseeuw P. J. (1987). Silhouettes: a graphical aid to the interpretation and validation of cluster analysis. Comput. Appl. Math. 20, 53–65. doi: 10.1016/0377-0427(87)90125-7
Santora J. A., Field J. C., Schroeder I. D., Sakuma K. M., Wells B. K., Sydeman W. J. (2012). Spatial ecology of krill, micronekton and top predators in the central California Current: Implications for defining ecologically important areas. Prog. Oceanog. 106, 154–174. doi: 10.1016/j.pocean.2012.08.005
Santora J. A., Mantua N. J., Schroeder I. D., Field J. C., Hazen E. L., Bograd S. J., et al. (2020). Habitat compression and ecosystem shifts as potential links between marine heatwave and record whale entanglements. Nat. Commun. 11, 536. doi: 10.1038/s41467-019-14215-w
Santora J. A., Rogers T. L., Cimino M. A., Sakuma K. M., Hanson K. D., Dick E. J., et al. (2021). Diverse integrated ecosystem approaches overcome pandemic-related fisheries monitoring challenges. Nat. Commun. 12, 6492. doi: 10.1038/s41467-021-26484-5
Sarrazin V., Kuhs V., Kullmann B., Kreutle A., Pusch C., Thiel R. (2021). A sensitivity-based procedure to select representative fish species for the Marine Strategy Framework Directive indicator development, applied to the Greater North Sea. Ecol. Indic. 131, 108161. doi: 10.1016/j.ecolind.2021.108161
Savoca M. S., Czapansky M. F., Kahane-Rapport S. R., Gough W. T., Fahlbusch J. A., Bierlich K. C., et al. (2021). Baleen whale prey consumption based on high-resolution foraging movements. Nature 599, 85–90. doi: 10.1038/s41586-021-03991-5
Schroeder I. D., Santora J. A., Mantua N., Field J. C., Wells B. K., Hazen E. L., et al. (2022). Habitat compression indices for monitoring ocean conditions and ecosystem impacts within coastal upwelling systems. Ecol. Indic. 144, 109520. doi: 10.1016/j.ecolind.2022.109520
Scientific Committee on Antarctic Research (2022) Southern Ocean diet and energetics database. Available at: https://www.scar.org/resources/southern-ocean-diet-energetics/ (Accessed 14 March 2022).
Sharf F. S., Juanes F., Rountree R. A. (2000). Predator-prey size relationships of marine fish predators: intraspecific variation and effects of ontogeny and body size on trophic-niche breadth. Mar. Ecol. Prog. Ser. 208, 229–248. doi: 10.3354/meps208229
Skern-Mauritzen M., Ottersen G., Handegard N. O., Huse G., Dingsør G. E., Stenseth N. C., et al. (2016). Ecosystem processes are rarely included in tactical fisheries management. Fish Fisherie 17, 165–175. doi: 10.1111/faf.12111
Smith A. D., Brown C. J., Bulman C. M., Fulton E. A., Johnson P., Kaplan I. C., et al. (2011). Impacts of fishing low–trophic level species on marine ecosystems. Science 333, 1147–1150. doi: 10.1126/science.1209395
Smith L. A., Link J. S., Cadrin S. X., Palka D. L. (2015). Consumption by marine mammals on the Northeast U.S. continental shelf. Ecol. Appl. 25, 373–389. doi: 10.1890/13-1656.1
Smith B. E., Smith L. A. (2020). Multispecies functional responses reveal reduced predation at high prey densities and varied responses among and within trophic groups. Fish Fish. 21, 891–905. doi: 10.1111/faf.12468
Spitz J., Ridoux V., Amour A. B. (2014). Let’s go beyond taxonomy in diet description: testing a trait-based approach to prey-predator relationships. J. Anim. Ecol. 83, 1137–1148. doi: 10.1111/1365-2656.12218
Stroud J. T., Bush M. R., Ladd M. C., Nowicki R. J., Shantz A. A., Sweatman J. (2015). Is a community still a community? Reviewing definitions of key terms in community ecology. Ecol. Evol. 5, 4757–4765. doi: 10.1002/ece3.1651
Suryan R., Harvey J. (1998). Tracking harbor seals (Phoca vitulina richardsi) to determine dive behavior, foraging activity, and haul out site use. Mar. Mammal Sci. 14, 361–372. doi: 10.1111/j.1748-7692.1998.tb00728.x
ter Braak C. J. F. (1985). Correspondence analysis of incidence and abundance data: properties in terms of a unimodal response model. Biometrics 41, 859–873. doi: 10.2307/2530959
Thayer J. A., Field J. C., Sydeman W. J. (2014). Changes in California Chinook salmon diet over the past 50 years: relevance to the recent population crash. Mar. Ecol. Prog. Ser. 498, 249–261. doi: 10.3354/meps10608
Thompson A. R., Harvey C. J., Sydeman W. J., Barceló C., Bograd S. J., Brodeur R. D., et al. (2019). Indicators of pelagic forage community shifts in the California Current Large Marine Ecosystem 1998–2016. Ecol. Indic. 105, 215–228. doi: 10.1016/j.ecolind.2019.05.057
Tolimieri N., Levin P. S. (2006). Assemblage structure of eastern Pacific groundfishes on the U.S. continental slope in relation to physical and environmental variables. Trans. Am. Fish. Soc. 135, 317–322. doi: 10.1577/T05-092.1
Townhill B., Holt R. E., Bogstad B., Durant J. M., Pinnegar J. K., Dolgov A. V., et al. (2021). Diets of Barents Sea cod (Gadus morhua) from the 1930s to 2018. Earth System Sci. Data 13, 1361–1370. doi: 10.5194/essd-13-1361-2021
Townsend H., Harvey C. J., DeReynier Y., Davis D., Zador S. G., Gaichas S., et al. (2019). Progress on implementing ecosystem-based fisheries management in the United States through the use of ecosystem models and analysis. Front. Mar. Sci. 6. doi: 10.3389/fmars.2019.00641
Valentine J. W. (1966). Numerical analysis of molluscan ranges on the extratropical northeastern Pacific shelf. Limnol. Oceanog. 11, 198–211. doi: 10.4319/lo.1966.11.2.0198
van Dam A., Dekker M., Morales-Castilla I., Rodríguez MÁ., Wichmann D., Baudena M. (2021). Correspondence analysis, spectral clustering and graph embedding: applications to ecology and economic complexity. Sci. Rep. 11, 8926. doi: 10.1038/s41598-021-87971-9
Warzybok P., Santora J. A., Ainley D. G., Bradley R. W., Field J. C., Capitolo P. J., et al. (2018). Prey switching and consumption by seabirds in the central California Current upwelling ecosystem: Implications for forage fish management. J. Mar. Syst. 185, 25–39. doi: 10.1016/j.jmarsys.2018.04.009
Wells B. K., Santora J. A., Henderson M. J., Warzybok P., Jahncke J., Bradley R. W., et al. (2017). Environmental conditions and prey-switching by a seabird predator impact juvenile salmon survival. J. Mar. Syst. 174, 54–63. doi: 10.1016/j.jmarsys.2017.05.008
Wetherbee B. W., Cortés E., Bizzarro J. J. (2012). “Food consumption and feeding habits,” in Biology of sharks and their relatives. Eds. Carrier J. C., Musick J. A., Heithaus M. R. (New York: CRC Press), 239–264.
Williams G. D., Andrews K. S., Brown J. A., Gove J. M., Hazen E. L., Leong K. M., et al. (2021). Place-based ecosystem management: adapting integrated ecosystem assessment processes for developing scientifically and socially relevant indicator portfolios. Coast. Manage. 49, 46–71. doi: 10.1080/08920753.2021.1846154
Keywords: biogeography, California Current Trophic Database, ecosystem-based fisheries management, food webs, predator-prey relationships, trophic guilds
Citation: Bizzarro JJ, Field JC, Santora JA, Curtis KA and Wells BK (2023) Trophic guilds of marine predators in the California Current Large Marine Ecosystem. Front. Mar. Sci. 10:1195000. doi: 10.3389/fmars.2023.1195000
Received: 27 March 2023; Accepted: 21 August 2023;
Published: 15 September 2023.
Edited by:
Chiara Piroddi, Joint Research Centre, ItalyReviewed by:
Rene Friedland, Leibniz Institute for Baltic Sea Research (LG), GermanyCopyright © 2023 Bizzarro, Field, Santora, Curtis and Wells. This is an open-access article distributed under the terms of the Creative Commons Attribution License (CC BY). The use, distribution or reproduction in other forums is permitted, provided the original author(s) and the copyright owner(s) are credited and that the original publication in this journal is cited, in accordance with accepted academic practice. No use, distribution or reproduction is permitted which does not comply with these terms.
*Correspondence: Joseph J. Bizzarro, am9lLmJpenphcnJvQG5vYWEuZ292
Disclaimer: All claims expressed in this article are solely those of the authors and do not necessarily represent those of their affiliated organizations, or those of the publisher, the editors and the reviewers. Any product that may be evaluated in this article or claim that may be made by its manufacturer is not guaranteed or endorsed by the publisher.
Research integrity at Frontiers
Learn more about the work of our research integrity team to safeguard the quality of each article we publish.