
95% of researchers rate our articles as excellent or good
Learn more about the work of our research integrity team to safeguard the quality of each article we publish.
Find out more
ORIGINAL RESEARCH article
Front. Mar. Sci. , 18 August 2023
Sec. Marine Ecosystem Ecology
Volume 10 - 2023 | https://doi.org/10.3389/fmars.2023.1185376
 Beñat Iglesias1*
 Maite Louzao1
 Eneko Bachiller1Lucía López-López2
 María Santos1
 Guillermo Boyra1
 Eider Andonegi1
 Unai Cotano1Izaskun Preciado2
Seasonal variations in hydrodynamic conditions play a critical role in prey availability at the base of the food web and thus have implications for trophic interactions at higher trophic levels. Here we use the combination of stomach content analysis (SCA) and stable isotope analysis (SIA) to investigate predator-prey interactions and trophic structure of the pelagic fish community of the Bay of Biscay (BoB) in spring and late summer of 2020 and 2021. We found that trophic guilds were more influenced by intra-specific affinities rather than seasonal variability. Main prey for the pelagic fish comprised a set of species belonging to different trophic positions (TPs), from low TP class Thaliacea (salps) to mid TP Engraulis encrasicolus. Vertically migrating meso- and macrozooplankton (mainly copepods and krill) also played an important role as food source for the pelagic fish community showing high trophic overlap among most of species. No differences were detected between the trophic structure in spring and late summer with fish, squids and chaetognaths at the top TPs, whereas krill, meso-zooplankton and salps had the lowest values. However, the TPs estimated using both SCA and SIA approaches were consistently lower in spring, likely due to higher densities and, thus, low TP prey availability in spring. When analyzing ontogenic changes in TPs with predator’s size, significant and positive relationships were found when TP was estimated using SIA but not when using SCA. Overall, our results reveal new insights into the seasonal trophic dynamics of the pelagic fish community of the BoB.
Marine ecosystem functioning depends on its structure, diversity and integrity. Disturbance of one or several components of marine ecosystems can affect higher (e.g., bottom-up control) or lower (e.g., top-down control), and even the same trophic level (Cury et al., 2003; Checkley et al., 2009). For instance, drastic changes in one abundant prey could have major consequences on potential predators and therefore on the functioning of the ecosystem. Forage fish are often abundant prey, playing a key role in marine pelagic ecosystems (Preciado et al., 2008; Corrales et al., 2022) jointly with phytoplankton and zooplankton, representing the main pathway by which energy and nutrients are transported from lower to upper trophic levels (Cury and Pauly, 2000). Therefore, studying seasonal variations not only in physical and oceanographic processes (e.g., Varela, 1996; Gil, 2008; Lassalle et al., 2011), but also in inter-specific trophic interactions (e.g., Bachiller and Irigoien, 2015) can contribute to better understand the overall functioning of marine ecosystems.
Trophic interactions in the pelagic environment have been traditionally studied through stomach content analysis (SCA). This approach provides qualitative and quantitative information on recent diet of a predator (Hyslop, 1980). However, this technique has several shortcomings, such as the disparate accuracy of prey taxonomic identification, given the uneven degree of prey digestion and short temporal resolution (Cresson et al., 2014). Complementing SCA, stable isotope analysis (SIA) has arisen as a powerful method in trophic ecology used to study the food assimilated by an organism over the previous weeks to months. The isotopic signature of a predator depends on the isotopic signature of its prey, corrected by an isotopic enrichment factor and as such, it can be used to understand trophic interactions within a community (Peterson and Fry, 1987). However, the taxonomic resolution of the SIA is much lower than of the SCA. Thus, the combination of both approaches, SCA and SIA, is highly recommended in trophic ecology to improve the estimate of predators’ diet at an appropriate level of taxonomic resolution. Such data is key to discern complex interactions at a seasonal timeframe, and thus elucidate a trustworthy trophic structure for the pelagic environment (Post, 2002; Boyle et al., 2012).
In addition, δ13C values provide information on the origin (e.g., terrestrial, benthic or pelagic) of the carbon source whereas δ15N values can be used to estimate the trophic position of the organism. In fact, the relation between fish body size and trophic position (TP hereafter) has been widely studied worldwide in marine and freshwater ecosystems (Deudero et al., 2004; Jennings et al., 2007; Arim et al., 2010; Barnes et al., 2010; Ou et al., 2017; Moranta et al., 2020). Empirical studies have supported positive relationships between body size and TP, mainly in those species with ontogenic changes in their diet (piscivores and omnivores). However, a trophic position-body size relationship may not be apparent in some species because of their non-piscivorous diet, such as in planktivorous fish, because of their external morphological traits, because of the sex change effect, or because the predator size range sampled is too small (Galván et al., 2010; Ríos et al., 2019; Keppeler et al., 2020; Moranta et al., 2020).
In temperate pelagic ecosystems, as seasonal variations of hydrodynamic conditions trigger changes in nutrients, primary production and primary consumers, variations in predator-prey interactions and pelagic ecosystem functioning are expected. The Bay of Biscay (hereafter BoB) is one of such ecosystems where temporal variations can be expected due to variability in mesoscale oceanographic processes (e.g. upwelling) that influence on the distribution of nutrients, phytoplankton, zooplankton and ichthyoplankton (Gil, 2008), as well as on the carbon and nitrogen isotopic signatures of pelagic fish (Bode et al., 2003; Bode et al., 2007; López-López et al., 2017). Important upwelling events occur in the Iberian and French shelves during summer (Botas et al., 1990; Jegou and Lazure, 1995; Gil, 2008), while the main rivers in the BoB are located in the French coast, providing approximately 80% of the freshwater discharge onto the French shelf mostly during winter and spring (Borja et al., 2018). The phytoplankton community in the shelf zone of the BoB is composed mainly of diatoms or dinoflagellates, which variation depends predominantly by river discharge variations, by water column stratification conditions, and by upwelling events (Morozov et al., 2013). In the off-shelf areas of the Cantabrian Sea there is a major phytoplankton spring bloom and a secondary one in autumn (Bode et al., 2011a). Zooplankton abundances and biomass in the BoB have two annual peaks, in spring and autumn, corresponding to, and just after, phytoplankton blooms (Valdés et al., 2007). Zooplankton communities are composed mainly of copepods (more than 70% of the total abundance), although other taxa such as Cladocera, Siphonophora, Thaliacea and Appendicularia also display high densities (Albaina and Irigoien, 2007). The pelagic fish community is mainly dominated by small species such as European anchovy Engraulis encrasicolus, sardine Sardina pilchardus, horse mackerel Trachurus trachurus and blue whiting Micromesistius poutassou all year round and Atlantic mackerel Scomber scombrus which seasonally enters the Bay during spring, as well as some migratory tuna species such as albacore which enters the BoB to feed on smaller pelagic fish (Goñi et al., 2011; Borja et al., 2018). Together with the latter, at the top of the pelagic food chain of the BoB are migratory and resident cetaceans and seabirds, including some endangered species (Pérez-Roda et al., 2017; Borja et al., 2018; Astarloa et al., 2019; García-Barón et al., 2019), although large demersal fish do also benefit from small pelagic forage fish regularly (Preciado et al., 2008; López-López et al., 2012).
The present study aimed to analyze seasonal changes in the trophic ecology of the pelagic community of the BoB using a multispecies and multitrophic approach. Based on information collected from integrated ecosystem-surveys, where information on oceanography, phytoplankton, zooplankton, small pelagic fish and marine megafauna is collected, we characterized the trophic ecology of the pelagic community using two complementary approaches (stomach contents and stable isotopes analysis). At the pelagic fish community level, different trophic metrics were estimated to assess prey contribution, diet overlap and trophic position. Specifically, trophic position was estimated from trophic information obtained from SCA and SIA to assess the influence of body condition and season. Our works provide novel insights on the trophic characterization of the pelagic fish community combining SCA and SIA. Our results might help elucidate the response of trophic variability in the Bay of Biscay that could contribute to the ecosystem monitoring of the pelagic domain.
Samples were collected in the Bay of Biscay during two ecosystem integrated surveys that cover the continental shelf and oceanic areas in spring (BIOMAN survey) and late summer (JUVENA survey) in two consecutive years, 2020 and 2021 (Figure 1). The BIOMAN survey aims to evaluate the European anchovy and sardine populations in the BoB to advice on the regulation of these fisheries (Santos et al., 2018). The JUVENA survey is designed to monitor juvenile anchovy and other small pelagic fish over both Spanish and French continental shelf and slope waters (Boyra et al., 2013). Additionally, within these surveys, information on the oceanographic conditions, plankton communities, and marine megafauna species is collected. Sampling was conducted in 4 different oceanographic areas within the BoB, based on Santos et al. (2013) and Koutsikopoulos and Cann (1996): Central Cantabrian (CC), East Cantabrian (EC), Garonne area (GR) and South Britain area (SB) (Figure 1).
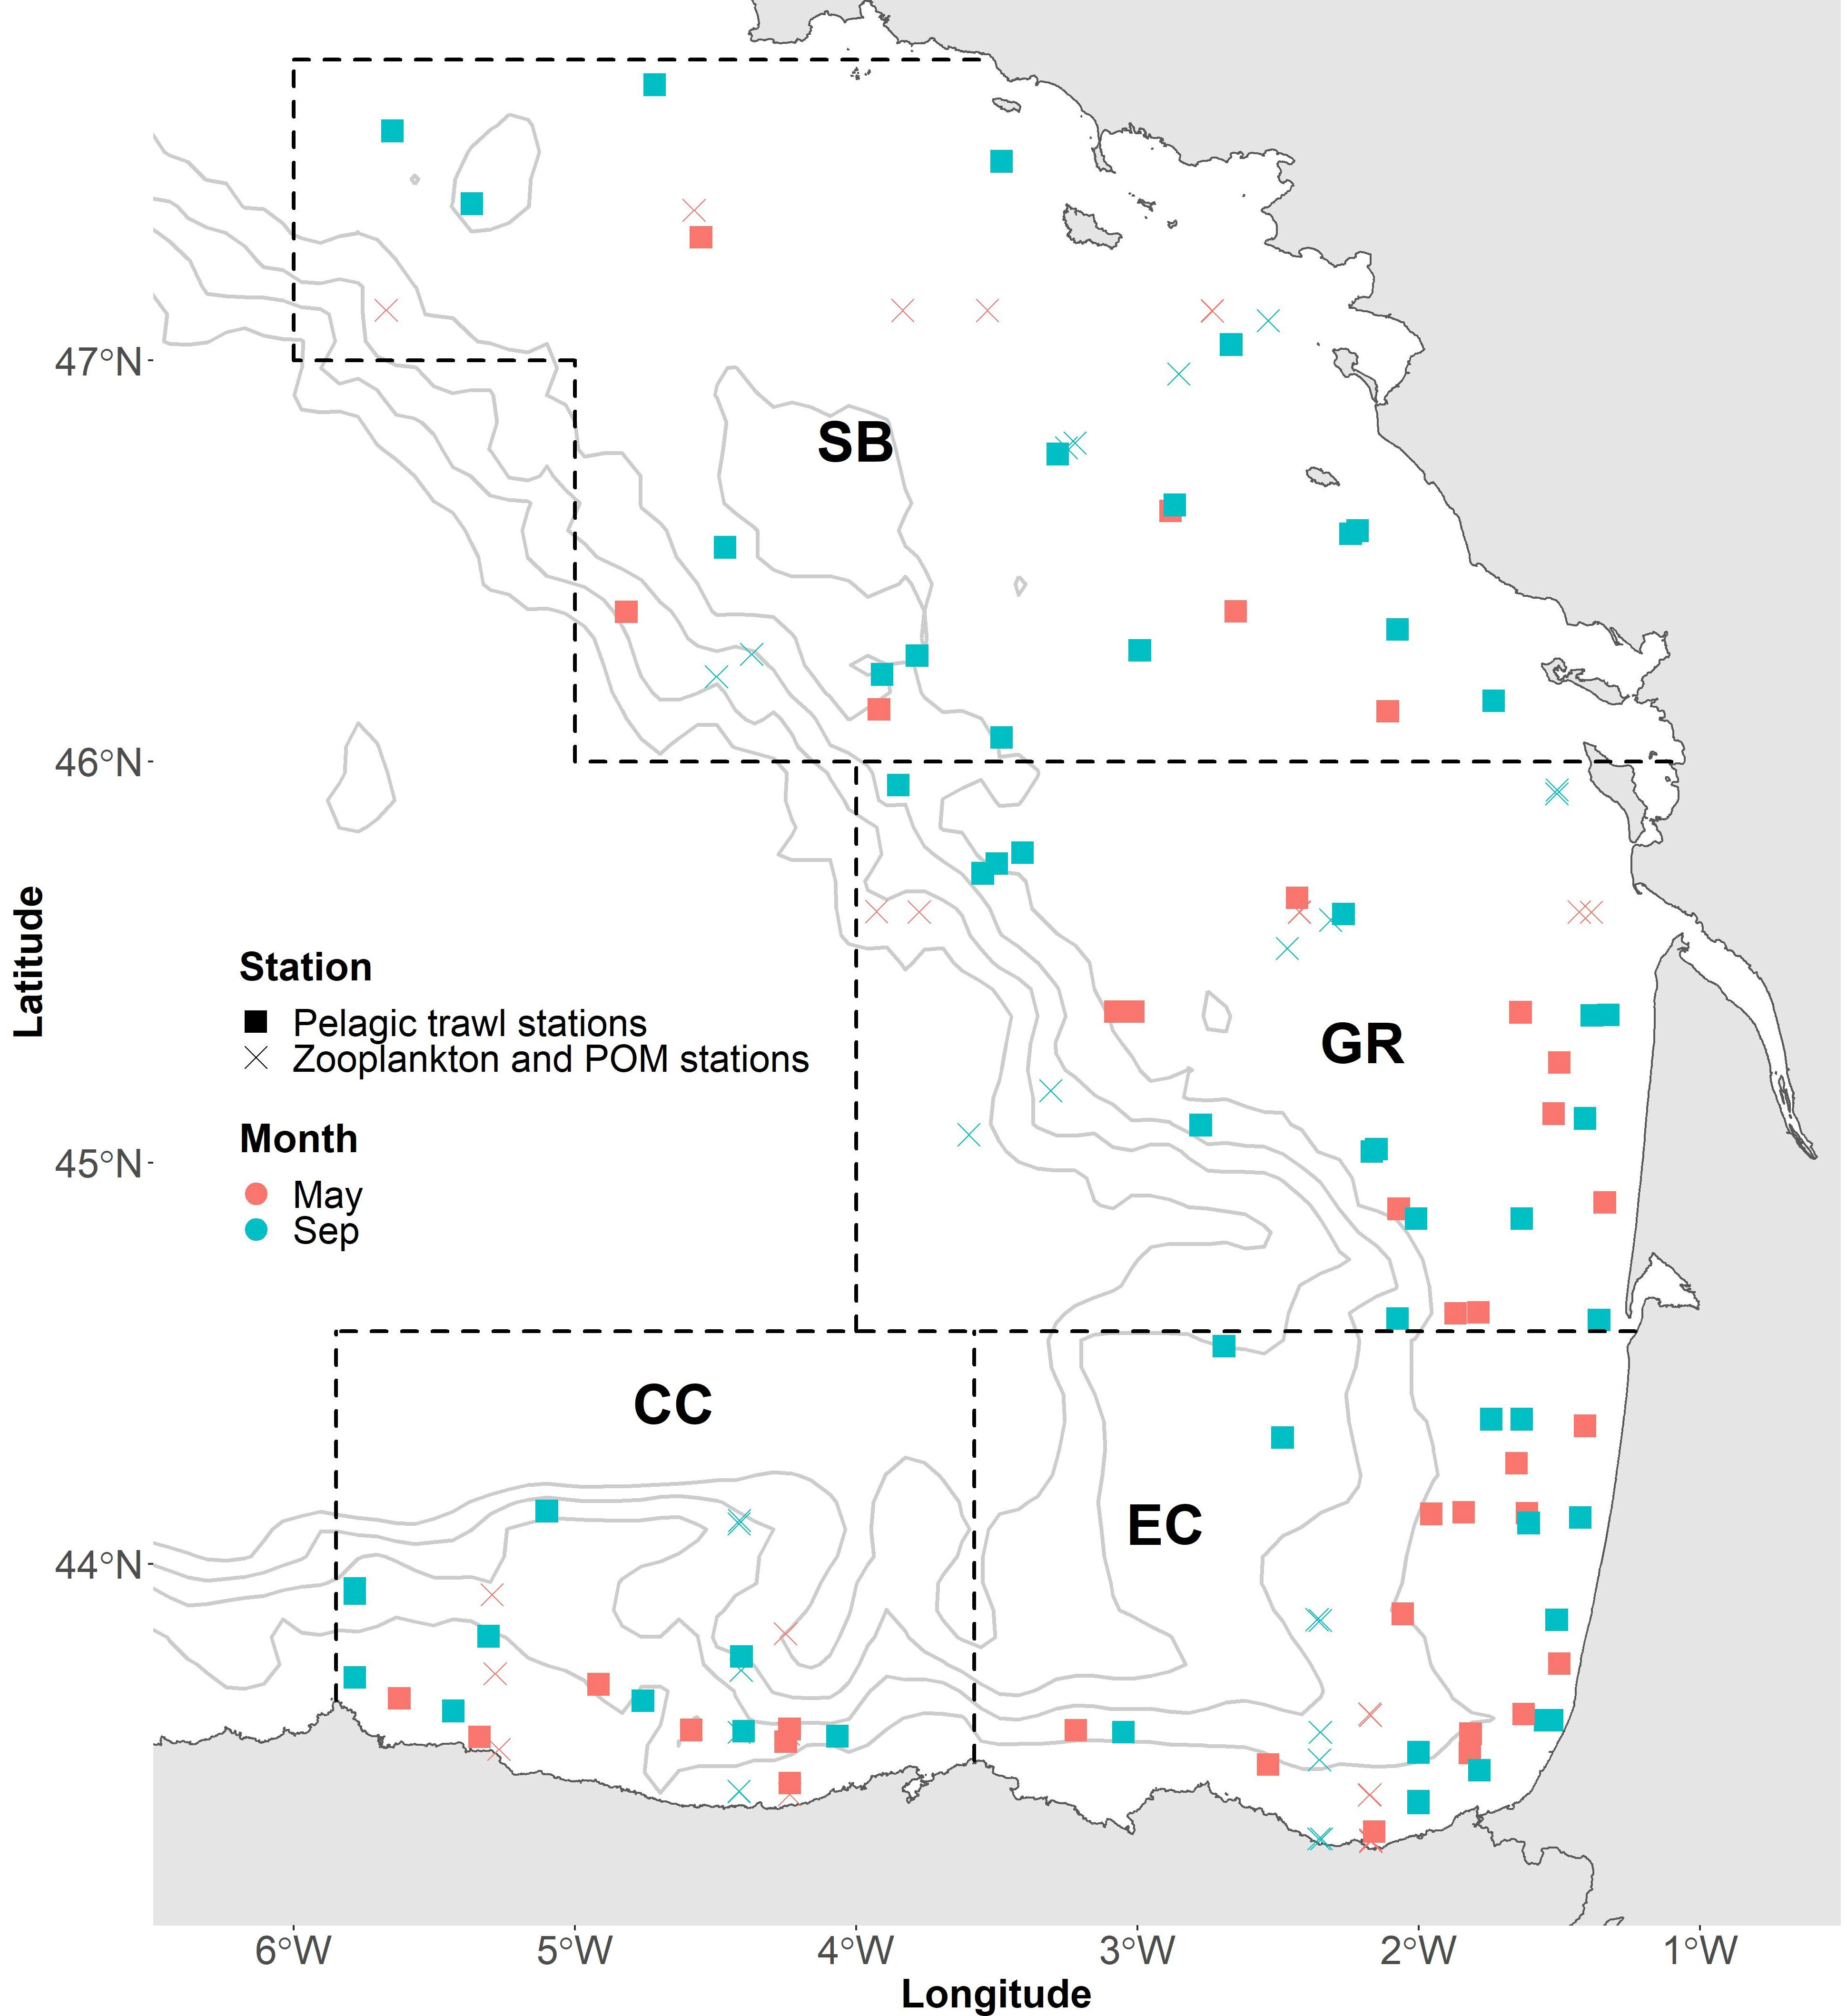
Figure 1 Pelagic trawl and zooplankton stations in each season (May and September) in the Bay of Biscay. Boundaries represent 4 different oceanographic areas, based on Santos et al. (2013) and Koutsikopoulos and Cann (1996): Central Cantabrian (CC), East Cantabrian (EC), Garonne area (GR) and south Britain area (SB).
The pelagic community was characterized using pelagic trawls collecting fish, crab, krill and squid samples. A total of 90 pelagic hauls were carried out, at depths ranging from 1.2 to 310 m (Figure 1), based on registrations from acoustic sampling. Fish sampling included boarfish (Capros aper), anchovy, Mueller’s pearlside (Maurolicus muelleri), hake (Merluccius merluccius), blue whiting, sardine, Atlantic chub mackerel (S. colias), Atlantic mackerel, sprat (Sprattus sprattus), Mediterranean horse mackerel (T. mediterraneus), horse mackerel and poor cod (Trisopterus minutus). All trawls lasted around 50 minutes at 4 knots, keeping the initial fishing depth whenever possible. In each sampling station, 10 individuals of each species were set aside randomly. Crabs, krill, fish and squid samples were preserved frozen immediately after collection for further analyses of SIA (all samples) and SCA (fish). Zooplankton communities were sampled in each survey and each area at three different bathymetrical ranges: coast, continental shelf and upper slope. We used PairoVET (Pair of Vertical Egg Tow, Smith et al., 1985) nets with a mesh size of 150µm, sampling the water column with vertical tows in depths ranging from 15 to 100m (Figure 1). These samples were preserved in ethanol (96%) for later isotope analysis.
The stomach contents of 12 pelagic fish species were analyzed Table 1. In the laboratory, each fish was first sized (0.5cm) and weighted (0.1g) and then the stomach was dissected, weighted, and preserved in ethanol (96%) for later stomach content analysis.
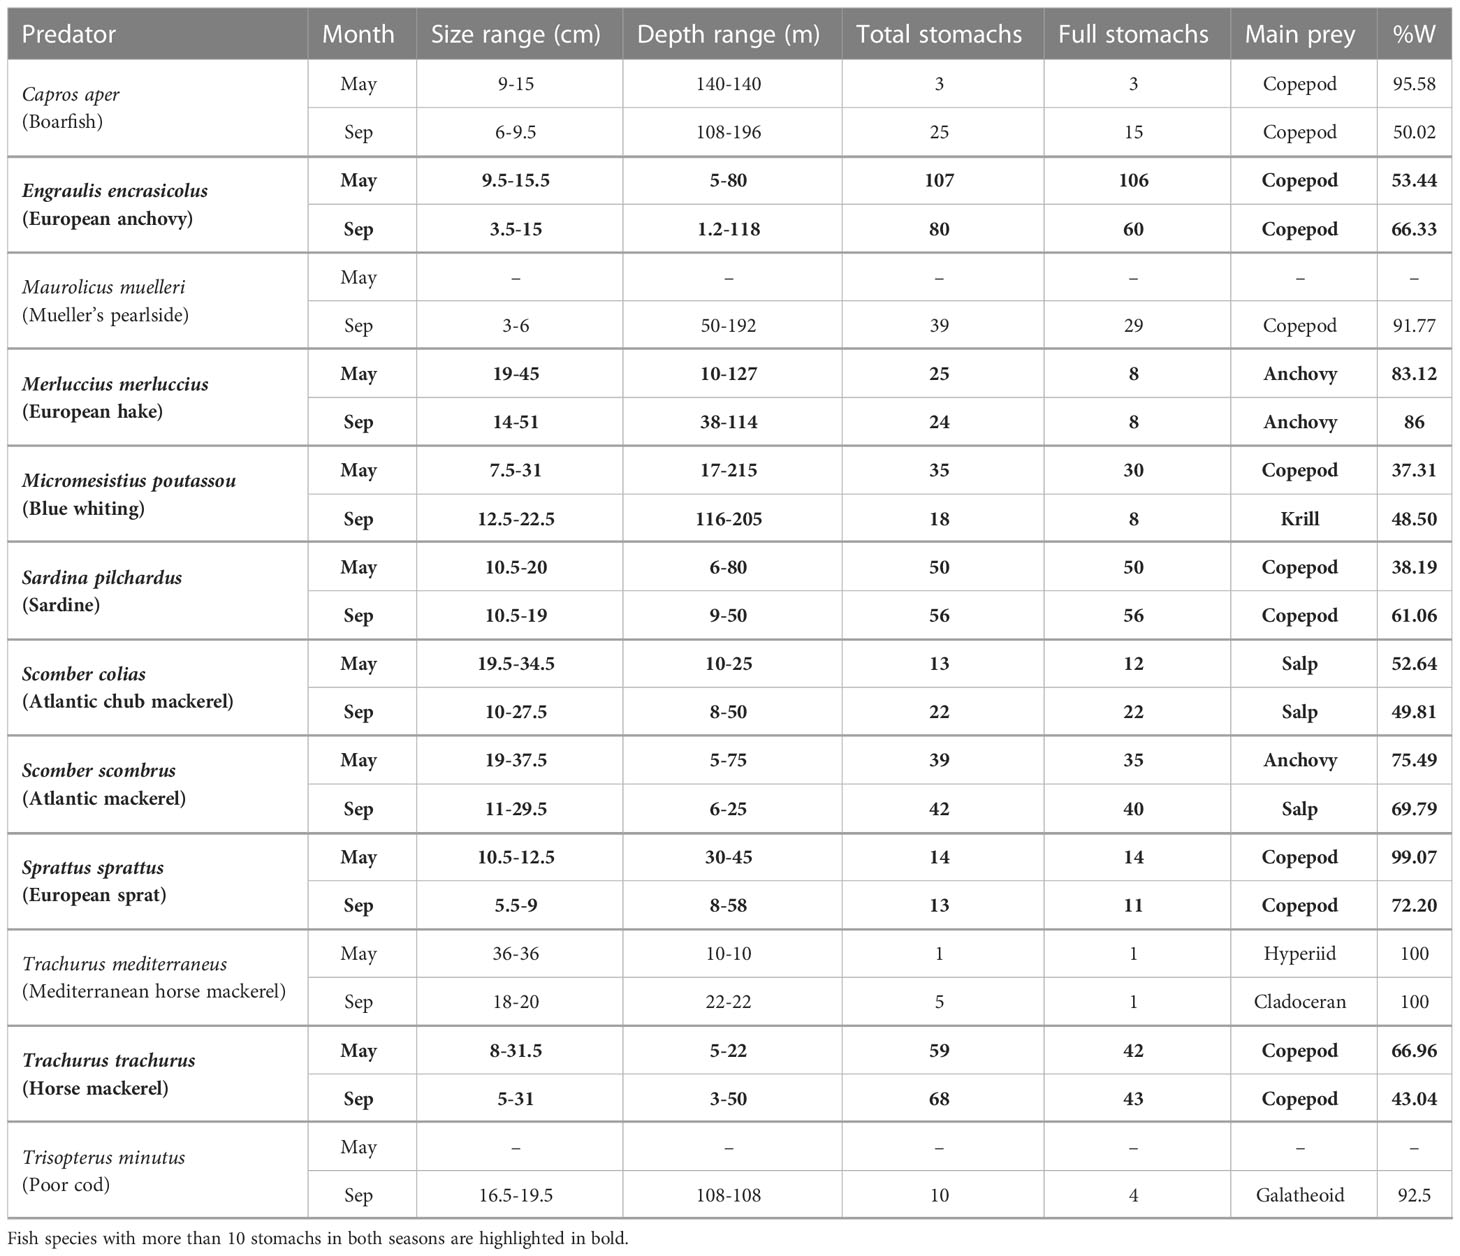
Table 1 Summary of the collected pelagic fish in each season describing the size range, collected depth range, number of total analyzed stomachs, number of full stomachs, main prey and main prey weight (%W).
A stereomicroscope was used for the identification of prey items. During processing, prey items were carefully separated, counted and classified to the lowest identifiable taxonomic group, adding up to a total of 30 prey taxa identified. A subsample was taken and analyzed in those stomachs with large amounts of zooplankton. To make the illustrations clearer, the 30 types of prey were merged into 9 larger taxon groups. The unidentifiable items were considered as digested material and thus were not quantified. Then the percentage of each prey in the stomachs was estimated by the relative volume. Prey weight was calculated from the total stomach weight and the relative volume of the prey. In subsequent analyses, only those fish species with at least 10 stomachs in both seasons were used (8 species). The contribution of each food item to the diet of each species was expressed using common qualitative and quantitative metrics in the trophic ecology literature: the frequency of occurrence in percentage (%FO), the abundance by number (%N) and the abundance by weight (%W).
To study the trophic overlap among predators, the Schoener Index (S) was computed (Schoener, 1970). Prey weight was used for the calculations, since it better represents the relative importance of any prey item when it is partially digested or is difficult to count (Hyslop, 1980). The degree of overlap between the diet of two predators is considered biologically significant when values are above 0.6 (Wallace, 1981). Values between 0.3 and 0.6 are considered as medium overlap and values lower than 0.29 as low overlap (Langton, 1982). The R package spaa (Zhang, 2016) was used for the calculations.
To identify feeding patterns based on the diet composition, a quantitative matrix of predator-prey (prey weight) was calculated. Prey weight values were normalized by applying a logarithmic transformation. A hierarchical classification analysis was performed on a matrix containing 8 predators and 30 prey taxa based on the Bray-Curtis dissimilarity index and the distance matrix calculated with the UPGMA algorithm. Then, a SIMPER analysis was conducted to identify which prey contributed most to the dissimilarities between the predators’ diet. The vegan package of R (Oksanen et al., 2022) was used for these analyses.
Muscle tissue samples were extracted at the laboratory from fish, squids, crabs and krill for the stable carbon (δ13C) and nitrogen (δ15N) isotope analysis. The samples were placed in a drying oven for 48h at 60°C, then grounded until a fine powder was obtained, and finally a subsample of 1-1.5 mg of this powder was weighted and packed into tin capsules for the isotopic analysis. Zooplankton samples were first analyzed under a stereomicroscope. Individuals of the same taxonomic group were set aside and grouped and then they were placed in a drying oven for 48h at 60°C. Finally, they were packed (whole individuals and grouped) into tin capsules for the isotopic analysis. Some prey taxa present in the stomachs of fish could not be obtained from zooplankton samples in enough number (i.e., sufficient weight) to perform SIA.
The isotopic analyses were carried out at the Servizos da Apoio á Investigación (SAI, Universidade da Coruña, Spain). The δ15N and δ13C determination was performed using a FlashEA1112 (ThermoFinnigan) analyzer coupled to a MAT253 ThermoFinnigan) mass spectrometer through a Conflo IV interface. δ15N and δ13C were expressed as parts per thousand (‰) with a standard deviation of ± 0.15‰. δ13C values were corrected to avoid the potential effect of lipids on individuals with a C:N ratio higher than 3.5, following the formula proposed by Post et al. (2007):
The trophic position (TP) of each predator was calculated both based on the stable isotopes (TPSIA) and stomach content analysis (TPSCA), and both estimates were used to carry out a seasonal comparison of the variation in the TP.
The filter feeder class Thaliacea (salp) was used as a baseline for its consistent low values of δ15N (Stowasser et al., 2012; Ménard et al., 2014). To calculate the TPSIA the incremental approach suggested by Hussey et al. (2014) was applied:
where δ15Nsample and δ15Nbase are the N isotopic signatures of each sample and the reference baseline (salps), 2 is the trophic position of the reference baseline, δ15Nlim is the saturating isotope limit as trophic position increases, and k the rate at which δ15Nsampleapproaches δ15Nlim. Values for δ15Nlim = 21.926 and k = 0.137 were provided by the meta-analysis of Hussey et al. (2014).
The TPSCA was calculated applying the formula suggested by Pauly et al. (2000):
where TPi is the trophic position of prey i, Wnij is the weight fraction of prey i in the diet of predator j, and m the total number of preys. TPivalues were assigned based on our results of isotopic δ15N signatures of the prey. For those prey taxa where TPi was not available, data were obtained from the literature and TrophLab values (Fishbase, Froese and Pauly, 2000).
To analyze changes in the TP of pelagic fish along their ontogeny, we applied a Linear Mixed-effects Model (LMM) using the TP as dependent variable (both for TPSIA and TPSCA). We used a multispecies approach, including all fish species in the same model and establishing predator size (continuous) and season (categorical) as explanatory variables. To account for the potential effect of the predator identity, predator species was included as random variable. The lmer4 package of R (Bates et al., 2015) was used for these analyses. To choose the final model, a selection of explanatory variables was carried out using a backwards/forwards stepwise selection process based on the Akaike’s Information Criteria (AIC). The MuMIn package of R (Bartón, 2022) was used for this purpose. Those models with ΔAIC (the difference between the AIC value of the model and the model with the lowest AIC value) less than 2 were considered equivalent. AIC weights were used for the model’s comparison.
A total of 744 stomachs from 12 pelagic fish species were analyzed, 147 of which (19.76%) were empty or with unidentifiable food/prey items. A summary of the total number of stomachs and analyzed (full) stomachs, size range and depth range per season for each pelagic species is shown in Table 1. The size of the individuals varies in spring from 7.5 cm of M. poutassou to 45 cm of M. merluccius and in late summer from 3 cm of M. muelleri to 51cm of M. merluccius. Two species, M. muelleri and T. minutus, were only present during late summer. C. aper, M. muelleri, T. minutus and T. mediterraneus were not included in further analyses due to their low sample sizes.
Based on the prey weight (%W), copepods were the most common prey in both seasons for four species, European anchovy, sardine, sprat and horse mackerel, and for blue whiting in spring with values ranging from 37.31%-99.07% (Table 1 and Figure 2). Blue whiting was the only predator mostly relying on krill, particularly in late summer (%W = 48.50%, Table 1 and Figure 2). Salps were also a common food resource in both seasons for Atlantic chub mackerel and in late summer for Atlantic mackerel, with %W ranging from 49.81%-69.79% (Table 1 and Figure 2). Anchovy was the main prey in both seasons for hake, as well as for Atlantic mackerel in spring (%W from 75.49%-86%, Table 1 and Figure 2). Other relevant prey (%W > 25%) found included fish eggs in the diet of sardines, gastropods in the diet of anchovies and hyperiids in the diet of blue whitings (Table S1 and Figure 2).
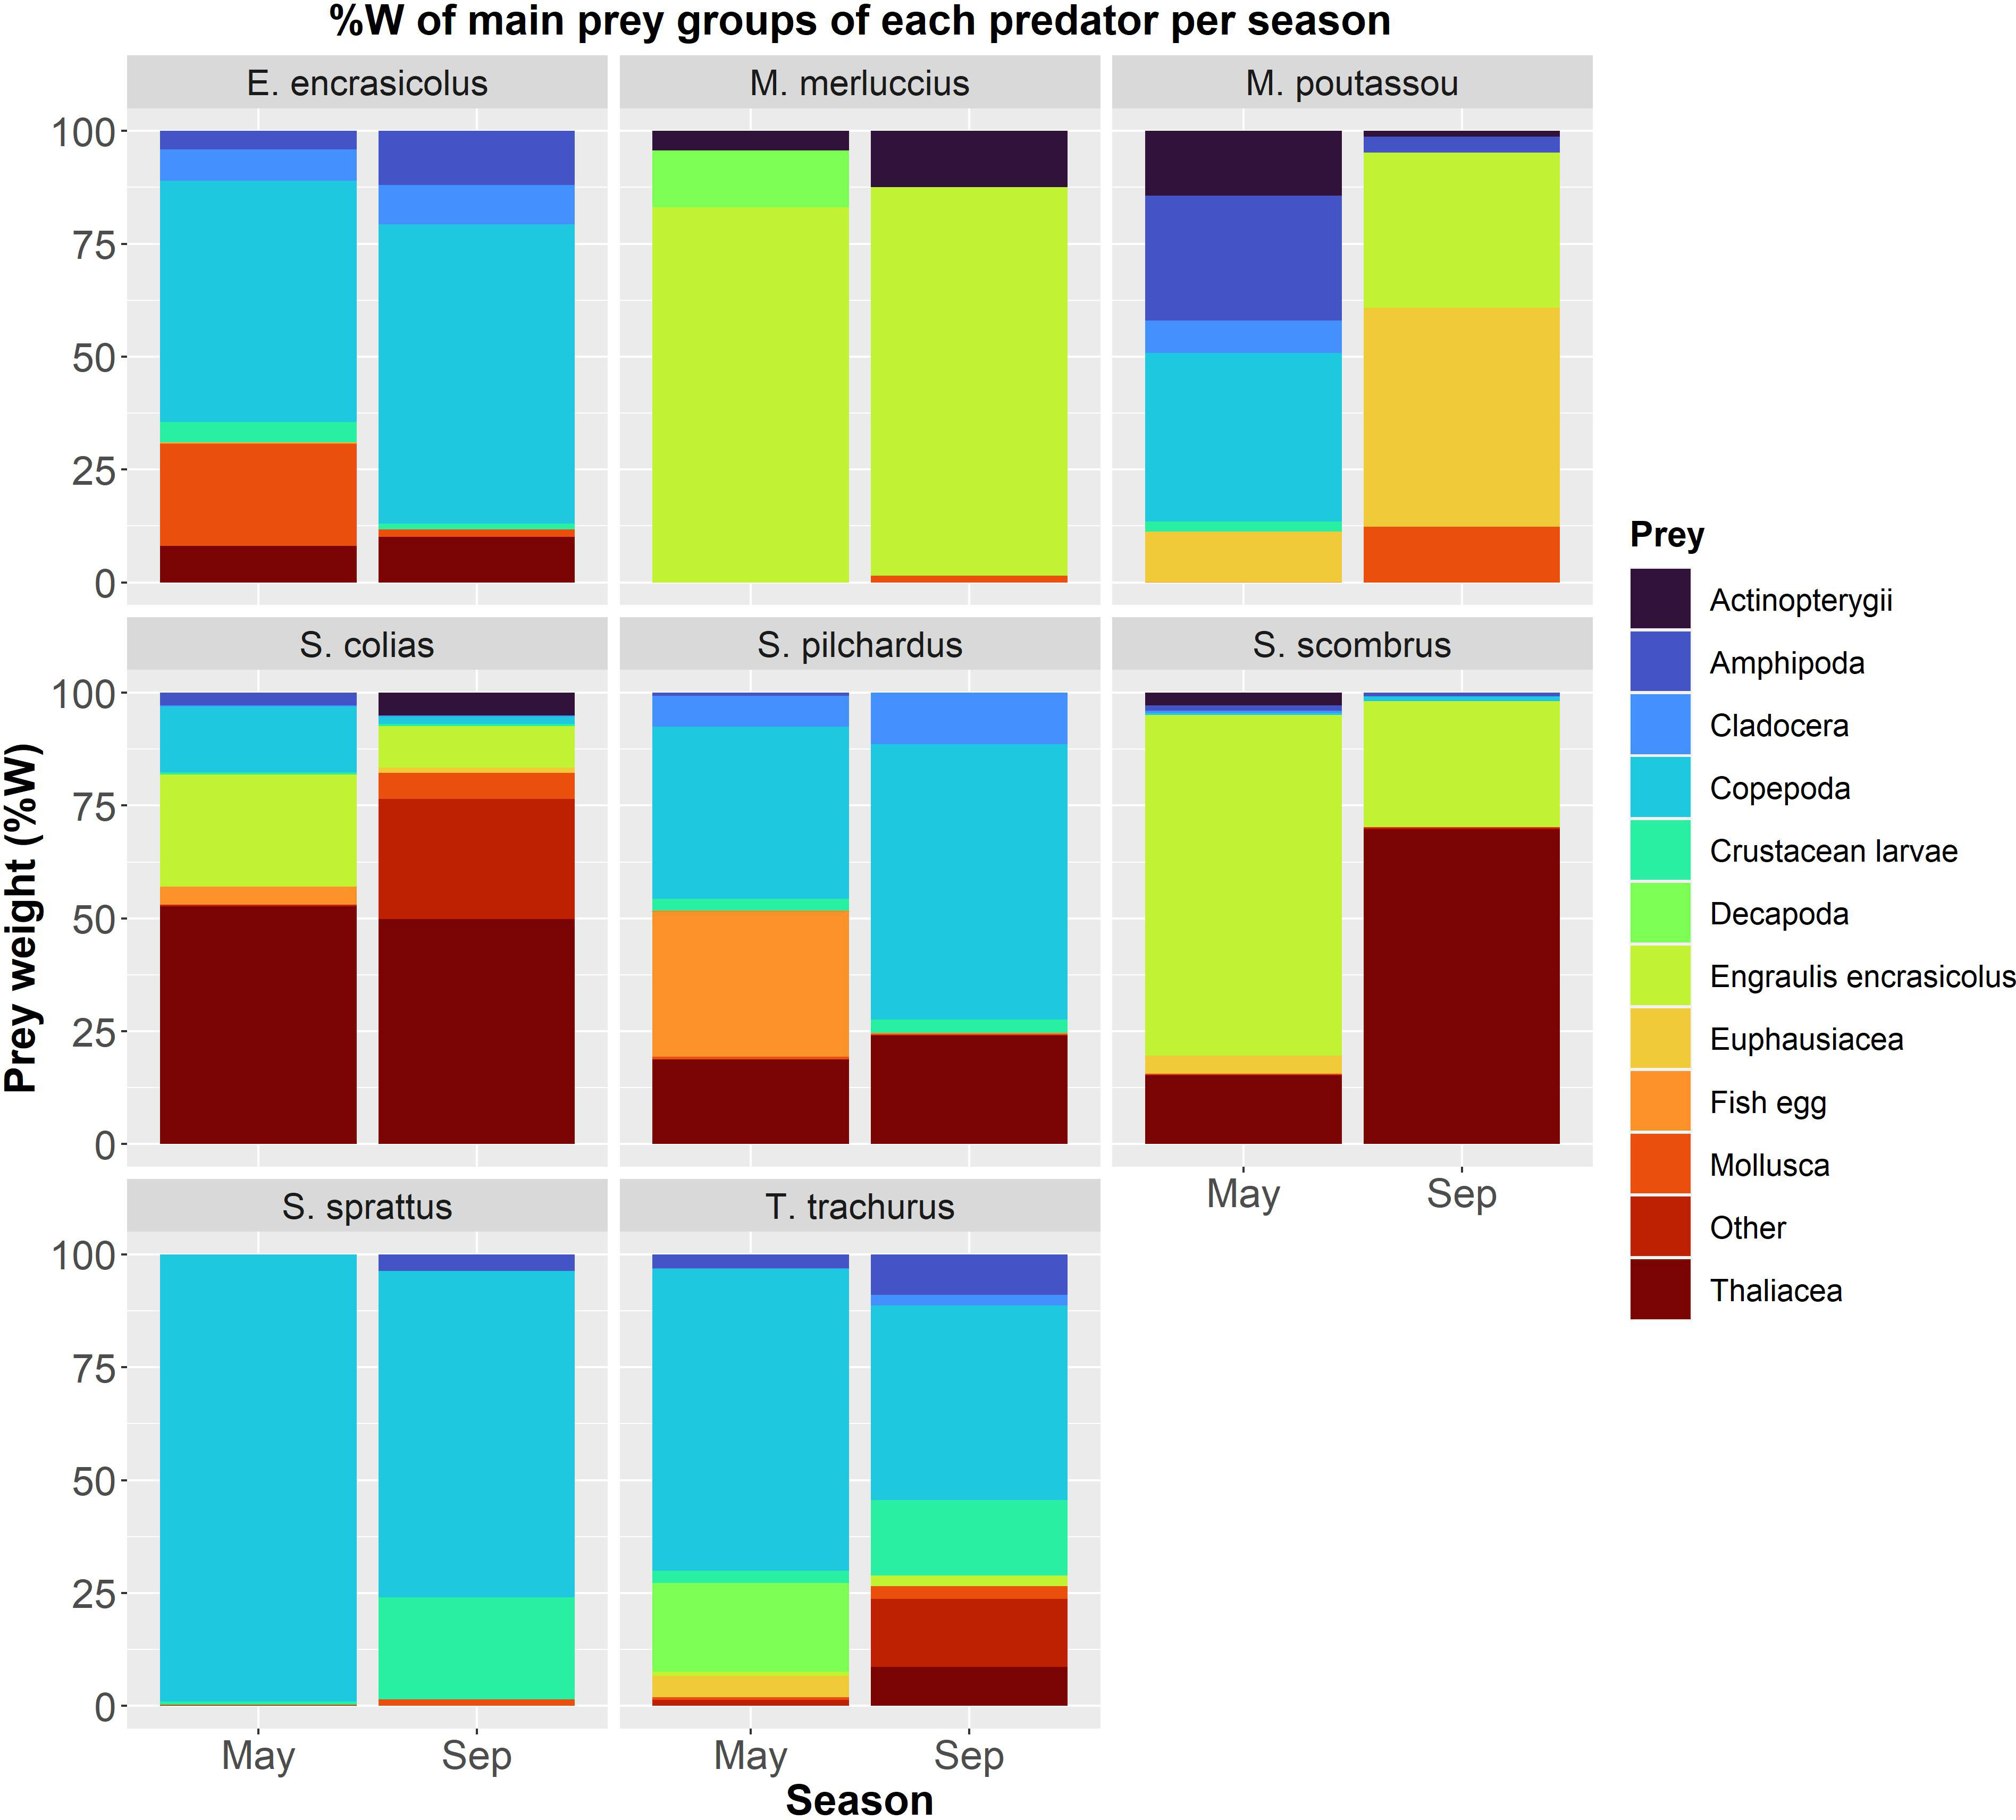
Figure 2 Prey weight (%W) for 12 prey groups of 8 fish species per season. Values can be found at Table S1.
Differences in trophic overlap of most species were evident among seasons. In spring, small pelagic fishes (clupeid species, i.e., anchovy, sardine and sprat; horse mackerel; and blue whiting) showed medium or significant trophic overlap between them (S > 0.30; Table 2). On the other hand, hakes and Atlantic mackerel displayed significant overlap (S > 0.60) between them but no overlap or low (S < 0.30) with the rest of species (Table 2). In late summer, also, a medium or significant dietary overlap was observed among small pelagic fishes, except for blue whiting, which only showed medium overlap with hakes (Table 2). The trophic overlap was also relevant between the two Scombridae species in both seasons (Table 2).
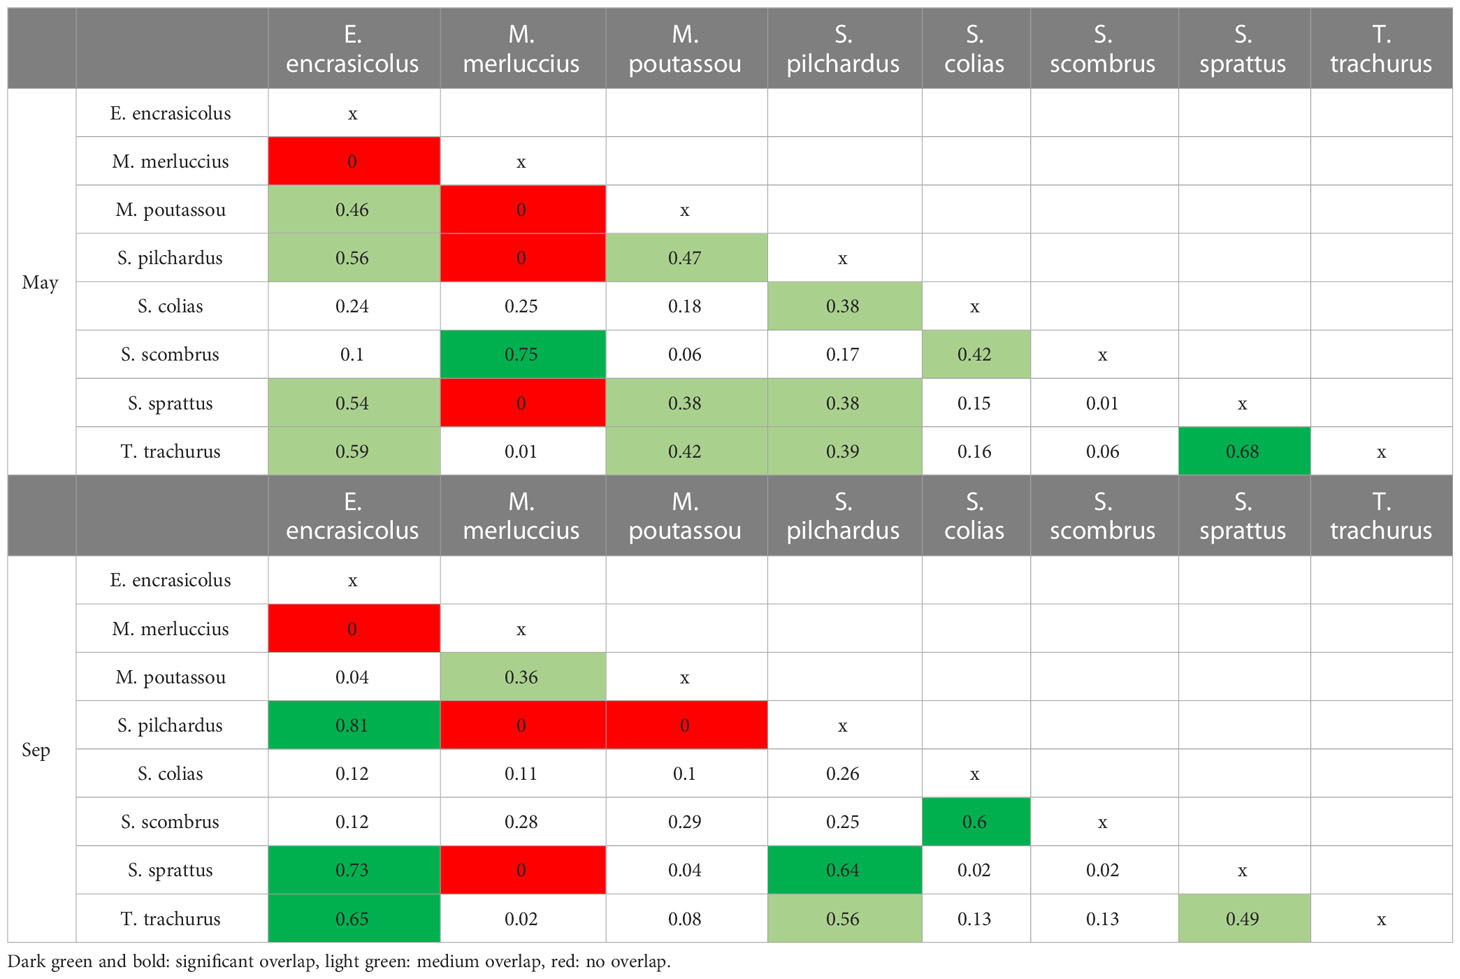
Table 2 Trophic overlap (S: Schoener Index) between 8 fish species per season calculated using the estimated prey weight.
Considering similarities between predators’ diets, the hierarchical classification analysis of prey affinities resulted in three groups of predators (Figure 3): i) planktivores with E. encrasicolus, S. pilchardus and S. sprattus, ii) piscivores which included M. merluccius, S. scombrus and S. colias, and iii) a mixed diet group composed of T. trachurus and M. poutassou, feeding on fish and plankton. SIMPER analysis revealed that the main taxa contributing to the average similarity within planktivores were copepods, salps and hyperiids (Table 3). Among piscivores, the European anchovy and salps were the main prey taxa. Finally, krill, European anchovies and hyperiids constituted the main prey in the diet composition of mixed-diet predators.
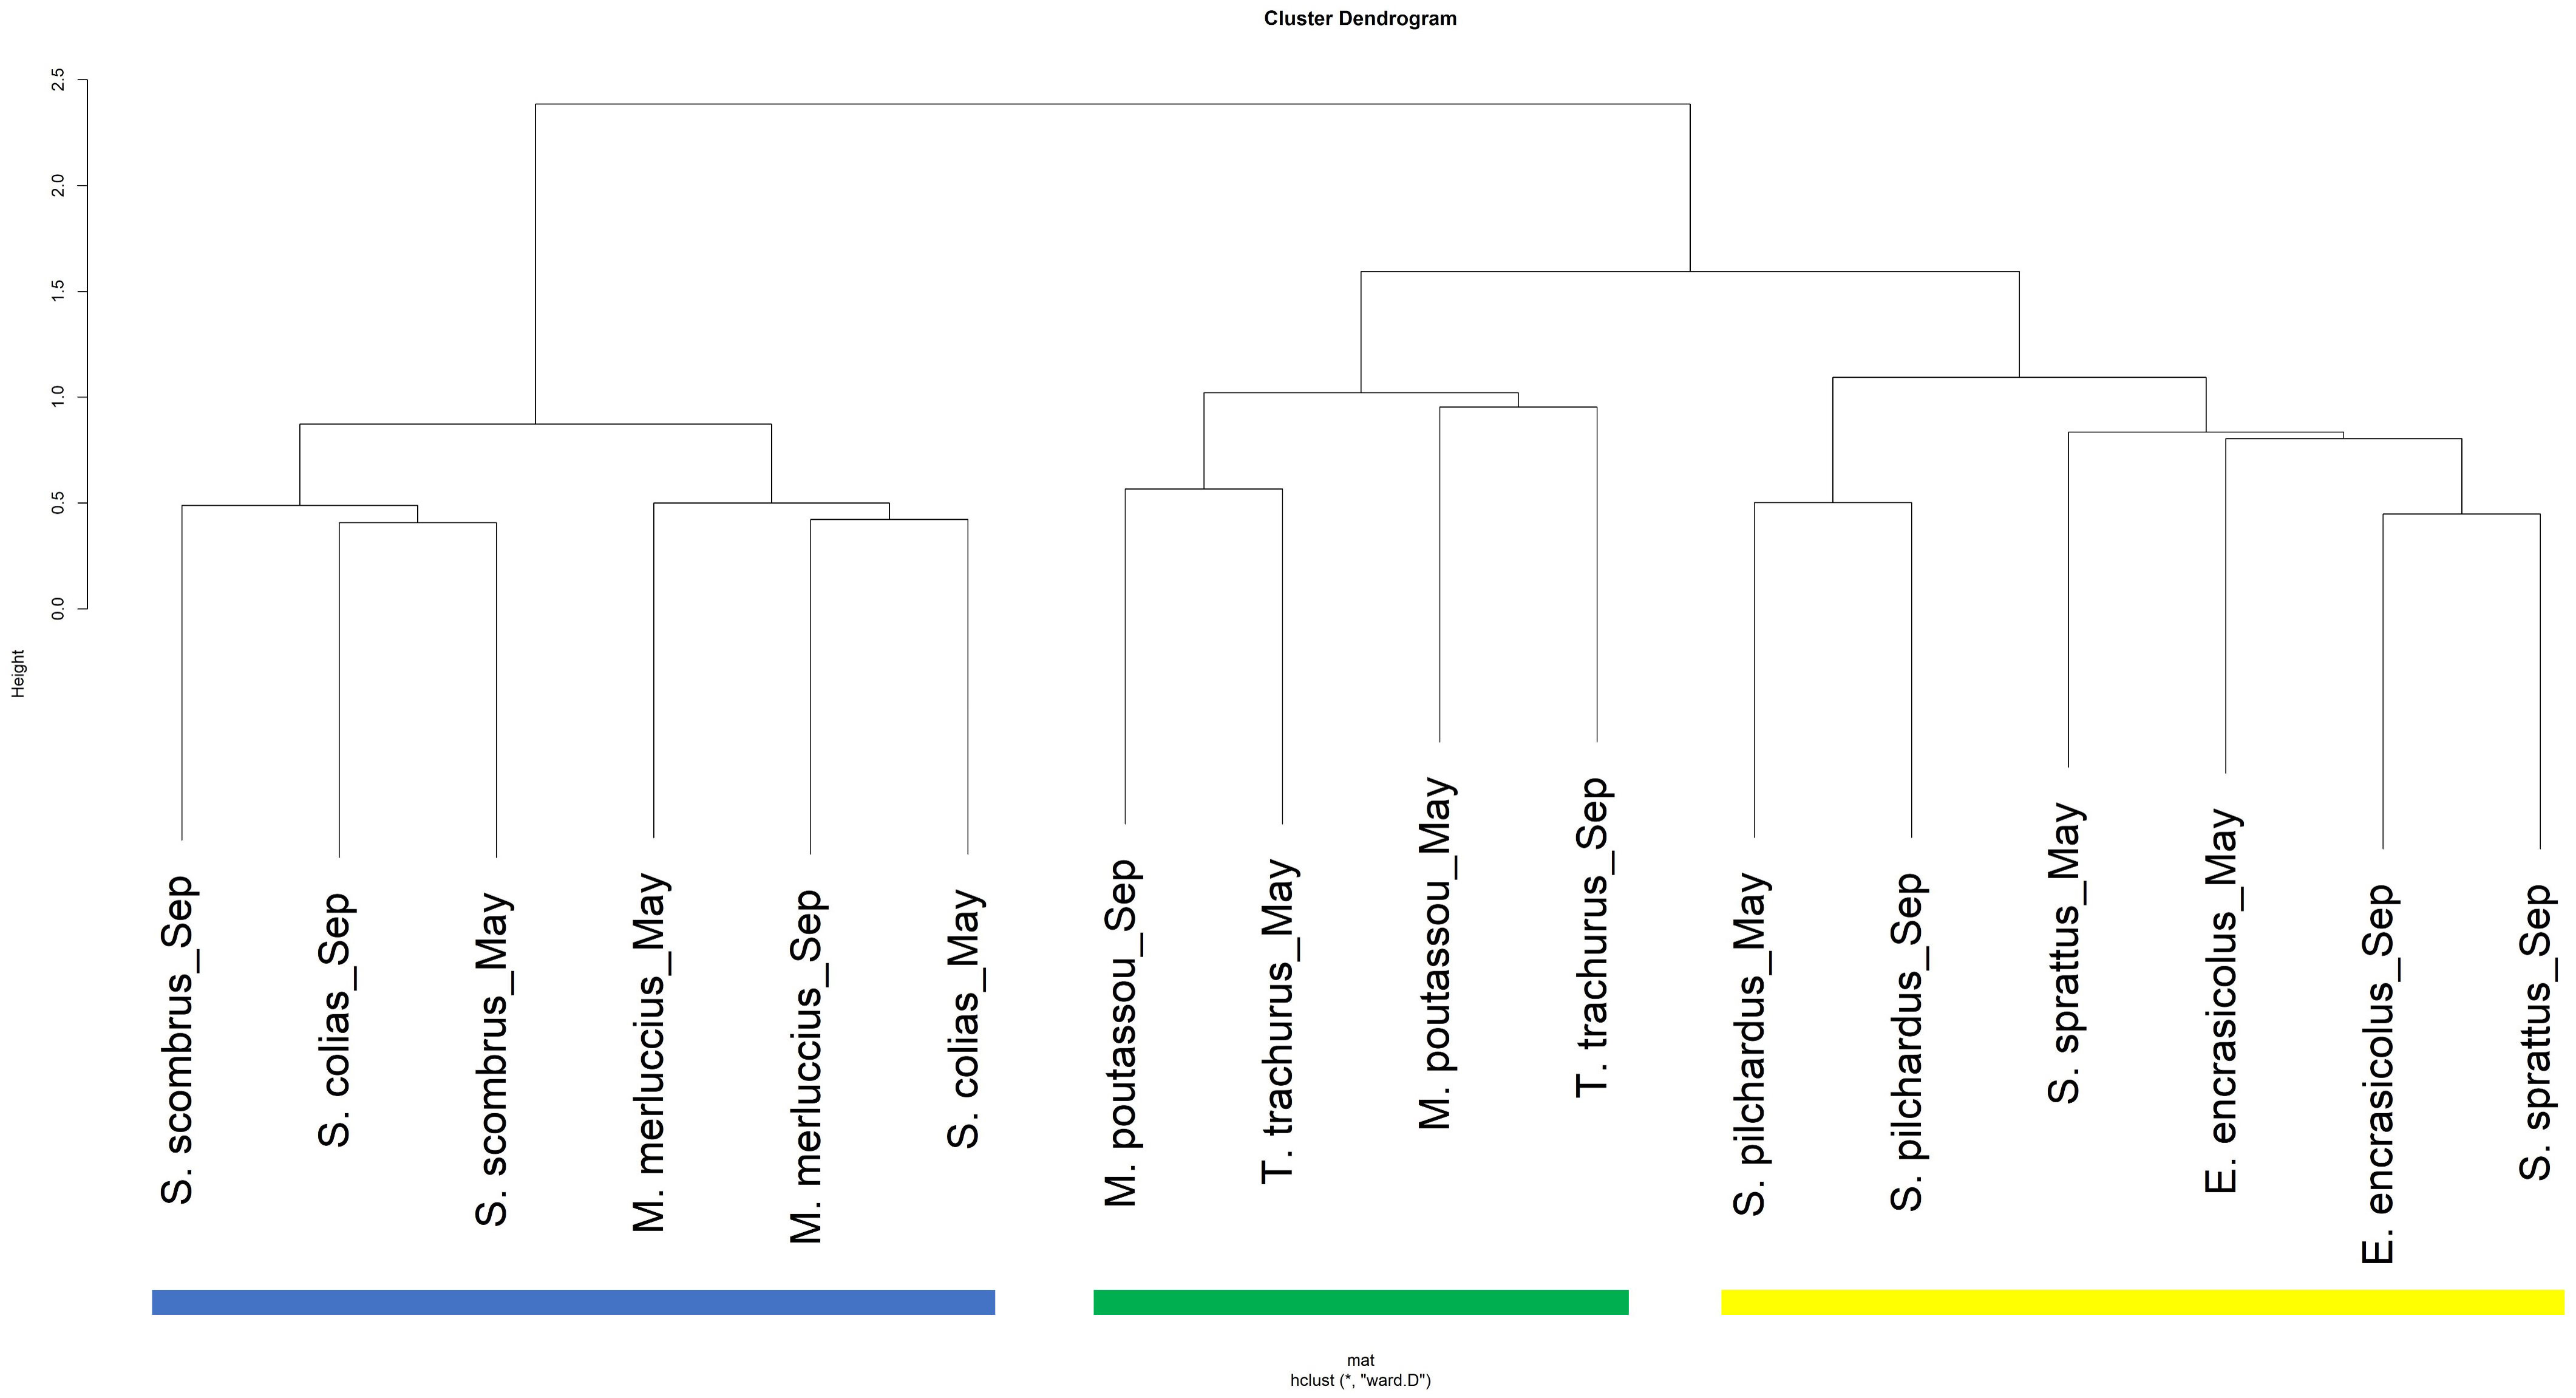
Figure 3 Identification of feeding affinities between 8 fish species per season based on Bray-Curtis dissimilarity of estimated prey weight. Yellow: planktivores; Blue: piscivores; Green: mixed-diet predators.
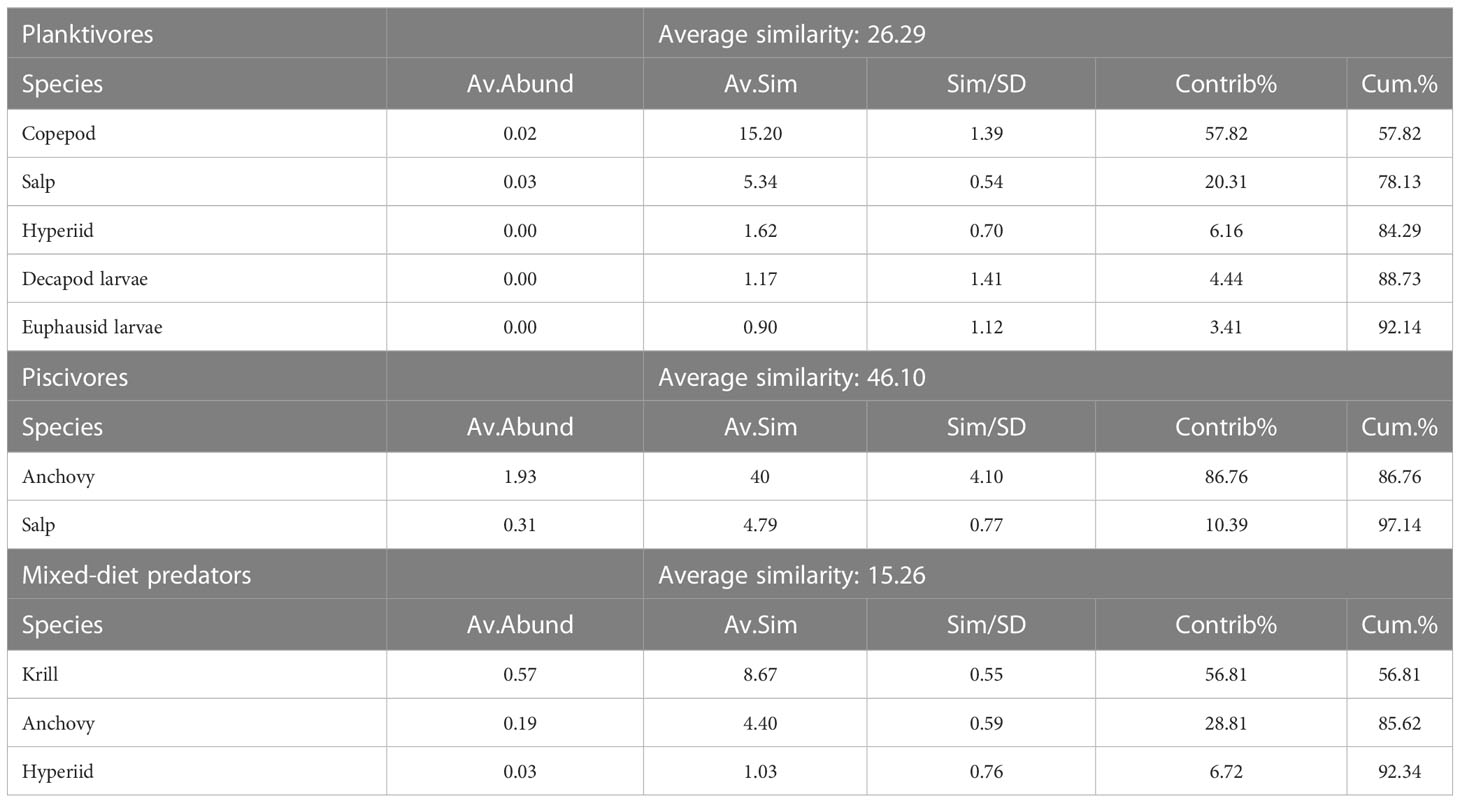
Table 3 Species contributing most to intra-group similarity resulting from the cluster analysis, with a 90% cut-off for low contribution.
Nine fish species, one squid species, one krill species, one pelagic crab and five zooplankton taxonomic groups were analyzed (Table 4, C:N ratios in Table S2). The isotopic biplots (showing δ13C and δ15N values) displayed distinct isotopic signatures between spring and late summer for the whole community (Figure 4). In May, δ13C ranged between -24.8‰ and -17.9‰ whereas δ15N ranged between 5.1‰ and 13.6‰. In September, values ranged between -22.5‰ and -17.5‰ for the δ13C and between 4.9‰ and 14.5‰ for the δ15N. Salps displayed the greatest variability in δ13C values between seasons. In both seasons, salps showed the lowest values of δ15N and δ13C (Table 4 and Figure 4, red circle); then there was a group with copepods, hyperiids, krill and pelagic crabs with higher δ15N values (Table 4 and Figure 4, blue circle), and, finally, another group with the highest δ15N values with fish, squids and chaetognaths (Table 4 and Figure 4, green circle). Boarfish showed lower values in September and was found in the middle group.
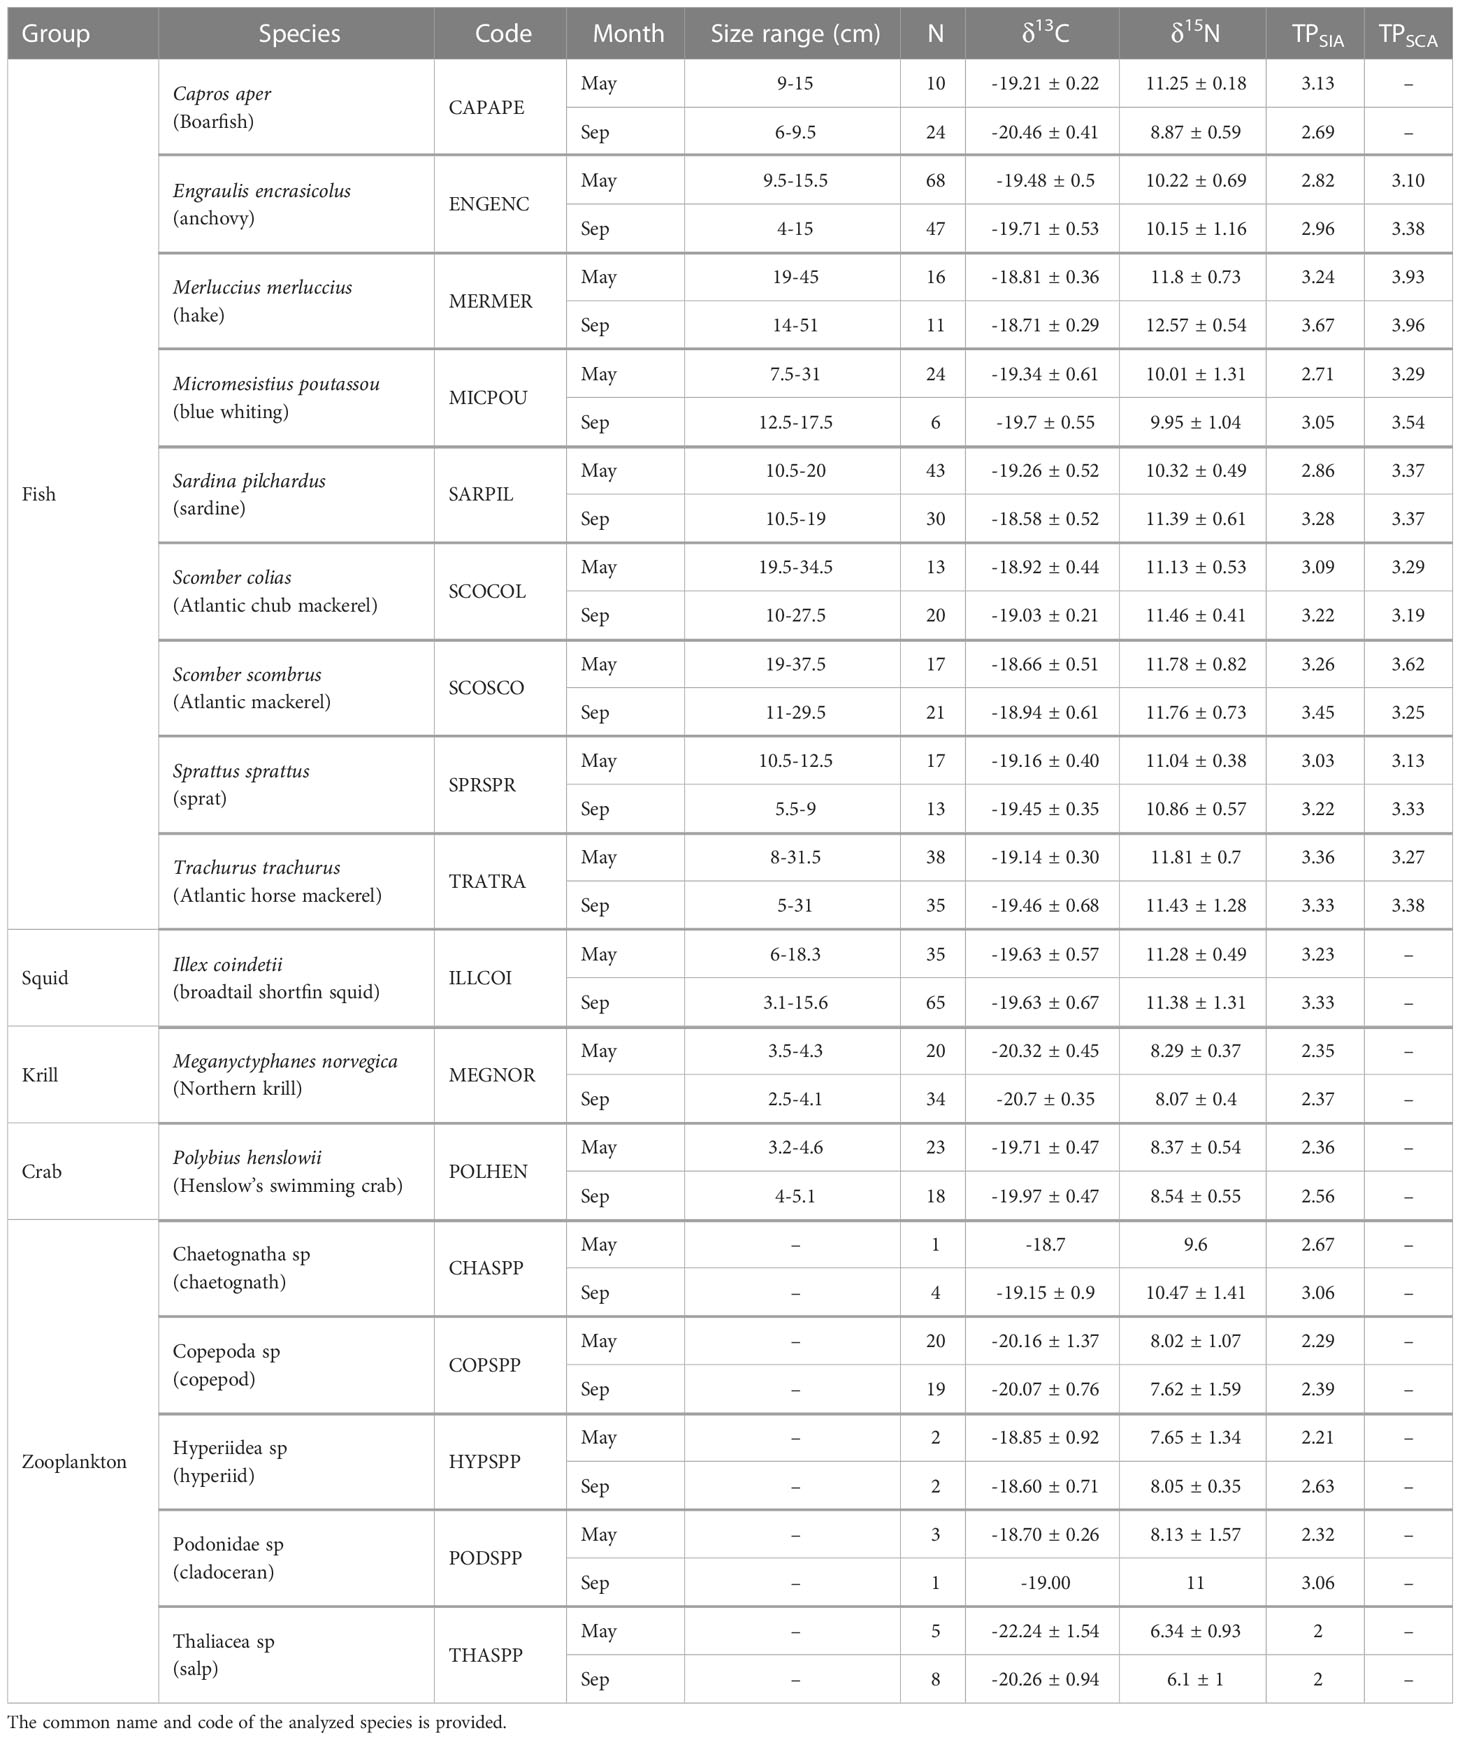
Table 4 Mean (δ15N and δ13C) and standard deviation (SD) of isotopic values, number of samples of the different groups analyzed for stable isotopes per season (N) and trophic position (TP) for each analysis method (SIA and SCA).
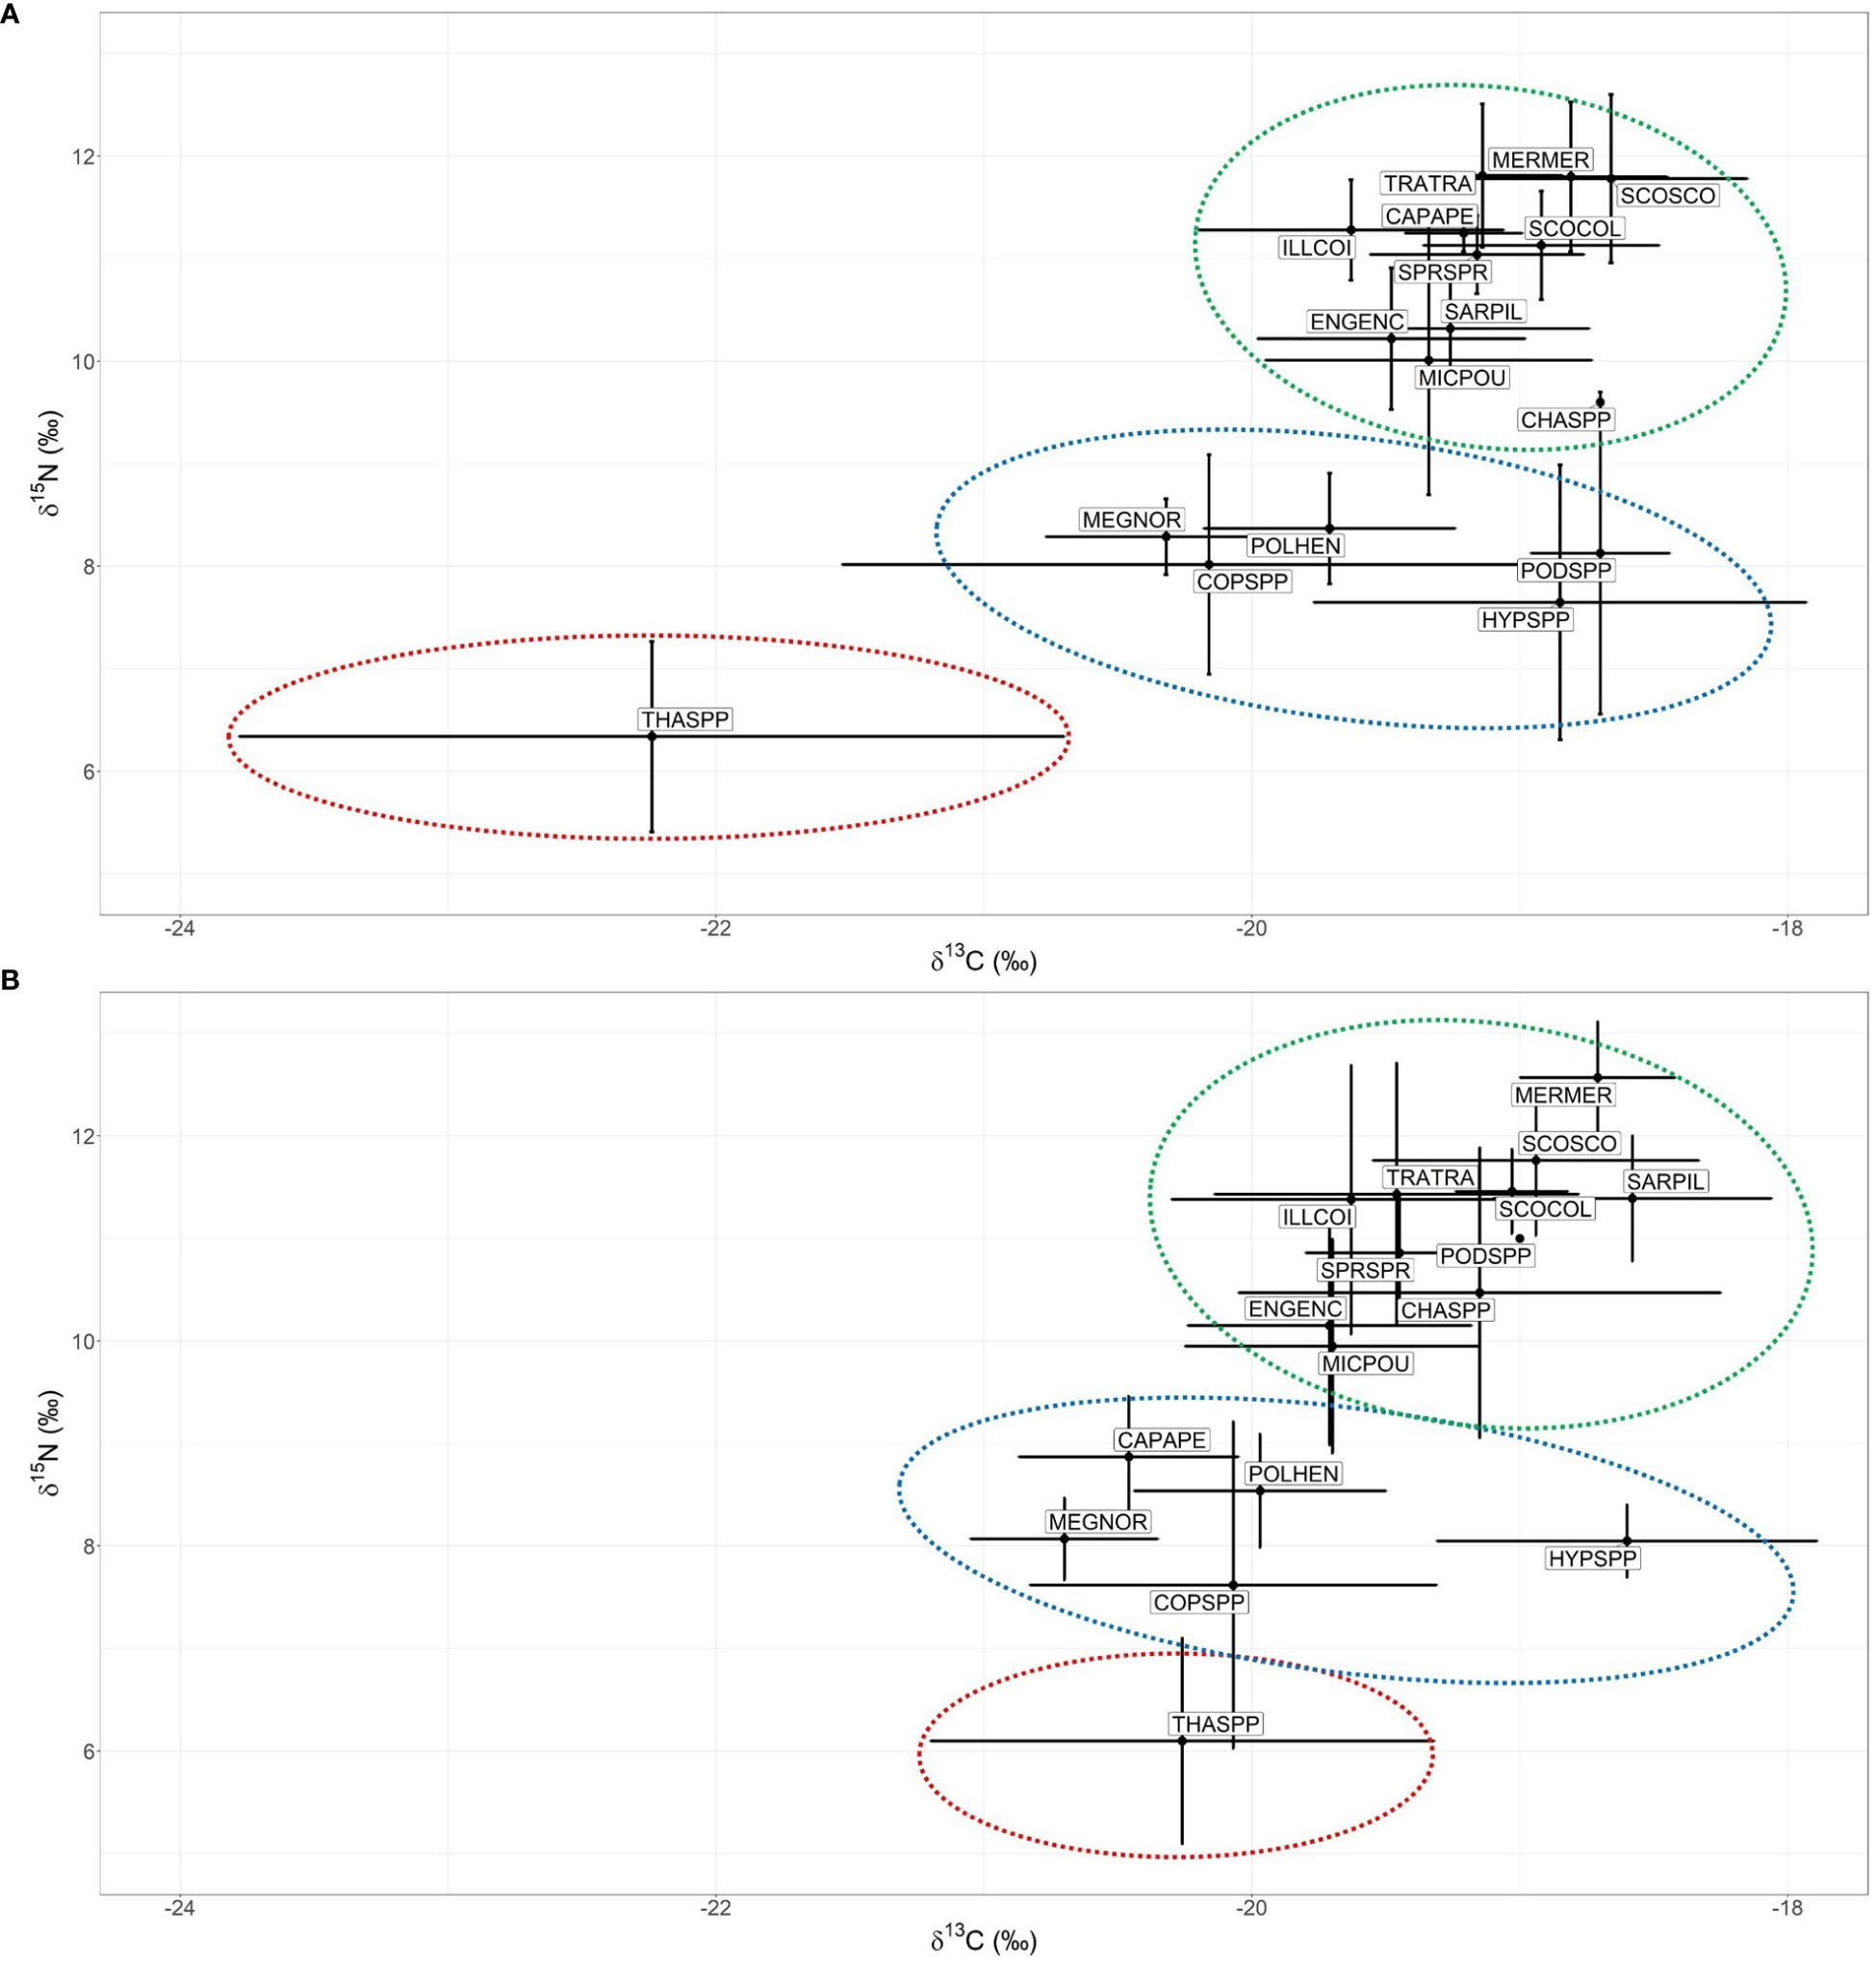
Figure 4 δ13C vs δ15N of all species analyzed in (A) May and in (B) September. Points represents the mean value, segments the standard deviation and circles the groups. Abbreviations and codes are shown in Table 4.
Based on stable isotopes, salps showed the lowest trophic position in both seasons because it was considered as the baseline (TPMay and TPSep = 2, Table 4). T. trachurus displayed the highest TPSIA in May and M. merluccius in September (TPMay = 3.36 and TPSep = 3.67, respectively, Table 4). Based on stomach contents (only fish species), M. merluccius had the highest TP in both seasons (TPMay = 3.93 and TPSep = 3.96, Table 4), whereas E. encrasicolus (TPMay = 3.1) and S. colias (TPSep = 3.19) showed the lowest TP (Table 4). Between-season comparisons showed lower TP in spring than in late summer using both approaches for all predator species, except for S. colias and S. scombrus in the TPSCA value and C. aper in the TPSIA value (Figure 5). Overall, TPSCA was consistently higher than TPSIA, with the exception of T. trachurus in spring and S. colias and S. scombrus in late summer (Table S3).
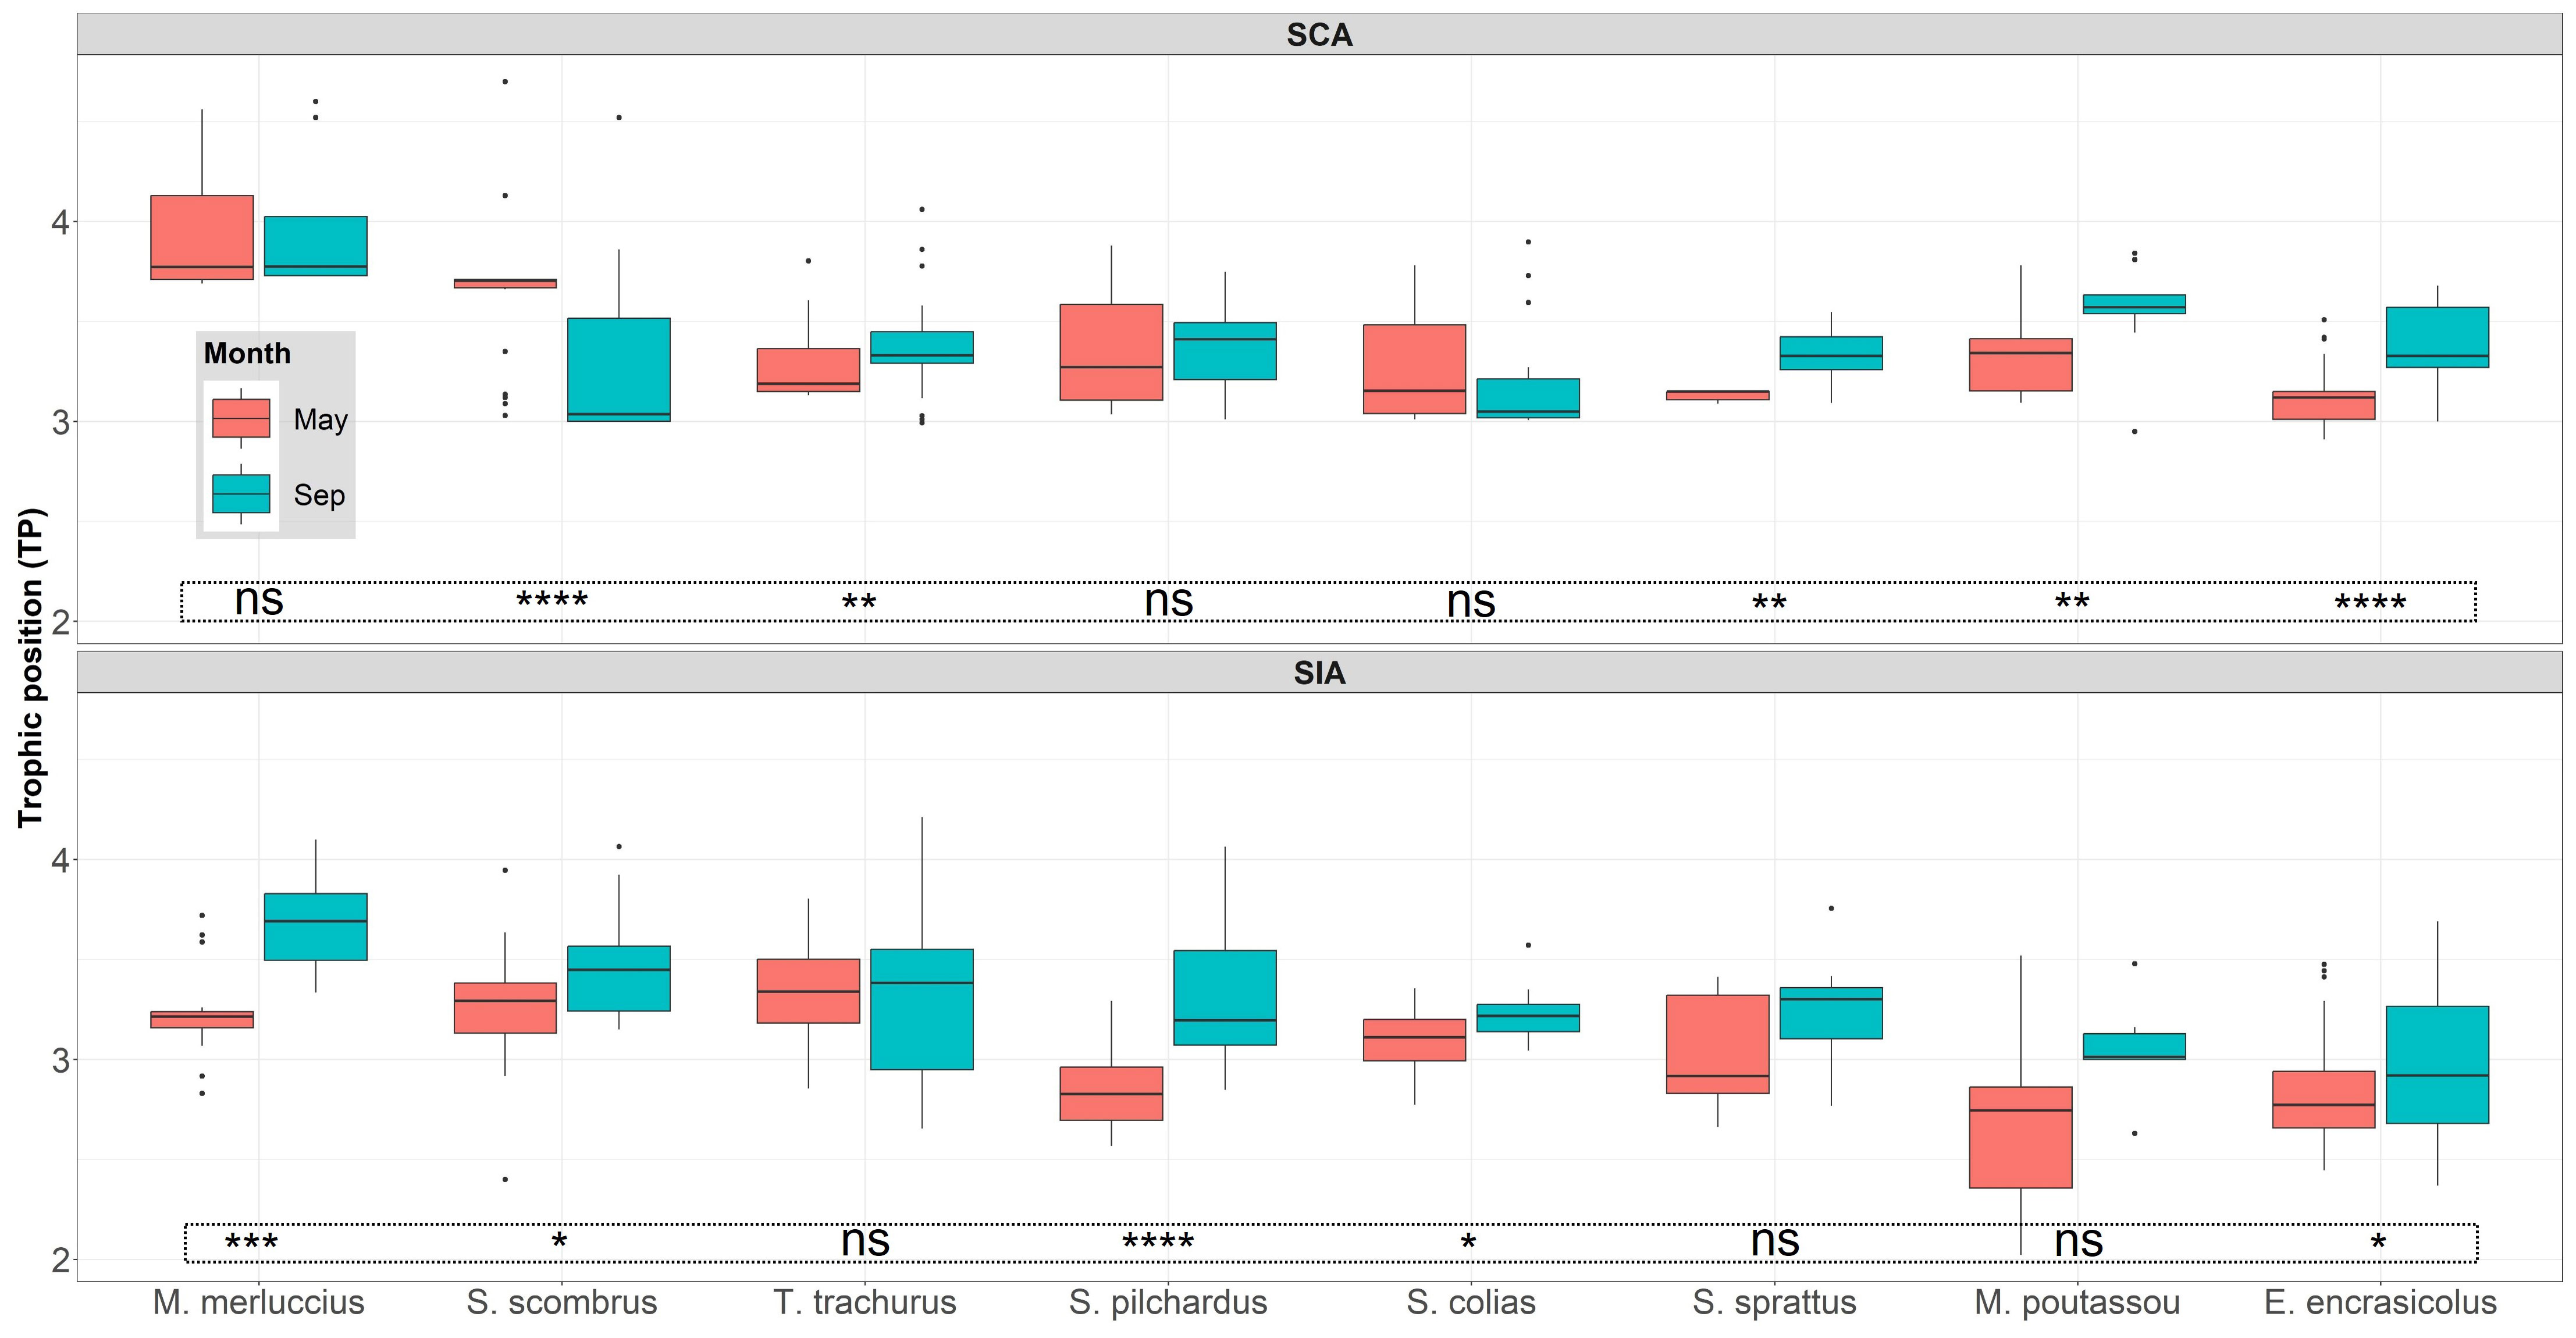
Figure 5 Seasonal comparison (May versus September) of trophic positions (TP) estimated using stomach contents (SCA) and stable isotope analysis (SIA) for the 8 fish species in the Bay of Biscay during the period 2020-2021. Significance levels for inter-seasonal differences are indicated by: ‘ns’: p > 0.05, ‘*’: p<= 0.05, ‘**’: p<= 0.01, ‘***’: p<= 0.001, ‘****’: p<= 0.0001.
Based on the results of the best modelling of the TPSIA with size (Table 5), the TP was influenced by the additive effect of the predator’s size and the season, carrying 96% of the cumulative model weight. The TPSCA however, it was influenced by the interaction of the season and the size (Table 5), with a cumulative model weight of 99%. TP increased in late summer using both approaches (see ‘Estimate’ in Table 6 and Figures S1, S2). The TPSIA increased with predator size (see ‘Estimate’ in Table 6 and Figure S1). The TPSCA increased with predator size in May, whereas in September it decreased slightly (see ‘Estimate’ in Table 6 and Figure S2).
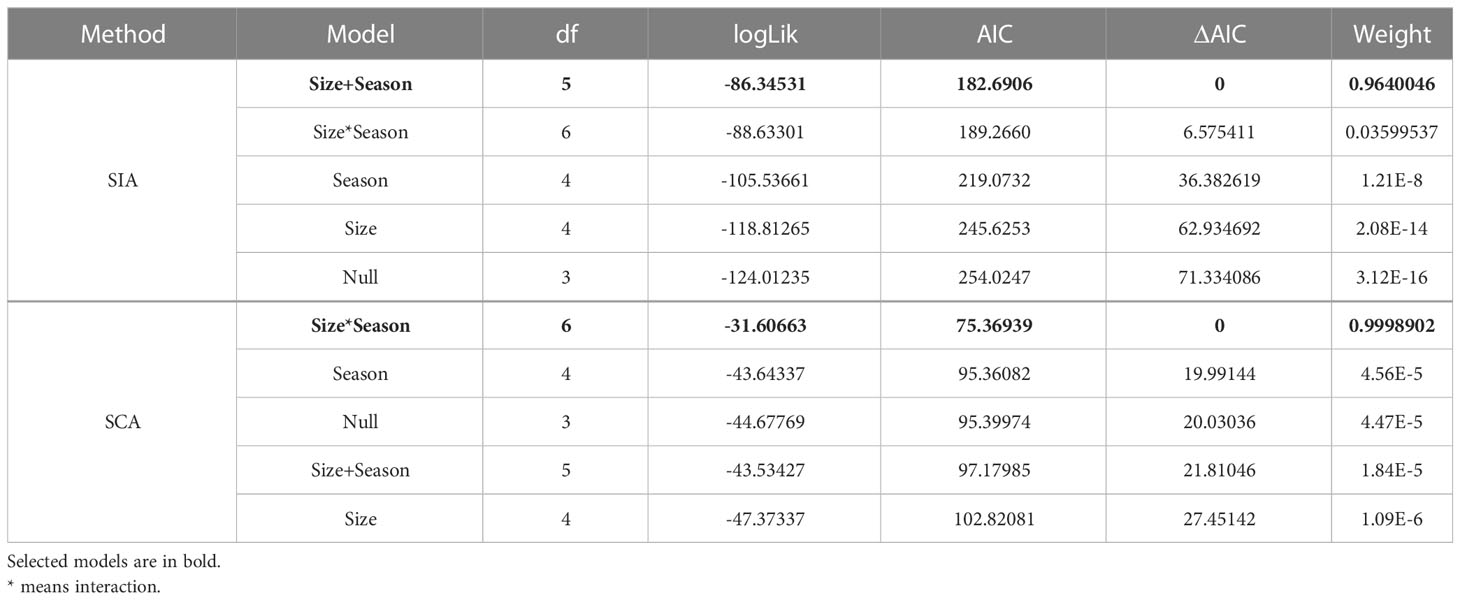
Table 5 Results of the GLMM models for the TP estimation for each method.
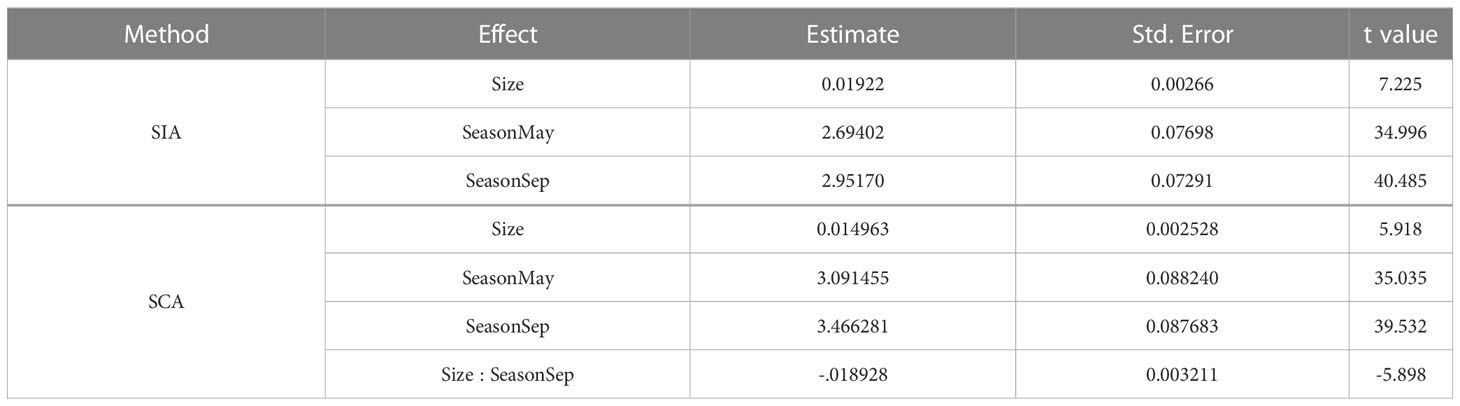
Table 6 Summary statistics of the selected models in Table 5 for explaining TP based on each method.
Attending the random effect of predator species, the estimated variability in the intercept of the random effect was close to zero in both methods, indicating that predator species were not important in the model (see ‘Variance’ in Table S4). There was no general pattern of the TP variation between species.
Our results confirm that seasonal variability has a significant impact on predator-prey interactions and trophic structure of the pelagic realm of the BoB. For the first time, we demonstrate this influence with a multispecies approach and using two complementary analyses (diet microscopy and stable isotopes) which give a more robust overview of the structure and functioning of the BoB pelagic ecosystem.
Contrary to our expectations, diet of pelagic fish was determined more by intra-specific affinities than by seasonal variations. The three trophic guilds identified in the present study (planktivores, piscivores and mixed-diet predators) showed a high proportion and contribution of pelagic sources to the diet of pelagic fish. Copepods constituted the most important food source for half of the fish species (anchovy, sardine, sprat and horse mackerel) in both seasons, which is in accordance with other authors findings (Bachiller and Irigoien, 2015). The relative importance of copepods’ consumption was higher in spring than in late summer for most of fish species, coinciding with the peak of abundance of copepods in the water column (Albaina and Irigoien, 2007); in late summer, larger prey such as krill were found in higher numbers in stomachs of blue whiting, and the same could be said regarding salps found in Atlantic mackerel, also being described by other authors in the study area (Olaso et al., 2005). Interestingly, the diet of anchovies and sardines showed the opposite trend, increasing the consumption of copepods in late summer, even though fewer copepods were presumably available (Albaina and Irigoien, 2007). This feeding behavior confirms that anchovies and sardines exhibit a clear prey preference for copepods, as it has already been demonstrated by other authors (Plounevez and Champalbert, 1999; Garrido et al., 2007). Copepods are indeed the dominant taxa in the offshore zooplankton communities of the Bay of Biscay during most of the year, with exception of early spring. However, larval stages of euphausiids and brachyuran, gelatinous organisms such as jellyfish, siphonophores and tunicates or fish eggs are also common within the size range of mesozooplankton within the BoB (Poulet et al., 1996), with meroplankton being more prevalent during the spring bloom (Bode et al., 2011b). In fact, an important ingestion of fish eggs was also observed in some species in spring, e.g., anchovy eggs ingested by sardines, also observed by (Bachiller et al., 2015), coinciding with the spawning season of some species, e.g., anchovies, sardines and Atlantic mackerel (Motos et al., 1996; Olaso et al., 2005; Bellier et al., 2007). Seasonal succession in the copepod community is also apparent; in the western edge of the BoB Pseudocalanus elongatus and Acartica clausii predominate in spring, while early stages of Calanus helgolandicus and Oncaea media are more abundant in late summer-autumn (Bode et al., 2011b). However, the taxonomic resolution of the present study prevented the detection of shifts in plankton composition at the species level.
Among the mixed-diet species, blue whiting showed a significant seasonal change in the diet, feeding primarily on copepods in spring, while on M. norvegica (krill) in late summer. This seasonal change in diet, which shifts the main prey from meso- to macrozooplankton species, could be attributed to variations in prey abundances but also suggests a preference for this prey which could respond both to its larger size and/or shoaling behavior. Krill typically performs daily vertical migrations shoaling close to the bottom over the continental shelf during daytime and near the surface at dawn (Mauchline and Fisher, 1967). Although the importance of krill in blue whiting’s diet has also been observed in other regions (Cabral and Murta, 2002; Bachiller et al., 2016; López-López et al., 2017), seasonal variations in the diet are reported here for the first time. A high proportion of copepods was observed in horse mackerels’ stomachs in both seasons, which is in line with previous observations (Bachiller and Irigoien, 2015), as well as the low proportion of anchovies in their diet (Olaso et al., 1999).
Our study confirms the piscivore behavior of European hake adults, which fed mainly on anchovies in both seasons. In other studies carried out in the BoB and surrounding regions however, blue whiting, horse mackerel and silvery pout were the most important prey species for hake (Velasco and Olaso, 1998; Cabral and Murta, 2002; Mahe et al., 2007). This difference in the diet could be attributed to the fishing depth at which hake were sampled (above 130m), where anchovies can be found more frequently than blue whiting (Velasco and Olaso, 1998) and to the spatial extent of the study area overlapping with the main recruitment areas for anchovy in the BoB (López-López et al., 2011). Cannibalism was also observed in hake’s diet in concurrence with previous studies (Velasco and Olaso, 1998; Cabral and Murta, 2002; Mahe et al., 2007; Preciado et al., 2015). The size range sampled (with full stomachs) in the present study (> 20cm) possibly prevented us to identify macrozooplankton as an essential part of hake diet, as this species shows an ontogenic change in diet (Velasco and Olaso, 1998), with only juveniles smaller than 19 cm being planktivores. Salps and anchovies were the main prey for Atlantic mackerel and Atlantic chub mackerel, in contrast to that observed in other studies where decapods, krill, copepods or blue whiting were the most important food source (Cabral and Murta, 2002; Olaso et al., 2005; Bachiller and Irigoien, 2015; Kvaavik et al., 2019). Olaso et al. (2005) however reported salps as important source of food for Atlantic mackerel in late summer-autumn in the BoB.
Attending to the dietary overlap among species, high potential competition for food source was evident between planktivore species especially in late summer, since all of them fed mainly on copepods. As shown in previous studies (Raab et al., 2011; Bachiller and Irigoien, 2015; Le Bourg et al., 2015), the three clupeid species had a large diet overlap, and also with larger fish like Atlantic horse mackerel. The trophic overlap among piscivore species (European hake and Atlantic mackerel) was also significant since both species fed mainly on anchovies. Diet overlap between the two species of scombrids was mainly due to the high presence of salps in their diet. However, as gelatinous prey experience a rapid digestion, their contribution to the diet using microscopy analyses is likely underestimated (Arai, 2005). The seasonal variation in the diet of blue whiting (no anchovies in spring, but in late summer) led to a medium overlap with hake in September indicating generally a high resource partitioning and low potential competition between these two species.
The seasonal changes detected in species diets did not respond to a change in the community structure, which displayed a similar structure between seasons with salps at the base of the food web (TP around 2), a second group primarily composed of meso and macrozooplankton and a third group of fish and squids with the highest TPs. Nevertheless, the whole community showed consistently lower TPs in spring, regardless of the trophic levels, which could be explained by the shortened trophic chains that dominate the pelagic pathway under high primary productivity pulses, such as those experienced during this season (Calbet, 2001; Jennings and Mackinson, 2003). Seasonal variations in trophic positions are likely caused by changes in prey availability and secondarily by the changes in feeding behaviour of each prey species which ultimately are largely influenced by changes in primary production. An enhanced input of nutrients (e.g., river discharge, upwelling) may trigger a bottom-up cascade effect by increasing primary production and consequently phytoplankton and zooplankton biomasses and/or changes in their associated diversity that will affect the upper trophic positions (Checkley et al., 2009; García-Comas et al., 2016).
Attending to Søreide et al. (2006) classification, all fish and squid species were found to have a carnivorous diet (TPSIA ≥ 2.8) showing the highest TPSIA in both seasons. The TPSIA values of blue whiting were relatively low in comparison with other studies (Pétursdóttir et al., 2012; Mir-Arguimbau et al., 2020), possibly due to the high consumption of copepods in the present study. Squids also showed high TPSIA in both seasons in agreement with previous studies, which characterize these species as meso- and top predators (Lassalle et al., 2014; Albo-Puigserver et al., 2016). Secondary consumers with mid TP species such as M. norvegica and the pelagic crab P. henslowii displayed significant lower values in spring, once again pointing to a more direct trophic transfer along the food web during this season (Calbet, 2001; Jennings and Mackinson, 2003). The TPSIA showed by M. norvegica (TPSIA< 2.4) suggests a herbivorous diet, probably composed of the dominant species of diatoms and dinoflagellates, whereas other studies showed an omnivorous feeding strategy (Pétursdóttir et al., 2008; Agersted et al., 2014; López-López et al., 2017). Similar discrepancies occurred with the pelagic crab P. henslowii with TPSIA (< 2.6) much lower than those expected for a carnivore species (Signa et al., 2008). European hake showed the highest TPSCA in both seasons likely due to their piscivorous diet based on anchovies. On the contrary, anchovies and the two species of scombrids displayed the lowest TPSCA most probably due to the consumption of gastropods and salps in spring and late summer, respectively. For those species which had a TPSIA and a TPSCA estimate available, the stable isotopes estimate was consistently lower than that based on the microscopy of the diet. This discrepancy could be attributed to many different factors, including an overestimation of the TP of prey items (using either SIA or published estimates) when calculating TPSCA, to the availability of prey with lower TPs in the weeks-months previous to the sample, or to inaccurate estimation of the SIA baseline and/or enrichment factors. It should be noted, however, that TPSIA and TPSCA represent different temporal resolution, giving thus a complementary perspective (assimilated food vs. snapshot respectively) of the feeding behaviour of the species.
Differences between TPSIA and TPSCA persisted when analyzing how these estimates varied across fish size. According to the results of the linear mixed model, the TPSIA was influenced by the additive effect of the predator’s size and season, whereas the interaction between season and size was affecting the TPSCA. TPSCA in May and TPSIA showed a positive relationship with body-size suggesting a dietary change with ontogeny, which could be attributed to either an increase in the ingestion of prey species with higher TPs, or to larger prey within the same species, not requiring in this latter case a taxonomic change in the diet (Deudero et al., 2004; Jennings et al., 2007; Ou et al., 2017). Although the general model stated an increase of TPSIA with size and, also, for TPSCA in May, such positive relationship was not evident for all species. European hake is well known to display ontogenic changes in diet which represent an increase in trophic position with size (Badalamenti et al., 2002; Le Loc’h and Hily, 2005). In contrast, a negative or null increase of the trophic position with size was found in planktivore species, such as sardine (Bode et al., 2007), which suggests the absence of ontogenic changes in the diet, which is corroborated by our diet results. Overall, these outcomes should be interpreted with caution since the size ranges of some species could be undersampled in the present study, and this has been suggested a crucial aspect to interpret changes in trophic position along species ontogeny (Galván et al., 2010).
Therefore, the resulting trophic groups in the pelagic fish community of the BoB were determined more by intra-specific feeding affinities than by seasonal differences, as the trophic structure was similar in both seasons. The trophic position of the analyzed species was consistently lower in spring than in late summer. To better understand the seasonal food web dynamics in the pelagic ecosystem of the BoB, longer time series are needed. Our study reflects the importance of analyzing the seasonal changes in diet using different techniques, since each approach provides different information. Taking advantage of the multidisciplinary oceanographic surveys that are conducted in the BoB throughout the year, the monitoring of systematic sample collection of pelagic components would allow the study of temporal (seasonal and annual) and spatial differences in pelagic trophic interactions. It would also allow the exploration of potential changes in the ecosystem under different stressors (e.g., changes in fishing pressure or climate change), as changes in this trophic guild of small pelagics have a major impact on other species in the ecosystem, thus moving towards an ecosystem-based management.
The raw data supporting the conclusions of this article will be made available by the authors, without undue reservation.
Ethical review and approval was not required for the study on animals in accordance with the local legislation and institutional requirements
BI, IP, ML, MS conceived and designed the study. BI did the lab work and performed the analyses. BI, IP and ML wrote the first draft of manuscript. EB, LL-L, MS, GB, EA and UC provided feedback on the manuscript. All authors contributed to the article and approved the submitted version.
Surveys BIOMAN and JUVENA were funded by the European Commission within the frame of the National Sampling Program, the Department of Economic Development and Infrastructure of Basque Government (projects MPDH and JUVENA) and the Spanish General Secretariat of the Sea, providing the RV ‘Emma Bardán’, RV ‘Vizconde de Eza’ and RV ‘Ángeles Alvariño’. The study was supported under the EPELECO project founded by the Spanish Government. BI was funded by a PhD fellowship from the Department of Economic Development, Sustainability and Environment of the Basque Government. ML was funded by a Ramón y Cajal contract (RYC-2012-09897) from the Spanish Government. LL-L was supported by a Juan de la Cierva-Incorporación grant (IJC2020-043235-I) from the Spanish Government (MCIN/AEI) co-funded by the European Union NextGeneration (EU/PRTR).
We would like to thank the crew of the R/V ‘Ángeles Alvariño’, R/V ‘Vizconde de Eza’ and R/V ‘Emma Bardán’ and the AZTI and IEO-CSIC staff who took part in the BIOMAN and JUVENA surveys, allowing the collection of the samples used in this study. This is contribution number 1166 from AZTI, Marine Research, Basque Research and Technology Alliance (BRTA).
The authors declare that the research was conducted in the absence of any commercial or financial relationships that could be construed as a potential conflict of interest.
All claims expressed in this article are solely those of the authors and do not necessarily represent those of their affiliated organizations, or those of the publisher, the editors and the reviewers. Any product that may be evaluated in this article, or claim that may be made by its manufacturer, is not guaranteed or endorsed by the publisher.
The Supplementary Material for this article can be found online at: https://www.frontiersin.org/articles/10.3389/fmars.2023.1185376/full#supplementary-material
Supplementary Figure 1 | Model visualization for the TPSIA. The effect of the predator’s size can be observed in the left and the effect of the season in the right.
Supplementary Figure 2 | Model visualization for the TPSCA. The effect of the interaction between predator’s size and season can be observed.
Agersted M. D., Bode A., Nielsen T. G. (2014). Trophic position of coexisting krill species: A stable isotope approach. Mar. Ecol. Prog. Ser. 516, 139–151. doi: 10.3354/meps11055
Albaina A., Irigoien X. (2007). Zooplankton communities and oceanographic structures in a high-resolution grid in the south-eastern corner of the Bay of Biscay. Estuar. Coast. Shelf Sci. 75, 433–446. doi: 10.1016/j.ecss.2007.05.028
Albo-Puigserver M., Navarro J., Coll M., Layman C. A., Palomera I. (2016). Trophic structure of pelagic species in the northwestern Mediterranean Sea. J. Sea Res. 117, 27–35. doi: 10.1016/j.seares.2016.09.003
Arai M. N. (2005). Predation on pelagic coelenterates: a review. J. Mar. Biol. Assoc. United Kingdom 85, 523–536. doi: 10.1017/S0025315405011458
Arim M., Abades S. R., Laufer G., Loureiro M., Marquet P. A. (2010). Food web structure and body size: Trophic position and resource acquisition. Oikos 119, 147–153. doi: 10.1111/j.1600-0706.2009.17768.x
Astarloa A., Louzao M., Boyra G., Martinez U., Rubio A., Irigoien X., et al. (2019). Identifying main interactions in marine predator-prey networks of the Bay of Biscay. ICES J. Mar. Sci. 76, 2247–2259. doi: 10.1093/icesjms/fsz140
Bachiller E., Cotano U., Ibaibarriaga L., Santos M., Irigoien X. (2015). Intraguild predation between small pelagic fish in the Bay of Biscay: impact on anchovy (Engraulis encrasicolus L.) egg mortality. Mar. Biol. 162, 1351–1369. doi: 10.1007/s00227-015-2674-0
Bachiller E., Irigoien X. (2015). Trophodynamics and diet overlap of small pelagic fish species in the bay of biscay. Mar. Ecol. Prog. Ser. 534, 179–198. doi: 10.3354/meps11375
Bachiller E., Skaret G., Nøttestad L., Slotte A. (2016). Feeding ecology of Northeast Atlantic Mackerel, Norwegian spring-spawning herring and blue whiting in the Norwegian Sea. PloS One 11. doi: 10.1371/journal.pone.0149238
Badalamenti F., D’Anna G., Pinnegar J. K., Polunin N. V. C. (2002). Size-related trophodynamic changes in three target fish species recovering from intensive trawling. Mar. Biol. 141, 561–570. doi: 10.1007/s00227-002-0844-3
Barnes C., Maxwell D., Reuman D. C., Jennings S. (2010). Global patterns in predator-prey size relationships reveal size dependency of trophic transfer efficiency. Ecology 91, 222–232. doi: 10.1890/08-2061.1
Bartón K. (2022) MuMIn: multi-model inference. Available at: https://cran.r-project.org/package=MuMIn.
Bates D., Maechler M., Bolker B., Walker S. (2015). Fitting linear mixed-effects models using lme4. J. Stat. Softw. 67, 1–48. doi: 10.18637/jss.v067.i01
Bellier E., Planque B., Petitgas P. (2007). Historical fluctuations in spawning location of anchovy (Engraulis encrasicolus) and sardine (Sardina pilchardus) in the Bay of Biscay during 1967-73 and 2000-2004. Fish. Oceanogr. 16, 1–15. doi: 10.1111/j.1365-2419.2006.00410.x
Bode A., Alvarez-Ossorio M. T., Cunha M. E., Garrido S., Peleteiro J. B., Porteiro C., et al. (2007). Stable nitrogen isotope studies of the pelagic food web on the Atlantic shelf of the Iberian Peninsula. Prog. Oceanogr. 74, 115–131. doi: 10.1016/j.pocean.2007.04.005
Bode A., Anadón R., Morán X. A. G., Nogueira E., Teira E., Varela M. (2011a). Decadal variability in chlorophyll and primary production off NW Spain. Clim. Res. 48, 293–305. doi: 10.3354/cr00935
Bode A., Bueno J., López-Urrutia Á., Villate F., Uriarte I., Iriarte A., et al. (2013). “Zooplankton of the bay of biscay and western iberian peninsula,” in O’Brien T., Wiebe P. H., Falkenhaug T. eds. ICES Zooplankton Status Report 2010-2011. (International Council for the Exploration of the Sea (ICES)), 208.
Bode A., Carrera P., Lens S. (2003). The pelagic foodweb in the upwelling ecosystem of Galicia (NW Spain) during spring: Natural abundance of stable carbon and nitrogen isotopes. ICES J. Mar. Sci. 60, 11–22. doi: 10.1006/jmsc.2002.1326
Borja A., Amouroux D., Anschutz P., Gómez-Gesteira M., Uyarra M. C., Valdés L. (2019). “Chapter 5: The Bay of Biscay,” in World seas: an environmental evaluation volume I: europe, the americas and west africa, ed Sheppard C. (London: Elsevier), 113–152. doi: 10.1016/B978-0-12-805068-2.00006-1
Botas J. A., Fernandez E., Bode A., Anadón R. (1990). A persistent upwelling off the Central Cantabrian Coast (Bay of Biscay). Estuar. Coast. Shelf Sci. 30, 185–199. doi: 10.1016/0272-7714(90)90063-W
Boyle M. D., Ebert D. A., Cailliet G. M. (2012). Stable-isotope analysis of a deep-sea benthic-fish assemblage: Evidence of an enriched benthic food web. J. Fish Biol. 80, 1485–1507. doi: 10.1111/j.1095-8649.2012.03243.x
Boyra G., Martínez U., Cotano U., Santos M., Irigoien X., Uriarte A. (2013). Acoustic surveys for juvenile anchovy in the Bay of Biscay: Abundance estimate as an indicator of the next year’s recruitment and spatial distribution patterns. ICES J. Mar. Sci. 70, 1354–1368. doi: 10.1093/icesjms/fst096
Cabral H. N., Murta A. G. (2002). The diet of blue whiting, hake, horse mackerel and mackerel off Portugal. J. Appl. Ichthyol. 18, 14–23. doi: 10.1046/j.1439-0426.2002.00297.x
Calbet A. (2001). Mesozooplankton grazing effect on primary production: A global comparative analysis in marine ecosystems. Limnol. Oceanogr. 46, 1824–1830. doi: 10.4319/lo.2001.46.7.1824
Checkley D. M., Alheit J., Oozeki Y., Roy C. (2009). Climate change and small pelagic fish (Cambridge: Cambridge University Press). doi: 10.1017/CBO9780511596681
Corrales X., Preciado I., Gascuel D., Lopez de Gamiz-Zearra A., Hernvann P. Y., Mugerza E., et al. (2022). Structure and functioning of the Bay of Biscay ecosystem: A trophic modelling approach. Estuar. Coast. Shelf Sci. 264. doi: 10.1016/j.ecss.2021.107658
Cresson P., Ruitton S., Ourgaud M., Harmelin-Vivien M. (2014). Contrasting perception of fish trophic level from stomach content and stable isotope analyses: A Mediterranean artificial reef experience. J. Exp. Mar. Bio. Ecol. 452, 54–62. doi: 10.1016/J.JEMBE.2013.11.014
Cury P., Pauly D. (2000). Patterns and propensities in reproduction and growth of marine fishes. Ecol. Res. 15, 101–106. doi: 10.1046/j.1440-1703.2000.00321.x
Cury P., Shannon L., Shin YunneJai S. Y. (2003). “The functioning of marine ecosystems: a fisheries perspective,” in Responsible fisheries in the marine ecosystem (UK: CABI Publishing), 103–123. doi: 10.1079/9780851996332.0103
Deudero S., Pinnegar J. K., Polunin N. V. C., Morey G., Morales-Nin B. (2004). Spatial variation and ontogenic shifts in the isotopic composition of Mediterranean littoral fishes. Mar. Biol. 145, 971–981. doi: 10.1007/s00227-004-1374-y
Galván D. E., Sweeting C. J., Reid W. D. K. (2010). Power of Stable isotope techniques to detect size-based feeding in marine fishes. Mar. Ecol. Prog. Ser. 407, 271–278. doi: 10.3354/meps08528
García-Barón I., Authier M., Caballero A., Vázquez J. A., Santos M. B., Murcia J. L., et al. (2019). Modelling the spatial abundance of a migratory predator: A call for transboundary marine protected areas. Divers. Distrib. 25, 346–360. doi: 10.1111/ddi.12877
García-Comas C., Sastri A. R., Ye L., Chang C. Y., Lin F. S., Su M. S., et al. (2016). Prey size diversity hinders biomass trophic transfer and predator size diversity promotes it in planktonic communities. Proc. R. Soc B Biol. Sci. 283. doi: 10.1098/rspb.2015.2129
Garrido S., Marçalo A., Zwolinski J., van der Lingen C. D. (2007). Laboratory investigations on the effect of prey size and concentration on the feeding behaviour of Sardina pilchardus. Mar. Ecol. Prog. Ser. 330, 189–199. doi: 10.3354/meps330189
Gil J. (2008). Macro and mesoscale physical patterns in the Bay of Biscay. J. Mar. Biol. Assoc. United Kingdom 88, 217–225. doi: 10.1017/S0025315408000490
Goñi N., Logan J., Arrizabalaga H., Jarry M., Lutcavage M. (2011). Variability of albacore (Thunnus alalunga) diet in the Northeast Atlantic and Mediterranean Sea. Mar. Biol. 158, 1057–1073. doi: 10.1007/s00227-011-1630-x
Hussey N. E., Macneil M. A., Mcmeans B. C., Olin J. A., Dudley S. F. J., Cliff G., et al. (2014). Rescaling the trophic structure of marine food webs. Ecol. Lett. 17, 239–250. doi: 10.1111/ele.12226
Hyslop E. J. (1980). Stomach contents analysis—a review of methods and their application. J. Fish Biol. 17, 411–429. doi: 10.1111/j.1095-8649.1980.tb02775.x
Jegou A. M., Lazure P. (1995). Quelques aspects de la circulation sur le plateau Atlantique. Actas del IV Coloq. Int. sobre Oceanogr. del Golf. Vizc., 99–106.
Jennings S., Mackinson S. (2003). Abundance–body mass relationships in size-structured food webs. Ecol. Lett. 6, 971–974. doi: 10.1046/j.1461-0248.2003.00529.x
Jennings S., Oliveira J. A. A. D., Warr K. J. (2007). Measurement of body size and abundance in tests of macroecological and food web theory. J. Anim. Ecol. 76, 72–82. doi: 10.1111/j.1365-2656.2006.01180.x
Keppeler F. W., Montaña C. G., Winemiller K. O. (2020). The relationship between trophic level and body size in fishes depends on functional traits. Ecol. Monogr. 90. doi: 10.1002/ecm.1415
Koutsikopoulos C., Cann B. L. E. (1996). Physical processes and hydrological structures related to the Bay of Biscay anchovy. Sci. Mar. 60, 9–19.
Kvaavik C., Óskarsson G. J., Daníelsdóttir A. K., Marteinsdóttir G. (2019). Diet and feeding strategy of Northeast Atlantic mackerel (Scombrus scomber) in Icelandic waters. PloS One 14. doi: 10.1371/journal.pone.0225552
Langton R. W. (1982). Diet overlap between Atlantic cod, Gadus morhua, silver hake, Merluccius bilinearis, and fifteen other northwest atlantic finfish. Fish. Bull. 80, 745–759.
Lassalle G., Chouvelon T., Bustamante P., Niquil N. (2014). An assessment of the trophic structure of the Bay of Biscay continental shelf food web: Comparing estimates derived from an ecosystem model and isotopic data. Prog. Oceanogr. 120, 205–215. doi: 10.1016/j.pocean.2013.09.002
Lassalle G., Lobry J., Le Loc’h F., Bustamante P., Certain G., Delmas D., et al. (2011). Lower trophic levels and detrital biomass control the Bay of Biscay continental shelf food web: Implications for ecosystem management. Prog. Oceanogr. 91, 561–575. doi: 10.1016/j.pocean.2011.09.002
Le Bourg B., Bănaru D., Saraux C., Nowaczyk A., Le Luherne E., Jadaud A., et al. (2015). Trophic niche overlap of sprat and commercial small pelagic teleosts in the Gulf of Lions (NW Mediterranean Sea). J. Sea Res. 103, 138–146. doi: 10.1016/j.seares.2015.06.011
Le Loc’h F., Hily C. (2005). Stable carbon and nitrogen isotope analysis of Nephrops norvegicus/Merluccius merluccius fishing grounds in the Bay of Biscay (Northeast Atlantic). Can. J. Fish. Aquat. Sci. 62, 123–132. doi: 10.1139/f04-242
López-López L., Preciado I., Muñoz I., Decima M., Molinero J. C., Tel E. (2017). Does upwelling intensity influence feeding habits and trophic position of planktivorous fish? Deep. Res. Part I Oceanogr. Res. Pap. 122, 29–40. doi: 10.1016/j.dsr.2017.01.017
López-López L., Preciado I., Velasco F., Villamor B., Nogueira E., Iglesias M., et al. (2011). Effect of anchovy fluctuations on demersal fish predators in the southern Bay of Biscay. In ICES/NAFO Decadal Symposium (Santander, Spain).
López-López L., Preciado I., Villamor B., Velasco F., Iglesias M., Nogueira E., et al. (2012). Is juvenile anchovy a feeding resource for the demersal community in the Bay of Biscay? On the availability of pelagic prey to demersal predators. ICES J. Mar. Sci. 69, 1394–1402. doi: 10.1093/icesjms/fss117
Mahe K., Amara R., Bryckaert T., Kacher M., Brylinski J. M. (2007). Ontogenetic and spatial variation in the diet of hake (Merluccius merluccius) in the Bay of Biscay and the Celtic Sea. ICES J. Mar. Sci. 64, 1210–1219. doi: 10.1093/icesjms/fsm100
Mauchline J., Fisher L. R. (1969). “The biology of euphausiids,” in Advances in marine biology. Eds. Russell F. S., Yonge M. (London and New York: Academic Press) 7, 1–454.
Ménard F., Benivary H. D., Bodin N., Coffineau N., Le Loc’h F., Mison T., et al. (2014). Stable isotope patterns in micronekton from the Mozambique Channel. Deep. Res. Part II Top. Stud. Oceanogr., 100. doi: 10.1016/j.dsr2.2013.10.023
Mir-Arguimbau J., Navarro J., Balcells M., Martín P., Sabatés A. (2020). Feeding ecology of blue whiting (Micromesistius poutassou) in the NW Mediterranean: The important role of Myctophidae. Deep. Res. Part I Oceanogr. Res. Pap 166. doi: 10.1016/j.dsr.2020.103404
Moranta J., Reñones O., Gouraguine A., Saporiti F., Cardona L. (2020). The effects of fishing on the ontogeny of trophic position and body condition of a small-sized temperate marine fish. Mar. Environ. Res. 161. doi: 10.1016/j.marenvres.2020.105055
Morozov E., Pozdnyakov D., Smyth T., Sychev V., Grassl H. (2013). Space-borne study of seasonal, multi-year, and decadal phytoplankton dynamics in the Bay of Biscay. Int. J. Remote Sens. 34, 1297–1331. doi: 10.1080/01431161.2012.718462
Motos L., Uriarte A., Valencia V. (1996). The spawning environment of the Bay of Biscay anchovy (Engraulis encrasicolus L.). Sci. Mar. 60, 117–140.
Oksanen J., Simpson G. L., Blanchet F. G. (2022) Vegan: Community Ecology Package. R package version 2.6–2. Available at: https://github.com/vegandevs/vegan.
Olaso I., Cendrero O., Abaunza P. (1999). The diet of the horse mackerel, Trachurus trachurus (Linnaeus 1758), in the Cantabrian Sea (north of Spain). J. Appl. Ichthiology 15, 193–198.
Olaso I., Gutiérrez J. L., Villamor B., Carrera P., Valdés L., Abaunza P. (2005). Seasonal changes in the north-eastern Atlantic mackerel diet (Scomber scombrus) in the north of Spain (ICES Division VIIIc). J. Mar. Biol. Assoc. United Kingdom 85, 415–418. doi: 10.1017/S0025315405011343h
Ou C., Montaña C. G., Winemiller K. O. (2017). Body size-trophic position relationships among fishes of the lower Mekong basin. R. Soc Open Sci. 4. doi: 10.1098/rsos.160645
Pauly D., Froese R., Sa-a P., Palomares M. L., Christensen V., Rius J. (2000). TrophLab manual (Manila: ICLARM).
Pérez-Roda A., Delord K., Boué A., Arcos J. M., García D., Micol T., et al. (2017). Identifying Important Atlantic Areas for the conservation of Balearic shearwaters: Spatial overlap with conservation areas. Deep. Res. Part II Top. Stud. Oceanogr., 141. doi: 10.1016/j.dsr2.2016.11.011
Peterson B. J., Fry B. (1987). Stable isotopes in ecosystem studies. Annu. Rev. Ecol. Syst. 18, 293–320. doi: 10.1146/annurev.es.18.110187.001453
Pétursdóttir H., Falk-petersen S., Gislason A. (2012). Trophic interactions of meso- and macrozooplankton and fish in the Iceland Sea as evaluated by fatty acid and stable isotope analysis. ICES J. Mar. Sci. 69, 1277–1288. doi: 10.1093/icesjms/fss125Trophic
Pétursdóttir H., Gislason A., Falk-Petersen S., Hop H., Svavarsson J. (2008). Trophic interactions of the pelagic ecosystem over the Reykjanes Ridge as evaluated by fatty acid and stable isotope analyses. Deep. Res. Part II Top. Stud. Oceanogr. 55, 83–93. doi: 10.1016/j.dsr2.2007.09.003
Plounevez S., Champalbert G. (1999). Feeding behaviour and trophic environment of Engraulis encrasicolus (L.) in the Bay of Biscay. Estuar. Coast. Shelf Sci. 49, 177–191. doi: 10.1006/ecss.1999.0497
Post D. M. (2002). Using stable isotopes to estimate trophic position: Models, methods, and assumptions. Ecology 83, 703–718. doi: 10.1890/0012-9658(2002)083[0703:USITET]2.0.CO;2
Post D. M., Layman C. A., Arrington D. A., Takimoto G., Quattrochi J., Montaña C. G. (2007). Getting to the fat of the matter: Models, methods and assumptions for dealing with lipids in stable isotope analyses. Oecologia 152, 179–189. doi: 10.1007/s00442-006-0630-x
Poulet S. A., Laabir M., Chaudron Y. (1996). Characteristic features of zooplankton in the Bay of Biscay. Sci. Mar. 60, 79–95.
Preciado I., Punzón A., Velasco F. (2015). Spatio-temporal variability in the cannibalistic behaviour of European hake Merluccius merluccius: The influence of recruit abundance and prey availability. J. Fish Biol. 86, 1319–1334. doi: 10.1111/jfb.12642
Preciado I., Velasco F., Olaso I. (2008). The role of pelagic fish as forage for the demersal fish community in the southern Bay of Biscay. J. Mar. Syst. 72, 407–417. doi: 10.1016/j.jmarsys.2007.04.007
Raab K., Nagelkerke L. A. J., Boerée C., Rijnsdorp A. D., Temming A., Dickey-Collas M. (2011). Anchovy Engraulis encrasicolus diet in the North and Baltic Seas. J. Sea Res. 65, 131–140. doi: 10.1016/j.seares.2010.09.002
Ríos M. F., Venerus L. A., Karachle P. K., Reid W. D. K., Erzini K., Stergiou K. I., et al. (2019). Linking size-based trophodynamics and morphological traits in marine fishes. Fish Fish. 20, 355–367. doi: 10.1111/faf.12347
Santos M. B., González-Quirós R., Riveiro I., Iglesias M., Louzao M., Pierce G. J. (2013). Characterization of the pelagic fish community of the north-western and northern Spanish shelf waters. J. Fish Biol. 83, 716–738. doi: 10.1111/jfb.12107
Santos M., Uriarte A., Boyra G., Ibaibarriaga L. (2018). “Anchovy DEPM surveys 2003–2012 in the Bay of Biscay (Subarea 8): BIOMAN survey series,” in Pelagic survey series for sardine and anchovy in ICES subareas 8 and 9 –Towards an ecosystem approach. Eds. Massé J., Uriarte A., Angélico M. M., Carrera P. (ICES Cooperative Research Report No. 332), 85–102. doi: 10.17895/ices.pub.4599
Schoener T. W. (1970). Nonsynchronous spatial overlap of lizards in patchy habitats. Ecology 51, 408–418. doi: 10.2307/1935376
Signa G., Cartes J. E., Solé M., Serrano A., Sánchez F. (2008). Trophic ecology of the swimming crab Polybius henslowii Leach, 1820 in Galician and Cantabrian Seas: Influences of natural variability and the Prestige oil spill. Cont. Shelf Res. 28, 2659–2667. doi: 10.1016/j.csr.2008.08.008
Smith P. E., Flerx W., Hewitt R. P. (1985). “The calCOFI vertical egg tow (CalVET) net,” in An egg production method for estimating spawning biomass of pelagic fish: application to the northern anchovy, Engraulis mordax, vol. 36. Ed. Lasker R. (Springfield, VA, USA: U.S. Department of Commerce, NOAATech. Rep. NMFS), 27–32.
Søreide J. E., Hop H., Carroll M. L., Falk-Petersen S., Nøst Hegseth E. (2006). Seasonal food web structures and sympagic – pelagic coupling in the European Arctic revealed by stable isotopes and a two-source food web model. Prog. Oceanogr. 71, 59–87. doi: 10.1016/j.pocean.2006.06.001
Stowasser G., Atkinson A., McGill R. A. R., Phillips R. A., Collins M. A., Pond D. W. (2012). Food web dynamics in the Scotia Sea in summer: A stable isotope study. Deep. Res. Part II Top. Stud. Oceanogr. 59–60, 208–221. doi: 10.1016/j.dsr2.2011.08.004
Valdés L., López-Urrutia A., Cabal J., Alvarez-Ossorio M. T., Bode A., Miranda A., et al. (2007). A decade of sampling in the Bay of Biscay: What are the zooplankton time series telling us? Prog. Oceanogr. 74, 98–114. doi: 10.1016/j.pocean.2007.04.016
Velasco F., Olaso I. (1998). European hake Merluccius merluccius (L) feeding in the Cantabrian Sea: Seasonal, bathymetric and length variations. Fish. Res. 38, 33–44. doi: 10.1016/S0165-7836(98)00111-8
Wallace R. K. (1981). An assessment of diet-overlap indexes. Trans. Am. Fish. Soc 110, 72–76. doi: 10.1577/1548-8659(1981)110<72:AAODI>2.0.CO;2
Zhang J. (2016) spaa: SPecies Association Analysis. R package version 0.2.2. Available at: https://Cran.R-Project.Org/Package=Spaahttps://cran.r-project.org/package=spaa.
Keywords: trophic structure, pelagic fish, stomach contents, stable isotopes, Bay of Biscay, trophic position, seasonal variability
Citation: Iglesias B, Louzao M, Bachiller E, López-López L, Santos M, Boyra G, Andonegi E, Cotano U and Preciado I (2023) Influence of seasonal variability on the trophic structure of pelagic communities. Front. Mar. Sci. 10:1185376. doi: 10.3389/fmars.2023.1185376
Received: 13 March 2023; Accepted: 11 July 2023;
Published: 18 August 2023.
Edited by:
Alberto Basset, University of Salento, ItalyReviewed by:
Vitor H. Paiva, University of Coimbra, PortugalCopyright © 2023 Iglesias, Louzao, Bachiller, López-López, Santos, Boyra, Andonegi, Cotano and Preciado. This is an open-access article distributed under the terms of the Creative Commons Attribution License (CC BY). The use, distribution or reproduction in other forums is permitted, provided the original author(s) and the copyright owner(s) are credited and that the original publication in this journal is cited, in accordance with accepted academic practice. No use, distribution or reproduction is permitted which does not comply with these terms.
*Correspondence: Beñat Iglesias, YmlnbGVzaWFzQGF6dGkuZXM=
Disclaimer: All claims expressed in this article are solely those of the authors and do not necessarily represent those of their affiliated organizations, or those of the publisher, the editors and the reviewers. Any product that may be evaluated in this article or claim that may be made by its manufacturer is not guaranteed or endorsed by the publisher.
Research integrity at Frontiers
Learn more about the work of our research integrity team to safeguard the quality of each article we publish.