 Igor A. Dmitrenko1*
 Sergei A. Kirillov1
 Bert Rudels2Nicolas-Xavier Geilfus1,3
 Jens Ehn1
 David G. Babb1
 David A. Lilien1Dorthe Dahl-Jensen1,4
- 1Centre for Earth Observation Science, University of Manitoba, Winnipeg, MB, Canada
- 2Marine Research, Finnish Meteorological Institute, Helsinki, Finland
- 3Now at Tvärminne Zoological Station, University of Helsinki, Helsinki, Finland
- 4Niels Bohr Institute, University of Copenhagen, Copenhagen, Denmark
The oceanography of the northern Canadian Arctic Archipelago (CAA) remains poorly studied. Here we present a unique set of conductivity–temperature–depth (CTD) and nitrate profiles collected in a fjord system around Axel Heiberg Island in the northern CAA during April–May 2022. The profiles are examined within the context of upstream observations in the Arctic Ocean and downstream observations in the central CAA, and reveal the origin of water masses and their interactions with ambient water from the continental slope and the nearby tidewater glacier outlet. The subsurface water (~25–180 m depth) is associated with the Pacific water outflow from the Arctic Ocean. The underlying halocline separates Pacific water from a deeper layer of polar water that has interacted with the warm (>0°C) Atlantic water observed below 240 m depth. Pacific water is significantly modified compared to the adjoining Arctic Ocean, as evidenced by the following details. Cold water intrusions from the tidewater glacier create deviations of ~0.25°C in the temperature profile through the subsurface water down to a depth of 140 m. Profiles show no thermal signature of Pacific summer water. Compared to the adjacent Arctic Ocean, the deeper fraction of Pacific-derived water and the Atlantic-modified polar water are warmer, while the underlying Atlantic water is colder. Overall, our results suggest that Pacific and Atlantic water in this area of the northern CAA are modified due to enhanced vertical mixing in a narrow band over the continental slope and shelf off the CAA, and are further modified by interactions with outlet glaciers in the area. This implies that tracing the initial thermohaline signature of the Pacific and Atlantic water flow through the CAA seems to be hardly possible without the use of additional tracers. We also find evidence of geothermal heating near the seafloor, which is not surprising given the observed presence of terrestrial geothermal vents around Axel Heiberg Island, and speculate this heat flux limits ice growth near the glacier terminus.
1 Introduction
Climate change in the Arctic, manifested in the increasing freshwater content over the past several decades (Prowse et al., 2015), affects the Atlantic overturning circulation with possible implications for global climate (Rahmstorf et al., 2015). Recent increases in Arctic freshwater flux (de Steur et al., 2013; Karpouzoglou et al., 2022; Karpouzoglou et al., 2023) are primarily attributed to precipitation, river runoff, and sea-ice melt (Rabe et al., 2011; Rabe et al., 2014; Haine et al., 2015), but also to Pacific water (PW; Alkire et al., 2017). Low-salinity PW entering the Arctic Ocean through Bering Strait is the second main source of fresh water to the Arctic Ocean (Carmack et al., 2016) and serves to increase primary production by supplying nutrients that are otherwise limited (Mills et al., 2018). After entering the Arctic Ocean through the Bering Strait, PW is spread along two major pathways: a Transpolar branch crossing the Arctic Ocean to Fram Strait, and an Alaskan branch that flows along the Beaufort Sea continental slope through the Canadian Arctic Archipelago (CAA) and eventually into Baffin Bay – Figure 1A (Jones, 2001; Rudels, 2012; Hu and Myers, 2013; Woodgate, 2013; Aksenov et al., 2016; Hu et al., 2019). As a result, PW is a primary source of fresh water for Baffin Bay (Münchow et al., 2007), and comprises up to 20% of the freshwater inventory in the upper 300 m in western Fram Strait (Dodd et al., 2012). Note that the orientation of the transpolar branch varies with atmospheric forcing associated with the Arctic Oscillation and Beaufort High variability (Wang and Danilov, 2022) and may be deflected to the southwest, advecting more PW towards the CAA and subsequently into Baffin Bay during some years (Figure 1; Hu et al., 2019). Regardless of the path, the outflow of PW from the Arctic Ocean through the CAA and into Baffin Bay is poorly resolved due to insufficient data coverage, specifically over the heavily ice covered CAA continental slope and the northern Canadian Arctic.
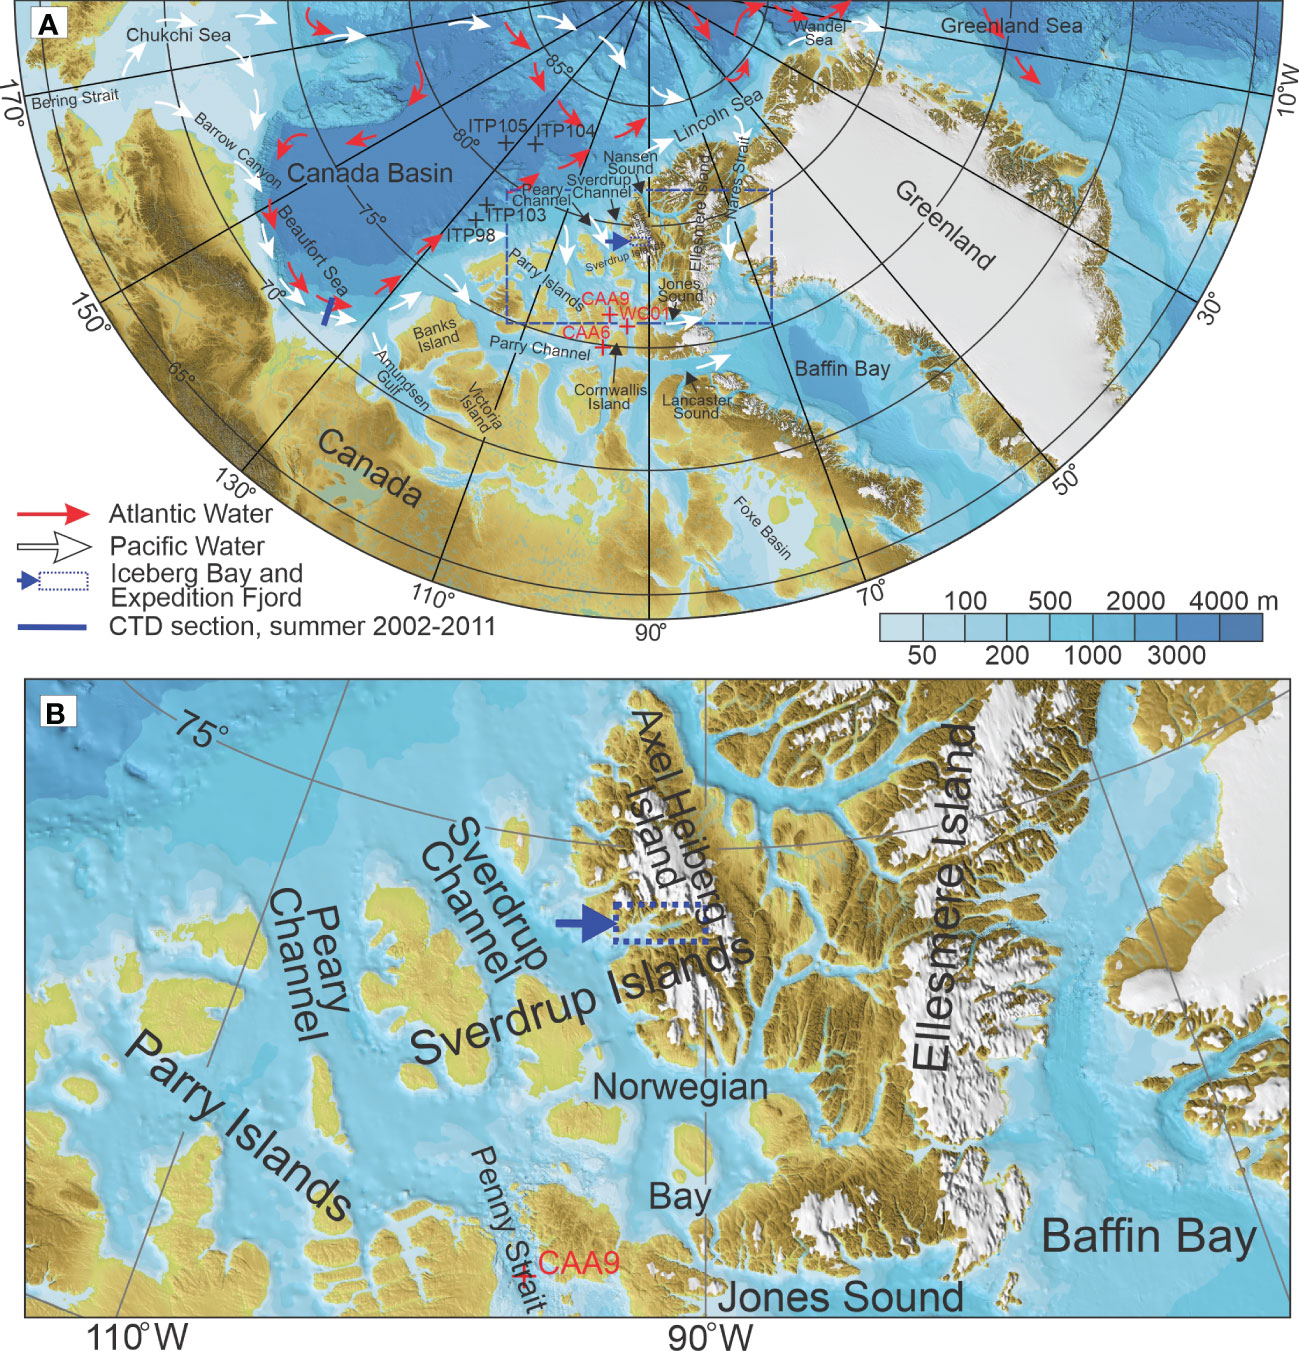
Figure 1 Bathymetric chart of the western Arctic (A), including the CAA (B), based on the International Bathymetric Chart of the Arctic Ocean (IBCAO), Version 3.0. Dashed blue rectangle in (A) denotes the area in (B). Dotted blue rectangle highlights Iceberg Bay and Expedition Fjord in Axel Heiberg Island. (A) The schematic circulation of the Pacific Water (white arrows) and Atlantic Water (red arrows) in the Arctic Ocean and adjoining CAA follows Jones (2001); Rudels (2012), and Woodgate (2013). Black crosses depict CTD profiles taken by the Ice-Tethered Profilers (ITPs) in the Canada Basin (#105 and 104) and over the lower continental slope of the CAA (#98 and 103). Red crosses indicate CTD profiles taken in the central CAA northward of the Parry Channel in September-October 2015. Blue line in the eastern Beaufort Sea shows location of the CTD cross-slope transect occupied during summer 2002–2011.
Over the coastal domains of northern Greenland, Baffin Bay, and the CAA, there are additional contributions to the freshwater budget from glacial melt (Gardner et al., 2011; Castro de la Guardia et al., 2015; Bendtsen et al., 2017; Bamber et al., 2018) superimposed on the Arctic freshwater flux (Dukhovskoy et al., 2019). Meltwater discharge from the Greenland ice sheet has accelerated since the 1990s (Rignot et al., 2011; Hugonnet et al., 2021) and is predicted to cause fundamental changes to the hydrography, biogeochemical cycles, and marine productivity of the downstream regions (Hendry et al., 2019; Seifert et al., 2019; Kanna et al., 2022). However, PW complicates direct estimates of the glacier meltwater fraction and therefore the freshwater balance. The general contribution of PW to the freshwater inventory remains poorly understood, partly due to seasonal and interannual variability (Falck et al., 2005; Melling et al., 2008; Dodd et al., 2012; Woodgate et al., 2012; de Steur et al., 2013; Münchow, 2015; Shroyer and Pickart, 2019; Lin et al., 2021), but also because of the different pathways of PW in the Arctic Ocean.
It seems that PW outflow from the Arctic Ocean is impacted by intense interaction between the Canada Basin and shelf water of the Beaufort Sea (Dmitrenko et al., 2018) and the CAA (Melling et al., 1984). This interaction is largely controlled by wind-forced water dynamics over the continental slope. Key processes affecting the shelf-basin interaction in the western Arctic include wind-driven up- and down-welling (Carmack and Chapman, 2003; Pickart et al., 2009; Dmitrenko et al., 2016; Dmitrenko et al., 2018), enhanced vertical mixing over the sloping topography (Guthrie et al., 2013), and processes associated with instability of the shelf break current transporting PW eastward along the Beaufort Sea continental slope (Lin et al., 2016; Dmitrenko et al., 2018). However, the volume transport by this shelfbreak current has decreased by approximately 80% between 2002-2004 and 2008-2011 due to the weakening of summer westerly winds (Brugler et al., 2014), demonstrating the importance of wind forcing.
Several studies have focused on modification of PW through the interaction between the shelf break current and surrounding waters along the Alaskan continental slope (Spall et al., 2008; Schulze and Pickart, 2012; von Appen and Pickart, 2012; Lin et al., 2016; Foukal et al., 2019). In contrast to the Alaskan Beaufort Sea, the PW modification through the shelf-basin interaction in the Canadian Beaufort Sea has received less attention, and the shelf-basin interaction over the CAA continental slope is completely unknown. Ocean-glacier interactions also have the potential to modify PW through cooling and freshening (Münchow et al., 2016; Dmitrenko et al., 2017; Kirillov et al., 2017; Dmitrenko et al., 2019), though this process has not previously been considered for modifying PW.
Overall, studies suggest that climate change accelerates the Arctic and subarctic freshwater cycle (Carmack et al., 2016; Rodell et al., 2018), which highlights the need for a clear understanding of the variability of PW outflow from the Arctic Ocean. In particular, this knowledge is required to address one of the central questions posed by Carmack et al. (2016): “Will the melting of glacial ice (including Greenland) substantially alter the freshwater budget and flow regimes of the Arctic Ocean and surrounding subarctic seas?” This is of special importance for Baffin Bay where the PW outflow through the CAA and Nares Strait dominates the freshwater inventory over the surface water layer (Alkire et al., 2010). The increase in freshwater in Baffin Bay elevates the sea surface height due to steric effects, which impacts the Baffin Bay circulation (Grivault et al., 2017).
This paper is focused on the analysis of a unique set of conductivity–temperature–depth (CTD) and nitrate profiles collected in the northern CAA, specifically Expedition Fjord and Iceberg Bay around Axel Heiberg Island, from the landfast ice in April–May 2022 (Figure 2). The field campaign was based out of the McGill Arctic Research Station (MARS) located near the Thompson Glacier outlet (Figure 2). Prior to the field program in April-May 2022, there were no oceanographic data collected in Iceberg Bay. CTD observations in Expedition Fjord were limited to several profiles taken in August 1988 in the inner part of the fjord near the mouth of Expedition River (Gilbert, 1990). Here we build on results of Melling et al. (1984), who showed that the Atlantic-derived water layer in the western CAA is modified due to enhanced vertical mixing over the rough bottom topography of the CAA margins. Our main goal is to infer modification of water masses as they enter the CAA. To assess this goal, our observations are set within the context of upstream, downstream and local conditions, with a focus on modifications of Pacific- and Atlantic-derived waters of the Arctic Ocean imposed by vertical mixing and ocean-glacier interactions during their advection through the CAA. Note that within the context of upstream observation, we assess the modification of PW only relative to an Alaskan branch transporting PW along the Beaufort Sea continental slope (Figure 1A). The other transport route via the central Arctic Ocean is not included in our analysis due to deficiency of the long-term observations.
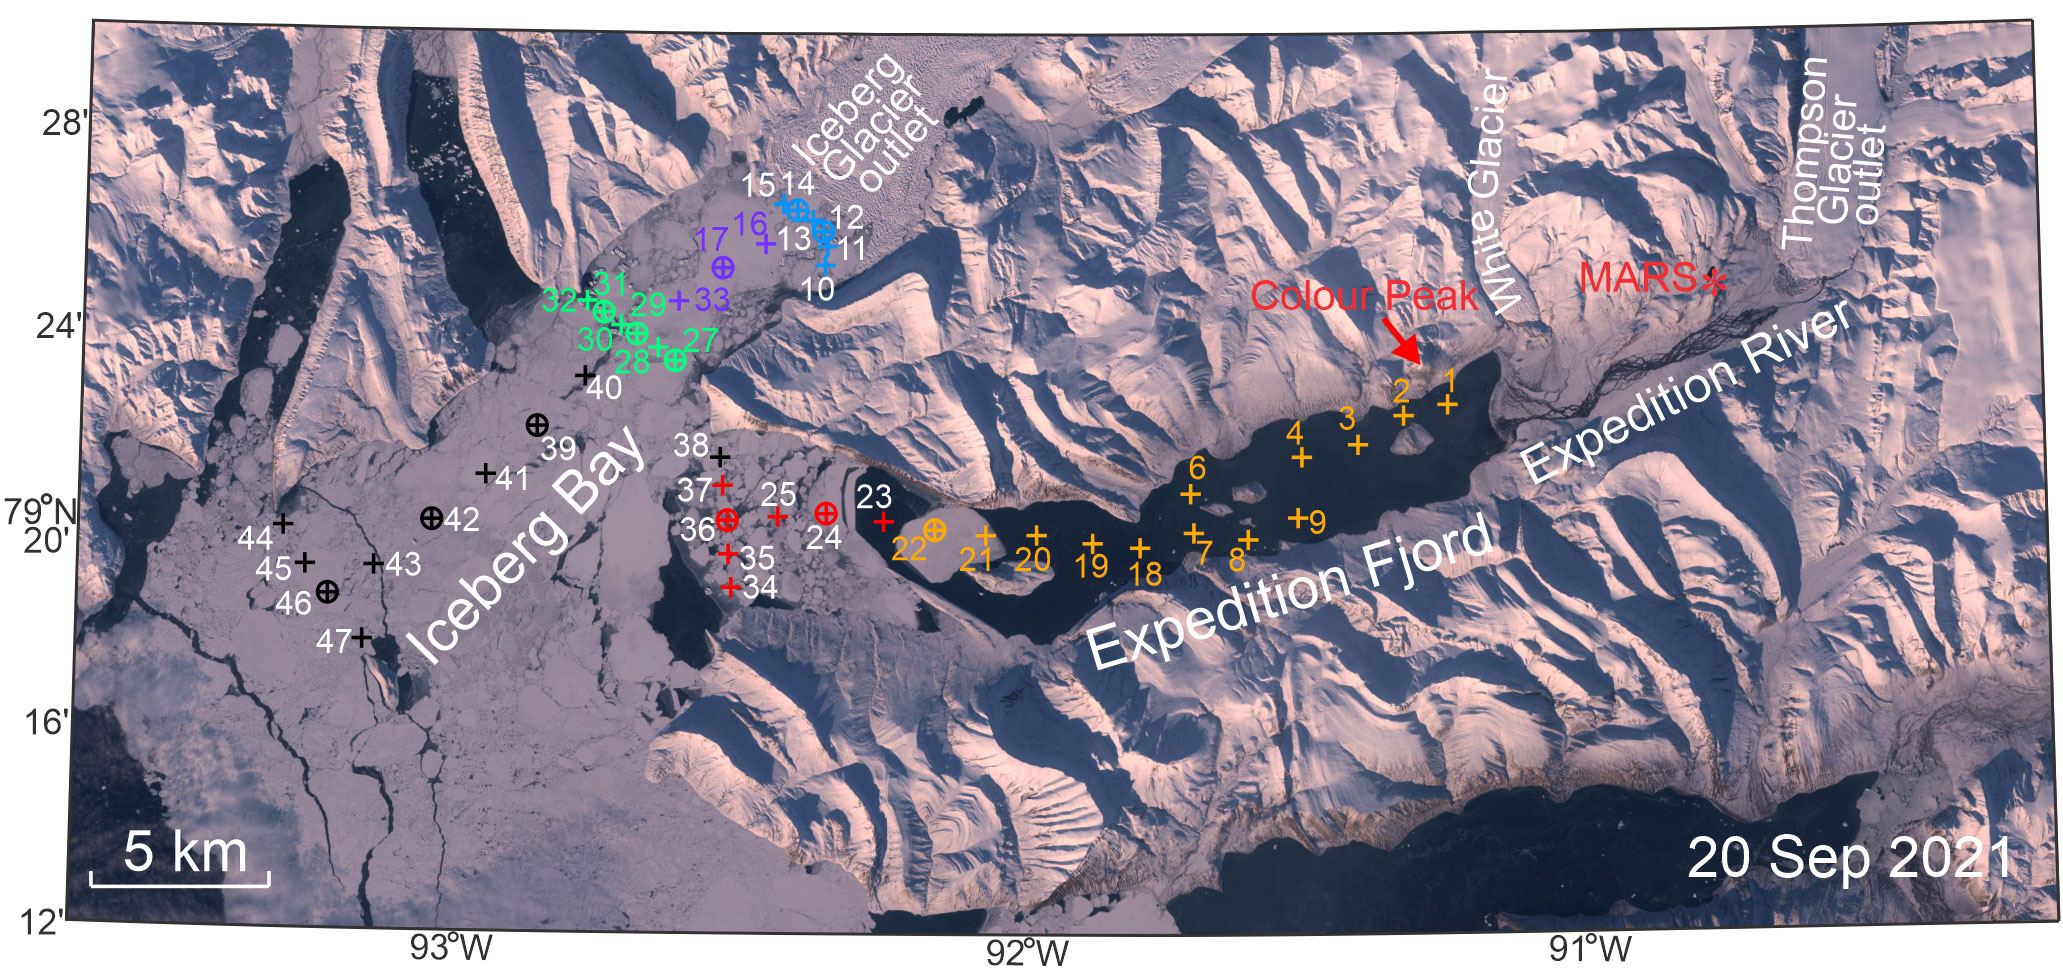
Figure 2 Sentinel-2 satellite image from 20 September 2021 shows Iceberg Bay and Expedition Fjord with oceanographic stations occupied from the landfast ice in April-May 2022. CTD (crosses) and SUNA (circled crosses) stations shown with their reference numbers. Red star depicts McGill Arctic Research Station (MARS).
Expedition Fjord and Iceberg Bay represent a glacial inlet of Axel Heiberg Island, which opens to the Sverdrup Channel connecting the continental slope of the Arctic Ocean with the CAA interior (Figure 1B). Expedition Fjord and Iceberg Bay are covered by landfast sea ice from October to June with significant interannual variability in the coverage and duration of open water (Figure 3). The landfast ice edge in Iceberg Bay roughly delineates the extension of pack ice inflowing to the CAA from the Arctic Ocean through Sverdrup and Peary Channels (Melling, 2022). The bottom topography of Expedition Fjord and Iceberg Bay is poorly known. The most comprehensive bathymetric data set in Expedition Fjord, reported by Gilbert (1990) and Aitken and Gilbert (1996), revealed a gradual sloping of the seafloor from the mouth of Expedition River to ~110 m depth at ~91.8°W longitude with a sill of ~70 m depth located at ~91.6°W. Further west of the entrance to Expedition Fjord, the seafloor slopes down to >300 m at ~92.3°W (Aitken and Gilbert, 1996). The seafloor of Iceberg Bay is largely unknown, though it seems to be impacted by Iceberg Glacier, which is a tidewater outlet glacier branching off from the Müller Ice Cap (Figure 2) that is over 500 m thick in the interior (Priergaard Zinck and Grinsted, 2022). Calving of the Iceberg Glacier terminus generates numerous icebergs that are commonly observed in the interior of Iceberg Bay and in the outer part of Expedition Fjord to the 70-m depth sill at ~91.6°W (Figure 2). Iceberg Bay opens to Sverdrup Channel, which is connected to the Arctic Ocean and generally covered by landfast ice through much of the year (Melling, 2002). There is a sill at ~450 m depth across the entrance from the Arctic Ocean to Sverdrup Channel (Melling et al., 1984), though this is deep enough to allow both Pacific-derived and Atlantic‐derived Arctic water with temperatures >0°C to flow into the CAA. In what follows, we examine the properties of the water column in Iceberg Bay and Expedition Fjord to trace the origins of the water and identify any local modifications.
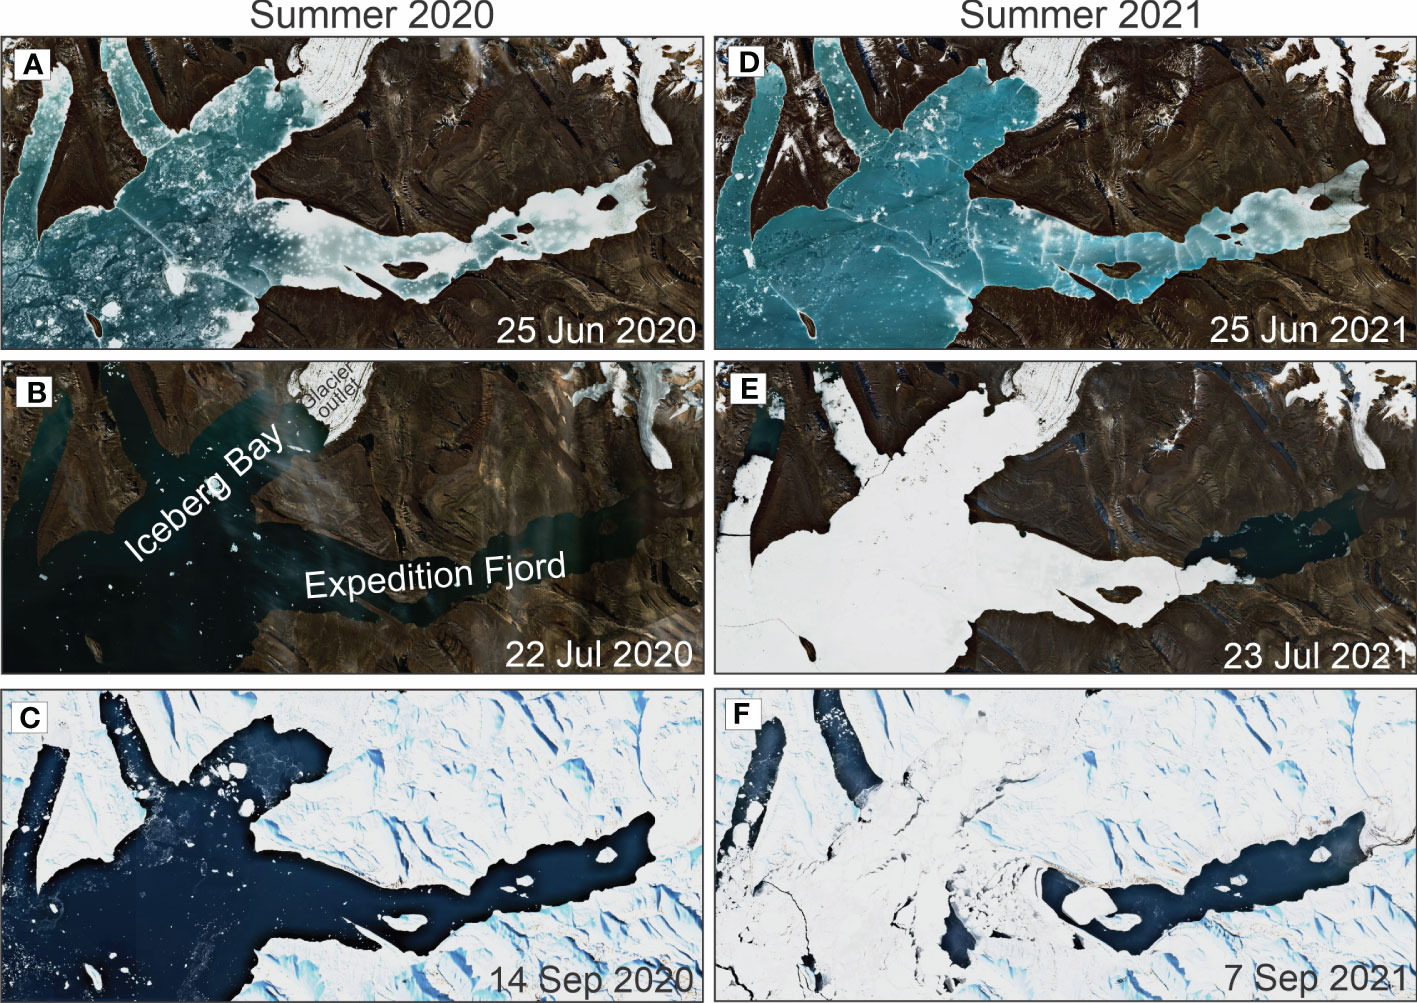
Figure 3 Sentinel-2 satellite imagery shows sea-ice conditions in Iceberg Bay and Expedition Fjord during summer (June to September) 2020 (left) and 2021 (right). (A) 25 June 2020, (B) 22 July 2020, (C) 14 September 2020, (D) 25 June 2021, (E) 23 July 2021, and (F) 7 September 2021.
2 Data and methods
Between 24 April and 1 May 2022, 47 CTD profiles were collected from the landfast sea ice (1.0 to 1.6 m thick) in Expedition Fjord and Iceberg Bay in the CAA (Figure 2). The CTD observations were carried out with a Sea-Bird Scientific SBE-19plus CTD that was calibrated prior to the expedition and was accurate to ±0.005°C and ±0.0005 S m–1. Throughout the manuscript, we used practical salinity calculated directly from the conductivity and temperature of seawater as defined by Practical Salinity Scale 1978 (PSS 78; Lewis, 1980). All CTD casts were taken down to the seafloor. The CTD was outfitted with a Sea-Bird Scientific SUNA V2 Optical Nitrate Sensor that measured nitrate based on the absorption characteristics of nitrate in the UV light spectrum. The nitrate profiling was conducted at 12 stations (#12, 14, 17, 22, 24, 27, 29, 31, 36, 39, 42, and 46; Figure 2), and was accurate to ± 2 mmol m-3 (mmol m-3 = millimoles of nitrate per cubic meter of water) or ± 10% of reading according to the manufacturer’s specifications. However, the SUNA nitrate data were not calibrated. In what follows, we limited our analysis based on nitrate data only to PW qualitative tracing.
Three sets of complementary CTD profiles are used to provide context for the water masses we observed in Expedition Fjord and Iceberg Bay. (i) CTD profiles collected in the eastern Beaufort Sea between 134°W and 135°W from June to October from 2002 to 2011 by ArcticNet (Figure 1A) were averaged and reveal the mean summer water profile in the eastern Beaufort Sea (Dmitrenko et al., 2017), which we consider the “upstream” area. (ii) CTD profiles collected by Ice Tethered Profilers (Toole et al., 2011; Ice Tethered Profilers, 2022) off the CAA continental slope and in the Canada Basin are used to represent the ambient water masses. ITPs are autonomous profilers that are deployed on perennial sea ice in the polar oceans to measure changes in upper ocean temperature and salinity (Krishfield et al., 2006). In the eastern Canada Basin, we use CTD profiles from ITP #104 (profile #2926) and #105 (profile #2467) taken on 8 March and 18 February 2019, respectively (Figure 1A; Toole and Krishfield, 2016). Over the lower continental slope of the CAA (depth >2000 m), ITPs #98 and #103 sampled the water column on 14 October 2016 (profile #29) and 2 April 2019 (profile #3366), respectively (Figure 1A). These are the only ITPs providing CTD data along the lower continental slope of the CAA in proximity to Peary and Sverdrup Channels (Figure 1A). To our knowledge, there are no oceanographic observations conducted over the CAA continental slope of the Sverdrup Islands. All ITP-derived CTDs were measured from 12 m to 760 m depth. We used level 2 real time ITP data with salinity accurate to 0.04. (iii) Finally, we adopted 3 CTD profiles (#CAA6, CAA9, and WC01) taken during the CCGS Amundsen GEOTRACES expedition in September-October 2015 (Hughes et al., 2018; Colombo et al., 2021) north of Parry Channel around Cornwallis Island in the central CAA, which we consider the “downstream” area (Figure 1A).
Ice conditions over Iceberg Bay and Expedition Fjord during summer were characterized by optical imagery from Sentinel-2 (Figures 2, 3), which has 10-meter spatial resolution and was acquired through Sentinel Hub (https://apps.sentinel-hub.com; Gascon et al., 2017). In general, open water, sea-ice, large icebergs, and glacier termini are easily distinguishable in cloud-free Sentinel-2 imagery. Sea-ice thickness was measured manually at each CTD station with an ice thickness tape with accuracy ±1 cm. The seasonal mean (July to October; open water season) fields of sea level atmospheric pressure (SLP) were retrieved from the ERA5 atmospheric reanalysis (Copernicus Climate Change Service, 2017; Hersbach et al., 2020) for 2020, 2021, and from 2001 to 2021 using Web-Based Reanalysis Intercomparison Tools (WRIT; Smith et al., 2014; NOAA Physical Sciences Laboratory, 2022). The horizontal resolution of ERA5 is 31 km.
Finally, ice-penetrating radar data acquired over Iceberg Glacier in 2014 and 2017 by the Multichannel Coherent Depth Sounder as part of NASA’s Operation Ice Bridge (Paden et al., 2010; IceBridge MCoRDS L2 Ice Thickness, 2023) were used to characterize the thickness of Iceberg Glacier (Figure 4). Data were elevation-corrected so that the surface matched simultaneous measurements from the Airborne Topographic Mapper (Studinger, 2013). Plotting and tracing in Figure 4B were done using ImpDAR (Lilien et al., 2020). Glacier height above flotation (Figure 4C) was estimated using the bed reflector. For this calculation, we assumed zero firn air, similar to other glaciers in the area (Müller, 1962), and a constant radar wave speed in ice of 1.69 108 m s–1. The bed reflector was converted to a height above flotation assuming that the density of ice is 917 kg m–3 and the density of ocean water is 1028 kg m–3. Where the height above flotation is at or below 0, the glacier is floating or only lightly grounded.
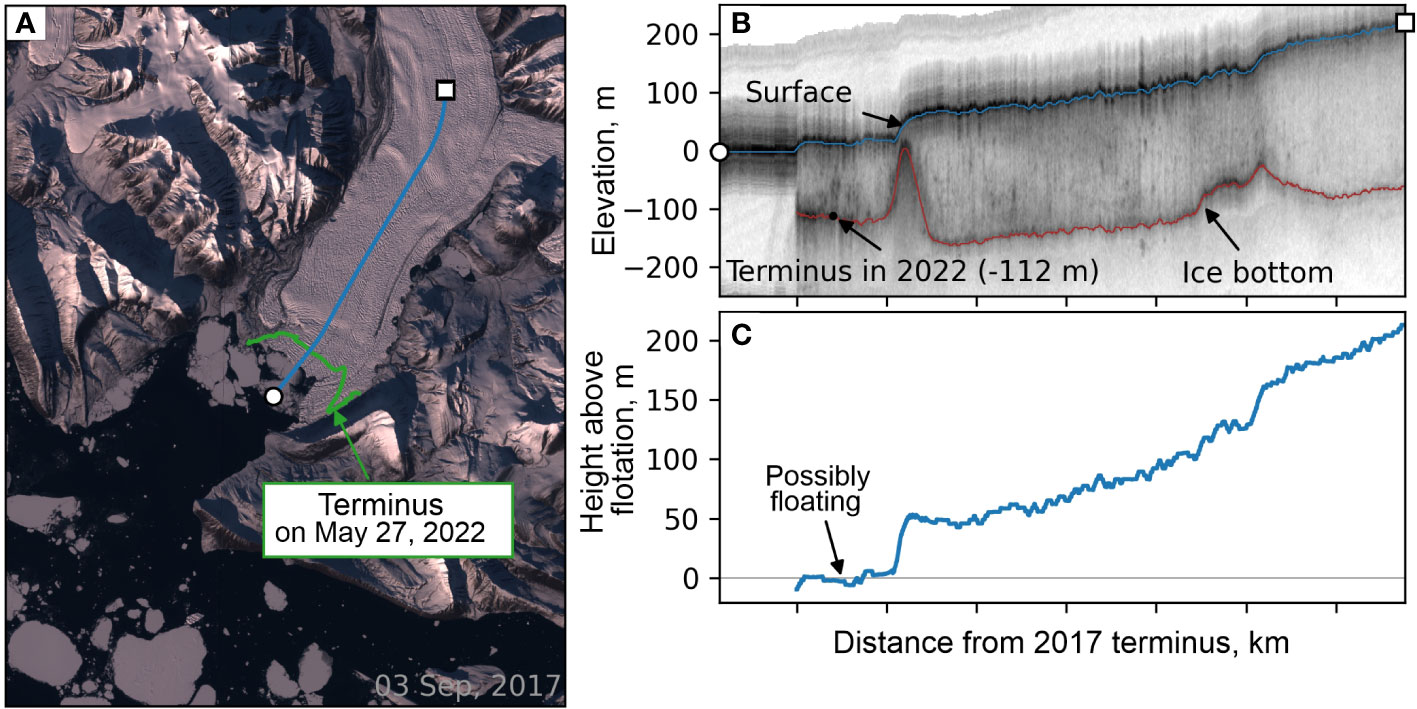
Figure 4 Terminus of Iceberg Glacier. (A) Sentinel-2 imagery of the terminus the year that radar data were acquired in 2017. Blue line shows the radar flight track. Green shows the position of the glacier’s terminus in May 2022, traced from Landsat-8 imagery. (B) Ice-penetrating radar acquired by the Multichannel Coherent Depth Sounder flying as part of NASA’s Operation Ice Bridge (Paden et al., 2010). (C) Height (m) above flotation implied by the bed reflector. The glacier is floating or only lightly grounded where the height above flotation is at or below 0.
3 Results
The water column at Iceberg Bay and Expedition Fjord shows four distinct layers, which are consistent across the entire study area (Figure 5). The four layers, from top to bottom are described below:
Figure 5 Gray solid lines show all vertical profiles of (A) in situ temperature (°C), (B) practical salinity, and (C) nitrates (mmol m-3) taken in Iceberg Bay and Expedition Fjord in April-May 2022. Dashed color lines show CTD profiles taken by the Ice-Tethered Profilers (ITPs) in the Canada Basin (ITPs #105 and #104) and over the lower continental slope of the CAA (ITPs #98 and #103). For ITP locations see Figure 1A. Blue and pink shading highlights the Pacific‐derived and Atlantic‐derived water, respectively. Dark blue shading is associated with Pacific winter water. The near-bottom increase of (A) temperature and (B) salinity is highlighted with numbered arrows with station numbers. Temperature distribution in the sub-surface water layer down to 150 m depth is enlarged in Figure 6 where all temperature profiles are distinguished by color.
(i) 0–27 m: The layer immediately below the sea-ice down to ~27 m depth comprises the subsurface halocline conditioned by snow, sea-ice and glacier meltwater inflow during summer (Figure 5B). The subsurface halocline is characterized by a relatively strong vertical salinity gradient that on average increases by 0.22 m–1, but peaks at 0.8 m–1 immediately below the ice. This layer shows two intermediate temperature maxima at ~3 m and 15–20 m depth with temperature increasing from –1.45°С to –0.41°С (Figures 5A, 6). The intermediate temperature maximum at ~3 m depth is recorded mainly in the inner part of Expedition Fjord with the magnitude of the temperature maximum gradually decreasing towards the mouth of Expedition Fjord (Figure 6). This maximum is not traced in Iceberg Bay (Figure 6). The deeper temperature maximum at ~15–20 m depth is present over the entire study area; however, the highest temperature of the intermediate maximum (–0.41°С) was recorded at station #2 in the shallowest (~40 m depth) inner part of Expedition Fjord (Figures 2, 6). The deeper temperature maximum gradually diminishes towards the outer part of Iceberg Bay and the Iceberg Glacier terminus (Figure 6).
Figure 6 Vertical distribution of in situ temperature at stations occupied in the inner and outer parts of Expedition Fjord (orange and red lines, respectively) and Iceberg Bay (green and black lines, respectively), at the glacier terminus (blue lines) and over the adjoining region (violet lines). For individual stations, see color code at the bottom. For regional differentiation of CTD stations see Figure 2.
(ii) 27–180 m: A layer with a weaker vertical salinity gradient (salinity 0.016 m–1) and temperatures increasing from –1.65°С to –1.25°С underlays the subsurface halocline and extends to a depth of ~180 m (Figures 5A, B). We refer to this layer as the Pacific-modified polar water following its similarity to the Pacific-derived water layer over the adjoining Canada Basin (e.g., Steele et al., 2004; Shimada et al., 2005). This layer is further split into two sub-layers around approximately 110 m depth by an increase in the intermediate maximum of nitrates (~18-19 mmol m-3; light blue vs. dark blue shading in Figure 5C), which indicates the presence of Pacific winter water (Jones and Anderson, 1986; Alkire et al., 2019). However, the temperature of the Pacific-modified polar water in Iceberg Bay and Expedition Fjord does not show the patterns typical for PW in the Arctic Ocean. The Arctic Ocean Pacific summer water with temperatures above −1.2°C for salinities between 31 and 32 overlays a deeper layer of Pacific winter water with salinities between 32 and 33 with temperature as cold as −1.45°C (Steele et al., 2004; Shimada et al., 2005; Timmermans et al., 2017). In contrast to the western Arctic Ocean, in Expedition Fjord and Iceberg Bay the shallower portion of the Pacific-modified polar water (associated with Pacific-derived summer water) has a mean temperature of ~ −1.4°C, while the deeper portion of this layer (related to the Pacific-modified winter water) exhibits an increase in temperature with depth from ~ −1.2°C to −0.5°C (Figures 5A and 6). Away from the Iceberg Glacier terminus and the inner part of Iceberg Bay, which was packed with icebergs, water temperature shows a gradual increase with depth from –1.5°С at 27 m depth to –0.5°С at 180 m depth indicating the influence of warm Atlantic water (AW). In the inner part of Iceberg Bay, and close to the Iceberg Glacier terminus, the temperature of Pacific-modified water shows intrusions of cooler water with negative temperature anomalies (relative to the ambient CTD profiles) from 0.05°C to ~0.3°C (Figures 5A and 6). In the σ0 plane, these intrusions are isopycnical meaning they are entirely driven by temperature anomalies with no deviations in salinity (Figure 7). The majority of the intrusions were recorded within the salinity range from 31.7 to 33.5 (Figure 7) from ~30 m down to ~130–140 m depth.
Figure 7 In situ temperature and practical salinity (TS) curves for CTD stations occupied (A) in the inner and outer parts of Expedition Fjord (orange and red lines, respectively) and (B) Iceberg Bay (green and black lines, respectively), (C) at the glacier terminus (blue lines), and (D) over the region adjoining the glacier terminus (violet lines). For individual stations, see color code at the bottom. Black arrows indicate sub-surface temperature maxima attributed to the solar radiative heating during summer 2020 and 2021. (C, D) Blue shading highlights ocean-glacier interaction. CTD stations taken by ITPs in the Canada Basin and over the lower continental slope of the CAA are shown by green (ITP98), light blue (ITP103), dark blue (ITP104), and purple (ITP105) dotted lines. Pink thick line shows mean TS diagram for the cross‐slope eastern Beaufort Sea section adopted from Dmitrenko et al. (2016). The σ0 isopycnals in kg m–3 are depicted with grey dashed lines. The dashed dark blue line is surface freezing temperature. Black‐dotted lines indicate the bounds defining the different water masses in the western Beaufort Sea following von Appen and Pickart (2012): The 33 line separates the Pacific (31 < S < 33) from the Atlantic (S > 33) water, and the −1°C line separates the Pacific summer and winter water.
(iii) 180–240 m: Below the Pacific-modified polar water (>180 m depth), temperatures increased steadily through the Atlantic-modified polar water with salinity from 34 to 34.5 (Figures 5A, B). The temperatures eventually exceeded 0°C (the commonly accepted upper boundary of the Atlantic layer) at ~240 m depth, indicating the presence of AW (Figure 5A).
(iv) 240 m to bottom: AW occupies depths exceeding 240 m. The thermohaline characteristics of the AW layer are spatially uniform over the entire study area (Figures 5A, B). The temperature increases with depth from 0°C at ~240 m to 0.4°C at ~495 m and 478 m depth (stations #43 and #45, respectively; Figures 2, 5A). The salinity of the AW layer ranges from 34.4 to 34.78 (Figures 5B, 7). The thermohaline stratification of a deeper portion of the AW layer from 400 m to 495 m depth is weak, with vertical temperature and salinity gradients of 0.0002°C m–1 and 0.0002 m–1, respectively (Figures 5A, B).
Finally, stations #1, 4, and 11 show an anomalous increase in temperature and salinity by 0.02°C to 0.05°C and 0.2 to 0.4, respectively, through the layer 5-20 m above the seafloor (Figures 5A, B, and 6). These stations are located in the inner part of Expedition Fjord (#1 and #4) and at the Iceberg Glacier terminus (station #11, Figure 2).
4 Discussion
Below we discuss the potential origin and modifications of the water masses identified in Iceberg Bay and Expedition Fjord. We also use our findings to trace PW flow through the northwestern CAA to Parry Channel, putting our results into the context of upstream observations in the Canada Basin and the eastern Beaufort Sea and downstream observations in the CAA.
4.1 Ocean-glacier interaction
Observations show that the Iceberg Glacier outflowing to Iceberg Bay is a surging tidewater glacier, currently in a quiescent phase (Copland et al., 2003). Ice-penetrating radar data allow us to estimate the draft of the glacier outlet and icebergs generated by calving of the glacier terminus (Figure 4). About 1.6 km upstream of Iceberg Glacier’s 2022 terminus position, it crosses a significant bedrock bump that reaches to just 2 m below sea level (Figure 4B). Downstream of this bump the glaciers tongue is free floating (Figure 4C) with a mean ice thickness of 131 m (117 m draft) and maximum of 141 m (129 m draft) in this area. This depth is consistent with the average depth of the grounding lines for marine terminated glaciers in the northern CAA (∼150-m depth; Van Wychen et al., 2014). Although satellite imagery indicates that the terminus retreated 4 km between 2001 and 2022 (including 0.8 km of retreat between the radar measurements in 2017 and our field season in 2022), ICESat-2 data indicate that the ice surface changed little (Smith et al., 2022), suggesting little change to the overall ice thickness.
CTD profiles taken in the inner part of Iceberg Bay show cold-water intrusions, which we speculate are the result of ocean–glacier interactions. This abnormal intrusive activity is evident for stations located near the terminus of the tidewater glacier and in the inner part of Iceberg Bay, which is tightly packed with icebergs (Figures 2, 6). These CTD profiles show numerous intrusions of cool water from ~30 m to 130–140 m depth that caused temperature inversions by up to 0.33°C (Figure 6). The depth of these intrusions aligns approximately with the estimated depth of the glaciers terminus (Figures 4, 6).
Seawater cools when it comes in contact with glacier ice that is colder than the in situ freezing temperature of seawater (Jenkins, 1999; Mayer et al., 2000; Stevens et al., 2016; Dmitrenko et al., 2017). For example, for the land terminating White Glacier located at the end of Expedition Fjord ~25 km eastward of the Iceberg Glacier terminus (Figure 2), Blatter (1987) reported that glacier ice temperature at ~3 km to the glacier terminus increased from –13°C at the surface to –2°C at 160 m depth. For the Iceberg Glacier outlet, the cold glacier and surrounding icebergs can significantly affect the water column both laterally and immediately below the ice, generating water that can be colder than the ambient water. The lateral exchange between water impacted by the ocean-glacier interaction and ambient water of Iceberg Bay, which is primarily comprised of modified PW, gives rise to the intrusive interleaving similar as reported by Jenkins (1999); Mayer et al. (2000); Stevens et al. (2016), and Dmitrenko et al. (2017), and as evident in Figure 6. The sub-glacier freshwater discharge and glacier meltwater can also reduce the salinity of the ambient water; however, there are no salinity anomalies that coincide with cold water intrusions, and the TS curves in Figure 7 show that cold water intrusions are isohaline (light blue shading in Figure 7). This indicates that there is no sub-glacier discharge during winter. This is also evident from the nitrate profiles (Figure 5C), which have a relatively uniform vertical distribution over the entire research area, with no increase in nitrates in the proximity of the tidewater glacier. In contrast, near the marine terminating glaciers in Jones Sound, Bhatia et al. (2021) linked enhanced concentration of nutrients to glacial activity during summer associated with upwelling of nutrients from deeper water by subglacial melt plume.
During summer, the local surface freshening in Iceberg Bay and Expedition Fjord is the result of glacier meltwater being discharged and glacier ice melting when it comes in contact with the warmer water. The observed melting at the face of the glacier leads to a temperature reduction of roughly 0.2°C. The heat lost by 1 g of water melts 0.0025 g of ice (latent heat 80 cal g–1). If the initial salinity is 33, this would reduce the salinity of the water cooled by 0.2°C to 32.92. The cooled, less saline water is less dense disrupting the interleaving observed during winter. This suggests that the interleaving is re-established during each winter. Finally, the interleaving occurs at the same temperature and salinity range as Pacific winter water (Figure 7) reinforcing the low temperature of Pacific winter water as the Arctic Ocean water passes through the CAA.
4.2 The properties of the Arctic water in Iceberg Bay and Expedition Fjord
The CAA connects the Arctic Ocean to Baffin Bay providing pathways for the freshened surface seawater and low-salinity Pacific-derived Arctic water to the North Atlantic through Nares Strait, Jones Sound and Lancaster Sound at the eastern end of Parry Channel (Melling et al., 1984; Wang et al., 2012; Wekerle et al., 2013; Colombo et al., 2021; Figure 1A). Comparing CTD profiles collected in Iceberg Bay and Expedition Fjord in 2022 (gray solid lines in Figures 5A, B) with those collected upstream in the adjacent Arctic Ocean in 2016 and 2019 (dashed color lines in Figures 5A, B) and in the eastern Beaufort Sea (pink thick line in Figure 7) reveals significant differences. Based on upstream CTD data and thermal structure of the sub-surface water layer in Iceberg Bay and Expedition Fjord, we assign this difference to the wind-driven water dynamics and vertical mixing over a rough bottom topography of the CAA continental slope.
4.2.1 Sub-surface layer
ITP data from 2019 show the presence of a sub-surface mixed layer extending down to 50 m depth with a salinity of 30.3–30.6 (Figure 5B). In 2016, the sub-surface mixed layer was shallower (to ~25 m depth), fresher (~28.7), and slightly warmer (~ –1.57°C). In contrast to the adjoining Arctic Ocean, in Iceberg Bay and Expedition Fjord, the sub-surface water layer is continuously stratified, with the salinity already exceeding 30 by 5 m depth. At 50 m depth, salinity exceeds that recorded over the adjoining Arctic Ocean in 2019 by ~1.5 (Figure 5B). For comparison, Fissel et al. (1984) observed salinity exceeding 31–32 below 5 m depth in Peary Channel during March-April 1982. The temperature of the sub-surface mixed layer off the CAA is close to the freezing point at a given salinity, while in Iceberg Bay and Expedition Fjord, the temperature exceeds that in the Arctic Ocean by 0.2°C to 1°C (Figure 5A).
The difference in the surface water salinity in Iceberg Bay and Expedition Fjord and the adjoining Arctic Ocean may also reflect a difference in source water properties for these two regions. Along the northern CAA, a wind-driven surface flow advects saline ocean water southwestwards along the CAA boundary (Leblond, 1980). This saltier water can dominate the surface water layer of Iceberg Bay and Expedition Fjord. In the adjoining Arctic Ocean, the clockwise atmospheric circulation over the Canada Basin favors accumulation of fresh water in the Beaufort Gyre (Kenigson and Timmermans, 2021). The ITP-derived CTD data used in this study (Figure 1A) seem to be impacted by the freshened water of the Beaufort Gyre.
The loss of the subsurface freshened water layer in Iceberg Bay and Expedition Fjord may be partially linked to anticyclonic atmospheric circulation over the Canada Basin (Figure 8). The Beaufort High atmospheric pressure associated with anticyclonic winds drives the Arctic Ocean’s Beaufort Gyre, the major freshwater reservoir of the Arctic Ocean (Kenigson and Timmermans, 2021). As sea-ice concentration is reduced during the summer, the water column is more readily exposed to wind forcing. The anticyclonic wind favors coastal upwelling over the Canadian Beaufort Sea continental slope (Kirillov et al., 2016). Over the northern Canadian Arctic, the summertime anticyclonic wind is suggested to generate off-shore surface Ekman transport reducing freshwater storage in the adjacent CAA. The onshore flow of the deeper water over the sills of 356–450 m depth (Melling et al., 1984) favors inflow of Pacific-derived and AW into the CAA, which is what we observed in Iceberg Bay and Expedition Fjord (Figure 5).
Figure 8 Sea-level pressure (mb) derived from ERA5 reanalysis for July to October (A) 2020, (B) 2021, and (C) for 2001 to 2021. The red dotted rectangle encloses Axel Heiberg Island in the CAA at ~ 90°W.
The difference in thermal structure of the sub-surface water layer down to 30 m depth in Iceberg Bay and Expedition Fjord compared to the adjacent Arctic Ocean seems to be explained by a combination of summer radiative heating and a deficiency of water dynamics including vertical mixing, lateral advection, and tides. During summer 2020, enhanced anticyclonic atmospheric forcing over the Canada Basin (Figure 8A) likely drove sea-ice out of Iceberg Bay and Expedition Fjord into Sverdrup Channel, resulting in them being ice-free by mid-late July (Figures 3A–C). By contrast, in summer 2021, the Beaufort High was weakened (Figure 8C), causing ice to remain within Iceberg Bay rather than being flushed out. As a result Iceberg Bay remained ice covered throughout summer (Figure 3, right), with open water gradually expanding from east to west along Expedition Fjord (Figure 3F). The linkage between ice flux and atmospheric forcing has been justified for this area by Kwok (2006). Using six years (1997–2002) of the satellite ice data and atmospheric reanalysis data, he reported that 67% of the variances in ice area exchanges between the Arctic Ocean and the CAA is controlled by the SLP gradient across the flux gate placed near the openings into the Peary and Sverdrup Straits. In turn, SLP over the flux gate is linked to the large-scale atmospheric circulation.
The presence of open water during summer favors radiative heating and thereby impacts the temperature profile of the water column. For example, during the ice-free summer of 1988 Gilbert (1990) reported water temperature exceeding 4°C down to ~7 m depth in Expedition Fjord. The spatial distribution of the sub-surface temperature maxima in spring 2022 is consistent with the spatial distribution of sea-ice during the preceding summers of 2020 and 2021. Temperature maxima at 15–20 m depth are observed over the entire sampled area (Figures 6, 7); however, the magnitude of the temperature anomaly gradually decreases from the inner part of Expedition Fjord to the outer part of Iceberg Bay (Figures 6, 7). This is consistent with spatial patterns of sea-ice retreat during July 2020 (not shown) when the inner part of Expedition Fjord became ice-free about three weeks earlier than the outer part of Iceberg Bay. A shallower temperature maximum at ~3 m depth was recorded only over the area of Expedition Fjord that became ice-free during the latter half of summer 2021 (Figures 3F, 6, 7). Thus, solar radiative heating during the open water season explains the origin of the intermediate temperature maxima in the sub-surface water layer. The preservation of these temperature features from summer 2020 to spring 2022 clearly indicates weak water dynamics and limited vertical mixing in Iceberg Bay and Expedition Fjord. This finding is critically important for interpreting modifications of Pacific-derived and AW from the Arctic Ocean to the central CAA. Weak water dynamics in Iceberg Bay and Expedition Fjord assumes that the revealed modification of PW and AW occurs upstream to this area.
Our suggestion on the origin of the sub-surface temperature maxima is supported by observations in several other areas of the Arctic. Ford and Hattersley-Smith (1965) collected CTD profiles during summers 1962-1965 in Nansen Sound (Figure 1A) and concluded that heat absorbed through solar radiative heating might be trapped if there is no vertical mixing and little advection. Jackson et al. (2010) reported on a near‐surface temperature maximum at typical depths of 25–35 m in the Canada Basin being trapped below the summer halocline, thereby storing heat from solar radiation that subsequently reduced ice growth. Dmitrenko et al. (2015) observed a near-surface temperature maximum in a fjord in northeast Greenland, which was preserved beneath the landfast ice and seasonal halocline from October to May, and thereby indicated weak water dynamics and limited vertical mixing. Through a 1-D thermodynamic ice growth model, Kirillov et al. (2015) found that this remnant heat reduced thermodynamic ice growth in the fjord by as much as 24% during winter. Hence, this remnant solar heat may in part explain why the landfast ice cover of Iceberg Bay and Expedition Fjord was only 1 to 1.6 m thick by the end of winter at such a high latitude.
4.2.2 Pacific-derived water and Atlantic water
ITP records show that off the coast of the CAA, below the sub-surface mixed layer, a low-stratified water layer from ~60 m to 180 m depth is comprised by the Pacific-derived water. Its shallower (warmer) portion (<100 m depth, salinity <32.3) at temperatures up to –0.85°C can be attributed to Pacific summer water, while its deeper (cooler) portion with temperatures down to –1.5°C at salinity from 32.2 to ~34 is associated with Pacific winter water (Figures 5A, B). The ITP stations have different characteristics, with higher temperature of Pacific summer water on the western stations #98 and #103 compared to the northeastern stations #104 and #105 (Figures 1A, 5). The different pathways of PW in the Arctic Ocean may explain this difference, with the western stations likely fed by the Alaska Coastal current, and the eastern stations by the transpolar branch (Steele et al., 2004).
Compared to the CAA continental slope, the temperature profiles in Expedition Fjord and Iceberg Bay show an opposite tendency. The upper portion of the Pacific-modified polar water is cooler, while the lower portion is warmer (Figure 5A). Moreover, the salinity of the Pacific-derived water layer off the CAA is less than that of the Pacific-modified polar water in Expedition Fjord and Iceberg Bay by ~0.5 (Figure 5B). For the underlying water layer (~180–240 m depth; the depth range of the Atlantic-modified polar water layer in Iceberg Bay and Expedition Fjord), the mean temperature off the CAA at ITPs #98, 104, and 105 is ~0.4°C less compared to Iceberg Bay and Expedition Fjord (Figure 4A). For ITP #103, this difference exceeded 0.7°C (Figure 5A). In contrast to temperature, ITPs #98, 104, and 105 do not show significant salinity differences between the CAA and the Arctic Ocean (Figure 5B). Only ITP #103 reveals a change in salinity in the Atlantic-modified polar water layer off the CAA, which is ~0.3 less than that in Expedition Fjord and Iceberg Bay (Figure 5B).
Overall, the Pacific-modified polar water in Iceberg Bay and Expedition Fjord does not show the thermal structure associated with Pacific-derived water of the Canada Basin and the eastern Beaufort Sea. There is no fraction of Pacific summer water, while the fraction of Pacific winter water is excessively warm indicating interaction with underlying AW (Figures 5A, 7). This feature is extended through the Atlantic-modified polar water down to the upper boundary of AW at ~240 m depth (Figures 5A, 7).
AW sampled in Iceberg Bay and Expedition Fjord is significantly different from that in the adjoining Arctic Ocean. The upper boundary of AW off the CAA was found at 245 m and 265 m depth by the ITPs, which is 5 m (ITPs #104 and 105) and 25 m (ITP #103) deeper compared to Iceberg Bay and Expedition Fjord (Figure 5A). The salinity of this layer, however, is not much different from that recorded in Expedition Fjord and Iceberg Bay; the insignificant (<0.15) negative salinity offset was observed only through the upper 50 m of the AW layer sampled by ITP #103 over the lower continental slope of Parry Islands (Figures 1A, 5B). In contrast to salinity, temperature of the AW layer off the CAA and in the eastern Beaufort Sea is significantly different from Iceberg Bay and Expedition Fjord. On average, temperature off the CAA is ~0.4°C warmer, with a maximum difference of 0.45°C recorded by ITP #105 at 370 m depth (Figure 5A). Furthermore, from 240–370 m depth, temperature profiles off the CAA show double diffusive staircases while temperature profiles through the upper AW layer in Iceberg Bay and Expedition Fjord are smooth (Figure 5A). The disruption of the double diffusive staircases suggests an enhanced vertical diffusivity (Dmitrenko et al., 2008) as the Arctic water passes over the CAA continental shelf. Finally, the temperature profiles through the AW layer off the CAA show the intermediate maximum at ~370–420 m depth with temperature increasing with depth from 0°С at the AW upper boundary to ~0.7°С at 370–420 m, and then gradually cooling to ~0.6°С above the seafloor (Figure 5A). In contrast, the temperature through the AW layer in Iceberg Bay and Expedition Fjord increases steadily. Moreover, the deeper portion of AW below ~350 m depth is weakly stratified with a vertical temperature gradient of 0.0003°C m–1.
We note, however, that the synoptic, seasonal and interannual variability of temperature and salinity in the Arctic Ocean can be significant (Polyakov et al., 2003; de Steur et al., 2013). This makes it difficult to interpret CTD profiles taken in Iceberg Bay and Expedition Fjord in 2022 in context of CTD profiles measured off the CAA in 2016 and 2019 and over the eastern Beaufort Sea from 2002 to 2011. However, this interpretation appears to be important and plausible for interpreting hydrographic patterns observed in Iceberg Bay and Expedition Fjord. Note that for salinity range ≥34, TS curves derived from ITP profiles resemble those collected across the Eastern Beaufort Sea continental slope (Figure 7). Moreover, the thermohaline structure revealed in Iceberg Bay and Expedition Fjord is consistent with that reported by Fissel et al. (1984) for the area between Parry Islands and Sverdrup Islands (Figure 1B). Using CTD profiles taken from the landfast ice in March 1982, they reported rather similar vertical salinity distribution with temperatures about 0.15°С cooler compared to our Iceberg Bay and Expedition Fjord observations. At the same time, for summer 1962, in the Nansen Sound fjord systems Ford and Hattersley-Smith (1965) reported a salinity of 34 at 100 m depth that exceeds the observed salinity in Iceberg Bay and Expedition Fjord by 1.2. The elevated salinity from ~60 m to 180 m depth indicates that there was no Pacific-modified water in the Nansen Sound fjord system in summer 1962, highlighting the importance of interannual variability through the CAA. More recent data from August 1998 obtained in Sverdrup Channel at the front of Glacier Bay and in southern Peary Channel (Fisheries and Oceans Canada (DFO), 2022) show thermohaline structure of PW and AW, which is rather similar to that recorded in Glacier Bay (not shown).
Overall, comparing with the adjacent Arctic Ocean, a shallower fraction of Pacific-derived water that is cooler and a deeper fraction that is warmer is observed in Iceberg Bay and Expedition Fjord (Figure 5A). Salinity of Pacific-derived water in the fjord system is higher than off the CAA (Figure 5B). AW of the Iceberg Bay and Expedition Fjord is cooler relative to that of the adjoining Arctic Ocean (Figures 5A, 7). These results suggest significant modification of Pacific-derived water in or “en route” to the fjord system. Preserving solar radiative heating in the sub-surface water layer for the period exceeding one and a half year (see section 4.2.1) reveals weak water dynamics and a lack of vertical mixing in Iceberg Bay and Expedition Fjord. This finding suggests that modification of Pacific-derived and AW is occurring upstream where the mixing rate is enhanced.
For the western CAA, Melling et al. (1984) identified a warmer halocline and cooler AW compared to the adjoining Arctic Ocean, a structure that is similar to that revealed for Iceberg Bay and Expedition Fjord (Figures 5A, 7). Note that in this context, the halocline is associated with the Pacific-modified water layer (Figure 5B). Furthermore, Melling et al. (1984) suggested that the observed thermohaline structure is a consequence of the heat exchange with underlying AW in a narrow band over the continental slope and shelf off the CAA, when the Arctic water is on its way to the western CAA. They also reported a maximal warming of the halocline (0.25°C) at a salinity of 33.5 in Parry Channel. In Iceberg Bay and Expedition Fjord, the mean warming of Pacific-modified water at salinity 33.5 is 0.38°C (Figure 7). This indicates that Iceberg Bay and Expedition Fjord are closer to the area of enhanced vertical diffusivity over the continental slope and shelf off the CAA compared to Parry Channel (Figure 1A). However, the interannual variability of PW and AW in the Arctic Ocean can be significant, making it difficult to compare quantitatively the CTD data used in this study to those analyzed by Melling et al. (1984). Overall, our results on modification of Pacific- and Atlantic-derived water in Iceberg Bay and Expedition Fjord are consistent with enhanced vertical diffusivity over the continental slope and shelf off the CAA suggested by Melling et al. (1984).
The downstream CTD data (Figures 1A, 9) from Penny Strait (station CAA9), Wellington Channel (station WC01) and McDougall Sound (station CAA6) show further modifications of the Arctic water flow through the CAA. All three stations reveal vertical mixing between Pacific- and Atlantic-modified water. This mixing tends to increase the salinity of Pacific-modified water (by ~0.5) and decreases the salinity of Atlantic-modified water (by ~0.8 to 1.7) relative to profiles obtained in Iceberg Bay and Expedition Fjord (Figure 9B). Among these three stations in the central CAA, only station CAA6 partially resembles the initial thermal signature of Pacific- and Atlantic-modified water below 80 m; however, this water layer is gradually cooling with depth by ~0.2°C at the seafloor relative to that in Iceberg Bay and Expedition Fjord (Figure 9A). It seems that station CAA6 captured flow of Pacific- and Atlantic-modified water through Parry Channel (Figures 1A, 9). Station WC01 shows strongly modified water below 50 m depth due to a shallow sill (~50 m depth) north to Cornwallis Island (Figures 1A, 9). Moreover, station CAA9 taken north of the sill at Penny Strait shows that the thermohaline signature of Pacific- and Atlantic-modified water was already significantly modified upstream before flowing over the sill. The nitrate profiles (Figure 9C) show no intermediate maximum, which is usually attributed to Pacific-derived water. High-spatial-resolution CTD profiling conducted in this area in September 2015 revealed enhanced vertical mixing caused by interaction of mean flow, tides and bottom friction (Hughes et al., 2018). This leads to the conclusion that tracing the initial thermohaline signature of the PW and AW flow through the CAA seems to be impossible due to disruptions imposed by enhanced vertical mixing in a narrow band over the continental slope and shelf off the CAA as suggested by Melling et al. (1984), but also over the sills and narrow straits through the CAA. This is consistent with results of downstream CTD observations and numerical simulations by Hughes et al. (2017).
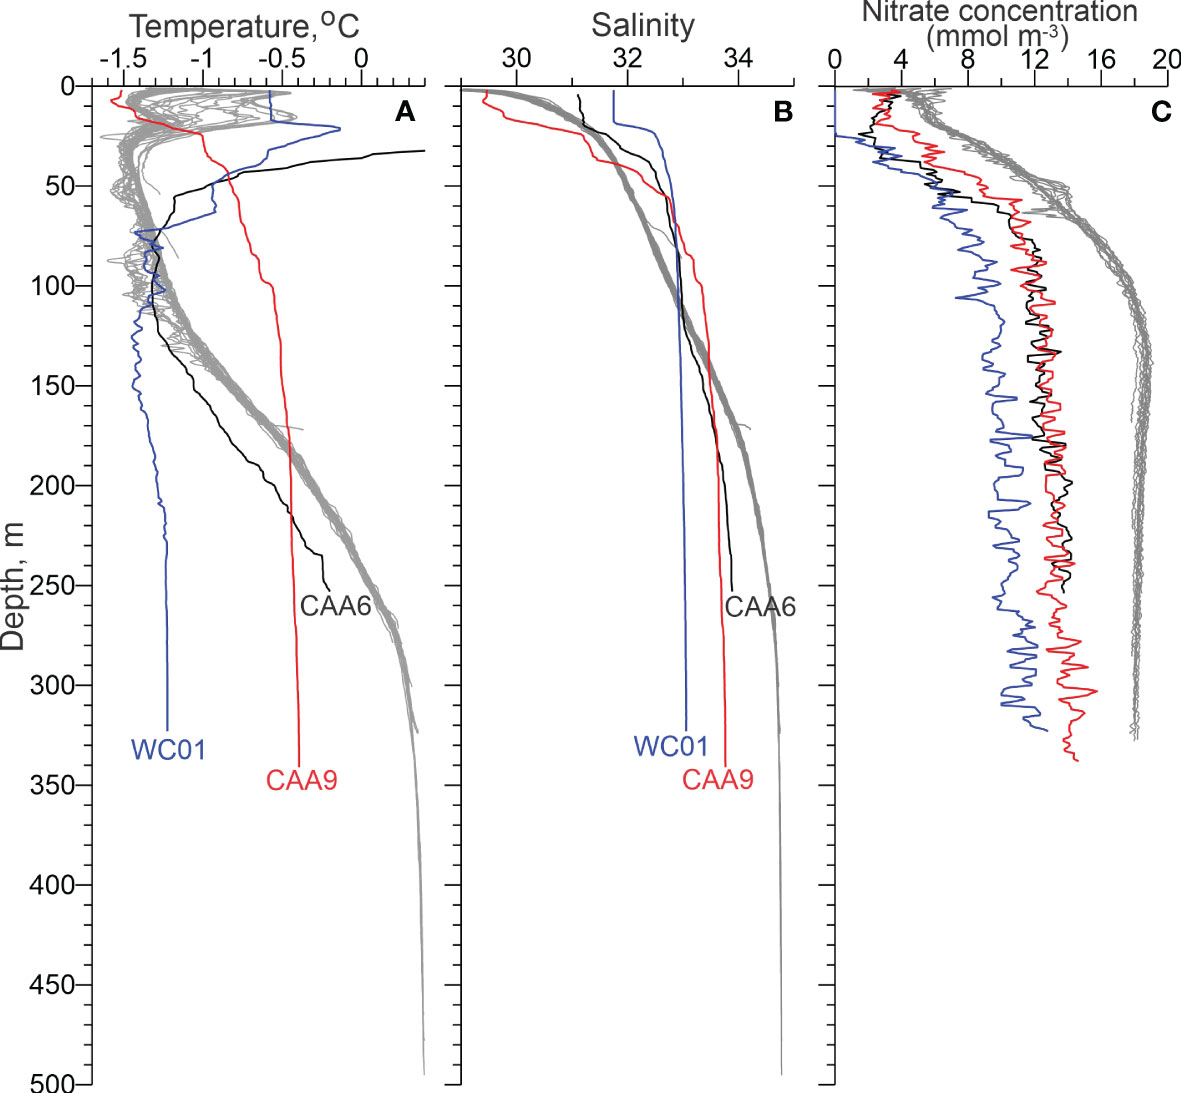
Figure 9 Gray lines show all vertical profiles of (A) in situ temperature (°C), (B) practical salinity, and (C) nitrates (mmol m-3) taken in Iceberg Bay and Expedition Fjord in April-May 2022. Сolor lines show CTD profiles taken in the central CAA north of Parry Channel during CCGS Amundsen GEOTRACES expedition in September-October 2015 (see Figure 1A): #CAA6 (black), CAA9 (red), and WC01 (blue).
4.3 Geothermal impact
Several CTD profiles in Iceberg Bay (#11) and Expedition Fjord (#1 and #4) show an anomalous increase of temperature and salinity by 0.02°C to 0.05°C and 0.2 to 0.4, respectively, through the bottom 5–20 m layer above the seafloor (Figures 5A, B). We attribute this near-bottom feature to geothermal activity. Perennial springs have been observed on land around Expedition Fjord at Colour Peak and along the right bank of the Expedition River (Omelon et al., 2006; Figure 2). At Colour Peak, the spring discharged water at ~6°C and specific conductivity 227 to 230 mS cm–1 (measured at 25°C; salinity ~170), and had a total discharge of 20–25 l s–1 year-round (Omelon et al., 2005). We speculate that CTD station #1, which is located ~2 km from Colour Peak (Figure 2), captured the extension of the geothermal springs along the seafloor of Expedition Fjord. Additionally, stations #4 and #11 also capture the influence of the geothermal springs that are presumably located along the seafloor in Expedition Fjord. Station #4 is ~6 km from Colour Peak, while station #11 is near the Iceberg Glacier terminus in Iceberg Bay (Figure 2).
High-resolution satellite imagery taken over the Iceberg Glacier terminus during an earlier stage of sea-ice breakup (June to August 2019-22) shows a small-scale (< 1 km2) area of open water adjoining the glacier terminus in the vicinity of station #11, which is located between ~0.6 km (2019) and 1.5 km (2022) to the terminus of Iceberg Glacier (Figure 10). The consistent formation of open water in this area during the early onset of sea-ice breakup indicates an enhanced heat flux to the sea surface. The geothermal heat flux suggested at station #11 is too weak to impact sea-ice in the area. Thus, we assume that the geothermal springs extend below the subglacial valley, and thus promote the basal melt and sub-glacier discharge. Note that the geothermal heat is among three separate terms composing the basal melt. Two others are frictional heat and heat from surface meltwater, and the basal friction term is responsible for half of the basal melt (e.g., Karlsson et al., 2021). During the beginning of summer, an advective heat flux associated with sub-glacier meltwater discharge seems to be sufficient for disrupting the sea-ice cover in the vicinity of the glacier terminus. This is consistent with Sentinel-2 observations of turbid water outflowing from above the glacier terminus during summer exactly in the area where open water is observed near the glacier terminus (not shown).
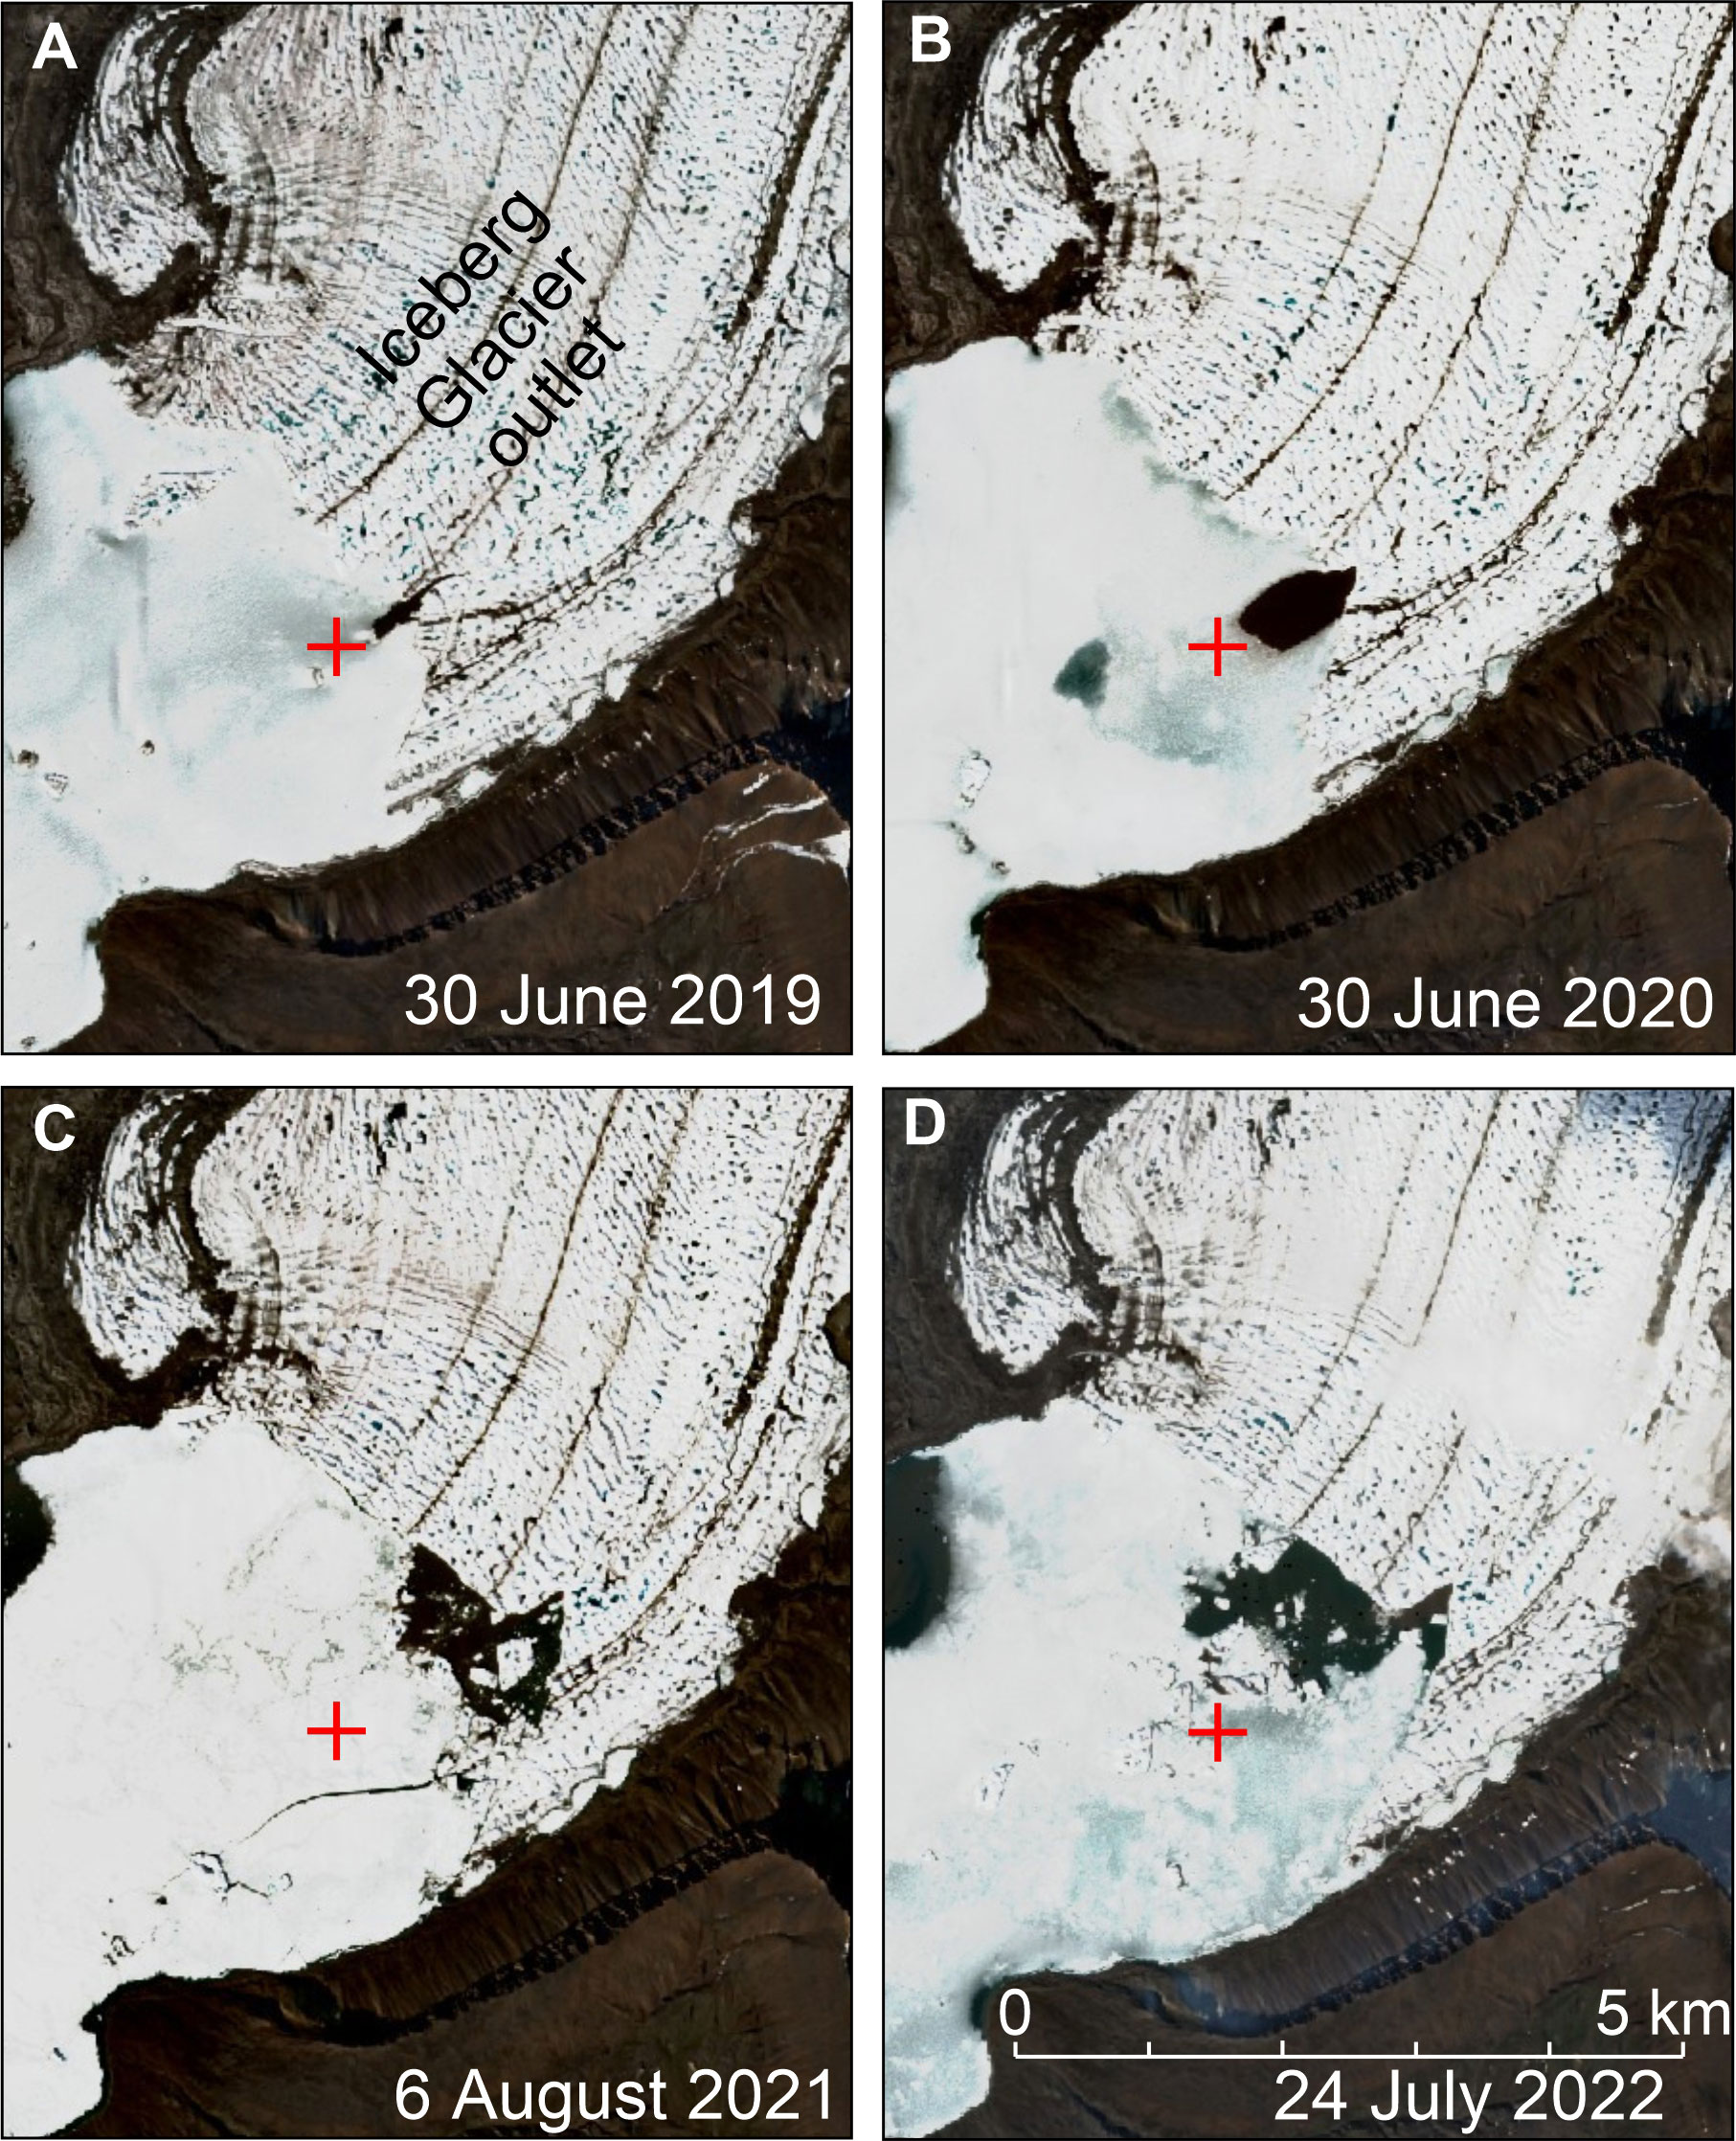
Figure 10 Sentinel-2 satellite imagery shows sea-ice conditions in Iceberg Bay at the Iceberg Glacier terminus during the beginning of sea ice break-up: (A) 30 June 2019, (B) 30 June 2020, (C) 6 August 2021, and (D) 24 July 2022. Red crosses mark location of St. 11.
5 Conclusions
A portion of the freshwater transport through the CAA consists of low‐salinity Pacific‐derived Arctic water flowing southeastward to Baffin Bay and onwards to the Labrador Sea. However, the processes that influence and modify this transport are not well understood. Here, a unique set of conductivity–temperature–depth (CTD) and nitrate profiles collected in April–May 2022 in Expedition Fjord and Iceberg Bay at Axel Heiberg Island, are used to identify the properties and spreading pathways of the Pacific-derived Arctic water in the northwestern CAA. The CTD profiles are examined within the context of upstream observations in the Arctic Ocean and downstream observations in the central CAA and reveal the origin of water masses and their interactions with ambient water from the continental slope and the nearby tidewater glacier outlet. CTD casts collected in Iceberg Bay and Expedition Fjord show that the subsurface water (25–180 m depth) is associated with the PW outflow from the Arctic Ocean. The underlying halocline separates the PW from a deeper layer of polar water that has interacted with warm (>0°C) AW that is detected below 240 m depth.
Notably, the water masses in Expedition Fjord and Iceberg Bay are significantly modified compared to the adjoining Arctic Ocean, as suggested from:
(i) Subsurface temperature maxima at ~3 m depth (salinity ~29.7) and ~17 m depth (salinity ~31) are attributed to solar radiative heating during summer 2021 and 2020, respectively. The preservation of these temperature features to spring 2022 clearly indicates weak water circulation and a lack of vertical mixing in Iceberg Bay and Expedition Fjord assuming that the revealed modification of PW and AW occurs upstream to this area. These findings are critically important for interpreting modifications of Pacific-derived and AW while they are “en route” from the Arctic Ocean to Baffin Bay;
(ii) The upper boundary of PW is traced at ~25 m depth in the study area compared to ~70 m depth in the adjoining Arctic Ocean. This indicates less freshwater content of the surface layer in the fjord system where the salinity of the 5-m thick surface layer is <30. We speculate that the anticyclonic atmospheric forcing over the Canada Basin favors surface water outflow to the Arctic Ocean, and Pacific and Atlantic water inflow through the CAA;
(iii) There is no signature of Pacific summer water; from ~30 m to 90 m depth, the mean water temperature is –1.4°C compared to –0.85°С over the lower continental slope of the CAA. At the front of the tidewater glacier outlet and near the surrounding icebergs, cold water intrusions of ~0.25°C are present through the Pacific water layer down to a depth of ~140 m, which corresponds to the estimated draft of the glaciers terminus;
(iv) The temperature of the deeper PW layer with salinity between 33 and 34 exceeds the temperature of Pacific winter water in the adjoining Arctic Ocean by ~0.5°C. The salinity of the PW layer exceeds that in the adjoining Arctic Ocean by 0.3–0.5. In contrast, AW is ~0.4°C cooler compared to the adjoining Arctic Ocean;
(v) CTD data suggests there is a geothermal heat flux at several spots in Expedition Fjord and near the terminus of Iceberg Glacier in Iceberg Bay. We speculate that the hypothetical extension of the geothermal springs to the Iceberg Glacier subglacial valley can generate sub-glacial discharge impacting sea-ice breakup along the glacier terminus.
Overall, our results indicate that Pacific and Atlantic waters in the CAA are modified due to enhanced vertical diffusivity over a rough bottom topography of the upper continental slope, which is consistent with upstream СTD observations in the Beaufort Sea continental slope, eastern Canada Basin and over the lower continental slope of the CAA, and preceding results by Melling et al. (1984). Taking into account numerous sills and narrow straits through the CAA, this leads us to conclude that tracing the initial thermohaline signature of the Pacific and Atlantic water flow through the CAA seems to be hardly possible. Both water masses are strongly modified due to disruptions imposed by interactions with a rough bottom topography of the CAA. This is consistent with results of downstream CTD observations and numerical simulations by Hughes et al. (2017).
Author’s note
Dedicated to the memory of our colleague Prof. David G. Barber, who inspired this research but passed away suddenly on 15 April 2022.
Data availability statement
The original contributions presented in the study are included in the article/Supplementary material. Further inquiries can be directed to the corresponding author.
Author contributions
ID, SK, and BR guided the overall research problem and developed methodology. ID conceptualized this research. ID, SK, NG, and DL conducted formal analysis and data curation. ID, SK, and NG performed the investigation. DD-J allocated resources. ID, BR, and DL wrote the original draft. ID, BR, NG, DL, JE, and DB revised and edited the original draft. ID, SK, and DL generated figures. ID and DD-J supervised and administrated this project. DD-J and DB accomplished the funding acquisition. All authors contributed to the article and approved the submitted version.
Funding
Funding for this research is provided by the Canada Excellence Research Chair (CERC) program (DD-J, PI). Logistics of expedition to Iceberg Bay and Expedition fjord was partially covered by Canada’s Polar Continental Shelf Program (PCSP), project Preliminary examination of glacial-marine coupling in a seasonally ice covered High Arctic Fjord. DB and JE are supported by the Natural Sciences and Engineering Research Council (NSERC) of Canada.
Acknowledgments
This work is a part of research conducted under the framework of the Arctic Science Partnership (ASP) and ArcticNet. Staff of the Martin Bergmann PCSP Complex in Resolute Bay, Nunavut provided operational equipment, accommodation and transportation. We appreciate Christopher Omelon (Queen’s University, Canada) for an extraordinary logistical support provided at McGill Arctic Research Station (MARS).
Conflict of interest
The authors declare that the research was conducted in the absence of any commercial or financial relationships that could be construed as a potential conflict of interest.
Publisher’s note
All claims expressed in this article are solely those of the authors and do not necessarily represent those of their affiliated organizations, or those of the publisher, the editors and the reviewers. Any product that may be evaluated in this article, or claim that may be made by its manufacturer, is not guaranteed or endorsed by the publisher.
Supplementary material
The Supplementary Material for this article can be found online at: https://www.frontiersin.org/articles/10.3389/fmars.2023.1181800/full#supplementary-material
References
Aitken A., Gilbert R. (1996). Marine Mollusca from expedition fiord, Western Axel heiberg island, Northwest territories, Canada. Arctic 49 (1), 29–43. doi: 10.14430/arctic1181
Aksenov Y., Karcher M., Proshutinsky A., Gerdes R., de Cuevas R. B., Golubeva E., et al. (2016). Arctic Pathways of pacific water: Arctic ocean model intercomparison experiments. J. Geophys. Res.: Ocean 121, 27–59. doi: 10.1002/2015JC011299
Alkire M. B., Falkner K. K., Boyd T., Macdonald R. W. (2010). Sea Ice melt and meteoric water distributions in Baffin bay and the Canadian Arctic archipelago. J. Mar. Res. 68 (6), 767–798. doi: 10.1357/002224010796673867
Alkire M. B., Morison J., Schweiger A., Zhang J., Steele M., Peralta-Ferriz C., et al. (2017). A meteoric water budget for the Arctic ocean. J. Geophys. Res.: Ocean 122, 10,020–10,041. doi: 10.1002/2017JC012807
Alkire M. B., Rember R., Polyakov I. (2019). Discrepancy in the identification of the Atlantic/Pacific front in the central Arctic ocean: NO versus nutrient relationships. Geophys. Res. Lett. 46, 3843–3852. doi: 10.1029/2018GL081837
Bamber J. L., Westaway R. M., Marzeion B., Wouters B. (2018). The land ice contribution to sea level during the satellite era. Environ. Res. Lett. 13, 063008. doi: 10.1088/1748-9326/aac2f0
Bendtsen J., Mortensen J., Lennert K., Ehn J. K., Boone W., Galindo V., et al. (2017). Sea Ice breakup and marine melt of a retreating tidewater outlet glacier in northeast Greenland (81° n). Sci. Rep. 7 (1), 4941. doi: 10.1038/s41598-017-05089-3
Bhatia M. P., Waterman S., Burgess D. O., Williams P. L., Bundy R. M., Mellett T., et al. (2021). Glaciers and nutrients in the Canadian Arctic archipelago marine system. Global Biogeochem. Cycles 35, e2021GB006976. doi: 10.1029/2021GB006976
Blatter H. (1987). On the thermal regime of an Arctic valley glacier: a study of white glacier, Axel heiberg island, N.W.T., Canada. J. Glaciol. 33 (114), 200–211. doi: 10.3189/S0022143000007279
Brugler E. T., Pickart R. S., Moore G. W. K., Roberts S., Weingartner T. J., Statscewich H. (2014). Seasonal to interannual variability of the pacific water boundary current in the Beaufort Sea. Prog. Oceanog. 127, 1–20. doi: 10.1016/j.pocean.2014.05.002
Carmack E., Chapman C. (2003). Wind-driven shelf/basin exchange on an Arctic shelf: the joint roles of ice cover extent and shelf-break bathymetry. Geophys. Res. Lett. 30, 1778. doi: 10.1029/2003GL017526
Carmack E. C., Yamamoto-Kawai M., Haine T. W. N., Bacon S., Bluhm B. A., Lique C., et al. (2016). Freshwater and its role in the Arctic marine system: sources, disposition, storage, export, and physical and biogeochemical consequences in the Arctic and global oceans. J. Geophys. Res.: Biogeosci. 121, 675–717. doi: 10.1002/2015JG003140
Castro de la Guardia L., Hu X., Myers P. G. (2015). Potential positive feedback between Greenland ice sheet melt and Baffin bay heat content on the west Greenland shelf. Geophys. Res. Lett. 42, 4922–4930. doi: 10.1002/2015GL06462
Colombo M., Rogalla B., Li J., Allen S. E., Orians K. J., Maldonado M. T. (2021). Canadian Arctic Archipelago shelf-ocean interactions: a major iron source to pacific derived waters transiting to the Atlantic. Global Biogeochem. Cycles 35, e2021GB007058. doi: 10.1029/2021GB007058
Copernicus Climate Change Service (2017) ERA5: fifth generation of ECMWF atmospheric reanalyses of the global climate. Copernicus climate change service climate data store (CDS). Available at: https://cds.climate.copernicus.eu/cdsapp#W/home (Accessed March 2, 2023).
Copland L., Sharp M. J., Dowdeswell J. A. (2003). The distribution and flow characteristics of surge-type glaciers in the Canadian high Arctic. Ann. Glaciol. 36, 73–81. doi: 10.3189/172756403781816301
de Steur L., Steele M., Hansen E., Morison J., Polyakov I., Olsen S. M., et al. (2013). Hydrographic changes in the Lincoln Sea in the Arctic ocean with focus on an upper ocean freshwater anomaly between 2007 and 2010. J. Geophys. Res.: Ocean 118, 4699–4715. doi: 10.1002/jgrc.20341
Dmitrenko I. A., Kirillov S. A., Forest A., Gratton Y., Volkov D. L., Williams W. J., et al. (2016). Shelfbreak current over the Canadian Beaufort Sea continental slope: wind-driven events in January 2005. J. Geophys. Res.: Ocean 121, 2447–2468. doi: 10.1002/2015JC011514
Dmitrenko I. A., Kirillov S. A., Ivanov V. V., Woodgate R. A. (2008). Mesoscale Atlantic water eddy off the laptev Sea continental slope carries the signature of upstream interaction. J. Geophys. Res.: Ocean 113, C07005. doi: 10.1029/2007JC004491
Dmitrenko I. A., Kirillov S. A., Myers P. G., Forest A., Tremblay B., Lukovich J. V., et al. (2018). Wind-forced depth-dependent currents over the eastern Beaufort Sea continental slope: implications for pacific water transport. Elem. Sci. Anth. 6, 66. doi: 10.1525/elementa.321
Dmitrenko I. A., Kirillov S. A., Rudels B., Babb D. G., Myers P. G., Stedmon C. A., et al. (2019). Variability of the pacific-derived Arctic water over the southeastern wandel Sea shelf (northeast Greenland) in 2015–2016. J. Geophys. Res.: Ocean 124, 349–373. doi: 10.1029/2018JC014567
Dmitrenko I. A., Kirillov S. A., Rudels B., Babb D. G., Toudal Pedersen L., Rysgaard S., et al. (2017). Arctic Ocean outflow and glacier-ocean interaction modify water over the wandel Sea shelf, northeast Greenland. Ocean Sci. 13, 1045–1060. doi: 10.5194/os-13-1045-2017
Dmitrenko I. A., Kirillov S. A., Rysgaard S., Barber D. G., Babb D. G., Toudal Pedersen L., et al. (2015). Polynya impacts on water properties in a northeast Greenland fjord. Estuar. Coast. Shelf Sci. 153, 10–17. doi: 10.1016/j.ecss.2014.11.027
Dodd P. A., Rabe B., Hansen E., Falck E., Mackensen A., Rohling E., et al. (2012). The freshwater composition of the fram strait outflow derived from a decade of tracer measurements. J. Geophys. Res.: Ocean 117, C11005. doi: 10.1029/2012JC008011
Dukhovskoy D., Yashayaev S. I., Proshutinsky A., Bamber J. L., Bashmachnikov I. L., Chassignet E. P., et al. (2019). Role of Greenland freshwater anomaly in the recent freshening of the subpolar north Atlantic. J. Geophys. Res.: Ocean 124, 3333–3360. doi: 10.1029/2018JC01468
Falck E., Kattner G., Budéus G. (2005). Disappearance of pacific water in the northwestern fram strait. Geophys. Res. Lett. 32, L14619. doi: 10.1029/2005GL023400
Fisheries and Oceans Canada (DFO) (2022) Vertical profiles of seawater properties measured by conductivity-Temperature-Depth loggers in British Columbia, Canada 1965 to present. Available at: https://catalogue.cioospacific.ca/dataset/ca-cioos_89aa45fc-7b42-426e-9293-e5703534bc4f?local=en (Accessed May 9, 2023).
Fissel D. B., Knight D. N., Birch J. R. (1984). An oceanographic survey of the Canadian Arctic archipelago, march–April 1982. Can. Contractor Rep. Hydrography Ocean Sci. 15, 415.
Ford L., Hattersley-Smith G. (1965). On the oceanography of the nansen sound fiord system. Arctic 18 (3), 149–204. doi: 10.14430/arctic3465
Foukal N. P., Pickart R. S., Moore G. W. K., Lin P. (2019). Shelfbreak downwelling in the alaskan Beaufort Sea. J. Geophys. Res.: Ocean 124 (10), 7201–7225. doi: 10.1029/2019JC015520
Gardner A. S., Moholdt G., Wouters B., Wolken G. J., Burgess D. O., Sharp M. J., et al. (2011). Sharply increased mass loss from glaciers and ice caps in the Canadian Arctic archipelago. Nature 473 (7347), 357–360. doi: 10.1038/nature10089
Gascon F., Bouzinac C., Thépaut O., Jung M., Francesconi B., Louis J., et al. (2017). Copernicus Sentinel-2A calibration and products validation status. Remote Sens. 9 (6), 584. doi: 10.3390/rs9060584
Gilbert L. (1990). Sedimentation in expedition fiord, Axel heiberg island, Northwest territories. Géographie physique Quaternaire 44 (1), 71–76. doi: 10.7202/032799ar
Grivault N., Hu X., Myers P. G. (2017). Evolution of Baffin bay water masses and transports in a numerical sensitivity experiment under enhanced Greenland melt. Atmosphere-Ocean 55 (3), 169–194. doi: 10.1080/07055900.2017.1333950
Guthrie J. D., Morison J. H., Fer I. (2013). Revisiting internal waves and mixing in the Arctic ocean. J. Geophys. Res.: Ocean 118 (8), 3966–3977. doi: 10.1002/jgrc.20294
Haine T. W. N., Curry B., Gerdes R., Hansen E., Karcher M., Lee C., et al. (2015). Arctic Freshwater export: status, mechanisms, and prospects. Glob. Planet. Change 125, 13–35. doi: 10.1016/j.gloplacha.2014.11.013
Hendry K. R., Huvenne V. A. I., Robinson L. F., Annett A., Badger M., Jacobel A. W., et al. (2019). The biogeochemical impact of glacial meltwater from southwest Greenland. Prog. Oceanog. 176, 102126. doi: 10.1016/j.pocean.2019.102126
Hersbach H., Bell B., Berrisford P., Hirahara S., Horányi A., Muñoz-Sabater J., et al. (2020). The ERA5 global reanalysis. Q. J. R. Meteorol. Soc 146, 1999–2049. doi: 10.1002/qj.3803
Hu X., Myers P. G. (2013). A Lagrangian view of pacific water inflow pathways in the Arctic ocean during model spin-up. Ocean Model. 71, 66–80. doi: 10.1016/j.ocemod.2013.06.007
Hu X., Myers P. G., Lu Y. (2019). Pacific water pathway in the ArcticOcean and Beaufort gyre in twosimulations with different horizontalresolutions. J. Geophys. Res.: Ocean 124, 6414–6432. doi: 10.1029/2019JC01511
Hughes K. G., Klymak J. M., Hu X., Myers P. G. (2017). Water mass modification and mixing rates in a 1/12° simulation of the Canadian Arctic archipelago. J. Geophys. Res.: Ocean 122, 803–820. doi: 10.1002/2016JC012235
Hughes K. G., Klymak J. M., Williams W. J., Melling H. (2018). Tidally modulated internal hydraulic flow and energetics in the central Canadian Arctic archipelago. J. Geophys. Res.: Ocean 123, 5210–5229. doi: 10.1029/2018JC013770
Hugonnet R., McNabb R., Berthier E., Menounos B., Nuth C., Girod L., et al. (2021). Accelerated global glacier mass loss in the early twenty-first century. Nature 592 (7856), 726–731. doi: 10.1038/s41586-021-03436-z
IceBridge MCoRDS L2 Ice Thickness (2023). Data set (University of Colorado Boulder, Colorado, USA: National Snow and Ice Data Center). doi: 10.5067/GDQ0CUCVTE2Q
Ice Tethered Profilers (2022) Data. Available at: https://www2.whoi.edu/site/itp/data/ (Accessed May 9, 2023).
Jackson J. M., Carmack E. C., McLaughlin F. A., Allen S. E., Ingram R. G. (2010). Identification, characterization, and change of the near-surface temperature maximum in the Canada basin 1193–2008. J. Geophys. Res.: Ocean 115, C05021. doi: 10.1029/2009JC005265
Jenkins A. (1999). The impact of melting ice on ocean waters. J. Phys. Oceanogr. 29, 2370–2381. doi: 10.1175/1520-0485(1999)029<2370:TIOMIO>2.0.CO;2
Jones E. P. (2001). Circulation in the Arctic ocean. Polar Res. 20 (2), 139–146. doi: 10.1111/j.1751-8369.2001.tb00049.x
Jones E. P., Anderson L. G. (1986). On the origin of the chemical properties of the Arctic ocean halocline. J. Geophys. Res.: Ocean 91, C9, 10759–10767. doi: 10.1029/JC091iC09p10759
Kanna N., Sugiyama S., Ando T., Wang Y., Sakuragi Y., Hazumi T., et al. (2022). Meltwater discharge from marine-terminating glaciers drives biogeochemical conditions in a greenlandic fjord. Global Biogeochem. Cycles 36, e2022GB007411. doi: 10.1029/2022GB007411
Karlsson N. B., Solgaard A. M., Mankoff K. D., Gillet-Chaulet F., MacGregor J. A., Box J. E., et al. (2021). A first constraint on basal melt-water production of the Greenland ice sheet. Nat. Commun. 12, 3461. doi: 10.1038/s41467-021-23739-z
Karpouzoglou T., de Steur L., Dodd P. A. (2023). Freshwater transport over the northeast Greenland shelf in fram strait. Geophys. Res. Lett. 50, e2022GL101775. doi: 10.1029/2022GL101775
Karpouzoglou T., de Steur L., Smedsrud L. H., Sumata H. (2022). Observed changes in the Arctic freshwater outflow in fram strait. J. Geophys. Res.: Ocean 127, e2021JC018122. doi: 10.1029/2021JC01812
Kenigson J. S., Timmermans M.-L. (2021). Arctic Cyclone activity and the Beaufort high. J. Climate 34 (10), 4119–4127. doi: 10.1175/JCLI-D-20-0771.1
Kirillov S., Dmitrenko I., Babb D., Rysgaard S., Barber D. (2015). The effect of ocean heat flux on seasonal ice growth in young sound (Northeast Greenland). J. Geophys. Res.: Oceans 120, 4803–4824. doi: 10.1002/2015JC010720
Kirillov S., Dmitrenko I., Rysgaard S., Babb D., Toudal Pedersen L., Ehn J., et al. (2017). Storm-induced water dynamics and thermohaline structure at the tidewater flade isblink glacier outlet to the wandel Sea (NE Greenland). Ocean Sci. 13, 947–959. doi: 10.5194/os-13-947-2017
Kirillov S., Dmitrenko I., Tremblay B., Gratton Y., Barber D., Rysgaard S. (2016). Upwelling of Atlantic water along the Canadian Beaufort Sea continental slope: favorable atmospheric conditions and seasonal and interannual variations. J. Climate 29, 4509–4523. doi: 10.1175/JCLI-D-15-0804.1
Krishfield R., Doherty K., Frye D., Hammar T., Kemp J., Peters D., et al. (2006). Design and operation of automated ice-tethered profilers for real-time seawater observations in the polar oceans (Woods Hole, Massachusetts, USA: Woods Hole Oceanographic Institution), 81. doi: 10.1575/1912/1170
Kwok R. (2006). Exchange of sea ice between the Arctic ocean and the Canadian Arctic archipelago. Geophys. Res. Lett. 33, L16501. doi: 10.1029/2006GL027094
Leblond P. H. (1980). On the surface circulation in some channels of the Canadian Arctic archipelago. Arctic 33 (1), 189–197. doi: 10.14430/arctic2554
Lewis E. L. (1980). The practical salinity scale 1978 and its antecedents. IEEE J. Ocean. Eng. OE-5 (1), 13–18. doi: 10.1109/JOE.1980.1145448
Lilien D., Hills B., Driscol J., Jacobel R., Christianson K. (2020). ImpDAR: an open-source impulse radar processor. Ann. Glaciol. 61 (81), 114–123. doi: 10.1017/aog.2020.44
Lin P., Pickart R. S., Stafford K. M., Moore G., Torres D. J., Bahr F., et al. (2016). Seasonal variation of the Beaufort shelfbreak jet and its relationship to Arctic cetacean occurrence. J. Geophys. Res.: Ocean 121 (12), 8434–8454. doi: 10.1002/2016JC011890
Lin P., Pickart R. S., Våge K., Li J. (2021). Fate of warm pacific water in the Arctic basin. Geophys. Res. Lett. 48 (20), e2021GL094693. doi: 10.1029/2021GL094693
Mayer C., Reeh N., Jung-Rothenhausler F., Huybrechts P., Oerter H. (2000). The subglacial cavity and implied dynamics under nioghalvfjerdsfjorden glacier, NE-Greenland. Geophys. Res. Lett. 27, 2289–2292. doi: 10.1029/2000GL011514
Melling H. (2002). Sea Ice of the northern Canadian Arctic archipelago. J. Geophys. Res.: Ocean 107 (C11), 3181. doi: 10.1029/2001JC001102
Melling H. (2022). Thickness of multi-year sea ice on the northern Canadian polar shelf: a second look after 40 years. Cryosphere 16, 3181–3197. doi: 10.5194/tc-16-3181-2022
Melling H., Agnew T. A., Falkner K. K., Greenberg D. A., Lee C. M., Münchow A., et al. (2008). “Fresh-water fluxes via pacific and Arctic outflows across the Canadian polar shelf,” in Arctic-Subarctic ocean fluxes: defining the role of the northern seas in climate. Eds. Dickson R. R., Meincke J., Rhines P. (Dordrecht: Springer), 193–247. doi: 10.1007/978-1-4020-6774-7_10
Melling H., Lake R. A., Topham D. R., Fissel D. B. (1984). Oceanic thermal structure in the western Canadian Arctic. Continental Shelf Res. 3 (3), 233–258. doi: 10.1016/0278-4343(84)90010-4
Mills M. M., Brown Z. W., Laney S. R., Ortega-Retuerta E., Lowry K. E., van Dijken G. L., et al. (2018). Nitrogen limitation of the summer phytoplankton and heterotrophic prokaryote communities in the chukchi Sea. Front. Mar. Sci. 5. doi: 10.3389/fmars.2018.00362
Müller F. (1962). Zonation in the accumulation area of the glaciers of Axel heiberg island, N.W.T., Canada. J. Glaciol. 4 (33), 302–311. doi: 10.3189/S0022143000027623
Münchow A. (2015). Volume and freshwater flux observations from nares strait to the West of Greenland at daily time scales from 2003 to 2009. J. Phys. Oceanogr. 46 (1), 141–157. doi: 10.1175/JPO-D-15-0093.1
Münchow A., Falkner K., Melling H. (2007). Spatial continuity of measured seawater and tracer fluxes through nares strait, a dynamically wide channel bordering the Canadian archipelago. J. Mar. Res. 65, 759–7788. doi: 10.1357/002224007784219048
Münchow A., Padman L., Washam P., Nicholls K. W. (2016). The ice shelf of petermann gletscher, north Greenland, and its connection to the Arctic and Atlantic oceans. Oceanogr 29 (4), 84–95. doi: 10.5670/oceanog.2016.101
NOAA Physical Sciences Laboratory (2022) Web-based reanalyses intercomparison tools (WRIT). Available at: https://www.psl.noaa.gov/data/writ/ (Accessed May 9, 2023).
Omelon C. R., Pollard W. H., Andersen D. T. (2006). A geochemical evaluation of perennial spring activity and associated mineral precipitates at expedition fjord, Axel heiberg island, Canadian high Arctic. Appl. Geochem. 21, 1–15. doi: 10.1016/j.apgeochem.2005.08.004
Paden J., Li J., Leuschen C., Rodriguez-Morales F., Hale R. (2010). Data from: IceBridge MCoRDS L2 ice thickness (Boulder, Colorado USA: NASA National Snow and Ice Data Center Distributed Active Archive Center). doi: 10.5067/GDQ0CUCVTE2Q
Pickart R. S., Moore G. W. K., Torres D. J., Fratantoni P. S., Goldsmith R. A., Yang J. (2009). Upwelling on the continental slope of the alaskan Beaufort Sea: storms, ice, and oceanographic response. J. Geophys. Res.: Ocean 114, C00A13. doi: 10.1029/2008JC005009
Polar Data Catalogue (2014) CTD data collected by the CCGS amundsen in the Canadian Arctic. Available at: www.polardata.ca/pdcsearch/PDCSearchDOI.jsp?doi_id=12713 (Accessed May 9, 2023).
Polyakov I., Walsh D., Dmitrenko I., Colony R. L., Timokhov L. A. (2003). Arctic Ocean variability derived from historical observations. Geophys. Res. Lett. 30 (6), 1298. doi: 10.1029/2002GL016441
Priergaard Zinck A. S., Grinsted A. (2022). Brief communication: estimating the ice thickness of the müller ice cap to support selection of a drill site. Cryosphere 16, 1399–1407. doi: 10.5194/tc-16-1399-2022
Prowse T., Bring A., Mård J., Carmack E. (2015). Arctic Freshwater synthesis: introduction. J. Geophys. Res.: Biogeosci. 120 (11), 2121–2131. doi: 10.1002/2015JG003127
Rabe B., Karcher M., Kauker F., Schauer U., Toole J. M., Krishfield R. A., et al. (2014). Arctic Ocean liquid freshwater storage trend 1992-2012. Geophys. Res. Lett. 41 (3), 961–968. doi: 10.1002/2013GL05812
Rabe B., Karcher M., Schauer U., Toole J. M., Krishfield R. A., Pisarev S., et al. (2011). An assessment of Arctic ocean freshwater content changes from the 1990s to the 2006–2008 period. Deep Sea Res. I 58 (2), 173–185. doi: 10.1016/j.dsr.2010.12.002
Rahmstorf S., Box J. E., Feulner G., Mann M. E., Robinson A., Rutherford S., et al. (2015). Exceptional twentieth-century slowdown in Atlantic ocean overturning circulation. Nat. Climate Change 5 (5), 475–480. doi: 10.1038/nclimate2554
Rignot E., Velicogna I., van den Broeke M. R., Monaghan A., Lenaerts J. (2011). Acceleration of the contribution of the Greenland and Antarctic ice sheets to sea level rise. Geophys. Res. Lett. 38, L05503. doi: 10.1029/2011GL046583
Rodell M., Famiglietti J. S., Wiese D. N., Reager J. T., Beaudoing H. K., Landerer F. W., et al. (2018). Emerging trends in global freshwater availability. Nature 557, 651–659. doi: 10.1038/s41586-018-0123-1
Rudels B. (2012). Arctic Ocean circulation and variability – advection and external forcing encounter constraints and local processes. Ocean Sci. 8, 261–286. doi: 10.5194/os-8-261-2012
Schulze L. M., Pickart R. S. (2012). Seasonal variation of upwelling in the alaskan Beaufort Sea: impact of sea ice cover. J. Geophys. Res.: Ocean 117, C06022. doi: 10.1029/2012JC007985
Seifert M., Hoppema M., Burau C., Elmer C., Friedrichs A., Geuer J. K., et al. (2019). Influence of glacial meltwater on summer biogeochemical cycles in scoresby sund, East Greenland. Front. Mar. Sci. 6. doi: 10.3389/fmars.2019.00412
Sentinel Hub (2022) Sentinelhub playground. Available at: https://apps.sentinel-hub.com/sentinel-playground/ (Accessed May 9, 2023).
Shimada K., Itoh M., Nishino S., McLaughlin F., Carmack E., Proshutinsky A. (2005). Halocline structure in the Canada basin of the Arctic ocean. Geophys. Res. Lett. 32, L03605. doi: 10.1029/2004GL021358
Shroyer E. L., Pickart R. S. (2019). Pathways, timing, and evolution of pacific winter water through Barrow canyon. Deep Sea Res. II 162, 5062. doi: 10.1016/j.dsr2.2018.05.004
Smith C. A., Compo G. P., Hooper D. K. (2014). Web-based reanalysis intercomparison tools (WRIT) for analysis and comparison of reanalyses and other datasets. Bull. Am. Meteorol. Soc 95 (11), 1671–1678. doi: 10.1175/BAMS-D-13-00192.1
Smith S., Dickinson S., Jelley B., Neumann T., Hancock D., Lee J., et al. (2022). Data from: ATLAS/ICESat-2 L3B slope-corrected land ice height time series (Boulder, Colorado USA: NASA National Snow and Ice Data Center Distributed Active Archive Center). doi: 10.5067/ATLAS/ATL11.005
Spall M. A., Pickart R. S., Fratantoni P. S., Plueddemann A. J. (2008). Western Arctic Shelfbreak eddies: formation and transport. J. Phys. Oceanogr. 38, 1644–1668. doi: 10.1175/2007JPO3829.1
Steele M., Morison J., Ermold W., Rigor I., Ortmeyer M. (2004). Circulation of summer pacific halocline water in the Arctic ocean. J. Geophys. Res.: Ocean 109, C02027. doi: 10.1029/2003JC002009
Stevens L. A., Straneo F., Das S. B., Plueddemann A. J., Kukulya A. L., Morlighem M. (2016). Linking glacially modified waters to catchment-scale subglacial discharge using autonomous underwater vehicle observations. Cryosphere 10, 417–432. doi: 10.5194/tc-10-417-2016
Studinger M. (2013). Data from: IceBridge ATM L1B elevation and return strength (Boulder, Colorado USA: NASA National Snow and Ice Data Center Distributed Active Archive Center). doi: 10.5067/19SIM5TXKPGT
Timmermans M.-L., Marshall J., Proshutinsky A., Scott J. (2017). Seasonally derived components of the Canada basin halocline. Geophys. Res. Lett. 44, 5008–5015. doi: 10.1002/2017GL073042
Toole J. M., Krishfield R. (2016) Woods hole oceanographic institution ice-tethered profiler program. ice-tethered profiler observations: vertical profiles of temperature, salinity, oxygen, and ocean velocity from an ice-tethered profiler buoy system. NOAA national centers for environmental information. Available at: https://www.ncei.noaa.gov/archive/accession/0181824 (Accessed May 15, 2023).
Toole J. M., Krishfield R. A., Timmermans M.-L., Proshutinsky A. (2011). The ice-tethered profiler: argo of the Arctic. Oceanography 24 (3), 126–135. doi: 10.5670/oceanog.2011.6
Van Wychen W., Burgess D. O., Gray L., Copland L., Sharp M., Dowdeswell J. A., et al. (2014). Glacier velocities and dynamic ice discharge from the queen Elizabeth islands, Nunavut, Canada. Geophys. Res. Lett. 41, 484–490. doi: 10.1002/2013GL058558
von Appen W.–J., Pickart R. S. (2012). Two configurations of the Western Arctic shelfbreak current in summer. J. Phys. Oceanogr. 42, 329–351. doi: 10.1175/JPO–D–11–026.1
Wang Q., Danilov S. (2022). A synthesis of the upper Arctic ocean circulation during 2000–2019: understanding the roles of wind forcing and Sea ice decline. Front. Mar. Sci. 9. doi: 10.3389/fmars.2022.863204
Wang Q., Myers P. G., Hu X., Bush A. B. G. (2012). Flow constraints on pathways through the Canadian Arctic archipelago. Atmosphere-Ocean 50 (3), 373–385. doi: 10.1080/07055900.2012.704348
Wekerle C., Wang Q., Danilov S., Jung T., Schröter J. (2013). The Canadian Arctic archipelago throughflow in a multiresolution global model: model assessment and the driving mechanism of interannual variability. J. Geophys. Res.: Oceans 118, 4525–4541. doi: 10.1002/jgrc.20330
Woodgate R. (2013). Arctic Ocean circulation: going around at the top of the world. Nat. Educ. Knowledge 4 (8), 8.
Keywords: Canadian Arctic Archipelago, Pacific-derived water, Atlantic water, ocean-glacier interaction, vertical mixing
Citation: Dmitrenko IA, Kirillov SA, Rudels B, Geilfus N-X, Ehn J, Babb DG, Lilien DA and Dahl-Jensen D (2023) Modification of Pacific water in the northern Canadian Arctic. Front. Mar. Sci. 10:1181800. doi: 10.3389/fmars.2023.1181800
Received: 07 March 2023; Accepted: 29 May 2023;
Published: 12 June 2023.
Edited by:
Qiang Wang, Alfred Wegener Institute Helmholtz Centre for Polar and Marine Research (AWI), GermanyReviewed by:
Birgit Rogalla, University of British Columbia, CanadaBenjamin Rabe, Alfred Wegener Institute Helmholtz Centre for Polar and Marine Research (AWI), Germany
Copyright © 2023 Dmitrenko, Kirillov, Rudels, Geilfus, Ehn, Babb, Lilien and Dahl-Jensen. This is an open-access article distributed under the terms of the Creative Commons Attribution License (CC BY). The use, distribution or reproduction in other forums is permitted, provided the original author(s) and the copyright owner(s) are credited and that the original publication in this journal is cited, in accordance with accepted academic practice. No use, distribution or reproduction is permitted which does not comply with these terms.
*Correspondence: Igor A. Dmitrenko, aWdvci5kbWl0cmVua29AdW1hbml0b2JhLmNh