
94% of researchers rate our articles as excellent or good
Learn more about the work of our research integrity team to safeguard the quality of each article we publish.
Find out more
ORIGINAL RESEARCH article
Front. Mar. Sci., 19 June 2023
Sec. Marine Biology
Volume 10 - 2023 | https://doi.org/10.3389/fmars.2023.1176829
This article is part of the Research TopicOcean-Biota System: Integrated Approach to Climate Change Impacts on Plankton Communities in Coastal and Pelagic EnvironmentsView all 8 articles
 Elisa Camatti1*
 Francesco Acri1
 Amelia De Lazzari1
 Nicola Nurra1,2
 Marco Pansera3
 Anna Schroeder4Alessandro Bergamasco1
The Venice Lagoon is an important site belonging to the Italian Long-Term Ecological Research Network (LTER). Alongside with the increasing trend of water temperature and the relevant morphological changes, in recent years, the resident zooplankton populations have also continued to cope with the colonization by alien species, particularly the strong competitor Mnemiopsis leidyi. In this work, we compared the dynamics of the lagoon zooplankton over a period of 20 years. The physical and biological signals are analyzed and compared to evaluate the hypothesis that a slow shift in the environmental balance of the site, such as temperature increase, sea level rise (hereafter called “marinization”), and competition between species, is contributing to trigger a drift in the internal equilibrium of the resident core zooplankton. Though the copepod community does not seem to have changed its state, some important modifications of structure and assembly mechanisms have already been observed. The extension of the marine influence within the lagoon has compressed the spatial gradients of the habitat and created a greater segregation of the niches available to some typically estuarine taxa and broadened and strengthened the interactions between marine species.
The Mediterranean Sea has been identified as a “hotspot” for climate change (IPCC, 2007), with a sea level rise in the order of 2.5 mm/year already experienced in the last century (Vecchio et al., 2019) and predictions of an increase of water temperature of 2–4°C over the next few decades (Šolić et al., 2017).
In the last 150 years, aquatic organisms, including zooplankton, have faced an increase in greenhouse gasses, marine heat content, heat waves, chemical pollution, physical alterations, ocean acidification, and ocean deoxygenation due to human activities and last but not least an increase in non-indigenous species (NIS). In the Mediterranean basin, these phenomena are amplified with extensive impacts on marine ecosystems and human society (Schroeder et al., 2017; Martínez-Megías and Rico, 2022). The response of the Mediterranean basin ecosystems to these changes ranges from the ecosystem level to the community structure, from the modification of phenotypic expression to modifications of gene expression or adaptation (Aurelle et al., 2022).
The Venice Lagoon (Figure 1), among the widest transitional areas in the Mediterranean, is one of the Italian marine and coastal sites most affected by anthropogenic pressures. It is part of the Italian Long-Term Ecological Research Network (LTER-http://www.lteritalia.it). Transitional environments are characterized by greater dynamism compared to open sea (Ferrarin et al., 2013) and by a heterogeneous mosaic of microhabitats (Tagliapietra et al., 2009). Furthermore, the superimposition of other events, such as recurrent phenomena of eutrophication (Sfriso et al., 2019), pollution (Alberotanza et al., 1991; Ravera, 2000), the recent arrival of NIS Mnemiopsis leidyi (Malej et al., 2017), and engineering interventions to protect the ancient city against floodings that interfere with the morphology and hydrodynamics of the basins (Umgiesser, 2020), can mask the source of stress on the ecosystem at every level of hierarchical organization. Therefore, a careful evaluation of species phenotypic plasticity and structural adaptation of communities to selective pressures is fundamental to correctly interpret and explain the resulting ecosystem evolutionary pattern.
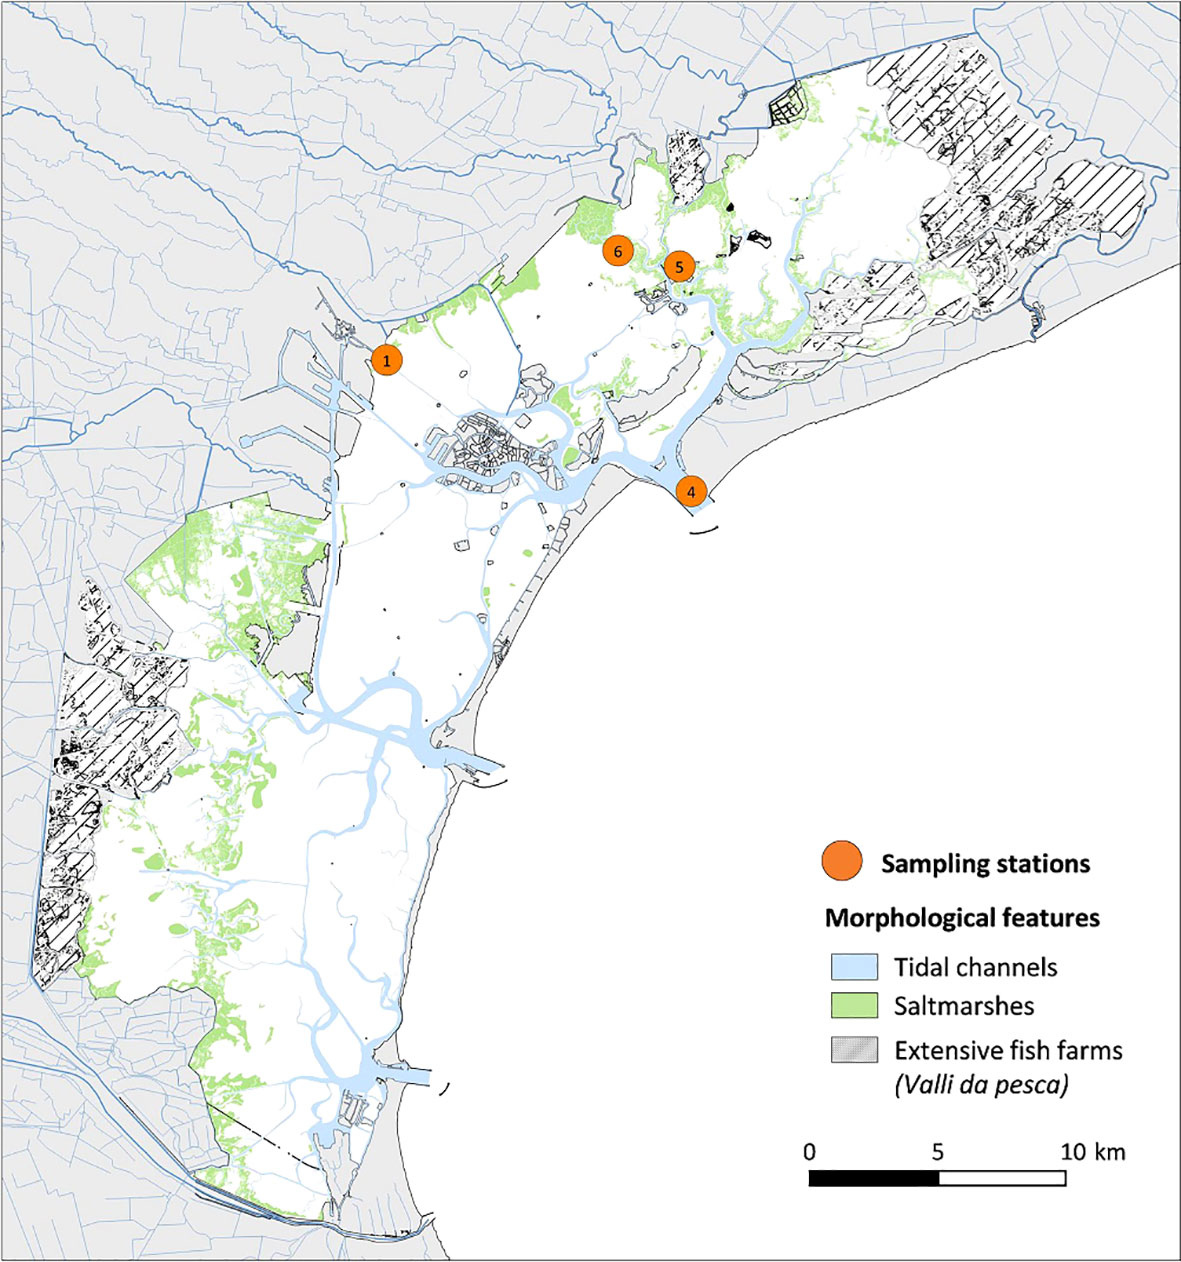
Figure 1 Study area and sampling stations (part of the LTER Network).
In aquatic systems, zooplankton dominate the pelagic food webs linking the primary producers to the upper trophic levels and playing an important role in biogeochemical cycles (Dam et al., 1995; Buitenhuis et al., 2006). For that, any important modification in terms of zooplankton abundance, taxonomic composition, and dimensional structure can alter the food web connectivity, the efficiency of trophic transfer, and its own contribution in terms of ecosystem services (sensu Costanza et al., 1997).
Introduced by an early work of Magurran and Henderson (2003), the partitioning of the species abundance distribution in core and occasional/satellite taxa is a powerful method often applied to the study of biodiversity patterns (Helden, 2021 and references therein) to investigate deterministic vs. stochastic assembly processes and to evaluate the reaction to human impact and community-level response to climate change (Henderson et al., 2011).
Co-occurrence networks that synthetically map the interrelationships between species in a community have proved to be a practical tool available for studying the assembly mechanisms and functioning of microbial communities in different ecosystems (e.g., Lindh et al., 2017; Yan et al., 2021 and references therein) using molecular approaches. Furthermore, network analysis and related metrics can be used to inform on system stability and resilience by using a well-developed mathematical frame (Oehlers and Fabian, 2021). In transitional ecosystems, network analysis has been successfully used to study the role of abiotic forcing factors on plankton food webs (Trombetta et al., 2020; Trombetta et al., 2021) and to study the effect of habitat heterogeneity on the planktonic protist community (Armeli et al., 2019). However, to our knowledge, the approach has not yet been tested on estuarine metazoan (e.g., copepods), especially using only taxonomic data. In addition, although the Venice Lagoon has been extensively studied both from the climatological point of view (Makris et al., 2023; Sambo et al., 2023) and from that of the impacts on ecosystems and resident biological communities (Solidoro et al., 2010; Picone et al., 2023; Milan et al., 2023; Zennaro et al., 2023), very few studies on zooplankton communities have been performed (Camatti et al., 2019; Pansera et al., 2021).
In this paper, we focus on understanding if and how the drift in the habitat conditions of the Venice Lagoon are recorded as changes in the structure of the zooplankton community, in particular of the copepods as the dominant component. To do this, an integrated dataset including abundances, taxonomy, and species co-occurrences has been combined using the network analysis approach aimed to describe the community reaction to the drifts imposed by the habitat. In particular, we want to examine how these drifts are recorded by the changes of the structure and coexistence relationships of copepod species. The zooplankton long-term variability was compared to selected environmental variables through two snapshots 20 years apart, from 1998 to the present day. Physical and biological data were analyzed and compared to evaluate the hypothesis that a slow shift in the environmental stressors (such as the rising temperatures or salinity) can contribute to trigger a drift in the internal equilibrium of the resident core zooplankton communities. This study represents the first application of statistical modeling methods to the zooplankton of the Venice Lagoon in a long-term perspective.
The Venice Lagoon is one of the largest systems of transitional waters in the Mediterranean Sea, and it is part of the Italian Long-Term Ecological Research Network (LTER-Italy, www.lteritalia.it). It is a shallow coastal water body (average depth 1.5 m) with an area of approximately 550 km2 and connected to the Adriatic Sea through three inlets allowing water and sediment exchange with the sea, named Lido, Malamocco, and Chioggia (Figure 1). The Venice Lagoon is a heterogeneous and complex system, characterized by different physical and environmental gradients, and a mosaic of landforms and habitats that are the result of natural and man-induced drivers. Its general circulation results from the superposition of tide, wind, and topographic control (Solidoro et al., 2004; Gačić et al., 2005). The effective renewal rate of water is about a few days for the areas closest to the inlets and up to a month for the innermost areas (Cucco and Umgisser, 2006). The lagoon is affected by several anthropogenic pressures like fisheries, mariculture, domestic and industrial discharges, maritime transport, and tourist activities (Solidoro et al., 2010).
The sites chosen for this study represent a gradient of environmental conditions and different anthropogenic impacts in the lagoon. Station ST1 (S. Giuliano) is affected by urban discharges and characterized by high water residence times of 18–25 days. The inlet station ST4 (Lido), located in the northernmost inlet of the lagoon, is influenced by Adriatic coastal waters with a residence time of few hours, and finally, ST5 (Palude della Rosa) is a typical lagoon environment influenced both by freshwater and by seawater inputs and characterized by a residence time of 6–12 days.
The zooplankton in the Venice Lagoon is mostly (80%) composed by Copepoda (with Acartia as the most abundant genus) and approximately 10% Chordata (Appendicularia, Ascidiacea larvae, and Actinopterygii larvae or eggs), followed by Echinodermata and Mollusca larvae (Camatti et al., 2006; Schroeder et al., 2020); in the hot season and in areas close to the inlets, the presence of Cladocera is relevant (Pansera et al., 2021). The community shows in general a clear seasonality in the populations’ composition and taxonomic diversity, indicating that water temperature is the most prominent environmental factor shaping the zooplankton assemblages. Since, in this ecosystem, the availability of food is not generally a limiting factor, the second emerging element conditioning and regulating the distribution of the various zooplankton taxa is the salinity and the relative gradient that is encountered from the port mouth to the internal lagoon areas (Bandelj et al., 2008).
The dataset used in this work covers a temporal space of almost 50 years, from 1975 to 2021, originating from different research projects on hydrochemical and plankton distributions in the Venice Lagoon. Data on the zooplankton have been available sporadically since the 1970s and regularly gathered only since the late 1990s. From 2006, long-term zooplankton sampling was conducted in the framework of the LTER monitoring activities, which, from that date, coordinates the activities of five stations located in the central and the northern part of the Venice Lagoon (Figure 1) representative of a gradient of environmental conditions and different anthropogenic impacts in the lagoon. In this work, however, only three stations have been considered, selected on the basis of their environmental and geographical characteristics according to the objectives of this study. Station ST1 (2 m depth) is affected by urban discharges and characterized by high water residence times of 18–25 days. The inlet station ST4 (11.2 m depth), located in the northernmost inlet of the lagoon, is influenced by Adriatic coastal waters with a residence time of a few hours, and, finally, ST5 (2.4 m depth) is a typical lagoon environment influenced both by freshwater and by seawater inputs and characterized by a residence time of 6–12 days.
To the objectives of the present work, two subsets of data were extracted from the Venice Lagoon LTER database; they can be considered homogeneous as for the type and frequency of sampling, and taxonomic and spatial coverage homogeneity. The two frames are 20 years apart, and each of them is 3 years long: given the available dataset, it was considered that this combination optimizes the possibility to evaluate the response signal of the zooplankton community to slow-varying monotonic habitat changes, without losing so much definition in describing its short-time seasonal variability.
Period 1 (P1): from November 1998 to December 2001; 38 monthly samples at three stations in the northern and central part of the lagoon (Figure 1; Bianchi et al., 2000; Comaschi et al., 2000; Bianchi et al., 2003)
Period 2 (P2): from November 2018 to December 2021; 38 monthly samples at the same three stations of the previous period (new data).
These snapshot zooplankton data of the two periods are framed in a long-term context relating to the physical/environmental data suitable for describing the variations of the lagoon habitat. For this purpose, the monthly time series of the last 25 years collected in the LTER field are analyzed.
Where feasible and functional to the reasoning, these two periods were put in comparison with a previous dataset, dating back to approximately 50 years ago:
Period 0 (P0): Two sampling campaigns were carried out from May 1975 to July 1976 and from June 1977 to June 1978 in three stations located in the northern lagoon area (Acri et al., 2004). For our study, we used data from two of these and monthly averages were produced [56 samples: 28 at Lido (ST4) and 28 at Dese (ST6), see Figure 1] for zooplankton and physicochemical data (T, S, oxygen only). This dataset was mainly used for comparisons (Temperature and Salinity) with the recent epoch.
All datasets are homogeneous by type of groupings in main zooplankton taxa (Copepods, Cladocerans, and other), by species list, and by environmental parameters considered (temperature, salinity, turbidity, and chlorophyll a).
At each site, a multiparametric CTD probe (Idronaut 801 until 2002, and after with CTD SBE 19plus SeaCAT) was used to measure the following environmental parameters: temperature, salinity, dissolved oxygen, and fluorescence (Grasshoff and Ehrhardt, 1976; Hansen and Koroleff, 1999). The water transparency was measured with the Secchi disk. In the three different periods, the sampling to investigate the horizontal spatial distribution of the mesozooplankton in the Venice Lagoon was conducted using two different nets with the same mesh size (200 μm). In Period 0 (1975–1978), the horizontal zooplankton sampling was collected by the Clarke–Bumpus quantitative sampler, while in Period 1 (1998–2001) and Period 2 (2018–2021), sampling was collected by an Apstein standard net (diameter 0.4 m), equipped with a flowmeter (HydroBios) to measure the volume of water filtered, which ranged from 7 to 50 m3. All samples were collected at the surface (0.5 m depth) for a time of approximately 5 min at a vessel cruising of 1 knot. The presence of the ctenophore M. leidyi in the net sampling was recorded on board. Samples were preserved in formaldehyde (4% final concentration). In the laboratory, the organisms were subsampled using a Folsom Plankton Splitter and at least two subsamples were counted completely and identified, according to the International Council for the Exploration of the Sea (ICES) protocol to species level, where possible, or to higher taxonomic levels, and the abundance of each taxon was presented as ind. m−3 (Boltovskoy, 1981).
Hourly tidal levels measured at Punta Salute were treated to build a time series of mean yearly averaged sea-level anomalies in the period 1997–2021. To test for possible abrupt changes, a sequential t-test of regime shift was performed in accordance with Rodionov (2004).
Monthly LTER time series at the stations ST1, ST5, and ST4 were decomposed with the R package “xts” to filter out the seasonal component and define the long-term trends. According to IPCC (2013), anomalies were calculated as the difference between any (deseasoned) monthly value and the overall mean of the series. Change point presence and extreme value statistics were studied with the R packages “ecp” and “extRemes”. The CuSum test from the R package “CPAT” has been used to verify the changes in mean.
Significant differences between the two periods P1 and P2 in the environmental parameters were identified using the Kruskal–Wallis test.
Beta-diversity of the zooplankton was calculated from dissimilarity matrices built according to Bray–Curtis distances using the metaMDS script with the autotransform function (R package vegan, Oksanen et al., 2020) and plotted as NMDS plots by the sampling station.
The data regarding the presence on M. leidyi that were collected during the period of 2016 to 2021 at the five LTER stations (LTER-Italy, www.lteritalia.it) showed a certain heterogeneity in its type as either the biovolume or the abundance counts were registered. Therefore, the data were first categorized as follows: “low” presence: BV ≤5 ml/m3; abundance ≤0.5 ind. m−3; “medium” abundance: BV >5 ≤ 20 ml/m3; abundance 0 > 0.5 ≤ 1 ind. m−3; “high” abundance: BV >20 ml/m3; abundance >1 ind. m−3. In order to calculate mean seasonal mean values (period 2016–2021) the categories were converted back as follows: “absent”: 0; “low”: 1; “medium”: 2; “high”: 3.
Indicator species analysis (IndVal) has been used to identify species indicative of given groups of samples and express their importance (Dufrene and Legendre, 1997; Podani and Csányi, 2010). The index is the product of two components that describe respectively the “specificity” of a species as an indicator of a certain group of samples and the “fidelity” of a species in terms of high probability of presence in a sample belonging to a certain group (De Cáceres et al., 2010). The function multipatt of the R package “indicspecies” has been used.
To study the networks implemented by the copepod assemblage in the two periods, we built the co-occurrence matrix of species. To reduce noise and complexity, without losing too much in describing the network detail, we considered only the species that appeared in at least five samples in each period. Spearman’s rank coefficients (r) between species were calculated pairwise using the R package “Hmisc” and only significant positive co-occurrences (with p < 0.05 and r > 0.1) were considered by following the approach described in Yan et al. (2021). The R package “igraph” was used to calculate node attributes and study the topological features of the networks through several metrics based on the adjacency matrix spectrum and eigenvalues of the Laplacian of the graph. In particular, centrality metrics on node topology such as degree, transitivity, closeness, and betweenness were considered to evaluate the keystoneness of the species within the copepod community whereas algebraic and natural connectivity metrics were considered to have insights into the global topological and structural robustness of the network.
Multilevel modularity optimization algorithm was used to find the sub-community structure, define modules, and assign the membership to each species (Blondel et al., 2008). Gephi software was used to visualize the networks (Bastian et al., 2009).
The following section describes the long-term drift (of temperature, sea level, and salinity) providing the environmental context over the past 25 years (using the monthly time series; 300 months, continuous).
Focusing on the sea-level time series recorded from 1997 to 2021 at Punta Salute station in the City of Venice, using data derived from Centro Previsioni e Segnalazioni Maree of the Venice Municipality (https://www.comune.venezia.it/node/6214), the overall average of hourly levels in the last 25 years was +30 cm. Yearly anomalies were always negative (ave −3.6 cm) from 1997 to 2008, while they exhibited generally positive values (ave +3.5 cm) from 2009 to 2021 (Figure 2, bars). According to Rodionov, an evident regime shift (RSI = 0.77) can be detected in the time series of mean yearly anomalies in 2009 and an increase of more than +7 cm is observed between the average level in 2021 with respect to 1997, corresponding to an average rising rate of 2.8 mm/year. Hence, we can expect an increase in the volume of water stored within the lagoon of approximately 5% in P2 (2018–2021) compared to P1 (1998–2001).
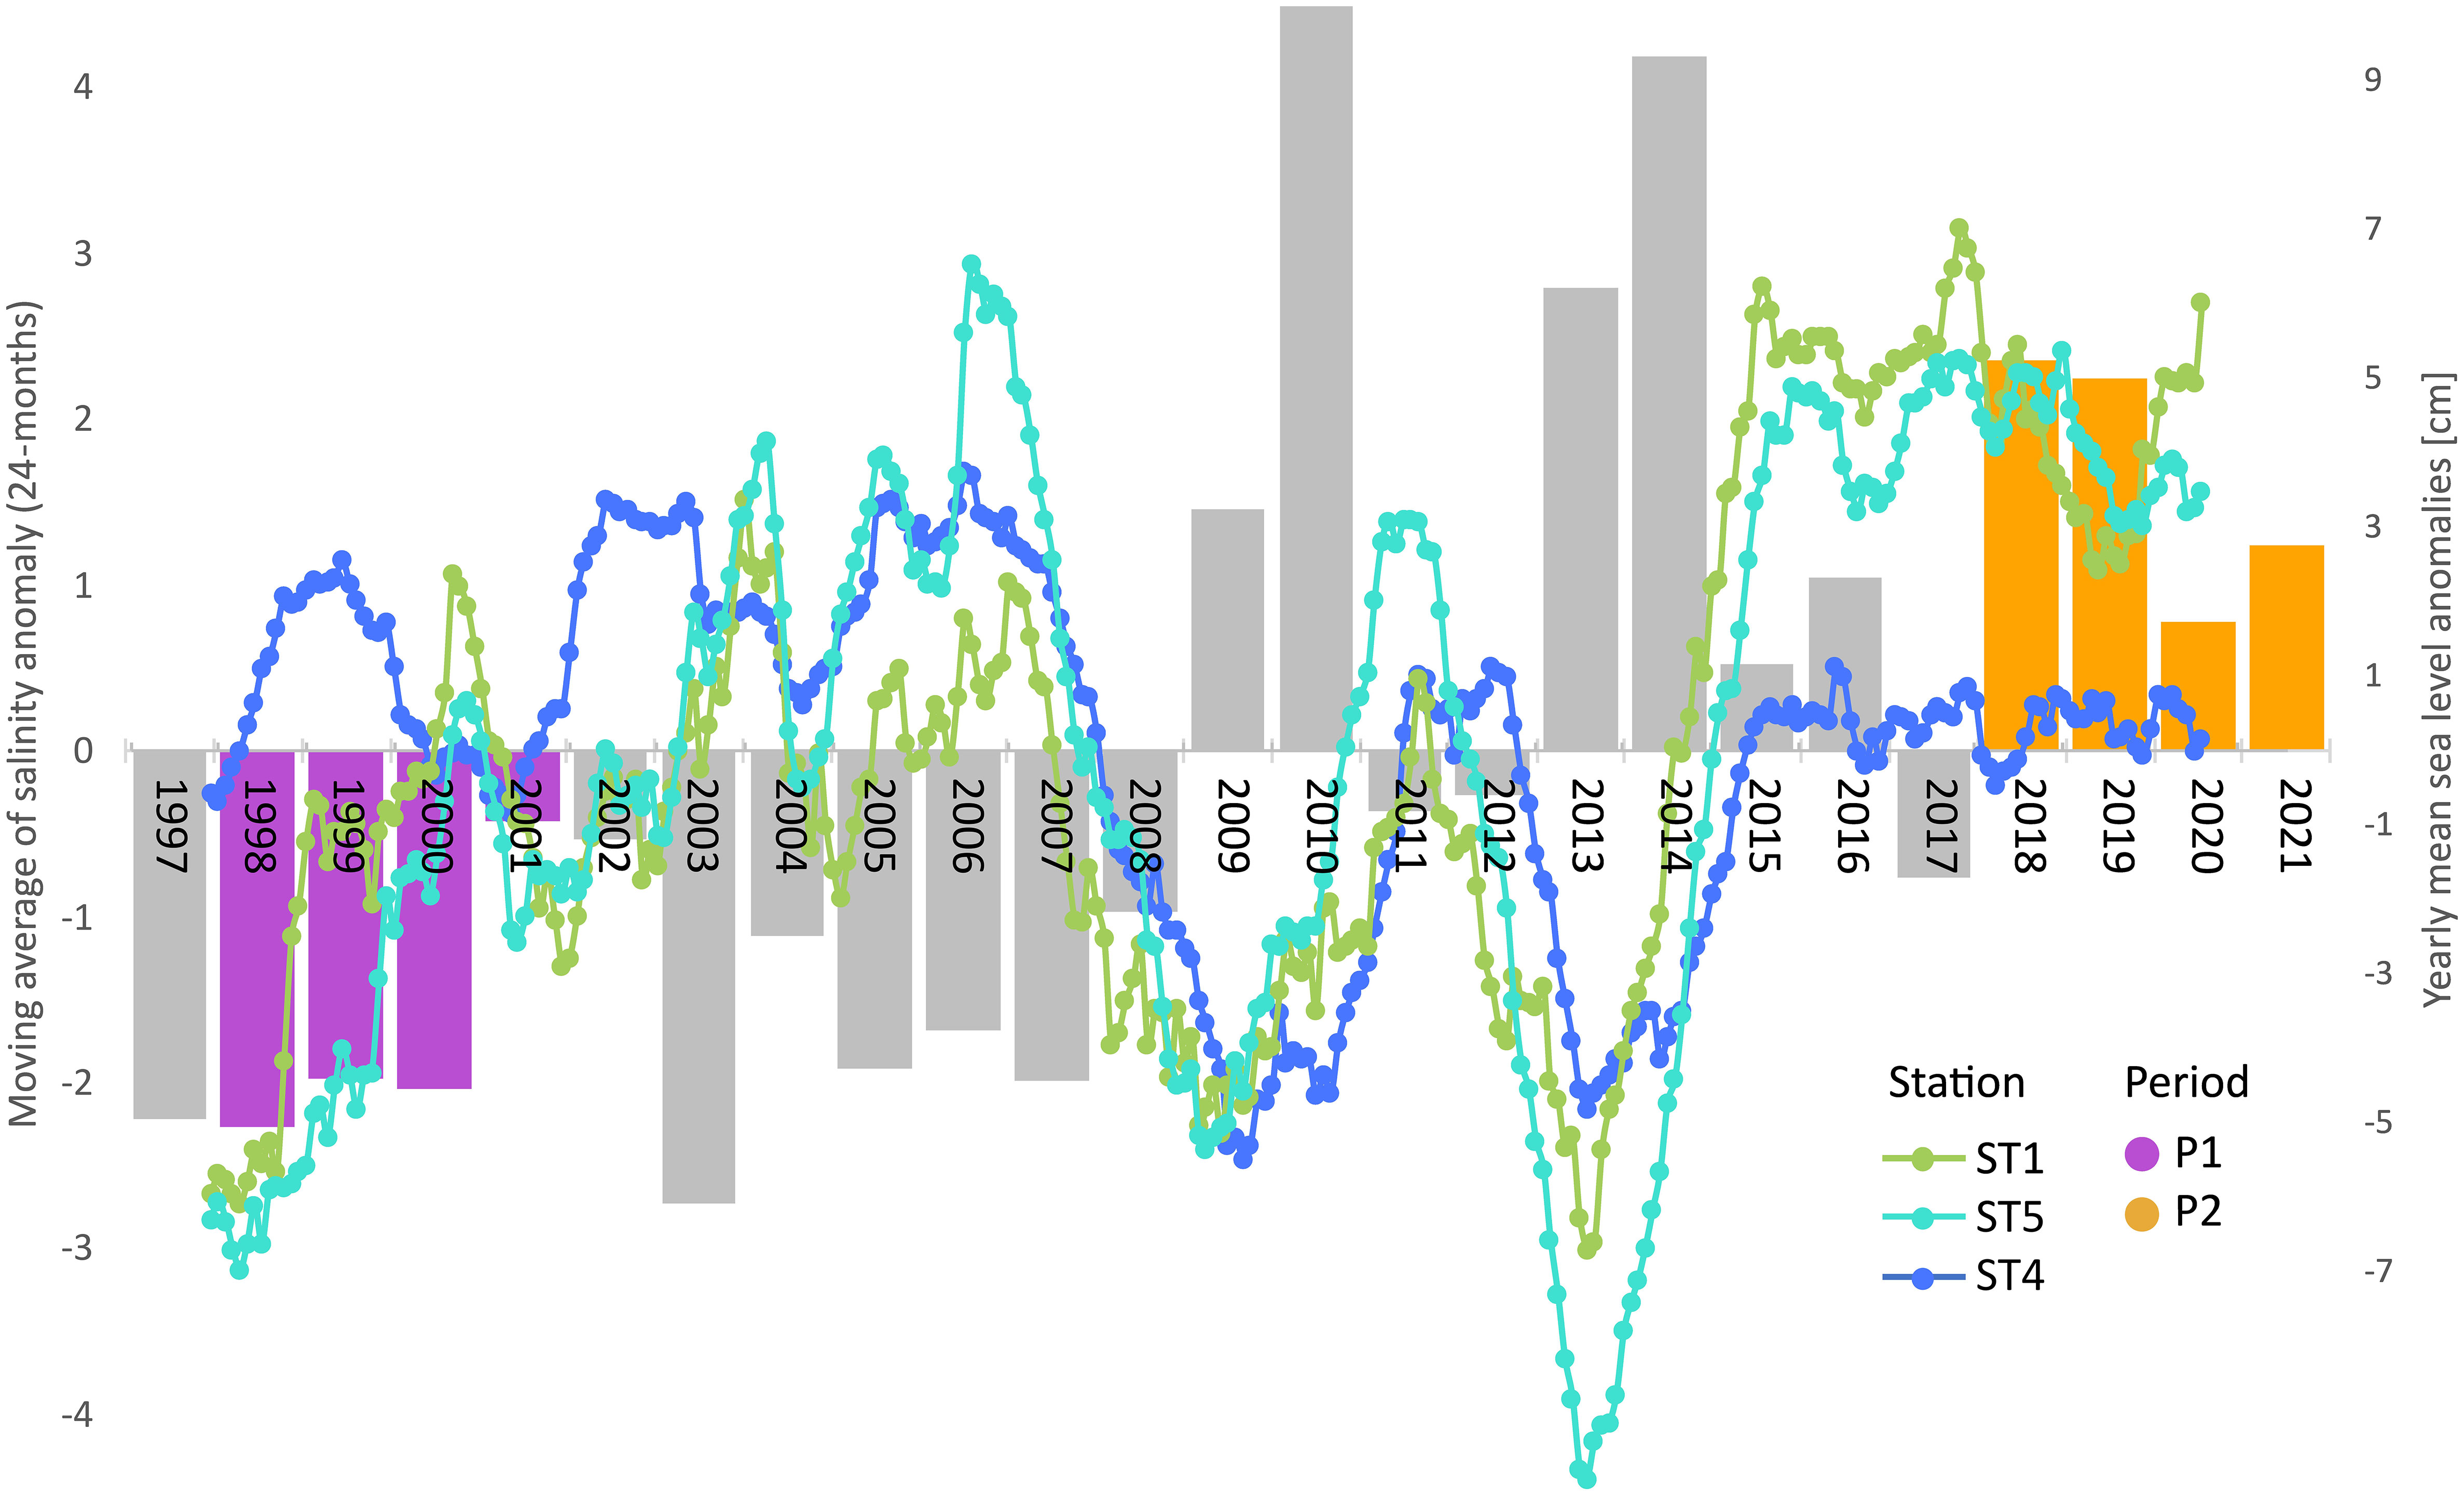
Figure 2 Sea level and salinity drift over the past 25 years. Bars represent the yearly averaged sea level anomalies at Punta Salute from 1997 to 2021. P1 and P2 periods are highlighted in violet and orange, respectively. Superimposed lines show the monthly salinity anomalies (smoothed trend by 24-month moving average) at ST1, ST4, and ST5.
Since freshwater inputs from the mainland have remained at best unchanged, if not even reduced, this excess volume is likely of marine origin, thus inducing a slow shift towards higher salinity within the lagoon. Such a progressive trend is well caught by the significant increase of salinity anomalies in the 25-year LTER monthly time series at the internal stations (Mann–Kendall, p < 0.001; Sen’s slopes: +0.9 and +1.5 units per decade at stations 5 and 1, respectively), while no clear drift is observed at the inlet station 4 (Figure 2).
The increasing trend of seawater temperature anomalies highlighted by the 2-year moving average is highly significant (Mann–Kendall, p < 0.001) at the lagoon–sea interface (ST4, red line in Figure 3A), where the overall 25-year average is 16.89°C and within the lagoon as confirmed by the 25-year LTER monthly time series at the internal stations (not shown). The estimated Sen’s slope is of 0.96°C per decade (range 0.52–1.35; 99% confidence). No change points in the monthly time series are present (CuSum test, p = 0.1) whereas the time series of yearly maxima exhibits a significantly increasing trend (Mann–Kendall, p < 0.01). Extreme value statistics allowed us to describe, as a Weibull curve, the stochastic behavior of the summer yearly maxima in the 25-year warming process at station 4 whose tail fits a generalized Pareto distribution (σ = 1.30, ξ = −0.24, μ = 26.35°C) with an upper limit of 31.8°C. The maximum already observed extreme was 29.8°C in 2014, which is in agreement with the estimated 50-year return level (Figure 3B). The estimated 100-year return level is 29.95°C (range 28.42–31.47°C; 95% confidence). Using the collected monthly temperature data, a yearly climatology can be fitted (loess interpolation) in the different periods at station 4 and interesting comparisons among them and a reference past condition (P0: years 1975–1978) are highlighted (Figure 3C). During the five decades, summer maxima rose and was anticipated from 23.2°C (20–30 July) in the 1970s to 25.5°C in P1 and 27.4°C in P2 (15–25 July). Relevant differences can be noted during the spring heating, with P1 and P2 trends strictly tracking each other and autumn cooling, with a prolonged permanence of warmer values in recent years. To better highlight the increasing extent of the long-term warming process and the consequent change in the habitat filtering effect exerted on the plankton community, we compared the estimated persistence (in days) over a defined threshold in the three considered periods (Figure 3D). For example, while the water temperature persisted above 22°C for approximately 2 months every year in the 1970s (P0) and for over 3 months (P1) around the 2000s, nowadays (P2), it persists for approximately 4 months; i.e., it has doubled in 50 years.
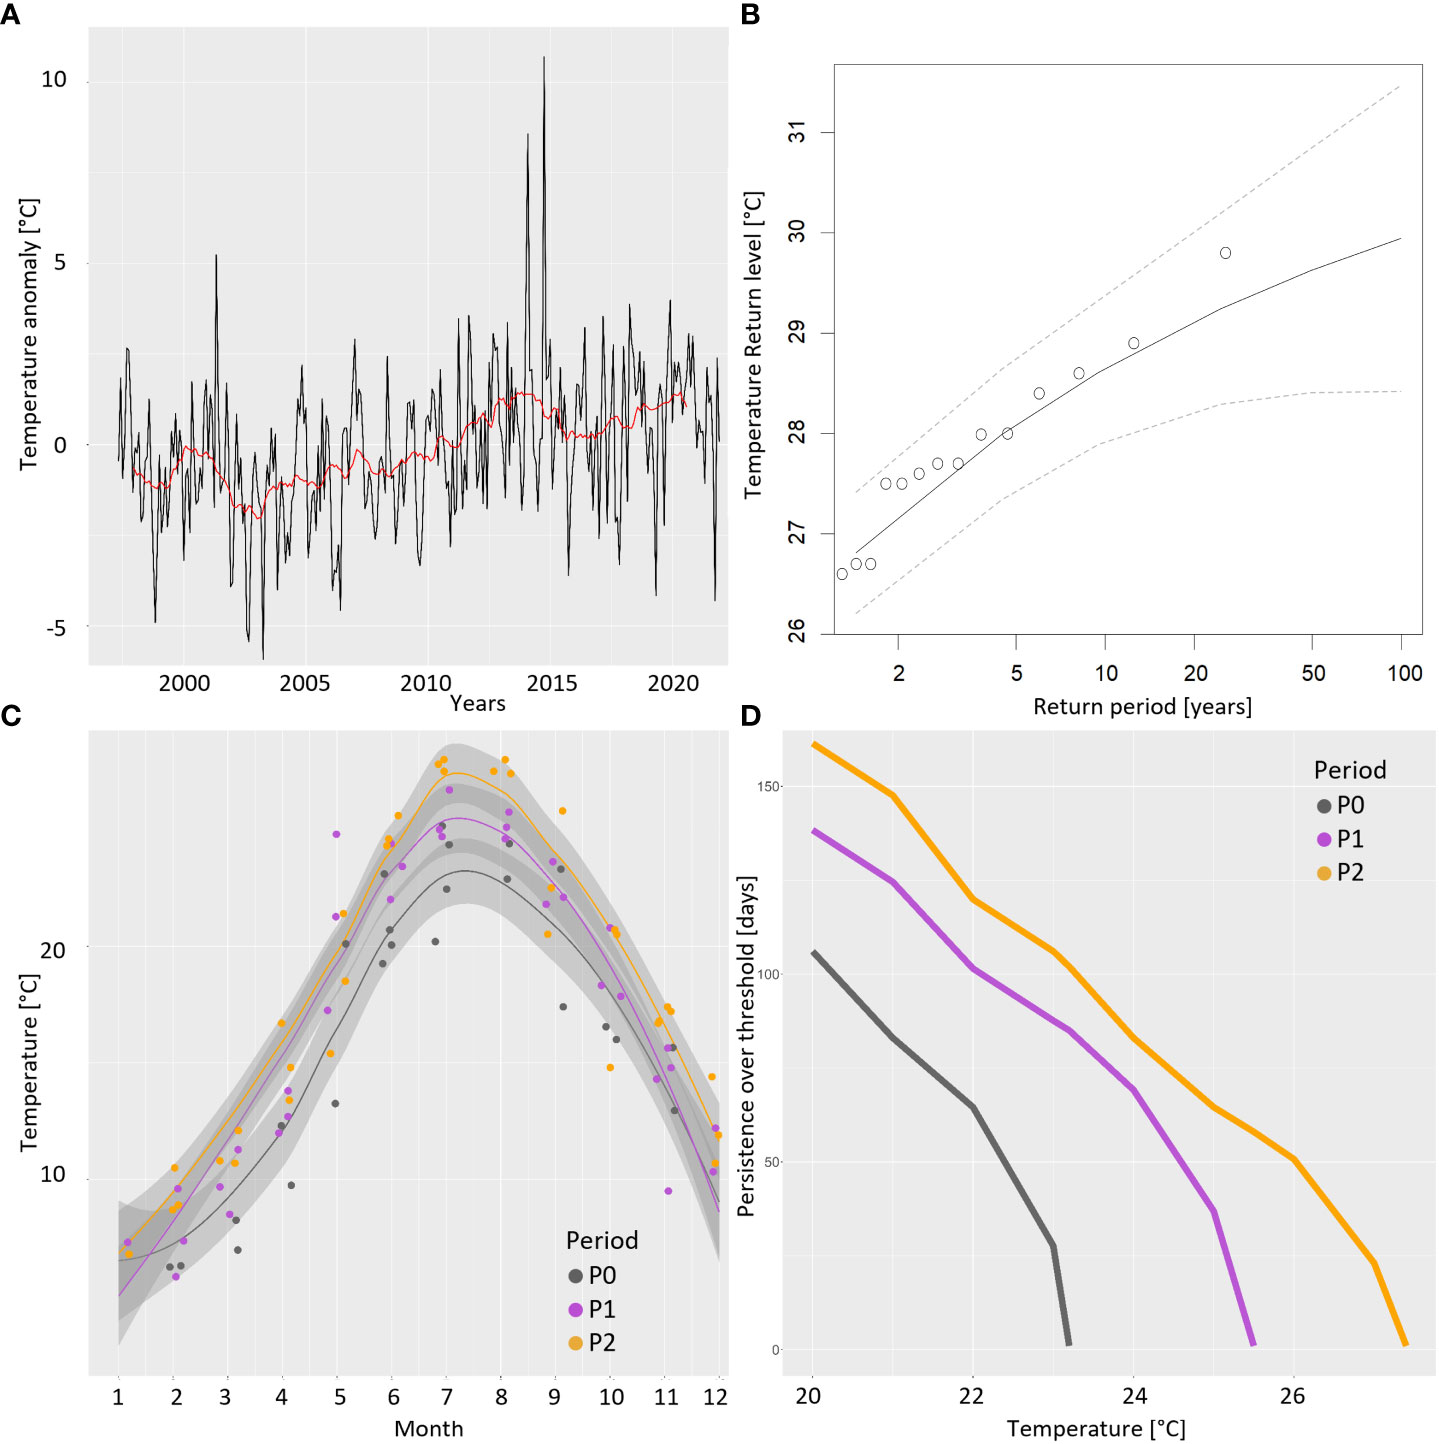
Figure 3 Temperature drift at the lagoon–sea interface (ST4). (A) Rising trend of monthly temperature anomalies from 1997 to 2021 (red line: 24-month moving average). (B) Estimated return levels of extreme values (yearly maxima of temperature). (C) Comparison of the yearly trends of temperature (obtained by loess interpolation on the corresponding months in each period) during P0 (1975–1978), P1 (1998–2001), and P2 (2018–2021). (D) Estimated persistence of water temperature (number of days per year) over a defined threshold in the three considered periods.
This section compares the two time frames P1 and P2 in terms of relevant environmental parameters and zooplankton (38 months continuous each, 20 years apart).
The temperature showed a general increasing trend from P1 to P2 [mean 15.7°C and 17.3°C (SD 7.6 and 7.4), respectively]. This was especially evident during summer, where, in fact, the temperature was significantly higher in P2 compared to P1, both at stations ST4 and ST5 (Figure 4). The same upward trend over the years has emerged for the lagoon salinity values, i.e., in the two lagoon stations ST1 and ST5, with significant higher salinity values in P2 compared to P1 during summer and ST5 during winter (mean summer values: ST1 = P1: 23.6 ± 2.0, P2: 26.5 ± 3.5; ST5 = P1: 27.6 ± 2.6, P2: 30.6 ± 1.7; ST4 = P1: 34.2 ± 1.27, P2: 33.3 ± 1.3). A clear salinity gradient is evident from station ST1 to ST5 and ST4 (Figures 4, 5).
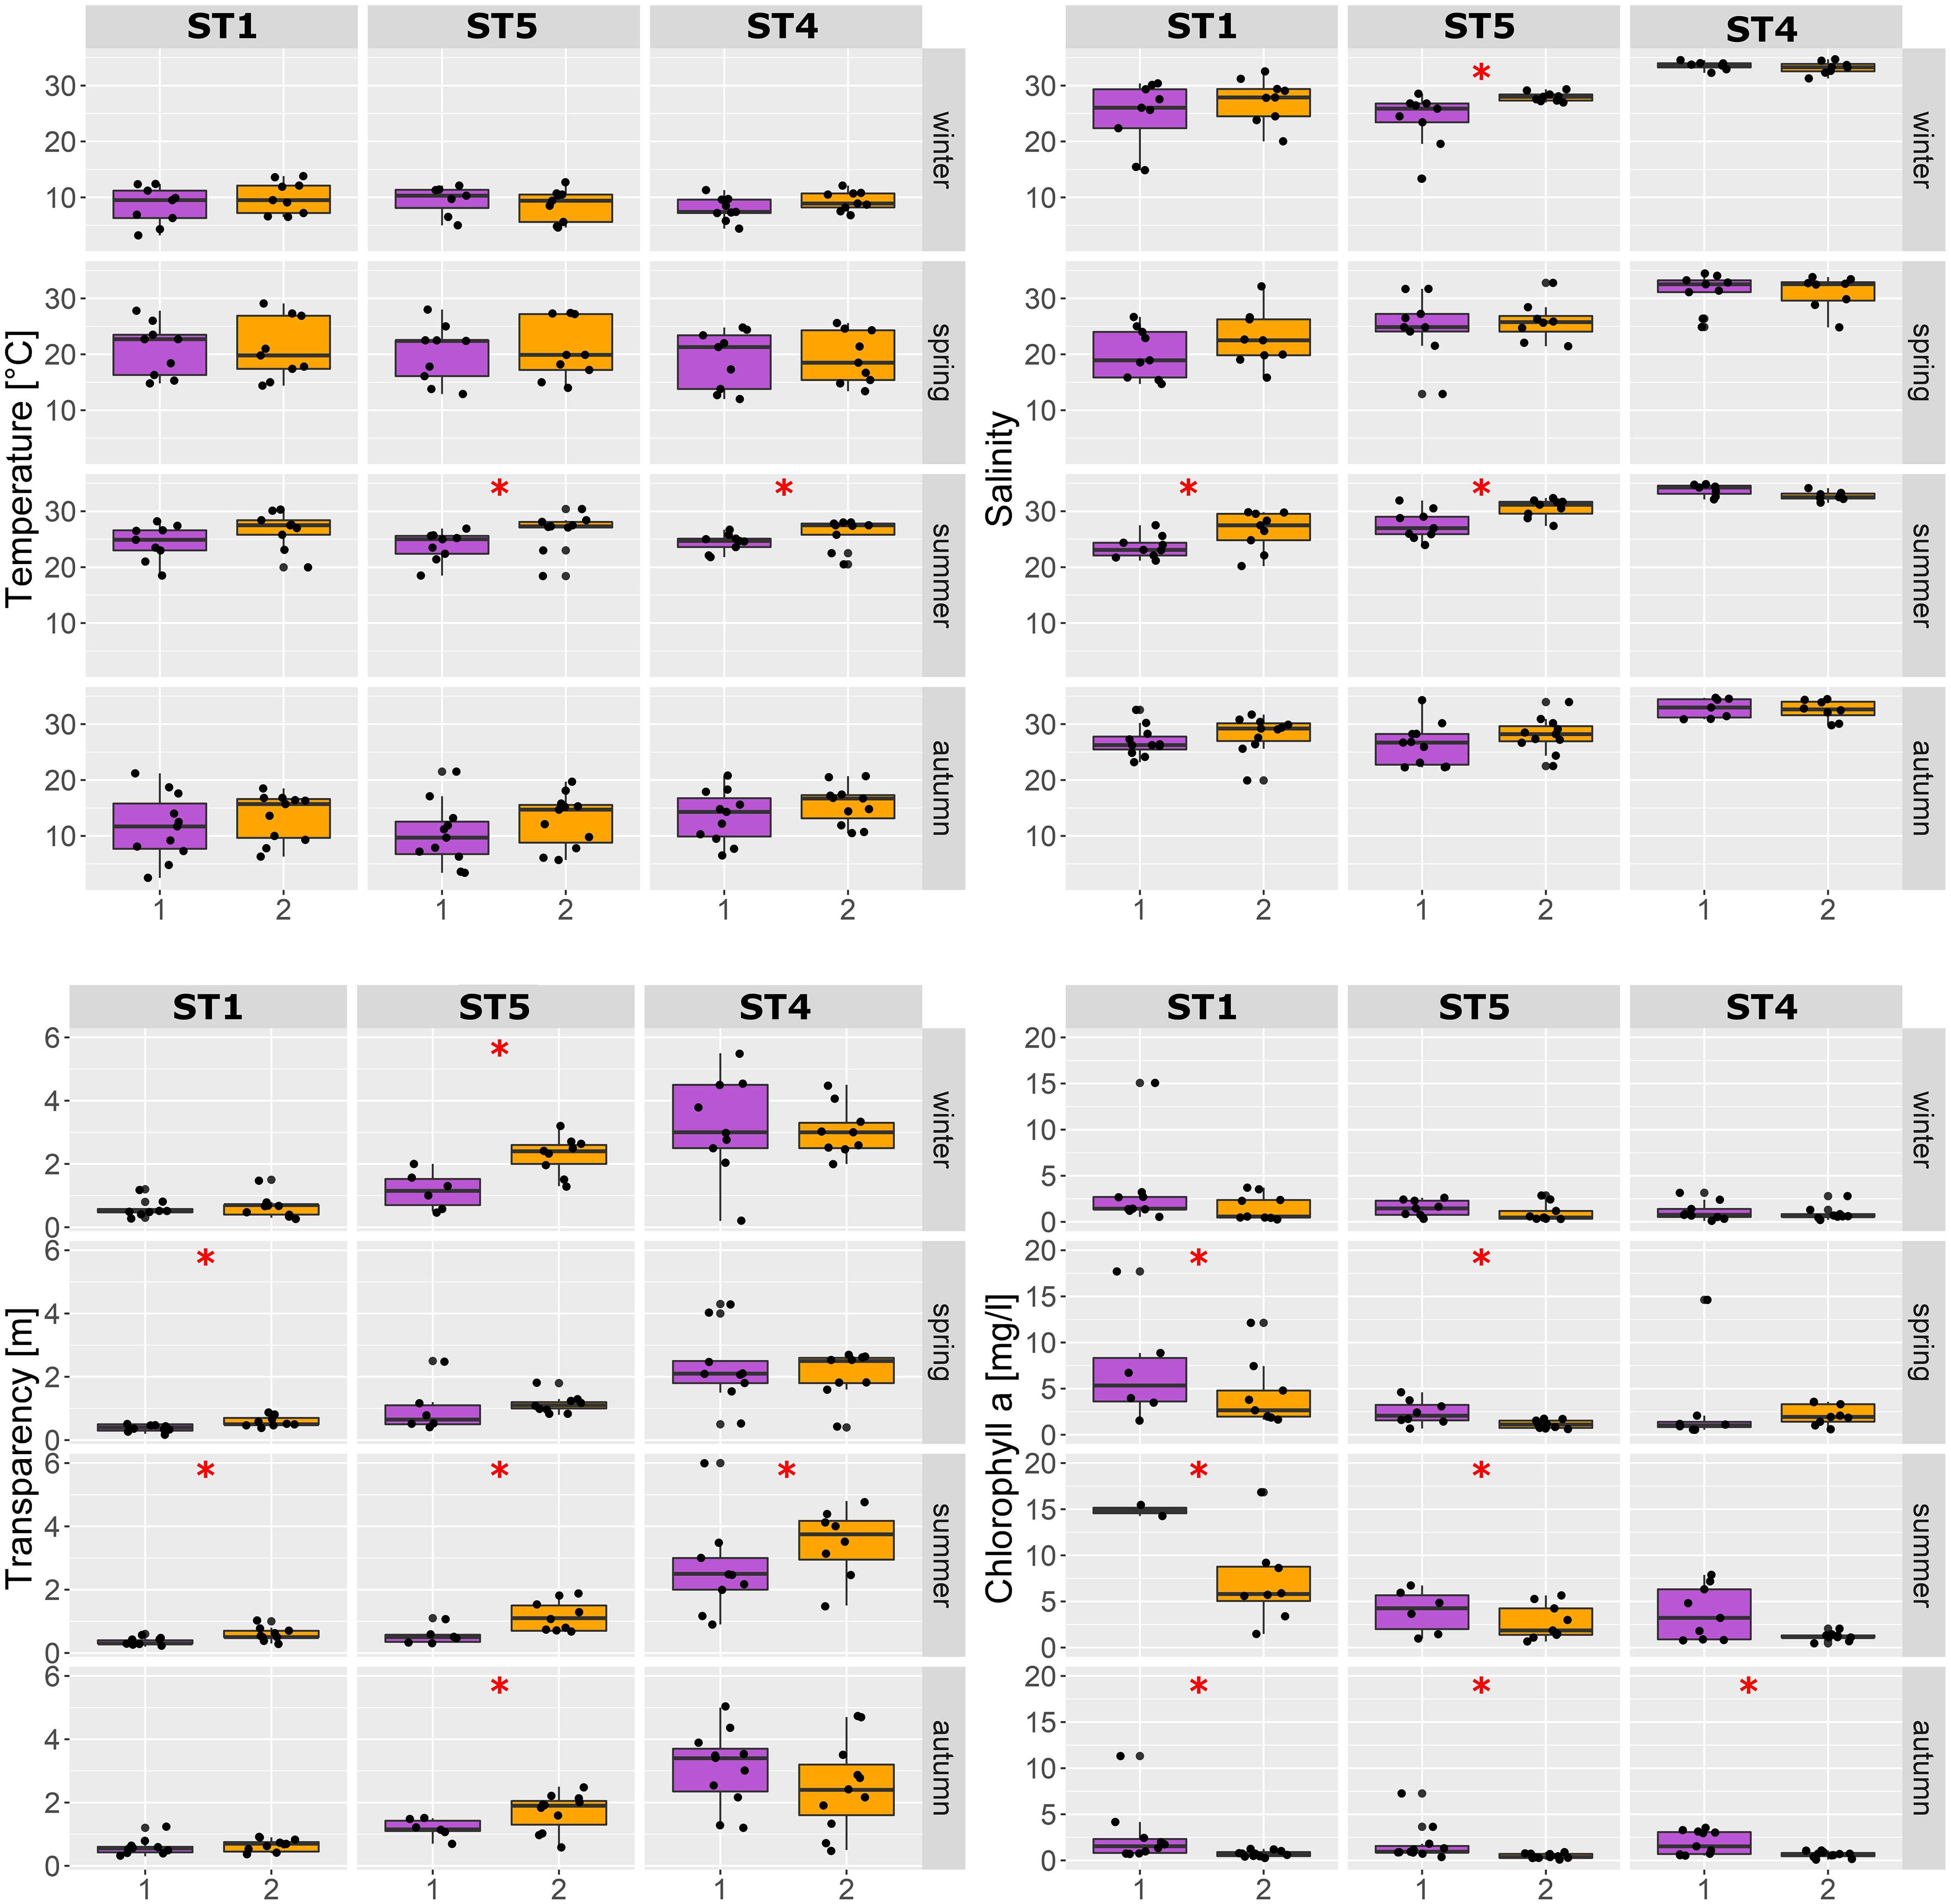
Figure 4 Environmental parameters comparing the two periods (P1 and P2) at different seasons at the three stations (ST1, ST4, and ST5). Asterisks indicate significant difference (p < 0.001; Kruskal–Wallis test) between P1 and P2.
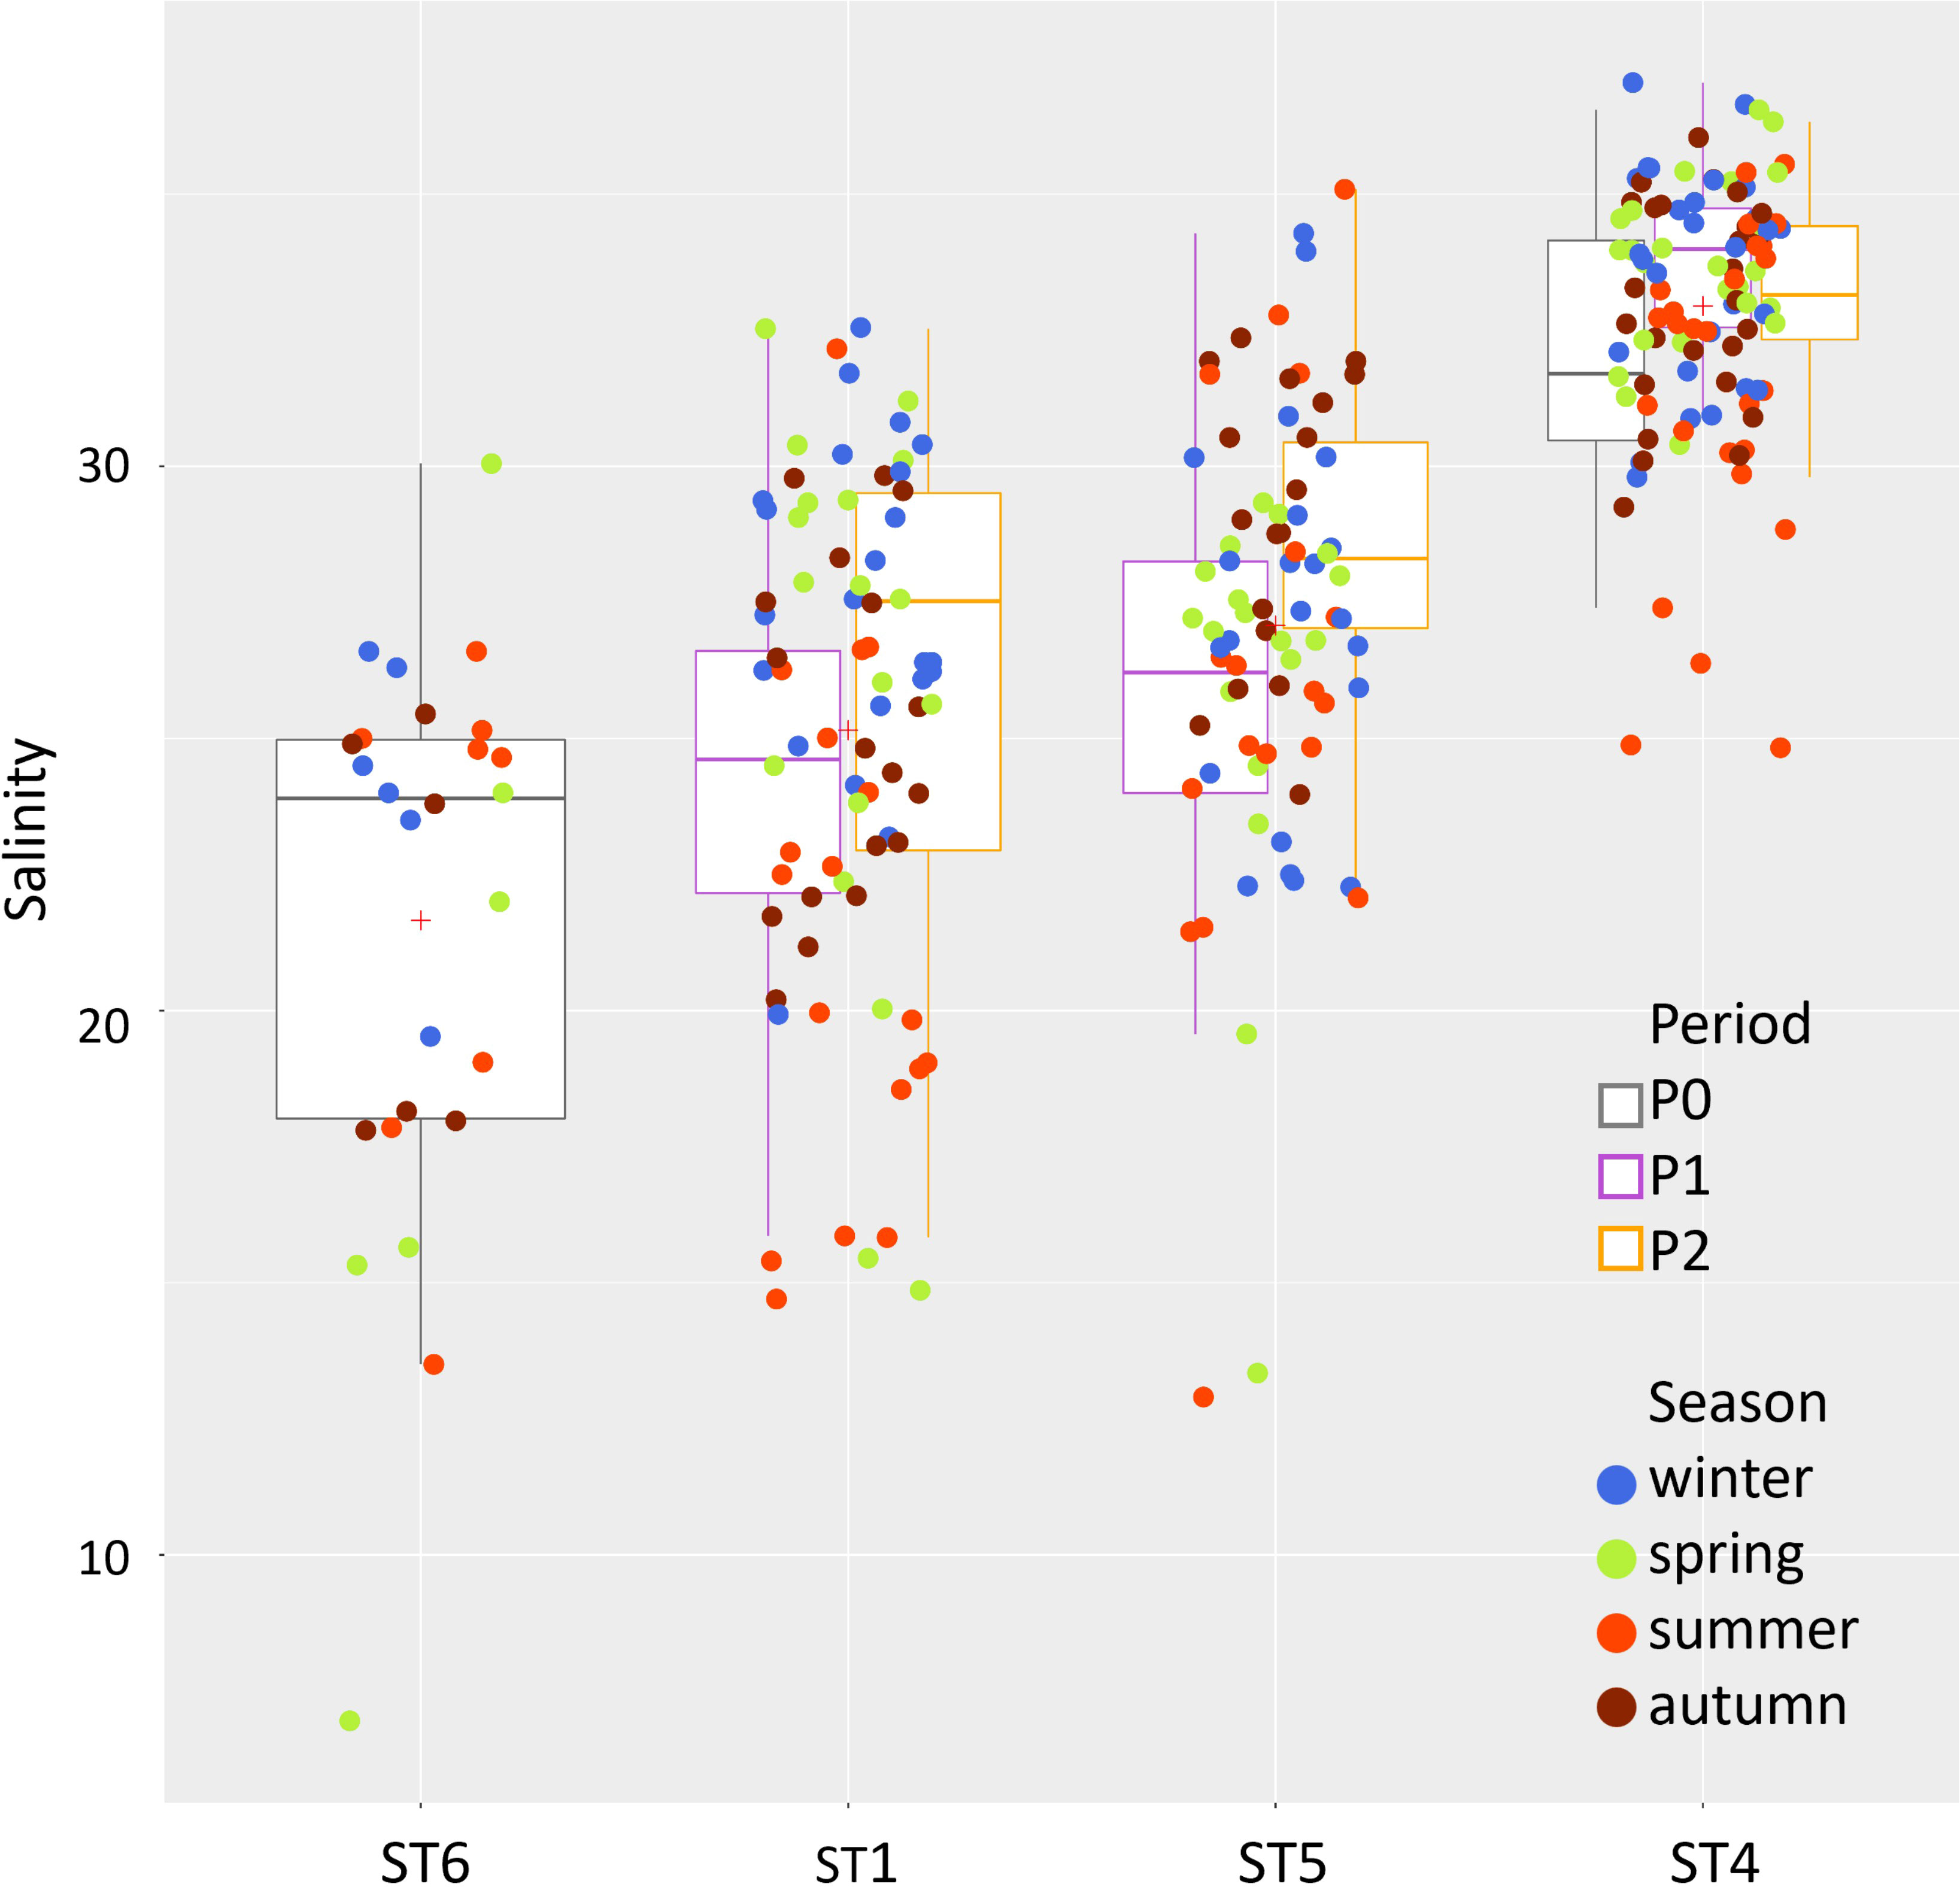
Figure 5 Multitemporal representation of the salinity changes along the inland-sea gradient from the innermost station at the mouth of the river Dese (ST6, P0 only) through ST1 and ST5 (P1 and P2) to the lagoon–sea interface ST4 (P0, P1, and P2).
Water transparency increased overall from Periods 1 to 2, especially in the lagoon stations ST1 (with lowest transparency) and ST5 (Figure 4). The chlorophyll a values instead exhibited an overall decrease from P1 to P2 in the seasons from spring to autumn (Figure 4). Overall, considering the two datasets as a whole (P1 and P2), the temperature values vary from a minimum of 1°C to a maximum of 30.4°C, salinity varies from 12.9 to 37.05, chlorophyll a varies from 0.9 to 124.64 μg L−1, and transparency varies from 0.2 to 6 m.
The total abundance of zooplankton, in the two periods (P1 and P2), increased progressively from winter to summer (Figure 6), with a minimum of 1 ind. m−3 at station 1 in February 2000 and a maximum of 79,214 ind. m−3 at station 1 in June 2019 (almost exclusively Acartiidae, with only Acartia tonsa as adult specimens). The average total zooplankton abundance was 2,549 ind. m−3 (SD 6620). A strong seasonality in the zooplankton abundance and species succession also emerged, indicating water temperature as the most evident environmental factor correlated with the zooplankton variation.
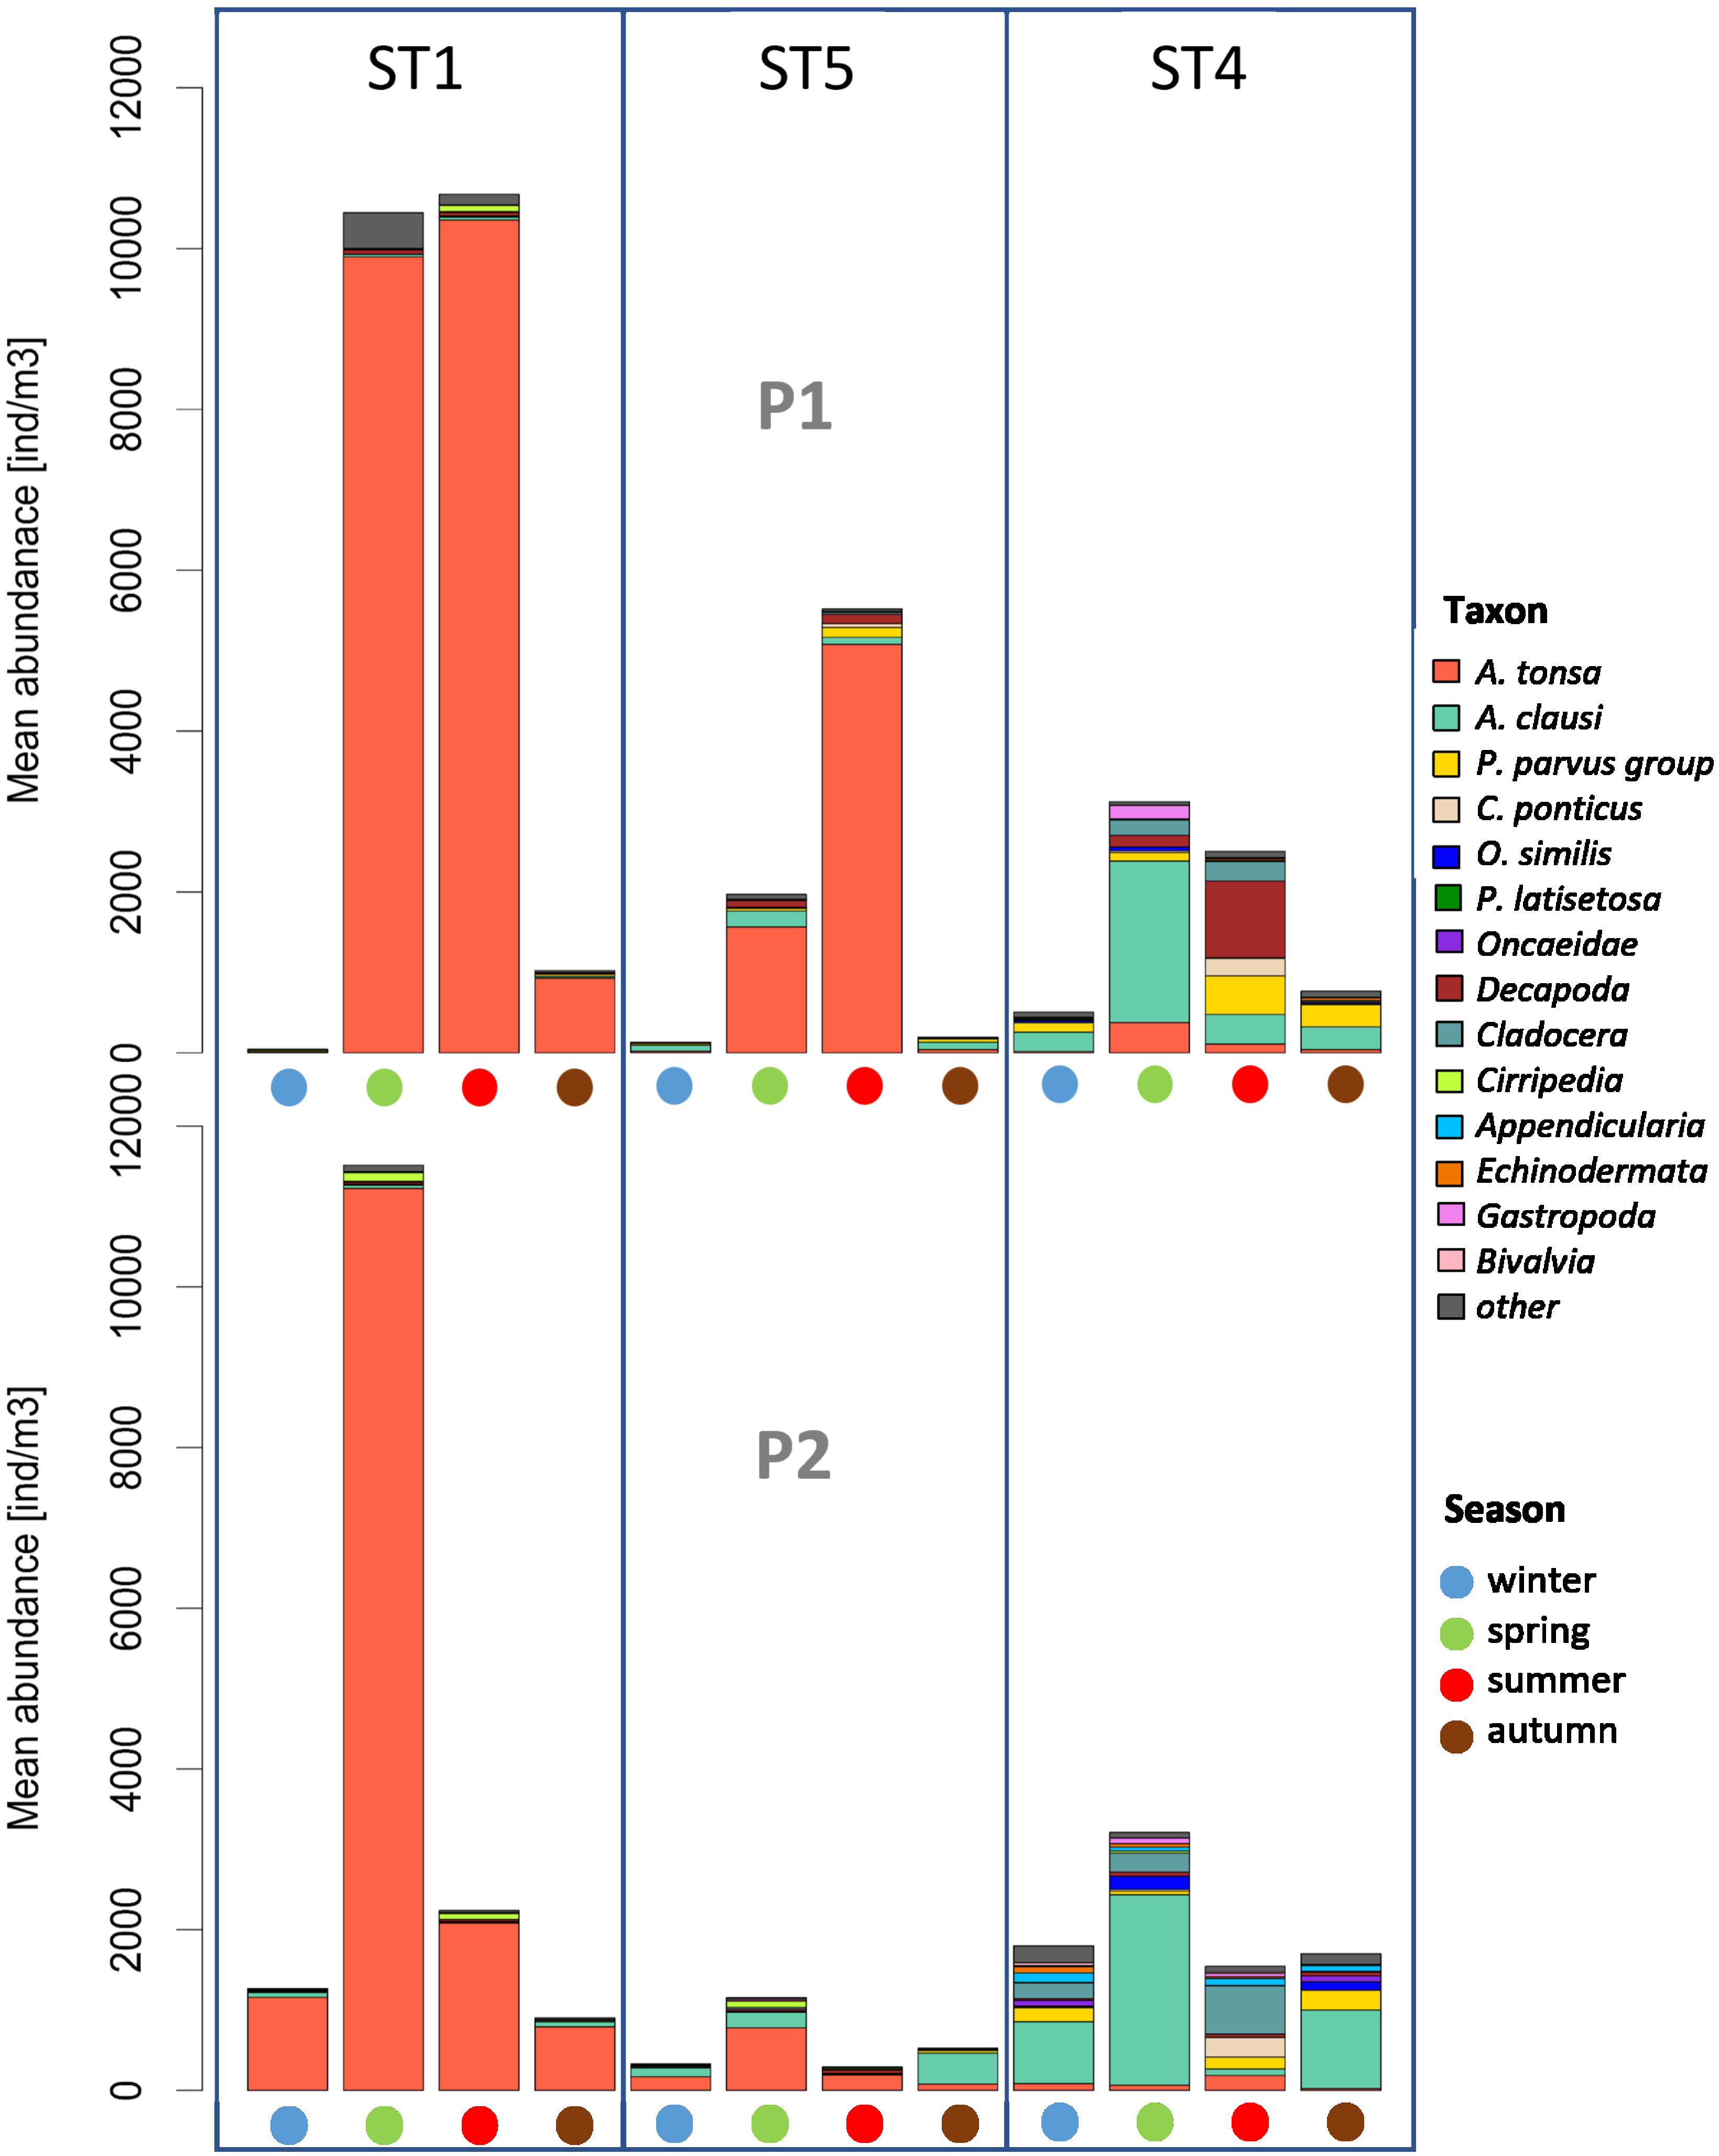
Figure 6 Seasonal mean abundance in the two periods, P1 and P2. Taxa with an overall mean abundance of less than 0.5% were grouped and plotted as “others”.
Overall, 54 zooplanktonic taxa were identified, with 24 Copepoda, of which 20 are species level. The identified Copepoda are omnivore–herbivore, filter feeders, grazers, or generalists. The higher copepod abundance was represented by genus Acartia with average percentages compared to the total community of 23.63% for A. clausi and 43.46% for A. tonsa, to follow species belonging to the genus Paracalanus, with a percentage of 9.92% and Cladocera species and Decapoda larvae with percentages of approximately 4%. A. tonsa dominates in the more internal areas (ST 1 and 5) while Acartia clausi is located in the area closest to the mouths or in any case in areas more influenced by marine-coastal ingress waters, as well as Cladocera and, although in a less evident way also occupying internal areas, Decapoda larvae (ST4).
At stations 1 and 5, the mesozooplankton was mainly represented by Copepoda, with a percentage greater than 90% of the total community, compared instead to the less than 80% in the more maritime station of the Lido (ST4), near the inlets, where the influence of the neritic-coastal populations coming from the Adriatic Sea is the highest. In fact, Cladocera and meroplankton, including Decapoda larvae, were more present in the inlet station. In the internal area of the lagoon (ST1 and 5), the zooplankton is characterized, unlike the more marine station of the Lido (ST4), by a few dominant species with high relative abundance, mainly during the summer (Figure 6). Peaks in abundances are often a result of flowering events of single species such as the copepod A. tonsa. At ST 4, A. clausi replaces the congeneric A. tonsa in terms of abundance. In fact, A. clausi dominates in the stations closest to the inlets, such as ST4, and in certain tidal conditions, even at ST5. As regards Cladocera typically present in the coastal neritic waters of the northern Adriatic Sea during the warm season, the trend of abundance follows a decreasing gradient from the inlets towards the inner areas. The maximum turnout is reached at the Lido station (ST4), and the minimum is reached in S. Giuliano (ST1), with the Podonidae family as the main representative. In Palude della Rosa (ST5), the cladoceran Penilia avirostris is also present, as a species widely present in the Adriatic Sea and probably carried to these areas by tidal currents flooding. Among the other taxa, which include meroplankton, the presence of mainly Appendicularia, Decapoda larvae, Gastropoda larvae, and Cirripedia larvae (nauplii and cypris) was noted.
In particular, in ST1 and ST5, Copepoda are represented by few but abundant species in terms of number of individuals, mainly belonging to the genus Acartia, dominating in absolute terms in ST1 (72.99% and 47.88% of the total community). At ST5, which is located near a canal that connects the lagoon hinterland to the sea, and therefore more influenced by the tidal effect, A. tonsa is still the most representative species of the community, but the presence of the neritic copepod A. clausi becomes more important. In ST4, the abundances of A. tonsa drop drastically in favor of those of A. clausi.
Therefore, moving away from the typical lagoon conditions, the populations of zooplankton became more diversified. In fact, at the Lido station, the presence of marine Copepoda and Cladocera is more important: here, we find the presence of copepods Paracalanus (16.95% against 8.53% in ST5 and only 4.28% at ST1) or of the cladocerans P. avirostris and Podonidae (10.21% and 1.49%, respectively). Concerning the relevance of the other zooplankton taxa, it is mainly given by typically marine taxa such as Appendicularia (Oikopleura spp.) (2.53%), Chaetognatha (Sagitta sp., Flaccisagitta, and Spadella sp.) (0.66%), Echinodermata (mainly Ophiuroidea larvae of Ophiura spp. and Ophiotrix fragilis are highlighted), and Gastropoda larvae (both approximately 1%). Decapoda larvae (mainly the zoea larval stages of the indigenous species Carcinus aestuarii and of the NIS Dyspanopaeus sayi) were present both in the lagoon stations and in the Lido station, with variable percentages of 2.76% in ST1, 4.95% at ST4, and 4.20% at ST5.
The beta-diversity analysis of the zooplankton composition (Figure 7) showed a separation between the stations, i.e., between ST4 and the two lagoon stations ST1 and ST5, following the two opposing gradients of salinity and Chla. The diversity in the two periods, P1 and P2, are overlapping, with P2 one being less variable and therefore within the range of P1. However, P2 diversity is slightly associated with higher temperature and higher salinity. Taxa such as the copepod A. tonsa and Amphipoda are more representative for the inner zone, while, e.g., the copepods Paracalanus parvus group, Corycaeus and Calocalanus spp., and Siphonophora and Chaetognatha were found more in the inlet station ST4. Cirripedia larvae, Bivalvia larvae, Cladocera, and Appendicularia seemed to be more characteristic for P2 (Figure 7).
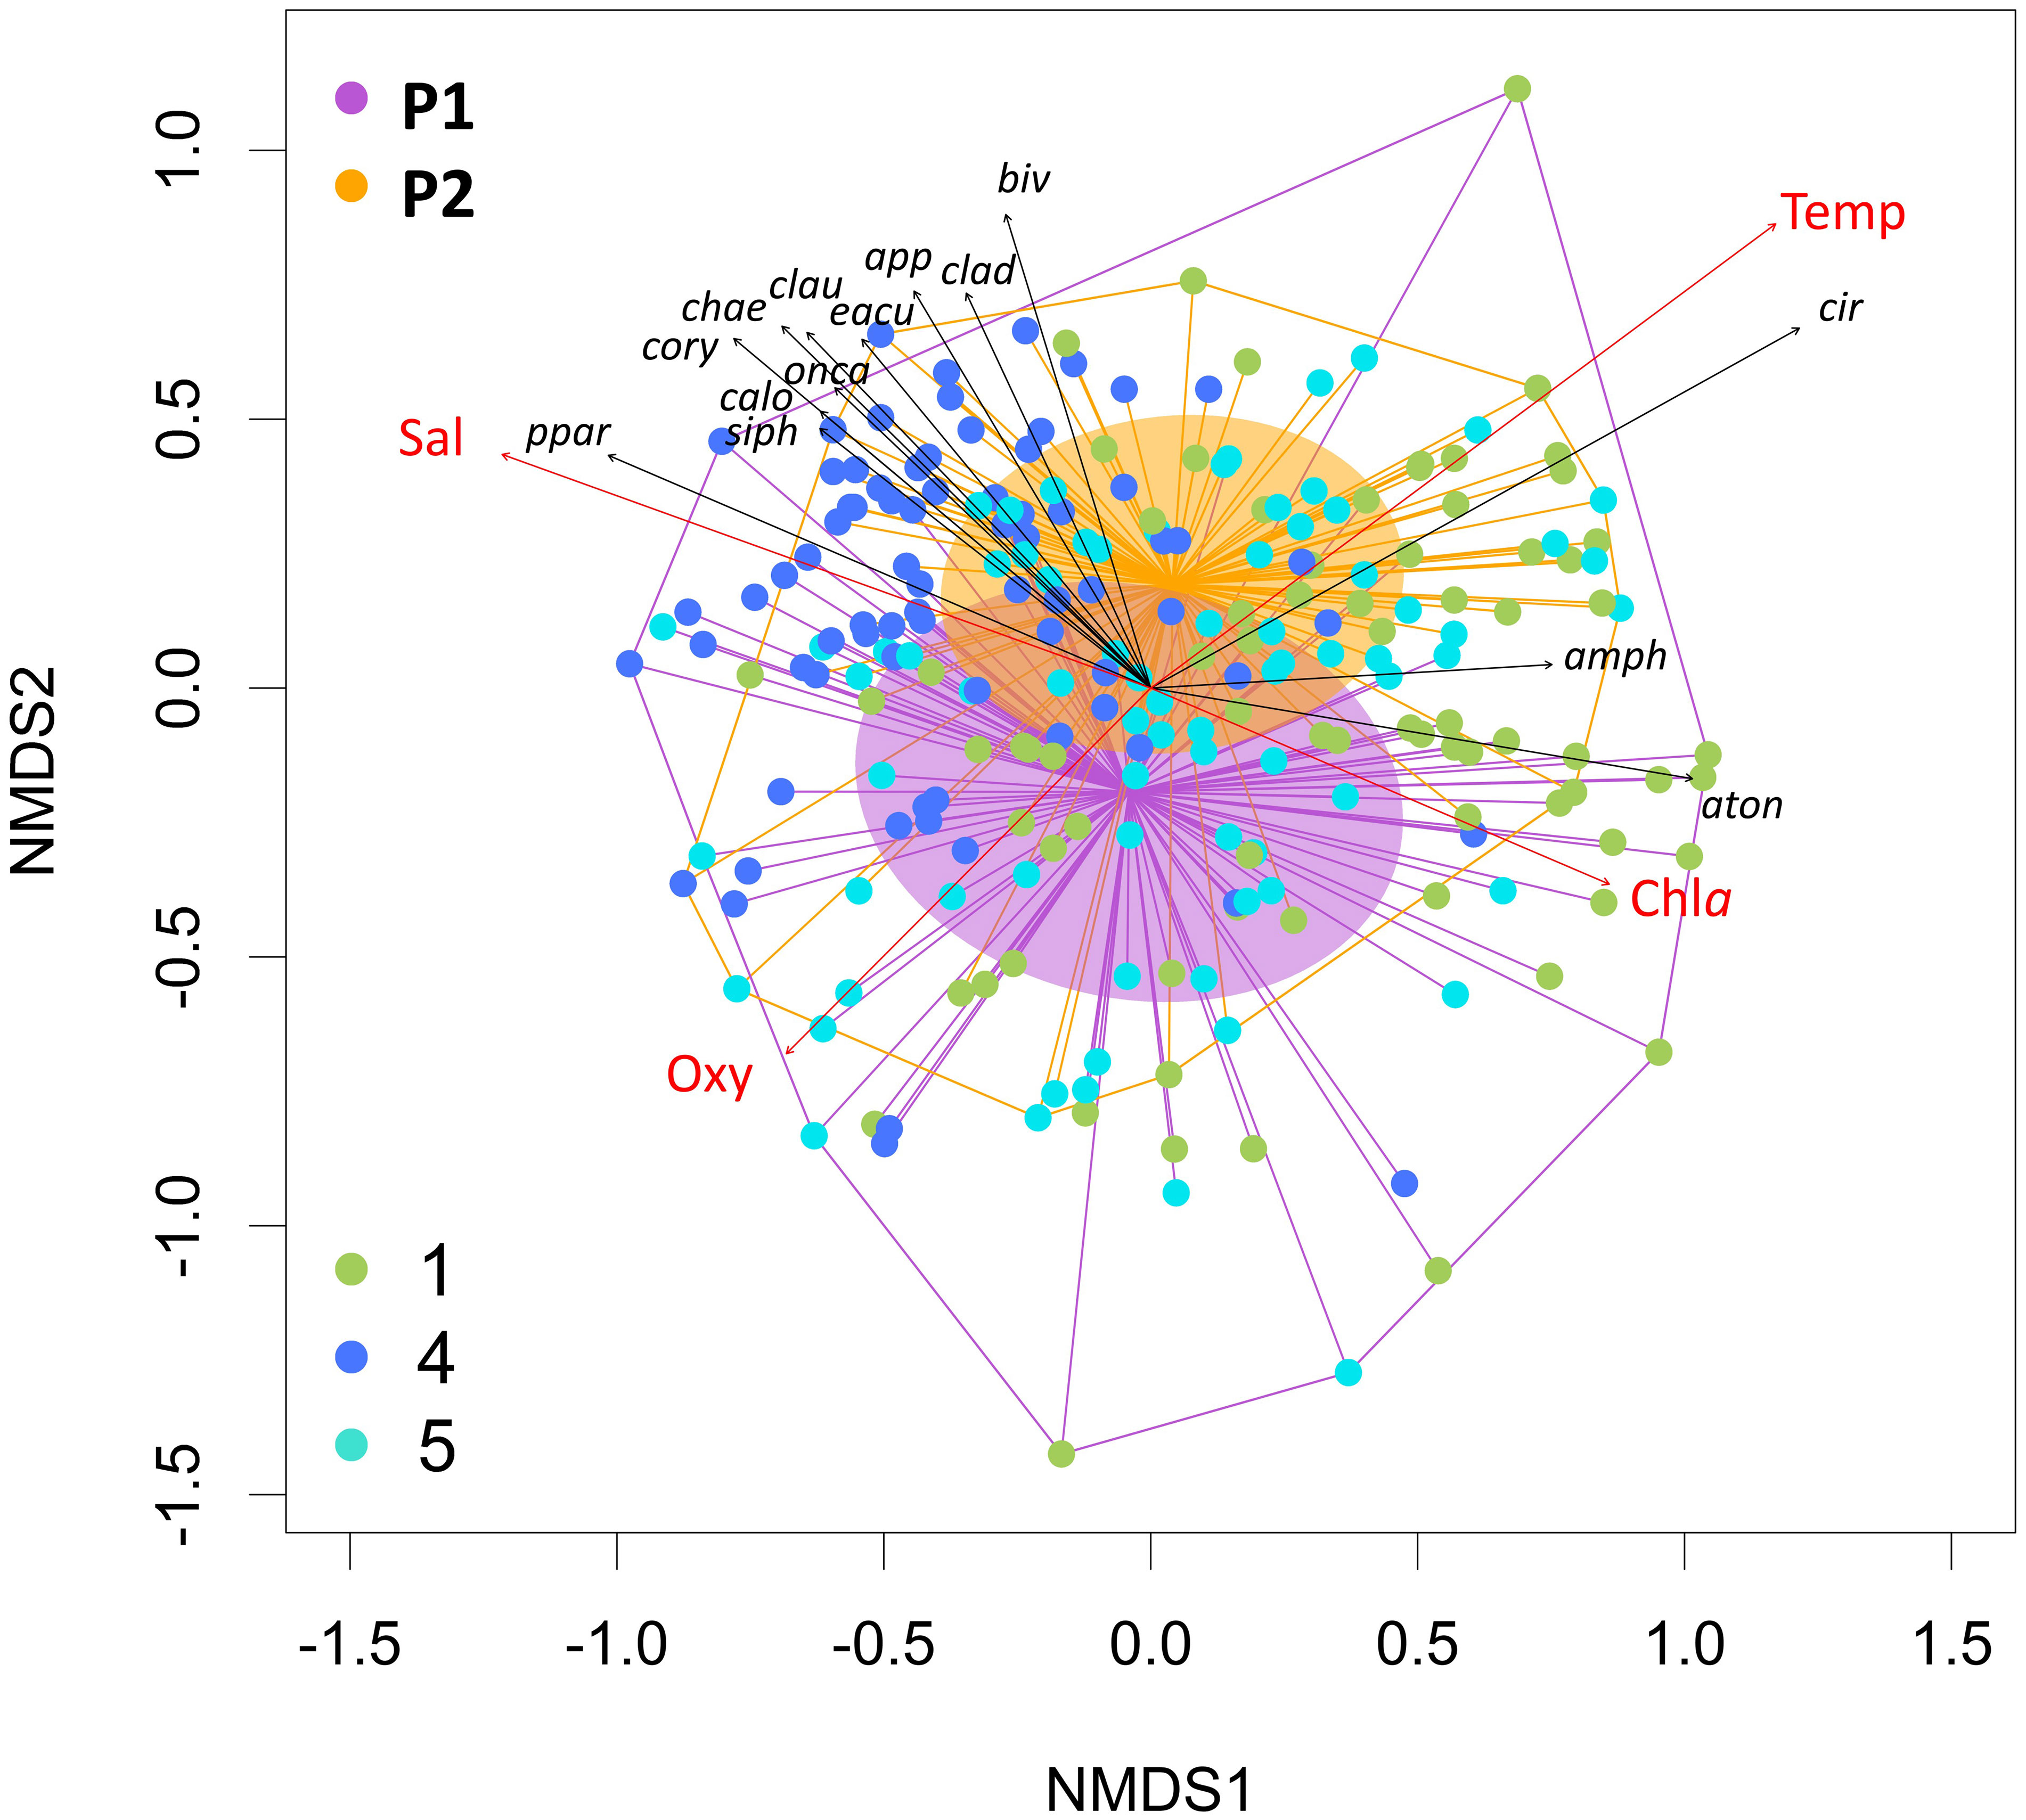
Figure 7 Beta-diversity estimates based on Bray–Curtis similarities plotted on NMDS of the mesozooplankton community. Colors of points refer to the sampling station of each sample. The two periods are highlighted plotting convex hulls, the distances to their centroid, and the standard deviation of the points with the respective colors. Environmental parameters (red) and the taxa best describing the ordination pattern (p = 0.001) (black) are plotted as vectors.
As for the trend of zooplankton over the years (Figure 8), in ST4, Copepoda showed very different abundances in comparison to P0 as well as in the ST5 between P1 and P2. On the other hand, this does not happen in ST1 even if the trend of the average abundance values of zooplankton are lower starting from the second part of the year. Similarly to the Copepoda, Cladocera showed significant differences between P0 and P1 and P2 only at ST4. As for the other zooplankton taxa, slight differences are visible, but they are not statistically significant.
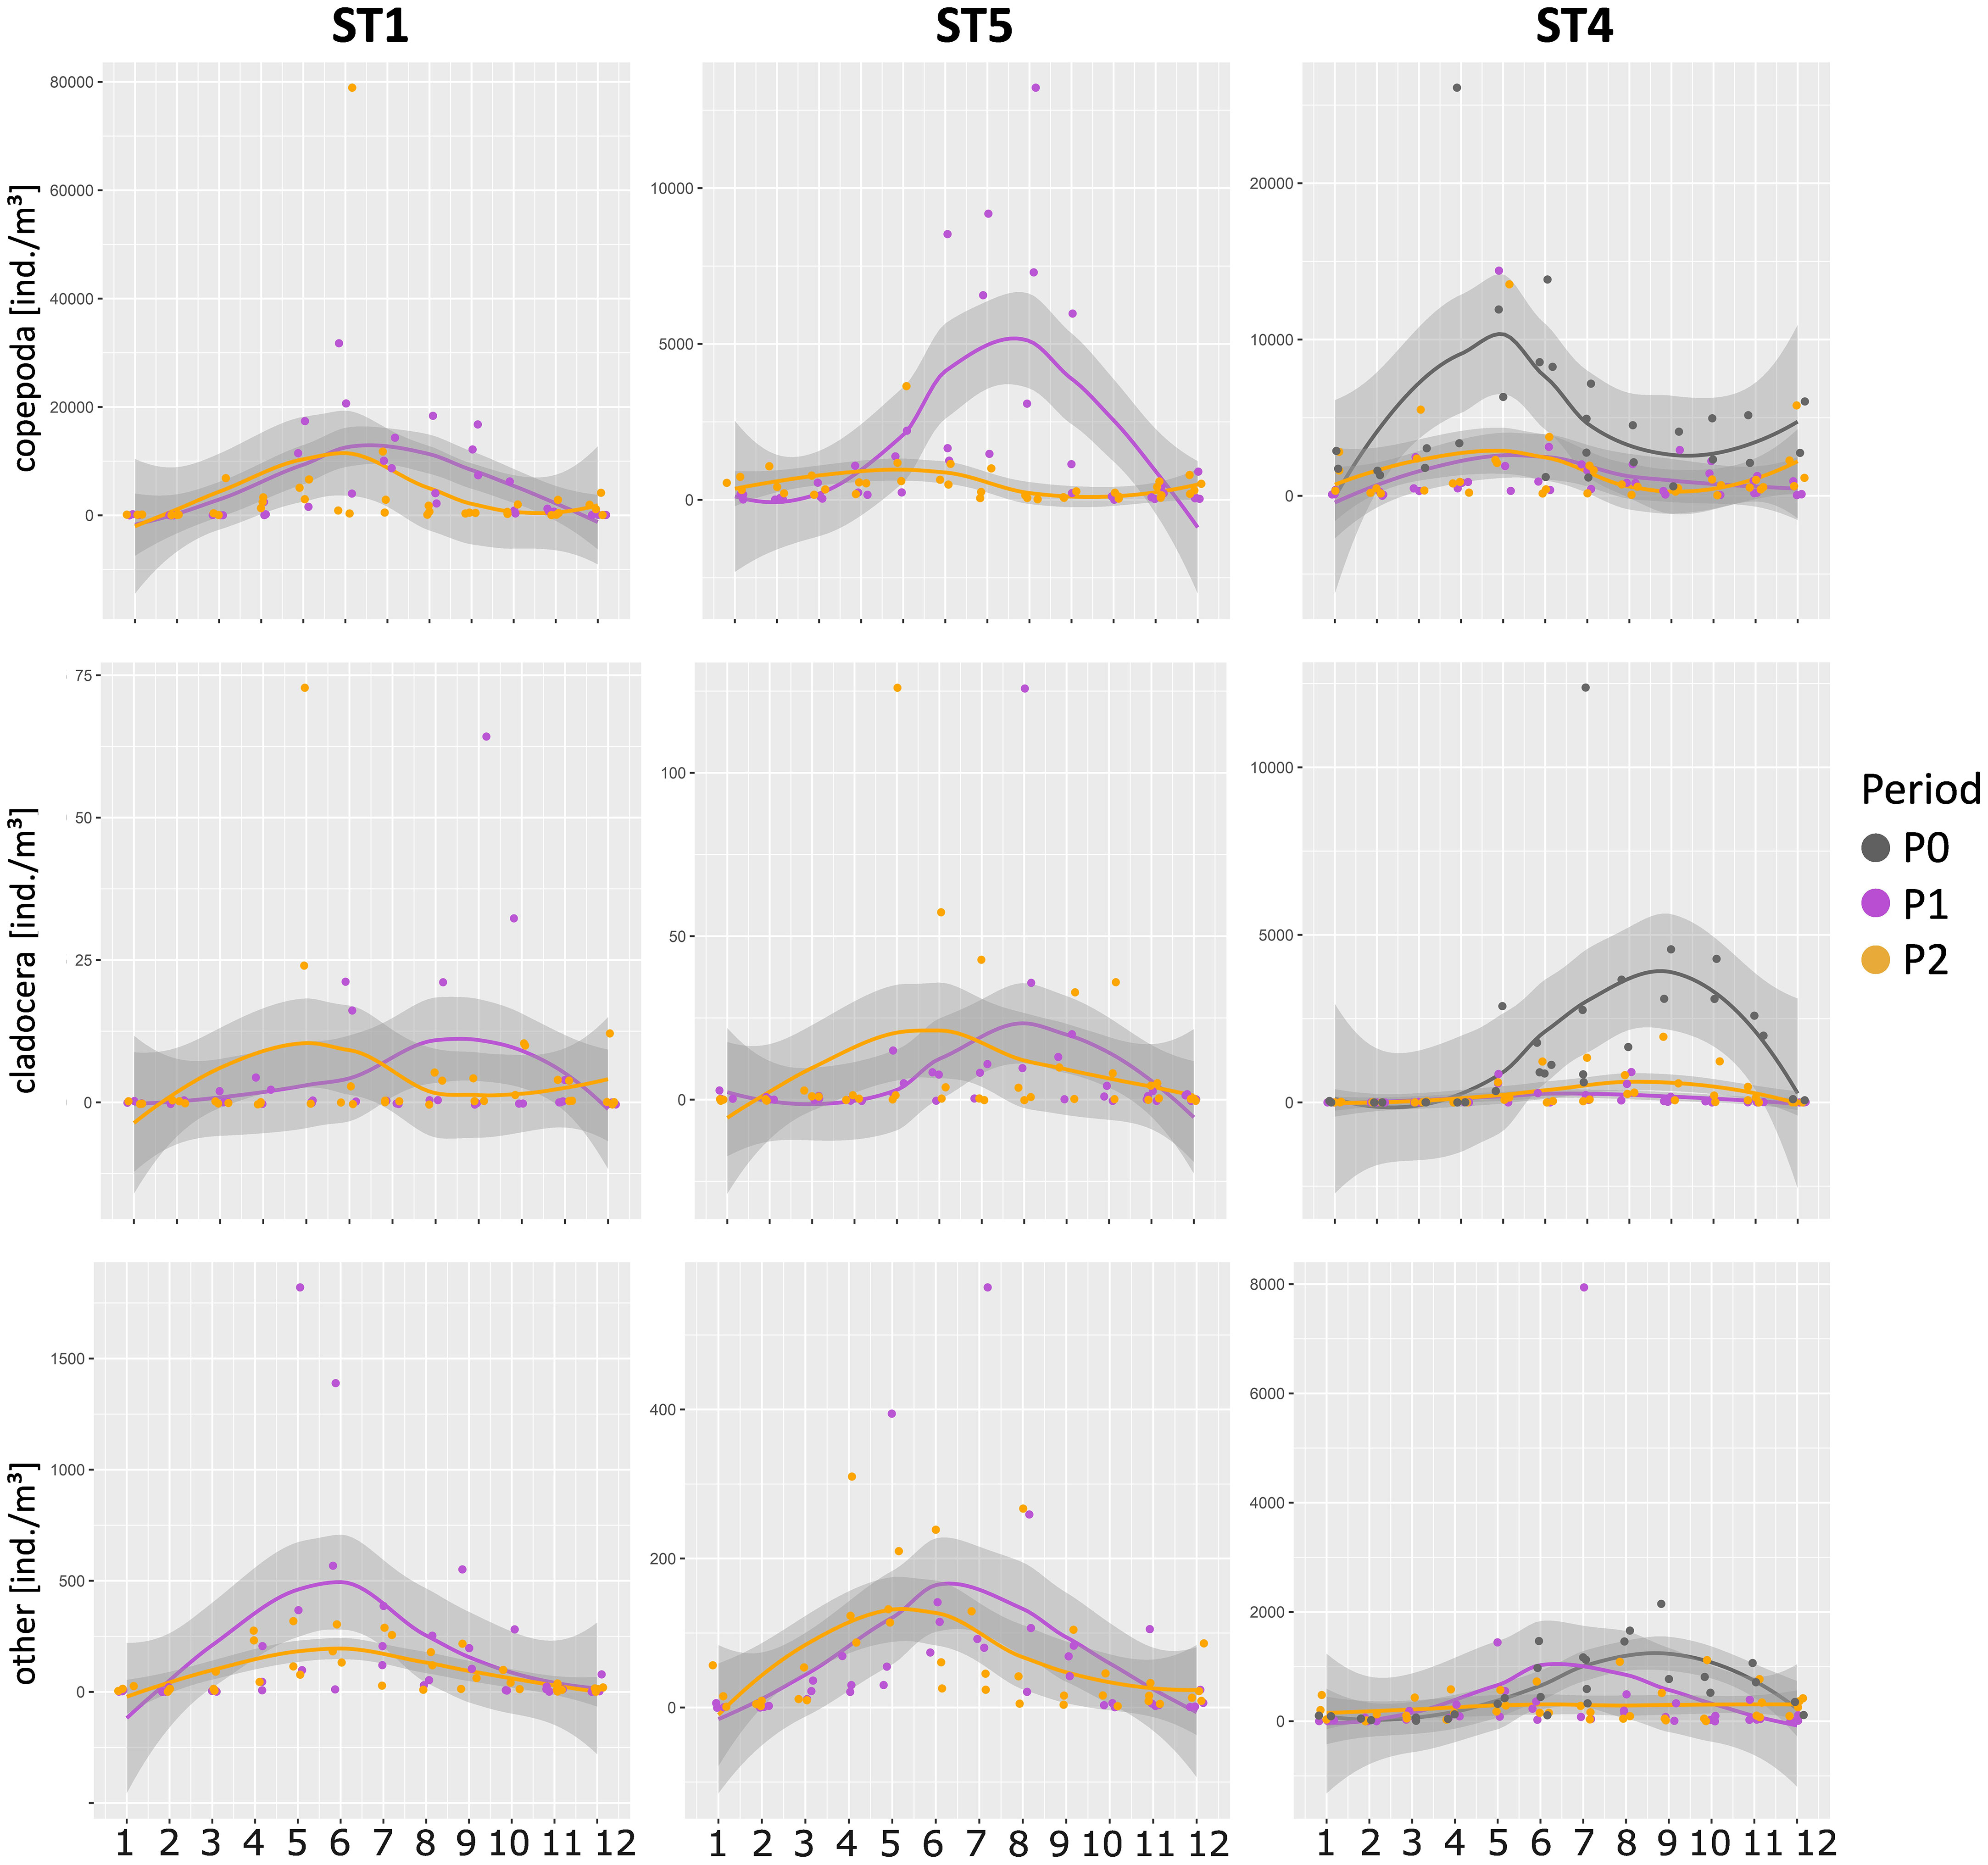
Figure 8 Mean abundance of copepods, cladocerans, and all other taxa in the different periods and stations. Yearly trends were obtained by loess interpolation on the corresponding months in each available period.
On the basis of these results and from a long-term perspective, our attention has focused therefore on the decrease of abundances of the dominant copepod community in the last period, P2, compared to the past. In particular, the decrease in total abundances is recorded mostly in the hottest months of the year, from July to September (Figure 9B), a period that, in recent years, coincided with the presence in large quantities of the filter feeder M. leidyi, firstly recorded in 2016 (Malej et al., 2017) and now a constant presence in the lagoon and in the Adriatic Sea. The abundance of this ctenophore in the LTER stations is highest in the hot season (Figure 9A), especially in the summer months, and it is widespread throughout the lagoon basin. The stations ST3, ST4, and ST5, which are the ones most influenced by the inputs of seawater, seem to characterize the areas of greatest presence of the species. The absolute maximums are reached in ST5 where the inlets inflow seawater through the navigable canal of S. Felice and the residence times of the waters (among the highest in the lagoon basin, Cucco and Umgisser, 2006) facilitate the arrival and settlement of the species in this type of area.
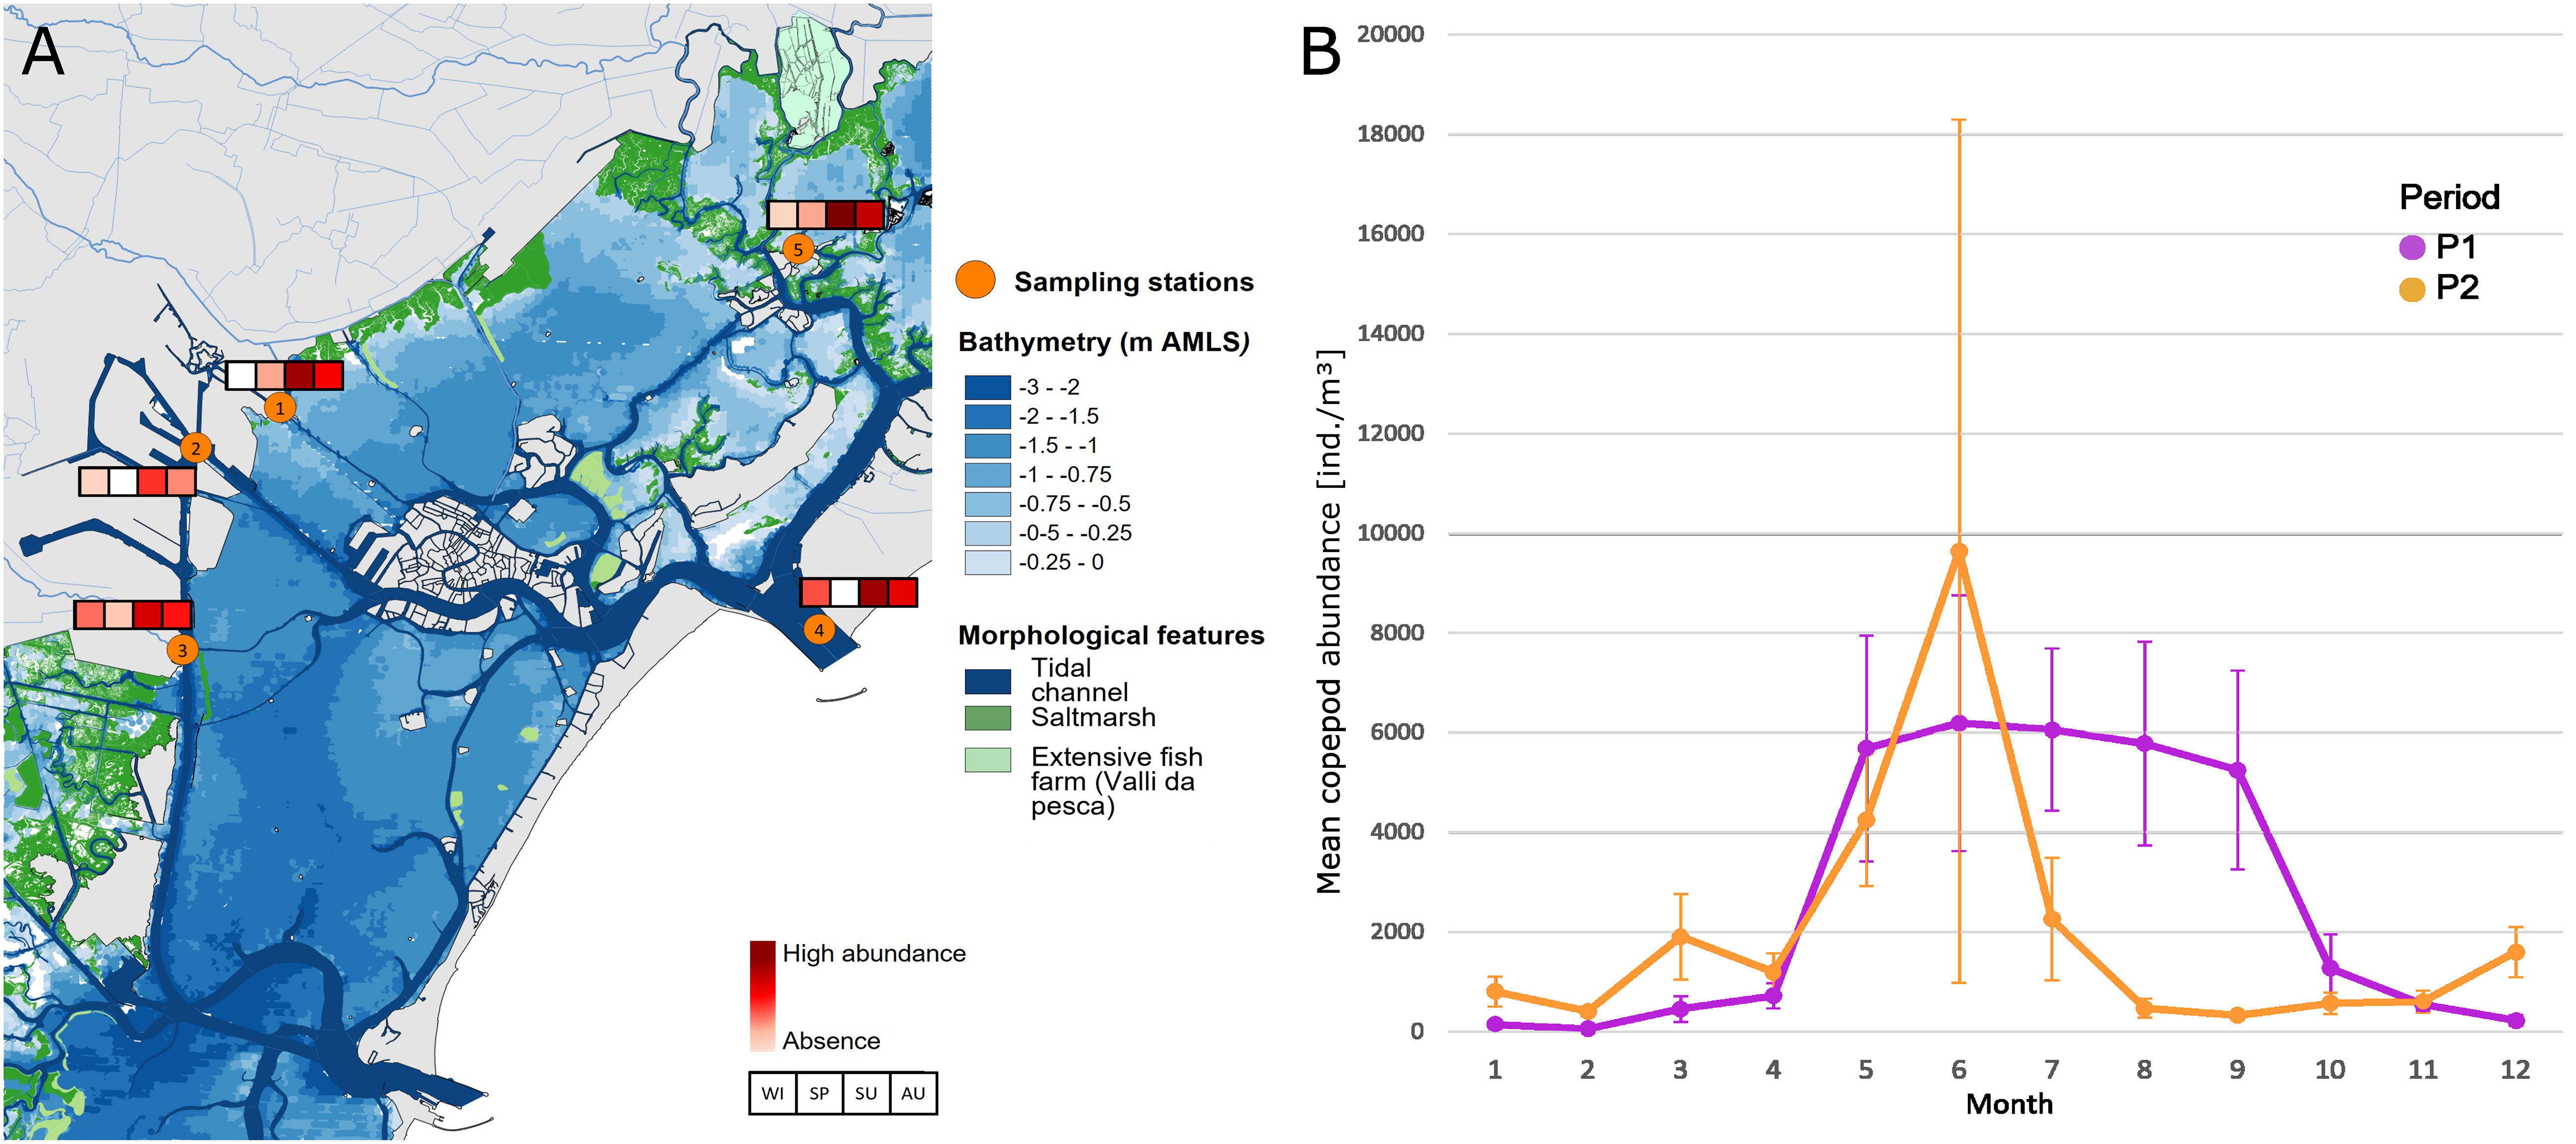
Figure 9 (A) Estimation of the seasonal and spatial presence on Mnemiopsis leidyi in the Venice Lagoon at the LTER station. (B) Monthly mean copepod abundance of the three stations ST1, ST4, and ST5.
The IndVal analysis performed on P1 and P2 copepod assemblages identifies the most characteristic species and assemblages of different habitats (Table 1).

Table 1 Indicator species of the different groups of samples.
In station ST1, despite the clear dominance of A. tonsa, the suggested indicator species is Calanipeda aquaedulcis. This species has been observed from freshwater to saline lake systems, being an extremely euryhaline osmoconformer (see Svetlichny et al., 2012). C. aquaedulcis is highly specific of ST1 and its low fidelity depends on its occasional occurrence, presumably related to rain events. Indicators of ST4 are a rather large group of 12 neritic-marine taxa, whereas for station 5, no species overcame the selected significance threshold.
Interestingly, considering together ST4 and ST5 as representative of a more marked marine influence, the species A. clausi and P. parvus group become the most relevant indicators with both high specificity and fidelity. Conversely, considering together ST1 and ST5 as representative of the inner brackish habitat, the species A. tonsa emerges as the most relevant indicator.
Considering the different periods, in P1 (1998–2001), Calanus helgolandicus, Pseudocalanus elongatus, and Acartia margalefi appeared to be the best indicator species, followed by Paracartia latisetosa that presented exclusivity (i.e., specificity = 1) but low fidelity. In P2 (2018–2021), Pseudodiaptomus marinus replaced P. latisetosa (which disappeared) in terms of representativeness of the association of species, together with Centropages typicus and Ctenocalanus vanus, two marine species already highlighted as indicators of ST4.
As expected, a positive relationship between the species occurrence and their relative mean abundance within the overall community was observed in both periods (R2 = 0.91, p < 0.001 and R2 = 0.76, p < 0.001, respectively, for P1 and P2). The overall richness amounts to 23 species in both periods. The partition of the community based on the species dispersion index (Figure 10) identifies the “core” and “satellite” sub-communities, which number 12 and 11 species, respectively, in the two periods (Table 2). It is interesting to note that there is a turnover of 50% among the 12 “core” species between the periods. In particular, six of them (A. tonsa, A. clausi, P. parvus, Centropages ponticus, Oithona similis, and Temora stylifera) maintain the “core” rank in both periods, while six species (C. helgolandicus, P. elongatus, A. margalefi, P. latisetosa, Calocalanus spp., and Oithona nana) having a “core” rank in the first period become “satellite” in the second period (apart from P. latisetosa, which is no longer present in the second period). Conversely six taxa (P. marinus, Oncaeidae, Clausocalanus spp., C. vanus, Oithona plumifera, and C. aquaedulcis) having the rank of “satellite” in the first period switch to the “core” group in the second (apart from P. marinus, which was not present in the first period).
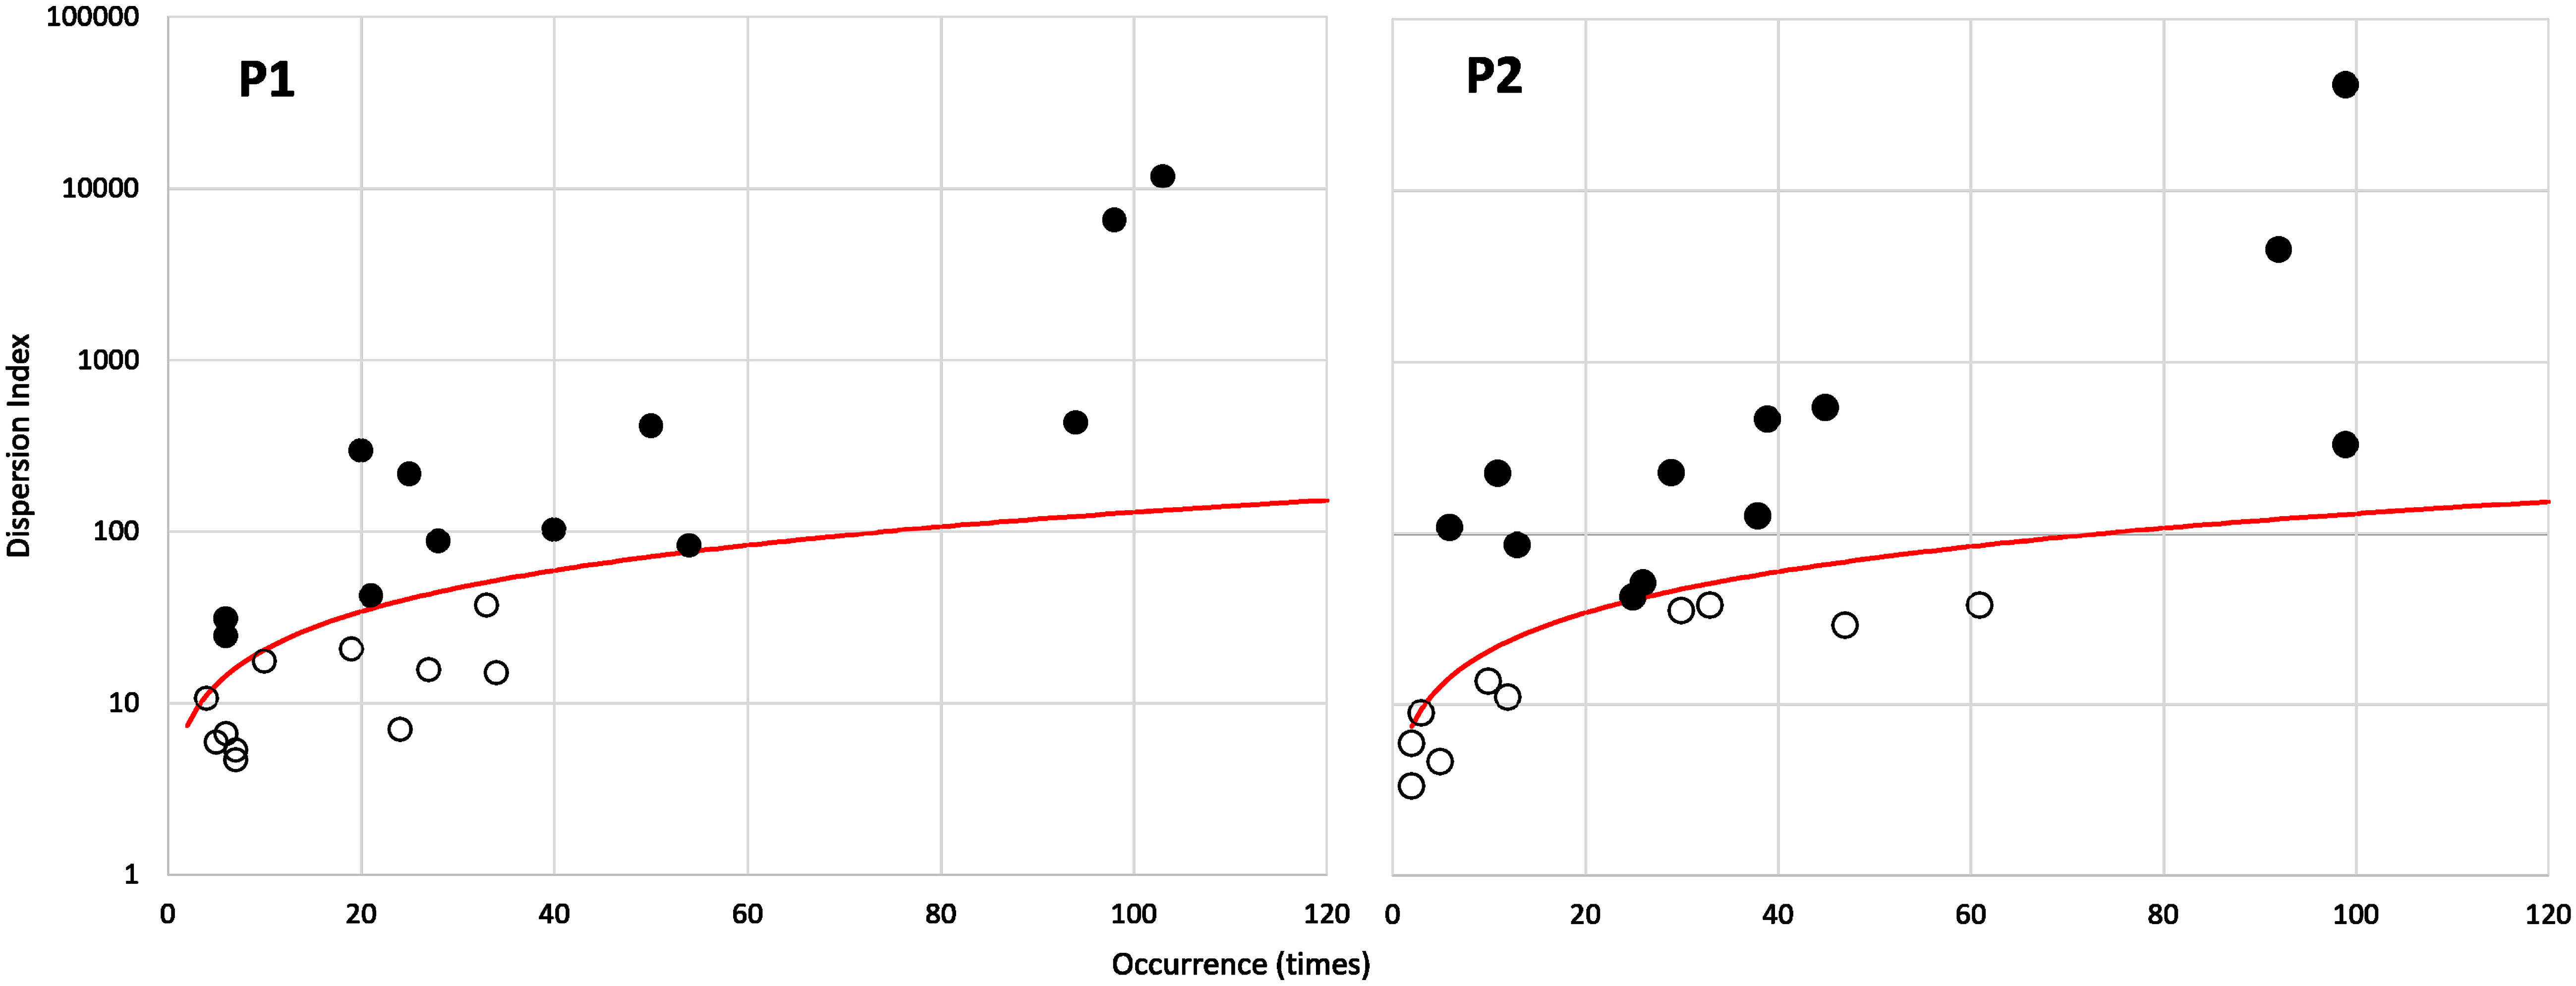
Figure 10 Species occurrence plotted against their index of dispersion (calculated as variance to mean ratio of abundance for each species). The red line represents the 2.5% confidence limit for the χ2 distribution. Species falling above the red line are the core species (filled dots), and species falling below the red line are the satellite (or “occasional”) species (see Table 3).
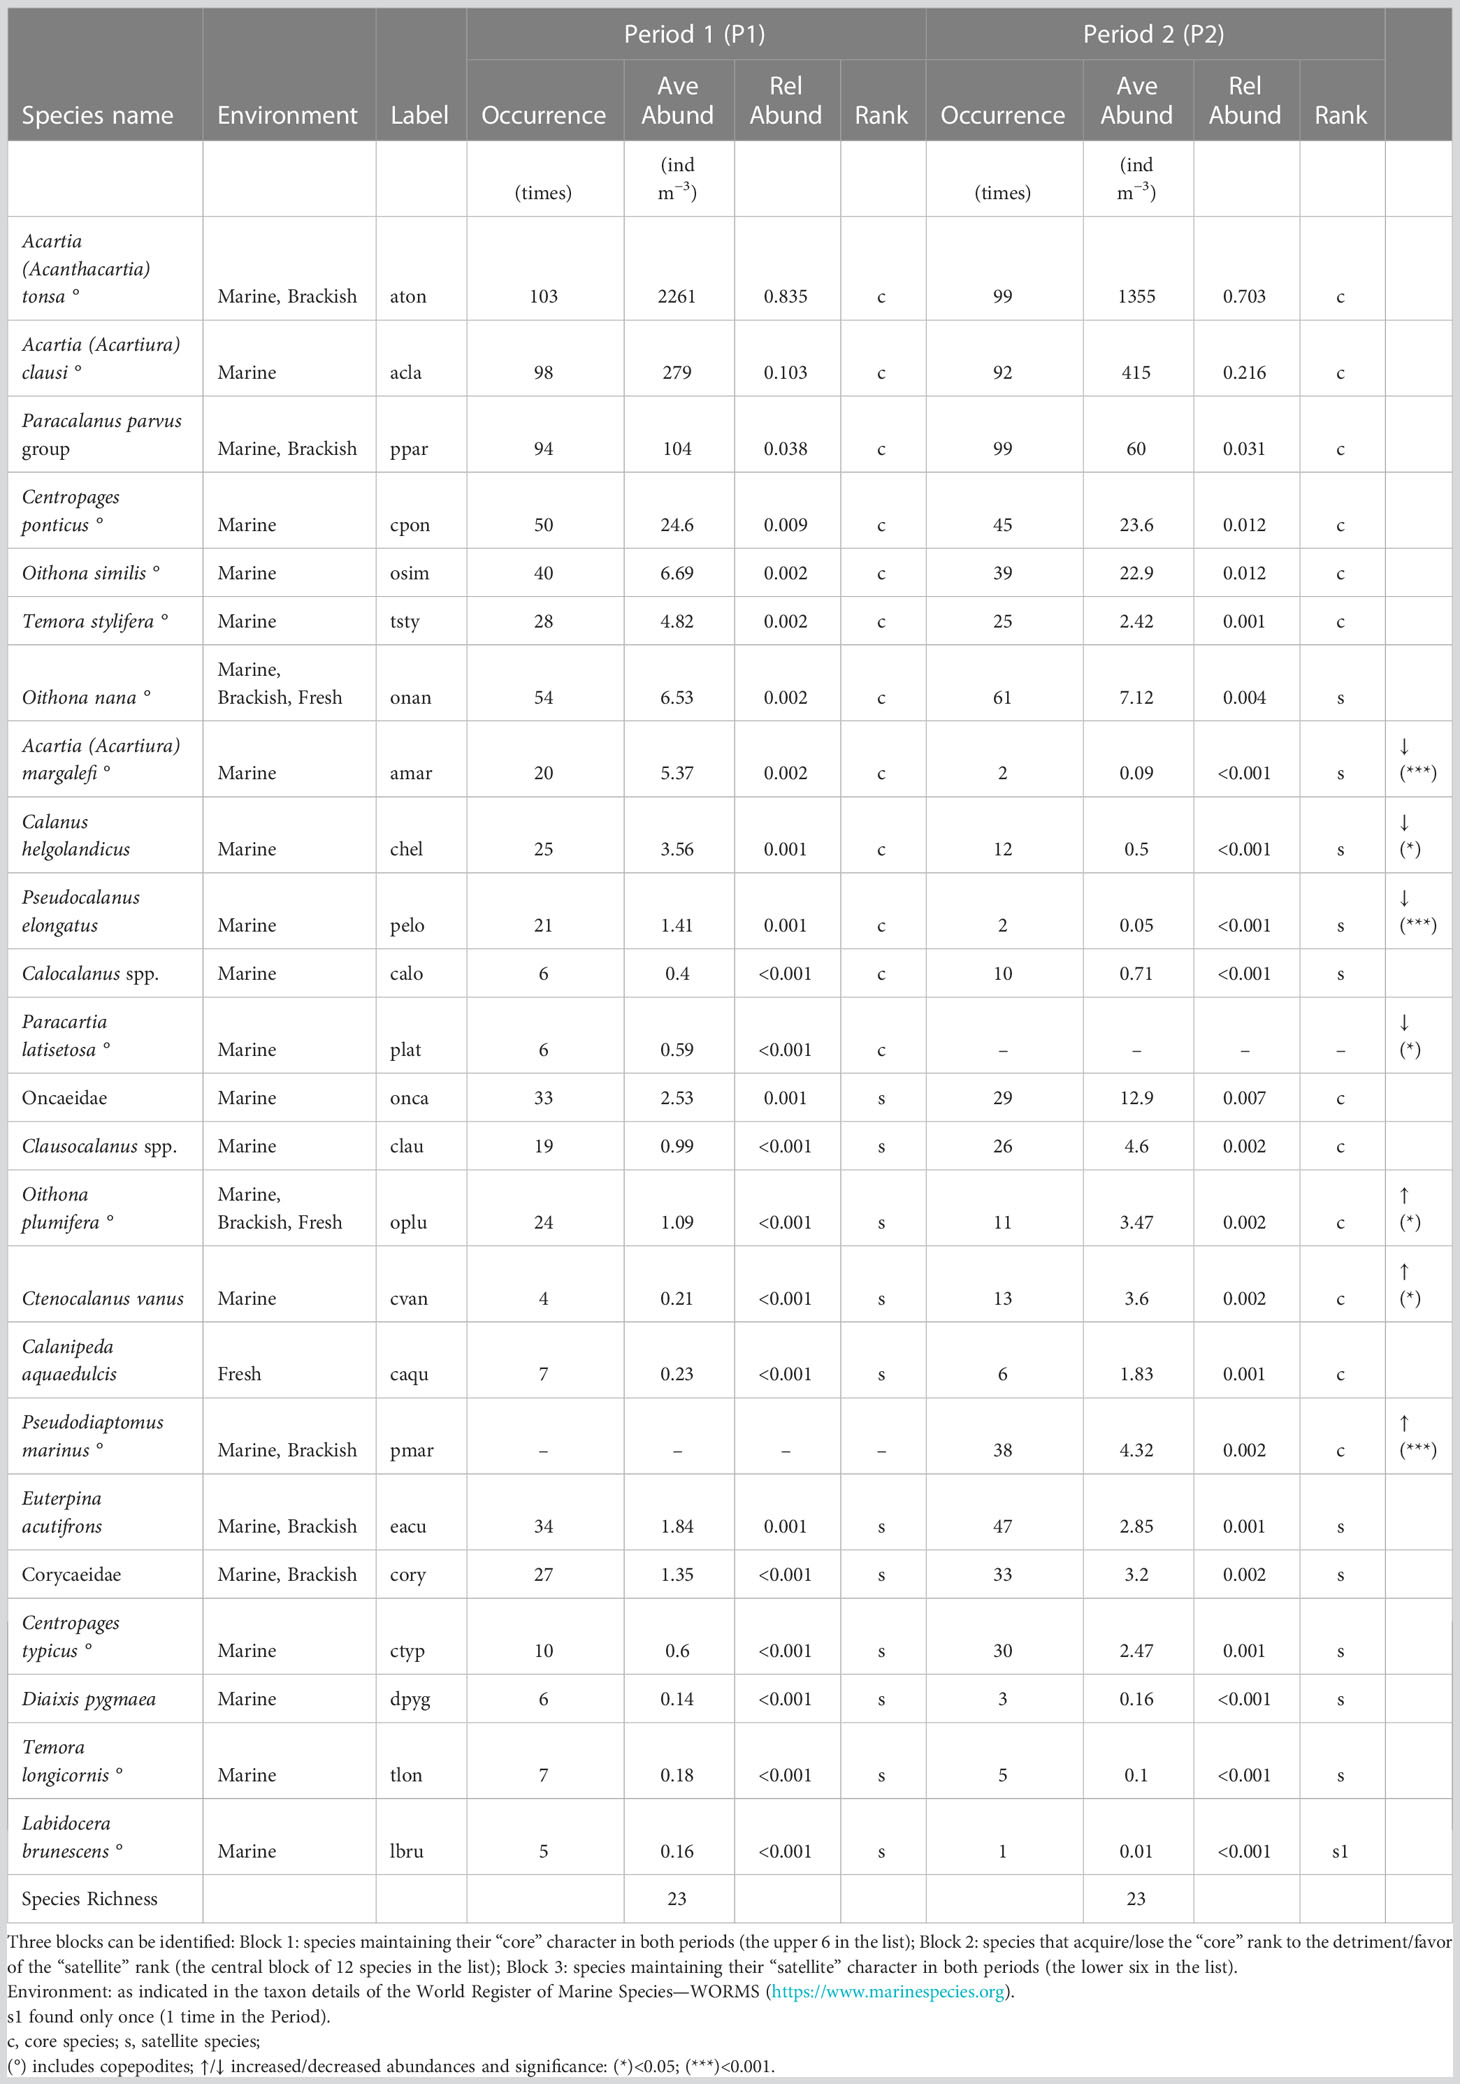
Table 2 Community composition and species ranking based on dispersion index in the two periods.
The rearrangement of the ranks in this central block of 12 species reveals the change in relevance of the role and strategies of the different species within the community induced by the modifications of the assembly rules imposed by the habitat. Thus, for example, species with greater marine affinity, not too large in size (approximately 1 mm, such as C. vanus), and more active in finding food (cruise feeders such as Clausocalanus spp.) assume greater importance in P2 compared to P1.
As a matter of fact, abundances of species with more neritic-coastal characteristics have significantly increased in P2 compared to P1 (KW test on medians, see Table 2) while the typically lagoon ones (P. latisetosa and A. margalefi) exhibited an opposite trend. Larger species, such as the copepods C. helgolandicus and P. elongatus, also showed a significant downward trend.
The constructed networks (Figure 11) represent the interactions/coexistence relations among species within the copepod guild. Modularity analysis identified three and four sub-communities in P1 and P2, respectively. Membership in a module is coded by the color of the node. Intra-module links have the color of the module itself, while inter-module links are mixed in color. The thickness of the links represents the significance of the species co-occurrence.
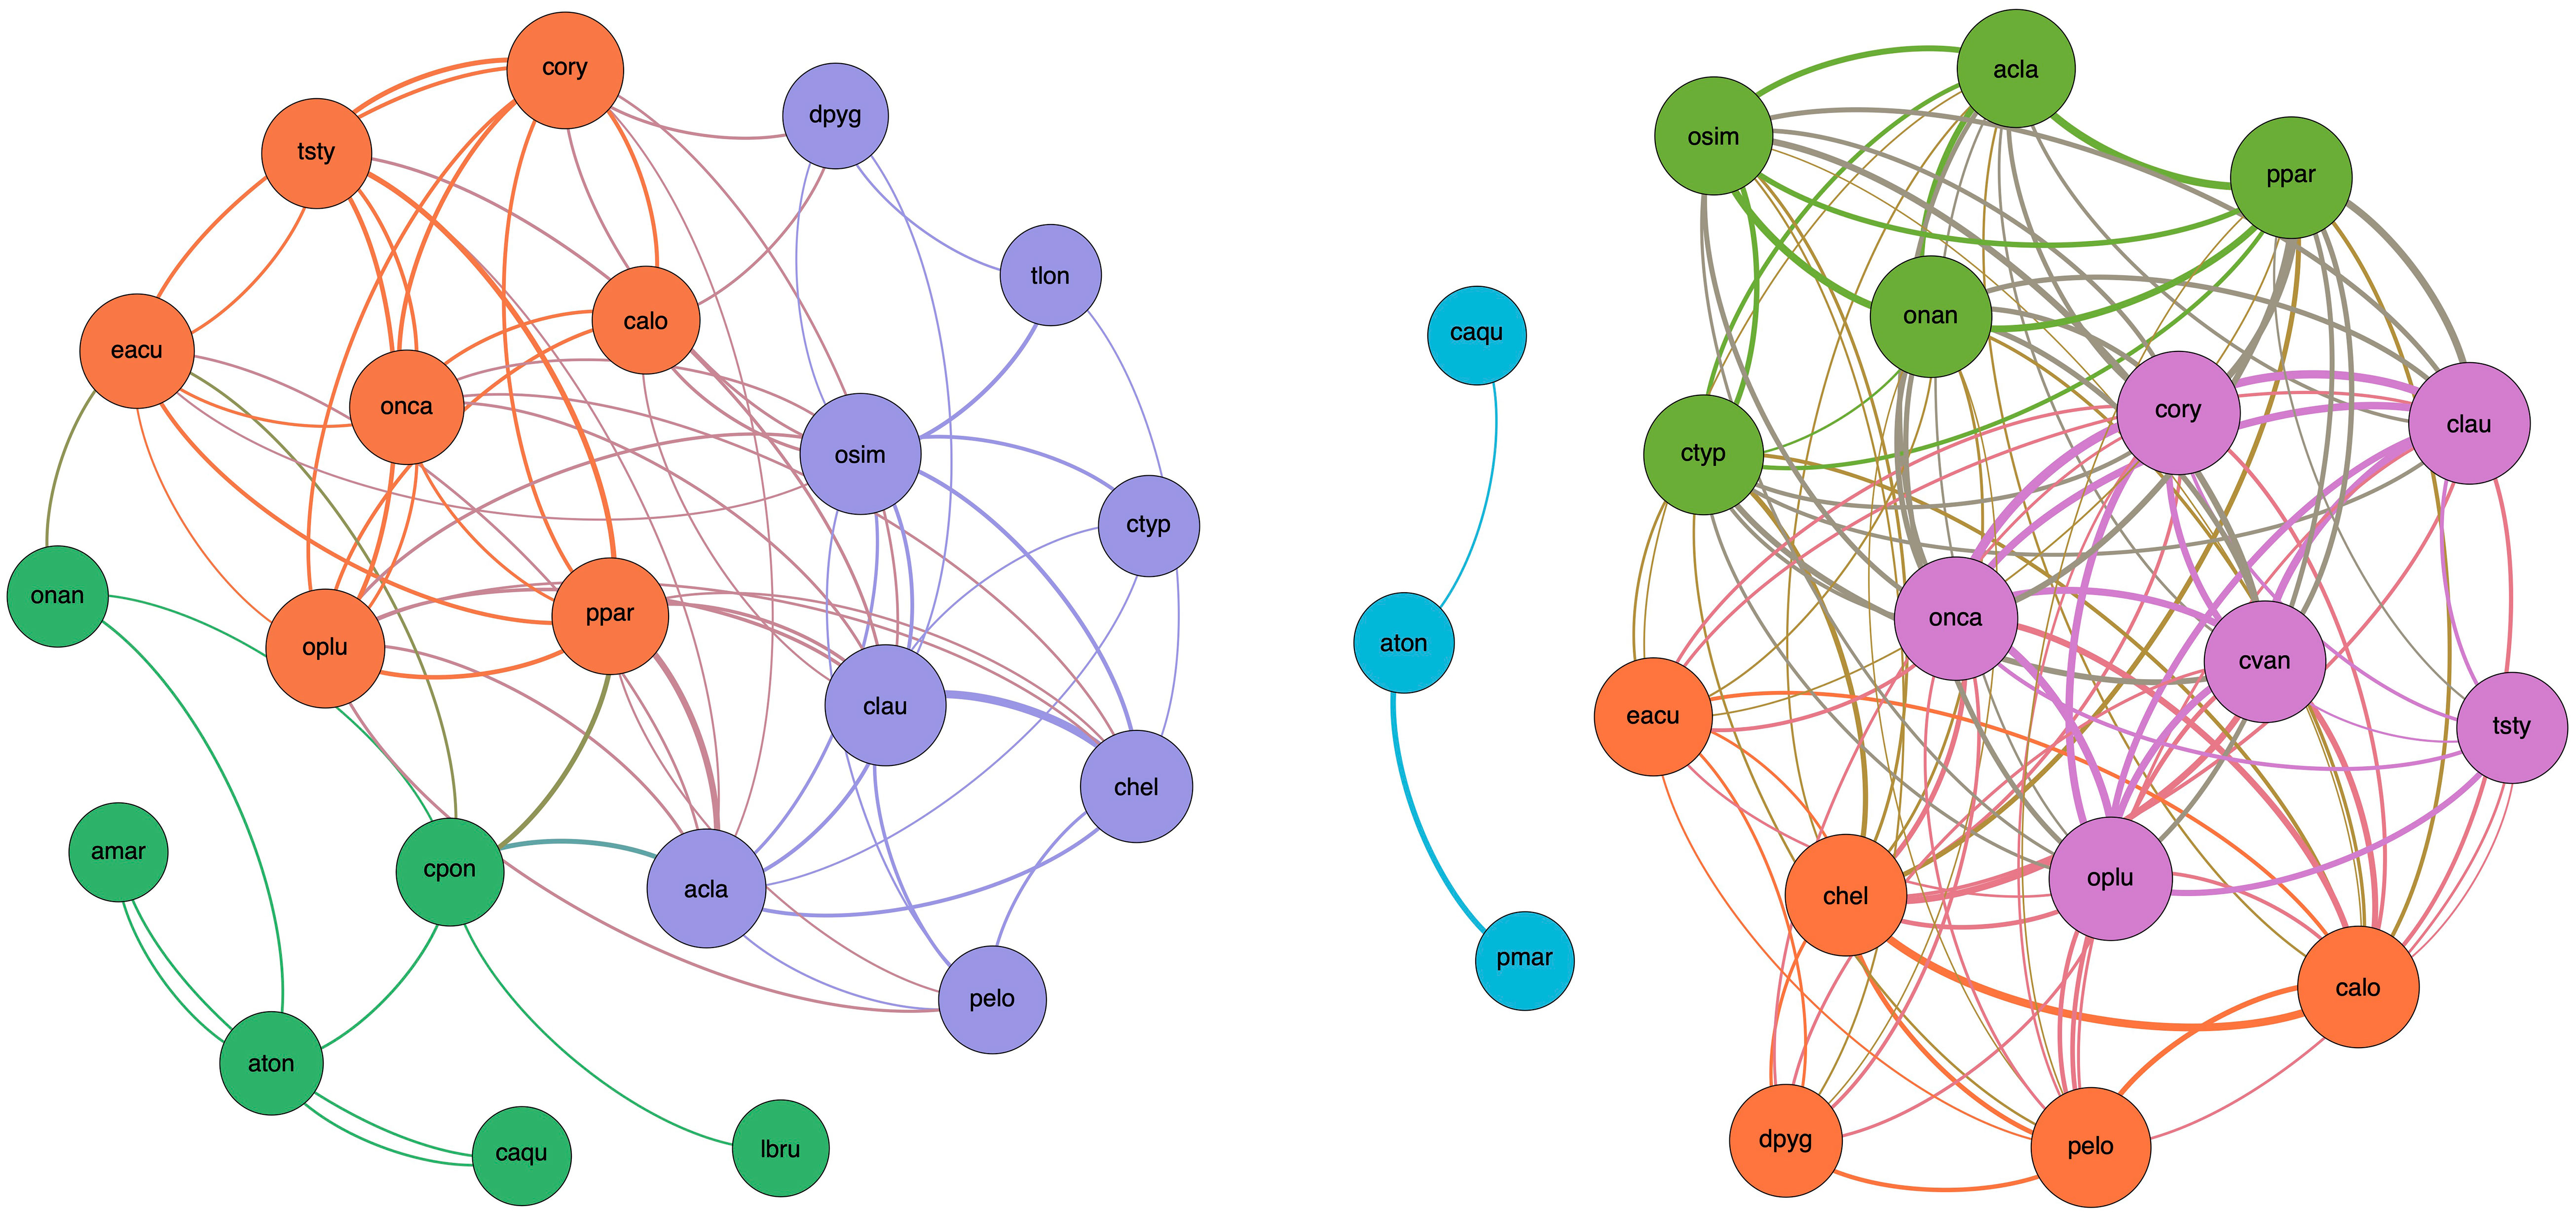
Figure 11 Network of significant taxon co-occurrence within the copepod guild in P1 (left panel) and P2 (right panel). A link (edge) is established between two species (nodes) when their Spearman’s rank coefficient is positive (ρ > 0.1) and significant (p < 0.05). The thickness of edges is proportional to the strength of the relation (ρ). The size of each node is proportional to its degree (i.e., the number of edges departing from that node). The color of a node encodes its membership to a specific module (sub-community of species). Edges that connect species belonging to the same sub-community (i.e., intra-module links) have the color of the sub-community. Edges that connect species belonging to two different sub-communities (i.e., inter-module links) have the color obtained by mixing the two colors of the sub-communities. Only species with at least one significant link are represented (P. latisetosa in P1 and A. margalefi, T. longicornis, and L. brunescens in P2 are skipped, respectively).
It is interesting to note that modules (sub-communities) include species that present and share a certain functional affinity and convergence of traits. For example, in P1, marine species gather together around A. clausi (blue module) whereas more brackish species or extremely euryhaline ones group with A. tonsa (green module). The third sub-community (orange module) includes mainly marine taxa with a co-occurrence pattern that reflects functional diversity and complementarity, presumably stimulated by habitat heterogeneity, niche differentiation, and trophic specialization.
In P2, the brackish module (blue) is broken apart. This is due to the module membership reconfiguration (e.g., O. nana) or occurrence reduction (Labidocera brunescens) of some species. Noteworthy is the case of C. ponticus, a species found only within the lagoon, which is the unique species/node belonging to the brackish module of Period 1 serving as connector with both other sub-communities. Though its occurrence was approximately the same in the two periods (44% and 39% in P1 and 2, respectively), its “disappearance” from the network in P2 is due to the relevant weakening of its inter-module co-occurrence pattern (rho < 0.1) with species to which it was linked in P1 (mainly A. clausi, Euterpina acutifrons, and P. parvus group) perhaps depending on its trophic specialization leading to competitive infra-module interaction with the dominant A. tonsa. The other two modules of the P1 network recombine into three sub-communities in the P2 network (green, orange, and violet modules) exhibiting an extremely dense species co-occurrence pattern so that every species becomes a connector within the sub-network. This possibly reveals the existence of interlaced trophic routes and increases the redundancy of the energy pathways in the sub-network.
Table 3 compares the global topological features of the P1 and P2 networks. A small reduction in the number of nodes contrasts with a significant increase in the number of edges (+150%) and higher transitivity in P2 than P1 suggests that the network shifted towards an internal organization containing more densely intra-connected sub-communities. Node clustering increases the local robustness of the P2 network but results in the overall presence of fewer bridges between these clusters and thus leads to possible network fragmentation (as in the case of the failure of node C. ponticus and the disconnection of the brackish module). Comparing P1 and P2, average density and average degree almost doubled and conversely average path length and network diameter roughly halved. Therefore, patterns of species co-occurrence became shorter and mass transport is presumably organized in shorter or less efficient webs. The null algebraic connectivity for the P2 network confirms that it is disconnected. Moreover, natural connectivity strongly increased in P2 compared to P1, suggesting an increased redundancy of alternative routes among nodes.
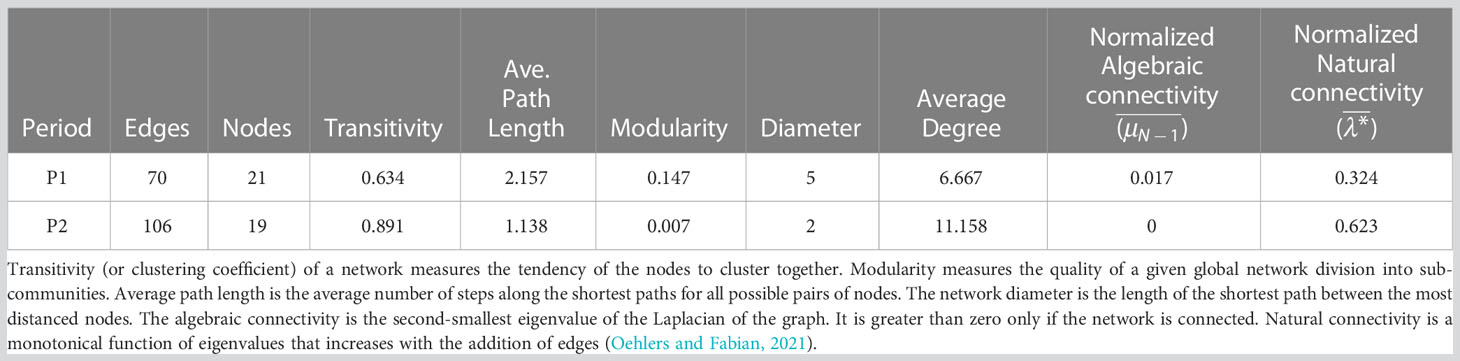
Table 3 Global topological features of the P1 and P2 copepod network.
Topology features at the node level of the P1 and P2 networks are compared in Figure 12 by considering the communities subdivided in blocks of species according to their rank as indicated in Table 2.
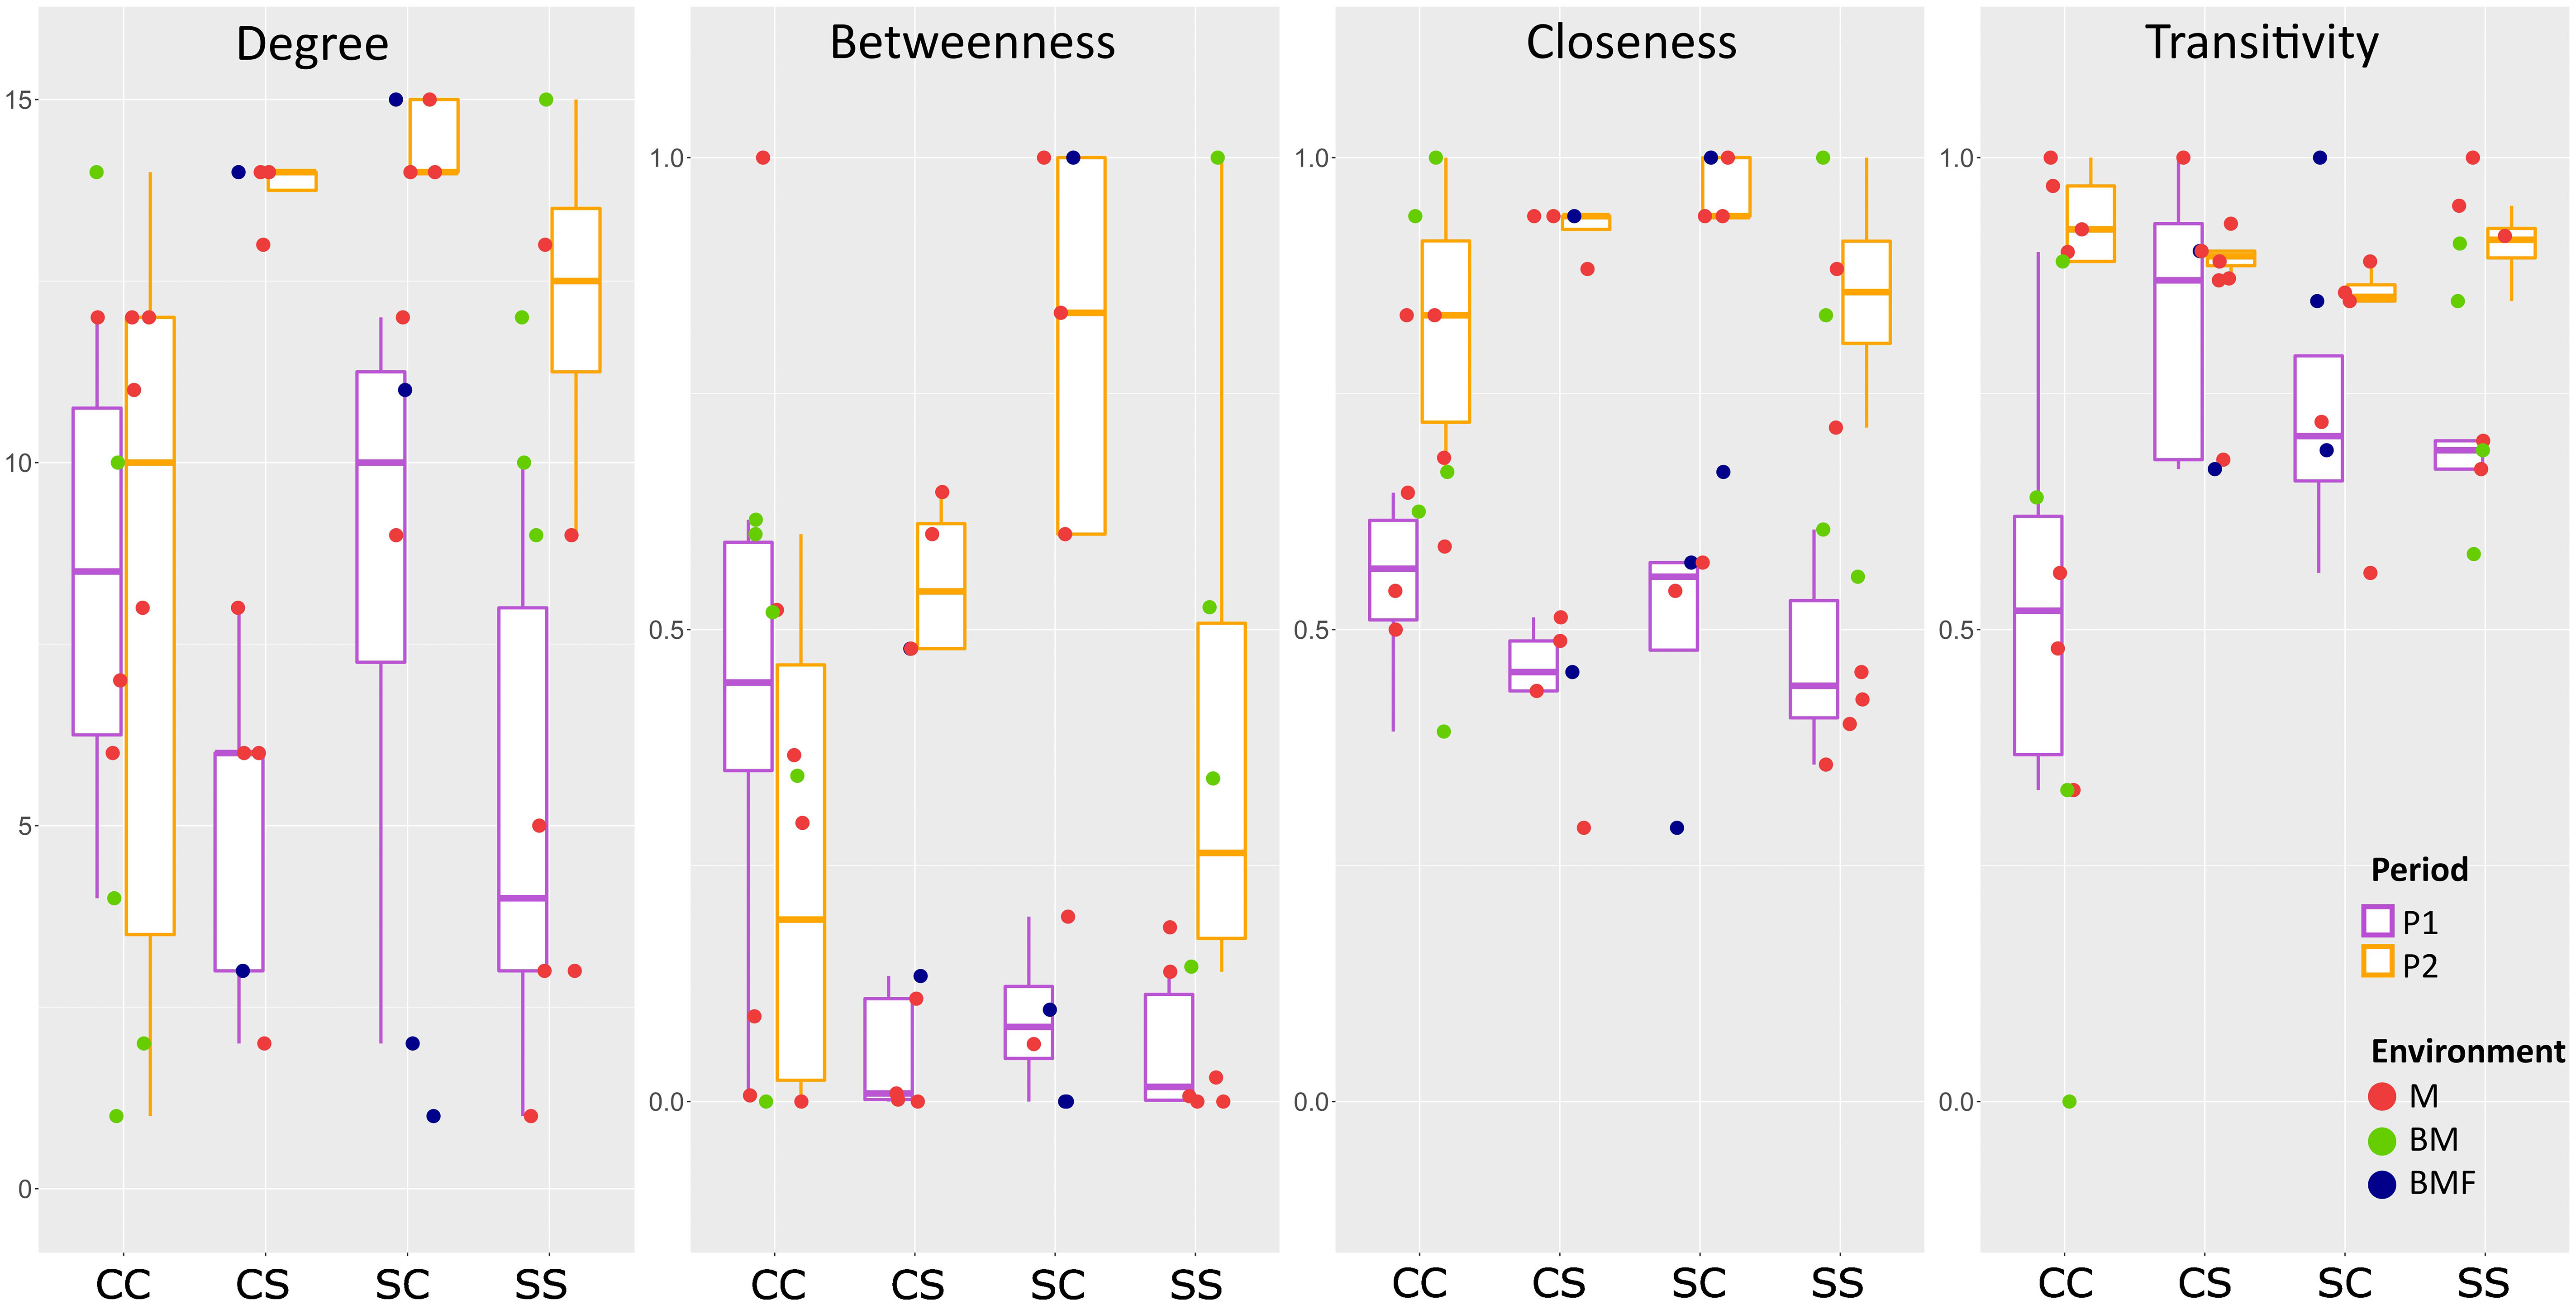
Figure 12 Node topological features of the P1 and P2 copepod networks. Communities are subdivided in blocks of species according to species rank in Table 2. Four centrality metrics have been calculated for each node/species in the two networks. (1) Node degree: The degree of a node is the number of links departing from that node. (2) Normalized Betweenness Centrality: Betweenness measures the number of times each node lies on the shortest path between any pair of nodes. The value is then scaled to the maximum range of betweenness for the network in question. (3) Closeness centrality: Closeness measures how short the shortest paths are from each node to all other nodes. (4) Node transitivity: Transitivity (or local clustering coefficient) of a node is the proportion of the connections among its neighbors, which are actually realized compared to the number of all possible connections. CC: Block1, species that maintain the core rank in both P1 and P2; CS: Block 2a, core species in P1 that become satellite in P2; SC: Block 2b, satellite species in P1 that acquire the core rank in P2; SS: Block 3, satellite species in both P1 and P2. M, marine; BM, marine, brackish; BMF, marine, brackish, freshwater.
Species belonging to Block 2 have a higher degree and betweenness in P2 than in P1. In particular, for those that lose the “core” role and become “satellite” (rank “c” in P1 and “s” in P2, respectively), the increase is significant both for the degree (p < 0.05, K-W test) and for betweenness (p < 0.05, K-W test). Interestingly, the species of Block 1 (rank “c” in both P1 and P2) exhibit an overall though not significant decrease in betweenness between P2 and P1 (i.e., in the internal re-adjustment of the community, they presumably have less influence on mass and energy flows). Among these in particular is the keystone marine species A. clausi. All blocks of species show a significantly higher closeness in P2 than in P1 (p < 0.05, K-W test), whereas no species block shows a significant change in transitivity.
This study depicts the patterns of the zooplankton assemblages in the Venice Lagoon over a period of 25 years in the context of a long-term drift of the most relevant habitat forcings. This has been achieved by comparing the zooplankton and copepod community structures, shown in two 20-year-apart 3-year periods (P1: 1998–2001 and P2: 2018–2021). Although the most relevant features were maintained in space and time, several clear changes emerged in the internal arrangement and species organization, suggesting that temperature increase and lagoon marinization are the main players in modulating the species settlement and interrelations. The challenge we faced was therefore to understand whether and how the long-term slow variation of these two parameters was received by the community and modulated its structure. To answer the question, we tested a mixed approach, combining traditional techniques of community structure comparison with the novel community representation via species coexistence network applied for the first time to planktonic Copepoda. Driving forces such as temperature and salinity have very high dynamics (temperature in time and salinity in space) because they depend primarily on the season and on the tide, respectively. With long-term observations, slow dynamics that are usually masked by strong short-term dynamics are best captured by the consolidated community structure, which is recorded in the coexistence network topology, and its changes over time and can be easily translated into measurable indicators.
Considerable evidence on a global scale points out significant changes in different geographic areas and habitats, the causes of which are mainly ascribable to anthropic and climatic forcing (Newton et al., 2014). Sea surface warming is a largely acknowledged effect of climate change at planetary and local scale (Nykjaer, 2009; Amos et al., 2017; Mondal and Lee, 2023). Our updated estimate on the 25-year LTER monthly time series (1997–2021) of water temperature indicates an overall warming trend of 0.96°C per decade at Lido inlet, which is consistent with previous findings (Amos et al., 2017) stating that after a cooling tendency up to 2004, the warming accelerated after 2008.
As for salinity, previous studies pointed out that tidal flushing dominates the process of distributing the available freshwater inputs (Umgiesser and Zampato, 2001; Ghezzo et al., 2011) and proved that spatial patterns of salinity within the lagoon were maintained in a quasi-stationary condition from year to year in the last decades of the 20th century and at least up to 2009 (Zirino et al., 2014). On the other hand, our analyses suggest that salinity anomalies in the internal areas were markedly positive since 2015. Hence, we can conclude that the dilution effect of marine water exerted by the available freshwater inputs within the lagoon diminished in recent years (P2). In other words, throughout the last 25 years, the zooplankton community, and biota in general, has experienced a slow shift towards the marinization of the habitat within the lagoon. Of course, we do not know whether this effect will be a permanent or transitory feature, though we can expect a further increase in sea levels and more relevant consequences of drought.
Our findings suggest that temperature and salinity drifts induced a rearrangement in the intermediate ranks of the copepod community with the exception of a small group of species whose relevance remained unchanged in both P1 and P2 periods. Some species, characterizing intermediate lagoon areas in P1, became satellites in P2. Conversely, former satellite species became core species in P2 when the lagoon featured more marine influence. In particular, we observed a clear decrease of the mean abundance of lagoon copepod species Oithona nana, Acartia margalefi, and Paracartia latisetosa, commonly found in the Venice Lagoon in historical collections, and a concurrent increase of the neritic/marine taxa such as Oncaeidae, Clausocalanus spp., Oithona plumifera, C. vanus, and P. marinus.
In P1 (1998–2001), the copepod community presents a well-defined group of species of inland areas, typical of more trophic and diluted waters (e.g., Acartia tonsa, A. margalefi, and Calanipeda aquaedulcis). These species are never found in the nearby Adriatic Sea (Camatti, personal communication). Furthermore, P1 points out a direct link between the aforementioned species and C. ponticus and O. nana, which, together with A. tonsa, characterize the Venice Lagoon communities of the considered period (Camatti et al., 2019; Pansera et al., 2021). Conversely, in P2 (2018–2021), a very different picture emerges with a new core of species, indicators of coastal marine waters, otherwise aggregated and interconnected only with each other. Co-occurrence network analysis confirmed a weakening of the inter-module connections in P2. This highlights the key role that connectors (i.e., species connecting distinct sub-communities) play in fostering/hampering the propagation of different ecological perturbations (climate trends, alien invasions, trophic cascades, etc.) from one sub-community to another. Furthermore, since it has been suggested that trophic specialization causes modularity (Prado and Lewinsohn, 2004), the network structure that translates the realized niche can help in identifying affinities in functional trophic traits that have been stimulated in P2 to better adapt to the drifts of the habitat.
The most typical species of internal lagoon environments seem to undergo, more than others, the change triggered by the current thermal and water regimes and by the probable consequent change of the trophic interaction between different taxa. It is also interesting to note how the newly introduced species, P. marinus, considered a “weed species’’ from the point of view of its ability to spread and adapt to new habitats (Uttieri et al., 2020), appears as a new stable component of the typical lagoon community. O. nana, the other typical species, is more abundant near the inlets of the lagoon compared to the past. This agrees with recent studies showing how, in recent years, the newly introduced congener Oithona davisae has occupied the niche left by the indigenous O. nana (Pansera et al., 2021), which, in fact, in P2 has become a satellite in inland areas. It is therefore possible that the habitat drift induced by climate trend has favored colonization by new species.
The P2 period (2018–2021) represents a climatic watershed in which the increase in average water temperature and positive salinity anomalies seems to have forced the lagoon zooplankton communities towards a different equilibrium characterized by a clearer separation between species related to different habitats as well as a remodeling of the connections between species. This is consistent with what seems to have happened in other areas of the world, including the Mediterranean Sea (Richardson, 2008; Brugnano et al., 2011; Berline et al., 2012; Mackas et al., 2012; Mazzocchi et al., 2012; Chaalali et al., 2013; Rice et al., 2015; Belmonte et al., 2018; Annabi-Trabelsi et al., 2019; Grainger and Levine, 2022; Zhang et al., 2022).
Climate change has been found to have multiple effects on species, communities, and ecosystem functioning in different aquatic ecosystems with cascading effects on species interactions, trophic dynamics, and ecosystem function (Wrona et al., 2006; Weiskopf et al., 2020; Viitasalo and Bonsdorff, 2022). Variations not only in temperature, salinity, oxygen, and pH, but also in nutrient concentrations influence biogeochemical processes and consequently the food chain: the prolonged persistence of water temperatures above a certain threshold detected and quantified in our study may have had repercussions on the entire planktonic community, from micro- to mega-plankton, because it influences the physiology of each species in a different way and therefore the resulting composition of the community.
As compared to P1, in the last two decades, water transparency exhibited a general increase (this study), and in parallel, chlorophyll-a (this study) and nutrients (Bernardi Aubry et al., 2021) have decreased. This supports the hypothesis of the ongoing lagoon marinization process and the changes in trophic conditions (Acri et al., 2020). In the work of Cruz et al. (2020), salinity was identified as the main factor inducing the increase in the abundances of several zooplankton taxa or in the production of the calanoid copepod Acartia clausi, a species with marine affinity, as also reported by Williams (2001). Our observations are consistent with this. Future hotter and drier summers due to climate change are expected to push the lagoon system towards conditions of even warmer and saltier waters, increasingly affecting the mesozooplankton community and probably the entire food chain with changes in species composition.
For example, in recent years, especially in summer, the higher temperature and the high consumption of nutrients have increased the presence of gelatinous organisms, particularly jellyfish and large quantities of M. leidyi, both in the Adriatic and in the lagoon of Venice (Schroeder et al., 2023). M. leidyi, a voracious predator of fish larvae and eggs, and phyto- and zooplankton, has created serious problems in the fishing of small pelagics (Shiganova, 1997) in the Black Sea and in closed and relatively small basins such as the lagoons of Venice, Grado, and Marano, also by clogging the fishermen’s nets and compromising fishing operations. In this regard, as the period of blooming of M. leidyi mostly coincides with the increase in zooplankton abundance, the impact M. leidyi can have is concerning. M. leidyi’s diet is variable and often reflects the composition of ambient prey and Copepoda often dominate the diet of M. leidyi, but meroplanktonic larvae are also consumed, hence a composition that characterizes a typical lagoon community. Recently, Schroeder et al. (2023) found that Copepoda and Cladocera were less represented in the gut content than in situ, while meroplanktonic groups such as decapod and mollusk larvae were more abundant in the gut content, indicating a preferential feeding on the latter ones, indicating that in the Venice Lagoon, M. leidyi’s impact may be greater on the meroplanktonic compartment, and consequently on the mussel, clam, and crab fishery and aquaculture.
In this study, among the copepod species permanently residing in the lagoon, A. tonsa emerged as the most resilient copepod, confirming its ecological plasticity. Nevertheless, P2 data are reporting a decrease in the dominance of A. tonsa compared to A. clausi, and an increase in the presence of species belonging to the genus Oithona. Almost all copepods are generalist with many species that show a trophic preferential regime depending on trophic conditions (Bjornberg, 1981). Daufresne et al. (2009) outline the mechanisms by which, at the community level, changes in the proportions between organisms of different sizes, in favor of smaller ones, or shifts in diversity are acquired. We provided evidence of the switch from core (in P1) to satellite rank (in P2) of two large-sized species (average length > 1 cm): C. helgolandicus and Pseudocalanus elongatus, thus endorsing other findings such that even in eutrophic systems, where food is not limiting, a continued increase in temperature could result in a smaller-sized copepod community. This is also consistent with predictions of the impact of climate change on aquatic ectotherms (Rice et al., 2015). Mäkinen et al. (2017) attributed the decline of large calanoid copepods to change of regimes of salinity and temperatures and still Rice and co-authors, in their work on Central Basin of Long Island Sound (LIS) from the late 1940s until 2012, indicate that in the early 1950s, there has been a concurrent decrease in the mean size of the dominant copepod species A. tonsa and A. hudsonica, an increase in the proportion of the small copepod Oithona sp., and the disappearance of the two largest-sized copepod genera from the 1950s.
Resilience, which implies the internal reorganization of a community to maintain functions, appears at the moment of action to prevent a catastrophic collapse typical of the tipping points of nonlinear systems. Though the copepod community does not seem to have changed its state, some important modifications of structure and assembly mechanisms have already been observed.
The extension of the marine influence within the lagoon has compressed the spatial gradients of the habitat and created a greater segregation of the niches available to some typically estuarine taxa and broadened and strengthened the interactions between marine species. At the global topology level, this is recorded by the disconnection of the P2 co-occurrence network and the relevant increase of the natural connectivity. At the node topology level, the readjustment of species roles in P2 community appears as a generalized increase in the closeness of each species and as an increase in the degree and betweenness of the species that experienced a decrease in importance, switching from “core” to “satellite” rank in the community.
According to our study, in the Venice Lagoon, the increasing trend of temperatures and in particular the noticeable prolonged persistence over threshold of high summer temperature is stimulating a shift in the copepod community composition towards smaller species; furthermore, the strong non-selective predatory pressure of the invasive ctenophore M. leidyi, regularly present in the lagoon in summer–autumn of recent years, could be the main cause of the reduction of the abundance of copepods and other groups, and it could have contributed, together with the increase of temperature and salinity, to weaken some connections especially between lagoon species.
The ongoing “disturbance” processes in the Venice Lagoon and the surrounding areas are certainly not concluded. It can also be assumed that the direction of the applied “disturbance” has been monotonic for some decades now; therefore, forms of “disturbance” recovery are not expected.
The changes in the zooplankton community are the result of cascading synergistic interactions, but should we, or can we, refer them to natural or anthropogenic variability? Wanting to project the results of this study onto a vision linked to the identification of the main drivers of change triggered by natural or anthropogenic forces, the observed effects are, at the moment, mainly of indirect anthropogenic nature. The long-term comparison of zooplankton communities has revealed an ongoing internal rearrangement. Thinking in terms of climatic changes and extreme event scenarios, it can be hypothesized that some phenological traits or the presence of critical species such as M. leidyi could trigger responses in terms of modification of the dynamics and dominance of some species over others, with important trade-offs at the level of the trophic network and ecosystem services.
The datasets presented in this article are not readily available because the data are at the ISMAR-CNR repositories and could be made available by the authors upon request. Requests to access the datasets should be directed to EC,ZWxpc2EuY2FtYXR0aUBpc21hci5jbnIuaXQ=.
EC designed the experiment and conceived the idea of the study. FA, EC, AL, NN, MP, and AS performed the samplings and all the laboratory activities. EC and AB conceptualized and drafted the manuscript. EC, AB, and AS contributed to the data processing. All authors contributed to interpretation of the results, to the discussion, to the revision, and to the finalization of the manuscript. All authors contributed to the article and approved the submitted version.
The research activities were carried out in the framework of the Italian Long-Term Ecological Research network LTER-Italy, with no specific dedicated funding. For the years 2019–2020–2021, some scientific activity was performed in the Research Programme Venezia 2021, coordinated by CORILA, with the contribution of the Provveditorato for the Public Works of Veneto, Trentino Alto Adige, and Friuli Venezia Giulia and was also supported by the SNAPSHOT (Synoptic Assessment of Human Pressures on key Mediterranean Hot Spots) project, funded by the Department of Earth System Science and Environmental Technologies, CNR (Italy).
The lagoon of Venice is included in the Italian (LTER-Italy), European (LTER-Europe), and International (LTER- International) Long-Term Ecological Research (LTER) networks: the time series analyzed in this paper was gathered in the context of these networks. The authors wish to thank Fabrizio Bernardi Aubry and Loris Dametto for their technical support during samplings and fieldwork, and the crew of the M/B “Litus” Mauro Penzo, Daniele Penzo, Gianni Zennaro, and Roberto Vianello.
The authors declare that the research was conducted in the absence of any commercial or financial relationships that could be construed as a potential conflict of interest.
All claims expressed in this article are solely those of the authors and do not necessarily represent those of their affiliated organizations, or those of the publisher, the editors and the reviewers. Any product that may be evaluated in this article, or claim that may be made by its manufacturer, is not guaranteed or endorsed by the publisher.
Acri F., Bernardi-Aubry F., Berton A., Bianchi F., Boldrin A., Camatti E., et al. (2004). Plankton communities and nutrients in the Venice lagoon: comparison between current and old data. J. Mar. Systems. 51, 321–329. doi: 10.1016/j.jmarsys.2004.05.019
Acri F., Braga F., Bernardi Aubry F. (2020). Long-term dynamics in nutrients, chlorophyll a and water quality parameters in the lagoon of Venice. Scientia Marina 84 (3), 215–225. doi: 10.3989/scimar.05022.30A
Alberotanza L., Carbognin L., Cova P., Ramasco C., Taroni G., Zucchetta G. (1991). “A water pollution study of the Venice lagoon,” in Water pollution: modelling, measuring and prediction. Eds. Wrobel L. C., Brebbia C. A. (Springer, Dordrecht), 481–496. doi: 10.1007/978-94-011-3694-5_34
Amos C. L., Umgiesser G., Ghezzo M., Kassem H., Ferrarin C. (2017). Sea Surface temperature trends in Venice lagoon and the adjacent waters. J. Coast. Res. 33 (2), 385–395. doi: 10.2112/JCOASTRES-D-16-00017.1
Annabi-Trabelsi N., El-Shabrawy G., Goher M. E., Subrahmanyam M. N. V., Al-Enezi Y., Ali M., et al. (2019). Key drivers for copepod assemblages in a eutrophic coastal brackish lake. Water 11, 363. doi: 10.3390/w11020363
Armeli M., Piredda R., Quero G. M., Finotto S., Bernardi Aubry F., Bastianini M., et al. (2019). Habitat heterogeneity and connectivity: effects on the planktonic protist community structure at two adjacent coastal sites (the lagoon and the gulf of Venice, northern Adriatic Sea, Italy) revealed by metabarcoding. Front. Microbiol. 10. doi: 10.3389/fmicb.2019.02736
Aurelle D., Thomas S., Albert C., Bally M., Bondeau A., Boudouresque C. F., et al. (2022). Biodiversity, climate change, and adaptation in the Mediterranean. Ecosphere 13 (4), e3915. doi: 10.1002/ecs2.3915
Bandelj V., Socal G., Park Y. S., Lek L., Coppola J., Camatti E., et al. (2008). Analysis of multitrophic plankton assemblages in the lagoon of Venice. Mar. Ecol. Prog. Ser. 368, 23–40. doi: 10.3354/meps07565
Bastian M., Heymann S., Jacomy M. (2009). “Gephi: an open source software for exploring and manipulating networks,” in Proceedings of the International AAAI Conference on Web and Social Media. (San Jose, California, USA: PKP Publishing Services Network), 3. 361–362. doi: 10.1609/icwsm.v3i1.13937
Belmonte G., Moscatello S., Hajdëri E., Vaglio I., Denitto F. (2018). Composition and spatial distribution of mesozooplankton along confinement and anthropogenic-impact gradients in the gulf of vlorë (Albania). J. Coast. Res. 34 (1), 174–184. doi: 10.2112/JCOASTRES-D-16-00103.1
Berline L., Siokou-Frangou I., Marasović I., Vidjak O., Luz Fernández de Puelles M., Mazzocchi M. G., et al. (2012). Intercomparison of six Mediterranean zooplankton time series. Prog. Oceanography 97–100, 76–91. doi: 10.1016/j.pocean.2011.11.011
Bernardi Aubry F., Acri F., Finotto S., Pugnetti A. (2021). Phytoplankton dynamics and water quality in the Venice lagoon. Water 13, 2780. doi: 10.3390/w13192780
Bianchi F., Acri F., Alberighi L., Bastianini M., Boldrin A., Cavalloni B., et al. (2000). “Biological variability in the Venice lagoon,” in The Venice lagoon ecosystem. inputs and interactions between land and Sea. Eds. Lasserre P., Marzollo A. (Paris: UNESCO and Parthenon Publishing Press), 97–126.
Bianchi F., Acri F., Bernardi Aubry F., Berton A., Boldrin A., Camatti E., et al. (2003). Can plankton communities be considered as bio indicators of water quality in the lagoon of Venice? Mar. pollut. Bull. 46, 964–971. doi: 10.1016/S0025-326X(03)00111-5
Bjornberg T. K. S. (1981). Copepoda. In: Atlas del zooplancton del atlántico sudoccidental y métodos de trabajo con zooplancton marino. Eds. Plata M. d., Boltovskoy D. (INIDEP), 587–679.
Blondel V. D., Guillaume J. L., Lambiotte R., Lefebvre E. (2008). Fast unfolding of communities in large networks. J. Stat. Mechanics: Theory Experiment. 10, 1000. doi: 10.1088/1742-5468/2008/10/P10008
Boltovskoy D. (1981). Atlas del Atlántico sudoccidental y métodos de trabajo con el zooplankton marino. Ed. Boltovskoy D. (Argentina: INIDEP), 1–935.
Brugnano C., D’Adamo R., Fabbrocini A., Granata A., Zagami G. (2011). Zooplankton responses to hydrological and trophic variability in a Mediterranean coastal ecosystem (Lesina lagoon, south Adriatic Sea). Chem. Ecol. 27 (5), 461–480. doi: 10.1080/02757540.2011.579962
Buitenhuis E., Le Quéré C., Aumont O., Beaugrand G., Bunker A., Hirst A., et al. (2006). Biogeochemical fluxes through mesozooplankton. Glob. Biogeochem. Cycles. 20, GB2003. doi: 10.1029/2005GB002511
Camatti E., Comaschi A., Socal. G. (2006). “Ciclo annuale del mesozooplancton,” in Atlante della laguna. venezia tra terra e mare. Eds. Guersoni S., Tagliapietre D. (Venezia: Marsilio Editori).
Camatti E., Pansera M., Bergamasco A. (2019). The copepod Acartia tonsa Dana in a microtidal Mediterranean lagoon: history of a successful invasion. Water 11 (6), 1200. doi: 10.3390/w11061200
Chaalali A., Chevillot X., Beaugrand G., David V., Luczak C., Boët P., et al. (2013). Changes in the distribution of copepods in the gironde estuary: a warning and marinisation con- sequence? Estuarine Coast. Shelf Sci. 134 (9), 150–161. doi: 10.1371/jour-nal.pone.0074531.hal-00936311
Comaschi A., Acri F., Bianchi F., Bressan M., Camatti E. (2000). Temporal changes of species belonging to the Acartia genus (Copepoda: calanoida) in the northern basin of the Venice lagoon. Boll. Mus. Civ. Stor. Nat. Venezia 50, 189–193.
Costanza R., D’Arge R., De Groot R., Farber S., Grasso M., Hannon B., et al. (1997). The value of the world’s ecosystem services and natural capital. Nature 387, 253–260.
Cruz J., Teodósioa M. A., Susana Garridob S., Ben-Hamadouc R., Chícharoe L., Réd P., et al. (2020). Plankton community and copepod production in a temperate coastal lagoon: what is changing in a short temporal scale? J. Sea Res. 157, 1–12. doi: 10.1016/j.seares.2020.101858
Cucco A., Umgisser G. (2006). Modeling the Venice lagoon residence time. Ecol. Modeling 193, 34–51. doi: 10.1016/j.ecolmodel.2005.07.043
Dam H. G., Roman M. R., Youngbluth M. J. (1995). Downward export of respiratory carbon and dissolved organic nitrogen by diel migrant mesozooplankton at the JGOFS Bermuda time series station. Deep-Sea Res. I 42, 1187–1197. doi: 10.1016/0967-0637(95)00048-B
Daufresne M., Lengfellner K., Sommer U. (2009). Global warming benefits the small in aquatic ecosystems. Proc. Natl. Acad. Sci. 106, 12788–12793. doi: 10.1073/pnas.0902080106
De Cáceres M., Legendre P., Moretti M. (2010). Improving indicator species analysis by combining groups of sites. Oikos 119, 1674–1684. doi: 10.1111/j.1600-0706.2010.18334.x
Dufrene M., Legendre P. (1997). Species assemblages and indicator species: the need for a flexible asymmetrical approach. Ecol. Monogr. 67 (3), 345–366. doi: 10.1890/0012-9615(1997)067[0345:SAAIST]2.0.CO;2
Ferrarin C., Ghezzo M., Umgiesser G., Tagliapietra D., Camatti E., Zaggia L., Sarretta A., et al. (2013). Assessing hydrological effects of human interventions on coastal systems: numerical applications to the Venice Lagoon. Hydrol. Earth Syst. Sci. 17, 1733-1748. doi: 10.5194/hess-17-1733-2013
Gačić M., Kovačević V., Mancero Mosquera I., Mazzoldi A., Cosoli S. (2005). Water fluxes between the Venice lagoon and the Adriatic sea. flooding and environmental challenges for Venice and its lagoon: state of knowledge. Eds. Fletcher C. A., Spencer D. T. (Cambridge, UK: Cambridge University), 431–444.
Ghezzo M., Sarretta A., Sigovini M., Guerzoni S., Tagliapietra D., Umgiesser G. (2011). Modeling the inter-annual variability of salinity in the lagoon of Venice in relation to the water framework directive typologies. Ocean Coast. Manage. 54, 706–719. doi: 10.1016/j.ocecoaman.2011.06.007
Grainger T. N., Levine J. M. (2022). Rapid evolution of life-history traits in response to warming, predation and competition: a meta-analysis. Ecol. Lett. 25, 541–554. doi: 10.1111/ele.13934
Grasshoff K., Ehrhardt M. (1976). “Automated chemical analysis,” in Methods of seawater analysis. Ed. Grasshoff K. (Weinheim: Verlag Chemie), 263–297.
Hansen H. P., Koroleff F. (1999). “Determination of nutrients,” in Methods of seawater analysis. Eds. Grasshoff K., K. Cremling K., Erhardt M. (Weinheim: Verlag Chemie), 159–1228.
Helden A. J. (2021). Core and occasional species: a new way forward. Ecol. Evol. 11, 10547–10565. doi: 10.1002/ece3.7863
Henderson P. A., Seaby R. M. H., Somes J. R. (2011). Community level response to climate change: the long-term study of the fish and crustacean community of the Bristol channel. J. Exp. Mar. Biol. Ecol. 400 (1– 2), 78–89. doi: 10.1016/j.jembe.2011.02.028
IPCC (2007) Climate change 2007: impacts, adaptation and vulnerability. Available at: https://www.ipcc.ch/site/assets/uploads/2018/03/ar4_wg2_full_report.pdf.
IPCC (2013) Summary for policy makers. Available at: http://www.ipcc.ch/report/ar5/wg1/.
Lindh M. V., Sjöstedt J., Ekstam B., Casini M., Lundin D., Hugerth L. W., et al. (2017). Metapopulation theory identifies biogeographical patterns among core and satellite marine bacteria scaling from tens to thousands of kilometers. Environ. Microbiol. 19, 1222–1236. doi: 10.1111/1462-2920.13650
Mackas D. L., Greve W., Edwards M., Chiba S., Tadokoro K., Eloire D., et al. (2012). Changing zooplankton seasonality in a changing ocean: comparing time series of zooplankton phenology. Prog. Oceanography 97–100, 31–62. doi: 10.1016/j.pocean.2011.11.005
Magurran A. E., Henderson P. A. (2003). Explaining the excess of rare species in natural species abundance distributions. Nature 422, 714–716. doi: 10.1038/nature01547
Mäkinen K., Vuorinen I., Hänninen J. (2017). Climate-induced hydrography change favours small-bodied zooplankton in a coastal ecosystem. Hydrobiologia 792, 83–96. doi: 10.1007/s10750-016-3046-6
Makris C. V., Tolika K., Baltikas V. N., Velikou K. (2023). The impact of climate change on the storm surges of the Mediterranean Sea: coastal sea level responses to deep depression atmospheric systems. Ocean Model. 181, 102149. doi: 10.1016/j.ocemod.2022.102149
Malej A., Tirelli V., Lučić D., Paliaga P., Vodopivec M., Goruppi A., et al. (2017). Mnemiopsis leidyi in the northern Adriatic: here to stay? J. Sea Res. 124, 10–16. doi: 10.1016/j.seares.2017.04.010
Martínez-Megías C., Rico A. (2022). Biodiversity impacts by multiple anthropogenic stressors in Mediterranean coastal wetlands. Sci. Total Environ. 818, 151712. doi: 10.1016/j.scitotenv.2021.151712
Mazzocchi M. G., Dubroca L., García-Comas C., Di Capua I., Ribera d’Alcalà M. (2012). Stability and resilience in coastal copepod assemblages: the case of the Mediterranean long-term ecological research at station MC (LTER-MC). Prog. Oceanography 97–100, 135–151. doi: 10.1016/j.pocean.2011.11.003
Milan M., Bernardini I., Bertolini C., Dalla Rovere G., Manuzzi A., Pastres R., et al. (2023). Multidisciplinary long-term survey of Manila clam grown in farming sites subjected to different environmental conditions. Sci. Total Environ. 863, 160796. doi: 10.1016/j.scitotenv.2022.160796
Mondal S., Lee M. A. (2023). Long-term observations of Sea surface temperature variability in the gulf of mannar. J. Mar. Sci. Eng. 11, 102. doi: 10.3390/jmse11010102
Newton A., Icely J., Cristina S., Brito A., Cardoso A. C., Colijn F., et al. (2014). An overview of ecological status, vulnerability, and future perspectives of european large shallow, semi-enclosed coastal systems, lagoons, and transitional waters. Estuar. Coast. Shelf Sci. 140, 95–122. doi: 10.1016/j.ecss.2013.05.023
Nykjaer L. (2009). Mediterranean Sea Surface warming 1985–2006. Clim. Res. 39, 11–17. doi: 10.3354/cr00794
Oehlers M., Fabian B. (2021). Graph metrics for network robustness–a survey. Mathematics 9, 895. doi: 10.3390/math9080895
Oksanen J., Blanchet F. G., Friendly M., Kindt R., Legendre P., McGlinn D., et al. (2020) Vegan: community ecology package. r package version 2.5-7. Available at: https://CRAN.R-project.org/package=vegan.
Pansera M., Camatti E., Schroeder A., Zagami G., Bergamasco A. (2021). The non-indigenous Oithona davisae in a Mediterranean transitional environment: coexistence patterns with competing species. Nat. Portfolio 11, 8341. doi: 10.1038/s41598-021-87662-5
Picone M., Distefano G. G., Benhene G. A., Corami F., Basso M., Panzarin L., et al. (2023). Seabirds as biomonitors of mercury bioavailability in the Venice lagoon. Bull. Environ. Contam Toxicol. 110, 2. doi: 10.1007/s00128-022-03650-z
Podani J., Csányi B. (2010). Detecting indicator species: some extensions of the IndVal measure. Ecol. Indic. 10, 1119–1124. doi: 10.1016/j.ecolind.2010.03.010
Prado P. I., Lewinsohn T. M. (2004). Compartments in insect–plant associations and their consequences for community structure. J. Anim. Ecol. 73, 1168–1178. doi: 10.1111/j.0021-8790.2004.00891.x
Ravera O. (2000). The lagoon of Venice : the result of both natural factors and human influence. J. Limnol. 59 (1), 19–30. doi: 10.4081/jlimnol.2000.19
Rice E., Dam H. G., Stewart G. (2015). Impact of climate change on estuarine zooplankton: surface water warming in long island sound is associated with changes in copepod size and community structure. Estuaries Coasts 38, 13–23. doi: 10.1007/s12237-014-9770-0
Richardson A. J. (2008). In hot water: zooplankton and climate change. – ICES. J. Mar. Sci. 65, 279–295. doi: 10.1093/icesjms/fsn028
Rodionov S. N. (2004). A sequential algorithm for testing climate regime shifts. Geophysical Res. Lett. 31, L09204. doi: 10.1029/2004GL019448
Sambo B., Bonato M., Sperotto A., Torresan S., Furlan E., Lambert J., et al. (2023). Framework for multirisk climate scenarios across system receptors with application to the metropolitan city of Venice. Risk Analysis. doi: 10.1111/risa.14097
Schroeder A., Camatti E., Pansera M., Pallavicini A. (2023). Feeding pressure on meroplankton by the invasive ctenophore mnemiopsis leidyi. Biol. Invasions 25, 2007–2021. doi: 10.1007/s10530-023-03023-5
Schroeder K., Chiggiato J., Josey S. A., Borghini M., Aracri S., Sparnocchia S. (2017). Rapid response to climate change in a marginal sea. Sci. Rep. 7 (1), 4065. doi: 10.1038/s41598-017-04455-5
Schroeder A., Stanković D., Pallavicini A., Gionechetti F., Pansera M., Camatti E. (2020). DNA Metabarcoding and morphological analysis-assessment of zooplankton biodiversity in transitional waters. Mar. Environ. Res. 160, 104946. doi: 10.1016/j.marenvres.2020.104946
Sfriso A., Buosi A., Mistri M., Munari C., Franzoi P., Sfriso A. A. (2019). Long-term changes of the trophic status in transitional ecosystems of the northern Adriatic Sea, key parameters and future expectations: The lagoon of Venice as a study case.. Nat. Conserv. 34, 193–215. doi: 10.3897/natureconservation.34.30473
Shiganova T. A. (1997). Mnemiopsis leidyi abundance in the Black Sea and its impact on the pelagic community. In: Özsoy E., Mikaelyan A. (eds) Sensitivity to change: Black Sea, Baltic Sea and North Sea. NATO ASI Series, vol. 27. (Springer, Dordrecht). doi: 10.1007/978-94-011-5758-2_10
Šolić M., Krstulović N., Šantić D., Šestanović S., Kušpilić G., Bojanić N., et al. (2017). Impact of 3°C temperature rise on bacterial growth and carbon transfer towards higher trophic levels: empirical models for the Adriatic Sea. J. Mar. Syst. 173, 81–89. doi: 10.1016/j.jmarsys.2017.01.001
Solidoro C., Bandelj V., Aubry Bernardi F., Camatti E., Ciavatta S., Cossarini G., et al. (2010). Response of the Venice lagoon ecosystem to natural and anthropogenic pressures over the last 50 years. In: Coastal lagoons. Critical habitats of environmental change. Eds. Kennish M. J., Paerl H. W. (CRC Press, New York), 483–511.
Solidoro C., Pastres R., Cossarini G., Ciavatta S. (2004). Seasonal and spatial variability of water quality parameters in the lagoon of Venice. J. Mar. Syst. 51, 7–18. doi: 10.1016/j.jmarsys.2004.05.024
Svetlichny L., Elena Hubareva E., Antonina Khanaychenko A. (2012). Calanipeda aquaedulcis and Arctodiaptomus salinus are exceptionally euryhaline osmoconformers: evidence from mortality, oxygen consumption, and mass density patterns. Mar. Ecol. Prog. Ser. 470, 15–29. doi: 10.3354/meps09907
Tagliapietra D., Sigovini M., Volpi Ghirardini A. (2009). A review of terms and definitions to categorise estuaries, lagoons and associated environments. Mar. Freshw. Res. 60 (6), 497–509. doi: 10.1071/MF08088
Trombetta T., Vidussi F., Roques C., Mas S., Scotti M., Mostajir B. (2021). Co-Occurrence networks reveal the central role of temperature in structuring the plankton community of the thau lagoon. Sci. Rep. 11, 17675. doi: 10.1038/s41598-021-97173-y
Trombetta T., Vidussi F., Roques C., Scotti M., Mostajir B. (2020). Marine microbial food web networks during phytoplankton bloom and non-bloom periods: warming favors smaller organism interactions and intensifies trophic cascade. Front. Microbiol. 11. doi: 10.3389/fmicb.2020.502336
Umgiesser G. (2020). The impact of operating the mobile barriers in Venice (MOSE) under climate change. J. Nat. Conserv. 54, 125783. doi: 10.1016/j.jnc.2019.125783
Umgiesser G., Zampato L. (2001). Hydrodynamic and salinity modeling of the Venice channel network with coupled 1-D–2-D mathematical models. Ecol. Modell. 138, 75–85. doi: 10.1016/S0304-3800(00)00394-X
Uttieri M., Aguzzi L., Aiese Cigliano R., Amato A., Bojanić N., Brunetta M., et al. (2020). WGEUROBUS – working group “Towards a EURopean OBservatory of the non-indigenous calanoid copepod Pseudodiaptomus marinus”. Biol. Invasions 22, 885–906. doi: 10.1007/s10530-019-02174-8
Vecchio A., Anzidei M., Serpelloni E., Florindo F. (2019). Natural variability and vertical land motion contributions in the Mediterranean Sea-level records over the last two centuries and projections for 2100. Water 11, 1480. doi: 10.3390/w11071480
Viitasalo M., Bonsdorff E. (2022). Global climate change and the Baltic Sea ecosystem: direct and indirect effects on species, communities and ecosystem functioning. Earth Syst. Dynam. 13, 711–747. doi: 10.5194/esd-13-711-2022
Weiskopf S. R., Rubenstein M. A., Crozier L. G., Gaichas S., Griffis R., Halofsky J. E., et al. (2020). Climate change effects on biodiversity, ecosystems, ecosystem services, and natural resource management in the united states. Sci. Total Environ. 733, 137782. doi: 10.1016/j.scitotenv.2020.137782
Williams W. D. (2001). Anthropogenic salinization of inland waters. Hydrobiologia 466, 329–337. doi: 10.1023/A:1014598509028
Wrona F. J., Prowse T. D., Reist J. D., Hobbie J. E., Lévesque L. M. J., Vincent W. F. (2006). Climate change effects on aquatic biota, ecosystem structure and function. Ambio 35, 7. doi: 10.1579/0044-7447(2006)35[359:CCEOAB]2.0.CO;2
Yan Q., Deng J., Wang F., Liu Y., Liu K. (2021). Community assembly and Co-occurrence patterns underlying the core and satellite bacterial Sub-communities in the Tibetan lakes. Front. Microbiol. Sec. Syst. Microbiol. 12. doi: 10.3389/fmicb.2021.695465
Zennaro F., Furlan E., Melaku Canu D., Aveytua Alcazar L., Rosati G., Aslan S., et al. (2023). “Evaluation of lagoon eutrophication potential under climate change conditions: a novel water quality machine learning and biogeochemical-based framework,” in EGU general assembly 2023, vol. 24–28. (Vienna, Austria), EGU23–E8409. doi: 10.5194/egusphere-egu23-8409
Zhang C., Brett M. T., Nielsen J. M., Arhonditsis G. B., Ballantyne A. P., Carter J. L., et al. (2022). Physiological and nutritional constraints on zooplankton productivity due to eutrophication and climate change predicted using a resource-based modeling approach. Can. J. Fisheries Aquat. Sci. 79 (3). doi: 10.1139/cjfas-2021-0071
Keywords: zooplankton, copepods, long-term research, transitional ecosystems, habitat drift, warming, co-occurrence network
Citation: Camatti E, Acri F, De Lazzari A, Nurra N, Pansera M, Schroeder A and Bergamasco A (2023) Natural or anthropogenic variability? A long-term pattern of the zooplankton communities in an ever-changing transitional ecosystem. Front. Mar. Sci. 10:1176829. doi: 10.3389/fmars.2023.1176829
Received: 28 February 2023; Accepted: 24 May 2023;
Published: 19 June 2023.
Edited by:
Sabrina Lo Brutto, University of Palermo, ItalyReviewed by:
Ulisses Miranda Azeiteiro, University of Aveiro, PortugalCopyright © 2023 Camatti, Acri, De Lazzari, Nurra, Pansera, Schroeder and Bergamasco. This is an open-access article distributed under the terms of the Creative Commons Attribution License (CC BY). The use, distribution or reproduction in other forums is permitted, provided the original author(s) and the copyright owner(s) are credited and that the original publication in this journal is cited, in accordance with accepted academic practice. No use, distribution or reproduction is permitted which does not comply with these terms.
*Correspondence: Elisa Camatti, ZWxpc2EuY2FtYXR0aUBpc21hci5jbnIuaXQ=
Disclaimer: All claims expressed in this article are solely those of the authors and do not necessarily represent those of their affiliated organizations, or those of the publisher, the editors and the reviewers. Any product that may be evaluated in this article or claim that may be made by its manufacturer is not guaranteed or endorsed by the publisher.
Research integrity at Frontiers
Learn more about the work of our research integrity team to safeguard the quality of each article we publish.