 Yuxiao Zhao1
 Wei Xiang
 Guoqiang Zhong
95% of researchers rate our articles as excellent or good
Learn more about the work of our research integrity team to safeguard the quality of each article we publish.
Find out more
ORIGINAL RESEARCH article
Front. Mar. Sci., 04 August 2023
Sec. Ocean Observation
Volume 10 - 2023 | https://doi.org/10.3389/fmars.2023.1174818
This article is part of the Research TopicDeep Learning for Marine ScienceView all 40 articles
Mesoscale eddies play a significant role in marine energy and matter transportation. Due to their huge impact on the ocean, mesoscale eddy detection has been studied for many years. However, existing methods mainly use single-modal data, such as the sea surface height (SSH), to detect mesoscale eddies, resulting in inaccurate detection results. In this paper, we propose an end-to-end mesoscale eddy detection method based upon multi-modal data fusion. Particularly, we don’t only use SSH, but also add data of other two modals, i.e., the sea surface temperature (SST) and the velocity of flow, which are closely related to mesoscale eddy detection. Moreover, we design a novel network named SymmetricNet, which is able to achieve multi-modal data fusion in mesoscale eddy detection. The proposed SymmetricNet mainly contains a downsampling pathway and an upsampling pathway, where the low-level feature maps from the downsampling pathway and the high-level feature maps from the upsampling pathway are merged through lateral connections. In addition, we apply dilated convolutions to the network structure to increase the receptive field without sacrificing resolution. Experiments on multi-modal mesoscale eddy dataset demonstrate the advantages of the proposed method over previous approaches for mesoscale eddy detection.
With the development of deep learning (LeCun et al., 2015), many practical problems, such as those in the fields of pattern recognition and computer vision, have been tackled with breakthrough results (Krizhevsky et al., 2012; Sermanet et al., 2014). Among others, semantic segmentation as an important branch of computer vision (Mottaghi et al., 2014; Cordts et al., 2016; Caesar et al., 2018), has benefited from the powerful deep learning models (Everingham et al., 2015). Since fully convolutional networks achieved the state-of-the-art performance on semantic segmentation (Long et al., 2015), a variety of deep learning approaches have been proposed for semantic segmentation (Chen et al., 2015; Ronneberger et al., 2015; He et al., 2017). Specifically, in this work, we model the mesoscale eddy detection problem from the perspective of semantic segmentation.
Mesoscale eddies (also known as weather-type ocean eddies) refer to ocean eddies with a diameter of 100-300 km and a life span of 2-10 months (Wyrtki et al., 1976; Chelton et al., 2007). They are generally divided into two categories, namely cyclonic eddies (counterclockwise rotation in the northern hemisphere) and anti-cyclonic eddies (counterclockwise rotation in the southern hemisphere). Mesoscale eddies not only play an important role in the transport of energy and particles in the ocean, but also have great effects on the oceanic biological environment. In consequence, there are many pieces of work on mesoscale eddy detection in the literature. Concretely, mesoscale eddy detection is to label the areas in an image where mesoscale eddies exist. However, it is very challenging to build a suitable detection method which can accurately detect the irregular shape of mesoscale eddies.
In the early days, traditional methods based on manual annotation, mathematical or physical knowledge and image processing techniques were used to detect mesoscale eddies. Nichol uses computers to search regions connected by the same gray level value in gray level images (Nichol, 1987), attempting to extract a similar eddy structure from the relationship diagram generated by these regions. Peckinpaugh and Holyer propose a method for eddy detection, which uses the Hough transformation method (Illingworth and Kittler, 1988) based on the edge detection in the remote sensing images (Peckinpaugh and Holyer, 1994). Due to the irregular shape of mesoscale eddies, Ji et al. use ellipse detection to detect mesoscale eddies (Ji et al., 2002). With the inspiration of ellipse detection, Fernandes proposes a new eddy detector which is capable of finding several eddies per satellite image (Fernandes, 2009). With the enrichment of satellite remote sensing data, a number of mesoscale eddy detection methods based on diverse data have been proposed. These mesoscale eddy detection methods can be divided into those using Eulerian data and those using Lagrangian data. For Eulerian data, the main methods are edge detection methods (Canny, 1986), Okubo-Weiss parameter value methods (Isern-Fontanet et al., 2003; Penven et al., 2005; Chelton et al., 2007), wavelet analysis methods based on the vorticity (Doglioli et al., 2007), wind angle methods based on geometric or kinematic characteristics of the flow field (Chaigneau et al., 2008), methods by using sea surface height variation (Chelton et al., 2011; Faghmous et al., 2012) and so on. For Lagrangian data, there are mainly Lagrangian stochastic methods (Lankhorst, 2006), rotation methods (Griffa et al., 2008), spiral trajectory search methods based on geometric features of trajectories (Dong et al., 2011a) and so on. However, these traditional methods have some defects in computational time and detection performance.
In recent years, the success of deep learning in various fields has provided a new paradigm for mesoscale eddy detection (Santana et al., 2022; Yu et al., 2022). Compared with traditional methods, deep learning based methods can extract rich feature information to improve the accuracy of mesoscale eddy detection. Unfortunately, there are not many deep learning based mesoscale eddy detection methods. Among them, Lguensat et al. propose EddyNet on SSH data for pixel-wise classification of eddies (Lguensat et al., 2018), which is a simple network architecture based on the U-Net (Ronneberger et al., 2015). Subsequently, Du et al. propose DeepEddy based on the principal component analysis network (PCANet) (Chan et al., 2015) and spatial pyramid pooling (SPP) (He et al., 2015), achieving a classification of SAR images (Du et al., 2019). Recently, Xu et al. adapt the PSPNet to mesoscale eddy detection (Xu et al., 2019), which is an architecture for semantic segmentation. Duo et al. use bounding boxes to achieve an object detection task for mesoscale eddy detection only based on sea level anomaly (SLA) data, not locating mesoscale eddies accurately by classifying each pixel (Duo et al., 2019). Similar to EddyNet, Santana et al. apply the U-Net model to mesoscale eddy detection based on SSH and SLA (Santana et al., 2020). Moschos et al. propose a deep learning method on SST, only completing a classification task on mesoscale eddy detection similar to DeepEddy (Moschos et al., 2020). Li et al. (2022) proposes a mesoscale detection network based on the extraction of eddy-related spatiotemporal information from multisource remote sensing data. However, there are some drawbacks in these approaches. There is no approach to detect mesoscale eddies using multi-modal data yet. In addition, some tasks such as classification and object detection are not suitable for mesoscale eddy detection, not segmenting mesoscale eddies with irregular shapes. Therefore, we model mesoscale eddy detection as a semantic segmentation problem in this paper. Specifically, we design an end-to-end deep network to detect mesoscale eddies by fusing multi-modal data, leading to improved accuracy over the previous methods.
Except for the methodology, a major challenge in mesoscale eddy detection lies in the fact that there are very few labeled datasets available. To address this problem, we build a multi-modal mesoscale eddy dataset. Specifically, we download the multi-modal data from the same sea area at the same time from the Copernicus Marine Environment Monitoring Service (CMEMS)1. The multi-modal data contain the sea surface height (SSH), the sea surface temperature (SST) and the velocity of flow, which can be used for mesoscale eddy detection, either independently or synthetically (Voorhis et al., 1976; Fu et al., 2010; Dong et al., 2011b; Mason et al., 2014). It should be noted that the flow velocity data contains two directions, namely zonal and meridional velocity, because the velocity vector at a certain point in the ocean is decomposed into the east/west direction (zonal) and the north/south direction (meridional). Hence, different from the SSH and SST data which include only one channel, the velocity of flow has two channels. Additionally, due to the extensive use of the SSH data for mesoscale eddies detection, we asked the experts to label the ground truth on the SSH images base on semantic segmentation tool so that it is easy to compare with previous mesoscale eddy detection approaches.
The multi-modal dataset we collected contains different variables affecting mesoscale eddies in the same sea area, so we concatenate four channels occupied by these three multi-modal data and input them into the network together for feature learning. In order to fuse multi-modal data for mesoscale eddy detection and reduce the loss of information during feature extraction, we propose a novel deep architecture dubbed SymmetricNet. SymmetricNet mainly consists of a downsampling pathway and an upsampling pathway. Particularly, we combine the low-level feature maps of high resolution from the downsampling pathway and the high-level feature maps with rich semantic information from the upsampling pathway via lateral connections. We use element-by-element addition to achieve the fusion of the feature maps, replacing the concatenation of feature maps which is widely used to merge feature maps in previous semantic segmentation approaches. Furthermore, considering that convolutional operations reduce resolution and tend to lose fine-grained information, dilated convolutions (Yu and Koltun, 2016) are used in the upsampling pathway, which can increase the receptive field and aggregate multi-scale contextual information without losing resolution. As a result, the final feature map of our model has not only rich semantics, but also rich contextual information. In contrast to EddyNet and PSPNet, our method makes use of multi-modal data fusion for mesoscale eddy detection. In contrast to DeepEddy, SymmetricNet can locate multiple mesoscale eddies in a sea area, and classify them as cyclonic eddies or anti-cyclonic eddies.
In summary, the main contributions of our work are:
● We construct a mesoscale eddy multi-modal dataset containing the SSH, SST and the velocity of flow. It is annotated by experts based on the SSH images from dataset;
● We propose a novel end-to-end SymmetricNet, which can achieve multi-modal data fusion and mesoscale eddy detection. SymmetricNet is composed mainly of a downsampling pathway and an upsampling pathway, which fuses low-level feature maps from the downsampling pathway with high-level feature maps from the upsampling pathway via lateral connections. In addition, we employ dilated convolutions in an effort to increase the receptive field and to obtain more contextual information without losing resolution;
● Our approach outperforms previous methods, achieving excellent performance for mesoscale eddy detection on the multi-modal dataset collected by us.
The rest of this paper is organized as follows. In Section 2, due to the lack of related work, we describe directly the structure of our proposed SymmetricNet and the loss function. In Section 3, we present the constructed multi-modal dataset, the parameter settings used to train our network, and three comparative experiments. In Section 4, we discuss the results of comparative experiments. Section 5 concludes this paper.
In this section, we first introduce the structure of our proposed network dubbed SymmetricNet, which is a symmetric network as shown in Figure 1. We then introduce lateral connections and dilated convolutions applied to SymmetricNet. We use lateral connections to fuse low-level feature maps with high-level feature maps, which replace the concatenation in previous methods with an element-by-element addition. In addition, dilated convolutions are used to increase the receptive field and obtain contextual information. Finally, we describe the loss function for the optimization of SymmetricNet.
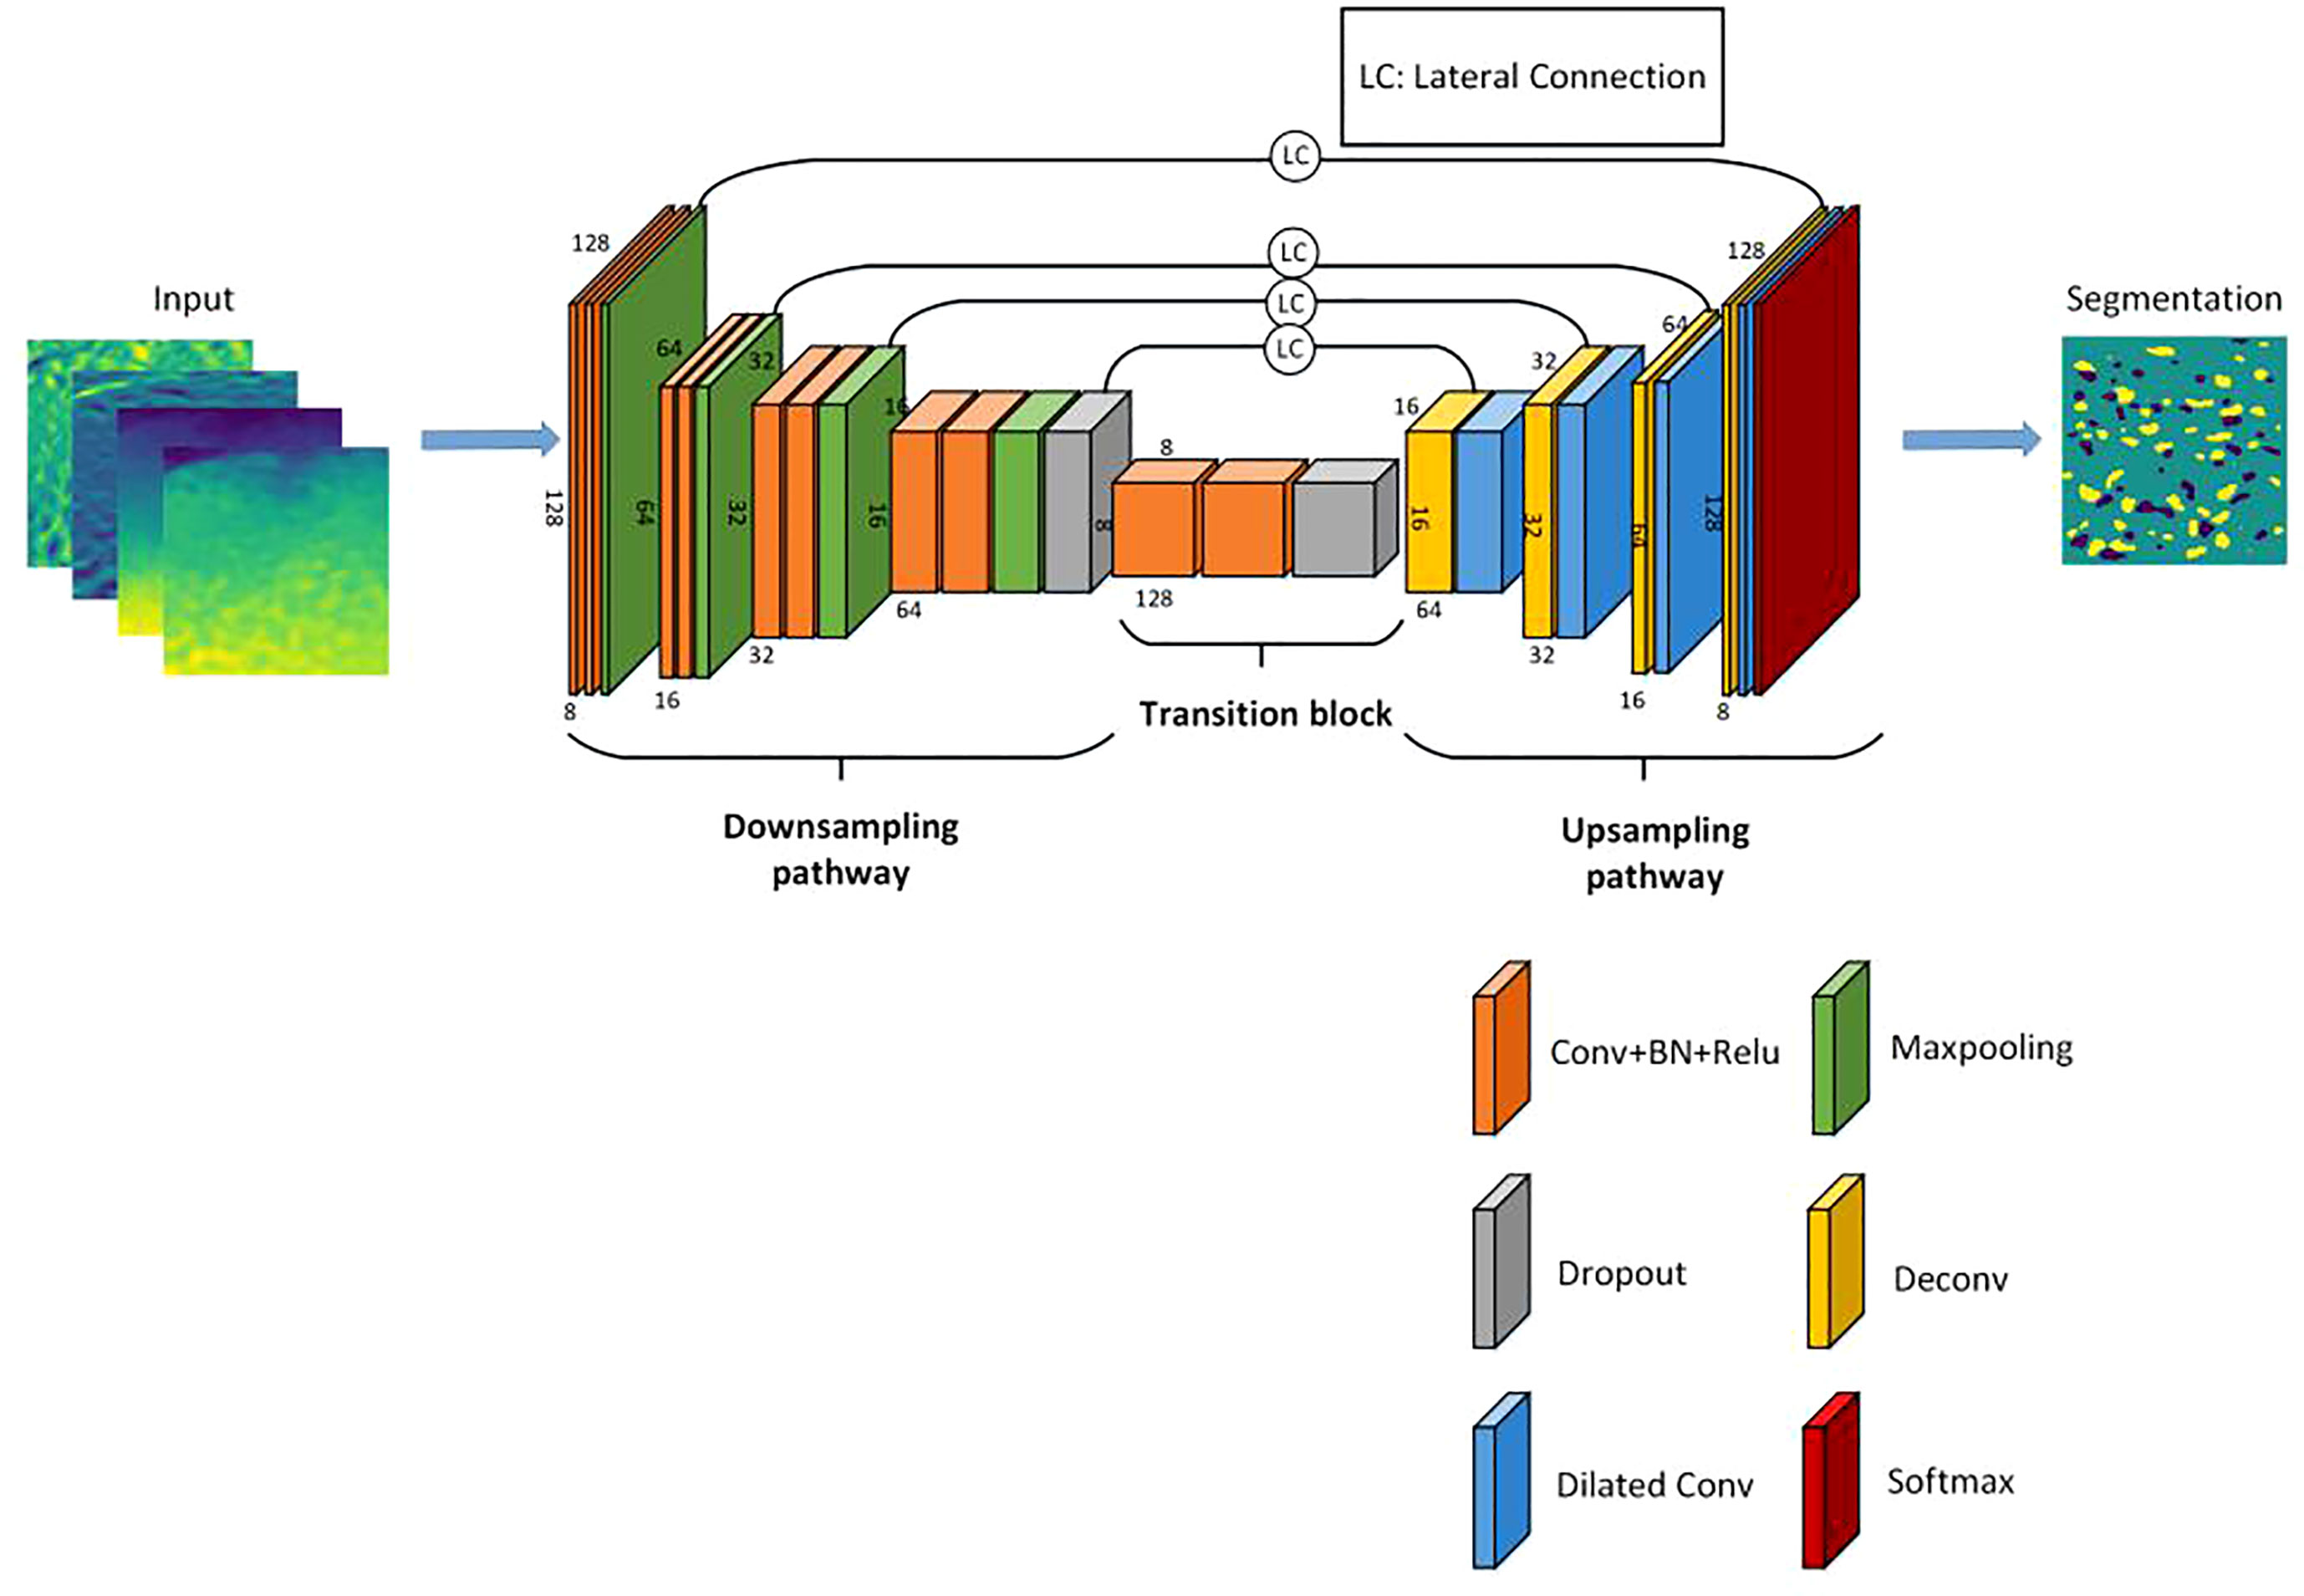
Figure 1 Schematics of the proposed SymmetricNet.
Recent semantic segmentation methods usually use the encoder-decoder structure due to its great successes in many applications (Chen et al., 2018). The SymmetricNet is also a symmetric encoder-decoder architecture. As shown in Figure 1, SymmetricNet is composed of a downsampling pathway (left side), an upsampling pathway (right side) and a transition block (in the middle). As can be seen in Figure 1, there are four downsampling blocks in the downsampling pathway and four upsampling blocks in the upsampling pathway. Thus, the architecture of SymmetricNet is symmetric.
In the downsampling pathway, each downsampling block mainly consists of two layers of 3×3 convolution, each followed by a batch normalization (BN) layer and a rectified linear unit (ReLU). Next, a 2 × 2 max pooling operation with a stride of two is employed to each block for downsampling. Furthermore, in order to avoid over-fitting in our network, a dropout layer is applied to the fourth downsampling block. Particularly, the number of channels is doubled when performing a downsampling block. The downsampling pathway can be viewed as that the length and width of the feature maps are halved and the number of channels is doubled when passing a downsampling block. Similarly, in the upsampling pathway, each upsampling block consists of a deconvolutional operation, a lateral connection and a 3×3 dilated convolution with a rate of four. The deconvolutional operation in each upsampling block can double the length and width of the feature maps and halve the number of channels. The lateral connection fuses low-level feature maps from the downsampling pathway with high-level feature maps from the upsampling pathway. Thus, the effect of the upsampling pathway can be viewed as that the length and width of the feature maps are doubled, and the number of channels is halved when passing a upsampling block. Except for these four downsampling blocks and four upsampling blocks, there is a transition block following the fourth downsampling block, which consists of two layers of 3×3 convolution, each followed by a BN layer and an ReLU layer. Similar to the fourth downsampling block, there is a dropout layer at the end of the transition block to avoid over-fitting in SymmetricNet.
In the end, we take the output of the last upsampling block as input into the final softmax layer to achieve pixel-level classification, and finally attain the segmentation results for mesoscale eddy detection.
In recent years, convolution has become an increasing popular method in deep learning thanks to its effectiveness in extracting rich semantic information from feature maps. However, fine-grained information can be lost by continuously convolutional operations. Although the resolution of feature maps increases when they are upsampled, some important details may be difficult to recover by the deconvolutional operation. Therefore, in SymmetricNet, the low-level feature maps of high resolution are fused with the high-level feature maps to capture fine-grained information lost in the downsampling pathway.
Additionally, dilated convolutions are adopted in our network to replace conventional convolutions so as to avoid the massive loss of contextual information as in conventional convolutional networks. Dilated convolution introduces the dilation rate in an attempt to increase the receptive field at a single pixel, and obtain more contextual information. Figure 2 illustrates the difference between a conventional convolutional kernel and two dilated convolutional kernels. Figure 2A shows the 3×3 convolutional kernel of conventional convolution, whereas Figure 2B and Figure 2C show the 3×3 convolutional kernels of dilated convolutions with a rate of two and four, respectively. The orange areas represent the non-zero parameters of the convolutional kernel, while the white areas represent the parameters filled with zero. There is a gap between the nonzero parameters of the dilated convolutional kernel, which is equal to the dilated rate minus one. It is obvious that the receptive field becomes larger due to the expansion of the convolutional kernel, and the increase of the receptive field results in enriched contextual information. However, the major drawback of dilated convolution lies in its excessive computational complexity and large memory requirement as the size of the dilated convolutional kernel increases. Therefore, we only apply dilated convolutions to the upsampling pathway.
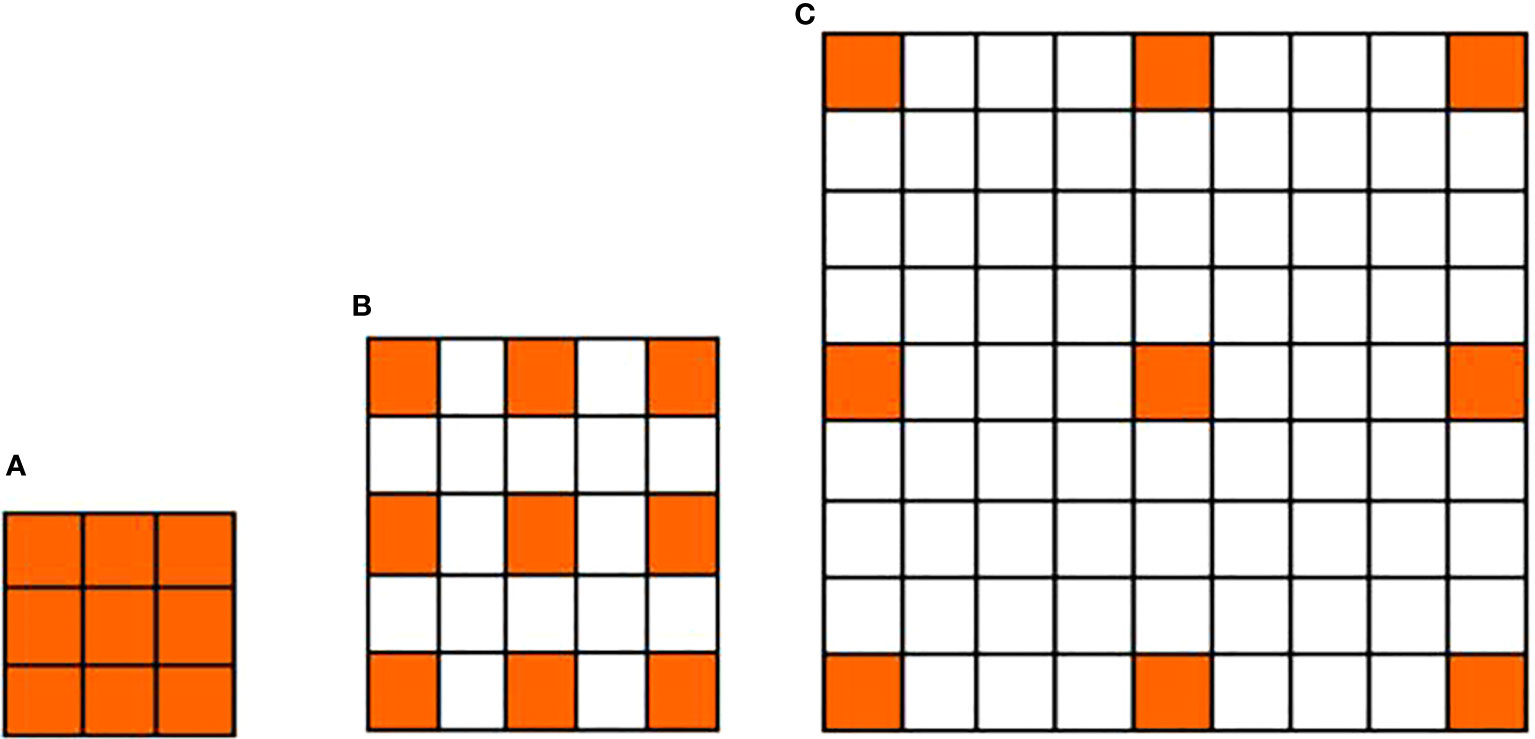
Figure 2 Comparison between a conventional convolutional kernel and two dilated convolutional kernels. (A) The 3×3 convolutional kernel of conventional convolution; (B) The 3×3 convolutional kernel of dilated convolution with a rate of 2; (C) The 3×3 convolutional kernel of dilated convolution with a rate of 4.
Figure 3 illustrates a lateral connection of the low-level feature maps from the downsampling pathway and the high-level feature maps from the upsampling pathway in detail. Firstly, the high-level feature maps output from the transition block or upsampling blocks are upsampled by a deconvolutional operation. Next, we select the corresponding low-level feature maps in the downsampling pathway according to the size of the high-level feature maps, because the sizes of the feature maps that need to be added must be the same. Then, we apply a 3×3 dilated convolution with a rate of four to the low-level feature maps of high resolution, performing semantic extraction without reducing the resolution. In this case, we can mitigate the disadvantage that the low-level feature maps have weak semantic information. Subsequently, the low-level feature maps of high resolution and the high-level feature maps with rich semantic information are added in an element-by-element manner. Ultimately, a 3×3 dilated convolution with a rate of four is applied to the fused feature maps in an effort to gain multi-scale contextual information, while maintaining the resolution.
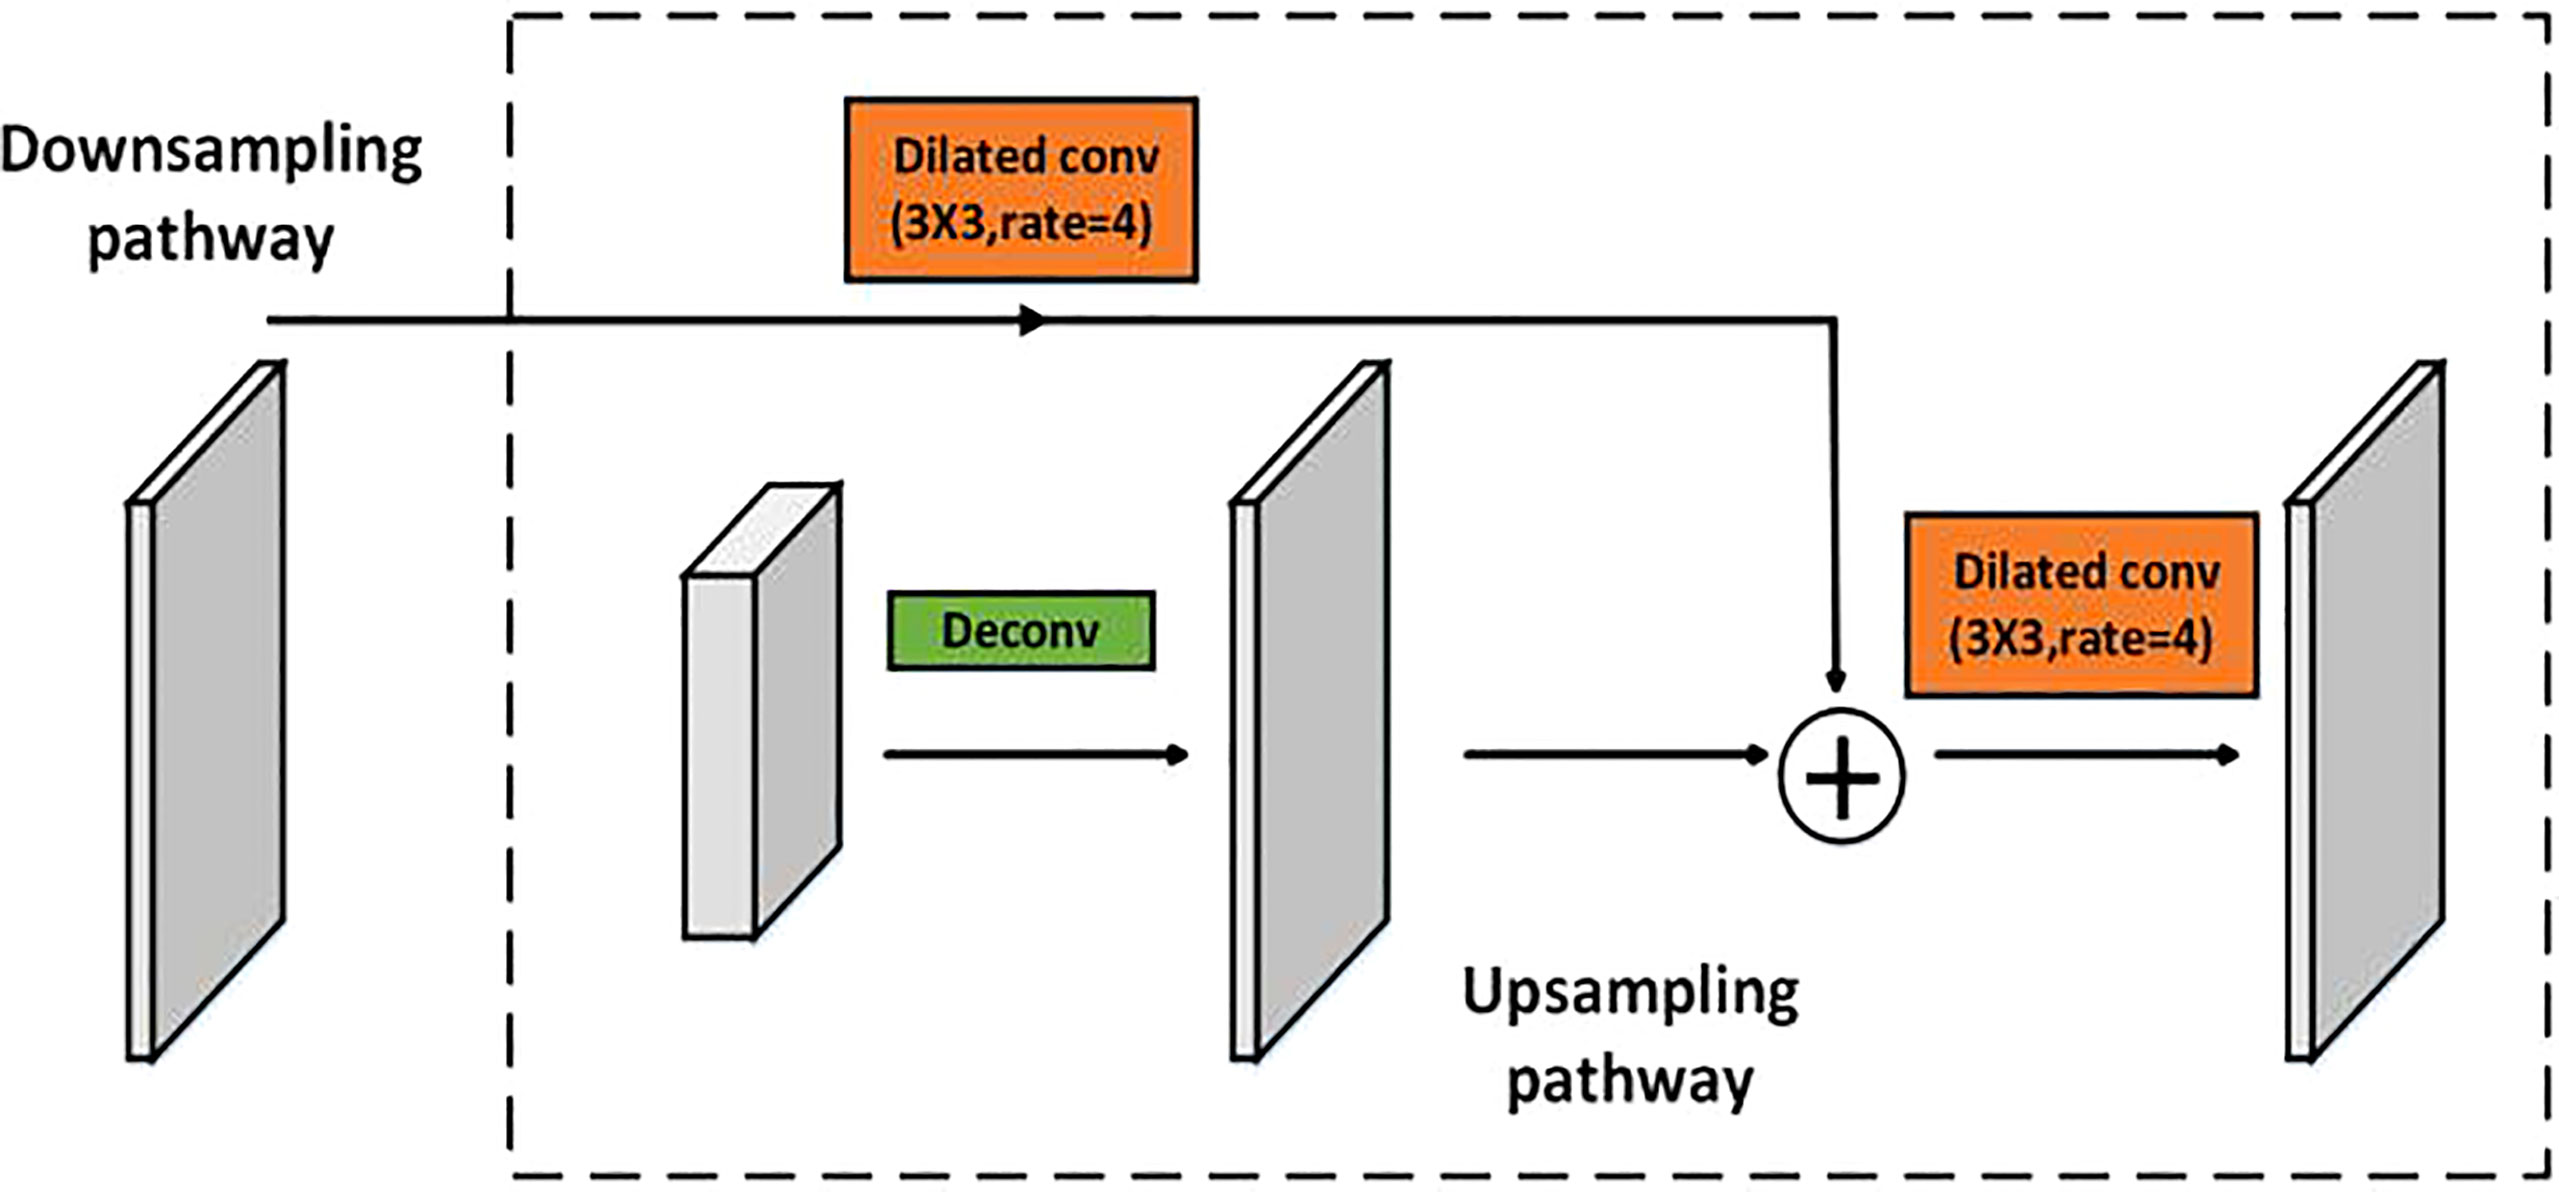
Figure 3 Illustration of a lateral connection.
The lateral connections between the low-level feature maps of high resolution from the downsampling pathway and the high-level feature maps with rich semantic information from the upsampling pathway achieve feature maps fusion, resulting in the feature maps with fine-grained and rich semantic information.
In our work, we use a loss function which combines the dice loss function and the cross-entropy loss function for the optimization of SymmetricNet. It is defined as
where DL(P,G) the dice loss function, and Llog(P,G) is the cross-entropy loss function.
We regard the mesoscale eddy detection problem as a semantic segmentation problem, which is essentially a pixel-level classification problem. The dice loss function is a popular loss function for training pixel-level classification networks, which is a similarity measure function used to calculate the similarity of two samples. Dice loss function is helpful to address the problem of class imbalance in semantic segmentation. Dice loss function combined with cross-entropy loss function can improve the stability of model training. Let us first introduce the dice coefficient which describes the similarity between the prediction and the ground truth. Denote by P the prediction and by G the ground truth. |P| and |G| represent the sums of elements in P and G respectively. Then, the dice coefficient function is defined as
According to the above formula, the prediction and the ground truth are exactly the same when the dice coefficient is one, and the segmentation result is optimal. By contrast, a dice coefficient of 0 refers to a completely erroneous segmentation result, implying that the prediction and the ground truth do not match at all. In other words, the larger the dice coefficient, the better the performance. As a result, we define the dice loss function as follows:
However, there is a disadvantage in the dice loss function. The gradient of the dice loss function mainly depends on the sum of the elements in the prediction and the ground truth. The gradient will change sharply if it is too small, making the training difficult. Besides, mesoscale eddy detection is actually a 3-class classification problem, i.e., the cyclonic eddies, anti-cyclonic eddies and background classes. Therefore, the cross-entropy loss function can reduce the training difficulty of the network, which is the most commonly used loss function for multi-class classification problems.
In the end, we use the loss function in Eq.(1) to train our network, achieving excellent performance for mesoscale eddy detection.
In this section, we first explain the details of the collected dataset. Then, we introduce parameter settings for training the proposed SymmetricNet. Finally, we demonstrate that our method is superior to other methods for mesoscale eddy detection in three aspects, i.e., the comparisons on different modals of data, different networks and different loss functions.
So far, there are very few public datasets available for mesoscale eddy detection. Therefore, it is necessary to build a reliable dataset as the first step. In most papers on mesoscale eddy detection to date, the authors rely mainly on the SSH data for detection, lacking the data of other modals closely related to mesoscale eddy detection. Motivated by this observation, we construct a multi-modal dataset, which is composed of the SSH, SST and the velocity of flow.
Firstly, we download the SSH, SST and the velocity of flow for a total of ten years from January, 2000 to December, 2009 on the website of CMEMS. Specifically, the SSH, SST and the velocity of flow of our dataset are downloaded from the GLOBAL OCEAN ENSEMBLE PHYSICS REANALYSIS product, where the spatial resolution is 0.25 degree × 0.25 degree. The dimension of these three-modal data is 681 × 1440, where 681 is the dimension of the latitude, and 1440 is the dimension of the longitude. There is one datum for each month, such that there are 120 data coming from 120 consecutive months. h/south direction (meridional). Then, we choose the data of 40 months for a three-month interval of totally 120 months in order to make the data to be diverse. Lastly, we randomly select the data of these three modals from multiple regions with the size of 128 × 128, ensuring that the corresponding positions of the SSH, SST and the velocity of flow are the same.
In this case, the multi-modal data have four channels, where the first channel corresponds to the SSH, the second channel corresponds to the SST, the third and fourth channels correspond to the velocity of flow. Figure 4 shows examples of the SSH, SST and the velocity of flow corresponding to the channels. Considering that previous methods only use the SSH data, experts are invited to label the SSH images as the ground truth to make it easy to conduct comparison. In labeling, the cyclonic eddies are annotated as -1, the anti-cyclonic eddies are annotated as 1, and the background is annotated as 0. The SSH image and the ground truth in a certain sea area are shown in Figure 5. Figure 5A shows the SSH image, while Figure 5B shows the ground truth, where the yellow areas represent the anti-cyclonic eddies, the dark blue areas represent the cyclonic eddies, and the light blue areas represent the area without eddies. In the end, we randomly select 512 and 256 samples as the training and test sets, respectively.
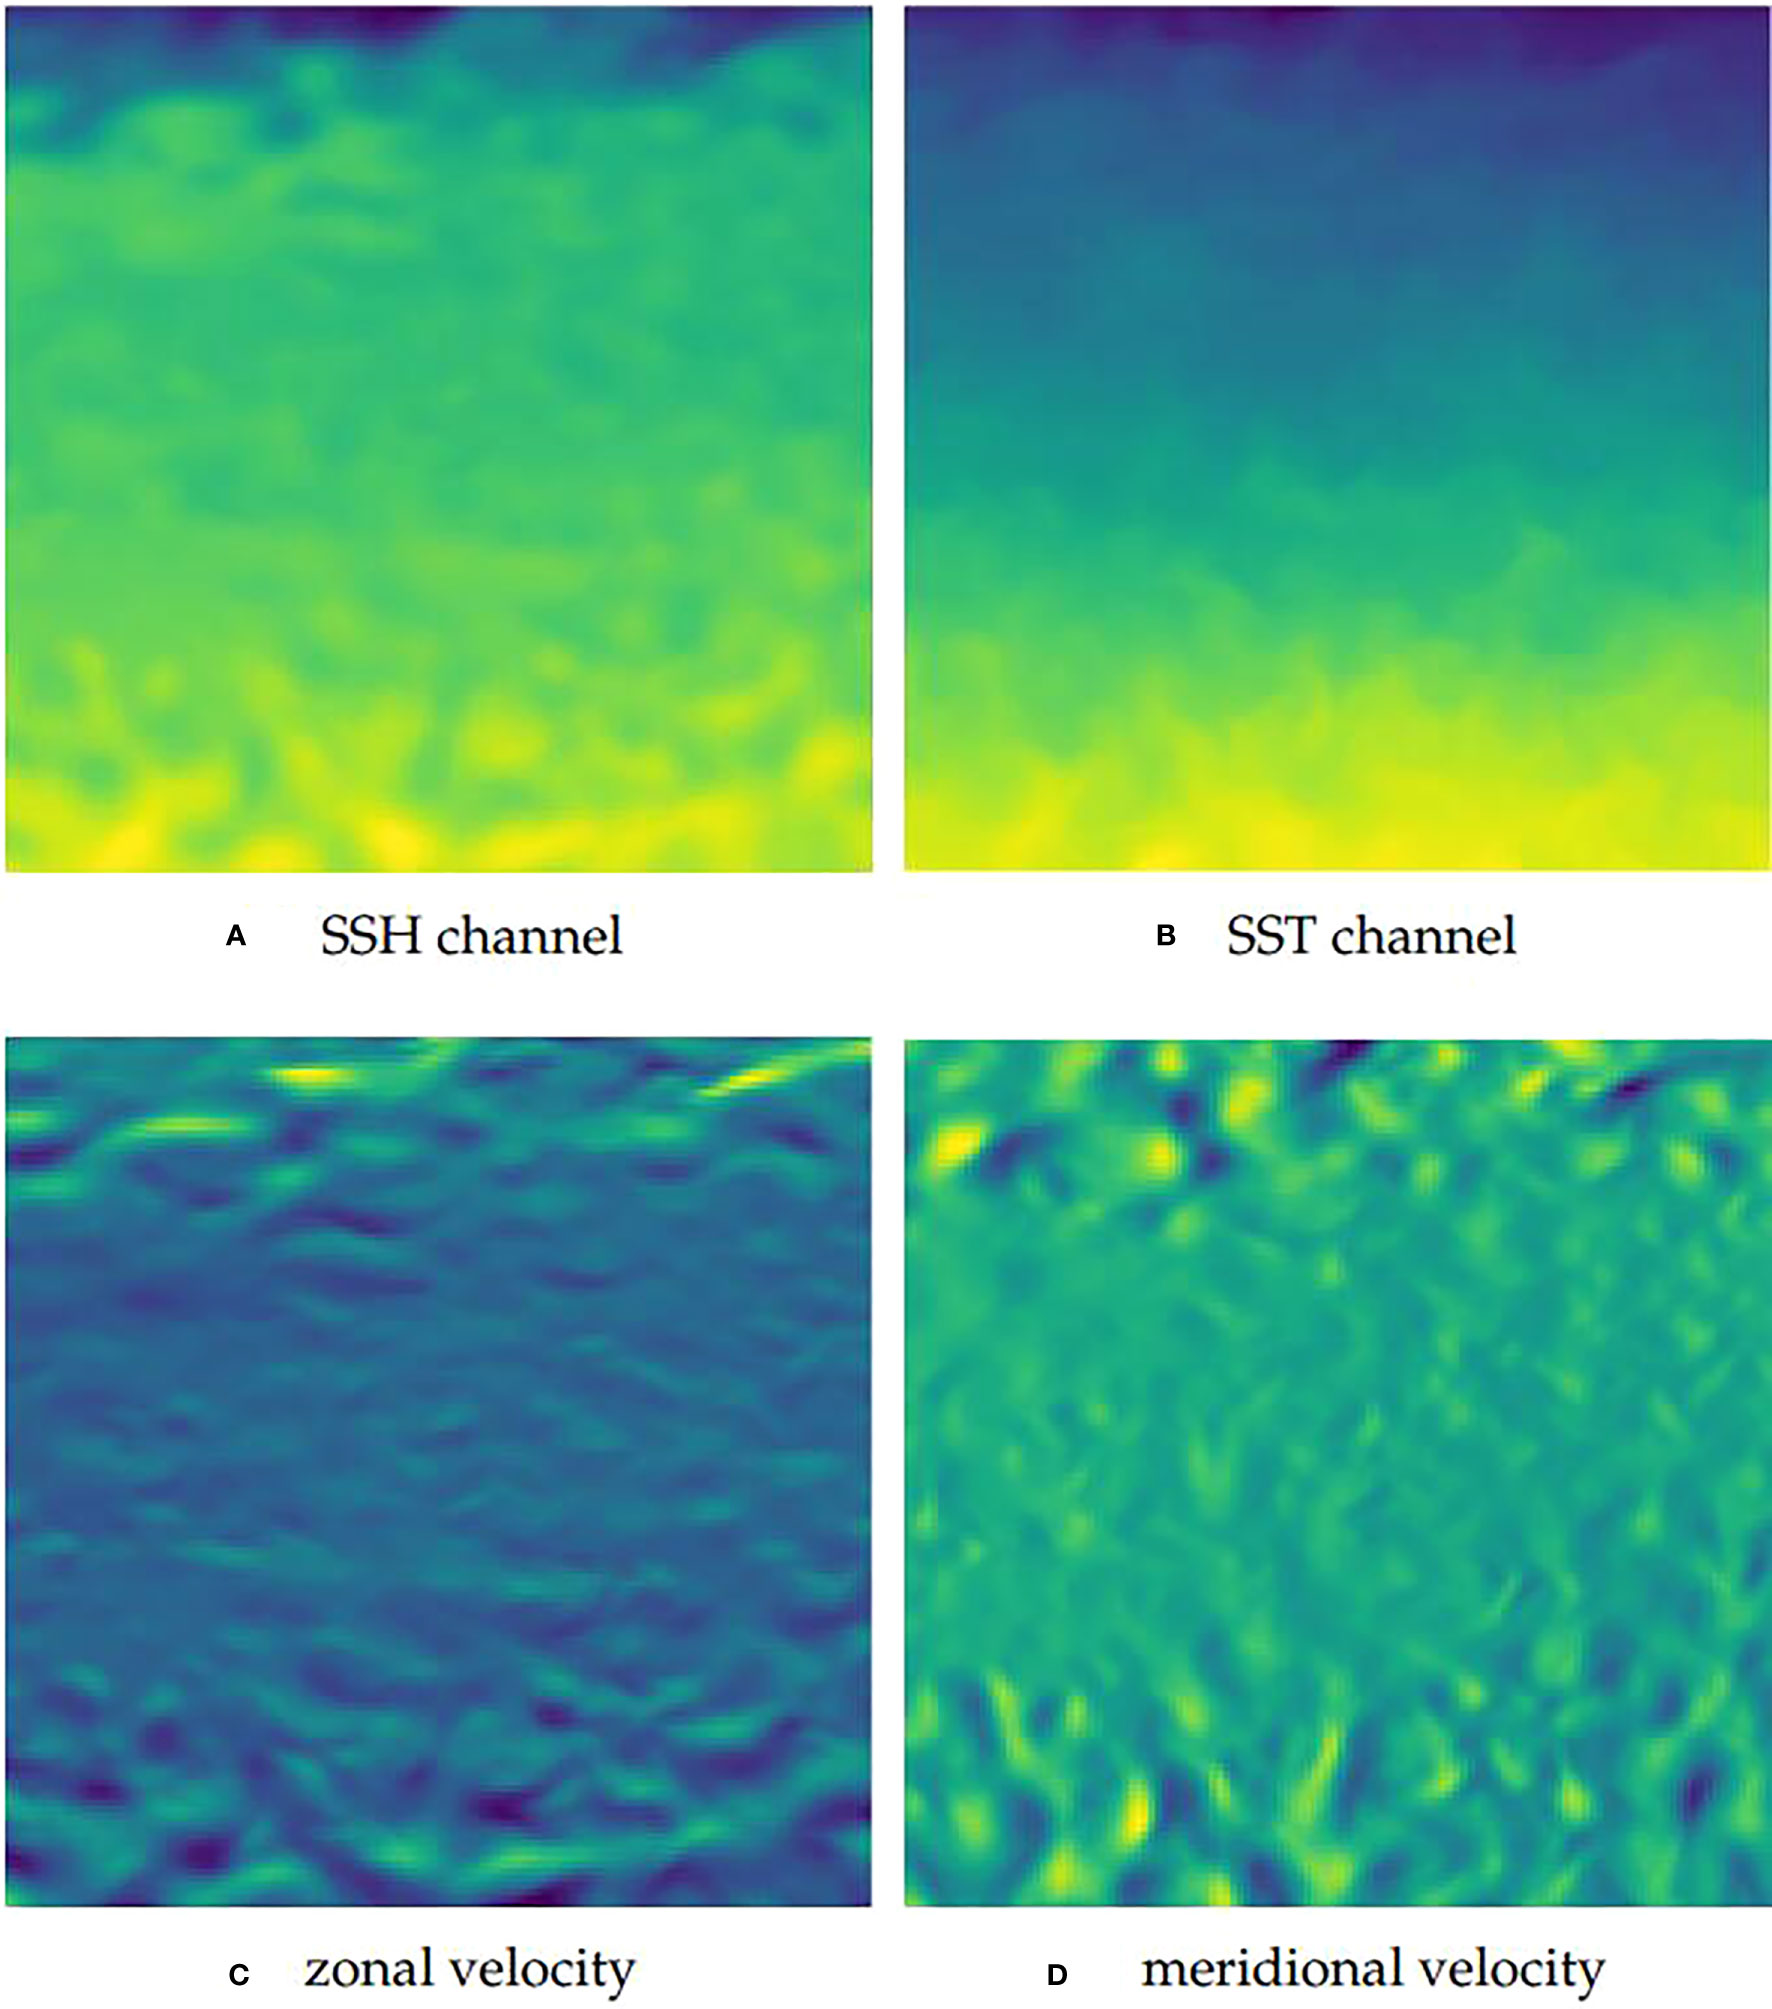
Figure 4 Examples of the SSH, SST and the velocity of flow corresponding to the channels of a multi-modal remote sensing image. (A) The SSH channel; (B) The SST channel; (C) The zonal velocity; (D) The meridional velocity.
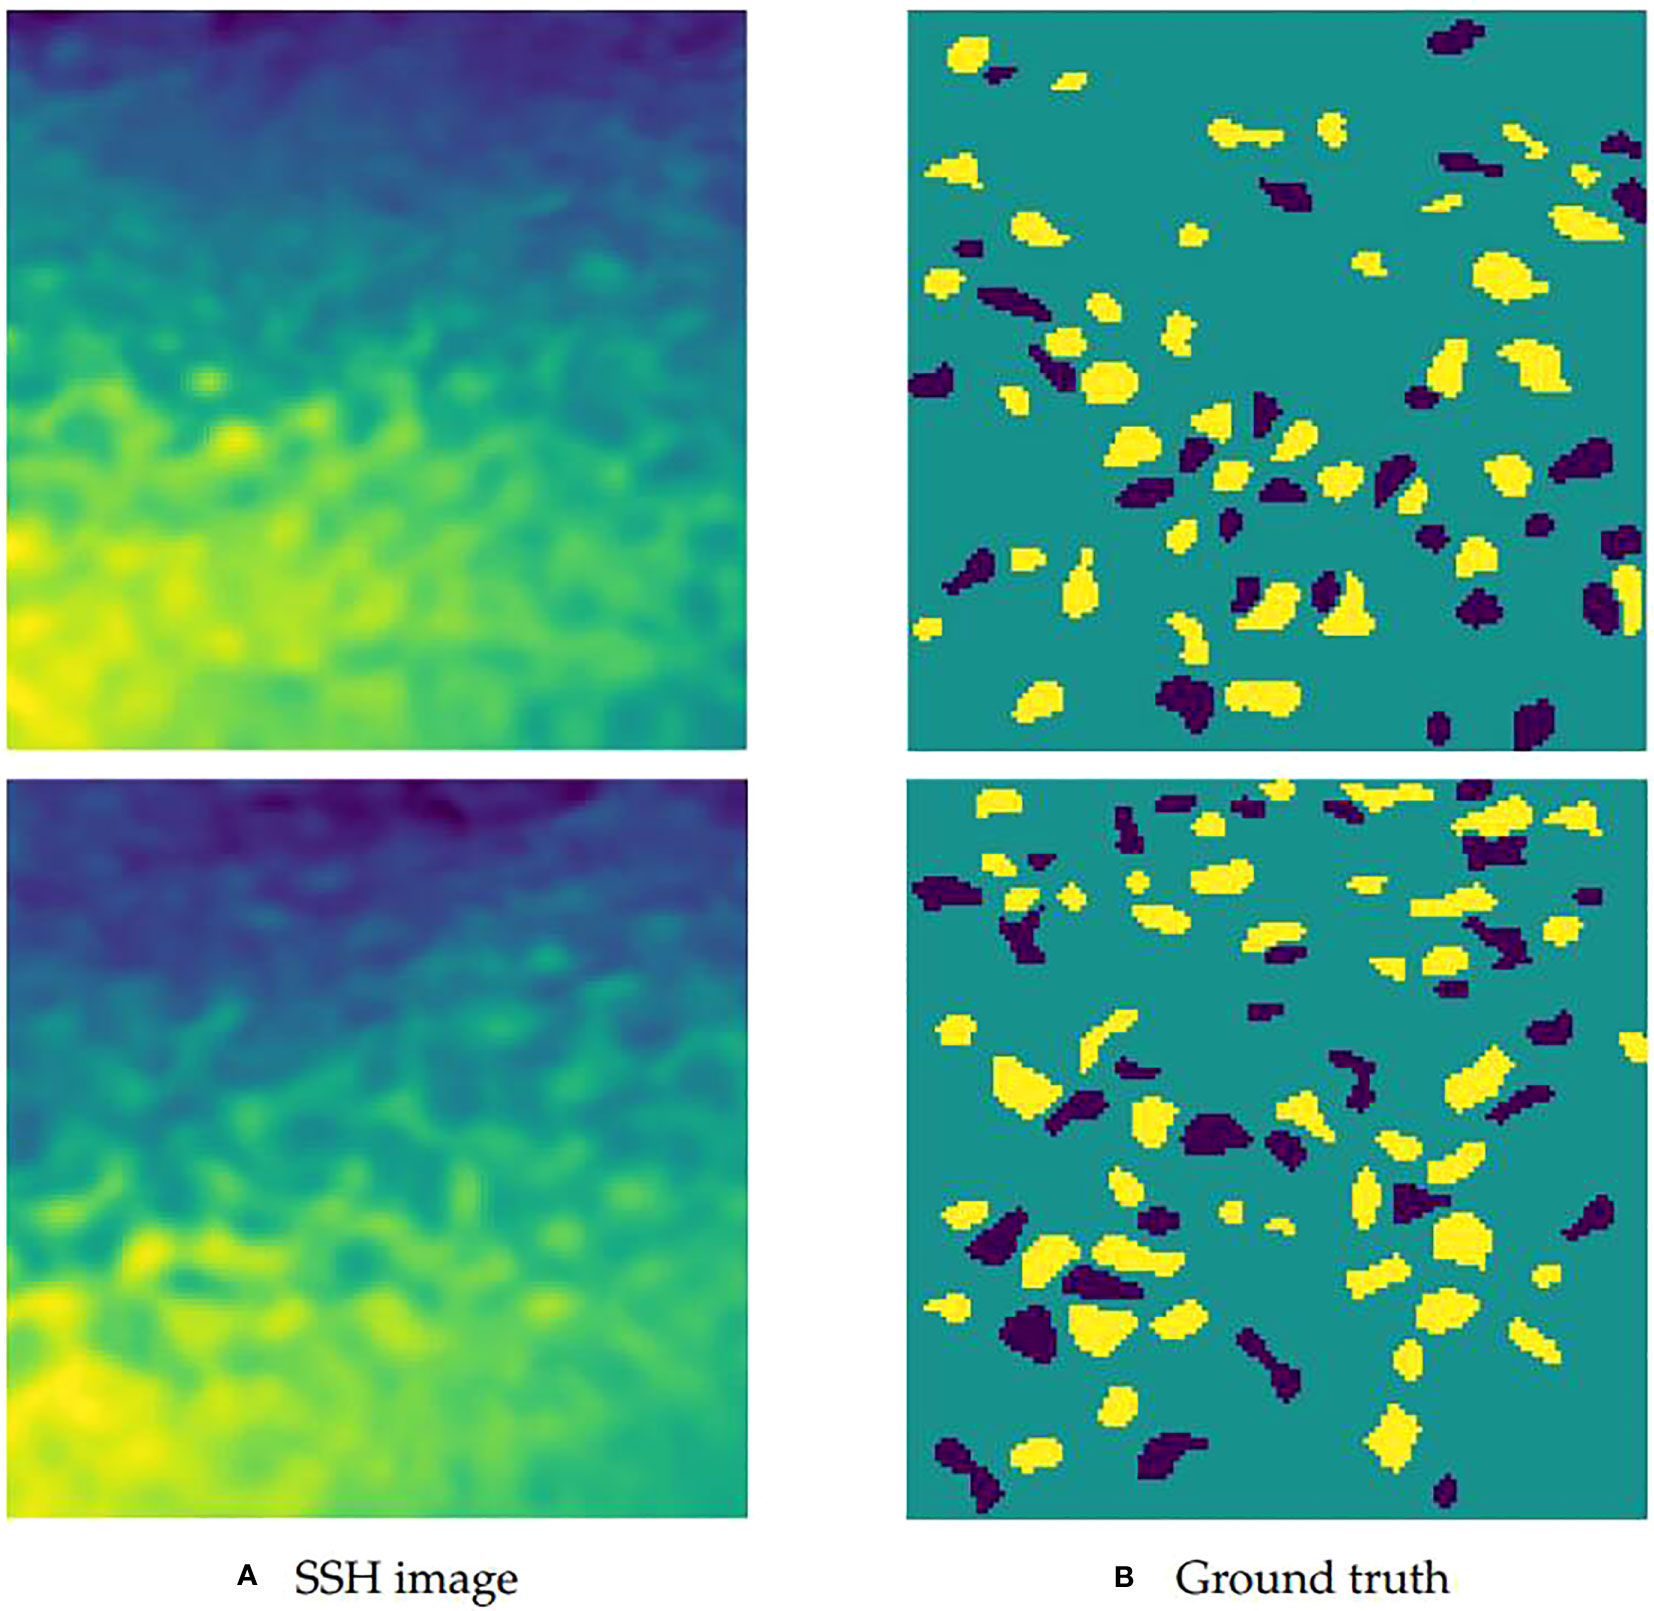
Figure 5 Example of the SSH image and the ground truth in a certain sea area. (A) Two examples of the SSH images; (B) The ground truth labeled by experts according to the SSH images.
In our network, we adopted 8, 16, 32, 64 and 128 convolutional kernels for the 3×3 convolution applied to each downsampling block and intermediate transition block. Symmetrically, the numbers of all convolutional kernels of each upsampling block were taken as 64, 32, 16, and 8, respectively. The dropout in the last downsampling block and the transition block were set to 0.3 and 0.5, respectively. We trained our network using the Adam optimizer, which had an initial learning rate of 1.0 × 10⁻³ and a minimum learning rate of 1.0 × 10⁻³⁰. Additionally, the batch size was set to 8 and the number of epochs was set to 50.
In this section, in order to validate the effectiveness of our constructed multi-modal dataset, our proposed network, and our combined loss function, we conducted comparative experiments on different modals of data, different networks, and different loss functions, respectively.
To study the significance of our constructed multi-modal dataset, we selected the SSH, SST and the velocity of flow separately from the corresponding channel of the multi-modal dataset. Then we trained and tested our network on these three modals of data and multi-modal data. There was no validation set because the amount of the collected data was not very large. Thus, we firstly compared the loss and accuracy on the training set to make an optimistic evaluation of the network. Figure 6 shows the learning curves on three modals of data and multi-modal data of training set, where the green, orange, blue and red curves represent the learning curves by using the SSH, SST, the velocity of flow and multi-modal data, respectively. As can be seen from Figure 6A, the losses gradually decrease and the loss using the multi-modal data is lower than that using other three modals of data as the training epoch increases. Similarly, it is observed in Figure 6B that the accuracy gradually increase and the accuracy using the multi-modal data is higher than that using other three modals of data as the training epoch increases.
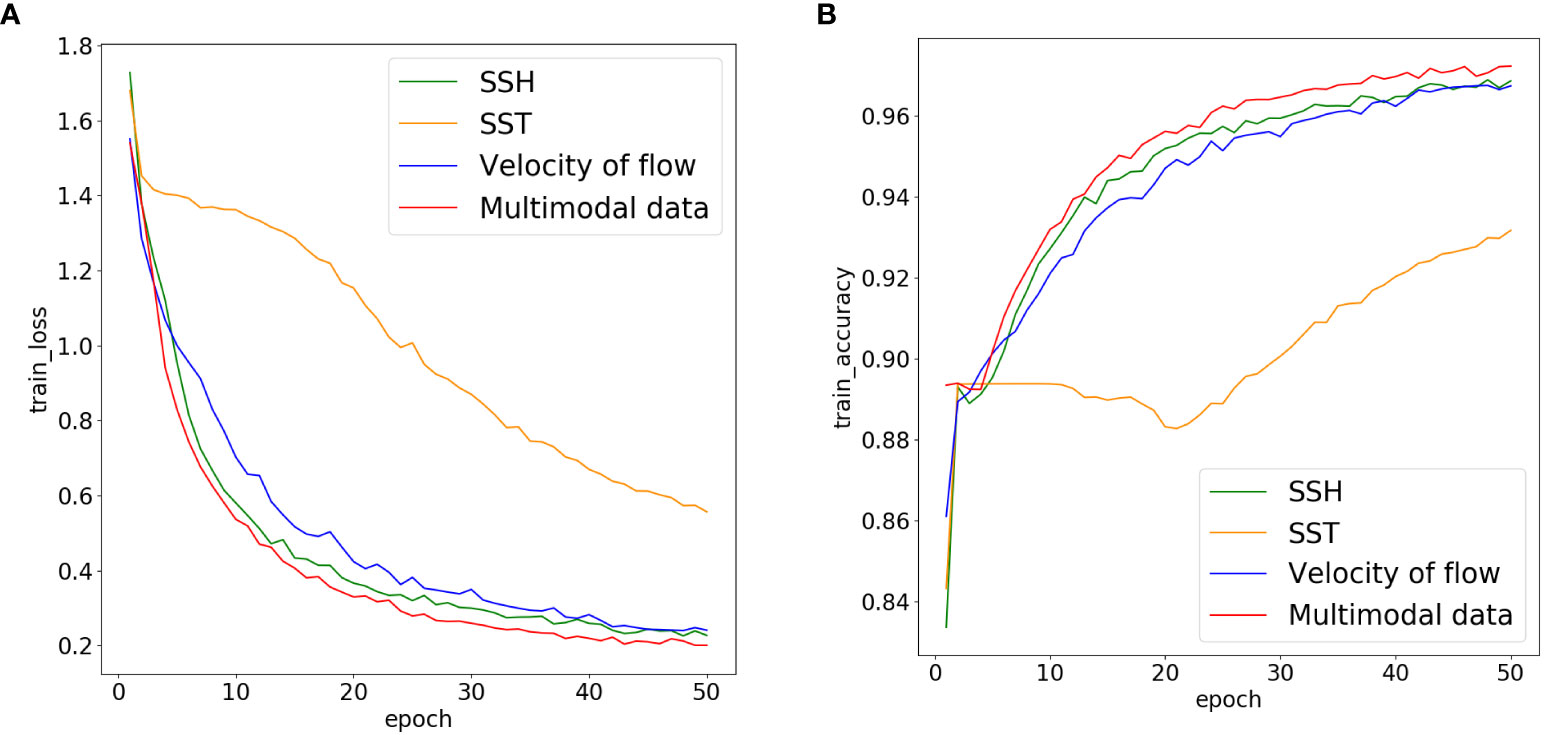
Figure 6 Loss and accuracy curves obtained by using our model on three modals of data and multi-modal data. (A) Loss curve (B) Accuracy curve.
Moreover, the loss and accuracy on three modals of data and multi-modal data after training 50 epochs are shown in Table 1, where the cross-entropy loss, dice loss and our loss combining the cross-entropy loss and the dice loss are shown, respectively. As can be seen from the table, the multi-modal data deliver the best results.
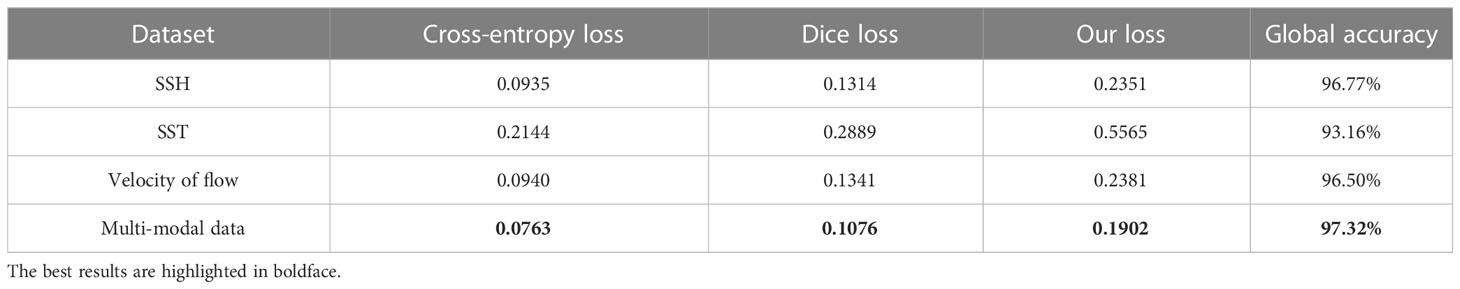
Table 1 Loss and accuracy obtained by using our model on three modals of data and multi-modal data of training set.
We tested our network using three modals of data and multi-modal data of the same test set. In addition to the measure of global accuracy shown in Table 1, we added four evaluation indexes to further prove the effectiveness of our collected multi-modal data, i.e., the pixel precision of cyclonic eddies, anti-cyclonic eddies, background classes and the mean precision of these three classes. Table 2 shows the detection results on three modals of data and multi-modal data, which demonstrate the significance of the multi-modal data. Through these experiments on the training and test sets, we can clearly see that the method based on the multi-modal data outperforms the methods based on the other three modals of data.
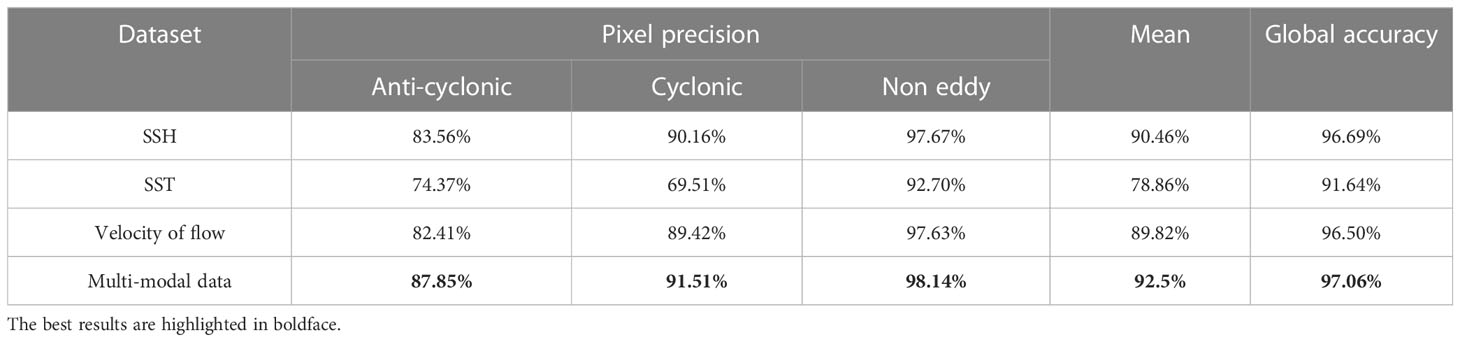
Table 2 Detection results obtained by using our model on three modals of data and multi-modal data of test set.
In order to visually demonstrate the advantage of our multi-modal data over three single-modal of data, the examples of eddy detection results using three modals of data and multi-modal data of test set are shown in Figure 7. Through comparing with the ground truth, we can see that mesoscale eddy detection results based on multi-modal data are closest to ground truth.
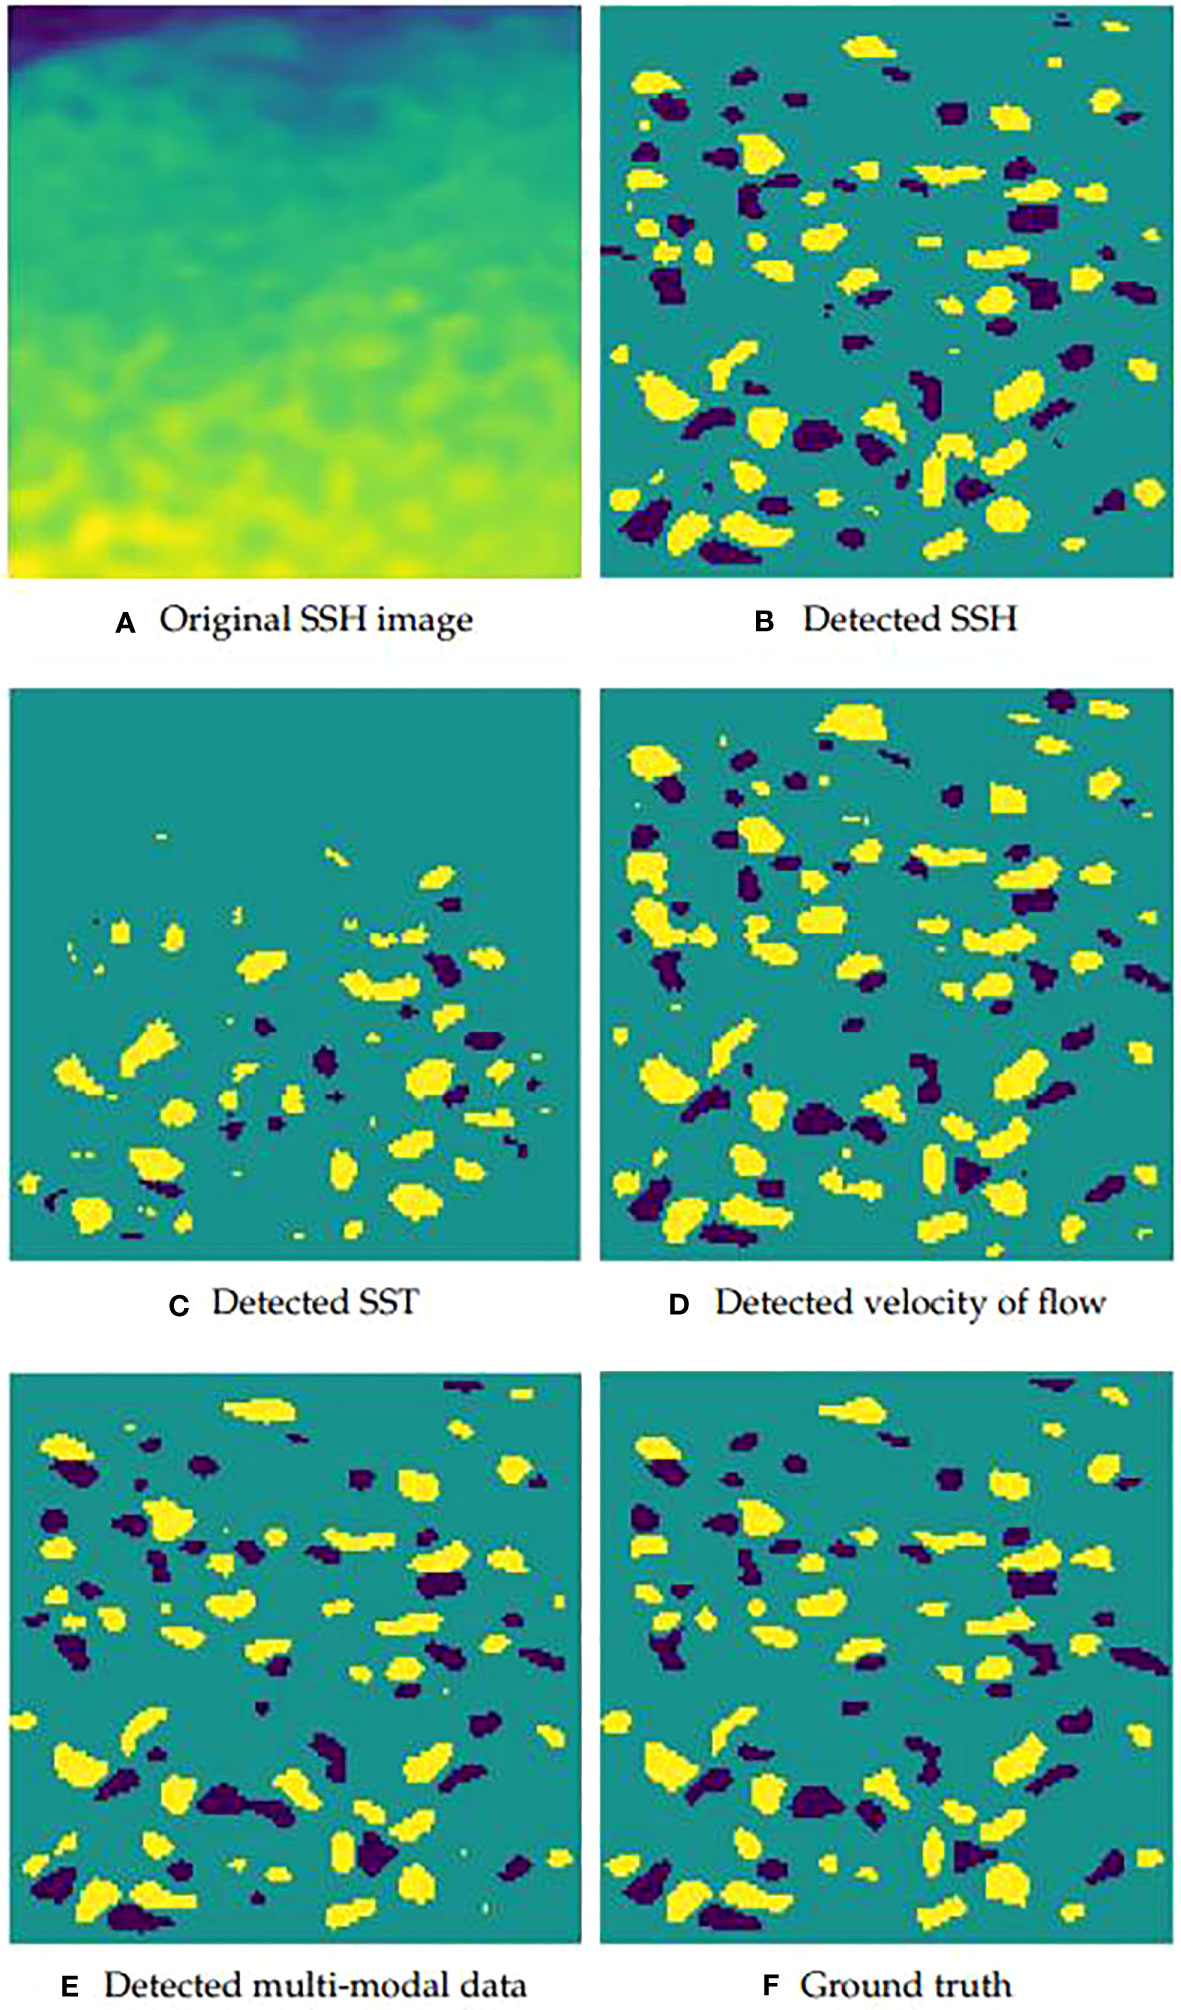
Figure 7 Eddy detection results obtained by using the proposed model on three modals of data and multi-modal data of test set. (A) Original SSH image in a region of sea; (B–E) Eddy detection results from the same region of sea using the SSH, SST, the velocity of flow and the multi-modal data, respectively; (F) Ground truth labeled by experts in the same region of sea according to the SSH image.
The result using the proposed network is compared with those of other networks with the objective of verifying the effectiveness of our framework. As mentioned in Section 1, there are few representative mesoscale eddy detection methods based on deep learning. Among them, DeepEddy, Duo et al. (2019) and Moschos et al. (2020) perform tasks of classification and object detection, and they cannot segment mesoscale eddies from remote sensing images. For methods using pixel-wise classification for mesoscale eddy detection, there are EddyNet, PSPNet and Santana et al. (2020). Considering that both the structure of EddyNet and Santana et al. (2020) rely on the U-Net, we select EddyNet as the representative of them. Hence, we choose to compare EddyNet and PSPNet with our proposed network. Besides, the SymmetricNet without dilated convolution is another compared network to prove the effectiveness of our network, which can also be viewed as an ablation study. Figure 8 shows the learning curves of these compared networks using the multi-modal training set, where the blue, orange, green and red curves represent the learning curves of EddyNet, PSPNet, SymmetricNet without dilated convolution and the proposed network, respectively. Figure 8A shows that the losses of all the models gradually decrease and the loss of our network is lower than that using the other networks as the training epoch increases. Similarly, it is observed from Figure 8B that the accuracy of all the models gradually increase and the accuracy of our network is higher than that using the other networks as the training epoch increases.
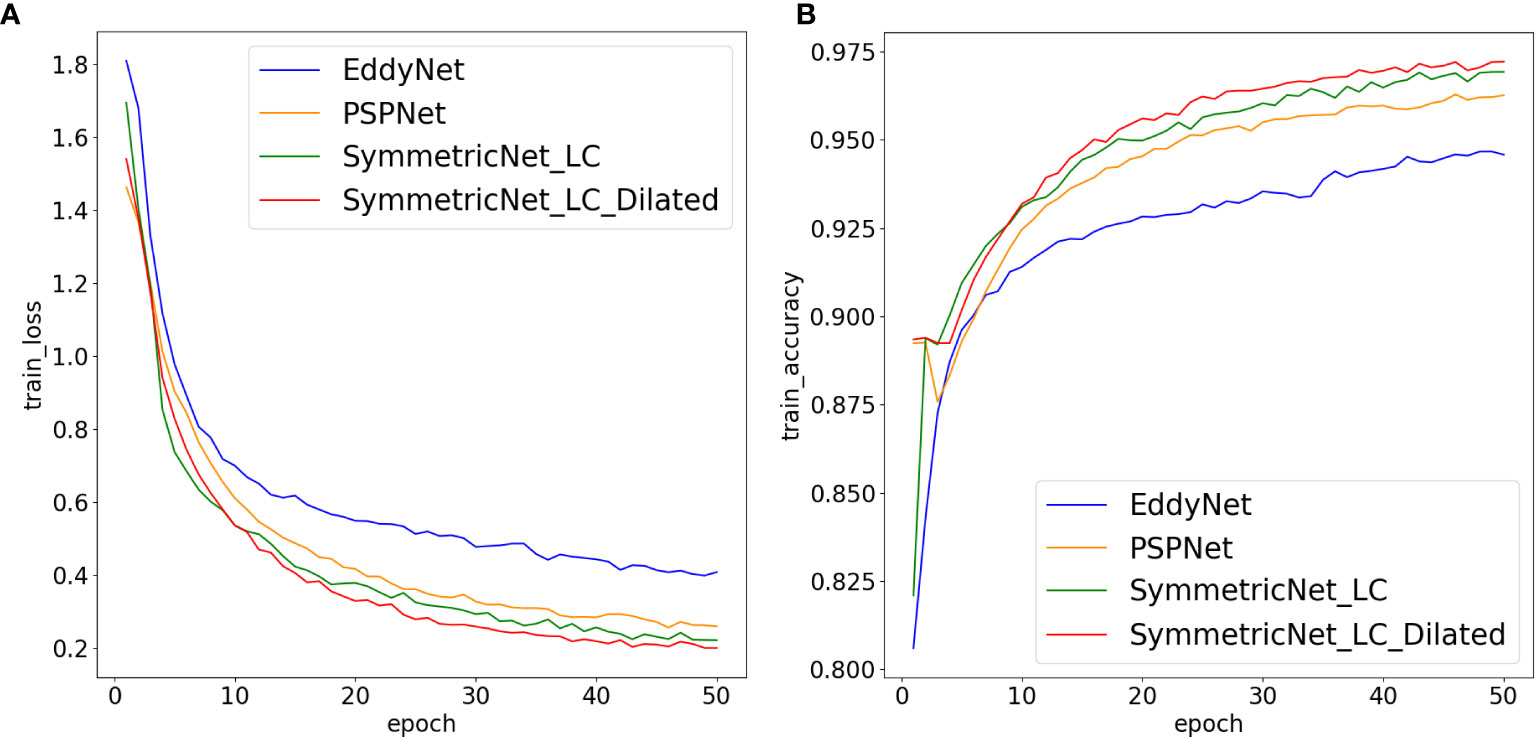
Figure 8 Loss and accuracy curves obtained by using different networks on the multi-modal training set. (A) Loss curve (B) Accuracy curve.
Similar to the preceding subsection, we also give detection performances by using the compared networks on the multi-modal training and test sets in Tables 3, 4, respectively. As can be observed from the tables, our proposed network yields best results among compared networks. Examples of eddy detection using the compared networks on the multi-modal test set are shown in Figure 9.
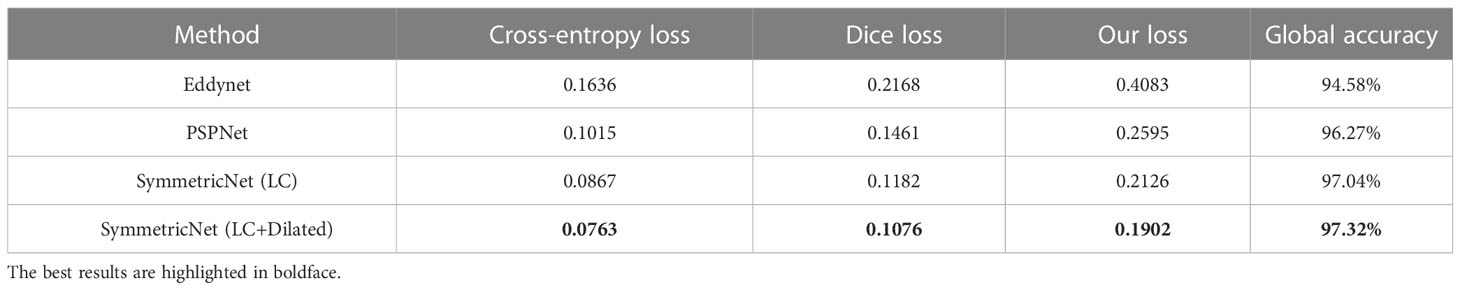
Table 3 Loss and accuracy obtained by using different networks on the multi-modal training set.
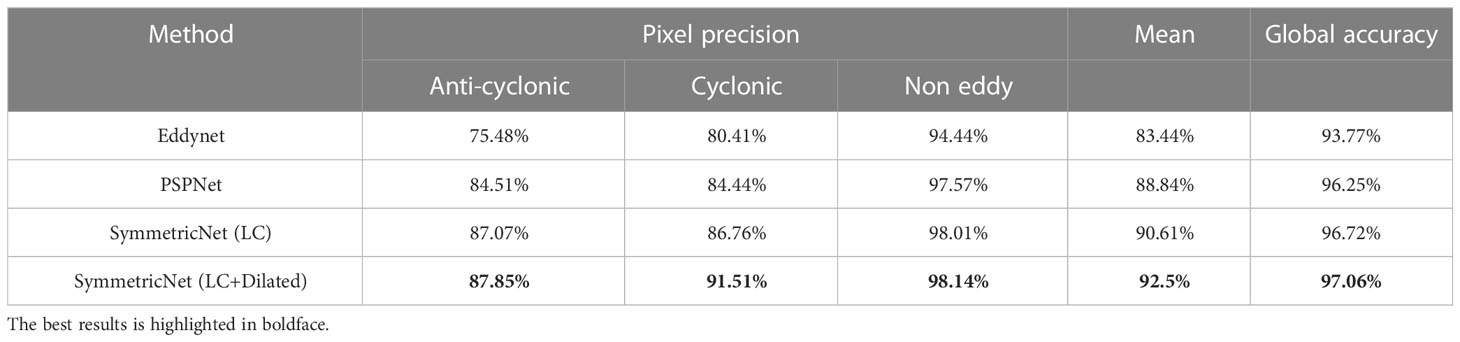
Table 4 Detection results obtained by using different networks on the multi-modal test set.
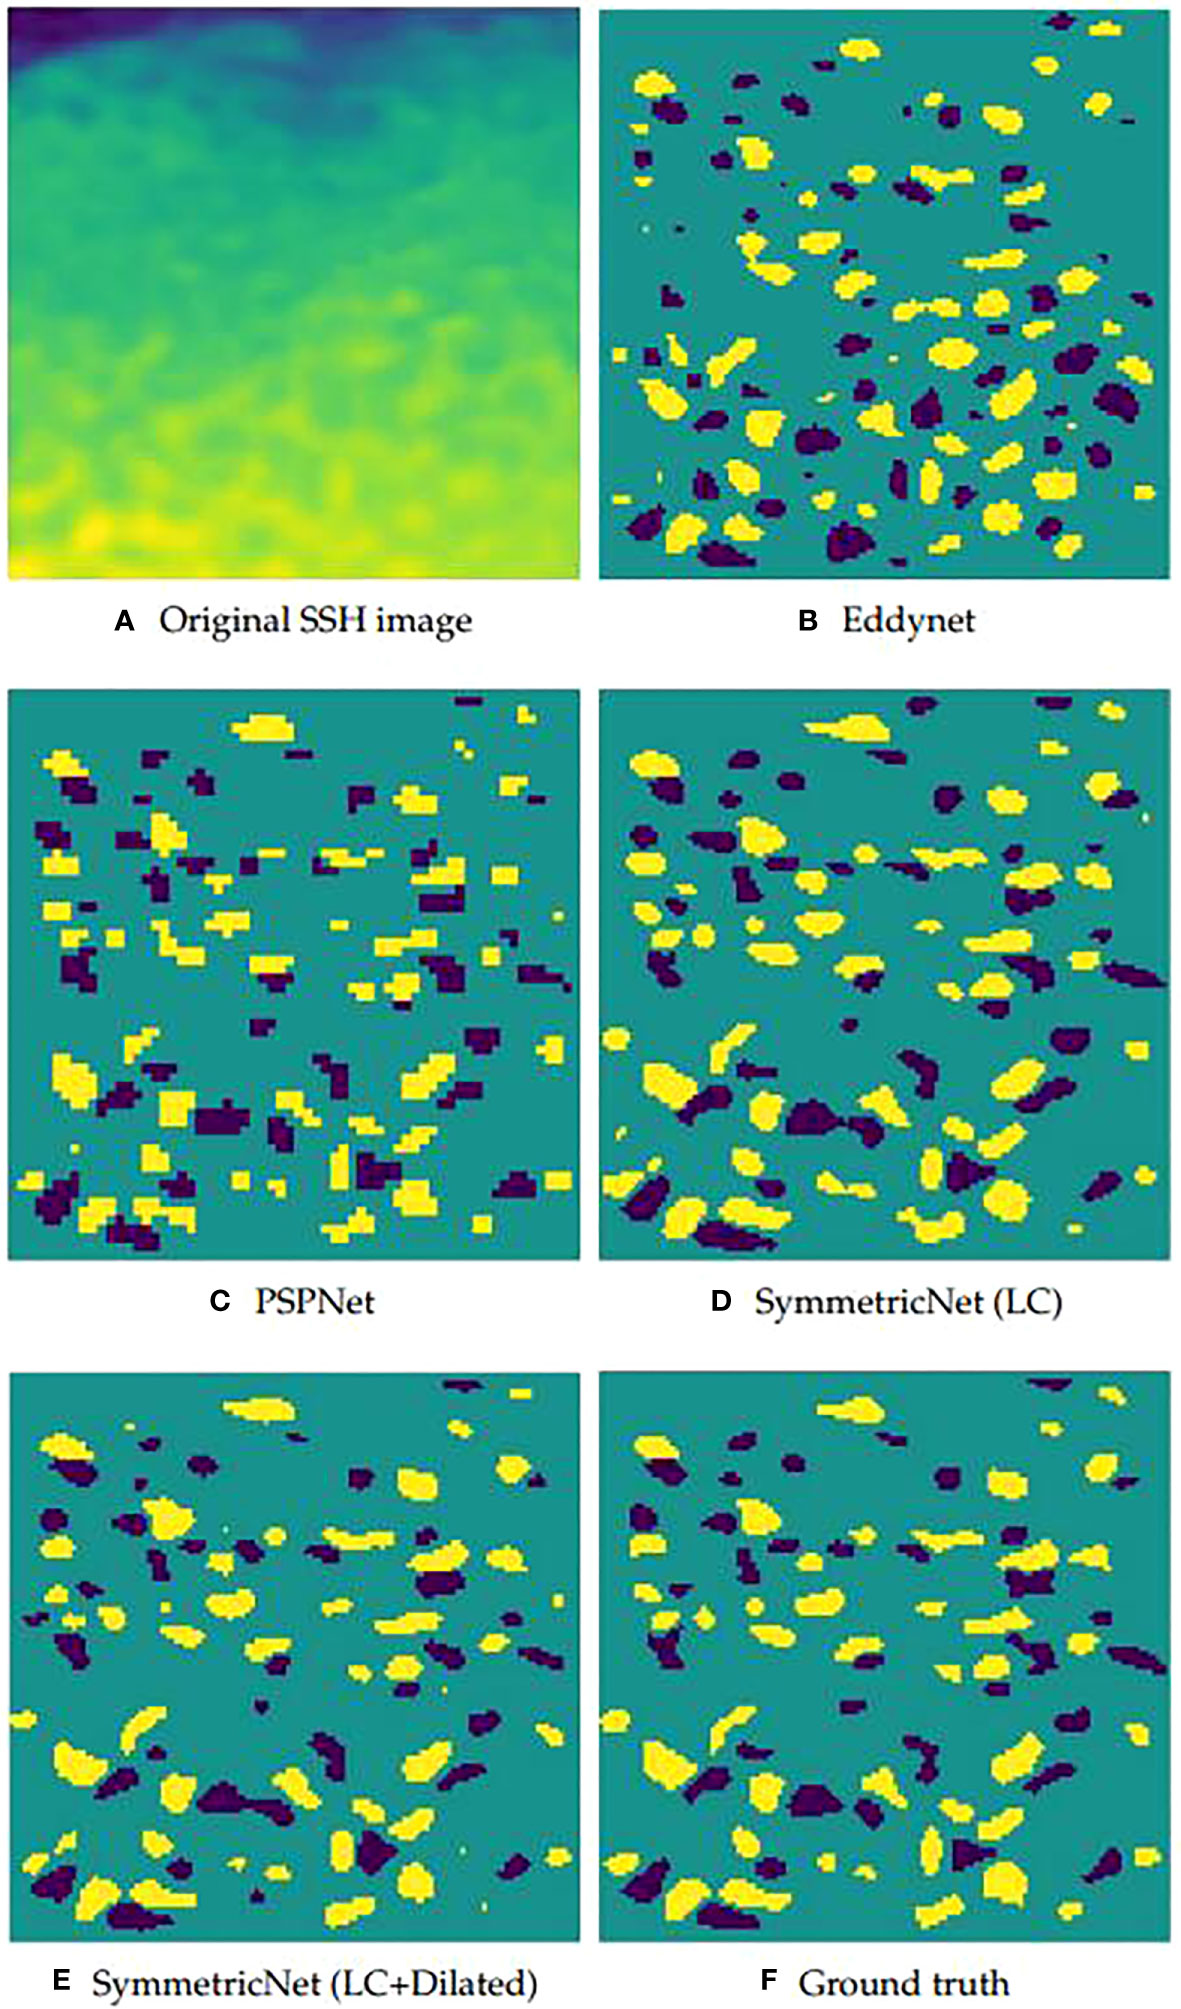
Figure 9 Eddy detection results obtained by using different networks on the multi-modal test set. (A) SSH image in a region of sea; (B–E) Eddy detection results from the same region of sea using the compared networks; (F) Ground truth labeled by experts in the same region of sea according to the SSH image.
To demonstrate the advantage of the proposed network using our constructed multi-modal dataset more convincingly, the accuracy results obtained by using SymmetricNet and the compared networks on three modals of data and multi-modal data are shown in Table 5. The performance by using the proposed SymmetricNet on our constructed multi-modal data is the best.
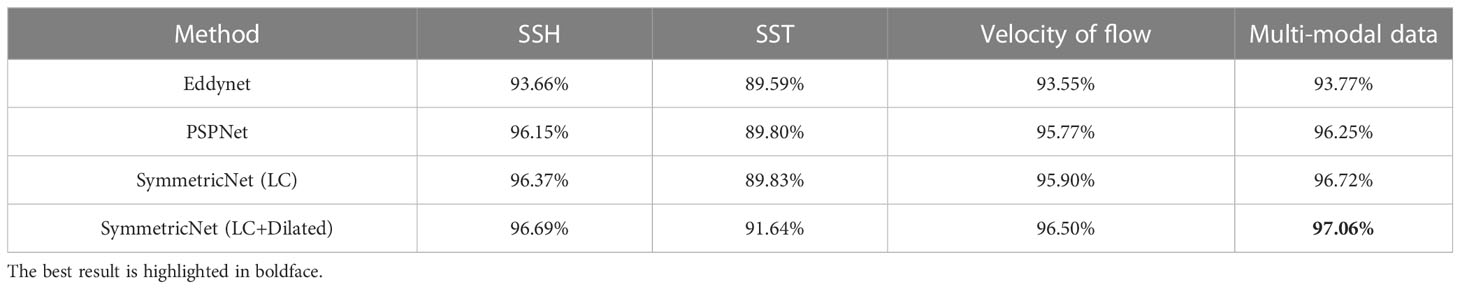
Table 5 Accuracy obtained by using different networks on three modals of data and multi-modal data of test set.
In this work, we trained our network with a loss function that combines the dice loss function and the cross-entropy loss function. The dice loss function is popular in semantic segmentation, and the cross-entropy loss function has been widely used on classification problems. In our experiments, we used different loss functions when training the proposed SymmetricNet on the multi-modal dataset to validate the effectiveness of our loss function.
The comparison among the cross-entropy loss function, dice loss function and our combined loss function is shown in Tables 6, 7. As can be seen from the tables, in terms of loss, precision and accuracy, our loss function achieves the best performance.
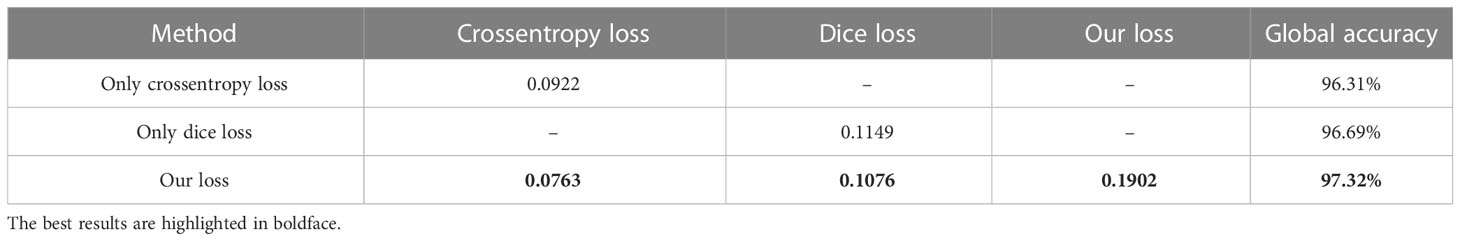
Table 6 Loss and accuracy obtained by using different loss functions on the training set.
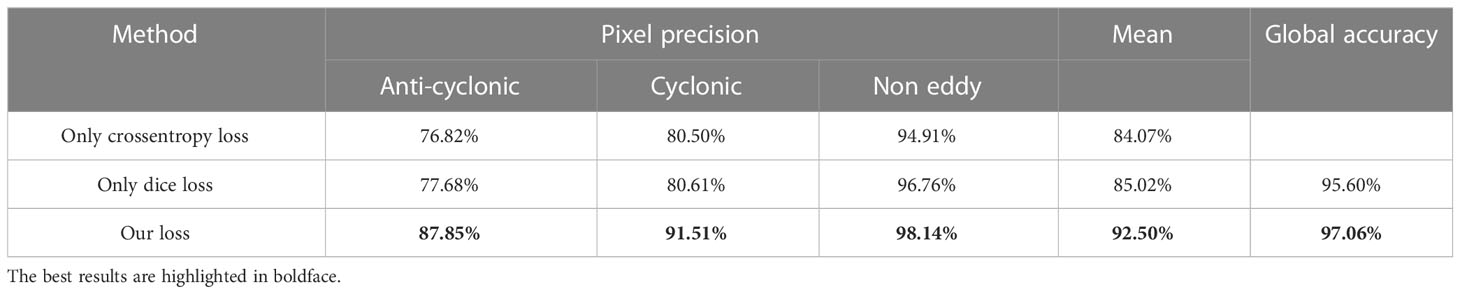
Table 7 Detection results obtained by using different loss functions on the test set.
In this section, we discuss the results of the comparative experiments in Section 3.3. We show the results of comparative experiments from three aspects, i.e., results on different modals of data, results on different networks and results on different loss functions. Here, we firstly discuss the results from two aspects, i.e., the effect of different modals of data, the effect of different networks. The analysis of loss function is introduced in Section 2.2, thus there is no further discussion in this section. Lastly, we discuss future research.
In Section 3.3.1, we show results on different modals of data. Firstly, we show the learning curves on three modals of data respectively and multi-modal data in Figure 6, and show the loss and accuracy on three modals of data and multi-modal data after training 50 epochs in Table 1. From Figure 6 and Table 1, we can see that the results based on multi-modal data are significantly better than those based on the three single-modal data. Additionally, one can clearly see the influence of the three modals of data on mesoscale eddy detection. It is evident that the SSH is the most important among the three modals, which has been widely studied in the literature. The velocity of flow also plays a significant role in the research of mesoscale eddy detection. Not only is the characteristics of the velocity of flow closely related to mesoscale eddies, but it occupies two of the four channels of multi-modal data. In addition, because a large fraction of the ocean satisfies the geotropic balance, the velocity of flow also directly links to the gradient of SSH. Therefore, both of these two modals of data have similar effects on mesoscale eddy detection. In comparison, the effect of SST on mesoscale eddy detection is not as evident as its counterparts. However, because SST can represent mesoscale eddies to a certain extent, it also has a certain positive influence on the mesoscale eddy detection. Therefore, multi-modal data can more comprehensively characterize mesoscale eddies during training, which is beneficial to the improvement of mesoscale eddy detection performance.
After the training, we show comparison results on the test set. In addition to the global accuracy shown in Table 1, we add the precision to further verify the experimental results. Precision refers to the proportion of the number of correctly classified pixels in a category to the number of all pixels predicted to be in this category, which is suitable for mesoscale eddy pixel-by-pixel classification task. Table 2 shows the precision of the three categories, i.e., cyclonic eddies, anti-cyclonic eddies and background. At the same time, we also calculate the mean precision of these three categories to verify the effectiveness of SymmetricNet. Regardless of the precision of a single category, the mean precision or the global accuracy, the results of SymmetricNet on the multi-modal data test set are higher than the results on other single-modal data. For cyclonic eddies and anti-cyclonic eddies which are difficult to detect, SymmetricNet achieved 91.51% and 87.85% precision on the multi-modal test set, which has great improvement compared with the results based on the other three single-modal data.
Lastly, we show Figure 7 to verify the validity of multi-modal data qualitatively. It is clear that the detection result using the SST data misses many eddies and the detection result using the velocity of flow data detects some ‘fake’ eddies erroneously. Although the detection results based on the SSH data and our multi-modal data are similar, one can assert that the detection result based on our multi-modal data is more accurate than that based on the SSH data in terms of detection details.
In order to prove that SymmetricNet proposed is superior to the current existing methods in mesoscale eddy detection, this paper applies multi-modal data to different networks models to conduct comparative experiments. In this paper, we carry out mesoscale eddy detection from the perspective of semantic segmentation. Thus, the compared methods chosen are EddyNet and PSPNet, which use pixel-by-pixel classification to achieve mesoscale eddy detection. EddyNet and the network proposed by Santana are implemented based on U-Net, the network structures of the two are roughly the same. Therefore, this paper selects EddyNet as the representative of the two. In addition, this paper replaces the dilated convolutions in SymmetricNet with the traditional convolutions, and uses it as a compared network to verify the effectiveness of dilated convolutions. Figure 8 shows loss and global accuracy curves of different networks on the multi-modal training set, Table 3 shows loss and global accuracy of different networks after training 50 epochs on multi-modal data. Global accuracy, precision of different categories and average precision of different networks on the multi-modal test set are shown in Table 4. We can see that the results of mesoscale eddy detection based on SymmetricNet are better than those obtained based on other comparative networks no matter in the process of training or testing. The number of convolutional layers of EddyNet is relatively shallow, which leads to insufficient feature extraction. Although the number of network layers of PSPNet are relatively deep, the downsampling scale of the pyramid pooling module in the network is large, resulting in serious information loss. Additionally, dilated convolutions can expand the receptive field to obtain more contextual information. Therefore, these comparative networks have poor performance on mesoscale eddy detection compared with SymmetricNet.
In addition to using quantitative indicators to verify the effectiveness of SymmetricNet proposed in this study, Figure 9 compares the results of mesoscale eddy detection based on different networks from a qualitative perspective. Apparently, the detection result of our method is the closest to the ground truth. However, EddyNet misses a lot of eddies, PSPNet locates eddies inaccurately, and SymmetricNet without dilated convolution detects some ‘fake’ eddies.
Table 5 shows the global accuracy of different networks based on different modals of data, further proving that the multi-modal data and SymmetricNet improve the mesoscale eddy detection performance. As can be seen from the table, our method is better than the others for all the data used, and the results obtained on our constructed multi-modal data are better than those tested on the individual modals of data for all the networks.
In this paper, we collect a multi-modal dataset and design SymmetricNet to detect mesoscale eddies, improving the accuracy of the mesoscale eddy detection. However, there are some shortcomings in this study, which need further improvement and perfection in future research. In this subsection, future research will be discussed in the following three aspects:
● To solve the problem that only single-modal data are mainly used for mesoscale eddy detection, a multi-modal dataset containing the SSH, SST and the velocity of flow is constructed. In the future study, we will continue to consider other modals of data affecting mesoscale eddies and expand the multi-modal data. In addition, in order to make the network have strong generalization ability, we will also increase the number of samples in the dataset in the future. Furthermore, in the process of data labeling, this study only uses SSH images for annotation. Although the annotation based on the SSH images is helpful for comparison with existing methods only using SSH, this study cannot output suitable fused feature maps for labeling. Therefore, the future research will find a suitable multi-modal data fused feature map, completing the annotation on the multi-modal data, and make the data match the ground truth.
● In response to the inaccuracy of the mesoscale eddy detection method, this study designs a deep network named SymmetricNet. Although SymmetricNet has achieved relatively good results, there is still room for improvement. The future work will continue to optimize the network. In this paper, we detect mesoscale eddies by pixel-by-pixel classification of ocean remote sensing images. Consequently, in the future research, we will learn ideas from current excellent work in semantic segmentation and improve existing networks to obtain better results.
● Considering the lifetime of mesoscale eddies, we will detect the eddies trajectories following its path until its disappearance in the future. We think it would be significant to discuss the mesoscale eddy detection from this perspective.
In this paper, we construct a multi-modal dataset for mesoscale eddy detection, which contains the SSH, SST and velocity of flow data. Additionally, a new network termed SymmetricNet is proposed, which is capable of fusing multi-modal data to boost the mesoscale eddy detection accuracy. SymmetricNet is capable of fusing low-level feature maps from the downsampling pathway and high-level feature maps from the upsampling pathway via lateral connections. In addition, dilated convolution is employed in our proposed network to obtain rich contextual information without losing resolution. To evaluate the constructed multi-modal dataset, our proposed network and the combined loss function, we conduct extensive experiments on different modals of data, different networks and different loss functions. It was demonstrated that the proposed method using our constructed multi-modal dataset outperforms the state-of-the-art existing approaches on mesoscale eddy detection.
The raw data supporting the conclusions of this article will be made available by the authors, without undue reservation.
All authors listed have made a substantial, direct, and intellectual contribution to the work, and approved it for publication.
This work was partially supported by the National Key Research and Development Program of China under Grant No. 2018AAA0100400, HY Project under Grant No. LZY2022033004, the Natural Science Foundation of Shandong Province under Grants No. ZR2020MF131 and No. ZR2021ZD19, Project of the Marine Science and Technology cooperative Innovation Center under Grant No. 22-05-CXZX-04-03-17, the Science and Technology Program of Qingdao under Grant No. 21-1-4-ny-19-nsh, and Project of Associative Training of Ocean University of China under Grant No. 202265007.
We want to thank “Qingdao AI Computing Center” and “Eco-Innovation Center” for providing inclusive computing power and technical support of MindSpore during the completion of this paper.
The authors declare that the research was conducted in the absence of any commercial or financial relationships that could be construed as a potential conflict of interest.
All claims expressed in this article are solely those of the authors and do not necessarily represent those of their affiliated organizations, or those of the publisher, the editors and the reviewers. Any product that may be evaluated in this article, or claim that may be made by its manufacturer, is not guaranteed or endorsed by the publisher.
Caesar H., Uijlings J., Ferrari V. (2018). “Coco-stuff: thing and stuff classes in context,” in Proc. IEEE computer vision and pattern recognition (Salt Lake, UT: IEEE), 1209–1218.
Canny J. F. (1986). A computational approach to edge detection. IEEE Trans. Pattern Anal. Mach. Intell. 8, 679–698. doi: 10.1109/TPAMI.1986.4767851
Chaigneau A., Gizolme A., Grados C. (2008). Mesoscale eddies off Peru in altimeter records: identification algorithms and eddy spatio-temporal patterns. Prog. Oceanography 79, 106–119. doi: 10.1016/j.pocean.2008.10.013
Chan T.-H., Jia K., Gao S., Lu J., Zeng Z., Ma Y. (2015). Pcanet: a simple deep learning baseline for image classification? IEEE Trans. Image Process. 24, 5017–5032. doi: 10.1109/TIP.2015.2475625
Chelton D. B., Schlax M. G., Samelson R. M. (2011). Global observations of nonlinear mesoscale eddies. Prog. Oceanography 91, 167–216. doi: 10.1016/j.pocean.2011.01.002
Chelton D. B., Schlax M. G., Samelson R. M., de Szoeke R. A. (2007). Global observations of large oceanic eddies. Geophys. Res. Lett. 34. doi: 10.1029/2007GL030812
Chen L.-C., Papandreou G., Kokkinos I., Murphy K., Yuille A. L. (2015). “Semantic image segmentation with deep convolutional nets and fully connected crfs,” in Proc. International Conference on Learning Representations, (San Diego, CA: OpenReview).
Chen L.-C., Zhu Y., Papandreou G., Schroff F., Adam H. (2018). “Encoder-decoder with atrous separable convolution for semantic image segmentation,” in Proc. European Conference on Computer Vision, (Munich, Germany: Springer). 833–851.
Cordts M., Omran M., Ramos S., Rehfeld T., Enzweiler M., Benenson R., et al. (2016). “The cityscapes dataset for semantic urban scene understanding,” in Proc. IEEE Computer Vision and Pattern Recognition, (Las Vegas, NV: IEEE). 3213–3223.
Doglioli A., Blanke B., Speich S., Lapeyre G. (2007). Tracking coherent structures in a regional ocean model with wavelet analysis: application to cape basin eddies. J. Geophys Res: Oceans 112. doi: 10.1029/2006JC003952
Dong C., Liu Y., Lumpkin R., Lankhorst M., Chen D., McWilliams J. C., et al. (2011a). A scheme to identify loops from trajectories of oceanic surface drifters: an application in the kuroshio extension region. J. Atmospheric Oceanic Technol. 28, 1167–1176. doi: 10.1175/JTECH-D-10-05028.1
Dong C., Nencioli F., Liu Y., McWilliams J. C. (2011b). An automated approach to detect oceanic eddies from satellite remotely sensed sea surface temperature data. IEEE Geosci. Remote Sens. Lett. 8, 1055–1059. doi: 10.1109/LGRS.2011.2155029
Du Y., Song W., He Q., Huang D., Liotta A., Su C. (2019). Deep learning with multi-scale feature fusion in remote sensing for automatic oceanic eddy detection. Inf. Fusion 49, 89–99. doi: 10.1016/j.inffus.2018.09.006
Duo Z., Wang W., Wang H. (2019). Oceanic mesoscale eddy detection method based on deep learning. Remote Sens. 11, 1921. doi: 10.3390/rs11161921
Everingham M., Eslami S. A., Van Gool L., Williams C. K., Winn J., Zisserman A. (2015). The pascal visual object classes challenge: a retrospective. Int. J. Comput. Vision 111, 98–136. doi: 10.1007/s11263-014-0733-5
Faghmous J. H., Styles L., Mithal V., Boriah S., Liess S., Kumar V., et al. (2012). “Eddyscan: a physically consistent ocean eddy monitoring application,” in Proc. IEEE Conference on Intelligent Data Understanding, (Boulder, CO: IEEE). 96–103.
Fernandes A. M. (2009). Study on the automatic recognition of oceanic eddies in satellite images by ellipse center detection - the iberian coast case. IEEE Trans. Geosci. Remote Sens. 47, 2478–2491. doi: 10.1109/TGRS.2009.2014155
Fu L.-L., Chelton D. B., Le Traon P.-Y., Morrow R. (2010). Eddy dynamics from satellite altimetry. Oceanography 23, 14–25. doi: 10.5670/oceanog.2010.02
Griffa A., Lumpkin R., Veneziani M. (2008). Cyclonic and anticyclonic motion in the upper ocean. Geophys. Res. Lett. 35. doi: 10.1029/2007GL032100
He K., Gkioxari G., Dollar P., Girshick R. (2017). “Mask r-cnn,” in Proc. IEEE International Conference on Computer Vision, (Venice, Italy: IEEE). 2980–2988.
He K., Zhang X., Ren S., Sun J. (2015). Spatial pyramid pooling in deep convolutional networks for visual recognition. IEEE Trans. Pattern Anal. Mach. Intell. 37, 1904–1916. doi: 10.1109/TPAMI.2015.2389824
Illingworth J., Kittler J. (1988). A survey of the hough transform. Comput. Vision Graphics Image Process. 44, 87–116. doi: 10.1016/S0734-189X(88)80033-1
Isern-Fontanet J., Garc´ıa-Ladona E., Font J. (2003). Identification of marine eddies from altimetric maps. J. Atmospheric Oceanic Technol. 20, 772–778. doi: 10.1175/1520-0426(2003)20<772:IOMEFA>2.0.CO;2
Ji G., Chen X., Huo Y., Jia T. (2002). A automatic detection method for mesoscale eddies in ocean remote sensing image. Ocean Lake 33, 139–144.
Krizhevsky A., Sutskever I., Hinton G. E. (2012). Imagenet classification with deep convolutional neural networks. Proc. Adv. Neural Inf. Process. Syst. 25, 1106–1114. doi: 10.5555/2999134.2999257
Lankhorst M. (2006). A self-contained identification scheme for eddies in drifter and float trajectories. J. Atmospheric Oceanic Technol. 23, 1583–1592. doi: 10.1175/JTECH1931.1
Lguensat R., Sun M., Fablet R., Tandeo P., Mason E., Chen G. (2018). “Eddynet: a deep neural network for pixel-wise classification of oceanic eddies,” in Proc. IEEE International Geoscience and Remote Sensing Symposium, (Valencia, Spain: IEEE). 1764–1767.
Li B., Tang H., Ma D., Lin J. (2022). A dual-attention mechanism deep learning network for mesoscale eddy detection by mining spatiotemporal characteristics. J. Atmospheric Oceanic Technol. 39, 1115–1128. doi: 10.1175/JTECH-D-21-0128.1
Long J., Shelhamer E., Darrell T. (2015). “Fully convolutional networks for semantic segmentation,” in Proc. IEEE Computer Vision and Pattern Recognition, (Boston, MA: IEEE). 3431–3440.
Mason E., Pascual A., McWilliams J. C. (2014). A new sea surface height–based code for oceanic mesoscale eddy tracking. J. Atmospheric Oceanic Technol. 31, 1181–1188. doi: 10.1175/JTECH-D-14-00019.1
Moschos E., Stegner A., Schwander O., Gallinari P. (2020). Classification of eddy sea surface temperature signatures under cloud coverage. IEEE J. Selected Topics Appl. Earth Observations Remote Sens. 13, 3437–3447. doi: 10.1109/JSTARS.2020.3001830
Mottaghi R., Chen X., Liu X., Cho N.-G., Lee S.-W., Fidler S., et al. (2014). The role of context for object detection and semantic segmentation in the wild. In Proc. IEEE Comput. Vision Pattern Recognition Columbus OH., 891–898. doi: 10.1109/CVPR.2014.119
Nichol D. G. (1987). Autonomous extraction of an eddy-like structure from infrared images of the ocean. IEEE Trans. Geosci. Remote Sens. GE-25, 28–34. doi: 10.1109/TGRS.1987.289778
Peckinpaugh S. H., Holyer R. J. (1994). Circle detection for extracting eddy size and position from satellite imagery of the ocean. IEEE Trans. Geosci. Remote Sens. 32, 267–273. doi: 10.1109/36.295041
Penven P., Echevin V., Pasapera J., Colas F., Tam J. (2005). Average circulation, seasonal cycle, and mesoscale dynamics of the Peru current system: a modeling approach. J. Geophys. Res. Oceans 110.
Ronneberger O., Fischer P., Brox T. (2015). “U-net: convolutional networks for biomedical image segmentation,” in Proc. Medical Image Computing and Computer-Assisted Intervention, (Munich, Germany: Springer). 234–241.
Santana O. J., Hernandez-Sosa D., Martz J., Smith R. N. (2020). Neural network training for the detection and classification of oceanic mesoscale eddies. Remote Sens. 12, 2625. doi: 10.3390/rs12162625
Santana O. J., Hernandez-Sosa D., Smith R. N. (2022). Oceanic mesoscale eddy detection and convolutional neural network complexity. Int. J. Appl. Earth Observation Geoinformation 113, 102973. doi: 10.1016/j.jag.2022.102973
Sermanet P., Eigen D., Zhang X., Mathieu M., Fergus R., Le Cun Y. (2014). “Overfeat: integrated recognition, localization and detection using convolutional networks,” in Proc. International Conference on Learning Representations, (Banff, Canada: OpenReview).
Voorhis A. D., Schroeder E. H., Leetmaa A. (1976). The influence of deep mesoscale eddies on sea surface temperature in the north atlantic subtropical convergence. J. Phys. Oceanography 6, 953–961. doi: 10.1175/1520-0485(1976)006<0953:TIODME>2.0.CO;2
Wyrtki K., Magaard L., Hager J. (1976). Eddy energy in the oceans. J. Geophysical Res. 81, 2641–2646. doi: 10.1029/JC081i015p02641
Xu G., Cheng C., Yang W., Xie W., Kong L., Hang R., et al. (2019). Oceanic eddy identification using an ai scheme. Remote Sens. 11, 1349. doi: 10.3390/rs11111349
Yu F., Koltun V. (2016). “Multi-scale context aggregation by dilated convolutions,” in Proc. International Conference on Learning Representations. (San Juan, Puerto Rico: OpenReview).
Keywords: deep learning, mesoscale eddy detection, multi-modal, data fusion, dilated convolutions
Citation: Zhao Y, Fan Z, Li H, Zhang R, Xiang W, Wang S and Zhong G (2023) SymmetricNet: end-to-end mesoscale eddy detection with multi-modal data fusion. Front. Mar. Sci. 10:1174818. doi: 10.3389/fmars.2023.1174818
Received: 27 February 2023; Accepted: 14 July 2023;
Published: 04 August 2023.
Edited by:
Mark C. Benfield, Louisiana State University, United StatesReviewed by:
Peng Ren, China University of Petroleum (East China), ChinaCopyright © 2023 Zhao, Fan, Li, Zhang, Xiang, Wang and Zhong. This is an open-access article distributed under the terms of the Creative Commons Attribution License (CC BY). The use, distribution or reproduction in other forums is permitted, provided the original author(s) and the copyright owner(s) are credited and that the original publication in this journal is cited, in accordance with accepted academic practice. No use, distribution or reproduction is permitted which does not comply with these terms.
*Correspondence: Shengke Wang, bmV2ZXJtZUBvdWMuZWR1LmNu; Guoqiang Zhong, Z3F6aG9uZ0BvdWMuZWR1LmNu
Disclaimer: All claims expressed in this article are solely those of the authors and do not necessarily represent those of their affiliated organizations, or those of the publisher, the editors and the reviewers. Any product that may be evaluated in this article or claim that may be made by its manufacturer is not guaranteed or endorsed by the publisher.
Research integrity at Frontiers
Learn more about the work of our research integrity team to safeguard the quality of each article we publish.