 Anwei Nie
 Zheng Wan
 ZhuangFei Shi1
 Zhaojun Wang
- 1College of Transport and Communications, Shanghai Maritime University, Shanghai, China
- 2Smithsonian Environmental Research Center, Edgewater, MD, United States
Introduction: The expansion of maritime trade has led to the introduction of invasive species into aquatic ecosystems through ballast water discharge. China, being a major player in global trade and manufacturing, has experienced negative impacts on its coastal ecosystems and marine biodiversity.
Methods: This study examines the cost‒benefit trade-offs of ballast water management policies for major port clusters in China and other global ports. This paper evaluates compliance costs for individual vessels and fleets under different policy scenarios and ballast water treatment system (BWTS) installation strategies.
Results: The onboard BWTS installation strategy appears to be more cost-effective under the existing International Maritime Organization (IMO) policy. However, with stricter global discharge requirements or a substantial increase in BWTS capital and operating costs, strategies based on port location could prove more beneficial due to potential economies of scale. Notably, ships with high ballast water discharge volumes, like bulk carriers, are potentially better equipped to cope with future policy shifts. In the face of stricter regulations in China, projected annual compliance cost increases range from $456 million (cost data based on China) to $1.205 billion (cost data based on US).
Discussion: Policymakers are advised to adopt a comprehensive view of ballast water management policies, taking into account the trade-offs between compliance costs and environmental risks. Other essential factors, such as advancements in BWTS technology, fuel consumption, emissions, and maintenance costs, also demand careful consideration in policy development.
1 Introduction
Ballast water is used to maintain the stability of ships during navigation, but it also provides a carrier for the transfer of nonindigenous species (NIS). As global trade increases, the problem of NIS introduction has become more pressing for the shipping industry (Drake et al., 2007; Ruiz et al., 2011). Aquatic species in ballast water can be transported from one port to another, outcompeting native species and causing ecological disruption and economic losses (McGeoch et al., 2010; Wan et al., 2016).
In China, the management of ballast water has become an increasingly pressing issue due to the rapid growth of its maritime industry. With its vast coastline and busy ports, China is particularly vulnerable to the introduction of invasive species through ballast water. In 2017, the first record of scyphomedusa in aquaculture ponds in China’s southern Yellow Sea was reported, which may have negative impacts on the local ecosystem and industries such as aquaculture and tourism (Dong et al., 2019). The local species community structure in the South China Sea was altered by Perna viridis, Pterois volitans, Penaeus monodon, Caulerpa racemose and green crab (Carcinus maenas), which had negative impacts on the local ecosystem and economy (Compton et al., 2010; Wang et al., 2021). Pseudocochlodinium profundisulcus, a type of algae, has been consistently reported to cause algal bloom pollution events in the ballast water of vessels traveling between ports in China and North America since its initial discovery in China in 2006 (Shang et al., 2022). The microbial community in ballast water is diverse and complex, with a large number of bacteria, cyanobacteria, and actinomycetes that may carry toxins or introduce antibiotic resistance genes (Gerhard and Gunsch, 2019). During screening, 83.3% of ballast water samples from ships at China’s Jiangyin Port were found to contain antiretroviral drugs, as well as antibiotic-resistant bacteria and multidrug-resistant bacteria (Lv et al., 2021). The total economic losses caused by invasive alien species to China in 2000 were estimated to be 144.5 billion US dollars (Xu et al., 2006).
Meanwhile, NIS from the East Asian coast also causes water pollution and damages aquatic ecosystems in other seas around the world. An invasive population of Chinese mitten crabs (Eriocheir sinensis) has recently formed in the San Francisco Bay system on the west coast of North America, causing millions of dollars in economic and ecological losses by damaging fishery resources and the aquarium industry (Dittel and Epifanio, 2009). Golden mussel (Limnoperna fortunei) is an invasive species mainly from China and Korea that has caused significant damage to the ecosystem and infrastructure of the Prata Basin in Argentina, Brazil, and other South American countries (Abelando et al., 2020; de Paula et al., 2020). One study estimated that the global economic cost of invasive species caused by ballast water discharge was approximately $162.7 billion in 2017 (Diagne et al., 2021).
To address these challenges, the International Maritime Organization (IMO) established the International Convention for the Control and Management of Ships’ Ballast Water and Sediments (IMO regulations) in 2004 (IMO, 2004). This convention requires all ships to implement measures to manage their ballast water to minimize the transfer of harmful organisms and pathogens. IMO regulations establish the D-2 standard for ballast water performance, which establishes water quality standards for ballast water discharged after treatment by approved ballast water treatment systems (BWTS). Regarding ballast water treatment systems, physical and mechanical treatment technologies are considered primary treatment technologies. Common physical and mechanical treatment technologies include filtration, cyclone separation, heating, ultrasonic treatment and ultraviolet treatment. Chemical treatment technologies (such as chlorine gas in chlorination technology) may corrode tanks and ballast water tanks. In addition, toxic chemicals and volatile disinfection by-products generated during the production of biocides and during the treatment process pose a danger to crew members, human health and the environment (Benson et al., 2017; Ziegler et al., 2018). Reviewing historical literature reveals that different treatment technologies have significant differences in microbial inactivation efficiency because biological genome sequences, cell membrane structures, morphology and size, and evolutionary stages also affect the inactivation efficiency of treatment methods in addition to external factors such as pH value, temperature, turbidity (Sayinli et al., 2022). Therefore, different combinations of treatment systems must be implemented for various organisms present in ballast tanks, which can help improve microbial inactivation efficiency and better treatment efficiency of ballast water (Bradie et al., 2021; Lakshmi et al., 2021).
BWTS aims to reduce the biological concentration in ballast water to a very small fraction and is expected to significantly reduce the risk of potential invasive species spread. According to a study, as of November 2017, more than 80% of ocean-going ships traveling between the United States and Australia did not install BWTS, and the main method of reducing biological concentration in ballast water during navigation is still ballast water exchange (BWE) with the mid-oceanic waters (Gerhard et al., 2019). Compared with BWE, the installation, operation and maintenance of BWTS that meet the D-2 discharge standard will inevitably bring costs to shipowners and operators (Werschkun et al., 2012). However, in the long run, the potential environmental damage caused by invasive species may be much higher. With the continuous updating of ballast water management and the strengthening of marine safety and pollution prevention, policy implementation and supervision at all levels of government are gradually increasing demand for BWTS, forcing more and more ships to choose more efficient and effective systems to comply with D-2 standards.
The efficacy of IMO regulations in preventing the spread of invasive species has been questioned due to the need for regular review and updating, given the emergence of new species, lack of global awareness of BWM issues, and insufficient national institutional regulations (Čampara et al., 2019; Wright, 2021). To address these concerns, the state of California in the United States has implemented its own stricter regulations for ballast water management. The California State Lands Commission has established a ballast water treatment technology verification and evaluation program, requiring ships to meet a higher standard of treatment performance than the IMO regulations (CA State Lands Commission, 2021). Although this approach aims to reduce the risks associated with ballast water discharge, it also poses significant challenges for the global shipping industry, particularly for vessels operating between California and other regions (Čampara et al., 2019).
From the perspective of treatment efficiency and analysis, the main difference between IMO regulations and stricter California regulations is different ballast water discharge standards. If a few regions transition from IMO regulations to stricter regulations such as those of California, the shipping industry will face new challenges in meeting compliance requirements. This will involve increased costs associated with the installation and maintenance of BWTS, as well as the risk of noncompliance and potential legal penalties. Nevertheless, Strict discharge standards limit the biological concentration in ballast water discharged from ship ballast tanks. This greatly reduces the survival rate of carried species, reduces the damage of invasive species to ecology and economy, and makes it an important area for continued research and improvement. China’s ports have played a critical role in the country’s economic growth, serving as major gateways for international trade and commerce (MOT, The Ministry of Transport, 2020). Due to China’s complex and diverse coasts and massive shipping volume, the country faces a significant risk of species invasion. Fortunately, China became a contracting party to the IMO regulations, which took effect for China on January 22, 2019 (Wan et al., 2021). Zhang et al., 2017 evaluated the total volume of ballast water discharge in China’s major port clusters from 2008 to 2014. The results showed that the top three foreign ballast water discharge volumes were the Yangtze River Delta (31.7% to 39.0% of all ports in the country), followed by the Bohai Rim (27.6% to 36.5%) and the Pearl River Delta (24.7% to 28.8%). The southeast and southwest coasts were the regions with the smallest amount of ballast water received, accounting for 4.8% to 6.7% and 1.8% to 2.4%, respectively. Considering the high weight of the ballast water discharge volume of the former, this paper takes the three major port clusters as the research object.
Based on this background, this study examines the potential for China to adopt regulatory standards stricter than those of IMO regulations, considering both economic and environmental perspectives. Through an analysis of the costs and benefits of each approach, the study aims to determine the most effective strategy for managing ballast water in China while balancing compliance costs with the risks of invasive species introduction. Ultimately, the goal of this study is to provide guidance for policymakers and stakeholders seeking to enhance ballast water management in China and worldwide. The innovation of this study is to simulate the transition from IMO regulations to stricter regulations in specific regions (such as China) and evaluate the economic impact and feasibility analysis of strengthening ballast water management on individual ship or global fleet.
2 Method
2.1 Ballast water
The automatic identification system (AIS) is a ship reporting system that uses transponders installed on ships and at ports, canals, and other waterways. Through dual positioning and communication services provided by land-based equipment and satellite systems, AIS records information such as real-time ship position and displacement, ship number, ship type, port of departure, and port of arrival. In this study, the study used the 2018 global shipping data recorded by AIS, and after data preprocessing, screening, and other operations, the study obtained a dataset of 42,108 independent ships and 2,341,480 voyage records, with the unique code Maritime Mobile Service Identify (MMSI) used as the unique identification of the ship.
The National Ballast Information Clearinghouse (NBIC) based in the USA is a vital resource for researchers and policymakers seeking to understand and manage the environmental impact of ballast water discharge. Since 2004, the NBIC has been collecting ballast water exchange records for every ship entering US ports (NBIC Online Database, 2012). In this study, the study utilized ballast water discharge data from 2017-2018 to perform regression analysis and estimate the volume of ballast water discharge. While the NBIC’s records are limited to vessels entering US ports, the study acknowledge that the discharge patterns observed in this region may not necessarily reflect those worldwide, including in China as a major exporting country. It is important to consider the potential differences in ballast water discharge patterns between countries. However, due to the lack of available data from other parts of the world, the study made the working assumption that all ships worldwide follow similar discharge patterns as captured in the NBIC dataset. This assumption allows us to utilize empirical data combined with regression analysis to gain in-depth insights into the global distribution and ecological impacts of ballast water discharge while acknowledging the potential uncertainties associated with applying US discharge patterns to China or other regions.
Faced with regulatory pressure on ballast water management policies, the compliance costs of ships include not only the capital costs of purchasing, installing and maintaining BWTS but also the operating costs of ensuring daily operations, which depend on the total ballast water discharge volume. Therefore, before calculating the compliance costs of fleets or individual ships, it is necessary to be able to obtain the actual ballast water discharge volume of global ships. Based on a working hypothesis (that all ships around the world follow similar discharge patterns captured in the NBIC dataset), this study uses empirical data and gravity models (Seebens et al., 2013; Wan et al., 2021) to predict the ballast water discharge volume of each ship, using ship type and deadweight tonnage as variables. The dataset revealed that ships do not always discharge ballast water every time they arrive at port, which is related to the nonzero discharge probability β. Furthermore, the ballast water discharge probability varies significantly between different ship types. For instance, the probability of discharging ballast water every time a bulk carrier calls is 57%, while the probability of discharging ballast water every time a container ship calls is only 9% (Table 1). The calculation formula is:
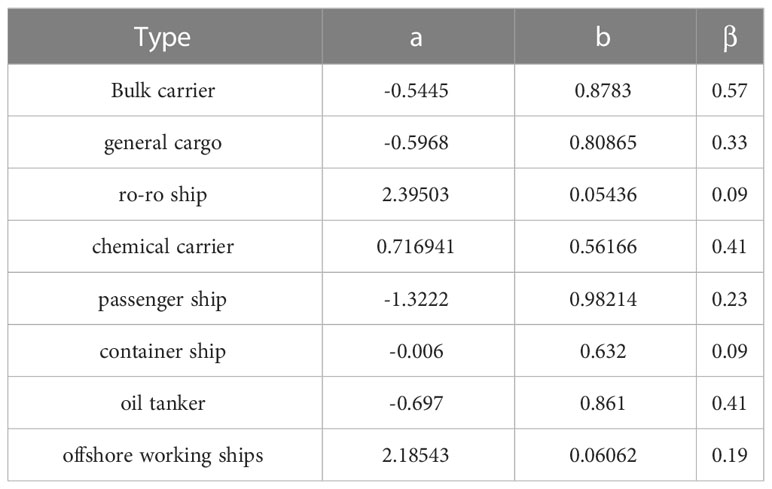
Table 1 Prediction of ballast water discharge and nonzero discharge ratio.
where represents the average ballast water discharge volume, and represents the average discharge volume excluding zero discharge. According to the research of Seebens et al. (2013), if the ship discharges ballast water, the corresponding discharge is proportional to the size of the ship and varies with the ship type. Since the dimension of ballast water discharge is different from ship deadweight ton, regression fitting is performed after logarithmic processing. The calculation formula is:
Among them, a and b represent the regression coefficients, and the parameter values are shown in Table 1. DWT: deadweight tonnage of the ship.
2.2 Policy scenario
Scenario analysis has a good effect on the choice of facing uncertainty (Morgan, 2017). In light of the uncertainties surrounding ballast water management and policy implementation, the study proposes three policy scenarios that take into account different ballast water management plans and policy implementation areas (Table 2). Ballast water management policies are categorized into IMO regulations and stricter regulations, while policy implementation areas are divided into three major port clusters in China (the Yangtze River Delta, Pearl River Delta, and Bohai Rim) and all other ports around the world. The strategies for treating ballast water discharged by ships include direct disinfection using ship-based BWTS and indirect disinfection using port-based BWTS. The barge BWTS is utilized to represent port-based BWTS in light of its economic feasibility and low occupancy benefits, as previously demonstrated by Wang et al. (2020).
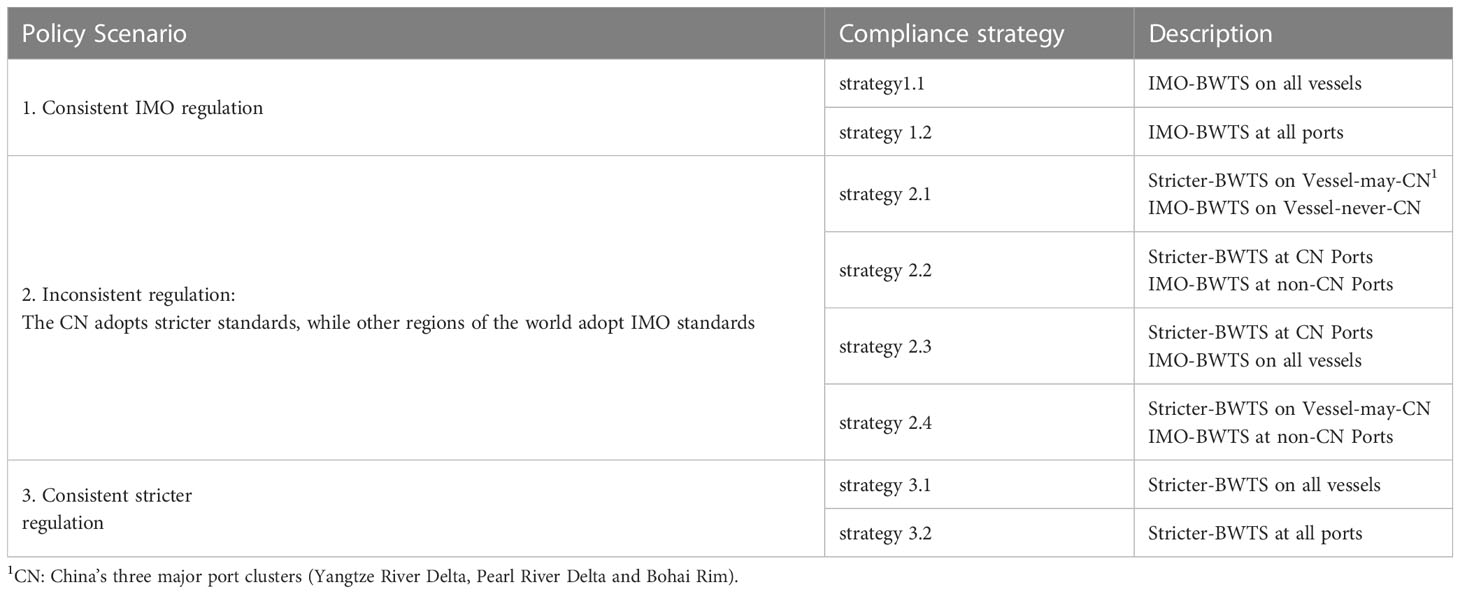
Table 2 Policy Scenario Description.
Policy Scenario 1 represents the IMO regulations currently adopted by most countries, requiring the installation of IMO standard BWTS worldwide. In Policy Scenario 2, the study assumes that the three major port clusters in China serve as pilot areas for implementing stricter regulations, while other regions of the world continue to follow IMO regulations. In Policy Scenario 3, other regions of the world gradually transition to stricter regulations, following the lead of the three major port clusters, and eventually BWTS with stricter standards will be adopted globally.
Implementing stricter regulations, as represented in Policy Scenario 2 and Policy Scenario 3, is likely to present challenges and opportunities for the shipping industry and policymakers. For example, the cost of installing and maintaining BWTS may increase, reducing the competitiveness of the shipping industry in some regions. However, high-standard BWTS can eliminate or eradicate more organisms in ballast water before discharging it into a new environment, thereby preserving marine biodiversity and enhancing ecosystem resilience (Hess-Erga et al., 2019). Therefore, reducing the spread of NIS and potential risks to ecosystems could yield benefits in terms of biosecurity and ecosystem health.
2.3 BWTS cost data
Given the volatility of the BWTS market and the uncertainty of technology, the cost data used in this analysis are subject to change. To address this issue, the study conducted a sensitivity analysis by incorporating a range of cost estimates in this analysis, including the lowest cost and 1.5 times the highest cost of BWTS. Through this approach, the study was able to assess the robustness of cost-effectiveness strategy in the face of uncertainty and variability.
To account for the potential impact of cost estimates on our analysis, the study captures BWTS cost variations associated with different geographical regions and regulatory regimes. The choice of data sources may impact the optimal strategy under different scenarios, and the study conducted sensitivity analysis to assess the robustness of the findings.
2.3.1 US-based cost data
To estimate the cost of BWTS produced in the United States that meets the IMO regulation, this paper relies on cost data (Table 3) from the research conducted by King et al. in 2009. The annual purchase, installation, and operating costs of the BWTS are based on the BWTS purchase and installation capital, with a BWTS lifespan of 30 years, a discount rate of 6%, and an annual inflation rate of 2.5%. In the case of BWTS that meets stricter standards, the cost data used in this study are obtained from the Delta Stewardship Council (Glosten, 2018), which includes the cost of barges and tugs (Table 4).
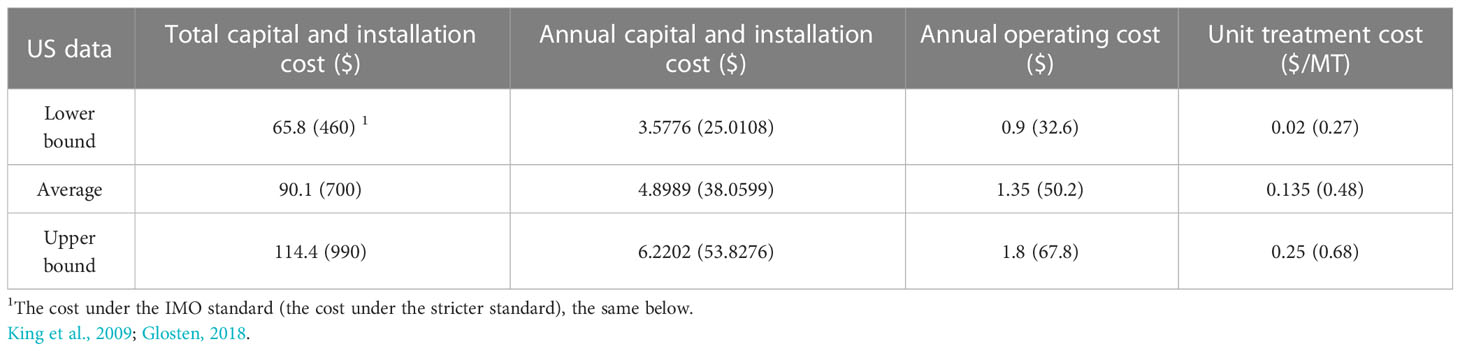
Table 3 Annual cost profile of BWTS based on US data.
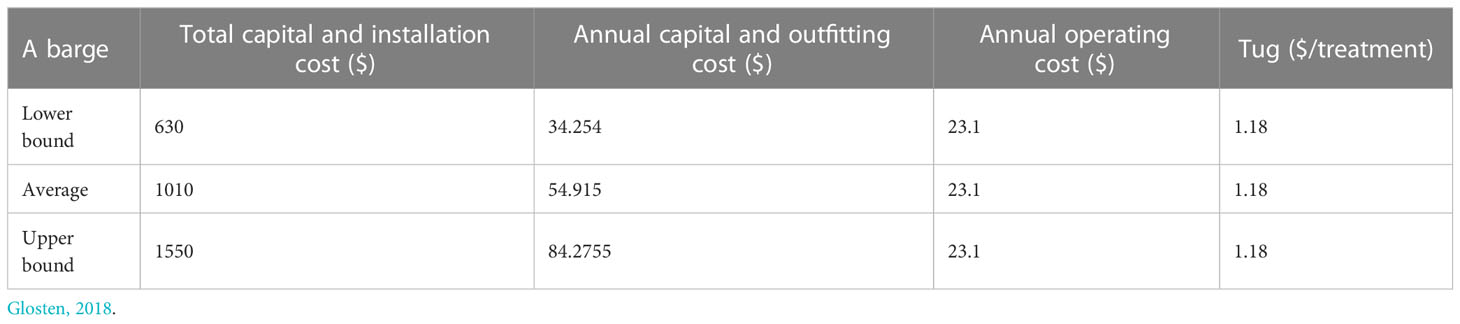
Table 4 Annual cost profile for a barge.
2.3.2 China-based cost data
Regarding the cost of BWTS produced in China that meets the IMO standard, the study consulted with a senior engineer from the China Classification Society and learned that the current cost price of BWTS ranges from 1 million RMB to 5 million RMB (Communications, Senior Engineer, China Classification Society, July 12, 2021). Additionally, by analyzing the BWTS bidding documents on the National Bidding and Purchasing Information Platform in 2021 and referring to the Chinese national industrial power consumption standard (China Tendering and Bidding Public Service Platform, 2021; NEA, National Energy Administration, 2021), the study obtained the cost data of BWTS in China (Table 5).
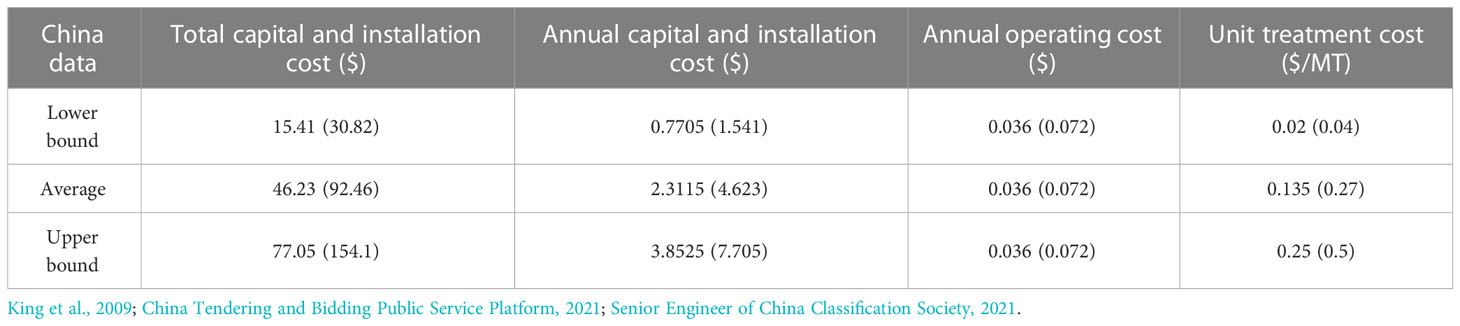
Table 5 Annual cost profile of BWTS based on China data.
When using BWTS cost data produced in China, the annual purchase and installation costs of BWTS are calculated based on the purchase capital and installation costs, assuming a service life of 20 years. Operating expenses are equal to the product of the ballast water treatment capacity and the unit electricity charges for ballast water treatment (Communications, Senior Engineer, China Classification Society, July 12, 2021). Additionally, the cost estimate data for stricter compliant BWTS comes from Chinese BWTS manufacturers. According to their predictions, the treatment efficiency of the stricter BWTS is expected to be approximately 10 times higher than the IMO standard. The treatment effect of stricter BWTS is predicted to be approximately 10 times higher than that of the IMO standard (Communications, Senior Engineer, China Classification Society, July 12, 2021).
2.4 Compliance cost model
Based on three scenario strategies, the corresponding cost models are established based on the two frameworks of world fleet and single ship.
2.4.1 Compliance cost model of world fleet
If BWTS is installed based on ships, the compliance cost of the world fleet at this time is:
where represents the number of ships in the fleet, represents the BWTS annual capital and installation cost of a ship, represents the BWTS annual operating cost of a ship, V represents the total amount of ballast water discharged by the global fleet, and T represents the treatment cost of unit ballast water.
If the BWTS is installed on a port barge, the fleet compliance cost also includes the purchase, installation and operation of the barge itself. Calculate the number of barges required for each port, taking into account the difference in the annual ballast water handling capacity of each port:
Where represents the minimum number of barges required by a port, represents the total ballast water treatment capacity of a port per year, and represents the processing capacity of BWTS. The estimated processing capacity of equipment in the United States is 2000 MT/h, and the processing capacity produced in China is 300 metric tons per hour to 1500 metric tons per hour (MT/h) (Senior Engineer of China Classification Society, July 12, 2021, communication). Under this setting, based on the barge each time the BWTS handles ballast water, it will require a corresponding number of tugboats to provide transport capacity:
where represents the number of ports, and represent the annual capital cost and operating cost of a barge, respectively, and T_tug represents the towing cost of a barge when participating in ballast water treatment.
2.4.2 Compliance cost model for a single ship
If BWTS is installed on a ship basis, the compliance cost for a single ship at this time is:
where represents the annual ballast water discharge of a single ship, and represents the annual ballast water discharge of all ships.
If the BWTS is installed on port barges, similar to the compliance cost calculation of the global fleet, the compliance cost of a single ship also includes the purchase, installation, operation and towing costs of the barge itself. Considering the difference in the maximum deadweight tonnage of ships, the calculation formula for the minimum number of barges required for a single ship is:
where represents the number of barges required for a single vessel.
Therefore, the formula for calculating the compliance cost per vessel based on port barges is:
2.5 Model assumptions
To simplify the model and calculations, this study makes the following assumptions:
Assumption 1: The ballast water discharge model fitted using regression analysis based on NBIC data is applicable to all ships in service in 2018.
Assumption 2: Ships and ports in the global shipping network have the necessary capacity or suitable conditions to install BWTS that meet regulatory requirements.
Assumption 3: Since there are currently no barges specifically designed and researched for installing BWTS in China, the study assumes that the cost data for installing BWTS on barges in China are the same as those published in the United States.
Assumption 4: The study does not differentiate between BWTS based on their disinfection ability or method; instead, the study categorizes them only according to whether they meet IMO standards or stricter standards.
2.6 The export price of China’s BWTS
The Ballast Water Management Convention, which mandates that all ships must be equipped with BWTS to meet the D-2 standard by 2024, was implemented in 2017. D-2 refers to the discharge standard for ballast water management, which sets the maximum allowable concentration of indicative microorganisms in ballast water discharged into the environment. As a result, this study only focuses on predicting the BWTS price from 2020 to 2024. The study collected the export sales and quantity of ship BWTS from 2014 to 2020 from the China Customs Import and Export Statistics website using the commodity number (84212191) (General Administration of Customs, 2021).
To understand the changing trend of BWTS cost data, the study used a combination of the gravity model and polynomial regression to fit the export price per unit of BWTS. The study then used this model to predict the expected export price from 2020 to 2024.
3 Result
3.1 Overview of ballast water discharge
Policy scenarios 1 and 3 entail globally consistent regulations (IMO or stricter), while policy scenario 2 involves different regulations being applied in pilot areas compared to control areas. Therefore, the study take into account the differentiated ballast water management approach where ships are divided into two categories based on their history of visiting the policy pilot area. The statistical analysis results in Table 6 present the number of ships and the total amount of ballast water discharged by ships in different regions. Based on the data, the study estimated that the global shipping fleet discharged approximately 1.26 billion tons of ballast water in 2018. These findings provide an overview of the ballast water discharges of ships and help to understand the potential impacts of ballast water on the marine environment.
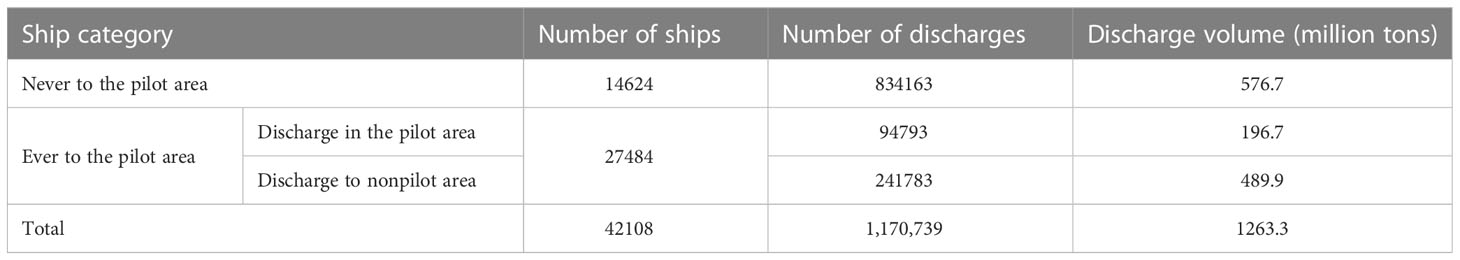
Table 6 Overview of ships and estimated ballast water discharges in 2018.
3.2 Cost-effectiveness analysis of the world fleet
3.2.1 Assessment based on US data
The compliance cost of the world fleet under each policy scenario and optimal strategies are presented in Table 7, assuming that the BWTS produced in the United States is used globally. In Policy Scenario 1, where the world adopts consistent IMO regulations, Strategy 1.1 has the lowest compliance cost among all strategies, with an average cost of only $2.802 billion. This suggests that the current strategy of installing BWTS based on ships is cost-effective in promoting IMO regulations and protecting marine life and ecological safety.
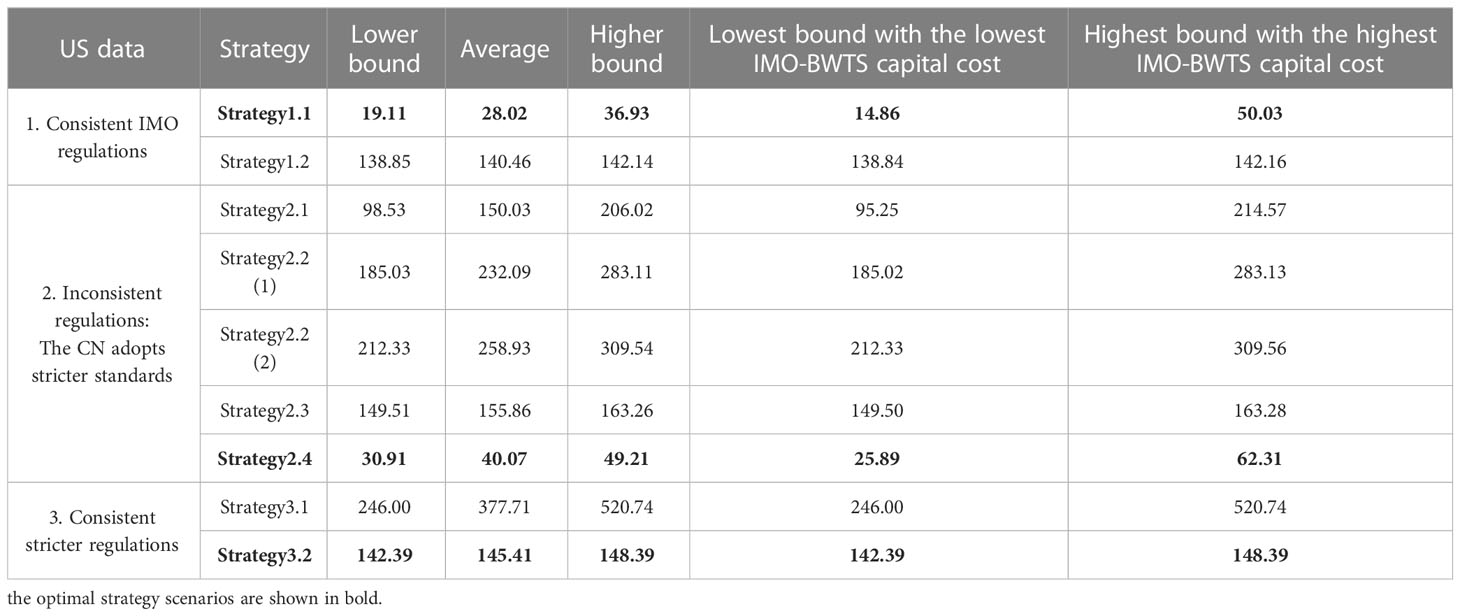
Table 7 Annual compliance cost of the world fleet based on US data (US$100 million).
In Policy Scenario 2, where stricter regulation is adopted in China’s pilot regions while IMO regulation is adopted in other regions, Strategy 2.4 is the most cost-effective among all compliance cost strategies. This strategy involves all ships installing IMO standard BWTS and port barges in China’s pilot areas installing stricter BWTS. This policy adjustment only affects the pilot areas of China and reduces the pressure on shipowners to retrofit BWTS. Moreover, stricter BWTS installed on port barges can help reduce the probability of marine invasive species invading Chinese waters and the potential losses they may cause.
In Policy Scenario 3, the compliance cost of Strategy 3.2 is significantly lower than that of Strategy 3.1, indicating that shore-based BWTS is more cost-effective as the ballast water discharge standards become stricter. Despite the higher capital cost, economies of scale make shore-based BWTS a more cost-effective option for the world’s fleet. Additionally, shore-based barges equipped with BWTS can process contaminated ballast water 24/7, achieving high equipment utilization, while ship-based BWTS are only needed during the period of port calls. Under optimal strategy 3.2, the maximum cost of installing Stricter-BWTS at all ports worldwide is $14.839 billion.
The robustness of the study’s results was verified by adjusting the upper and lower limits of capital costs for IMO-BWTS. The optimal strategies for each policy scenario remain unchanged, with Strategies 1.1, 2.4, and 3.2 continuing to be the most cost-effective options across all scenarios (Table 7).
3.2.2 Assessment based on China data
Table 8 presents the annual fleet cost of each compliance strategy when using the BWTS cost data produced in China, with the optimal strategy under each scenario. The cost of BWTS production in China is much lower than that in the United States, resulting in a lower overall compliance cost of the ship fleet based on Chinese BWTS cost data. The cost difference is particularly significant in policy scenario 3. The optimal compliance cost based on US data is almost 6 times that based on China data. However, this will also be accompanied by a significant reduction in environmental risk, as stricter BWTS produced in the United States can achieve disinfection performance that may be more than 100 times that of the IMO standard (Glosten, 2018).
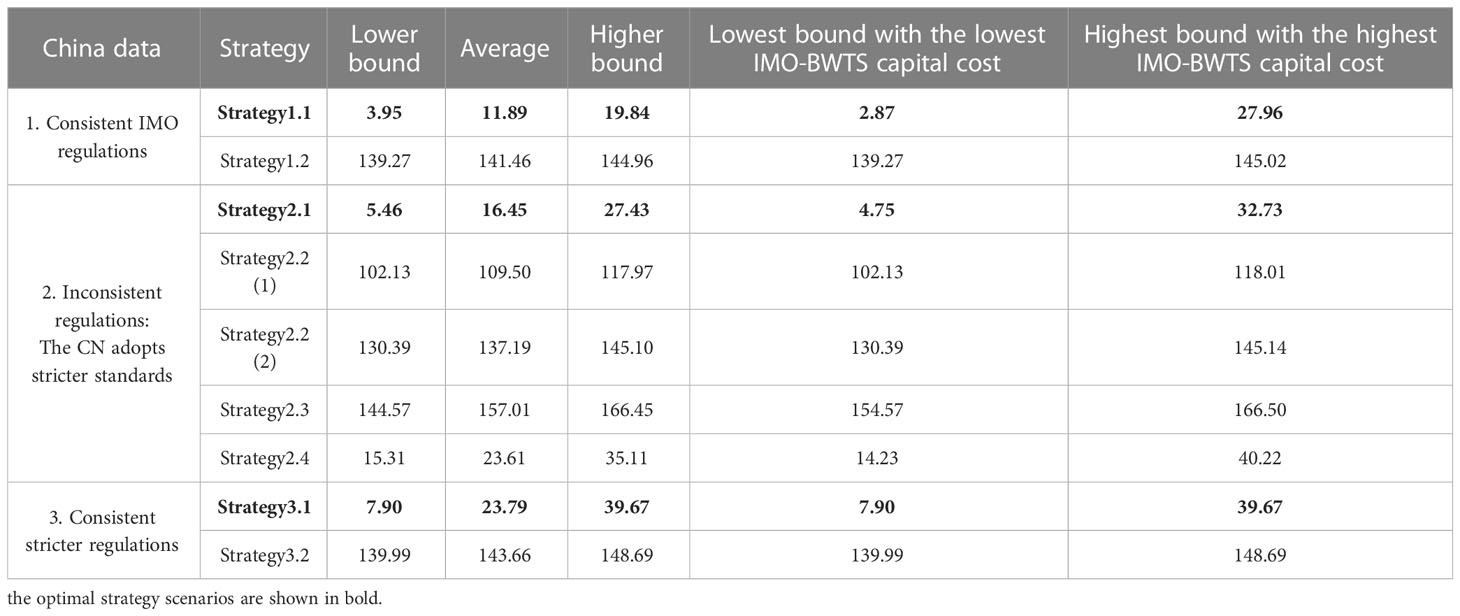
Table 8 Annual compliance cost of the world fleet based on China data ($100 million).
Compared with the United States, the significantly reduced cost of BWTS manufactured in China has also changed the best compliance strategy. The relatively low cost of BWTS is more friendly to ship-based strategies, because this strategy uses more BWTS than port-based strategies and does not depend on barge disinfection of ballast water. Consequently, the compliance cost based on port barge-installed BWTS is higher than that based on ship-installed BWTS, and the optimal strategy in Scenario 2 becomes Strategy 2.1, while the optimal strategy in Scenario 3 becomes Strategy 3.1 (Table 8).
The results based on China’s cost data also exhibit excellent robustness, even in the face of price changes. Therefore, they can serve as a reliable guide for decision-making.
3.3 Single ship compliance cost strategy
To account for the temporal variability of the cost data used in the analysis, the study have calculated not only the mean compliance costs but also the upper and lower limits to represent the extreme values under cost fluctuations. This provides decision-makers with a range of potential costs and allows them to assess the robustness of their compliance strategies under different cost scenarios. These sensitivity analyses are critical for ensuring the effectiveness and sustainability of BWTS compliance policies in the long term.
3.3.1 Evaluation based on US data
The analysis of compliance costs reveals that the average unit cost of ballast water treatment per vessel increases as regulations become stricter, with Strategy 1.1 having the lowest cost and Strategy 3.2 having the highest cost (Table 9). However, there is significant variability in the unit cost of ballast water treatment per vessel, ranging from as low as 0.24 USD to almost 13,000 USD per ton of ballast water treated. This variation is due to the inclusion of smaller vessels, such as passenger and coastal vessels, which discharge smaller volumes of ballast water annually (with the smallest volume being only 4.90 MT).
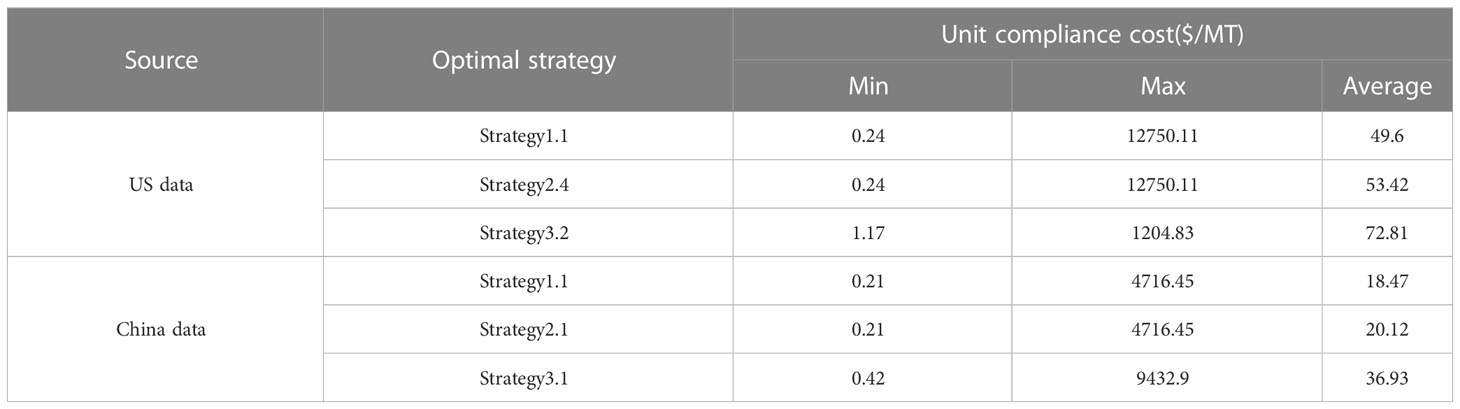
Table 9 The unit compliance cost of a single ship under the optimal cost strategy.
To capture the variability in ballast water discharge volumes and probabilities among different vessel types, the study calculated the upper and lower limits of the unit cost of ballast water treatment per vessel (Supplementary TableS1). The results indicate that among ships of the same size, the annual discharged amount of ballast water per ship is the lowest for passenger ships, while the annual compliance cost per ship is the highest. This suggests that while passenger ships may have a smaller environmental impact in terms of ballast water discharge, they may also face higher regulatory costs compared to other types of ships. On the other hand, bulk carriers have the largest annual ballast water discharge volume per vessel, and the economies of scale allow for a lower compliance cost, making it more advantageous for potentially stricter policies. These findings provide valuable information for decision-making regarding the implementation of BWTS regulations and the management of ballast water in different types of vessels.
Notably, Strategy 3.2 has a lower maximum compliance cost than Strategy 1.1, with a cost of only 1204.83 USD/MT (Table 9). This is because the port-based strategy allows shipowners to share the regulatory pressure on ballast water discharges, and the compliance cost of a single vessel primarily depends on its ballast water discharge volume. In contrast, Strategy 1.1 requires installing BWTS on each vessel, and the capital, operation, and ballast water treatment costs of the BWTS are borne by the vessel itself. For vessels with low discharge volume, the capital cost of BWTS per MT is extremely high, resulting in a high compliance cost for each vessel. However, Strategy 3.2 installs BWTS on barges in ports, and the costs of BWTS are calculated based on the needs of each port and then shared among all vessels in operation. In this way, the compliance cost borne by each vessel is proportional to its annual ballast water discharge volume.
To address the issue of high compliance costs for vessels with low discharge volumes, the study removed vessels with low discharge volumes in a proportion of 1%-30% and recalculated the compliance costs for each policy scenario by separately counting vessels above each discharge threshold (Table 10; Figure 1A). The results showed that as the discharge threshold increased, the compliance cost per vessel gradually decreased for all three strategies, indicating that installing BWTS is more cost-effective for vessels with larger ballast water discharge volumes. For vessels with a discharge threshold below 500 MT, the cost-effectiveness was low, and there was an obvious inflection point in the compliance cost per vessel for both Strategy 1.1 and Strategy 2.4. Therefore, from the perspective of shipowners’ interests, such vessels may not be suitable for installing BWTS (as used in this study), and alternative methods, such as the use of pure water, can be considered (Wang and Corbett, 2020).
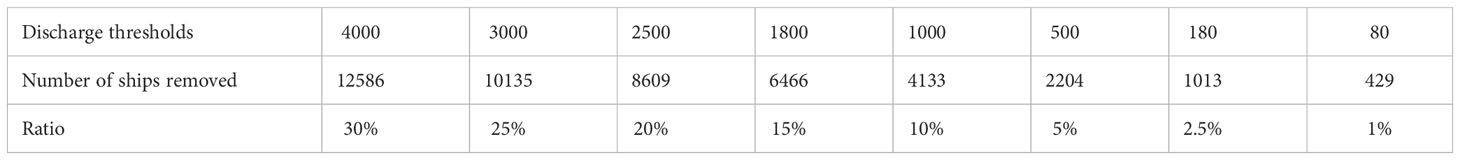
Table 10 Annual ballast water low discharge thresholds for different proportions.
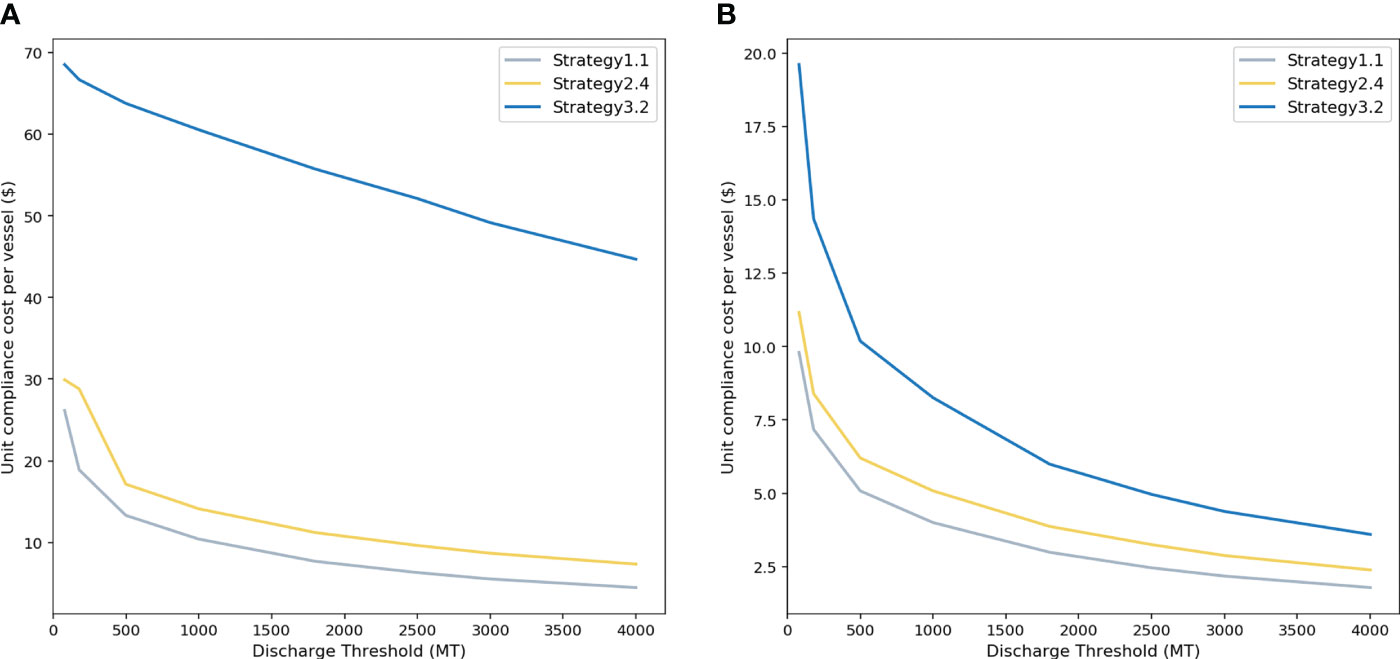
Figure 1 Changes in compliance costs of optimal strategies under different discharge thresholds. (A) Based on US data, (B) Based on China data.
3.3.2 Evaluation based on China data
The study findings suggest that the stricter installation standards of BWTS on ships, as implemented in Strategy 2.1 and Strategy 3.1, have a significant economic advantage over port-based strategies. This strategy may be effective and applicable in terms of economic and technological aspects for specific ports, as evidenced by the study conducted by King and Hagan, 2013. This is due to the lower capital and operational costs of the BWTS produced in China compared to those in the United States and the high cost of the full set of barges announced by California (Glosten, 2018).
Table 9 shows that the difference in the unit compliance cost per vessel between the strategies based on US data, Strategy 1.1 and Strategy 2.4, and the strategies based on Chinese data, Strategy 1.1 and Strategy 2.1, is minimal. This indicates that it is economically feasible for shipowners to implement stricter regulations in China’s three leading regions.
Figure 1B demonstrates that strategies based on ship-based installation of BWTS are more advantageous for high-emitting vessels, as they benefit from economies of scale, resulting in low unit compliance costs per deadweight ton. The inflection point at the same location again indicates that vessels with an annual ballast water discharge of less than 500 MT are not suitable for strategies based on ships.
3.4 Forecast of BWTS price change
While the BWTS cost used in this study may differ from the BWTS price exported by Chinese Customs, future changes in the latter can reflect the changes in BWTS cost data to some extent (Figure 2). The results indicate that the fourth-order polynomial regression curve fits better, with a smaller residual of 0.00058 for the least squares fitting, compared to the corresponding residual of 0.001 for the third-order fitting. The predicted results suggest that the future export price of BWTS produced in China will show a slow growth trend, indicating the stability of BWTS cost data. Therefore, the evaluation results of this study are robust and still provide good reference value in the coming years.
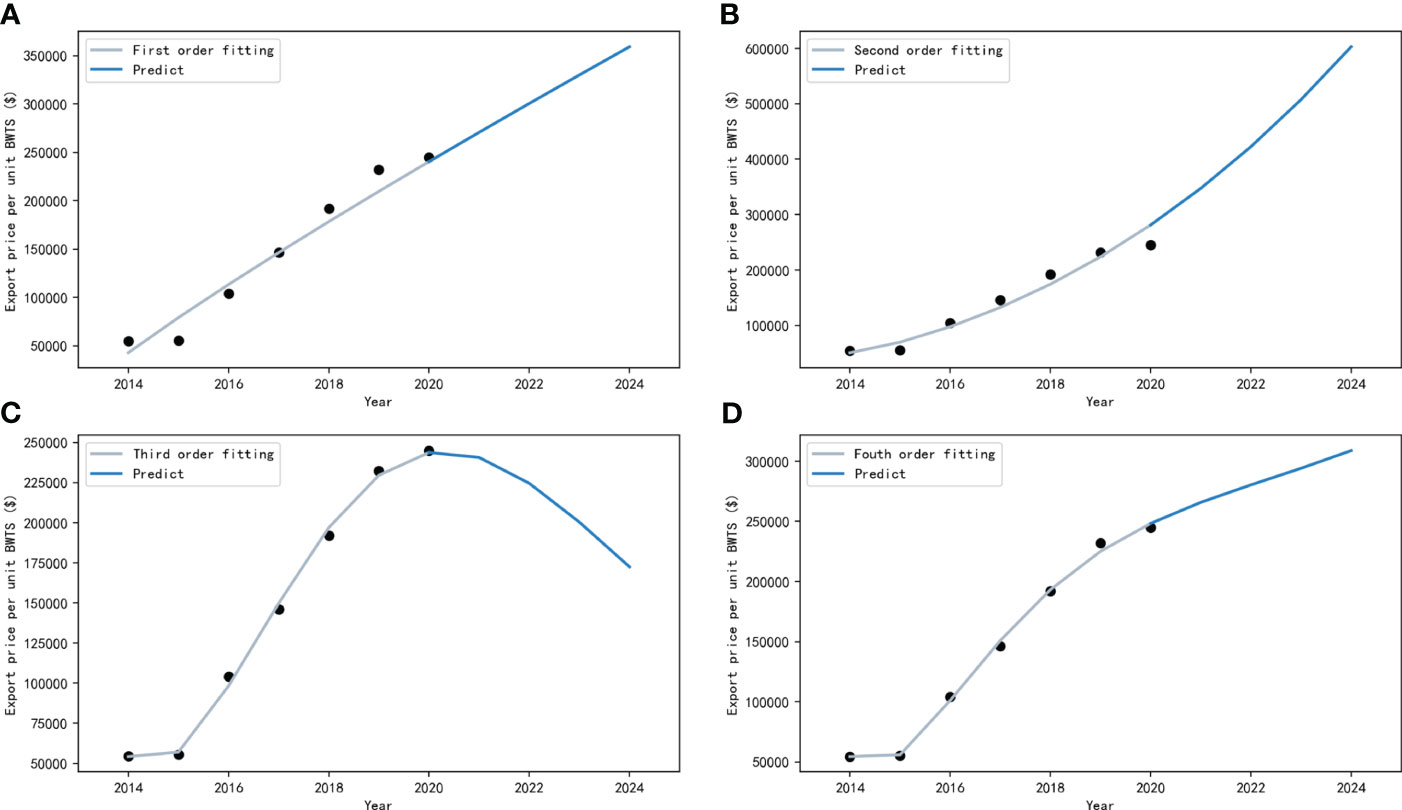
Figure 2 Estimated changes in export costs per unit BWTS. (A–D) represent the regression curves at different orders and the predicted price of unit BWTS.
4 Discussion
Compliance costs are contingent upon the digital standards and data sources needed. Calculations based on China data indicate that implementing ship-based compliance technologies is more cost-effective than centralized compliance using barges in the three major port clusters. Thus, regardless of which standard is used, it is recommended to install ship borne BWTS in Chinese ports. Similarly, calculations based on US data indicate that ship-based compliance technologies are cheaper than centralized compliance using barges if consistent IMO standards are globally adopted. However, if stricter standards are implemented regionally or globally, or if the cost of BWTS increases significantly, compliance costs for barge-based systems may be lower than retrofitting the entire global fleet, as supported by Wang and Corbett, (2020). As China transitions from IMO regulations to more stringent ones, the annual increase in compliance costs varies from $456 million (based on Chinese data) to $1.205 billion (based on US data).
As for individual ships, the cost of unit ballast water discharge is closely related to the digital standards required by regulations. In simple terms, the higher the anti-pollution level, the higher the cost of ballast water treatment that shipowners or operators need to bear. If certain regions (such as China’s three major port clusters) adopt stricter standards, the average cost of ballast water treatment per ton only increases by $1.65 (an increase of 8.9%, based on Chinese data) or $3.82 (an increase of 7.7%, based on US data) relative to the relatively weak IMO standard adopted globally. From the perspective of shipowners’ interests, if the management of specific regions considers the pressure of anti-pollution safety and adopts stricter ballast water management, the increase in operating costs per ship is relatively small. This indicates that the transition from global standard IMO regulations to stricter anti-pollution policies is feasible, and this finding also applies to regions other than Chinese ports.
The result shows that regardless of the policy scenario or the way BWTS is installed, the compliance costs per ship will gradually decrease as the annual ballast water discharge volume increases. Different types of ships have significant differences in the average annual ballast water discharge volume. Ships with larger discharge volumes (such as bulk carriers) have higher cost-effectiveness in compliance costs and are more likely to ease economic pressure due to economies of scale when facing new management policies. Ships with low discharge volumes (such as passenger ships) have higher operating costs and may not be cost-effective to use BWTS to treat ballast water. Here, it is recommended that ships with an average annual ballast water discharge volume of less than 500MT rely on current BWTS equipment for disinfection treatment and can choose other ballast materials such as pure water to replace. Effective management of specific ship types is important, although this paper did not consider the differences in disinfection effects of different types of BWTS on different ship types. It is recommended that different ship types can adjust their own choices according to actual financial, legal and operational conditions when choosing BWTS, and shipowners and operators can choose the most suitable BWTS for their ships based on indicative factors such as tonnage and age (Satir, 2014).
The stability of BWTS cost data is a key factor in determining the best compliance strategy for the shipping industry. According to our forecast, the export price of BWTS in China may continue to rise in the future, which may affect the cost-effectiveness of compliance strategies. Considering future uncertainties, incorporating the latest information on shipping trends, technological advances, and potential changes in regulations or trade patterns into cost-benefit analysis can more accurately understand current and future challenges in ballast water management. According to an estimate, China’s ballast water discharge volume is slowly increasing (Zhang et al., 2017). This paper recommends that decision-makers need to establish a ballast water management information platform to ensure mandatory reporting of ballast water discharge and unified detection and monitoring methods for ballast water. Cost-benefit analysis should be used to formulate ballast water management regulations and monitor harmful aquatic organisms and pathogens in ballast water (Rey et al., 2018). It is also necessary to encourage the development of more effective, efficient and environmentally friendly new technologies for BWTS to ensure the safety of ships and crew members and minimize compliance costs.
5 Conclusion
The findings of this study have important implications for Chinese policymakers and other countries with similar ecological conditions. Adopting stricter regulations can significantly reduce the risk of biological invasions and associated economic losses, but it is also crucial to balance the environmental benefits and economic costs of implementing BWTS policies. The study emphasizes the importance of evaluating and updating the cost-benefit analysis regularly to provide more comprehensive policy guidance.
However, the study still has several limitations: 1. Lack of explicit data recording or sources: The interpretation of results is subject to limitations and potential biases due to the absence of clear data records or sources. 2. Limited consideration of environmental risks: The primary focus of this study is on compliance costs related to ballast water management policies, but it may not fully address all potential environmental risks associated with invasive species nor adequately quantify the mitigation effects of different ballast water treatment strategies on coastal ecosystems. 3.Insufficient assessment of influencing factors: While the study mentions the importance of evaluating potential factors such as fuel consumption, emissions, and maintenance costs, including BWTS technology improvements, it does not delve into how these factors impact the overall cost-effectiveness and feasibility of different ballast water management policies.
Future studies should pay attention to the changes in BWTS cost data, especially from different sources, to improve the accuracy and reliability of the evaluation results. Furthermore, the study highlights the potential long-term economic and environmental benefits of adopting more efficient and sustainable BWTS technologies, such as reduced fuel consumption, emissions, and maintenance costs. As such, there is a need for continued research into the impact of such factors on the cost-effectiveness of compliance strategies.
Data availability statement
The original contributions presented in the study are included in the article/Supplementary Material. Further inquiries can be directed to the corresponding authors.
Author contributions
AN: Writing—Original draft preparation, Methodology, Visualization, Formal analysis, Investigation, Validation. ZW: Conceptualization, Resources, Data Curation, Writing—Original draft preparation, Writing—Review & Editing, Supervision, Funding acquisition. ZS: Methodology, Visualization, Writing—Original draft preparation, Formal analysis, Investigation, Validation. ZJW: Writing—Original draft preparation, Methodology, Review & Editing, Supervision. All authors contributed to the article and approved the submitted version.
Funding
The work is supported by the Shanghai Education and Development Foundation Shuguang Grant (number 21SG46).
Conflict of interest
The authors declare that the research was conducted in the absence of any commercial or financial relationships that could be construed as a potential conflict of interest.
Publisher’s note
All claims expressed in this article are solely those of the authors and do not necessarily represent those of their affiliated organizations, or those of the publisher, the editors and the reviewers. Any product that may be evaluated in this article, or claim that may be made by its manufacturer, is not guaranteed or endorsed by the publisher.
Supplementary material
The Supplementary Material for this article can be found online at: https://www.frontiersin.org/articles/10.3389/fmars.2023.1174550/full#supplementary-material
References
Abelando M., Bobinac M., Chiarandini Fiore J. (2020). Assessment of the efficiency of controls to prevent biologic invasions at the San Lorenzo Port, Argentina. Environ. Monit. Assess. 192, 420. doi: 10.1007/s10661-020-08359-2
Benson N. U., Akintokun O. A., Adedapo A. E. (2017). Disinfection byproducts in drinking water and evaluation of potential health risks of long-term exposure in Nigeria. J. Environ. Public Health 2017, 1–10. doi: 10.1155/2017/7535797
Bradie J. N., Drake D. A. R., Ogilvie D., Casas-Monroy O., Bailey S. A. (2021). Ballast water exchange plus treatment lowers species invasion rate in freshwater ecosystems. Environ. Sci. Technol. 55 (1), 82–89. doi: 10.1021/acs.est.0c05238
Čampara L., Frančić V., Maglić L., Hasanspahić N. (2019). Overview and comparison of the IMO and the US Maritime Administration ballast water management regulations. J. Mar. Sci. Eng. 7 (9), 283. doi: 10.3390/jmse7090283
CA State Lands Commission (2021). California adopts federal ballast water discharge standards. Available at: https://www.slc.ca.gov/marine-invasive-species-program/ca-adopts-federal-ballast-water-discharge-standards (Accessed 14 December 2021).
China Tendering and Bidding Public Service Platform (2021). Available at: http://zb.yfb.qianlima.com/yfbsemsite/mesinfo/zbpglist (Accessed 11 October 2021).
Compton T. J., Leathwick J. R., Inglis G. J. (2010). Thermogeography predicts the potential global range of the invasive European green crab (Carcinus maenas). Divers. Distrib. 16, 243–255. doi: 10.1111/j.1472-4642.2010.00644.x
de Paula R. S., Reis M., de P., de Oliveira Junior R. B., Andrade G. R., de Carvalho M. D., et al. (2020). Genetic and functional repertoires of Limnoperna fortunei (Dunker 1857) (Mollusca, Mytilidae): a review on the use of molecular techniques for the detection and control of the golden mussel. Hydrobiologia 847, 2193–2202. doi: 10.1007/s10750-020-04196-z
Diagne C., Leroy B., Vaissière A. C., Gozlan R. E., Roiz D., Jarić I., et al. (2021). High and rising economic costs of biological invasions worldwide. Nature 592, 571–576. doi: 10.1038/s41586-021-03405-6
Dittel A. I., Epifanio C. E. (2009). Invasion biology of the Chinese mitten crab Eriochier sinensis: A brief review. J. Exp. Mar. Biol. Ecol. 374, 79–92. doi: 10.1016/j.jembe.2009.04.012
Dong Z., Morandini A. C., Schiariti A., Wang L., Sun T. (2019). First record of Phyllorhiza sp. (Cnidaria: Scyphozoa) in a Chinese coastal aquaculture pond. Peerj 7, e6191. doi: 10.7717/peerj.6191
Drake L. A., Doblin M. A., Dobbs F. C. (2007). Potential microbial bioinvasions via ships’ Ballast water, sediment, and biofilm. Mar. pollut. Bull. 55, 333–341. doi: 10.1016/j.marpolbul.2006.11.007
General Administration of Customs, P.R. CHINA (2021). Available at: http://gdfs.customs.gov.cn/customs/index/index.html (Accessed 15 October 2021).
Gerhard W. A., Gunsch C. K. (2019). Metabarcoding and machine learning analysis of environmental DNA in ballast water arriving to hub ports. Environ. Int. 124, 312–319. doi: 10.1016/j.envint.2018.12.038
Gerhard W. A., Lundgreen K., Drillet G., Baumler R., Holbech H., Gunsch C. K. (2019). Installation and use of ballast water treatment systems – implications for compliance and enforcement. Ocean Coast. Manage. 181, 104907. doi: 10.1016/j.ocecoaman.2019.104907
Glosten (2018). “Shore-Based Ballast Water Treatment in California, Task 10: Cost Analysis,” in Prepared for Delta Stewardship Council, 36. Available at: https://slcprdwordpressstorage.blob.core.windows.net/wordpressdata/2022/03/Task10_webacc_opt.pdf.
Hess-Erga O.-K., Moreno-Andres J., Enger O., Vadstein O. (2019). Microorganisms in ballast water: Disinfection, community dynamics, and implications for management. Sci. Total Environ. 657, 704–716. doi: 10.1016/j.scitotenv.2018.12.004
IMO (2004). International Convention for the Control and Management of Ships' Ballast Water and Sediments (International Maritime Organization, London). Available at: http://www.imo.org/en/About/Conventions/List ofConventions/Pages/International- Convention-for-th e-Control-and-Management-of-Ships%27-Ballast-Water-and-Sediments-(BWM).aspx
King D. M., Hagan P. T. (2013). Economic and logistical feasibility of port-based ballast water treatment: a case study at the port of Baltimore (USA). Maritime Environ. Res. Centre Ballast Water Econ. Discussion Paper 6.
King D. M., Riggio M., Hagan P. T. (2009). Preliminary cost analysis of ballast water treatment systems. Maritime environmental resources center (MERC). Ballast Water Econ. Discussion Paper 1, 51.
Lakshmi E., Priya M., Sivanandan Achari V. (2021). An overview on the treatment of ballast water in ships. Ocean Coast. Manage. 199, 105296. doi: 10.1016/j.ocecoaman.2020.105296
Lv B., Jiang T., Wei H., Tian W., Han Y., Chen L., et al. (2021). Transfer of antibiotic-resistant bacteria via ballast water with a special focus on multiple antibiotic-resistant bacteria: A survey from an inland port in the Yangtze River. Mar. pollut. Bull. 166, 112166. doi: 10.1016/j.marpolbul.2021.112166
McGeoch M. A., Butchart S. H., Spear D., Marais E., Kleynhans E. J., Symes A., et al. (2010). Global indicators of biological invasion: species numbers, biodiversity impact and policy responses. Diversity Distrib. 16, 95–108. doi: 10.1111/j.1472-4642.2009.00633.x
Morgan M. G. (2017). Theory and Practice in Policy Analysis: Including Applications in Science and Technology. Cambridge Core. doi: 10.1017/9781316882665
MOT (2020)MOT. The Ministry of Transport. In: National port cargo and container throughput. Available at: https://xxgk.mot.gov.cn/2020/jigou/zhghs/202006/t20200630_3321297.html (Accessed 15 October 2021).
National Ballast Information Clearinghouse (NBIC) Online Database (2012) (States Coast Guard: Electronic Publication, Smithsonian Environmental Research Center & United). Available at: http://invasions.si.edu/nbic/search.html (Accessed 16 October 2021).
NEA, National Energy Administration (2021). Available at: http://www.nea.gov.cn/ (Accessed 10 October 2021).
Rey A., Basurko O. C., Rodríguez-Ezpeleta N. (2018). The challenges and promises of genetic approaches for ballast water management. J. Sea Res. 133, 134–145. doi: 10.1016/j.seares.2017.06.001
Ruiz G. M., Fofonoff P. W., Carlton J. T., Wonham M. J., Hines A. H. (2011). Invasion of coastal marine communities in North America: apparent patterns, processes, and biases. Annual Review of Ecology, Evolution, and Systematics 42 (1), 389–422. doi: 10.1146/annurev-ecolsys-102209-144647
Satir T. (2014). Ballast water treatment systems: design, regulations, and selection under the choice varying priorities. Environ. Sci. pollut. Res. 21 (18), 10686–10695. doi: 10.1007/s11356-014-3087-1
Sayinli B., Dong Y., Park Y., Bhatnagar A., Sillanpää M. (2022). Recent progress and challenges facing ballast water treatment – A review. Chemosphere 291, 132776. doi: 10.1016/j.chemosphere.2021.132776
Seebens H., Gastner M. T., Blasius B. (2013). The risk of marine bioinvasion caused by global shipping. Ecol. Lett. 16, 782–790. doi: 10.1111/ele.12111
Senior Engineer of China Classification Society. (2021). Data Service - China Classification Society. https://www.ccs.org.cn/ccswz/dataService?columnid=202001161095588876. (Accessed 10 October 2022).
Shang L., Zhai X., Tian W., Liu Y., Han Y., Deng Y., et al. (2022). Pseudocochlodinium profundisulcus resting cysts detected in the ballast tank sediment of ships arriving in the ports of China and North America and the implications in the species’ Geographic distribution and possible invasion. Int. J. Environ. Res. Public Health 19, 299. doi: 10.3390/ijerph19010299
Wan Z., Chen J., Makhloufi A. E., Sperling D., Chen Y. (2016). Four routes to better maritime governance. Nature 540, 27–29. doi: 10.1038/540027a
Wan Z., Shi Z., Nie A., Chen J., Wang Z. (2021). Risk assessment of marine invasive species in Chinese ports introduced by the global shipping network. Mar. pollut. Bull. 173, 112950. doi: 10.1016/j.marpolbul.2021.112950
Wang Z., Corbett J. (2020). Scenario-based cost-effectiveness analysis of ballast water treatment strategies. Manage. Biol. Invasions, 12(1). doi: 10.3391/mbi.2021.12.1.08
Wang Z., Nong D., Countryman A. M., Corbett J. J., Warziniack T. (2020). Potential impacts of ballast water regulations on international trade, shipping patterns, and the global economy: an integrated transportation and economic modeling assessment. J. Environ. Manage. 275, 110892. doi: 10.1016/j.jenvman.2020.110892
Wang H., Xie D., Bowler P. A., Zeng Z., Xiong W., Liu C. (2021). Non-indigenous species in marine and coastal habitats of the South China Sea. Sci. Total Environ. 759, 143465. doi: 10.1016/j.scitotenv.2020.143465
Werschkun B., Höfer T., Bundesinstitut für Risikobewertung (2012). Emerging Risks from Ballast Water Treatment (Berlin: BfR).
Wright D. A. (2021). Compliance assessment for the ballast water convention: time for a rethink? A UK case study. J. Mar. Eng. Technol. 20 (4), 254–261. doi: 10.1080/20464177.2018.1513686
Xu H., Ding H., Li M., Qiang S., Guo J., Han Z., et al. (2006). The distribution and economic losses of alien species invasion to China. Biol. Invasions 8, 1495–1500. doi: 10.1007/s10530-005-5841-2
Zhang X., Bai M., Tian Y., Du H., Zhang Z. (2017). The estimation for ballast water discharged to China from 2007 to 2014. Mar. pollut. Bull. 124 (1), 89–93. doi: 10.1016/j.marpolbul.2017.07.012
Keywords: marine transportation, biological invasion, ballast water, scenario analysis, cost-benefit analysis
Citation: Nie A, Wan Z, Shi ZF and Wang Z (2023) Cost-benefit analysis of ballast water treatment for three major port clusters in China: evaluation of different scenario strategies. Front. Mar. Sci. 10:1174550. doi: 10.3389/fmars.2023.1174550
Received: 26 February 2023; Accepted: 27 July 2023;
Published: 15 August 2023.
Edited by:
Peter Ridd, Retired, Townsville, AustraliaReviewed by:
Christian T. K.-H. Stadtlander, Independent Researcher, Destin, FL, United StatesTien Anh Tran, Seoul National University, Republic of Korea
Copyright © 2023 Nie, Wan, Shi and Wang. This is an open-access article distributed under the terms of the Creative Commons Attribution License (CC BY). The use, distribution or reproduction in other forums is permitted, provided the original author(s) and the copyright owner(s) are credited and that the original publication in this journal is cited, in accordance with accepted academic practice. No use, distribution or reproduction is permitted which does not comply with these terms.
*Correspondence: Zheng Wan, bXJ3YW5AdWNkYXZpcy5lZHU=; Zhaojun Wang, aXpoYW9qdW5AdWRlbC5lZHU=