 Yubin Chu
 Zengan Deng
 Ting Yu2,3*
95% of researchers rate our articles as excellent or good
Learn more about the work of our research integrity team to safeguard the quality of each article we publish.
Find out more
ORIGINAL RESEARCH article
Front. Mar. Sci. , 07 July 2023
Sec. Physical Oceanography
Volume 10 - 2023 | https://doi.org/10.3389/fmars.2023.1173163
This article is part of the Research Topic Multi-Scale Fluid Physics in Oceanic Flows: New Insights from Laboratory Experiments and Numerical Simulations View all 16 articles
Tropical cyclones (TCs) play an important role in sea‐air interactions and cross-scale impacts on of El Niño–Southern Oscillation events by influencing the turbulent mixing and heat distribution in the upper ocean. Utilizing the observational data and simulations from a numerical model with modified surface wind forcing, this study systematically investigates the effects of a tropical storm (TS) on equatorial Kelvin waves based on TS Dujuan, which is a low-intensity TC. Observations of anomalies combine with the equatorial wave decomposition method are used to confirm the passage of a downwelling Kelvin wave during the same period with properties similar to those of the modeled wave. Modeling results indicate that the TS amplifies the equatorial Kelvin wave, raising the sea surface height by ~2.1 cm and the upper ocean temperature by ~0.34°C and accelerating the eastward zonal current. These signals propagate eastward with the wave and decrease rapidly, and finally decrease to approximately 3-35% of their original strength, particularly the temperature decrease is greatest. Our findings reveal that, in the region close to the equator, even low-intensity cyclones like TS Dujuan can significantly impact the dynamics and propagation of Kelvin waves. TS Dujuan is capable of altering the thermal structure of the equatorial Pacific by amplifying the Kelvin waves. As TS Dujuan occurred during a La Niña event, we infer from our specific study that the forcing effects of TS on equatorial Kelvin waves may reduce the duration of La Niña events.
A tropical cyclone (TC) is an intense cyclonic vortex with a warm core structure, originating from warm tropical or subtropical oceans. TCs play an important role in sea-air coupling interactions. On one hand, they can drive mesoscale ocean circulation and intensify the turbulent mixing within specific regions, resulting in alterations to the temperature and salinity structure of the upper ocean. The passage of TCs involves the input of a large amount of mechanical energy into the ocean, leading to the loss of local sea surface water vapor and heat due to the high wind stress and the associated wave action. Furthermore, TCs can induce Ekman pumping and heat pumping, causing the cooling of the surface’s warm water, and the heating of the subsurface’s cold water. With the passing of TCs, the surface water returns to the normal thermal condition of the Pre-TCs, and the subsurface water remains warm (Emanuel, 2001). Additionally, strong turbulent mixing and upwelling can be caused in the subsurface water due to the entrainment of TCs (Greatbatch, 1984; Monaldo et al., 1997; Gierach and Subrahmanyam, 2008; Hung et al., 2013; Chang et al., 2014). On the other hand, the energy input to the ocean from TCs propagates as near-inertial internal waves and interacts nonlinearly with local internal waves and near-inertial oscillations in the ocean, ultimately affecting energy distribution in the ocean basin and even globally (Quanan et al., 2006; Furuichi et al., 2008; Elipot et al., 2010). Since temperature anomalies of surface and subsurface seawater are closely related to global climate (Wyrtki, 1985; Zebiak and Cane, 1987), TCs exert significant impacts on climate-scale events.
TCs commonly occur in the equatorial Pacific, particularly in the northwestern region of the western equatorial Pacific, which accounts for approximately one-third of the global total (Wang and Chan, 2002; Chan, 2005). Additionally, almost all equatorial Kelvin waves originate in the western equatorial Pacific. Previous studies (Sriver et al., 2008; Fedorov et al., 2010; Sriver and Huber, 2010) indicated that TCs can affect equatorial Kelvin waves and thereby influence ocean dynamics. Therefore, examining the potential relationship between TCs and equatorial ocean dynamics can further deepen our understanding of TC generation and climate processes.
Previous studies have explored the forcing effect of cross-equatorial TCs and TC pairs on equatorial Pacific dynamics based on buoy data and found that individual synoptic events may influence the entire El Niño–Southern Oscillation (ENSO) cycle (Keen, 1982; Nitta, 1989). Based on a statistical analysis of observations of multiple TC events at an interannual timescale, Gao et al. (1988) found that the near-equatorial tropical cyclones developed equatorward of 10°N can intensify the equatorial westerlies and produce the Kelvin waves, which propagate to the South American coasts in about 2-3 months, inducing the rise of Sea Surface Temperature (SST) there. Chen and Gao (1994) pointed out that the durations of TCs (in days) in the near-equatorial and tropical areas of the Northwest Pacific are significantly higher in El Niño than in non-El Niño years, and concluded that the development of TCs in the near-equatorial and tropical areas of the Northwest Pacific strengthens the equatorial westerly wind pulse and excites the Kelvin waves, contributing to the development and maintenance of El Niño. Sriver et al. (2013) used the Community Climate System Model to prove that three successive TC events may excite equatorial Kelvin and Yanai waves, and they found the wave amplitude is directly proportional to TCs wind speed. They also suggested that the wind forcing of TCs would affect the period and amplitude of ENSO events. Wang et al. (2019) proposed that TC events in the Western Pacific could significantly affect the development of ENSO events, mediated by Walker circulation and equatorial Kelvin waves. Previous modeling studies on the effects of TCs on Kelvin waves mainly focused on multiple TC events at interannual scales. However, the response of equatorial Kelvin waves to an individual TC remains unknown. To our knowledge, the forcing effect of a tropical storm (TS), which is a low-intensity TC, on Kelvin waves has never been studied.
In this study, we concentrate on TS Dujuan, which lasted for approximately 10 days (from the tropical disturbance stage) in the western equatorial Pacific in February 2021. The primary reason we select it is that it was active near the equator for a very long time (Figure 1A). TS Dujuan occurred when the Eastern Pacific was transitioning from a La Niña to a neutral state (Figure 1B), which is more conducive to the development of Kelvin waves (McPhaden, 1999). For the first time, the forcing effect of individual TS on the equatorial Kelvin wave and the associated ocean dynamics are investigated in this study.

Figure 1 (A) The track of TS Dujuan during its entire activity. Colors denote the maximum central wind speed. The information on typhoon path and intensity used in this study comes from the China Meteorological Administration (CMA) Best Track dataset (https://www.typhoon.org.cn/) collected and compiled by the Shanghai Typhoon Research Institute. (B) Monthly average Niño3.4 index from January 2020 to July 2021, the shadow area is the TS Dujuan activity duration. Six consecutive months of temperature anomalies exceeding + (-) 0.5°C as El Niño (La Niña) events, derived from NOAA/NCEP CPC sea surface temperature data based on ERSSTv5.
The data and the anomalous ocean signals during TS Dujuan are described and discussed in Section 2. The configuration of the global ocean circulation model and the model verification are given in Section 3. The diagnostic modeling results are analyzed in Section 4, and the discussion and conclusions are presented in Section 5.
Based on the analysis of the anomalous ocean signals, the existence of a Kelvin wave in the equatorial Pacific between February 1 and April 30, 2021 is inferred. Although easterly anomalies dominate over the Pacific during La Niña events, more than 50% of the tropical cyclones in the western Pacific reverse the direction of local trade winds by enhancing the equatorial westerly anomalies (Lian et al., 2019) (Figure 2A), which is conducive to the generation of downwelling Kelvin waves.
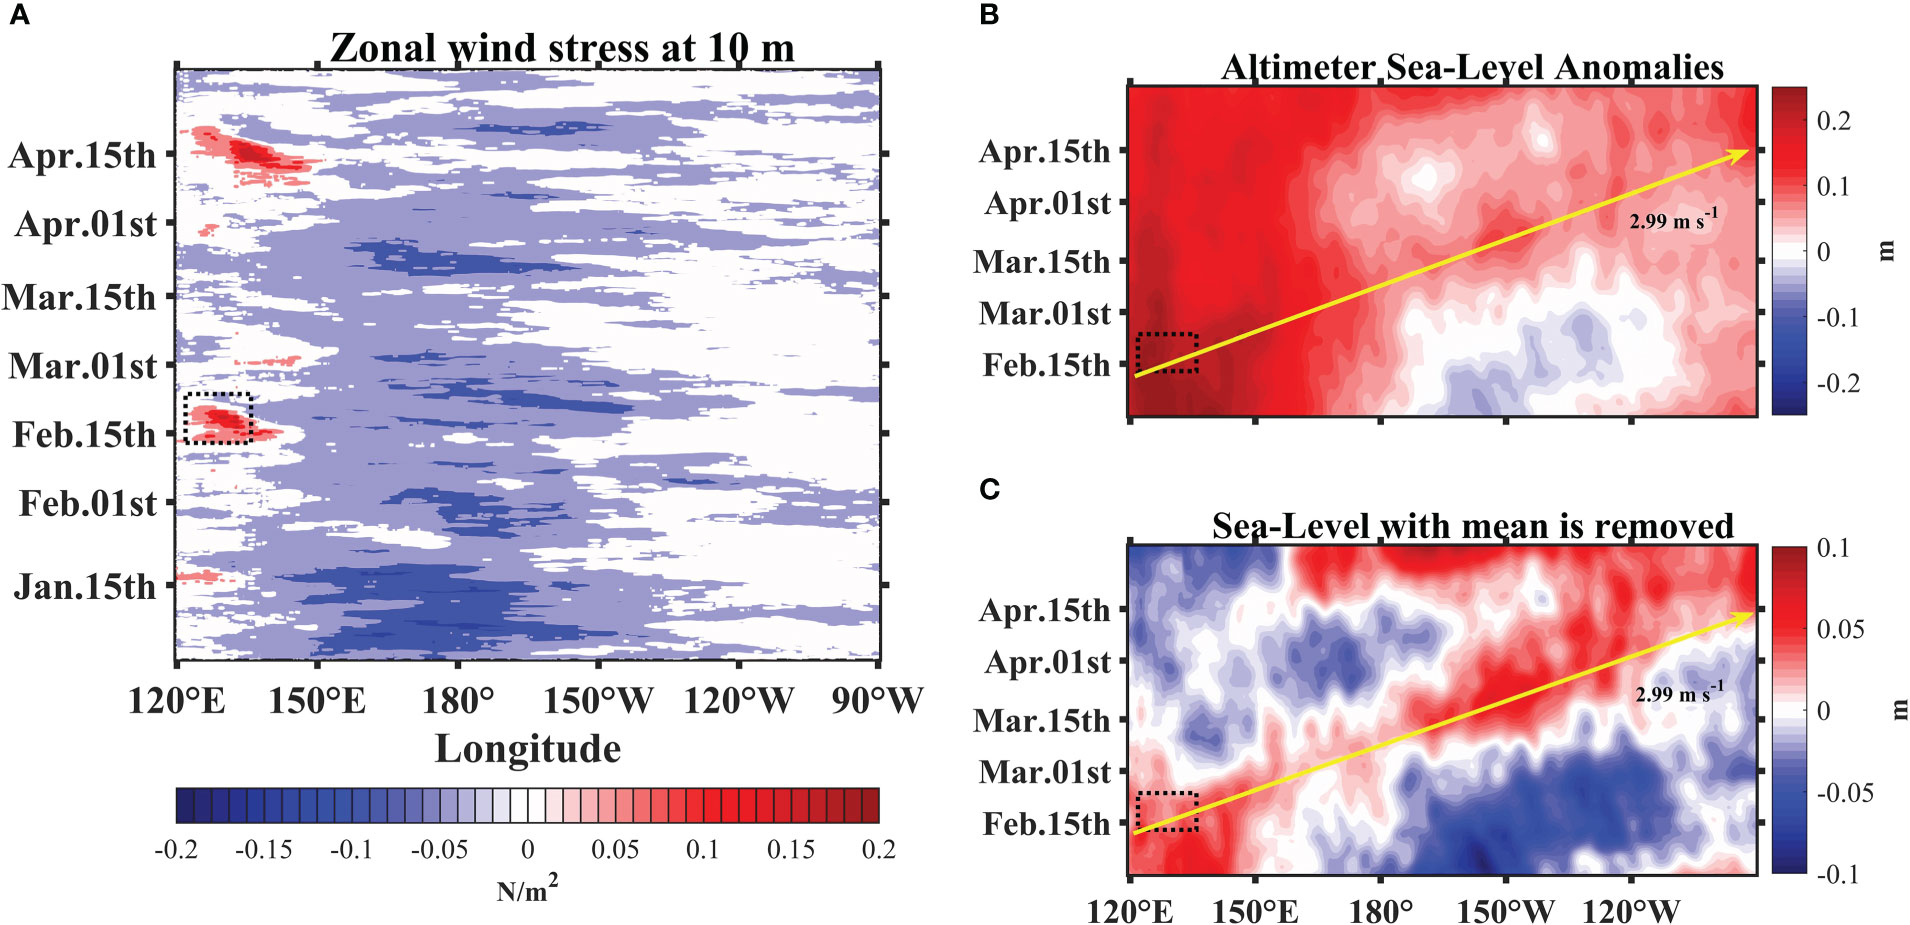
Figure 2 Longitude-time plots of daily anomalous (A) zonal wind stress at 10m, (B) sea surface height, (C) sea surface height with the mean is removed. Wind stress anomalies are averaged between 5°S and 5°N. Sea surface height anomalies are averaged between 2°S and 2°N and filtered using the mean filter. The dashed area denotes the TS Dujuan activity region. The solid yellow arrow denotes the estimated observed Kelvin wave speed.
The coupled forecast system model version 2 (CFSv2, https://cfs.ncep.noaa.gov/) hourly wind data product, developed at the Environmental Modeling Center at the National Center for Environmental Prediction (NCEP), is adopted to calculate the wind stress anomaly (Figure 2A) from 1990 to 2022. We calculated the wind stress based on the bulk formula by Large and Pond (1981). We use data from Copernicus Marine Environment Monitoring Service (CMEMS) to draw the longitude-time plots of sea-level anomalies (SLAs, https://marine.copernicus.eu/) for the study area from February 1 to April 30, 2021 (Figures 2B, C). The SLA product is calculated once a day, and the method of multi-satellite data integration used in the product has been proven to improve the ability to capture large-scale or mesoscale variabilities (Pujol et al., 2016). The SLA data is validated using upper ocean heat content and thermocline depth (D20) anomalies from the Tropical Atmosphere Ocean (TAO, https://www.pmel.noaa.gov/) buoy array. The TAO buoys are located between the latitudes of 10°S–10°N, and the spatial resolution of data in the meridional direction is much higher than that in the zonal direction. The asymmetrical design of this buoy array helps to effectively capture the information of equatorial Kelvin waves. The observational range of the buoys in the vertical extends from the surface to a depth of ~500 m, precisely including the tropical thermocline. Data from this buoy array has contributed greatly to the theoretical study of several ENSO events, including the “Delayed Oscillator” (McPhaden et al., 2010).
Generally, the influence of zonal wind stress anomalies on equatorial Kelvin waves can be categorized into two types. The first is that the zonal wind stress anomaly shows low-frequency variations. The second is that the action time of the wind stress anomaly is very short, i.e., the wind stress anomaly can be regarded as a wind “pulse” at the initial moment of occurrence, and the wind stress anomaly quickly approaches zero within a short time. The wind stress anomaly of TS Dujuan during the La Niña event belongs to the second type (Figure 2A).
The features of anomalous signals in the equatorial Pacific are shown in Figures 2B, C. A clear positive SLA can be observed in the TS Dujuan-forcing area around February 15, 2021, because TS Dujuan induces local wind stress curl in the northern part of the western equatorial Pacific (~6°N), which produces Ekman upwelling and divergence in the range of 135°E–140°E (Figure S1). Under the effects of negative wind stress curl and the Coriolis force, seawater converged to the equatorial region, resulting in a sea level rise within the 5°S–5°N region. Meanwhile, as the influencing of the La Niña event, the southeast trade winds blew the seawater to the west of the Pacific, and the seawater converged on the west coast, generating a positive SLA higher than 20 cm. The spatio-temporal variation of this SLA is characterized by a clear eastward movement. TS Dujuan is active near both the location and time of onset of the eastward propagation of SLA, according to Figure 2B. The eastward propagation of the positive anomaly is more pronounced in Figure 2C. The eastward propagation of the anomaly starts from the western Pacific near 130° E and reaches the eastern coast of the Pacific after ~62 days, resulting in a positive SLA in the eastern Pacific. Using satellite-derived SLA data, we also estimate the zonal and meridional geostrophic velocity anomalies (GVAs) (See Supplementary Material 1). Zonal GVAs (Figure 3A) are generally consistent with the spatial and temporal features of the SLAs shown in Figures 2B, C. However, as shown in Figure 3B, the meridional GVAs do not show an obvious eastward-propagation response. This suggests that TS-forced eastward propagation brings about the redistribution of zonal geostrophic velocities, and thus leads to the zonal transport, but has little effect on the meridional transport (Delcroix et al., 1991; Sriver et al., 2013). The distribution of zonal GVAs is relatively scattered to the west of the International Date Line, which may be due to deviations from the calculation method or the altimeter data.
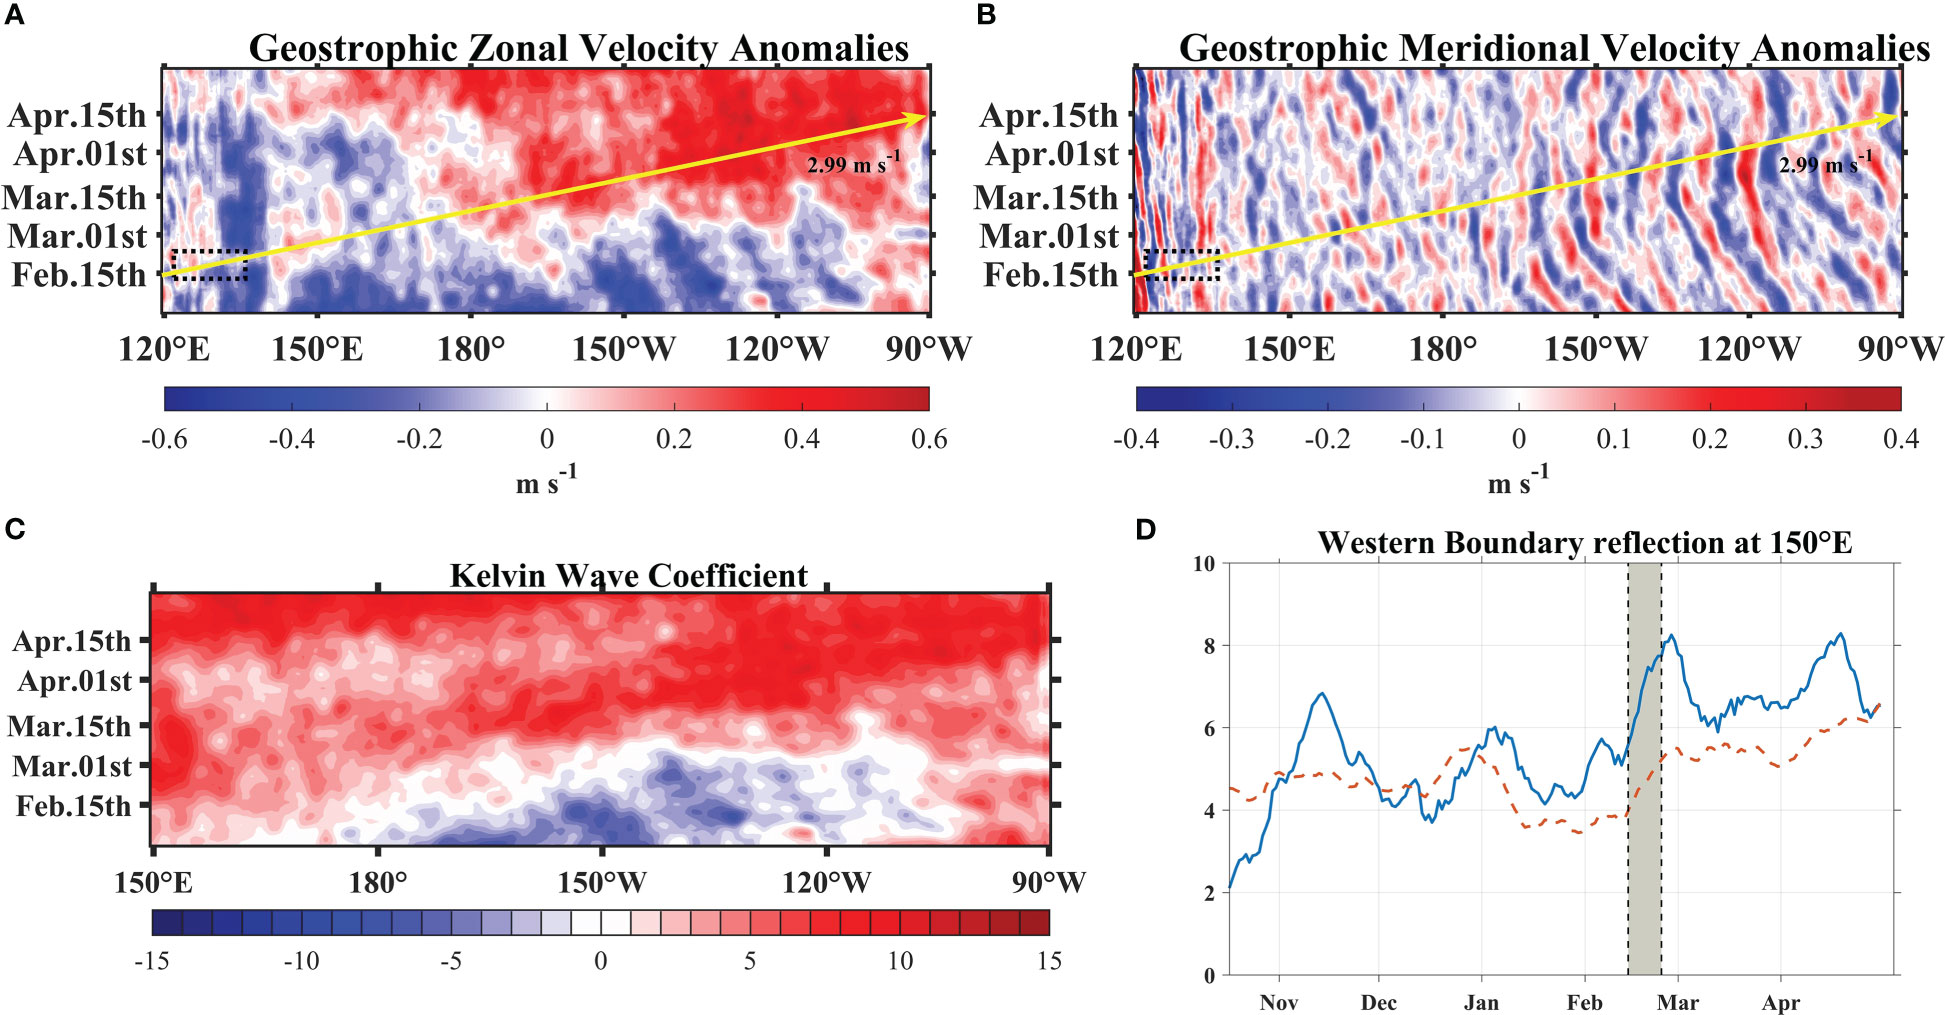
Figure 3 Longitude-time plots of anomalous daily (A) geostrophic zonal velocity (eastward positive, within 2°S-2°N), (B) geostrophic meridional velocity (northward positive, within 5°S-5°N), (C) Kelvin coefficient and (D) Kelvin coefficients (solid line) and Rossby coefficients (dash line) at 150°E, The positive value represents downwelling, the negative value represents upwelling. For instance, a coefficient of 10 units would yield an equatorial sea surface height amplitude of 5cm and an equatorial zonal current amplitude of 16 cm s-1. The dashed area denotes the TS Dujuan activity region. The solid yellow arrow denotes the estimated observed Kelvin wave speed.
Variations in the heat content and D20 anomalies in the upper ocean also agree with the main characteristics of equatorial Kelvin waves, therefore it is useful to analyze the upper ocean heat anomaly. To further determine the nature of the eastward propagation of the SLA and its effect on the upper ocean, we analyze the heat content anomaly and D20 anomaly based on TAO observations (Figure 4) for the same period as that used for the validation of the SLA. As shown in Figure 4A, compared to the climatological state, the entire east-central Pacific exhibits a cold anomaly in early February, whereas the eastern part of the western Pacific presents a warm anomaly. These zonal depth differences in the equatorial Pacific thermocline, i.e., an increase in the east-west Pacific thermocline gradient, are consistent with the characteristics observed in the equatorial Pacific during La Niña events. By mid-February, TS Dujuan causes anomalous forcing of the westerly wind, and the cold phase of the ENSO gradually returns to the neutral state as the heat anomaly moving eastward across the equatorial Pacific (Figure 1B). Moreover, the thermocline in the Western Pacific is depressed by 20–30 m, and the heat also accumulates in the same location. Both the heat content anomaly and D20 anomaly show an extremely strong correlation with SLA (also shown in Rebert et al., 1985). The D20 and positive heat content anomalies in the upper ocean of the western Pacific propagate eastward to the eastern Pacific with time in the form of waves. This eastward-propagation process redistributes the upper ocean heat anomalies, which is consistent with the effect of nonlinear equatorial Kelvin waves in the equatorial Pacific (Sommer and Zeitlin, 2005). At the same time, the eastward-propagating wave transfers thermocline anomalies to the eastern Pacific, affecting surface temperature anomalies (Chao and Xu, 2001). One part of the thermocline anomalies is transported poleward, and the other is deflected westward in the form of downwelling Rossby waves. Finally, the heat content of the entire equatorial Pacific increases, depressing the thermocline and attenuating the large zonal gradient of equatorial Pacific heat during the La Niña event. The combination of the spatial and temporal features of sea-level, upper ocean heat, and D20 anomalies indicate that a downwelling equatorial Kelvin wave is forced by TS Dujuan during this period. To directly represent the activity of the downwelling Kelvin wave, we calculate the Kelvin coefficient and first Rossby wave coefficient using the equatorial wave decomposition method (Boulanger and Menkes, 1995) based on the SLAs and zonal GVAs. As shown in Figures 3C, D, a downwelling Kelvin wave travels within the equatorial Pacific from February to May.
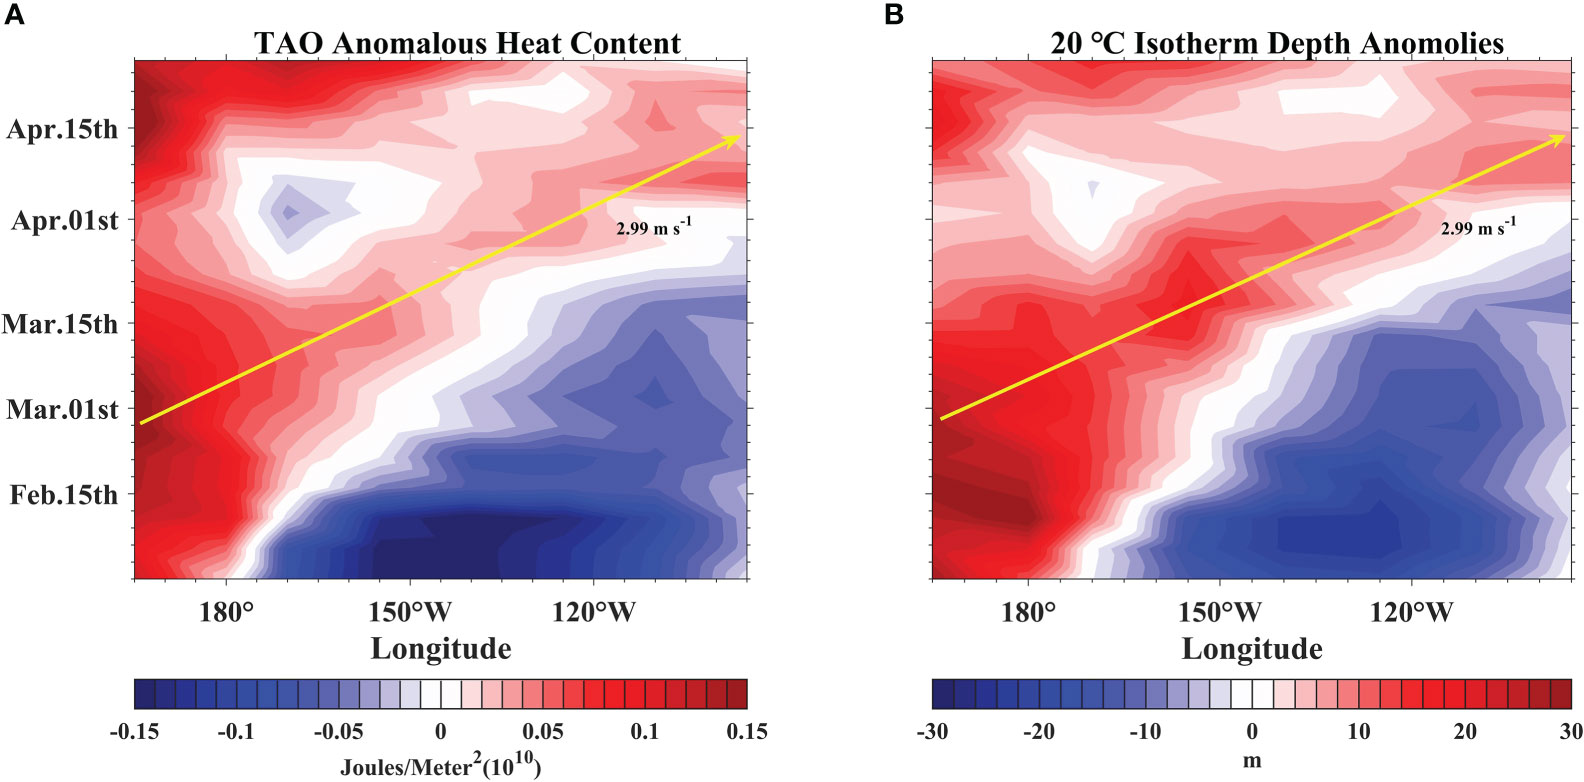
Figure 4 Longitude-time plots of observed anomalies (A) the upper ocean heat content, and (B) D20, derived from TAO buoy array. Heat content anomalies were based on existing buoy locations, and integrated to 300m depth. All quantities are compared to climatology and interpolated by Akima to 165°E-95°W, averaged at 2°S-2°N. The solid yellow arrow denotes the estimated observed Kelvin wave speed.
We have also examined the contribution of Rossby wave reflections at the western boundary to the Kelvin waves. Considering the low-frequency reflection, even-order Rossby waves make a minor contribution to the total reflection Kelvin wave coefficient. The reflection coefficient of even-order Rossby waves decreases with the increasing frequency of incident waves. According to the findings of Yuan and Han (2006), the Rossby waves that make the primary contribution to the linearly reflected Kelvin wave can be represented by the first baroclinic mode of the first-order Rossby wave, shown by the dashed line in Figure 3D. The consistency between the solid and dashed lines indicates that the linearly reflected Kelvin wave is mainly derived from the reflection of the first baroclinic mode Rossby wave. The difference between the solid and dashed lines may be attributed to the influence of nonlinearity. In addition, simulations of the equatorial Pacific from February 01 to April 30 using the Hybrid Coordinate Ocean Model (HYCOM) are employed to calculate the mean wave speed through the vertical mode function. Model simulations yielded a Kelvin wave speed of 3.09 m s-1, which agrees with the first baroclinic Kelvin wave speed (Boulanger and Menkes, 1995). Furthermore, the observed Kelvin wave speed is estimated to be 2.99 m s-1 based on the propagation distance and time of the heat content anomalies and D20 anomalies. Both the modeled and observed wave speeds agree well with the wave observations recorded by the TAO buoy array (Shinoda et al., 2008).
Kelvin wave has been identified above, but the effects of TS Dujuan on the Kelvin wave during the La Niña event remain unclear. Therefore, here we perform diagnostic experiments to systematically identify the specific effects of TS Dujuan forcing on the equatorial Kelvin wave.
The ocean general circulation model used in this study is HYCOM 2.3, which is based on the Miami Isopycnic-Coordinate Ocean Model and has proved useful for simulating equatorial Kelvin waves (Shinoda et al., 2008). HYCOM uses hybrid coordinates in the vertical, which is the salient feature of this model. HYCOM retains isopycnal coordinates in the open, stratified ocean, and the isopycnal vertical coordinates smoothly transition to z-coordinates in the weakly stratified upper mixed layer. In the shallow water region, the vertical coordinates become terrain-following (sigma) coordinates; in the very shallow water near the shore, the coordinates become z-level coordinates again.
K-Profile Parameterization (Large et al., 1994) was selected in our simulation to calculate vertical mixing. The modeling domain covers the region from 0° to 360° and from 70°N to 65°S, with a uniform horizontal grid that had a resolution of 0.5° at the equator (Philander, 1990), at which resolution the equatorial Rossby radius can be well resolved (Hsieh et al., 1983). There are total of 32 levels in the vertical with 12 layers in the upper 300m. We use global bathymetric grid data with a spatial grid size of 30″ × 30″ from the General Bathymetric Chart of the Oceans (GEBCO, https://www.gebco.net/) that released in December 2014 (GEBCO_2014) to represent the model topography.
The model is first spun up using climatological forcings and initial conditions. The initial temperature and salinity data are adopted from World Ocean Atlas 2018 (WOA18, https://odv.awi.de/data/ocean/world-ocean-atlas-2018/) and the climatological forcings are from Coordinated Ocean-Ice Reference Experiments (CORE II, https://data1.gfdl.noaa.gov/nomads/forms/core/COREv2/). After the model reaches an equilibrium state, the diagnostic experiments are run for the whole year of 2021 using hourly forcings of wind stress and heat fluxes from NCEP reanalysis data.
To examine the forcing effect of TS Dujuan on the Kelvin wave in the equatorial Pacific, we reconstructed two sets of wind forcing to drive two numerical experiments referring to the method of Wang et al. (2014). Initially, we eliminated the winds within a distance equals to 25 times the radius of maximum wind from the center of the tropical cyclone (Willoughby and Rahn, 2004). This TC center was provided by the CMA. In effect, we removed the original winds within this specified region. Subsequently, we employed a traditional recursive filter (Xie et al., 2005; Xie et al., 2011) to supplement the data. The smoothing parameter α was set to a range between 0.5 and 0.9, a value contingent on the wind speed. Using the filter, the high winds of TS Dujuan is excluded within a certain spatial range (Figure 5). Two experiments were designed: one forced by the original winds including the information of TS Dujuan (hereafter referred to as TSF) and the other forced by winds excluding TS Dujuan information (hereafter referred to as NONTSF).
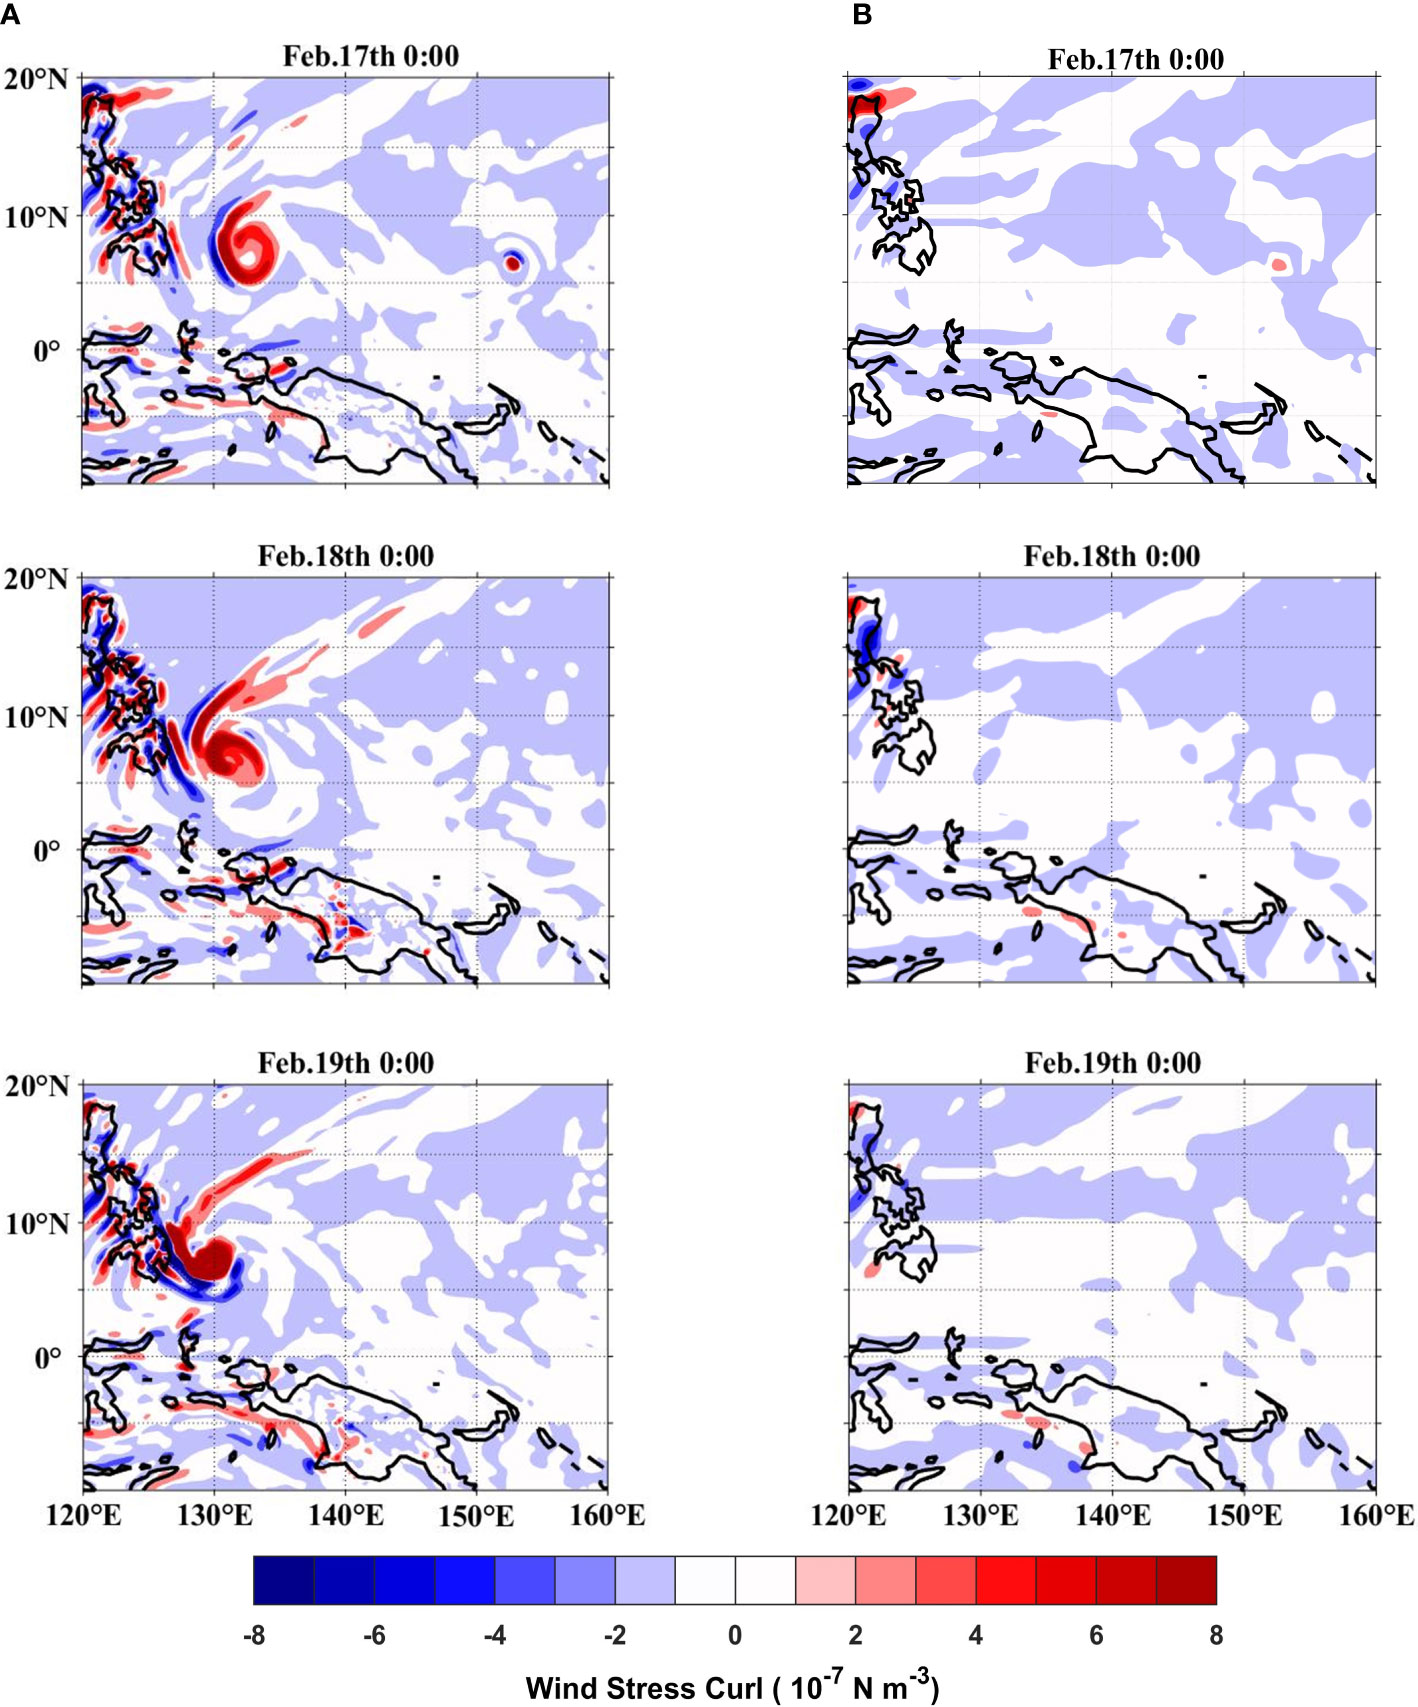
Figure 5 Wind stress curl from February 17th to 19th (A) the original data, (B) the filtered data.
A complete validation of the model is beyond the scope of this study. In this work, we mainly focus on the sea surface height (SSH), temperature, and zonal current. The simulations are compared with in-situ and reanalysis data to evaluate the modeling skill.
Figure 6 shows the simulated SSH and the comparison with HYCOM+NCODA (Hybrid Coordinate Ocean Model and Navy Coupled Ocean Data Assimilation) Global 1/12° Reanalysis data (https://hycom.org/data/). We also provide some statistics in Figure 7, including mean error (ME), root-mean-square error (RMSE), and correlation coefficient (CC). The maximum ME is 1.73 cm, and the minimum is -2.27 cm. The RMSE is lower than 1.68 cm and the CCs all exceed 88%. The simulated SSH is lower than the reanalysis data in the western Pacific, which may be due to the parameterization scheme and viscosity terms of the model, however, the deviation is generally acceptable.
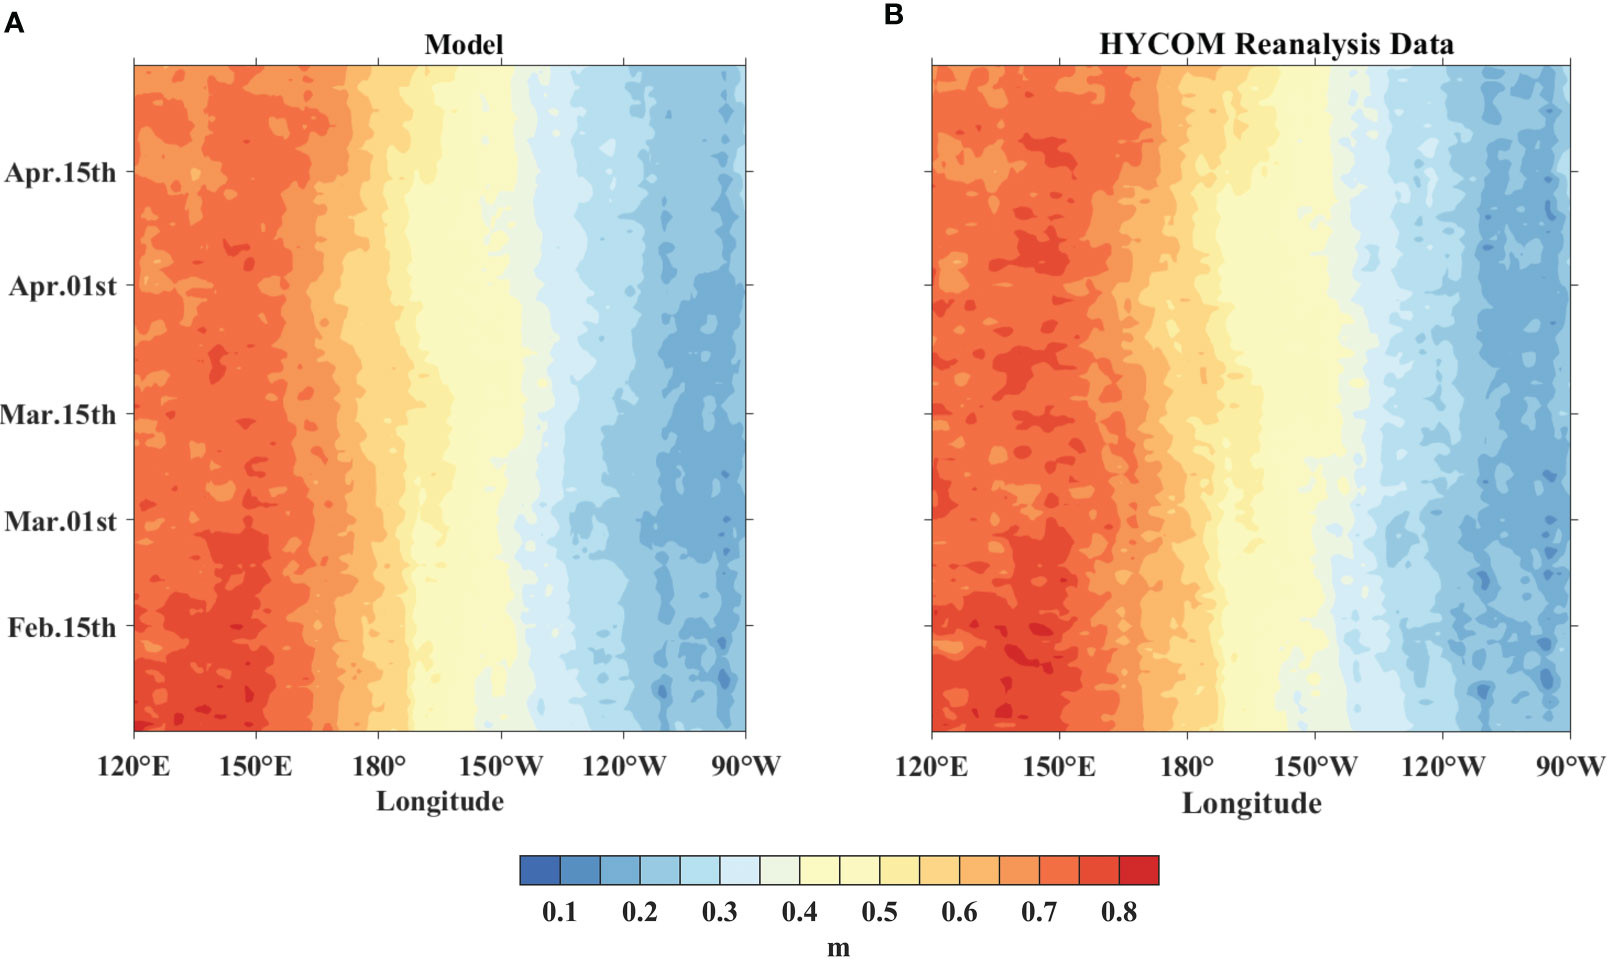
Figure 6 Longitude-time plots of daily SSH (within 5°S-5°N), for (A) the model simulation, (B) the HYCOM+NCODA Global 1/12° Reanalysis Data.
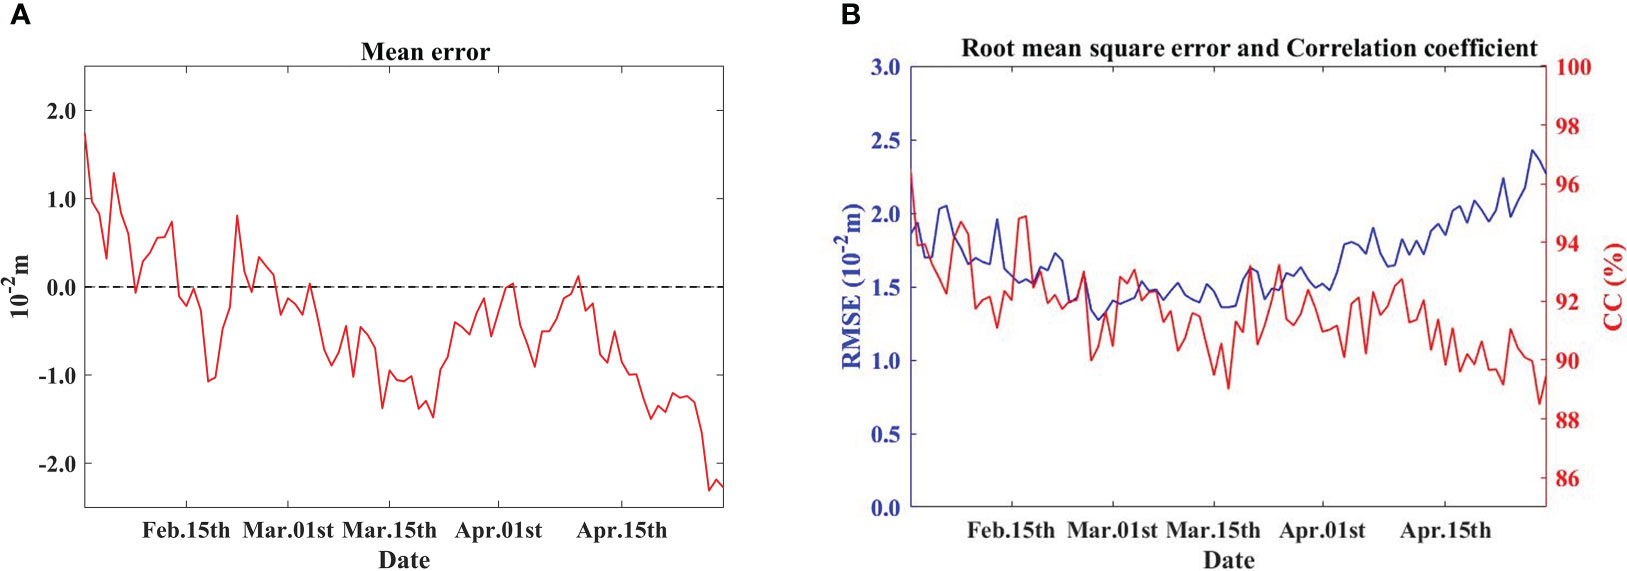
Figure 7 The evaluation indices of daily sea surface height, for (A) the mean error, (B) the root mean squared error, and correlation coefficient.
Figure 8 shows the vertical profiles of temperature from February to April. The temperature is verified using Argo data (ftp://ftp.argo.org.cn/pub/ARGO/global/). The vertical depths of both the simulations and buoy observations are interpolated to 43 layers using the Akima interpolation method. The simulated temperature in the upper ocean is slightly lower than the temperature given by the Argo data, the maximum deviation within 0-300 m is ~2.2°C. Since data assimilation is not performed in our model, deviations are mainly accumulated during the time of integration. In general, there is a good agreement between the simulations and Argo observations, with the correlation coefficient exceeding 99% (Figure 9, for further details regarding the Argo buoy, please refer to Table S1).
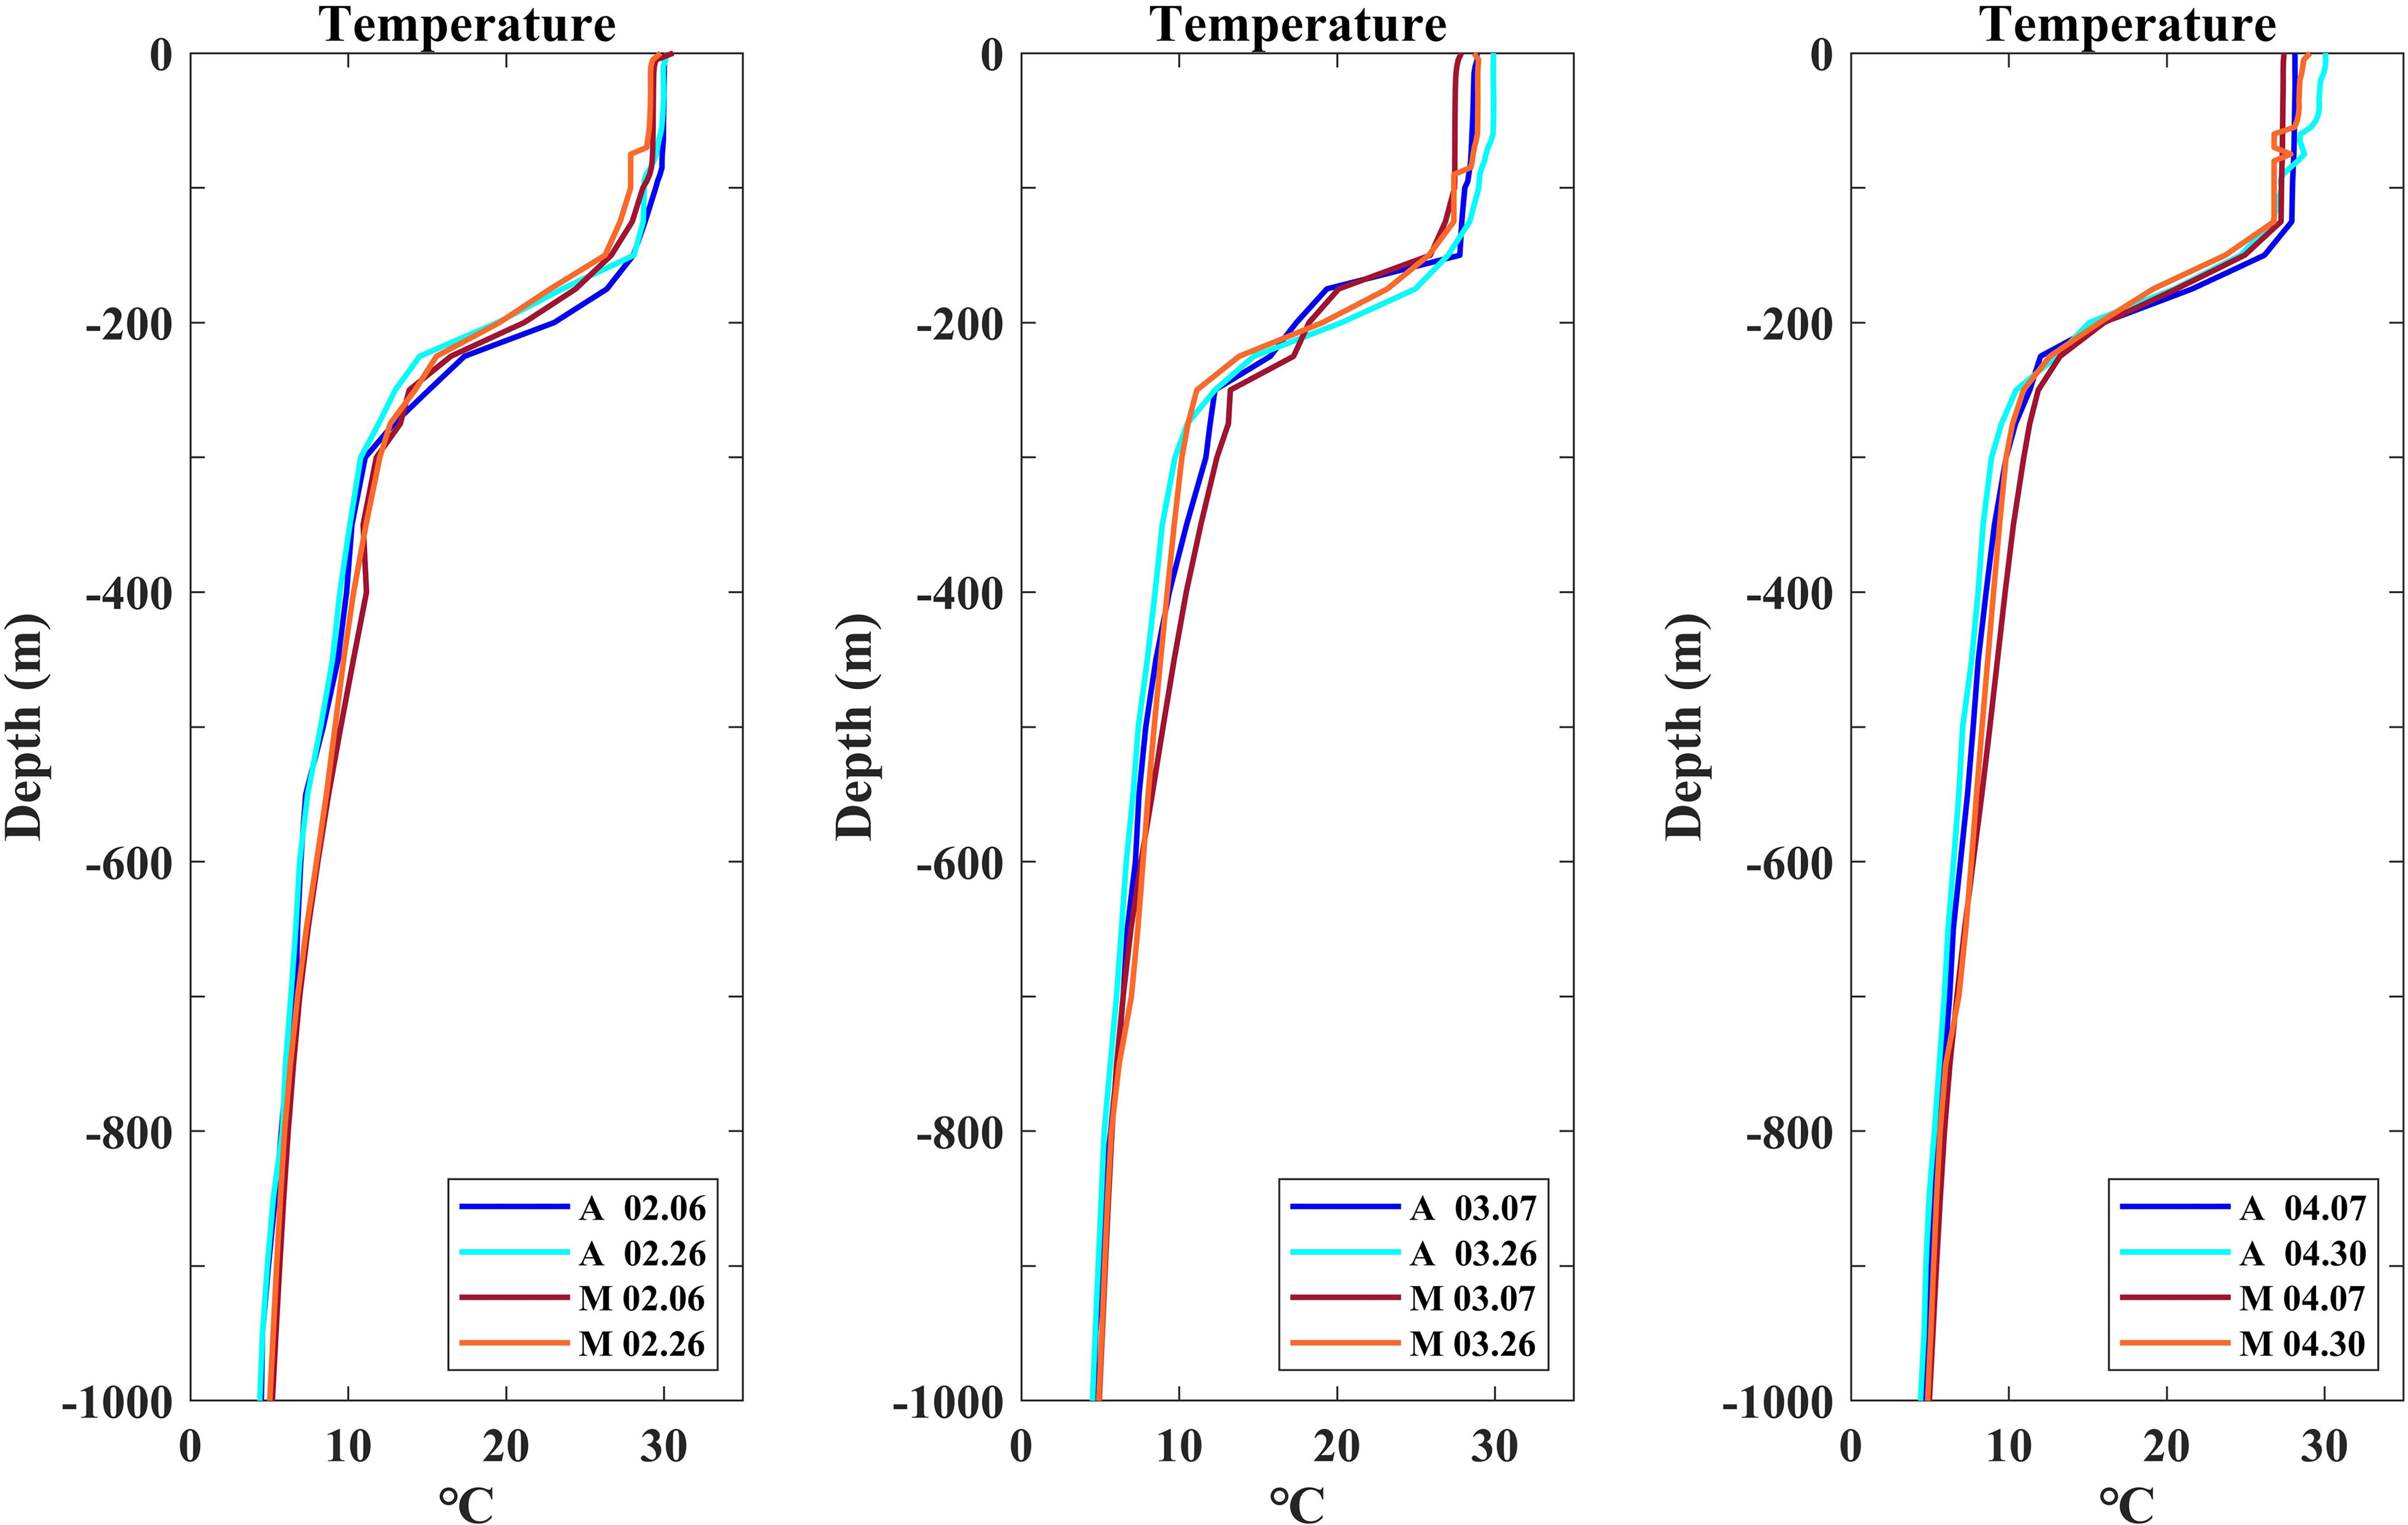
Figure 8 Vertical temperature profiles. M is the model simulation result, and A is the Argo buoy data.
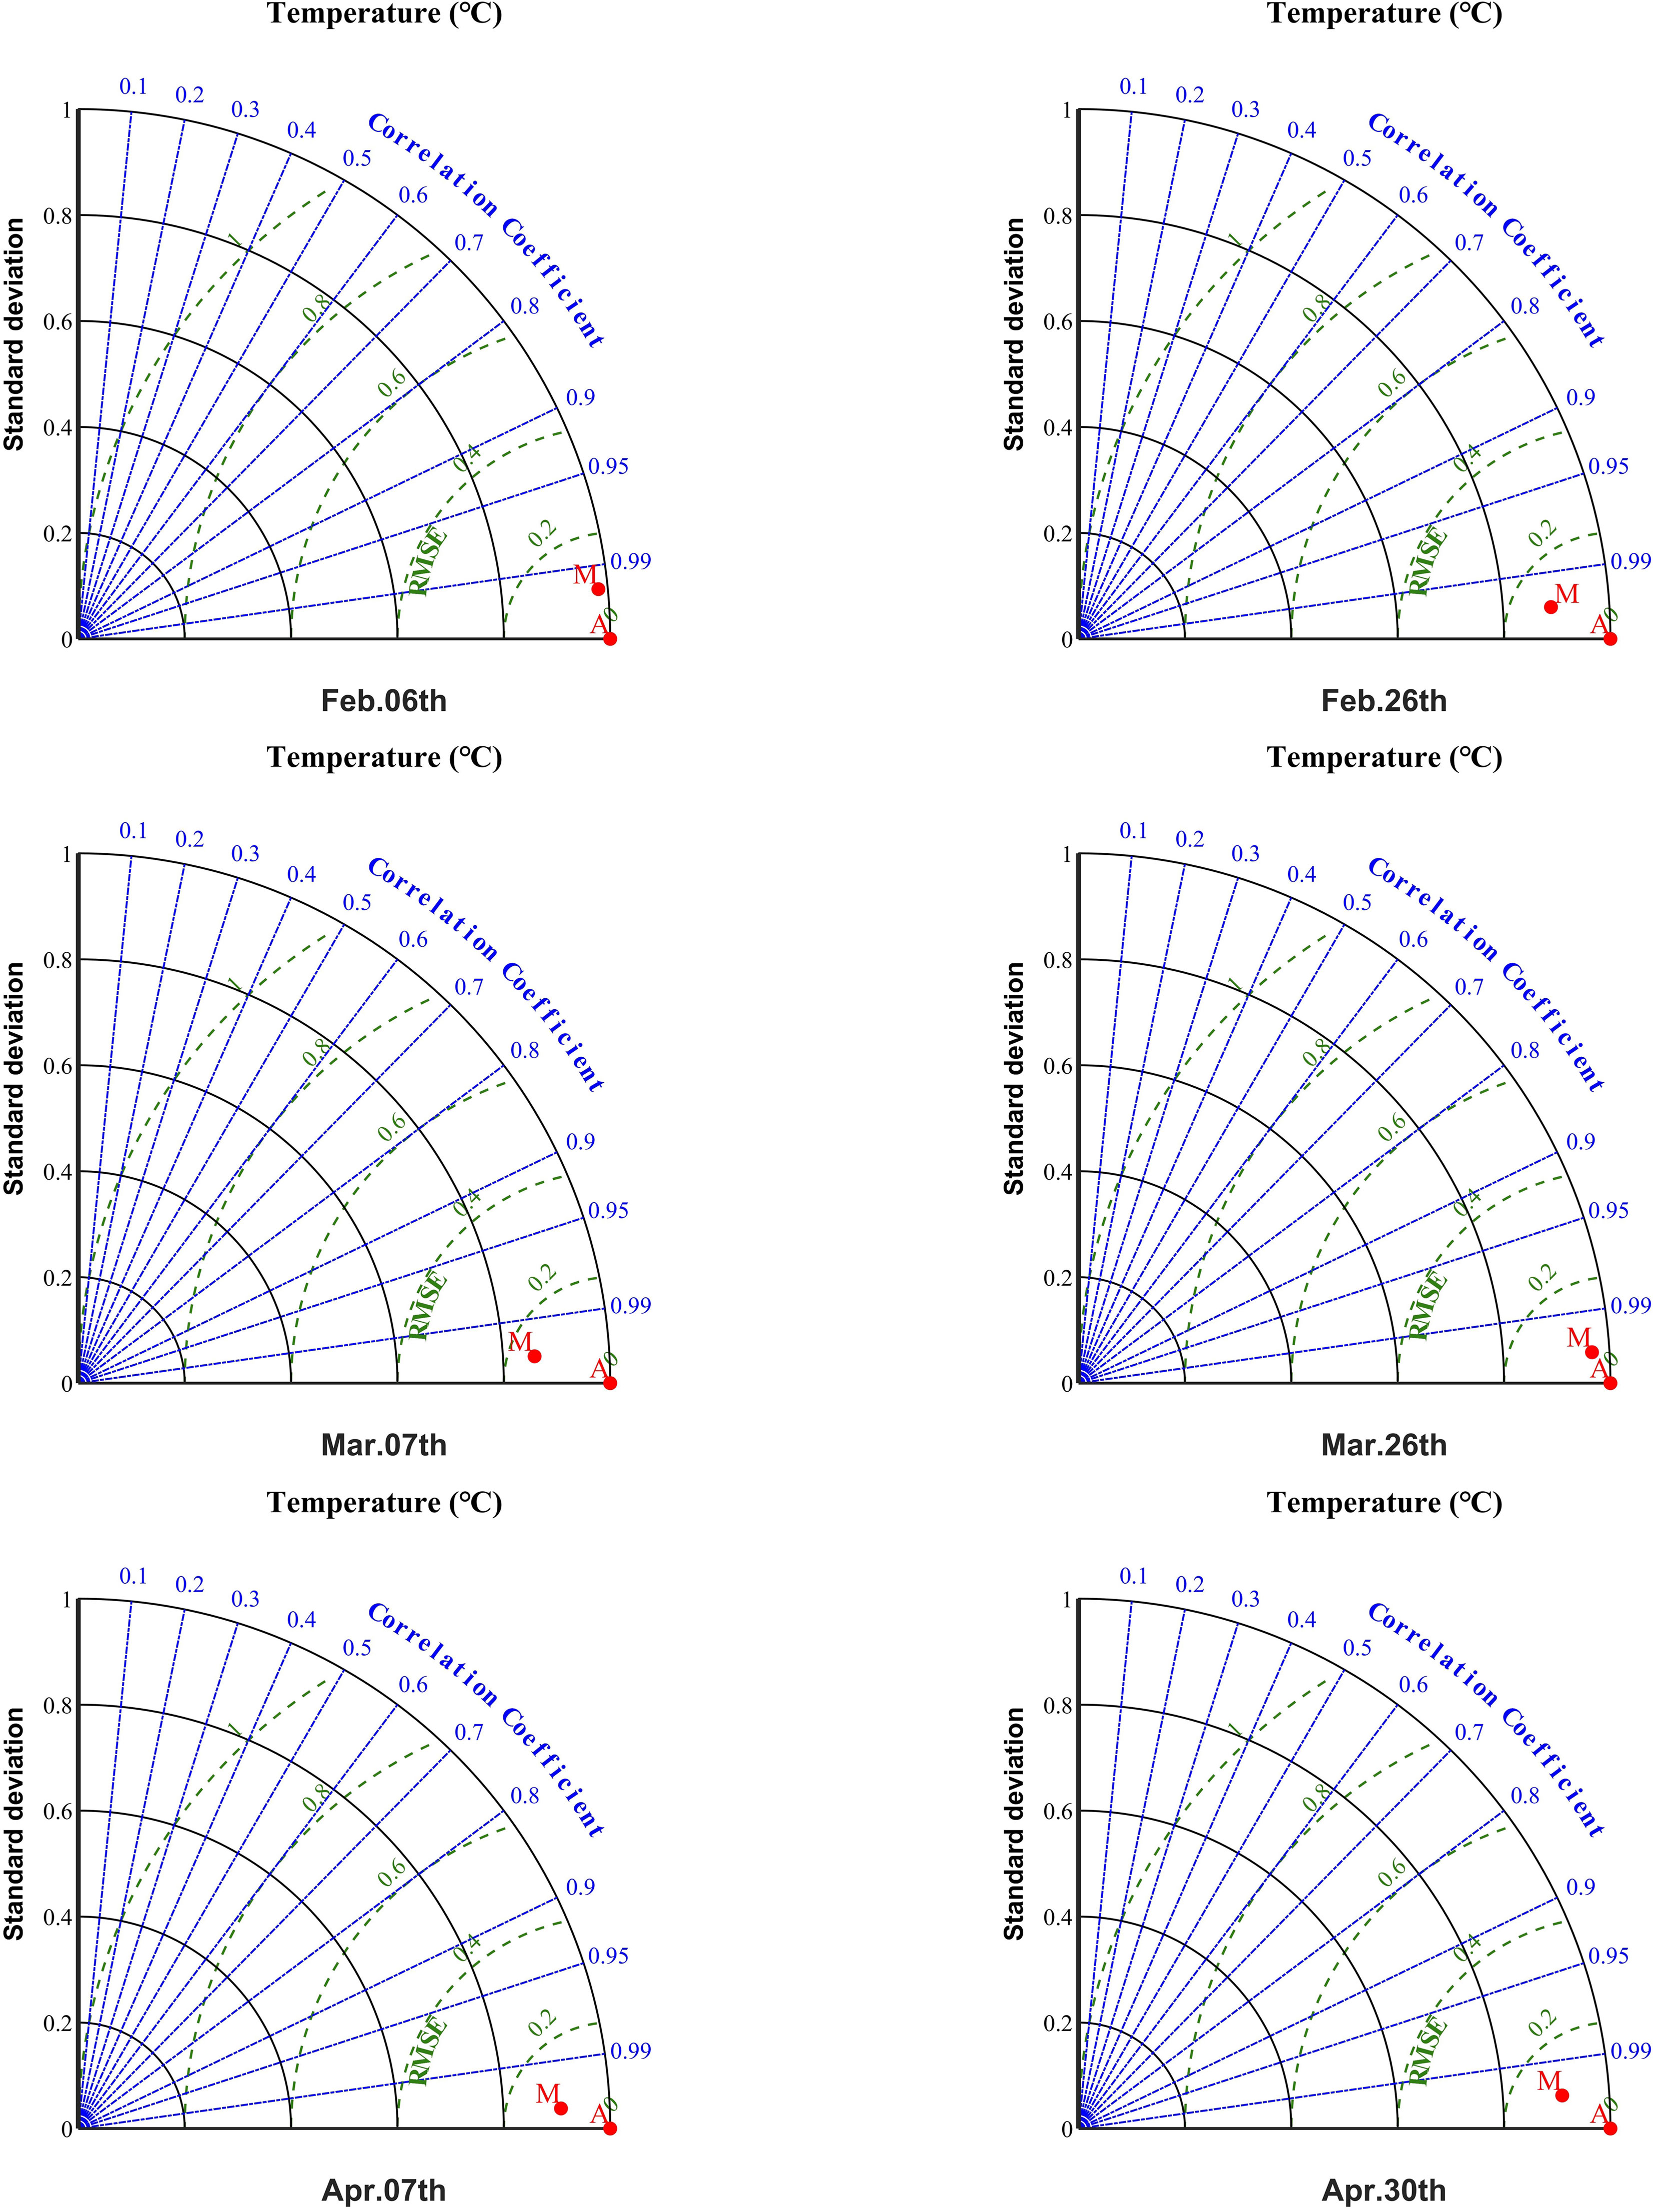
Figure 9 Taylor plots of 0-300 m vertical temperature distribution. Point M represents the index calculated from the model data compared to the Argo buoy data (point A). Standard deviation and root mean square error were normalized.
The equatorial undercurrent, an important part of the ocean circulation in the tropical Pacific, is a stable eastward flow existing in the upper equatorial ocean. The currents from February to April are presented in Figure 10, showing the monthly variability and the comparison with reanalysis data from the Nucleus for European Modeling of the Ocean (NEMO, downloaded from CMEMS). The equatorial undercurrent is weak in February and stronger in March and April, which is related to the eastward propagation of the anomalous temperature signals in the upper ocean and further reflects the potential activity of the Kelvin wave. The simulated maximum zonal current is between 1 and 1.6 m s-1, consistent with the results of Firing et al. (1983). It is indicated that our model is capable of reproducing the prominent features of the equatorial undercurrent.
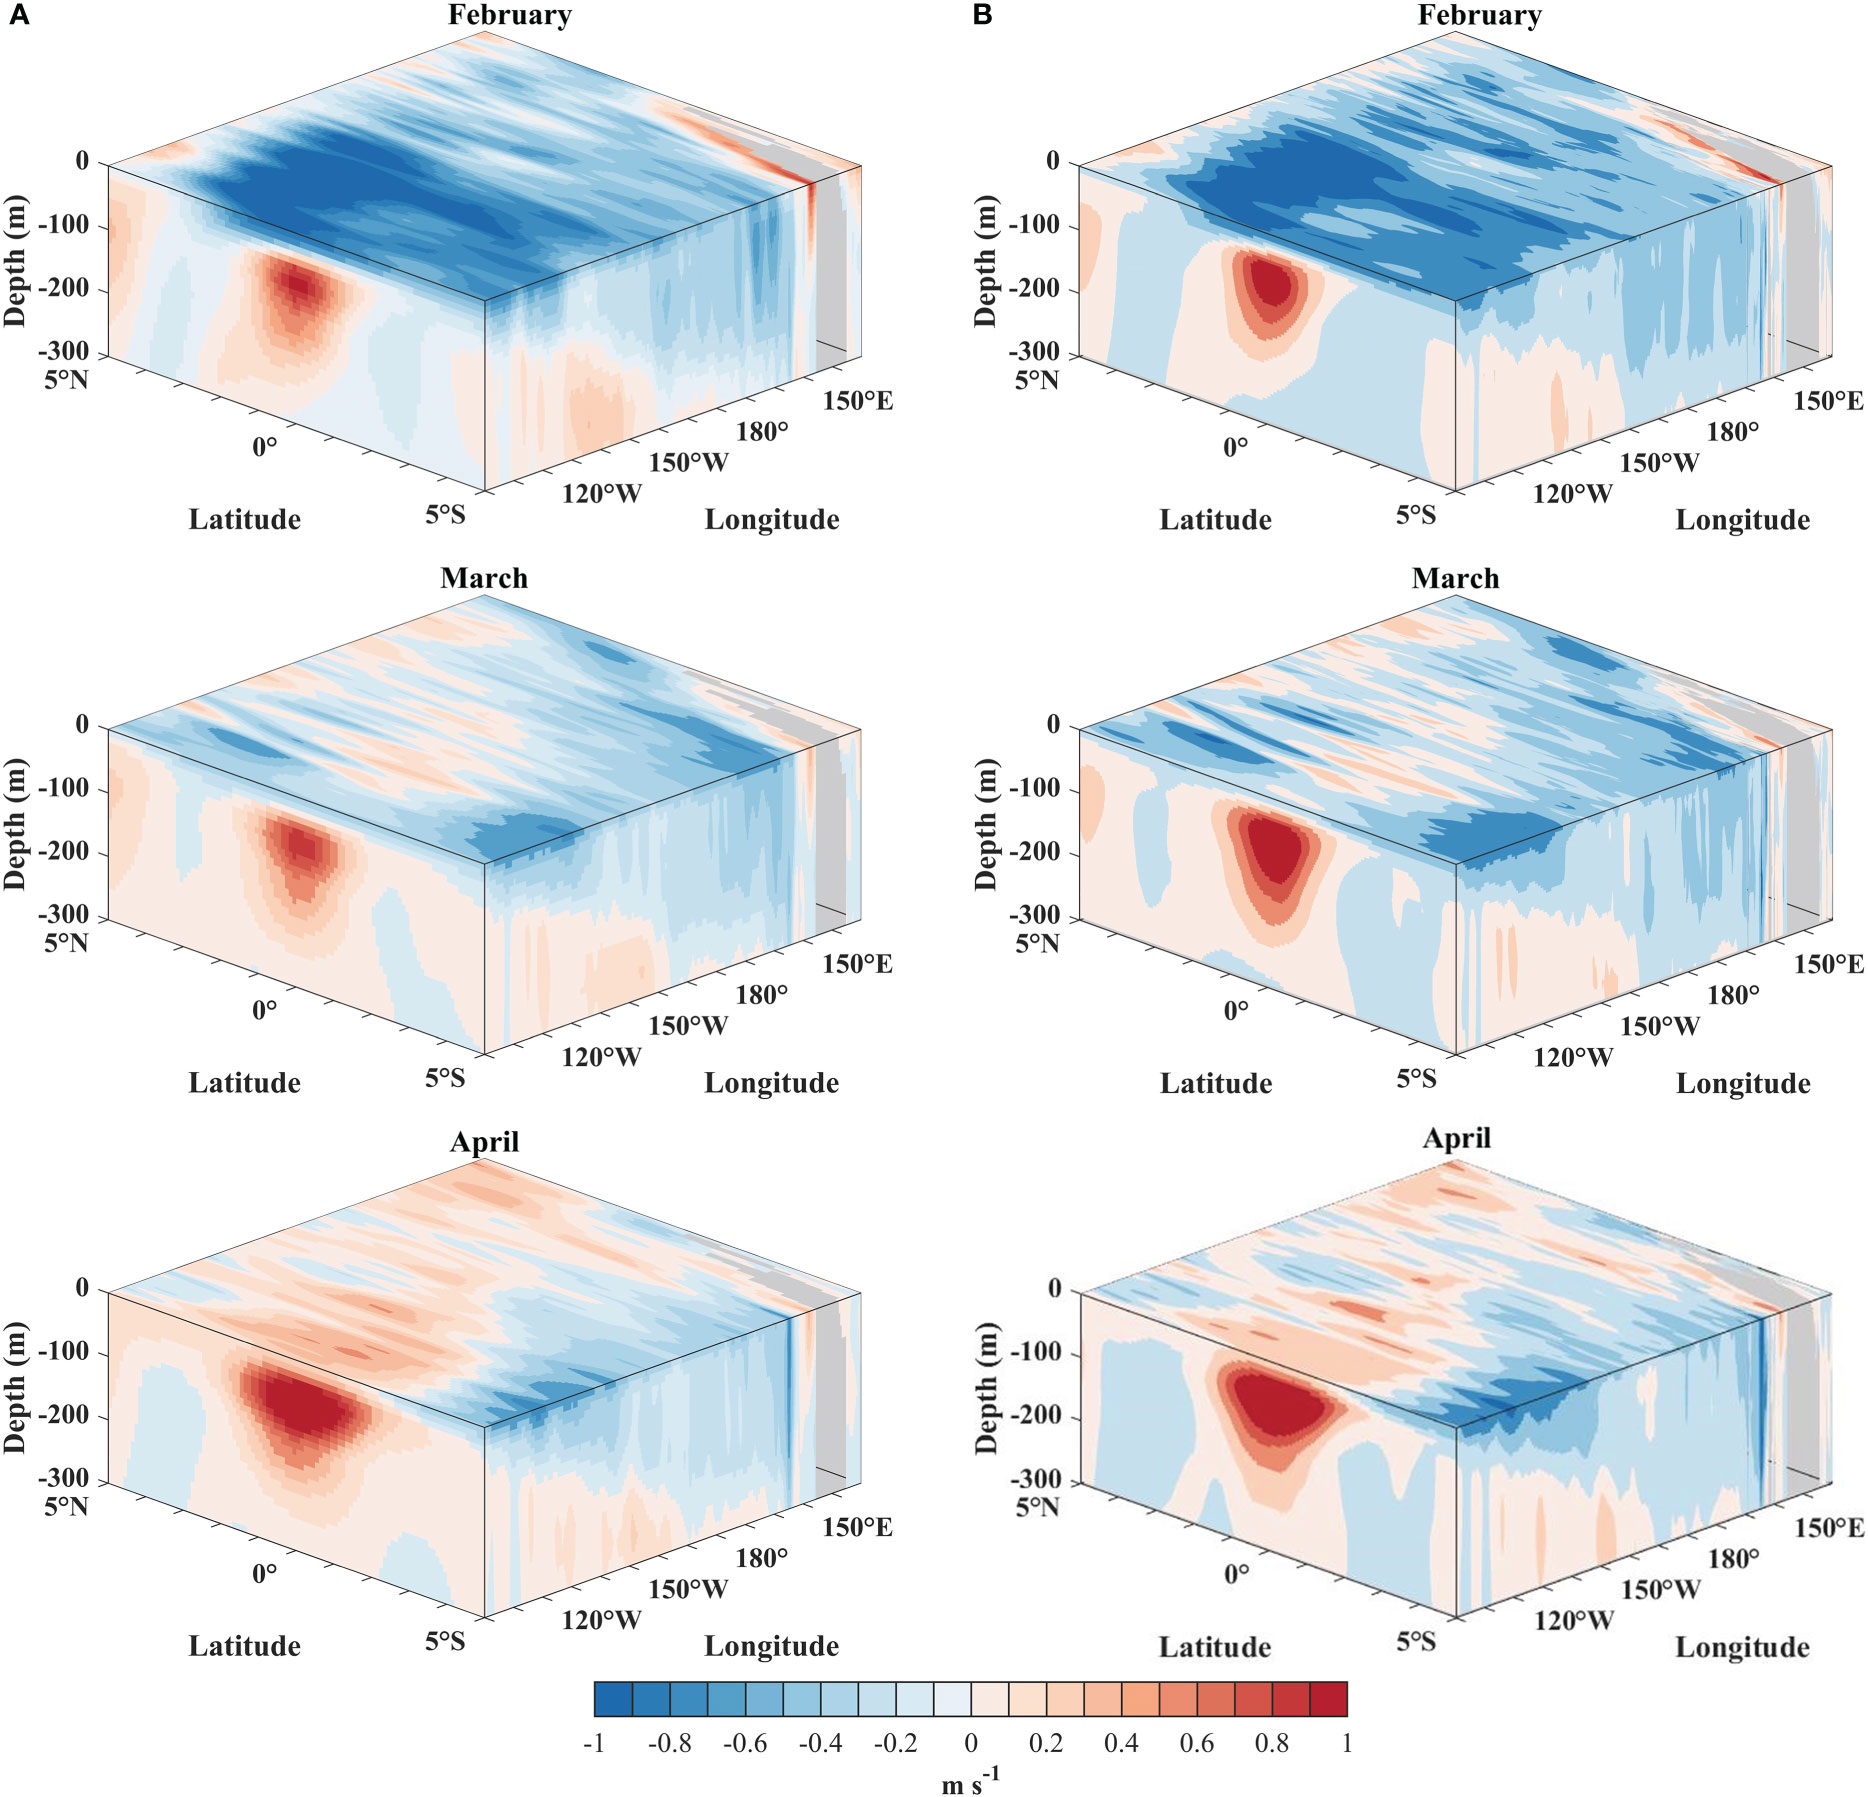
Figure 10 The 3D plots of the monthly mean zonal velocity between 0 to 300 m, for (A) the model simulation, and (B) the NEMO Reanalysis Data.
Here we compare the differences in detail between the simulations of the TSF and NONTSF experiments. The oceanic responses, including SSH, temperature, and zonal current, to the forcing of TS Dujuan are analyzed and discussed in the following.
The longitude-time plots for the results of TSF and NONTSF from February to May 2021 are shown in Figure 11. The locations of the alternating positive and negative differences in the western equatorial Pacific correspond to those of the zonal wind stress anomalies in late February (Figure 2A), indicating that TS Dujuan causes the change in SSH in the western Pacific. The intensity of TS Dujuan is low, and consequently so is the accumulated cyclone energy (ACE; only 0.54×10⁴ m2 s-2). Therefore, the SSH characteristics in the TSF experiment do not differ considerably from those in the NONTSF experiment, which is depicted visually in Figures 11A, B. Compared to the NONTSF case, TS Dujuan winds raise the SSH on the east side of the forcing region (by more than 2.1 cm) and lower it on the west side. The differences between the positive and negative increase with proximity to the TS track (Sun et al., 2014). In the Northern Hemisphere, the asymmetrical nature of the SSH (i.e., raised on the east side of the TS track and lowered on the west side) is probably due to the local winds. The direction of the local winds on the east side of the TS track is consistent with that of the Ekman drift. For a slow-moving TS, the wind enhances Ekman pumping and induces stronger upwelling on the east side of the TS than that on the west side, driving sea surface water masses away from the center of the TS. As a result, the water accumulates on the east side of the TS, and the SSH rises. In addition to local differences, the eastward propagation phenomenon also occurs. The negative SSH difference between the TSF and NONTSF in the Western Pacific caused by TS Dujuan propagates westward in the form of Rossby waves and remains in the Western Pacific. Over the next ~60 days, the positive SSH difference propagates eastward at a speed consistent with Kelvin waves (Figure 11C, yellow dashed line). The signal raises the SSH in the eastern equatorial Pacific and ultimately reaches the eastern boundary.
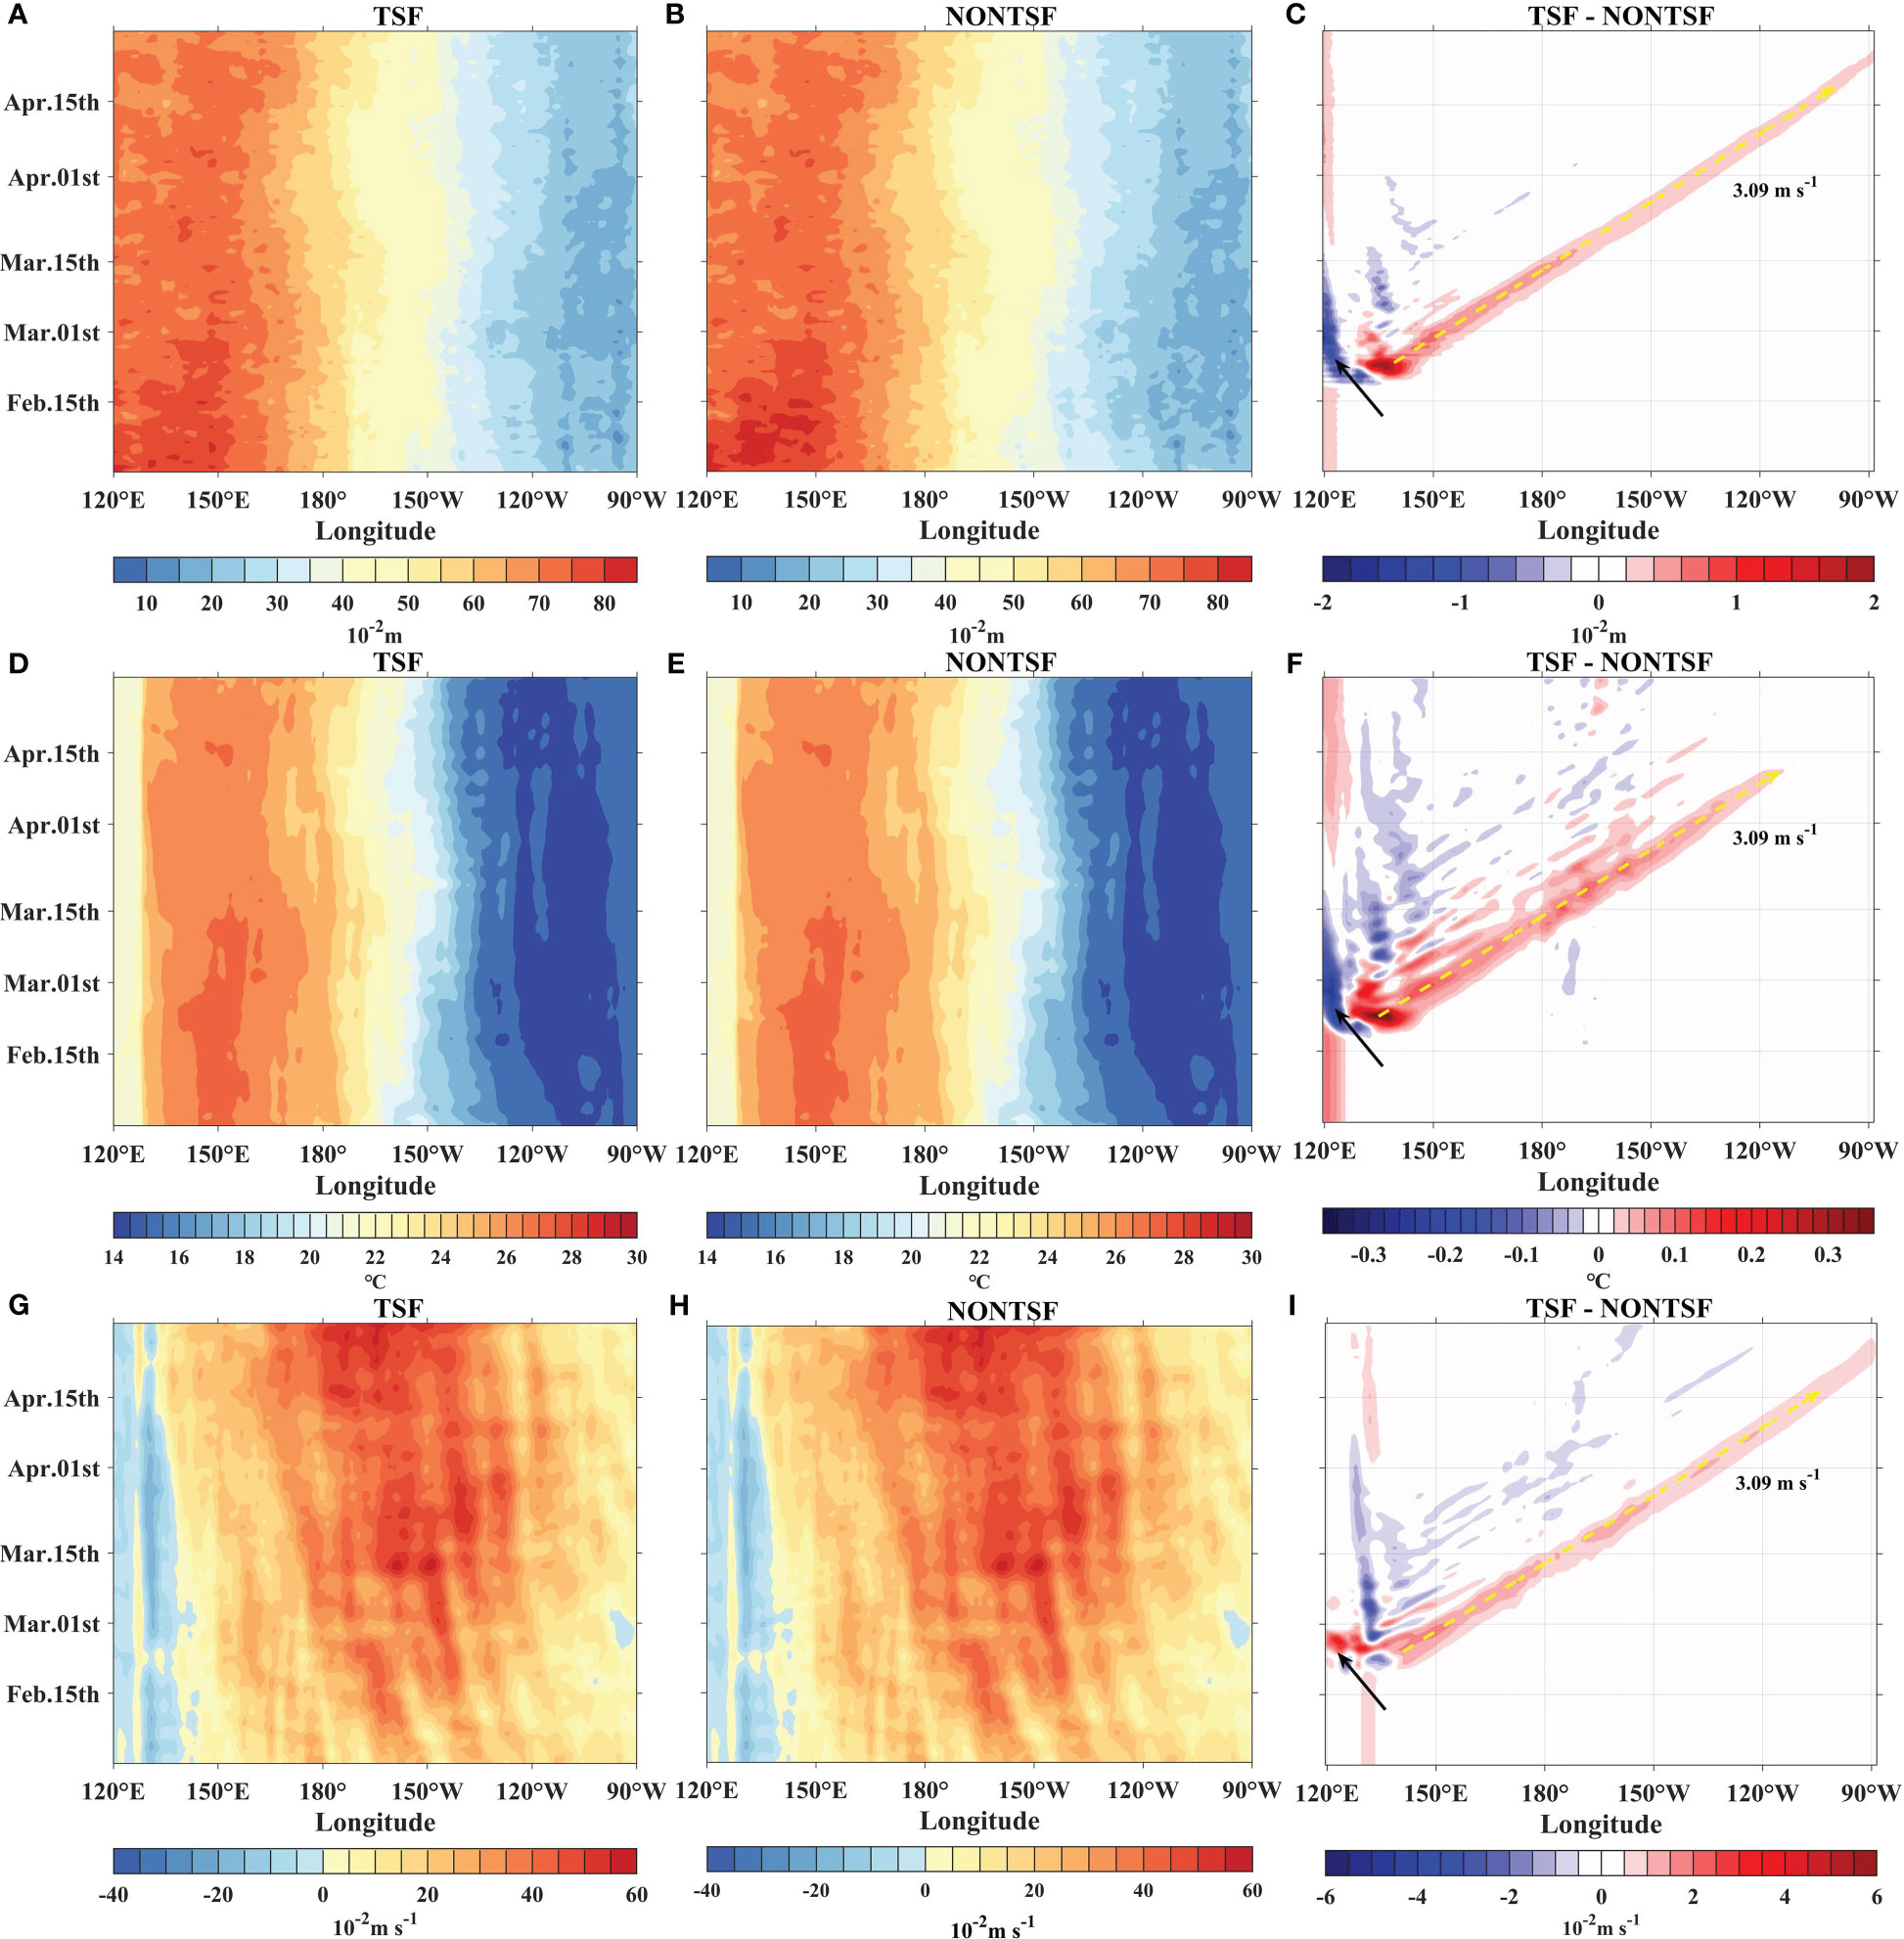
Figure 11 Longitude-time plots of daily TSF, NONTSF and their differences of (A–C) sea surface height, (D–F) 100-200 m upper ocean temperature, (G–I) 100-200 m upper ocean zonal velocity. (A) Same as Figure 6A, sea surface high anomalies data are all averaged at 5°S-5°N, and the upper layer temperature and zonal flow are averaged at 0°-5°N and are processed by 2D mean filter. The black arrow represents the projection of the TS Dujuan track on the equator. The yellow dashed arrow denotes the estimated modeled Kelvin wave speed and the value is 3.09 m s-1.
Compared to the NONTSF, the TSF has positive temperature differences; the maximum value is about 0.34°C between 130°E and 135°E on February 21. The characteristics of the temperature differences between the TSF and NONTSF experiments are also consistent with those of the SSH differences between the two experiments (Figure 11F).
The characteristics of the temperature differences between the TSF and NONTSF experiments along the TS track could also be explained by the fact that the direction of wind stress on the east side of the TS is aligned with that of the Ekman drift. As the TS moves from south to north, the energy input to the ocean on the east side of its track will be greater than that on the west side. The vertical mixing, entrainment, and Ekman pumping that occur on the east side can be more intensive and more likely to transport the subsurface low-temperature seawater up to the sea surface. Due to the heat-pumping effect of TS, more warm water masses at the surface can be transported downward by entrainment and mixing, warming the subsurface seawater. Moreover, the negative wind stress curl is input by the TS on the left side of the track (Figure 5), causing the equator-ward Sverdrup transport. The subsurface seawater is conveyed to the equator and accumulated, resulting in a change in the equatorial D20. The temperature differences in the upper ocean then propagate eastward with Kelvin waves. Since the temperature differences between the TSF and NONTSF experiments are small and the upper ocean temperature difference can only reach ~120°E, we speculate that the effect of TS Dujuan on the equatorial Kelvin wave is an amplification rather than an excitation. The differences between the TSF and NONTSF highlight the fact that the temperature change in the upper ocean of the western Pacific is caused by TS Dujuan rather than the climatological winds (Figures 11C, F, I). The TS winds induce the vertical mixing and intensify the air-sea heat exchange, causing the decrease of the temperature in the upper ocean on the west side of the forcing area, whereas the increase on the east side. The negative temperature differences on the west side present in the western Pacific, whereas the positive temperature difference on the east side moves eastward to a certain extent. TS Dujuan causes much more local changes than remote changes in SST (Figure S2A). In order to verify the negative feedback of Dujuan on La Niña events, the Niño3.4 index is calculated. The ENSO cycle in TSF enters the neutral state 1 to 2 days before that in the NONTSF (Figure S2B), and the difference between the two is slight due to low ACE, reflecting the contribution of TS-forced Kelvin waves in the La Niña event. However, for a significant impact on a La Niña event to be observed, the interactions and actions of multiple tropical cyclones are necessary (Sriver et al., 2013; Wang et al., 2019; Chen and Lian, 2020; Tong et al., 2023).
The effects of TS Dujuan on zonal currents in the upper ocean are analyzed based on our model simulations as well as a conceptual model (See Supplementary Material 2). A westward current is presented in both the TSF and NONTSF experiments (Figures 11G, H), which is in good agreement with the results shown in Figure 12A, further verifying the reliability of the model results. The distribution pattern of the speed differences between the TSF and NONTSF is similar to that of the SSH and temperature differences. TS Dujuan causes the zonal current in the equatorial region to produce the extreme value of the speed difference between TSF and NONTSF. The zonal current on the western side of the extreme value accelerates westward, and that on the eastern side accelerates eastward. The equatorial wind pulse induced by TS Dujuan produces the same acceleration characteristics in and (Figures 12A–C, E), and also results in alternating positive and negative changes in the zonal pressure gradient (Figure 12F), causing the Kelvin wave pulse during this period. Meanwhile, it is found that the TS-induced extreme values shown in Figures 11C, F, I lag behind the TS Dujuan activity. The cross-correlation analysis of and indicates that the shear current lags behind the pulsing wind for ~6 days. Based on this, we calculate the vertical eddy viscosity coefficients using the e-folding scale and regression fitting and estimate the values to be 132 cm2 s-1 and 64 cm2 s-1 (Figure 12D), respectively. The latter is roughly half of the former, similar to the relation obtained by McPhaden et al. (1988). However, the estimated value is lower than that in previous studies. Because the selected point is placed at the edge of TS Dujuan and the duration of the wind pulse is relatively short, and the wind intensity is relatively low.
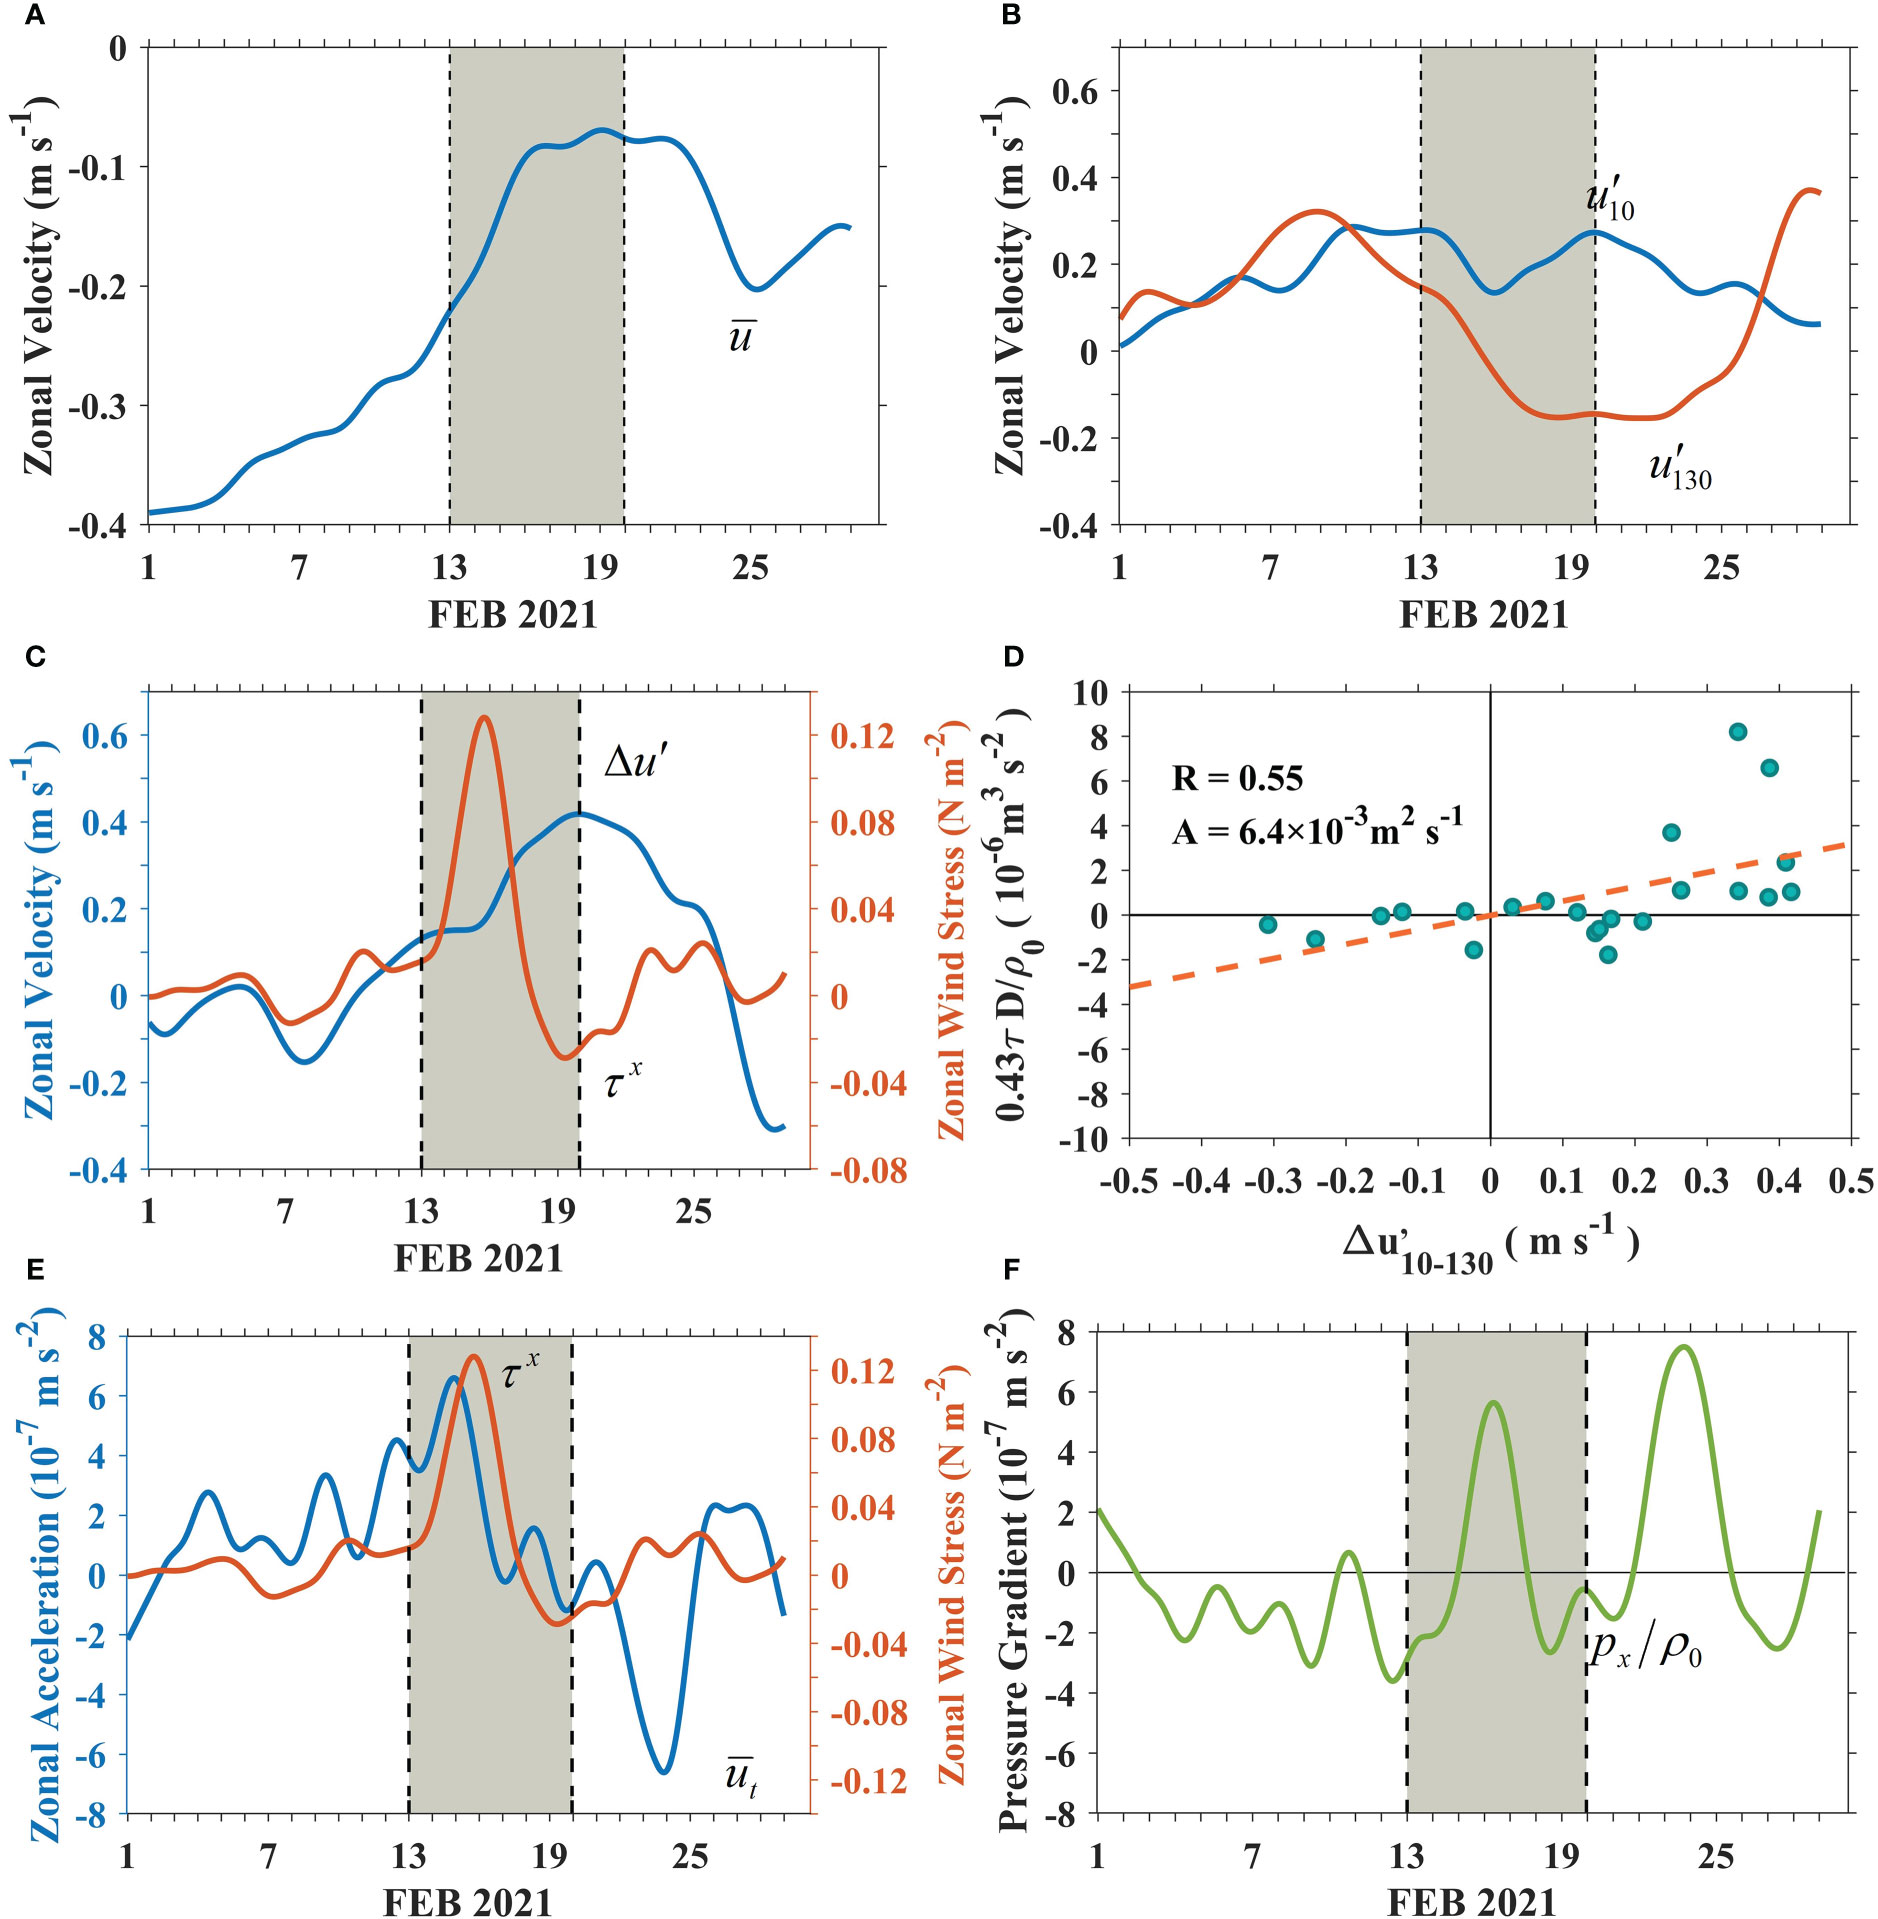
Figure 12 Time series of hourly data smoothed using the 5-day Hanning filter at 0°, 140°E, for (A) the zonal velocity, averaged over 0-150 m (), (B) current at 10 m and 130 m relative to the average (), (C) the wind stress () and the velocity difference , (D) regression of advanced by 6 days for daily data estimates of and . The slope is the eddy viscosity A, (E) the zonal acceleration () and wind stress (), (F) the zonal pressure gradient () (eastward direction is positive).
In TSF, TS Dujuan induces the increases in local SSH, upper ocean temperature, and zonal current speed. Those signals propagate eastward as Kelvin waves. Nevertheless, as seen in Figure 13, the difference between TSF and NONTSF declines rapidly. The SSH, temperature, and zonal current speed are decreased to 33%, 30%, and 53% of their maximum values at the start of eastward-propagation, and then to only 11%, 3%, and 35% in the eastern Pacific. We speculate that the weak propagation of the temperature gradient to the eastern boundary is due to the strength of TS Dujuan and thermal damping. Consequently, we suggest that TS Dujuan is not the primary source of the Kelvin waves activity shown in Figures 2–4, given the fact that the amplitude of SSH in NONTSF is lower than that in TSF by<4%.

Figure 13 The differences of (A) sea surface height, (B) 100-200 m upper ocean temperature, (C) 100-200 m upper ocean zonal velocity. The solid line is obtained from the model data by Gaussian fitting. The data is selected along the yellow arrow in Figures 11C, G, I.
In this study, the equatorial Kelvin waves are primarily excited by the reflection of Rossby waves at the western boundary of the Pacific Ocean. The diagnostic experiments allow us to detect the forcing effect of Dujuan on the equatorial Kelvin waves. Since the difference between the TSF and NONTSF rapidly decays during the eastward-propagation process, the temperature difference between the TSF and NONTSF does not propagate to the eastern boundary of the equatorial Pacific (Figures 11F, 13B). Moreover, the difference between the TSF and NONTSF experiments is much smaller than the change from the long-term average (anomalous signals), so we infer that TS Dujuan amplifies the Kelvin waves.
The 2020/2021 La Niña event began in August 2020 and ended in May 2021. TS Dujuan, which was active in the northwest Pacific in mid-February 2021, caused significant changes in the upper ocean in the equatorial Pacific, and the timing of the eastward propagation of the TS-forced wave coincided with the transition from the La Niña to a neutral state, which provided negative feedback to the development of La Niña.
In this study, the responses of the ocean to TS Dujuan are quantified and the effects of TS Dujuan on the equatorial oceanic Kelvin wave are analyzed and discussed based on satellite data, TAO buoy observations, and model simulations. According to both the satellite observations and simulations, the strong zonal wind anomaly which links to TS Dujuan elevates the local sea level, and pushes warm water from the sea surface into the subsurface, thereby deepening the D20, and accelerating zonal currents. These anomalies propagate eastward along the equator as Kelvin waves, the equatorial wave decomposition method is adopted to detect the wave. In addition to the zonal redistribution of heat, the spatial-temporal patterns of the surface GVAs reveal that the TS-forced Kelvin waves also redistribute the zonal current at the surface. We assume that there might be a connection between the TS Dujuan and the Kelvin wave because TS Dujuan happened near both the location and time of the onset of the equatorial Kelvin wave. To elucidate the forcing effect of TS Dujuan, we designed the diagnostic experiments using recursive filters to modify the surface wind forcing. The simulated SSH, upper ocean temperature, and zonal current are generally consistent with the observations, indicating that the modeling results are reliable.
Our simulation results suggest that even low-intensity cyclones like TS Dujuan can have a significant effect on the dynamics and propagation of Kelvin waves. The modeled Kelvin wave propagates faster than the observed one. Compared with the case in which the wind forcing of TS Dujuan is removed, TS Dujuan wind forcing induces a rise in the local SSH by ~2.1 cm and an increase in the upper ocean temperature by ~0.34°C, exhibiting a strong positive correlation. The simulation results also show that TS Dujuan promotes the acceleration of the zonal current. This acceleration lags behind the TS winds, and the acceleration effect spreads to the eastern Pacific. The equatorial upper ocean is impacted by TS Dujuan, causing Ekman suction to cool the surface seawater and heat the subsurface seawater (Emanuel, 2001). Combined with the negative wind stress curl input by TS Dujuan on the left side of its track, the warm water in the upper ocean is transported to the equator and further propagates eastward. Our results demonstrate that the transient wind forcing of TS Dujuan can redistribute the zonal heat and current of the upper ocean in the equatorial Pacific through the equatorial Kelvin waves. The outcomes of our model bear a striking resemblance to those derived from prior research (Sriver et al., 2013). However, a noteworthy deviation from other studies is observed in that the positive discrepancy rapidly descends to 30-53% of its peak. Additionally, the difference in the upper ocean temperature fails to extend to the eastern boundary of the equatorial Pacific. Also, the signal of SSH difference is significantly smaller than the SLA signal. Therefore, we infer that the forcing effect of TS Dujuan on the equatorial Kelvin wave is an amplification. In conclusion, the enhanced equatorial Kelvin wave propagates to the eastern Pacific, deepening the thermocline and inducing warm temperature anomalies, thus reducing the zonal thermal gradient of the equatorial Pacific during the La Niña phase and to a small extent accelerating the transition from the cold phase of ENSO to a neutral state in May 2021.
As the global warming, more strong tropical cyclones can be generated in the near-equatorial Pacific. It is estimated that before 2100 the continuous SST rise in the low-latitude area of the northwest Pacific will increase the intensity of tropical cyclones by ~14% (Emanuel, 2005; Webster et al., 2005; Mei et al., 2015). Further understanding of the forcing effects of near-equatorial TCs on equatorial Kelvin waves would help improving the predictions of ENSO events. Different from the previous researches that focused on asymmetric multi-TC forcing and symmetric twin-TC forcing (Keen, 1982; McPhaden et al., 1988; Nitta, 1989; Sriver et al., 2013), our study for the first time concentrated on the effect of a single TS. Based on the simulated results, we validly confirm the amplification effect of an individual TS on equatorial Kelvin waves from the perspectives of SSH, temperature, and zonal current. Owing to the limit of the TS wind stress intensity, the forcing effect is not very great. However, it can still be used as a reference for the study of the cross-scale influence of TCs on ENSO events. In addition, this study only investigated the forcing effect of the atmosphere on the ocean, without the coupling interactions between the ocean and the atmosphere (Boucharel et al., 2016). The impacts of ocean variability on the generation and development of TS Dujuan have not been considered.
The raw data supporting the conclusions of this article will be made available by the authors, without undue reservation.
ZD conceived and designed the study. YC conducted the numerical experiments and wrote the original draft. TY carried out the data analysis and language review. All authors contributed to the manuscript and agreed to the submitted version of the manuscript.
This work was supported by the National Natural Science Foundation of China (No. 42176020), the National Key Research and Development Program (2022YFC3105002), and the CAE Advisory Project (2022-XBZD-11).
We thank Prof. Xuefeng Zhang for providing the recursive filter code and for his helpful suggestions. We also appreciate NCEP, NOAA, CMEMS, and CMA for providing the observational and reanalysis data.
The authors declare that the research was conducted in the absence of any commercial or financial relationships that could be construed as a potential conflict of interest.
All claims expressed in this article are solely those of the authors and do not necessarily represent those of their affiliated organizations, or those of the publisher, the editors and the reviewers. Any product that may be evaluated in this article, or claim that may be made by its manufacturer, is not guaranteed or endorsed by the publisher.
The Supplementary Material for this article can be found online at: https://www.frontiersin.org/articles/10.3389/fmars.2023.1173163/full#supplementary-material
Boucharel J., Jin F. F., England M. H., Dewitte B., Lin I. I., Huang H. C., et al. (2016). Influence of oceanic intraseasonal kelvin waves on eastern pacific hurricane activity. J. Clim. 29 (22), 7941–7955. doi: 10.1175/JCLI-D-16-0112.1
Boulanger J. P., Menkes C. (1995). Propagation and reflection of long equatorial waves in the pacific ocean during the 1992–1993 El nino. J. Geophys. Res. Oceans. 100, 25041–25059. doi: 10.1029/95JC02956
Chan J. C. (2005). Interannual and interdecadal variations of tropical cyclone activity over the western north pacific. Meteor. Atmos. Phys. 89, 143–152. doi: 10.1007/s00703-005-0126-y
Chang Y. C., Chu P. C., Centurioni L. R., Tseng R. S. (2014). Observed near-surface currents under four super typhoons. J. Mar. Syst. 139, 311–319. doi: 10.1016/j.jmarsys.2014.07.011
Chao J., Xu X. (2001). The dynamic theory of shelf waves and its effect in the propagation of El niño signal. Acta Meteor. Sin. 59 (5), 515–523. doi: 10.3321/j.issn:0577-6619.2001.05.002
Chen D., Lian T. (2020). Frontier of El Niño-Southern Oscillation research. Chin. Sci. Bull. 65 (35), 4001–4003. doi: 10.1360/TB-2020-1219
Chen X., Gao S. (1994). The typhoon activity in the north-west pacific in el nino year. Marin. Forec. 11, 47–54. doi: 10.11737/j.issn.1003-0239.1994.03.009
Delcroix T., Picaut J., Eldin G. (1991). Equatorial kelvin and rossby waves evidenced in the pacific ocean through geosat sea level and surface current anomalies. J. Geophys. Res. Oceans. 96, 3249–3262. doi: 10.1029/90JC01758
Elipot S., Lumpkin R., Prieto G. (2010). Modification of inertial oscillations by the mesoscale eddy field. J. Geophys. Res. Oceans. 115 (C9), C09010. doi: 10.1029/2009JC005679
Emanuel K. A. (2001). Contribution of tropical cyclones to meridional heat transport by the oceans. J. Geophys. Res. 106, 14771–14781. doi: 10.1029/2000JD900641
Emanuel K. A. (2005). Increasing destructiveness of tropical cyclones over the past 30 years. Nature 436 (7051), 686–688. doi: 10.1038/nature03906
Fedorov A. V., Brierley C. M., Emanuel K. (2010). Tropical cyclones and permanent El niño in the early pliocene epoch. Nature 463, 1066–1070. doi: 10.1038/nature08831
Firing E., Lukas R., Sadler J., Wyrtki K. (1983). Equatorial undercurrent disappears during 1982-1983 El niño. Sci 222, 1121–1123. doi: 10.1126/science.222.4628.1121
Furuichi N., Hibiya T., Niwa Y. (2008). Model-predicted distribution of wind-induced internal wave energy in the world’s oceans. J. Geophys. Res. Oceans. 113, C09034. doi: 10.1029/2008JC004768
Gao S., Wang J., Ding Y. (1988). The triggering effect of near-equatorial cyclones on El niño. Adv. Atmos. Sci. 5 (1), 87–95. doi: 10.1007/BF02657349
Gierach M. M., Subrahmanyam B. (2008). Biophysical responses of the upper ocean to major gulf of Mexico hurricanes in 2005. J. Geophys. Res. Oceans. 113, C04029. doi: 10.1029/2007JC004419
Greatbatch R. J. (1984). On the response of the ocean to a moving storm: parameters and scales. J. Phys. Oceanogr. 14, 59–78. doi: 10.1175/1520-0485(1984)014<0059:OTROTO>2.0.CO;2
Hsieh W. W., Davey M. K., Wajsowicz R. C. (1983). The free kelvin wave in finite-difference numerical models. J. Phys. Oceanogr. 13, 1383–1397. doi: 10.1175/1520-0485(1983)013<1383:TFKWIF>2.0.CO;2
Hung C. C., Chung C. C., Gong G. C., Jan S., Tsai Y., Chen K. S., et al. (2013). Nutrient supply in the southern East China Sea after typhoon morakot. J. Mar. Res. 71, 133–149. doi: 10.1357/002224013807343425
Keen R. A. (1982). The role of cross-equatorial tropical cyclone pairs in the southern oscillation. Mon. Wea. Rev. 110, 1405–1416. doi: 10.1175/1520-0493(1982)110<1405:TROCET>2.0.CO;2
Large W. G., McWilliams J. C., Doney. S. C. (1994). Oceanic vertical mixing: review and a model with a nonlocal boundary layer parameterization. Rev. Geophys. 32, 363–403. doi: 10.1029/94RG01872
Large W. G., Pond S. (1981). Open ocean momentum flux measurements in moderate to strong winds. J. Phys. Oceanogr. 11, 324–336. doi: 10.1175/1520-0485(1981)011<0324:OOMFMI>2.0.CO;2
Lian T., Ying J., Ren H. L., Zhang C., Liu T., Tan X. X. (2019). Effects of tropical cyclones on ENSO. J. Climate. 32, 6423–6443. doi: 10.1175/JCLI-D-18-0821.1
McPhaden M. J. (1999). Genesis and evolution of the 1997-98 El niño. Sci 283 (5404), 950–954. doi: 10.1126/science.283.5404.950
McPhaden M. J., Ando K., Bourles B., Freitag H. P., Lumpkin R., Masumoto Y., et al. (2010). The global tropical moored buoy array. Proc. OceanObs. 9, 668–682. doi: 10.5270/OceanObs09.cwp.61
McPhaden M. J., Freitag H. P., Hayes S. P., Taft B. A., Chen Z., Wyrtki K. (1988). The response of the equatorial pacific ocean to a westerly wind burst in may 1986. J. Geophys. Res. Oceans. 93, 10589–10603. doi: 10.1029/JC093iC09p10589
Mei W., Xie S. P., Primeau F., McWilliams J. C., Pasquero C. (2015). Northwestern pacific typhoon intensity controlled by changes in ocean temperatures. Sci. Adv. 1 (4), e1500014. doi: 10.1126/sciadv.1500014
Monaldo F. M., Sikora T. D., Babin S. M., Sterner R. E. (1997). Satellite imagery of sea surface temperature cooling in the wake of hurricane Edouard(1996). Mon. Wea. Rev. 125, 2716–2721. doi: 10.1175/1520-0493(1997)125<2716:SIOSST>2.0.CO;2
Nitta T. (1989). Development of a twin cyclone and westerly bursts during the initial phase of the 1986-87 El niño. J. Meteor. Soc Jpn. Ser. II. 67, 677–681. doi: 10.2151/jmsj1965.67.4_677
Philander S. G. H. (1990). El Niño, la niña, and the southern oscillation (San Diego: Academic Press), 1–299.
Pujol M. I., Faugère Y., Taburet G., Dupuy S., Pelloquin C., Ablain M., et al. (2016). DUACS DT2014: the new multi-mission altimeter data set reprocessed over 20 years. Ocean. Sci. 12, (5), 1–48. doi: 10.5194/os-12-1067-2016
Quanan Z., Jiayi P. A. N., Timothy L. W. (2006). Observation of ocean current response to 1998 hurricane georges in the gulf of Mexico. Acta Oceanol. Sin. 25, 1–14. doi: 10.1016/S0090-6980(01)00146-0
Rebert J. P., Donguy J. R., Eldin G., Wyrtki K. (1985). Relations between sea level, thermocline depth, heat content, and dynamic height in the tropical pacific ocean. J. Geophys. Res. Oceans. 90, 11719–11725. doi: 10.1029/JC090iC06p11719
Shinoda T., Roundy P. E., Kiladis G. N. (2008). Variability of intraseasonal kelvin waves in the equatorial pacific ocean. J. Phys. Oceanogr. 38, 921–944. doi: 10.1175/2007JPO3815.1
Sommer J. L., Zeitlin V. (2005). Tracer transport during the geostrophic adjustment in the equatorial ocean, in Chaotic Dynamics and Transport in Classical and Quantum Systems. NATO Advanced Study Institute on International, School on Chaotic Dynamics and Transport in Classical and Quantum Systems, 413–429. doi: 10.1007/1-4020-2947-0_19
Sriver R. L., Huber M. (2010). Modeled sensitivity of upper thermocline properties to tropical cyclone winds and possible feedbacks on the Hadley circulation. Geophys. Res. Lett. 37 (8), L08704. doi: 10.1029/2010GL042836
Sriver R. L., Huber M., Chafik L. (2013). Excitation of equatorial kelvin and yanai waves by tropical cyclones in an ocean general circulation model. Earth. Syst. Dynam. 4, 1–10. doi: 10.5194/esd-4-1-2013
Sriver R. L., Huber M., Nusbaumer J. (2008). Investigating tropical cyclone-climate feedbacks using the TRMM microwave imager and the quick scatterometer. Geochem. Geophy. Geosy. 9, Q09V11. doi: 10.1029/2007GC001842
Sun L., Li Y. X., Yang Y. J., Wu Q., Chen X. T., Li Q. Y., et al. (2014). Effects of super typhoons on cyclonic ocean eddies in the western north pacific: a satellite data-based evaluation between 2000 and 2008. J. Geophys. Res. Oceans. 119, 5585–5598. doi: 10.1002/2013JC009575
Tong B., Wang X., Wang D., Zhou W. (2023). A novel mechanism for extreme El niño events: interactions between tropical cyclones in the Western north pacific and Sea surface warming in the Eastern tropical pacific. J. Clim. 36 (8), 2585–2601. doi: 10.1175/JCLI-D-21-1014.1
Wang B., Chan J. C. (2002). How strong ENSO events affect tropical storm activity over the western north pacific. J. Climate 15, 1643–1658. doi: 10.1175/1520-0442(2002)015<1643:HSEEAT>2.0.CO;2
Wang Q., Li J., Jin F. F., Chan J. C., Wang C., Ding R., et al. (2019). Tropical cyclones act to intensify El niño. Nat. Commun. 10, 1–13. doi: 10.1038/s41467-019-11720-w
Wang X., Wang C., Han G., Li W., Wu X. (2014). Effects of tropical cyclones on large-scale circulation and ocean heat transport in the south China Sea. Clim. Dyn. 43, 3351–3366. doi: 10.1007/s00382-014-2109-5
Webster P. J., Holland G. J., Curry J. A., Chang H. R. (2005). Changes in tropical cyclone number, duration, and intensity in a warming environment. Sci 309 (5742), 1844–1846. doi: 10.1126/science.1116448
Willoughby H. E., Rahn M. E. (2004). Parametric representation of the primary hurricane vortex. part I: observations and evaluation of the Holland, (1980) model. Monthly. Weather. Rev. 132 (12), 3033–3048. doi: 10.1175/MWR2831.1
Wyrtki K. (1985). Water displacements in the pacific and the genesis of El niño cycles. J. Geophys. Res. Oceans. 90, 7129–7132. doi: 10.1029/JC090iC04p07129
Xie Y., Koch S., McGinley J., Albers S., Bieringer P. E., Wolfson M., et al. (2011). A space-time multiscale analysis system: a sequential variational analysis approach. Mon. Wea. Rev. 139, 1224–1240. doi: 10.1175/2010MWR3338.1
Xie Y., Koch S. E., McGinley J. A., Albers S., Wang N. (2005). “July: A sequential variational analysis approach for mesoscale data assimilation. in preprints, 21st conf. on weather analysis and Forecasting/17th conf,” in Numerical weather prediction, vol. 15. (Washington, DC, Amer: Meteor. Soc. B).
Yuan D., Han W. (2006). Roles of equatorial waves and western boundary reflection in the seasonal circulation of the equatorial Indian ocean. J. Phys. Oceanogr. 36 (5), 930–944. doi: 10.1175/JPO2905.1
Keywords: tropical storm, equatorial Kelvin wave, La Niña, ocean modeling, upper ocean
Citation: Chu Y, Deng Z and Yu T (2023) Effects of tropical storm on equatorial Kelvin waves: a study based on both observation and modeling. Front. Mar. Sci. 10:1173163. doi: 10.3389/fmars.2023.1173163
Received: 24 February 2023; Accepted: 12 June 2023;
Published: 07 July 2023.
Edited by:
Shengqi Zhou, Chinese Academy of Sciences (CAS), ChinaReviewed by:
William Smyth, Oregon State University, United StatesCopyright © 2023 Chu, Deng and Yu. This is an open-access article distributed under the terms of the Creative Commons Attribution License (CC BY). The use, distribution or reproduction in other forums is permitted, provided the original author(s) and the copyright owner(s) are credited and that the original publication in this journal is cited, in accordance with accepted academic practice. No use, distribution or reproduction is permitted which does not comply with these terms.
*Correspondence: Zengan Deng, ZGVuZ3plbmdhbkAxNjMuY29t; Ting Yu, anVsaWFfeXVfbm1kaXNAMTYzLmNvbQ==
Disclaimer: All claims expressed in this article are solely those of the authors and do not necessarily represent those of their affiliated organizations, or those of the publisher, the editors and the reviewers. Any product that may be evaluated in this article or claim that may be made by its manufacturer is not guaranteed or endorsed by the publisher.
Research integrity at Frontiers
Learn more about the work of our research integrity team to safeguard the quality of each article we publish.