 Mats Westerbom
 Sanna Kuningas
 Antti Lappalainen2
- 1Natural Resources Institute Finland (Luke), Turku, Finland
- 2Natural Resources Institute Finland (Luke), Helsinki, Finland
- 3Natural Resources Institute Finland (Luke), Vaasa, Finland
Fish spawning and nursery habitats are critically important for the maintenance and conservation of viable fish stocks. Understanding habitat use of breeding fish is therefore important. This study examines the spatial distribution of Eurasian perch (Perca fluviatilis) egg strand occurrence and larval density in 18 brackish water post-glacial land-uplift lagoons in the northern Baltic Sea. The aim of the study was to quantify spawning habitat characteristics and evaluate how geomorphological, hydrological, and biological parameters affect perch breeding. Egg strand occurrence was assessed by snorkeling whereas fish larvae and zooplankton were sampled using horizontal surface hauls. Egg strand and larval density increased with higher habitat isolation, i.e., bay morphology had a decisive role in determining early recruitment success. Moreover, egg strand occurrence and larval density correlated positively with water temperature, charophyte cover and negatively with salinity. The zooplankton community structure differed among lagoon types but neither zooplankton density nor diversity showed a clear association with egg strand or fish larvae abundance. However, cladocerans and copepods were abundant in the most enclosed bays, and their density correlated positively with perch larval density. Our findings comply with earlier studies highlighting the importance of bay isolation for fish recruitment strength. We call for a foreseeing coastal management planning, that apart from considering current status and trends, also integrates decadal long projections of isostatic land-uplift processes in conservation decisions to secure the long-term persistence of the best spawning and nursery areas.
1 Introduction
Elucidating fish recruitment is a complicated undertaking and requires the integration of many processes that vary over space and time (Kaemingk et al., 2014; Zimmermann et al., 2019). In response to this variation, fish breeding success can be highly stochastic, affecting fish stock size and ultimately fish yields. Exploring species-environment relationships to identify the characteristics of essential fish habitats (EFH) is important for maintaining viable fish populations also allowing their use (Kraufvelin et al., 2018). Key to maintaining strong populations on a global scale is a better understanding of the factors that support or obstruct fish recruitment biology, and on a regional scale, by locating the most important spawning and nursery grounds and allocating protection measures to secure their future state (Saulamo and Neuman, 2002; Olsson et al., 2011). The task is challenging, as EFHs are highly heterogeneous and dynamic and as fish reproduction is a fragile life-history event controlled by many stochastic factors (Wang and Eckmann, 1994).
Coastal lagoons in the Baltic Sea are expanses of coastal waters typically showing a high variability in geomorphology, hydrology, chemistry, and biology. Lagoons are partially separated from the sea; usually by a threshold or a narrow inlet that limits water exchange with the adjacent sea area (Munsterhjelm, 1997). Shallow post-glacial land-uplift lagoons in the Baltic Sea that go through natural succession are continually formed along the coastline. Through isostatic land uplift, they go through a process of increasing isolation to eventually become completely landlocked (Munsterhjelm, 1997). Shallow post-glacial land-uplift bays are in many ways dynamic and complex ecosystems (Munsterhjelm, 1997; Tolvanen et al., 2004). They are important spawning and nursery areas for many freshwater fish, such as pike Esox lucius, roach Rutilus rutilus, white bream Blicca bjoerkna and bleak Alburnus alburnus (Lappalainen and Urho, 2006, Snickars et al., 2009; Donadi et al., 2020; Pursiainen et al., 2021). Several environmental parameters change in the freshwater – brackish water interchange that characterizes coastal lagoons (Tolvanen et al., 2004; Hansen et al., 2008). These changes may either promote or suppress fish breeding. As coastal lagoons lie in the interface between land and sea, they are highly productive. However, they also integrate several adverse effects of human land and sea use that weaken their ecosystem integrity. Human incited changes in watershed and shoreline areas compromise the capacity of these habitats to maintain structure and ecosystem function, such as their function as fish spawning and nursery habitats (Sundblad and Bergström, 2014).
Eurasian perch (Perca fluviatilis) is a widely distributed freshwater fish in the Baltic Sea and a valued target fish for both commercial and recreational fisheries (Hansson et al., 2018, Lappalainen et al., 2020). Together with roach (Rutilus rutilus), perch dominates the gill-net test-fishing catches in number and biomass in coastal areas of the northern Baltic Sea (Lappalainen et al., 2000). Despite their dominance, the population size of perch is in many areas declining (Nilsson et al., 2004; Ljunggren et al., 2010; Bergström et al., 2016; Nelson et al., 2018, Olsson et al., 2019) likely reflecting changes in the spawning grounds (Snickars et al., 2010) and changes in predation pressure (Kokkonen et al., 2019; Donadi et al., 2020; Veneranta et al., 2020). Spawning fish typically congregate in enclosed shallow bays with a lush underwater vegetation where seawater temperature is higher and less variable than in the surrounding open sea area (Karås, 1996). After breeding, they commonly migrate back to their feeding areas outside the lagoons (e.g. Tibblin et al., 2012). Perch has a limited home range (Böhling and Lehtonen, 1984), leading to small scale spatial genetic variability among populations (Olsson et al., 2011; Hall et al., 2022). With a limited home range, the conditions in the spawning grounds become vital for population maintenance where only a few breeding areas may contribute disproportionately to the regional fish population size, underscoring the importance of local management actions that secure the integrity of the local breeding grounds. In the Gulf of Finland, Kallasvuo et al. (2017) estimated that 80% of perch larvae are produced in an area that comprises only 2.4% of the total coastal area. Despite the increased need for characterizing EFHs, information is still lacking to assess the role of coastal habitats for early fish production (Kraufvelin et al., 2018).
The aim of this study was to explore the factors affecting perch recruitment variability in 18 coastal lagoons of different successional stage. Specifically, we wanted to clarify (1) if the number of egg strands and larval density differ across lagoon types, and (2) elucidate what environmental and biological parameters correlate with this variation. Based on previous studies (Snickars et al., 2010; Donadi et al., 2020; Pursiainen et al., 2021), we hypothesized that we would find perch strands in all included bays but that bays in the late stage of land-uplift succession would outperform those that are in an earlier stage. From historic records, we know that > 500 egg strands were found (Eero Aro, unpublished data) in a single outer open bay (also part of this study) suggesting that perch breeding occurs abundantly in outer sea areas as well. We also hypothesized that larval density would be higher in the more isolated bays, driven primarily by an initially higher number of egg strands, but secondarily by a higher survival rate among perch larvae in more stable conditions with also better feeding conditions (Ljunggren et al., 2010). This study provides information on the early breeding biology of perch and identifies the habitat characteristics that support a viable perch population. The questions we ask are by no means new. Effects of variations in bay morphometry on perch recruitment in the Baltic Sea have been studied in relation to hydrology (Karås, 1996), vegetation (Snickars et al., 2010; Bučas et al., 2022), human impact (Sandström et al., 2005) or a combination of these (Donadi et al., 2020). While most of the previous studies have independently tried to answer specific aspects of perch reproductive biology in the Baltic Sea, only few have analyzed the factors controlling roe and early larval abundance simultaneously (see however Ljunggren et al., 2010; Snickars et al., 2010). Moreover, in most studies relating habitat quality and fish production, research has targeted juvenile stages not specifically larvae (see however Snickars et al., 2010). Results from this study provide baseline information on the early recruitment biology of perch and helps in the management and conservation planning of this important species. A central goal in ecological research is to find unifying explanations for population variability in space and time. However, most research findings are context-dependent – i.e. the strength (weak, intermediate or strong) and direction (-, 0 or +) of relationships between dependent and independent variables often vary with changing biological and environmental settings. Replicating research questions and comparing findings is crucial for progressing science at large, i.e. for finding generic explanations for ecological pattern (Camerer et al., 2018) and for finding the best management solutions that may vary over space (Hall et al., 2022).
2 Materials and methods
Field surveys were conducted from late March to the end of June in 2020 and covered 18 shallow land-uplift bays located in a vast archipelago area of SW Finland (59,8280/23,0687 – 59,9071/23,6173) (Figure 1). The isostatic land-uplift in the area is around 30-40 cm per century (Eronen et al., 2001). Selected lagoons varied in size, habitat isolation and position in the archipelago area and they were grouped into three distinct morphological groups according to Munsterhjelm (1997). The three different groups were: 1) Juvenile Flads or semi-Open bays characterized by a good water exchange with the surrounding sea area, 2) Flads with a distinct threshold and narrowing of the inlet and 3) Glo-Flads that are temporally separated from the adjacent sea by land or by a dense reed (Phragmites australis) belt. These three groups represent different stages of lagoon land-uplift succession and differ profoundly regarding biotic and abiotic parameters. To each bay type, we included 6 bays that were dispersed as best as possible over the entire study area. In each of the 18 lagoons, several independent factors were measured to characterize the lagoons. These included bay morphology (average depth, surface area and bay openness), hydrology (salinity, cumulative temperature and turbidity) and biological characteristics (vegetation cover and character, zooplankton abundance and composition). Morphological characteristics were measured in field or calculated using orthophotos offered by the National Land Survey of Finland. Depth measurements are based on previous research (Rosqvist et al., 2010), and in cases when no previous records were available, they were measured using a handheld sonar. From orthophotos, reed cover was also estimated. Bay topographic openness (To) was estimated according to Persson et al. (1994) by calculating the quotient of the narrowest cross-sectional area (At) of the inlet and the surface area (a) of the lagoon x 100.
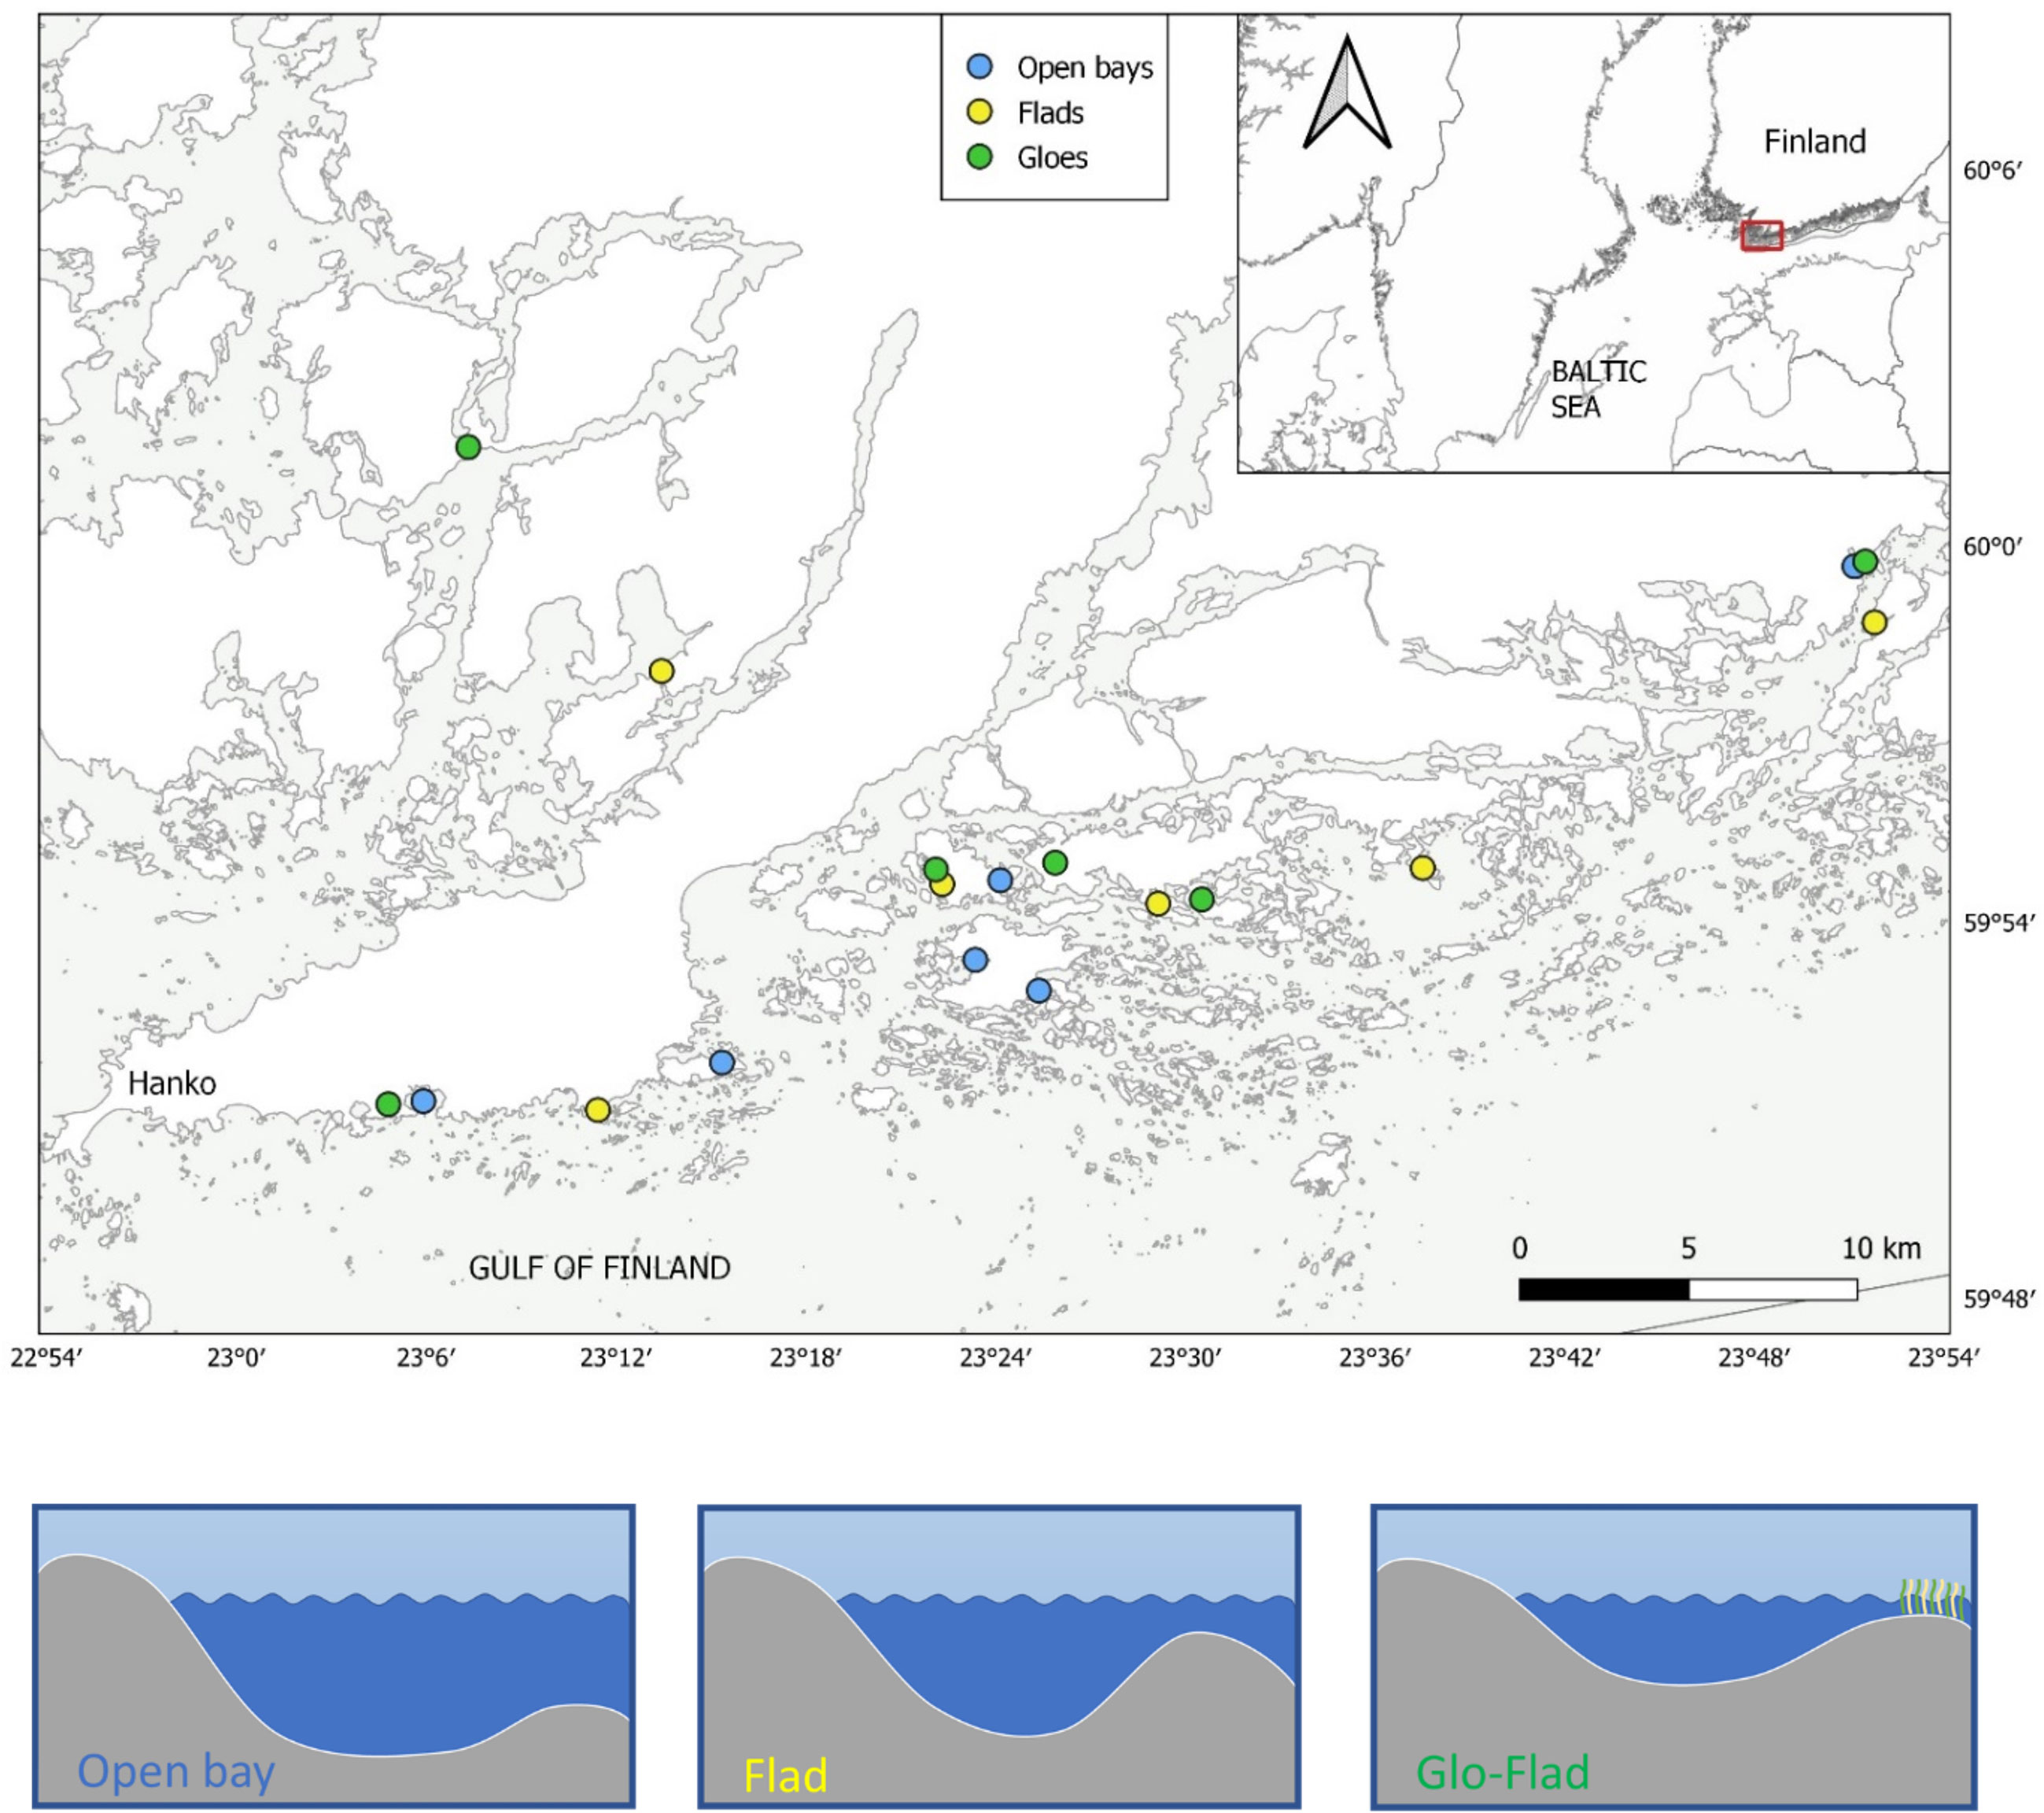
Figure 1 Map of the study area showing the location of the three bay types Open bays, Flads and Glo-Flads (or Glos). Lower panel, schematic representation of the bay succession stages (Munsterhjelm, 1997).
2.1 Hydrological sampling
Several abiotic parameters were measured to characterize the 18 lagoons. Automatic HOBO temperature loggers located at 0.5 m depth, recorded sea temperature every 4th hour from early April to early June in each of the 18 lagoons. Cumulative temperatures based on daily averages (heatsum d°C) were then used in statistical testing. Salinity (PSU) measures were taken by hand every second week during the spring and early summer (April – June). Turbidity (NTU – Nephelometric Turbidity Unit) was measured at four occasions in April and May with a turbidimeter (Hach 2100P; Hach Co, USA). Hydrological data collected between early April and early May were used when analyzing egg strand data. For larval density, measurements taken in entire May were additionally included.
2.2 Estimating egg strand number and macrophyte cover
To estimate macrophyte cover and number of perch egg strands, a snorkeler swam along the shoreline in each bay at depths between ca 0.5 – 1.5 meters. Dominating macrophyte coverage was estimated in portions along the transects and the occurrence of perch egg strands was counted. In small and shallow bays, perpendicular transects from shore to shore to the length axis of the lagoon were additionally included. Observations were made on either side of the snorkeler, each within a space of 1 m from the snorkeler. The distribution of egg strands was observed biweekly from 29th March to 1st June in all bays. The first egg strands were observed on the 17th of April. In bays with few or no observations, surveys were extended to the end of June whereas in bays with a high number of strands, counting was terminated when the peak in encountered strands was passed, and when only few new egg strands were observed. In deeper bays with no or a few strands, perpendicular transects were additionally surveyed to assure that there were no strands deeper down. Since no egg strands were found in these perpendicular transects, the effort was not included in the abundance estimates. From each bay, the highest number of strands found in a single survey event was used in final analyses. Abundance values for egg strands were CPUE-corrected by the length of the snorkeling distance to standardize the effort among different bays. Since fish breeding success varies highly among years, all 18 bays were re-visited in 2021 (21st April – 4th May) and egg strands were counted to estimate the annual consistency of egg strand number among the different bays. No other measurements were taken in 2021.
2.3 Sampling fish larvae
Larval perch and zooplankton samples were collected between 30th April and 27th May. The exact timing of the hauls was done based on the embryonic development stage in the roe. Hauling was initiated within a week after the first signs of hatched eggs. Perch larvae display ontogenic shifts in habitat use. Immediately after hatching, they show low mobility and are found as passive drifters in the near surface zone (Urho, 1996). Fish sampling was conducted at five haphazardly dispersed locations within each bay. Sampling was conducted from shore by using a remotely operated boat, or alternatively, from a boat that carried a conical haul (200-μm mesh, mouth aperture 50 cm in diameter) at the end of a 30 m rope. Five horizontal transects of 30 m length where then hauled at a speed of approx. 1 ms-1. Target size of perch in larval sampling was between 5-7 mm. Before collecting the sample, fish trapped in the net were washed down with seawater and the retained sample was preserved in a 4% buffered formalin seawater solution. In laboratory, all fish larvae were identified to species and their total length (TL) was measured to the nearest 1 mm. Larval sampling was done at two occasions, with ca one - two weeks intervals. In a subset of bays with either many or no egg strands, sampling was done a third time to assure that there were no later peaks in larval occurrence. When analyzing the data, we combined the average counts from two sampling rounds that had the highest density.
2.4 Plankton community
For early life history stages in fish, food availability and food quality are critical determinants of habitat quality. To assess the gross food composition, zooplankton hauls were taken parallel with perch larval sampling. Using horizontal hauls (100-μm mesh, mouth aperture 25 cm in diameter) and a towing speed of ca 1ms-1, three replicate plankton hauls were sampled at different parts of the 18 bays. Each haul was 4 m in length. Upon sampling, the plankton net was washed down with seawater and the retained sample was preserved in 70% ethanol (round 1) or in 5% acid Lugol solution (round 2). In laboratory, plankton were counted and identified from subsamples to the main zooplankton groups that constitute the larval fish diet. Some species were included only as genera due to taxonomic ambiguity or uncertainty in species identification. The plankton was also assigned to three size groups and only plankton smaller than 0.5 mm were included in the analyses, as small percid larvae have been shown to be gape limited (Bremigan et al., 2003; Kestemont and Henrotte, 2015). It is noteworthy that this study wasn’t designed to describe the dynamics of the plankton community in the different bays – for which a more frequent, and extended sampling scheme would have been needed. The plankton sampling was designed to grossly picture the zooplankton density and composition at the time when perch larval abundances on average peak in this system.
2.5 Statistical analyses
Since many dependent and independent variables were measured only at the bay level and therefore lacked within bay replication (e.g., egg strand number, bay morphometric characteristics, temperature), we treated each bay as the smallest sampling unit. The only exception were the plankton data, where analyses were based on individual samples. We applied parametric univariate ANOVA techniques to test for differences in response and independent variables among the different bay groups. In most cases, variables were transformed by log+1, forth- or square root to meet assumptions for normal distribution and homogeneous variance. In case these assumptions could not be met, Kruskal-Wallis tests were performed. In ANOVA, we used a posteriori Student-Neuman-Keuls (SNK) tests to reveal the occurrence and direction of pairwise differences. In all cases, analyses were carried out on balanced data.
The relationship between the two response variables, number of egg strands and perch larvae abundance, and the explanatory environmental variables was assessed using distance-based linear modelling, DISTLM in PRIMER-e v7 package (Anderson et al., 2008). Skewness of variables was first tested in SPSS and variables were transformed by log+1, fourth root, square root, or inverse transformation to minimize skewness. Prior to all multivariate tests, Draftman plots were used to evaluate for multi-collinearity and skewness of data and where Pearson´s correlations approached 0.9, one of the highly correlating variables was removed (see Anderson et al., 2008). As environmental variables had different measurement scales, the data was normalized prior to testing. R2 was calculated for each explanatory variable, and the most parsimonious model was selected according to the Akaike Information Criterion (AIC). We tested our DistLM models also with BIC as selection criterion that corroborated almost perfectly models based on AIC. The Best procedure was used to examine the value of the selection criterion for all possible combinations of environmental variables that best explained the variation in response variables. In the DistLM model, the zooplankton variable was represented by the summed abundance of cladocerans and copepods (including nauplii) for each bay. A total of 9999 unrestricted permutations of raw data were used in all analyses.
For graphical illustration of results, we used correlation-based principal coordinates analysis (PCO) on normalized data to condense and summarize the differentiation among the three bay types and using vector overlays to show which of the environmental variables that best describes the similarities among bays. PCOs were run for both abiotic and biotic parameters. In these analyses, we used Spearman’s correlations at 0.2 to indicate the variables were most responsible for the differences among bay types.
For zooplankton, Shannon-Wiener diversity index (with log base e), zooplankton richness and density were calculated for all samples and tested for potential bay differences with a two-factor nested Analysis of Similarity test (ANOSIM). ANOSIM was chosen over PERMANOVA as PERMDISP indicated heterogeneity in dispersion among groups that couldn’t be rectified using transformations. These univariate tests were done on matrices based on Euclidean distances with 9999 permutations. To test for differences in zooplankton community composition among the different bay types, we used Analysis of Similarity tests with lagoons (random factors) nested within bay types (fixed factors). Bray-Curtis similarity matrices based on fourth root transformed abundance data were used. Canonical Analysis of Principal coordinates was then used to visualize the distinctiveness among a priori groups indicated by ANOSIM. CAP is a constrained ordination that computes the axes that best separate a priori groups and uses cross-validation (leave-one-out diagnostics) to provide a measure of classification accuracy. The appropriate axis (m = 10) was applied by maximizing the leave-one-out allocation success. Species responsible for differences among bay types in CAP plots were identified by the strength of their correlation with canonical discriminant axes and species correlations of 0.4 were then visualized as overlay vectors.
3 Results
3.1 Bay morphometry
Lagoon area (ANOVA, F2,15 = 0.878, P = 0.44), shoreline length (One way ANOVA, F2,15 = 0.716, P = 0.51) and lagoon volume (One way ANOVA, F2,15 = 2.6, P = 0.11) didn’t differ among bay groups (see Table 1). Average depth differed among groups (One way ANOVA, F2,15 = 4.24, P = 0.035) as Glo-Flads were shallower than both Flads and Open bays. Obviously, as inlet threshold depth defines bay successional stage, the deepest threshold was found in the Open bays and the shallowest in the Glo-Flads (Kruskal-Wallis, H = 12.63, P = 0.002). Topographic openness was lower in Glo-Flads compared to Open bays (Kruskal-Wallis, H = 12.01, P = 0.002). Multivariate tests – testing for all geomorphological parameters - found significant differences among the lagoon types (PERMANOVA, pseudo-F = 4.92, P< 0.001). Pair-wise tests separated Glo-Flads from Open bays (P = 0.002). For the other bay combinations, there were no significant differences but strong trends indicating some degree of separation (P = 0.06 in both cases). The differences in bay morphology were seen in the PCO ordination (Figure 2) where Open bays and Glo-Flads, were grouped at different ends of the multivariate data cloud, while Flads were found between these extremes. The two first PCO-axes explained together 87% of the variation in the data cloud. PCO1 discriminated lagoons mainly based on threshold depth and average depth while Shoreline length was best discriminated along PCO2.

Table 1 Summed characteristics for the main environmental variables.
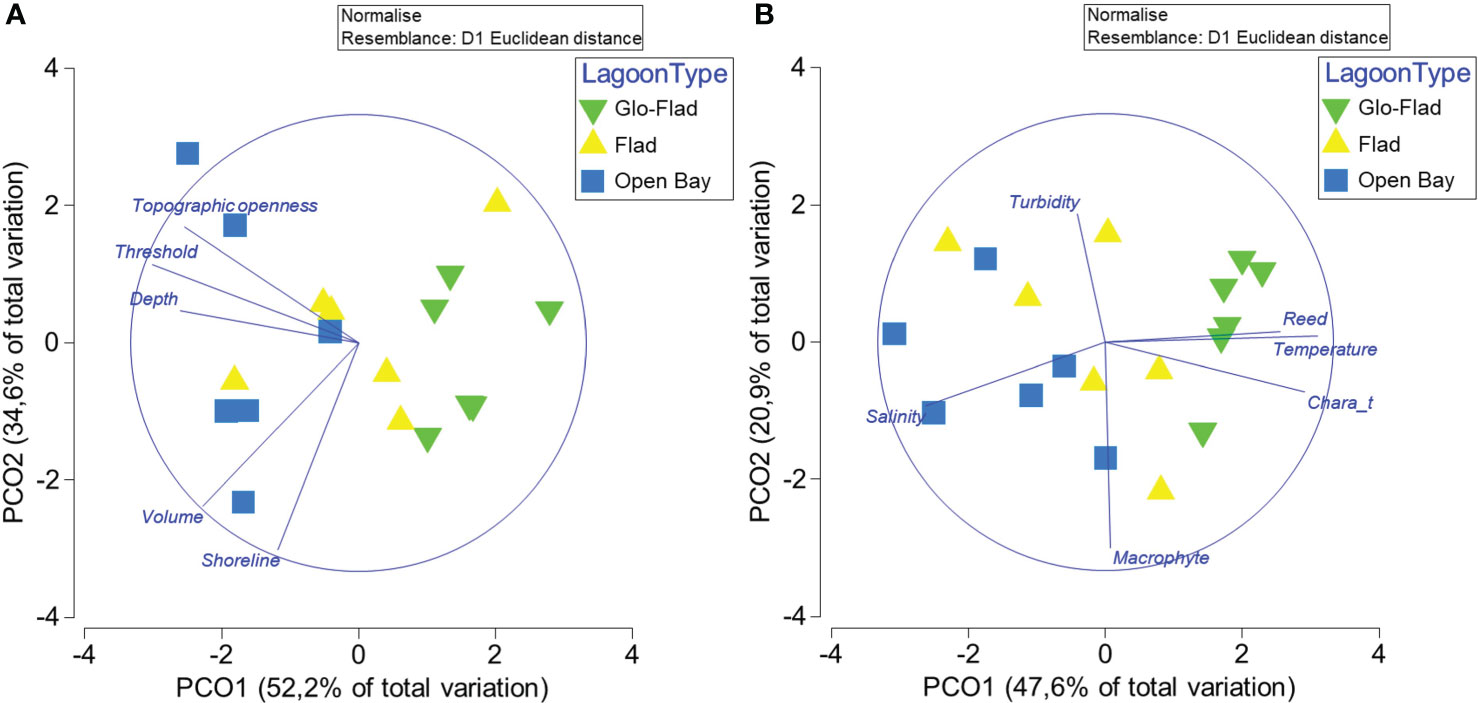
Figure 2 Principal Coordinate Ordination showing location and dispersion of different bay types based on bay geomorphology (A) and hydrology & vegetation (B).
3.2 Hydrology
Cumulative temperature (heatsum d°C) in April and early May differed significantly among all lagoon types, with Glo-Flads being the warmest, followed by Flads and Open bays (One way ANOVA, F2, 15 = 14.57, P< 0.001, Table 1). The pattern was stable over the summer season (One way ANOVA, F2, 15 = 14.00, P< 0.001), showing high correlation between April and the remaining part of the growth season (Pearsons correlation, N = 18, r = 0.95, P< 0.001). Sea temperature increased sharply after spring, with the fastest increase in the Glo-Flads, followed by Flads and Open bays (Figure 3). Salinity differed among lagoons (One way ANOVA, F2, 15 = 8.59, P = 0.003), with Glo-Flads having the lowest average salinity. Post-hoc tests showed that there were no salinity differences between Flads and Open bays. Turbidity (One way ANOVA, F2, 15 = 1.09, P = 0.36) didn’t differ among lagoon types.
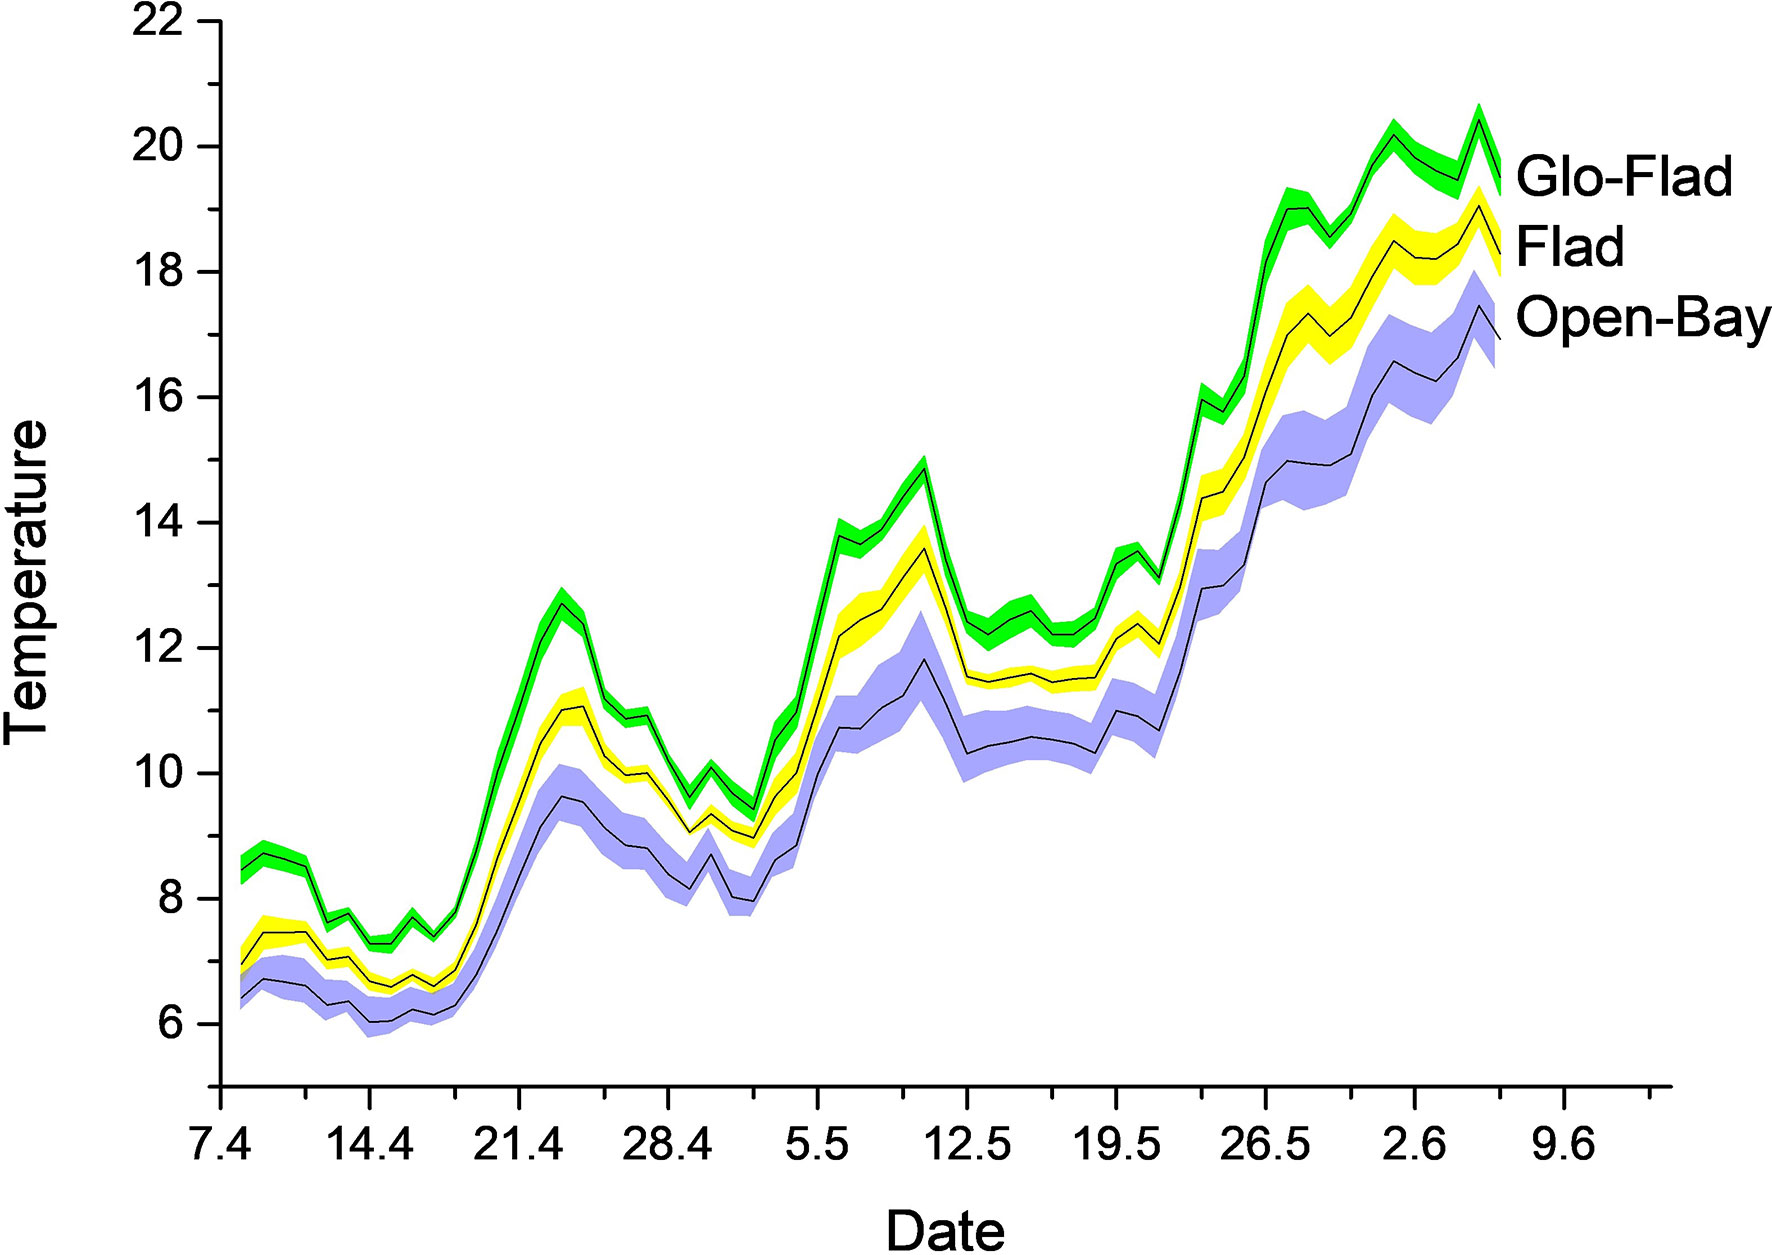
Figure 3 Temperature evolution (mean ± SE) in the three bay types. On average, Glo-Flads were 2.4 oC degrees warmer than Open bays whereas Flads were 1.3 oC degrees warmer than Open bays.
3.3 Vegetation cover and zooplankton community structure
While the total macrophyte cover, estimated in April, was homogeneous among the lagoons (Kruskal-Wallis H = 0.71, df = 2, P = 0.7), the coverage of the carophyte Chara tomentosa differed (Kruskal-Wallis H = 7.94, df = 2, P = 0.019), with the highest coverage in Glo-Flads and least in the Open bays. Again, pairwise comparisons didn’t reveal any other group differences. Reed area estimated from orthophotos showed no bay effects (One way ANOVA, F2, 15 = 3.19, P = 0.2), but the quotient between bay size and reed area was larger in Glo-Flads compared to the two other bay types (Kruskal-Wallis H = 5.98, df = 2, P = 0.05). For hydrological factors combined with vegetation variables, PERMANOVA demonstrated that there were significant differences among different bay types (PERMANOVA, pseudo-F = 4.67, P< 0.001). Pairwise comparisons revealed significant differences between Glo-Flads and Flads, as well as between Glo-Flads and Open bays, but there were no differences between Flads and Open bays. The dissimilarity among bays regarding hydrology and vegetation cover was seen in the PCO ordination (Figure 2) where the different bay types, and especially Glo-Flads and Open bays were grouped at different ends of the multivariate data cloud. The two axes in the PCO explained together 69% of the overall variability with temperature, Chara tomentosa, reed cover and salinity contributing with variability along PCO1 and macrophyte cover and turbidity along PCO2.
Zooplankton abundance (ANOSIM Global R = -0.015, P = 0.51), richness (ANOSIM Global R -= 0.003, P = 0.48) and diversity (ANOSIM Global R = -0.066, P = 0.77) didn’t differ among lagoon types. While the overall zooplankton community differed among the Glo-Flads and Open bays and between Glo-Flads and Flads (ANOSIM Global R = 0.271, P = 0.003, Figure 4), there were no differences in the overall species composition between Flads and Open bays. Out of 62 species, species groups or crustacean life stages, the most abundant were rotifers constituting between 70% (Open bays) and 48% (Flad) of all zooplankton individuals (Figure 4). Copepod nauplii were highly abundant in Flads and Glo-Flads, but they were proportionately few in Open bays. Calanoida (including also juveniles) and cladocera were particularly abundant in Glo-Flads compared to the two other bay types, whereas bivalve veliger larvae were common only in Open bays. The highest zooplankton abundances were mainly attributable to copepoda nauplius, Keratella quadrata, Keratella cochlearis, Synchaeta spp and juveniles of both cyclopoda and calanoida. In especially Glo-Flads, Bosmina sp and Podon sp were also frequent.
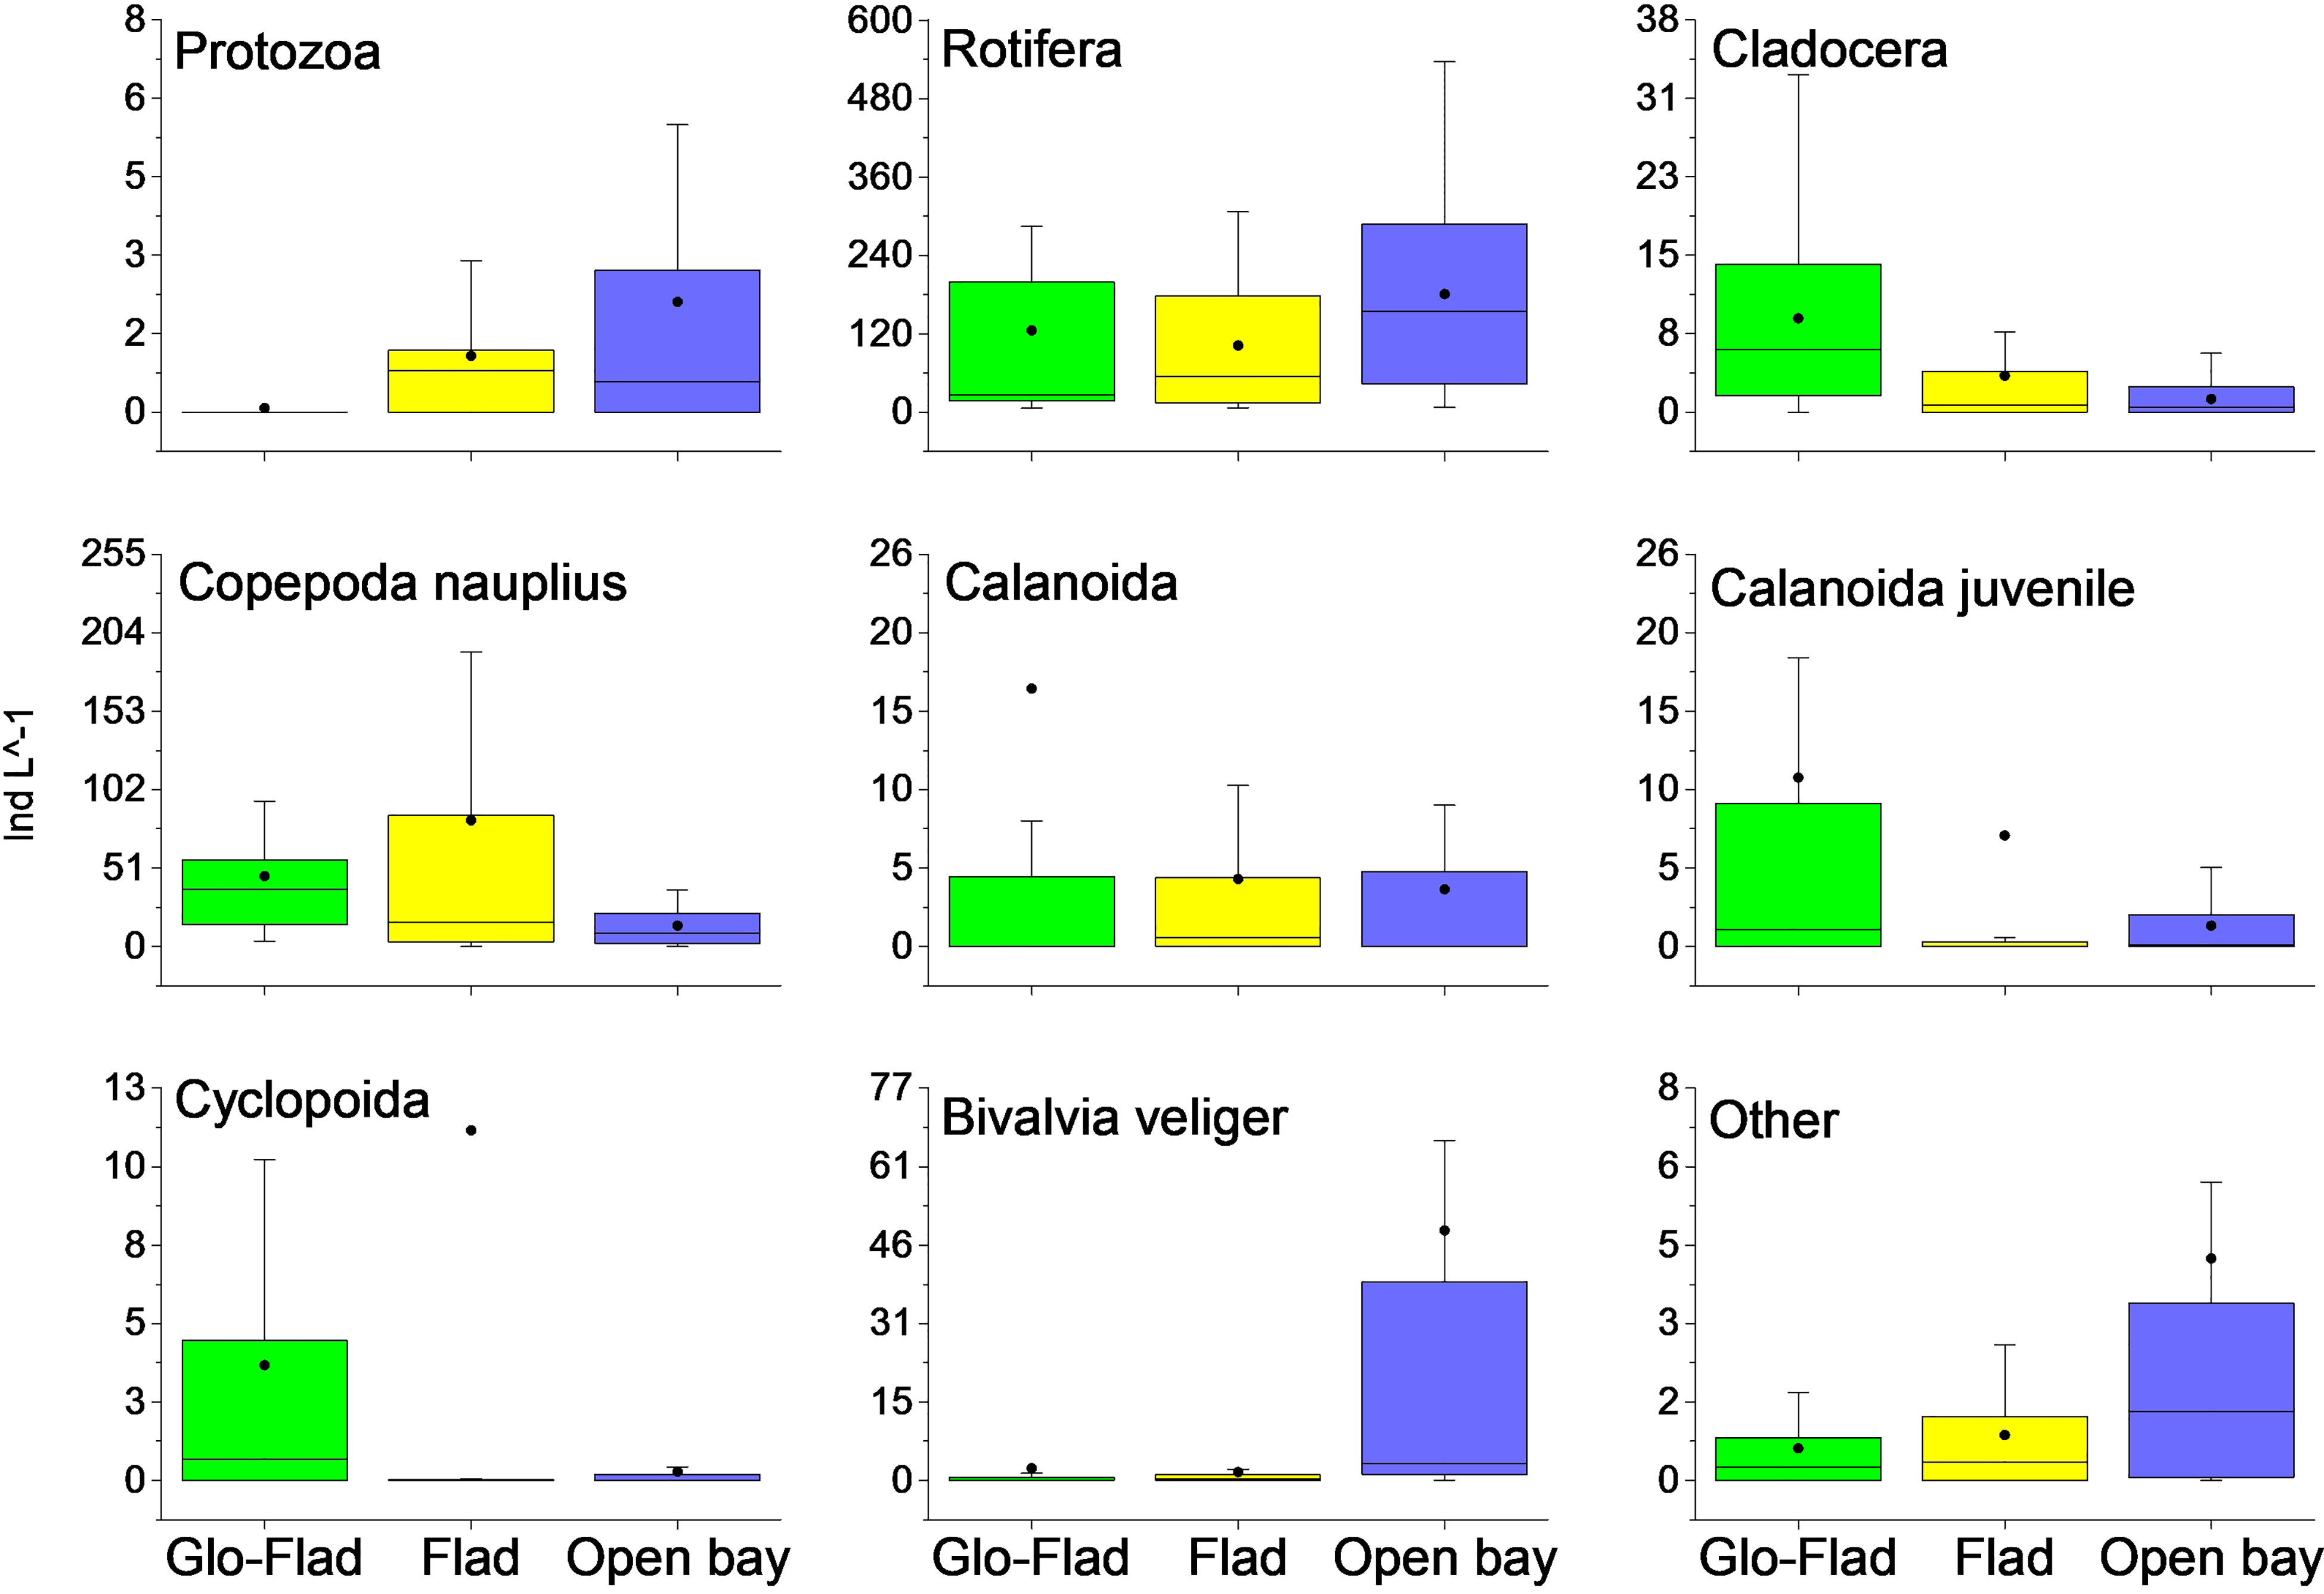
Figure 4 Box-whisker plots for the most numerous plankton groups. The box extends from the first to the third quartile. The line in the box is the median whereas the dot displays the mean. Whiskers show 1.5 times the interquartile range (IQR). Cladocera, calanoida and cyclopoida include adult forms. Calanoida juvenile are separated from copepoda nauplius stages.
CAP (Figure 5) demonstrated that the distribution of the zooplankton community in the three bay types was well discriminated among the a priori groups, however showing some overlap. Cross-validation revealed that 73% of samples were correctly classified. Most of the misclassifications was related to Flads. As Flads lie between Glo-Flads and Open bays morphologically and hydrologically, one third of the samples from Flads were misclassified as either Glo-Flads (11%) or Open bays (22%). In Glo-Flads, 80% of samples were correctly classified, whereas the corresponding number was 72% in Open bays. In Glo-Flads, only one sample was misclassified as Open bay and in Open bays, none of the samples were classified to the Glo-Flad type.
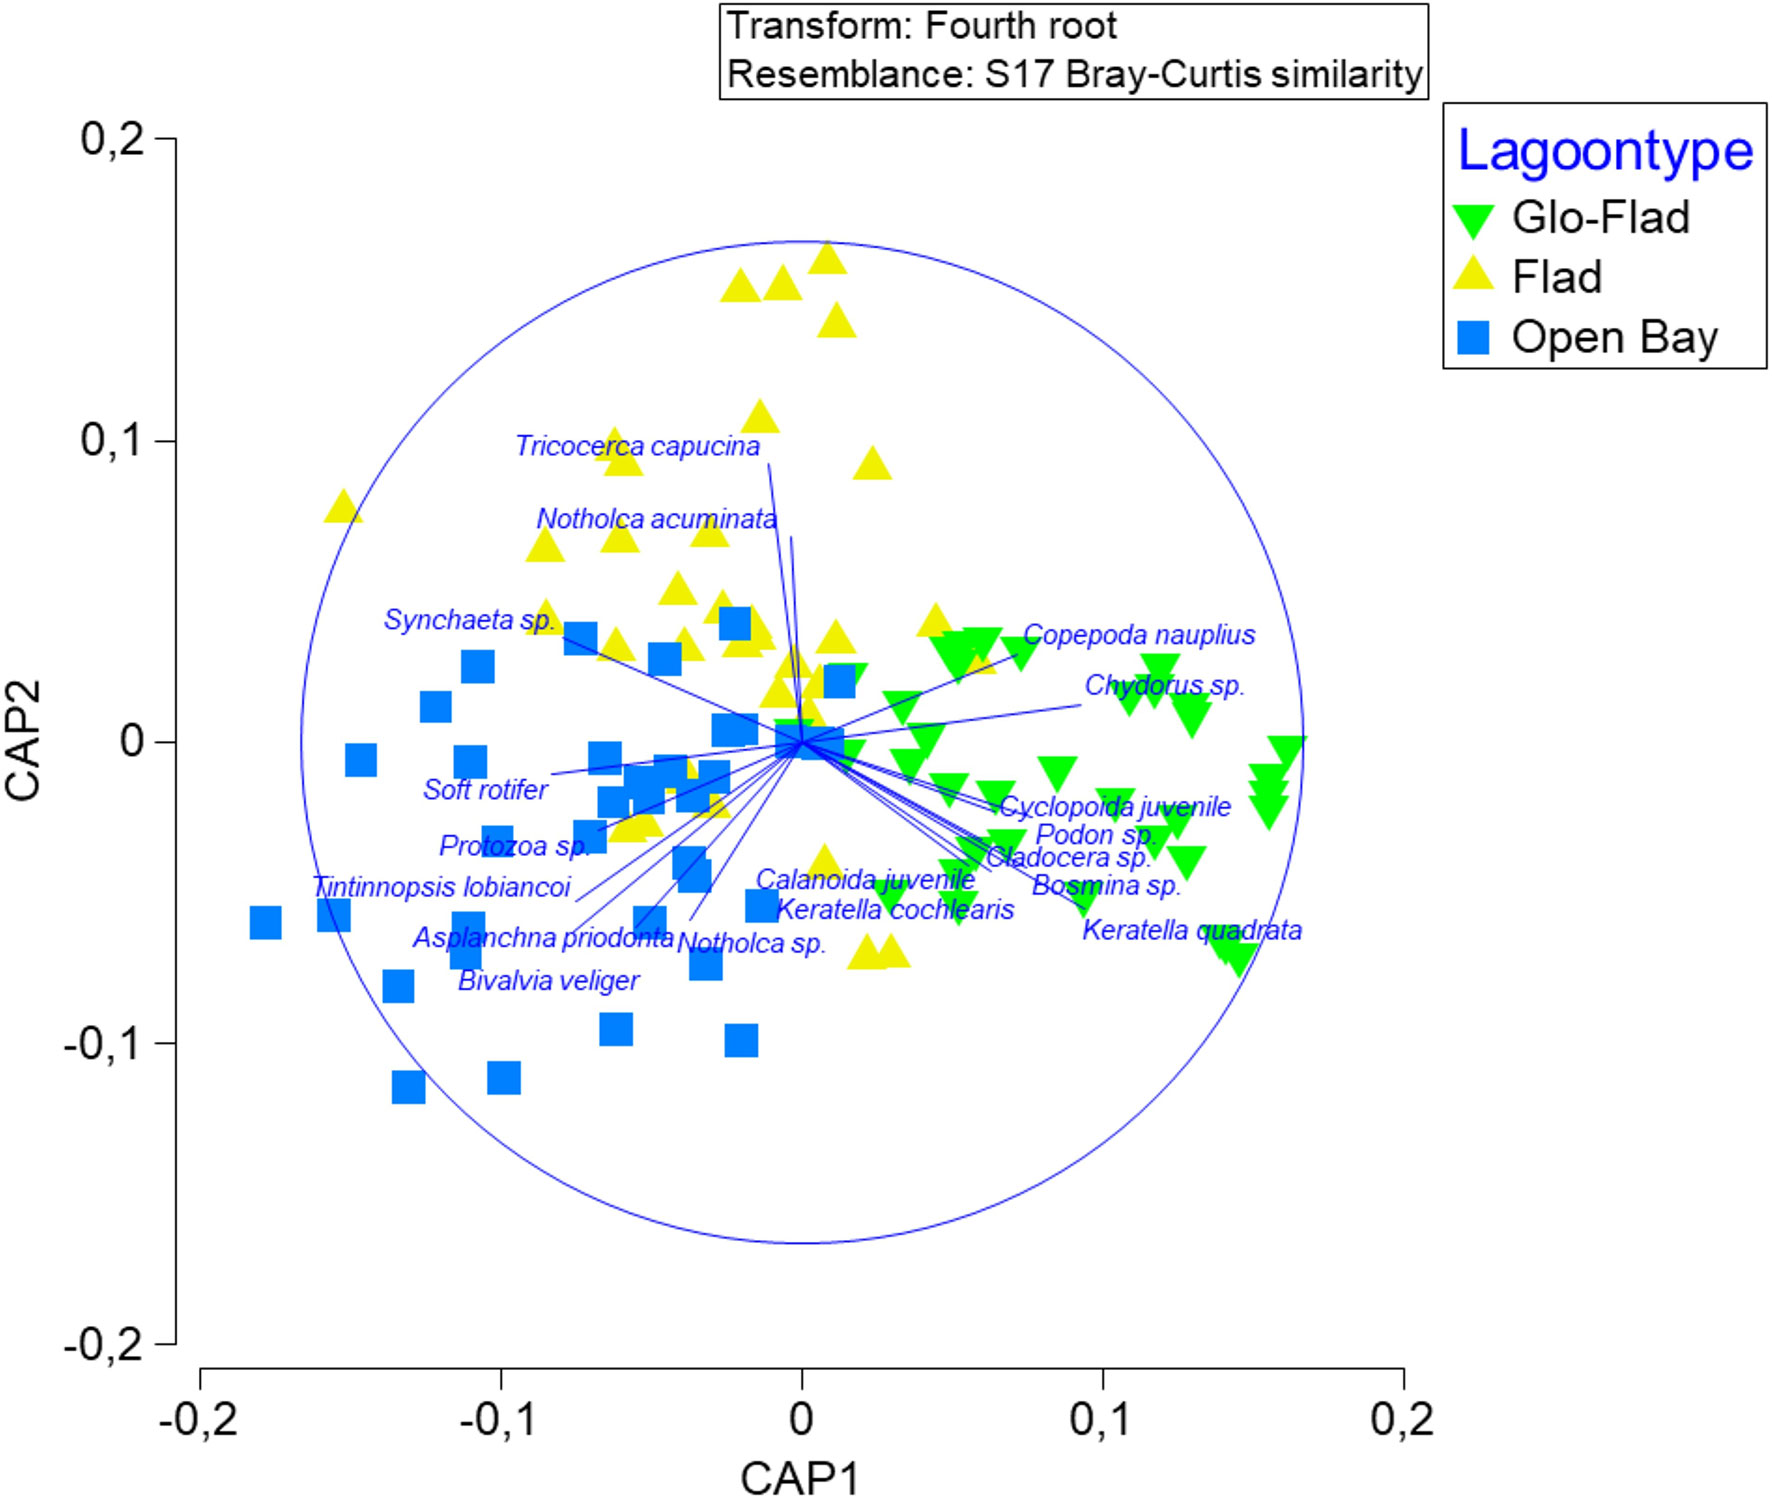
Figure 5 Canonical Analysis of Principle Coordinates on Bray-Curtis similarity matrices of 108 zooplankton samples collected from three bay types. Vectors represent Pearson correlation with species contributing most to observed patterns (only correlations > 0.4 are shown).
3.4 Abundance of perch egg strands and larvae
A total of 1453 perch egg strands and 6024 perch larvae were found in the 18 bays. Strands typically occurred between 0.1 and ca 2 m depth, the vast majority around 0.5-0.7 m. Strands were mostly found on vegetation, much less on submerged branches or on tree-trunks, in a few lagoons also on bare bottoms. Egg strands occurred mostly on clean reeds without epiphytes, but they were also very common on the charophyte Chara tomentosa (Appendix 1). There was a large bay type effect on both the number of egg strands (Kruskal-Wallis H = 9.47, df = 2, P = 0.009) and on the abundance of larvae (Kruskal-Wallis H = 12.51, df = 2, P = 0.002), with the highest occurrences in Glo-Flads followed by Flads (Figures 6, 7). Only a few strands or larvae were found in Open bays. Pairwise tests showed that the significant difference among the lagoon types regarding egg strands was driven by differences between Glo-Flads and Open bays, with no difference between Flads and Open bays. Glo-Flads had additionally more larvae than Flads. The number of egg strands in the different bays correlated very strongly between the years 2020 and 2021 (Spearman’s rho = 0.95, P< 0.001) indicating a recurrent pattern in observations. Also, egg strand and larval number showed a high correlation (Spearman’s rho = 0.92, P< 0.001), suggesting that both methods (egg strand counting and larval sampling) corroborated each other and differentiated productive from unproductive bays. The size of the perch larvae in samples ranged from 4 – 9 mm in early May, to 6 – 14 mm in late May.
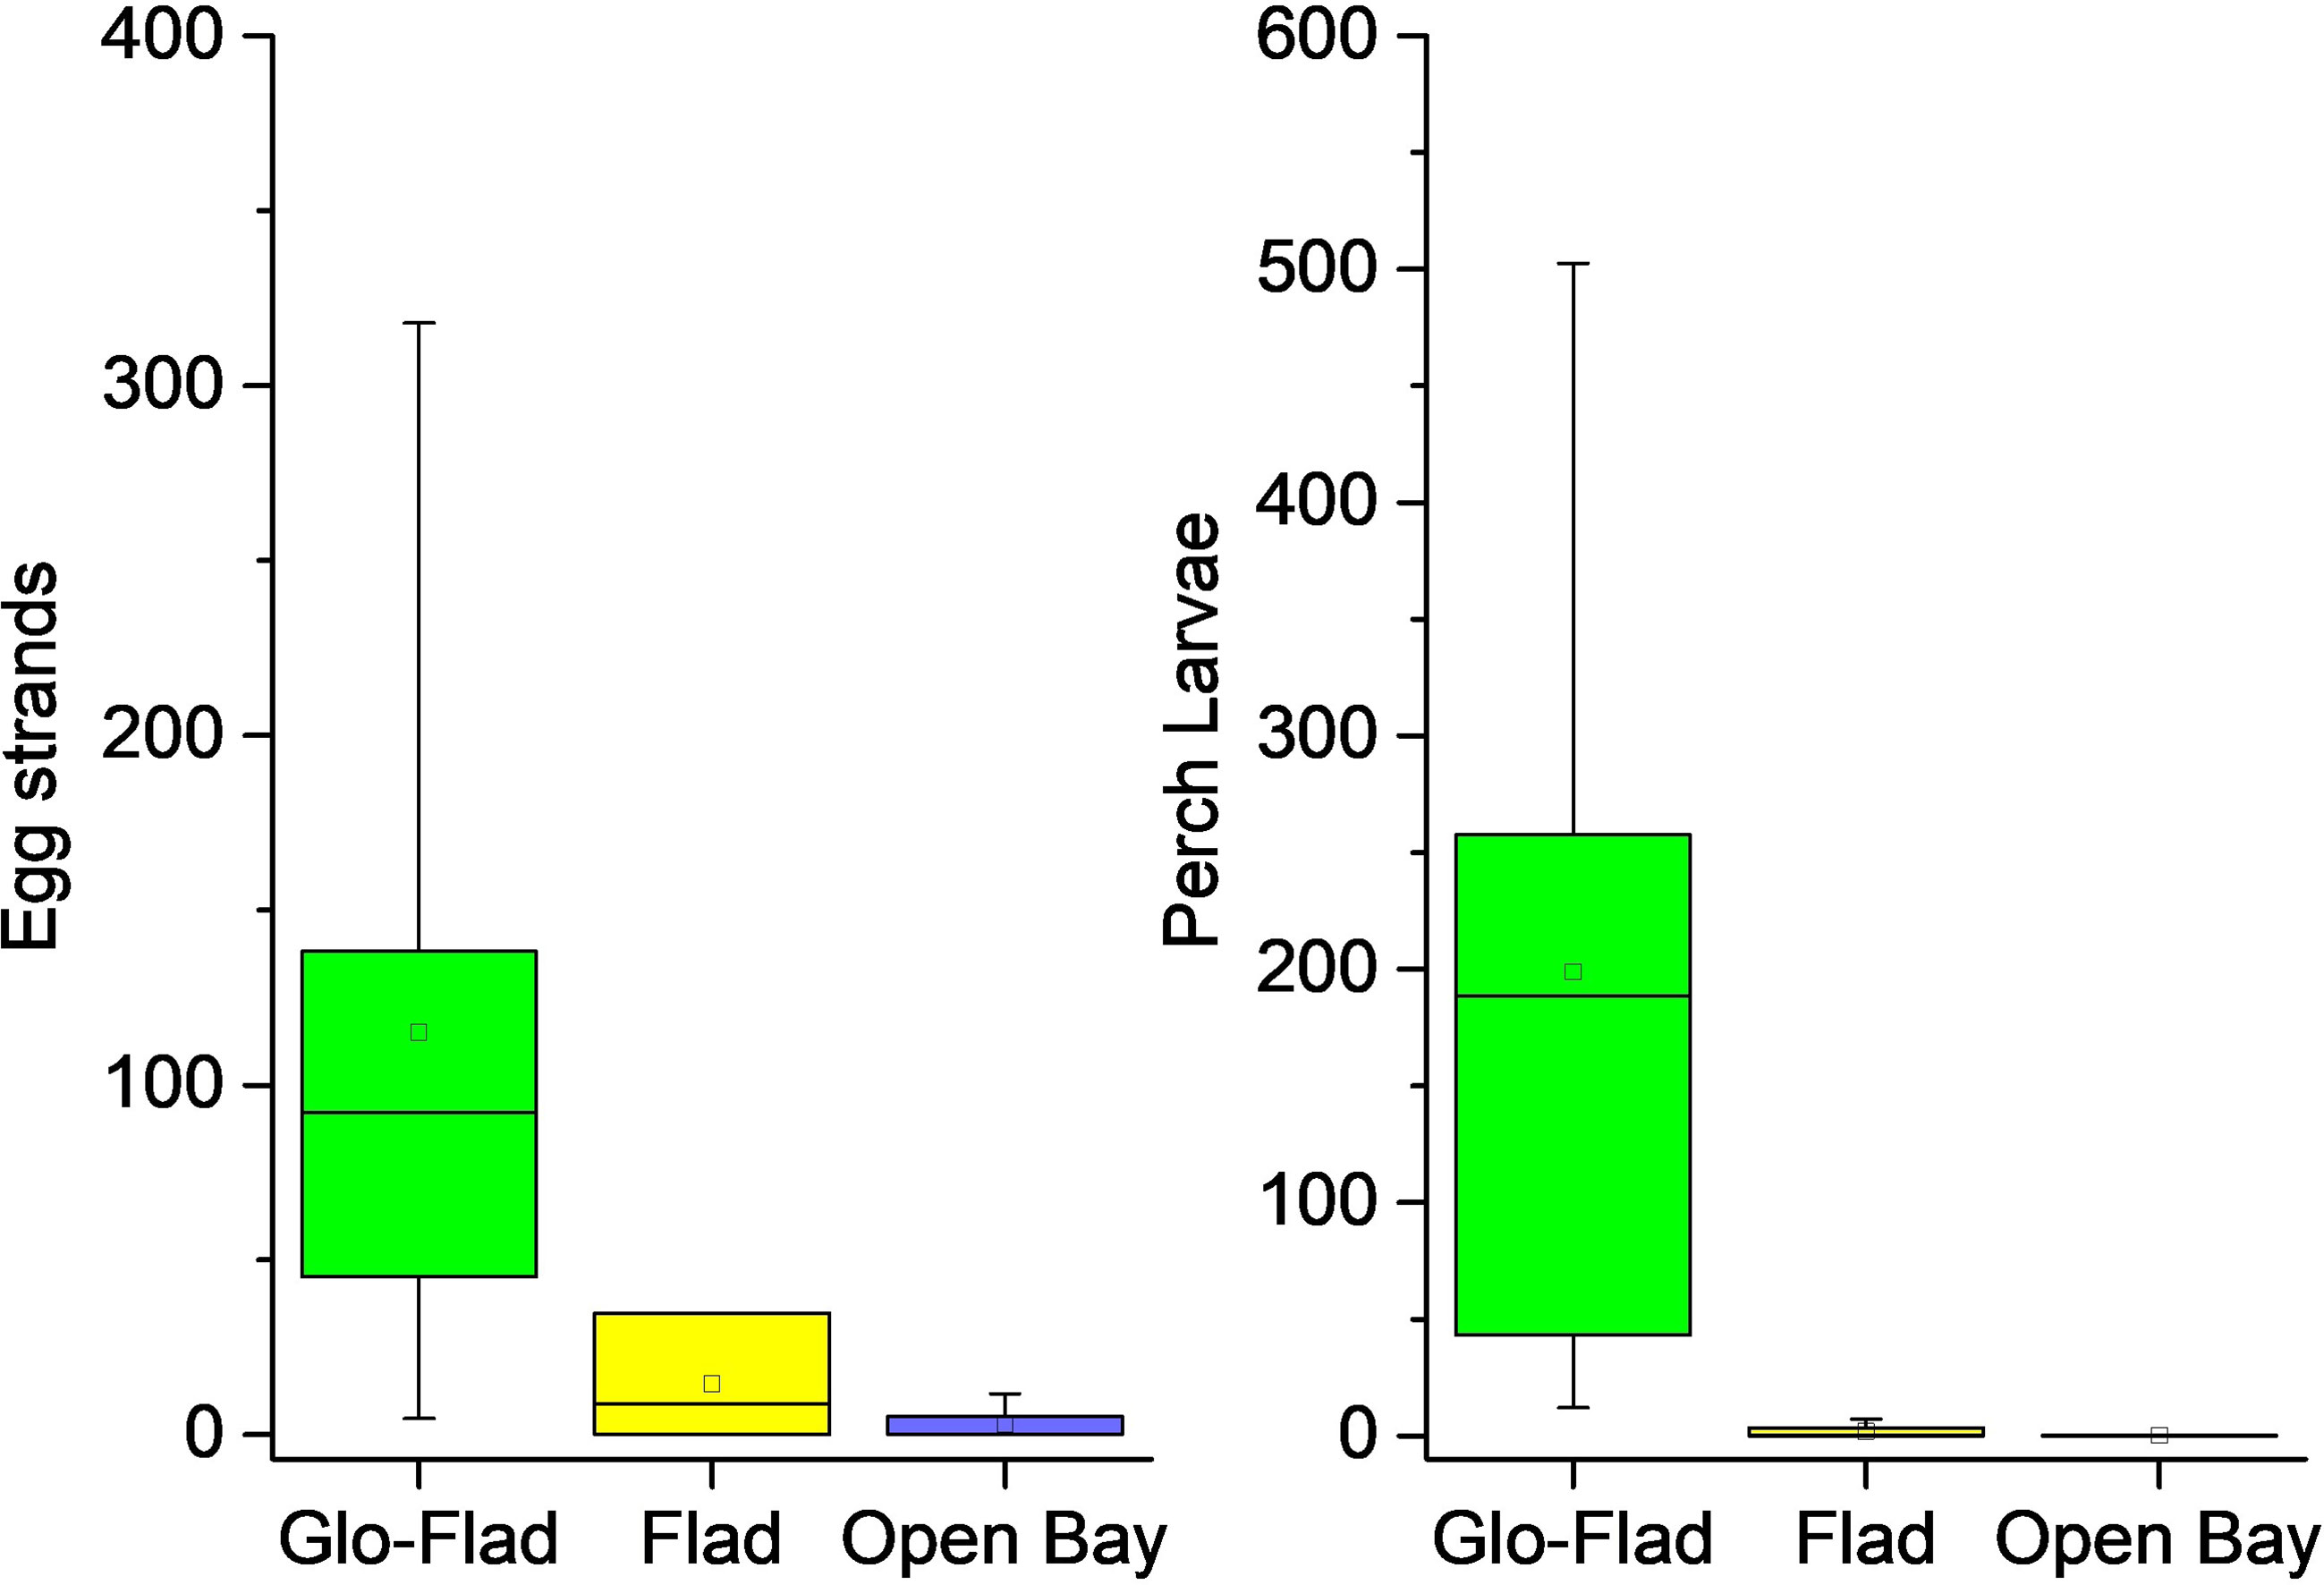
Figure 6 Box-whisker plots for roe and perch larvae data. The box extends from the first to the third quartile. The line in the box is the median whereas the dot displays the mean. Whiskers show 1.5 times the interquartile range (IQR).
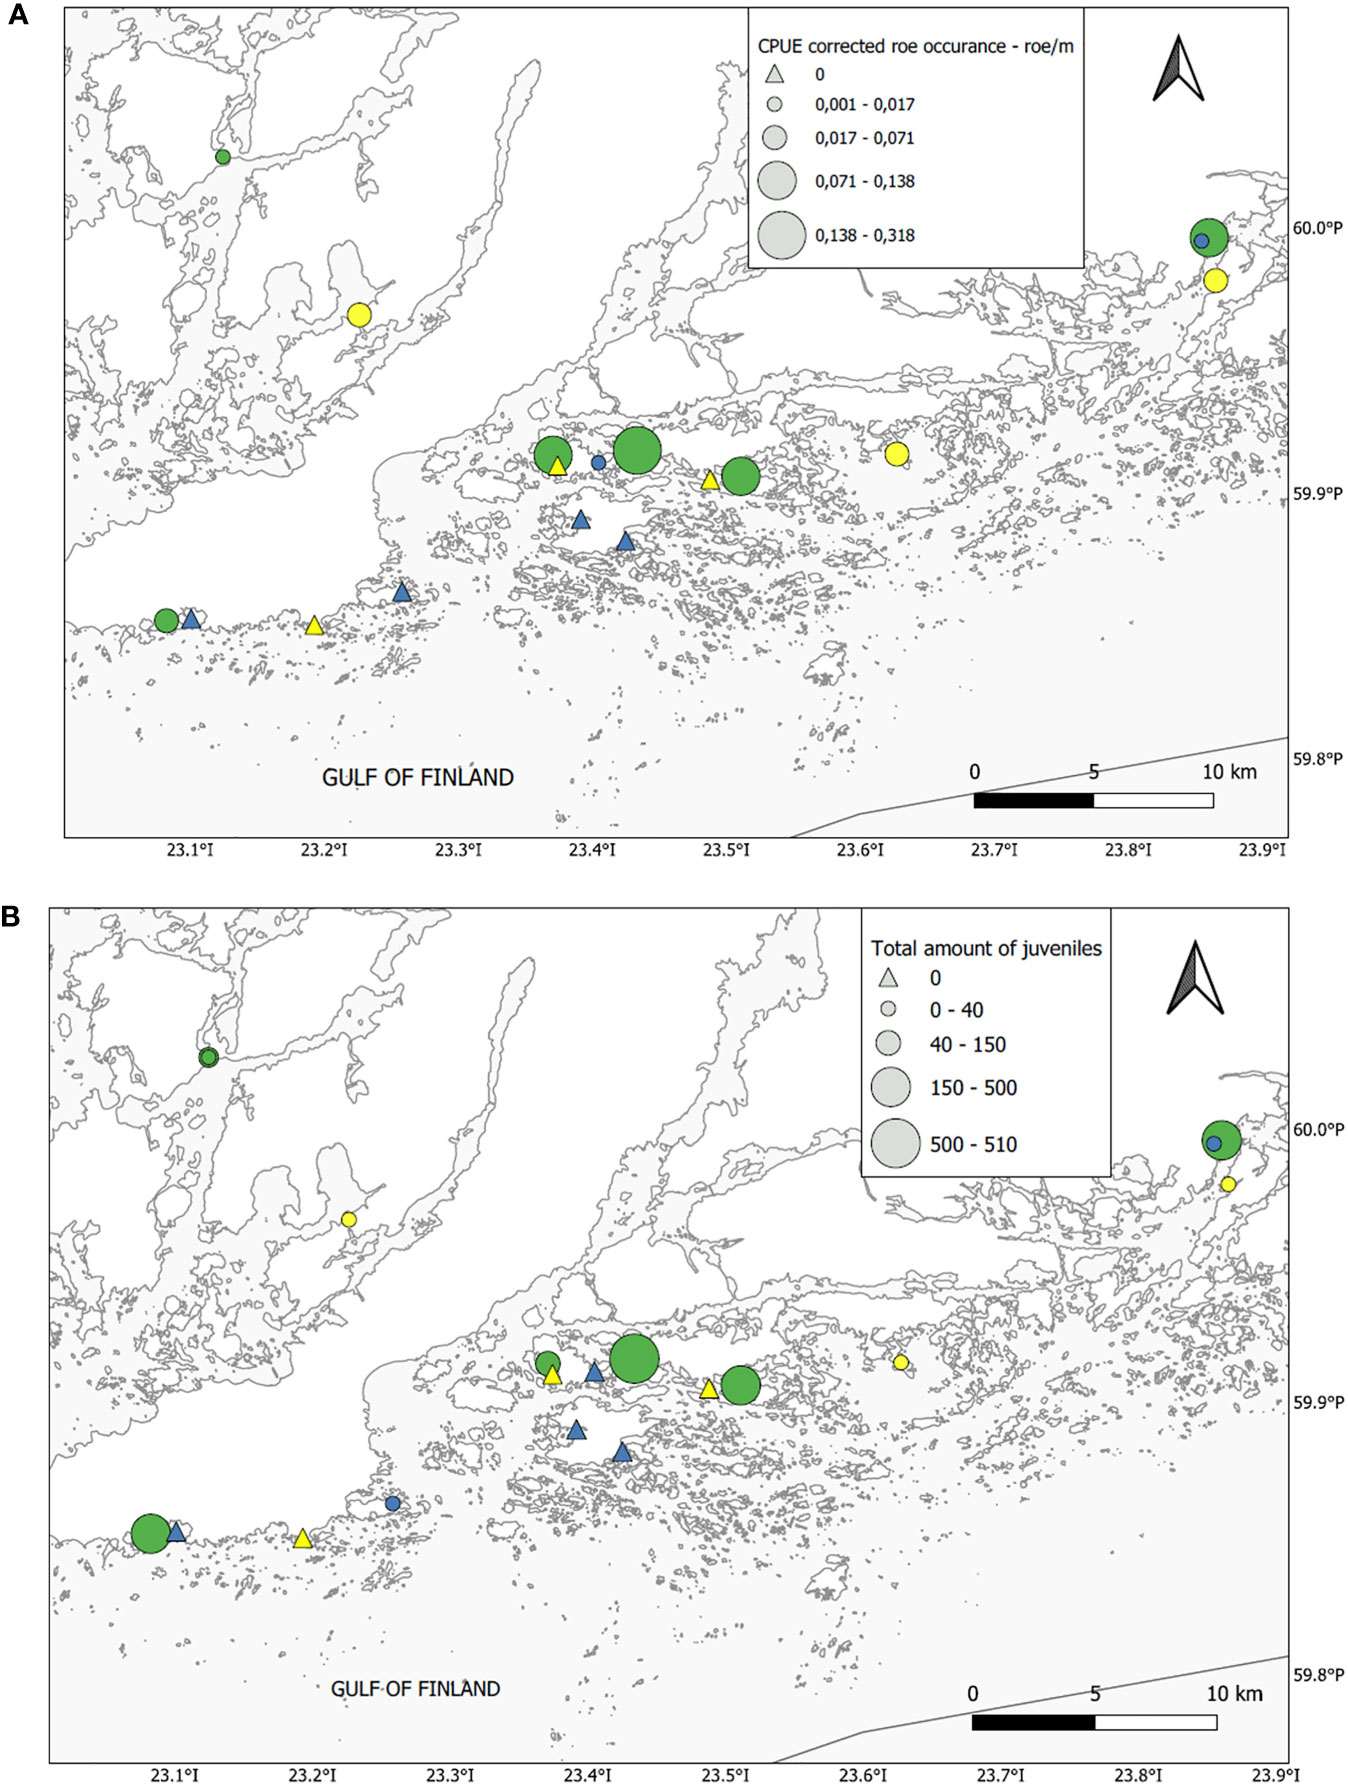
Figure 7 Map showing the (A upper panel) distribution of egg strands and larvae (B lower panel) among the different bay types (green Glo-Flad, yellow — Flad and blue Open bay).
The results of the DistLM models are summarized in Table 2 (Correlation matrix (-1 to 1) is summarized in Appendix 2). Marginal tests between egg strand number and environmental variables identified nine potential environmental variables that explained a considerable portion of the variation in egg strand occurrence in the different lagoons. Among the significant explanatory variables, Chara tomentosa (59%, P< 0.001), threshold depth (53%, P< 0.001), temperature (51%, P< 0.001) and salinity (45%, P = 0.002) appeared to be the most important factors determining egg strand occurrence when tested alone without the influence of other variables. The overall Best solution (R2 = 0.9) based on AIC selection criterion was found by including all variables except reed cover. For perch larvae, threshold depth (59%, P< 0.001), salinity (55%, P< 0.001), temperature (47%, P = 0.001), relative reed area (46%, P = 0.002), Chara tomentosa (41%, P = 0.004), depth (26%, P = 0.029), cladocera and copepoda density (24%, P = 0.038), and bay volume (23%, P = 0.044) showed significant relationships when considered alone and ignoring the influence of the other variables. The overall best solution (R2 = 0.93) included all variables except shoreline length, Chara tomentosa cover, macrophyte cover and turbidity.
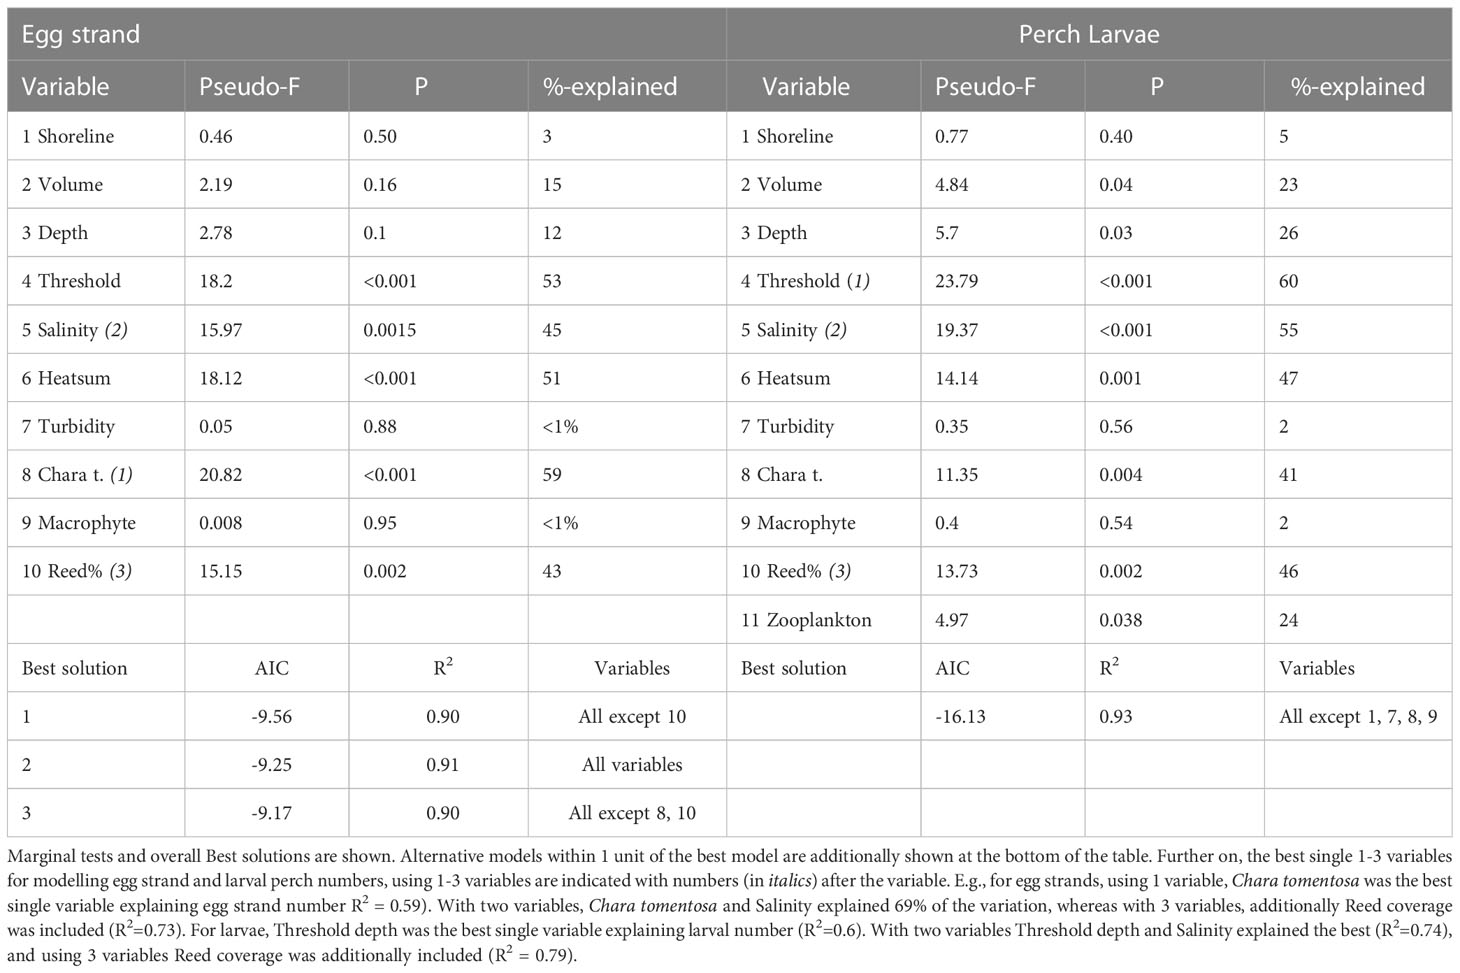
Table 2 Results of DistLM.
As hydrological and vegetation structure/coverage are highly influenced by bay morphology, and as bay morphology unlikely affects egg strand and larval numbers per se, we finally tested the influence of only hydrological and vegetation variables without including the influence of bay morphology. In these reduced analyses, DistLM produced models with salinity, Chara tomentosa and temperature as the best predictors in the most parsimonious models for egg strand number (R2 = 0.73). For larvae, salinity, turbidity and reed cover were included in the overall best model (R2 = 0.74).
4 Discussion
One of the most challenging, yet important, tasks in fisheries ecology and management is to identify the factors that cause variation in the early life history stages of fish (Zimmermann et al., 2019). Here we show that (1) bay geomorphology and (2) succeeding changes in hydrology and benthic vegetation to a large extent drive the occurrence of perch egg strands and larval abundance. We also show that (3) there is a significant difference in zooplankton community structure among different bay types indicating different feeding conditions for early perch larvae. Based on historic records, we initially hypothesized that we would find perch egg strands in all studied bays, but that well developed bays would outperform those that represent earlier stages. We also predicted that environmental variables, mainly temperature, would cause a higher survival rate among larvae in the more isolated bays where sea temperatures generally are higher and more stable. Consistent with our first hypothesis, the most enclosed bays, i.e., Glo-Flads showed the highest occurrence of egg strands and larvae, followed by Flads. In Open bays, however, both egg strands and particularly larvae were almost absent. Due to the shortage of larvae in Open bays, we couldn’t test how bay type affects larval survival over time. A general pattern emerged throughout the study with significant differences between Glo-Flads and Open bays, but results were more obscure when comparing other bay combinations. This was expected as Flads are intermediate structures between Glo-Flads and Open bays (see Figure 2) where some Flads show characteristics closer to Open bays, others show characteristics reminding Glo-Flads.
Previous research on the relationship between environmental variability and perch breeding (Snickars et al., 2010) and recruitment success (Karås, 1996; Snickars et al., 2009; Ljunggren et al., 2010) have shown that there are many environmental variables that should be accounted for when predicting perch reproduction success in the northern Baltic Sea. In line with several other studies (Blomqvist, 1984; Karås, 1996; Snickars et al., 2009; Pursiainen et al., 2021), we show that bay morphology is an overarching factor that separates productive bays from unproductive. Our results explicitly highlight the importance of the late bay succession stage for perch breeding success in the outer archipelago area of the northern Baltic Sea. Our results revealed a substantial variation in egg strand and larval abundance among different bays that correlated significantly with many predictor variables in marginal DistLM tests. The summed temperature (Heatsum) was a highly significant predictor in marginal tests, with a relatively high explanatory power. Temperature is known to affect fish hatching, survival and larval growth throughout embryonic (Saat and Veersalu, 1996) and larval stages (Guma'a, 1978; Wang and Eckmann, 1994). Salinity was also a strong predictor in marginal and overall best models, correlating negatively with larval density and egg strand abundance. These results are consistent with e.g., Snickars et al. (2009) who showed a negative relationship between salinity and the abundance of older juvenile perch. Reproductive migrations of perch between brackish and freshwaters are well documented in the Baltic Sea suggesting that perch larvae and juveniles have different salinity requirements than the adults (for further reading on salinity effects see e.g. Christensen et al., 2016; Christensen et al., 2019; Hall et al., 2022). Tibblin et al. (2012) showed that while brackish water conditions (7‰) didn’t affect hatching success, salinity had negative effects on the survival of perch larvae and later juveniles, and this negative effect also included resident brackish water forms. Tibblin et al. (2012) concluded that freshwater habitats along the Baltic Sea coast may be important for the overall Baltic Sea perch stock size. Kokkonen et al. (2019) for their part, suggested that perch reproduction may be limited to restrained areas close to the coast, where salinity is lower than offshore. These predictions fit well with results in this study where Glo-Flads were the only lagoon type where larvae were systematically found in high numbers compared to saltier Flads and Open bays.
An important variable explaining differences among bays were the occurrence, structure, and coverage of the macrophyte vegetation. While the total macrophyte cover didn’t predict the occurrence of egg strands and larvae, reed cover and Chara tomentosa cover were significant predictors in DistLM marginal tests. As a substrate spawning fish, rigid erect structures are a precondition for successful breeding for perch (Snickars et al., 2010) and in many places rigid macrophytes were either absent or densely covered by ephemeral nuisance algae (Appendix 1). In bays with both bare and covered reeds, egg strands were always found on reeds that were free from algal cover and cut by ice just below the water surface. Aneer (1987) showed that nuisance algae can reduce the survival of Baltic herring eggs, mainly through toxic exudates released by the algae. Nilsson et al. (2004) showed that brown algae negatively affect pike hatchability. Snickars et al. (2010) found that reed belts are a preferred spawning substrate whereas Chara tomentosa wasn’t. We didn’t test preferences, but egg strands were commonly found on Chara tomentosa in all Glo-Flads and in Flads with Chara tomentosa. In some of the Glo-Flads, Chara tomentosa was the main spawning substrate, even in bays where its overall coverage was low (Appendix 1). Chara tomentosa clearly provided an alternative substrate for spawning fish and its presence predicted well the occurrence of egg strands. Eutrophication has led to an overall loss of plant coverage as light conditions have weakened the depth distribution of plants leading to the loss of structurally complex and rigid structures, such as Chara tomentosa (Munsterhjelm et al., 2008), possibly also reducing the extent of valuable spawning areas. Chara tomentosa is rigid and develops early in spring, much earlier than many annual aquatic plants. The reduced coverage of Chara tomentosa may therefore reduce the availability of the best surface areas for perch to breed on.
Perch breeding success may also be linked to available feeding resources (Karus et al., 2022) and food availability can create large fluctuations in perch recruitment (Wang and Eckmann, 1994; Ljunggren et al., 2010). Past studies have consistently shown that the percid fish larvae and juveniles show a positive selection for copepods and cladocerans (e.g. Graeb et al., 2004; Fulford et al., 2006 with references, Karus et al., 2022). The zooplankton diet of perch also shifts during the ontogeny from small species such as rotifers and copepod nauplii to medium sized zooplankton such as copepods and small cladocerans (Treasurer, 1990; Wang and Eckmann, 1994; Skrzypczak et al., 1998; Bremigan et al., 2003; Fulford et al., 2006; Jolley et al., 2010). Karus et al. (2022) showed that growth rate of perch was slowest in environments where they are forced to feed on small zooplankton, such as rotifers (see also Fulford et al., 2006; Jolley et al., 2010). Wang and Eckmann (1994) showed, experimentally, that newly hatched perch feed on rotifers and algae, 1-week old perch shift to copepod nauplii and copepodites. Perch larvae older than 12 days no longer ingest rotifers but consume copepods and larger cladocerans. Graeb et al. (2004) showed that the growth and survival of newly hatched (5 – 7 mm) to 12 mm yellow perch was the greatest when feeding on copepod nauplii and adult copepods. Larvae larger than 12 mm grew fastest and had the highest survival rate when feeding on adult copepods and cladocerans. Graeb et al. (2004) predicted that the recruitment of small percid larvae will be best where both adult copepods and copepod nauplii are abundant. Differences in zooplankton community composition across different spawning habitats can affect larval survival and growth, even in systems with an equal density of zooplankton (Fulford et al., 2006). While we couldn’t find a difference in overall zooplankton density, diversity, or richness among the bay types, the structure of the zooplankton community differed, indicating that the feeding conditions and the nutritional value among bays may also differ. In Flads and Glo-Flads, copepods were very common representing ca 50% and 40% of the zooplankton community in the respective bay types. Copepods were proportionately few in Open bays, comprising only 8% of the zooplankton community. In Glo-Flads, cladocerans were proportionately well represented. Taken together, although this study wasn’t planned to address causative patterns, and we didn’t measure fish feeding, our findings corroborate previous research suggesting that food composition and availability may correlate with perch breeding success (Ljunggren et al., 2010).
Several recent studies (e.g. Byström et al., 2015; Eklöf et al., 2020) have suggested that a reversed predator-prey relationship between three-spined sticklebacks and perch would limit perch recruitment, and effects should be most pronounced in open bays. Although increasing stickleback populations likely is a contributing factor to the overall decline of perch in the northern Baltic Sea and may explain some of the variation also seen in this study, we couldn’t observe any abundant shoals of sticklebacks that would alone explain the observed patterns. Stickleback population sizes have increased in the Baltic Sea (Bergström et al., 2015; Olsson et al., 2019) coinciding with a general deterioration of coastal habitats. Because of their moderate abundance in our study area early in spring, and difficulties in accurately estimating their population size, the effects of stickleback predation were not tested here.
5 Conclusions
Over the last decades, the quality and quantity of spawning areas for fish have changed due to the direct and indirect effects of human activities (Macura et al., 2016). Human interference typically leads to habitat degradation with adverse effects on aquatic communities in general and fish population productivity, especially among fish that rely on specific habitats (Sundblad and Bergström, 2014). Coastal modification and land cultivation in the watershed has led to severe eutrophication problems in the Baltic Sea at large (HELCOM, 2018) causing decreased water transparency with adverse effects on aquatic vegetation cover and its structural complexity (Munsterhjelm et al., 2008). Shoreline construction and recreation including boating have further increased with undesirable effects on spawning substrate availability (e.g. Eriksson et al., 2004; Sundblad and Bergström, 2014). Sundblad et al. (2013) suggested that nursery habitat availability and habitat limitation may itself explain almost half of the variation of the adult population size of perch. Dredging of inlets to Flads have counteracted the natural land-uplift process leading to a reduced formation and extent of Glo-Flads over entire archipelago areas. In this paper we have shown that the most isolated lagoons are the most productive systems pertaining to perch breeding. With accelerating human interference, and particularly interventions that hold back the natural creation of Glo-Flads together with the natural loss of existing Glo-Flads (Appendix 3), we are currently losing the spatial extent and cover of the some of the most productive fish breeding habitats. With a limited dispersal ability, limited home range and reproductive homing behavior (Hall et al., 2022), the loss of suitable spawning grounds may lead to breeding habitat limitation which potentially may underlie small regional population sizes of perch, perhaps even explaining the reported general decline of perch stock size on a Baltic Sea wide scale (e.g. Nilsson et al., 2004; Ljunggren et al., 2010). Today, there is an ongoing debate regarding the drivers for dwindling perch stocks in the Baltic Sea, including e.g. effects of cormorant predation and overfishing (e.g. Hansson et al., 2018; Veneranta et al., 2020). In line with Sundblad et al. (2013), we propose that attention should be directed towards understanding the local effects of habitat loss that may be the most important reason for dwindling predatory fish stocks in the Baltic Sea. We suggest that particularly the loss of Glo-Flads in outer archipelago areas of the Baltic Sea (Appendix 3) may be an important driver behind dwindling perch stocks in the more open parts of the archipelago. Consequently, conservation efforts should aim at securing the current state of Flads and Glo-Flads but they should also look decades or even centuries ahead to ensure the future creation of these habitats. Moreover, fisheries management should be better integrated into nature conservation efforts as the conservation coverage of EFHs are suboptimal in many Baltic Sea countries where conservation targets often restrict the focus to the habitats themselves, rather than looking at their functional value from a fisheries perspective (Kraufvelin et al., 2018). Setting joint objectives for fisheries management and nature conservation would be highly important for the protection of EFHs in the Baltic Sea (Kraufvelin et al., 2018). Further, better understanding of the share of perch stock sizes and larval production in small, limited reproduction areas in the outer archipelago areas contra production happening in estuaries or sheltered areas close to land is needed (Kallasvuo et al., 2017). Taken together, this article presents data that underpins the need for protection of the last development stage of coastal lagoons in the outer archipelago. As land-uplift in the northern Baltic Sea is an ongoing process, conservation actions should better include the land uplift process in the overall management and conservation planning. Planning should look decades or even centuries ahead to secure the long-term accessibility and integrity of these habitats that arise and vanish over time naturally.
Data availability statement
The raw data supporting the conclusions of this article will be made available by the authors, without undue reservation.
Ethics statement
Ethical review and approval was not required for the animal study because Collecting fish larvae does not require a license in Finland.
Author contributions
All authors designed the study. MW, SK, and AL collected the data. MW wrote a draft of the manuscript. All authors contributed to the article and approved the submitted version.
Funding
This project was funded by the European Maritime and Fisheries Fund (EMFF).
Acknowledgments
We thank Annica Långnabba, Sanna Korkonen and Kimmo Karell for help in the lab. Valuable comments by two reviewers helped us much to clarify the manuscript.
Conflict of interest
The authors declare that the research was conducted in the absence of any commercial or financial relationships that could be construed as a potential conflict of interest.
Publisher’s note
All claims expressed in this article are solely those of the authors and do not necessarily represent those of their affiliated organizations, or those of the publisher, the editors and the reviewers. Any product that may be evaluated in this article, or claim that may be made by its manufacturer, is not guaranteed or endorsed by the publisher.
Supplementary material
The Supplementary Material for this article can be found online at: https://www.frontiersin.org/articles/10.3389/fmars.2023.1167038/full#supplementary-material
References
Anderson M. J., Gorley R. N., Clarke K. R. (2008). Permanova + for primer: guide to software and statistical methods (Plymouth, UK: Primer-e).
Aneer G. (1987). High natural mortality of Baltic herring (Clupea harengus) eggs caused by algal exudates. Mar. Biol. 94, 163–169. doi: 10.1007/BF00392928
Bergström L., Heikinheimo O., Svirgsden R., Kruze E., Ložys L., Lappalainen A., et al. (2016). Long term changes in the status of coastal fish in the Baltic Sea. Estuar. Coast. Shelf Sci. 169, 74–84. doi: 10.1016/j.ecss.2015.12.013
Bergström U., Olsson J., Casini M., Eriksson B. K., Fredriksson R., Wennhage H., et al. (2015). Stickleback increase in the Baltic Sea–a thorny issue for coastal predatory fish. Estuar. Coast. Shelf Sci. 163, 134–142. doi: 10.1016/j.ecss.2015.06.017
Blomqvist E. M. (1984). Changes in fish community structure and migration activity in a brackish bay isolated by land upheva1and reverted by dredging. Ophelia Supplementum 3, 11—21.
Böhling P., Lehtonen H. (1984). Effect of environmental factors on migrations of perch (Perca fluviatilis l.) tagged in the coastal waters of Finland. Finn. Fish. Res. 5, 31–40.
Bremigan M. T., Dettmers J. M., Mahan A. L. (2003). Zooplankton selectivity by larval yellow perch in green bay, lake Michigan. J. Great Lakes Res. 29 (3), 501–510. doi: 10.1016/S0380-1330(03)70454-7
Bučas M., Lesutienė J., Nika N., Skersonas A., Ivanauskas E., Srėbalienė G., et al. (2022). Juvenile fish associated with pondweed and charophyte habitat in the curonian lagoon. Front. Mar. Sci. 9. doi: 10.3389/fmars.2022.862925
Byström P., Bergström U., Hjälten A., Ståhl S., Jonsson D., Olsson J. (2015). Declining coastal piscivore populations in the Baltic Sea: where and when do sticklebacks matter? Ambio 44 (3), 462–471. doi: 10.1007/s13280-015-0665-5
Camerer C. F., Dreber A., Holzmeister F., Ho T. H., Huber J., Johannesson M., et al. (2018). Evaluating the replicability of social science experiments in nature and science between 2010 and 2015. Nat. Hum. Behav. 2 (9), 637–644. doi: 10.1038/s41562-018-0399-z
Christensen E. A., Grosell M., Steffensen J. F. (2019). Maximum salinity tolerance and osmoregulatory capabilities of European perch Perca fluviatilis populations originating from different salinity habitats. Conserv. Physiol. 7 (1), coz004. doi: 10.1093/conphys/coz004
Christensen E. A. F., Skovrind M., Olsen M. T., Carl H., Gravlund P., Møller P. R. (2016). Hatching success in brackish water of Perca fluviatilis eggs obtained from the western Baltic Sea. Cybium 40 (2), 133–138. doi: 10.26028/cybium/2016-402-004
Donadi S., Bergström L., Berglund J. M. B., Bäck A., Mikkola R., Saarinen A., et al. (2020). Perch and pike recruitment in coastal bays limited by stickleback predation and environmental forcing. Estuar. Coast. Shelf Sci. 246, 107052. doi: 10.1016/j.ecss.2020.107052
Eklöf J. S., Sundblad G., Erlandsson M., Donadi S., Hansen J. P., Eriksson B. K., et al. (2020). A spatial regime shift from predator to prey dominance in a large coastal ecosystem. Commun. Biol. 3 (1), 1–9. doi: 10.1038/s42003-020-01180-0
Eriksson B. K., Sandström A., Isæus M., Schreiber H., Karås P. (2004). Effects of boating activities on aquatic vegetation in the Stockholm archipelago, Baltic Sea. Estuar. Coast. Shelf Sci. 61, 339–349. doi: 10.1016/j.ecss.2004.05.009
Eronen M., Glückert G., Hatakka L., van de Plassche O., van der Plicht J., Rantala P. (2001). Rates of Holocene isostatic uplift and relative sea-level lowering of the Baltic in SW Finland based on studies of isolation contacts. Boreas 30, 17–30. doi: 10.1111/j.1502-3885.2001.tb00985.x
Fulford R. S., Rice J. A., Miller T. J., Binkowski F. P., Dettmers J. M., Belonger B. (2006). Foraging selectivity by larval yellow perch (Perca flavescens): implications for understanding recruitment in small and large lakes. Can. J. Fish. Aquat. Sci. 63, 28–42. doi: 10.1139/f05-19
Graeb B. D. S., Dettmers J. M., Wahl D. H., Cáceres C. E. (2004). Fish size and prey availability affect growth, survival, prey selection, and foraging behavior of larval yellow perch. Trans. Am. Fish. Soc. 133, 504–514. doi: 10.1577/T03-050.1
Guma'a S. A. (1978). The effects of temperature on the development and mortality of eggs of perch, Perca fluviatilis. Freshw. Biol. 8 (3), 221–227. doi: 10.1111/j.1365-2427.1978.tb01443.x
Hall M., Koch-Schmidt P., Larsson P., Tibblin P., Yıldırım Y., Sunde J. (2022). Reproductive homing and fine-scaled genetic structuring of anadromous Baltic Sea perch (Perca fluviatilis). Fish. Manage. Ecol. 29, 586–596. doi: 10.1111/fme.12542
Hansen J. P., Wikström S. A., Kautsky L. (2008). Effects of water exchange and vegetation on the macroinvertebrate fauna composition of shallow land-uplift bays in the Baltic Sea. Estuar. Coast. Shelf Sci. 77, 535–547. doi: 10.1016/j.ecss.2007.10.013
Hansson S., Bergström U., Bonsdorff E., Härkönen T., Jepsen N., Kautsky L., et al. (2018). Competition for the fish–fish extraction from the Baltic Sea by humans, aquatic mammals, and birds. ICES J. Mar. Sci. 75 (3), 999–1008. doi: 10.1093/icesjms/fsx207
HELCOM (2018) HELCOM thematic assessment of eutrophication 2011-2016. Available at: http://www.helcom.fi/baltic-sea-trends/holistic-assessments/state-of-the-baltic-sea-2018/reports-and-materials/.
Jolley J. C., Willis D. W., Holland R. S. (2010). Match–mismatch regulation for bluegill and yellow perch larvae and their prey in sandhill lakes. J. Fish. Wildlife Manage. 1 (2), 73–85. doi: 10.3996/062010-JFWM-018
Kaemingk M. A., Graeb B. D. S., Willis D. W. (2014). Temperature, hatch date, and prey availability influence age-0 yellow perch growth and survival. Trans. Am. Fish. Soc. 143, 845–855. doi: 10.1080/00028487.2014.886622
Kallasvuo M., Vanhatalo J., Veneranta L. (2017). Modeling the spatial distribution of larval fish abundance provides essential information for management. Can. J. Fish. Aquat. Sci. 74 (5), 636–649. doi: 10.1139/cjfas-2016-000
Karås P. (1996). Basic abiotic conditions for production of perch (Perca fluviatilis l.) young-of-the-year in the gulf of bothnia. Ann. Zool. Fennici 33, 371–381.
Karus K., Zagars M., Agasild H., Feldmann T., Tuvikene A., Puncule L., et al. (2022). Prey selection and growth in 0+ Eurasian perch Perca fluviatilis l. in littoral zones of seven temperate lakes. Ecol. Freshw. Fish 32, 37–52. doi: 10.1111/eff.12667
Kestemont P., Henrotte E. (2015). “Nutritional requirements and feeding of broodstock and early life stages of Eurasian perch and pikeperch,” in Biology and culture of percid fishes - principles and practices. Eds. Kestemont P., Dabrowski K., Summerfelt R. C. (New York: Springer), 539–564. doi: 10.1007/978-94-017-7227-3_20
Kokkonen E., Heikinheimo O., Pekcan-Hekim Z., Vainikka A.. (2019). Effects of water temperature and pikeperch (Sander lucioperca) abundance on the stock–recruitment relationship of Eurasian perch (Perca fluviatilis) in the northern Baltic Sea. Hydrobiologia 841, 79–94. doi: 10.1007/s10750-019-04008-z
Kraufvelin P., Pekcan-Hekim Z., Bergström U., Florin A. B., Lehikoinen A., Mattila J., et al. (2018). Essential coastal habitats for fish in the Baltic Sea. Estuar. Coast. Shelf Sci. 204, 14–30. doi: 10.1016/j.ecss.2018.02.014
Lappalainen A., Hyvönen J., Söderkultalahti P., Heikkinen J. (2020). Estimating annual CPUE indices for perch (Perca fluviatilis) from monthly logbook data of a gill-net fishery in the bothnian bay, Baltic Sea. Boreal. Environ. Res. 25, 79–91.
Lappalainen A., Shurukhin A., Alekseev G., Rinne J. (2000). Coastal fish communities along the northern coast of the gulf of Finland, Baltic Sea: responses to salinity and eutrophication. Int. Rev. Hydrobiol. 85, 687–696. doi: 10.1002/1522-2632(200011)85:5/6<687::AID-IROH687>3.0.CO;2-4
Lappalainen A., Urho L. (2006). Young-of-the-year fish species composition in small coastal bays in the northern Baltic Sea, surveyed with beach seine and small underwater detonations. Boreal. Environ. Res. 11, 431–440.
Ljunggren L., Sandström A., Bergström U., Mattila J., Lappalainen A., Johansson G., et al. (2010). Recruitment failure of coastal predatory fish in the Baltic Sea coincident with an offshore ecosystem regime shift. ICES J. Mar. Sci. 67, 1587–1595. doi: 10.1093/icesjms/fsq109
Macura B., Lönnstedt O. M., Byström P., Airoldi L., Eriksson B. K., Rudstam L., et al. (2016). What is the impact on fish recruitment of anthropogenic physical and structural habitat change in shallow nearshore areas in temperate systems? A systematic review protocol Environ. Evid. 5 (1), 1–8. doi: 10.1186/s13750-016-0061-z
Munsterhjelm R. (1997). The aquatic macrophyte vegetation of flads and gloes, s coast of Finland. Acta Botanica Fennica 157, 1–68.
Munsterhjelm R., Henricson C., Sandberg-Kilpi E. (2008). The decline of a charophyte - occurrence dynamics of Chara tomentosa l. at the southern coast of Finland. Memoranda Societatis pro fauna flora Fennica 84, 56–80.
Nelson T. R., Jefferson A. E., Cooper P. T., Buckley C. A., Heck K. L., Mattila J. (2018). Eurasian Perch Perca fluviatilis growth and fish community structure, inside and outside a marine-protected area in the Baltic Sea. Fish. Manage. Ecol. 25 (3), 172–185. doi: 10.1111/fme.12277
Nilsson J., Andersson J., Karas P., Sandstrom O. (2004). Recruitment failure and decreasing catches of perch (Perca fluviatilis l.) and pike (Esox lucius l.) in the coastal waters of southeast Sweden. Boreal. Environ. Res. 9 (4), 295–306.
Olsson J., Jakubavičiūtė E., Kaljuste O., Larsson N., Bergström U., Casini M., et al. (2019). The first large-scale assessment of three-spined stickleback (Gasterosteus aculeatus) biomass and spatial distribution in the Baltic Sea. ICES J. Mar. Sci. 76 (6), 1653–1665. doi: 10.1093/icesjms/fsz078
Olsson J., Mo K., Florin A. B., Aho T., Ryman N. (2011). Genetic population structure of perch perca fluviatilis along the Swedish coast of the Baltic Sea. J. Fish. Biol. 79 (1), 122–137. doi: 10.1111/j.1095-8649.2011.02998.x
Persson J., Håkanson L., Pilesjö P. (1994). Prediction of surface water turnover time in coastal waters using digital bathymetric information. Environmetrics 5, 433–449. doi: 10.1002/env.3170050406
Pursiainen A., Veneranta L., Kuningas S., Saarinen A., Kallasvuo M. (2021). The more sheltered, the better-coastal bays and lagoons are important reproduction habitats for pike in the northern Baltic Sea. Estuar. Coast. Shelf Sci. 259, 107477. doi: 10.1016/j.ecss.2021.107477
Rosqvist K., Mattila J., Sandstrom A., Snickars M., Westerbom M. (2010). Regime shifts in vegetation composition of Baltic Sea coastal lagoons. Aquat. Bot. 93 (1), 39–46. doi: 10.1016/j.aquabot.2010.03.002
Saat T., Veersalu A. (1996). The rate of early development in perch Perca fluviatilis l. and ruffe Gymnocephalus cernuus (L.) at different temperatures. Annales Zoologici Fennici 33, 693–698.
Sandström A., Eriksson B. K., Karås P., Isæus M., Schreiber H. (2005). Boating and navigation activities influence the recruitment of fish in a Baltic Sea archipelago area. Ambio: A J. Hum. Environ. 34 (2), 125–130. doi: 10.1579/0044-7447-34.2.125
Saulamo K., Neuman E. (2002). Local management of Baltic fish stocks – significance of migrations. Fiskeriverket informerar 9, 1–18.
Skrzypczak A., Mamcarz A., Kujawa R., Kucharczyk D., Furgala-Selezniow G. (1998). Feeding habits of larval Eurasian perch, Perca fluviatilis (Percidae). Ital. J. Zool. 65:sup1, 243–245. doi: 10.1080/11250009809386825
Snickars M., Sandström A., Lappalainen A., Mattila J., Rosqvist K., Urho L. (2009). Fish assemblages in coastal lagoons in land-uplift succession: the relative importance of local and regional environmental gradients. Estuar. Coast. Shelf Sci. 81, 247–256. doi: 10.1016/j.ecss.2008.10.021
Snickars M., Sundblad G., Sandström A., Ljunggren L., Bergström U., Johansson G., et al. (2010). Habitat selectivity of substrate-spawning fish: modelling requirements for the Eurasian perch Perca fluviatilis. Mar. Ecol. Prog. Ser. 398, 235–243. doi: 10.1016/j.ecss.2008.10.021
Sundblad G., Bergström U. (2014). Shoreline development and degradation of coastal fish reproduction habitats. Ambio 43, 1020–1028. doi: 10.1007/s13280-014-0522-y
Sundblad G., Bergström U., Samdström A., Eklöv P. (2013). Nursery habitat availability limits adult stock sizes of predatory coastal fish. ICES J. Mar. Sci. 71, 672–680. doi: 10.1093/icesjms/fst056
Tibblin P., Koch-Schmidt P., Larsson P., Stenroth P. (2012). Effects of salinity on growth and mortality of migratory and resident forms of Eurasian perch in the Baltic Sea. Ecol. Freshw. Fish 21 (2), 200–206. doi: 10.1111/j.1600-0633.2011.00537.x
Tolvanen H., Numminen S., Kalliola R. (2004). Spatial distribution and dynamics of special shore-forms (tombolos, flads and glo-lakes) in an uplifting archipelago of the Baltic Sea. J. Coast. Res. 20 (1), 234–243. doi: 10.2112/1551-5036(2004)20[234:SDADOS]2.0.CO;2
Treasurer J. W. (1990). The food and daily food consumption of lacustrine 0+ perch, Perca fluviatilis l. Freshw. Biol. 24, 361–374. doi: 10.1111/j.1365-2427.1990.tb00716.x
Urho L. (1996). Habitat shifts of perch larvae as survival strategy. Annales Zoologici Fennici 33, 329–340.
Veneranta L., Heikinheimo O., Marjomäki T. J. (2020). Cormorant (Phalacrocorax carbo) predation on a coastal perch (Perca fluviatilis) population: estimated effects based on PIT tag mark-recapture experiment. ICES J. Mar. Sci. 77 (7-8), 2611–2622. doi: 10.1093/icesjms/fsaa124
Wang N., Eckmann R. (1994). Effects on temperature and food density on egg development, larval survival and growth of perch (Perca fluviatilis l.). Aquaculture 122, 323–333. doi: 10.1016/0044-8486(94)90341-7
Keywords: Baltic Sea, essential fish habitat (EFH), fish recruitment variation, marine conservation planning, fish spawning areas, perch (Perca fluviatilis L.), zooplankton
Citation: Westerbom M, Kuningas S, Lappalainen A and Veneranta L (2023) Lagoon morphology as an overarching driver for perch breeding success. Front. Mar. Sci. 10:1167038. doi: 10.3389/fmars.2023.1167038
Received: 15 February 2023; Accepted: 08 May 2023;
Published: 09 June 2023.
Edited by:
Alberto Basset, University of Salento, ItalyReviewed by:
Matteo Zucchetta, National Research Council (CNR), ItalyDmitry Lajus, Independent Researcher, Saint Petersburg, Russia
Copyright © 2023 Westerbom, Kuningas, Lappalainen and Veneranta. This is an open-access article distributed under the terms of the Creative Commons Attribution License (CC BY). The use, distribution or reproduction in other forums is permitted, provided the original author(s) and the copyright owner(s) are credited and that the original publication in this journal is cited, in accordance with accepted academic practice. No use, distribution or reproduction is permitted which does not comply with these terms.
*Correspondence: Mats Westerbom, bWF0cy53ZXN0ZXJib21AbHVrZS5maQ==