 Fanna Kong1,2*
 Jiqiang Yin1,2
 Xinzi Yu1,2
 Junhao Wang1,2Bin Sun1,2
 Yunxiang Mao3
 Jang Kyun Kim4Hongzhong Ren1,2Huijie Yue1,2Chenggong Yu1,2Xinping Miao1,2Ying Sun1,2
- 1College of Marine Life Sciences, Ocean University of China, Qingdao, China
- 2Key Laboratory of Marine Genetics and Breeding of Ministry of Education, Ocean University of China, Qingdao, China
- 3Key Laboratory of Utilization and Conservation of Tropical Marine Bioresource (Hainan Tropical Ocean University), Ministry of Education, Sanya, China
- 4Department of Marine Science, Incheon National University (INU), Incheon, Republic of Korea
With the development of the laver industry, germplasm depression has become a serious issue, and current cultivars cannot adapt to different aquaculture regions. In order to increasing the genetic diversity and developing more germplasm sources, it is urgent and reasonable to construct a mutant library with more new germplasms. In this research, a mutant library was constructed by ethyl methanesulfonate (EMS)-mutagenized archeospores, and the most optimal treatment procedure was determined by performing different mutagen concentrations (2.25%) and treatment times (30 min). A total of 1860 haploid thalli were produced as the M1 mutant population and further cultured into conchocelis clones for the reservation of germplasm resources. Among these, 667 individual thalli were evaluated for their phenotypic traits, including thallus length, thallus width, length/width, thallus shape, photosynthesis ability, thallus color, thallus margin, and specific growth speed. The mutation frequency of the length/width ratio was 17.39%, Fv/Fm and NPQ were 21.84% and 29.35%, respectively, and SGR was 13.59%. The mutation frequency of thallus color was 0.91%. This work may not only provide a basic practical reference guide for EMS-based mutant library construction for other seaweeds but, more importantly, also serve as a valuable resource for functional genomics research and laver breeding.
1 Introduction
As an important economic seaweed, laver is cultivated in east Asian countries such as China, Japan, and Korea because of its high economic value. In China, Neopyropia yezoensis and Neoporphyra haitanensis have been widely cultivated in northern and southern coastal cities, respectively. N. yezoensis and N. haitanensis once belonged to the same genus Pyropia but were recently divided (Yang et al., 2020). In 2019, the production of laver in China reached 212,304 tons in fresh weight with US $2.7 billion of economic value (Kim et al., 2022).
With the development of the laver industry, germplasm depression of current cultivars has become more and more serious (Hwang et al., 2019; Kim et al., 2022). Additionally, in recent years, the environmental factors of cultivated sea areas, especially temperature and nutrient salt, also changed, and current cultivars cannot adapt to the different aquaculture areas. Therefore, it is critical to improve the breeding speed of new varieties or strains with excellent economic traits, such as stress resistance, high yield, and high-quality, by widening the genetic diversity and developing more germplasm sources. Traditionally, the combination of selective breeding and mutation breeding based on cultivated and wild populations has produced some cultivars with desired traits, as well as promoted the development of the entire laver industry. However, the genetic diversity of the present varieties or strains has decreased because of the continued cultivation for many years. Therefore, the construction of a saturated mutant library may provide more innovative resources and promote laver breeding development.
Mutations are the driver of species evolution and adaption; however, spontaneous mutation with extremely low rate requires a long identification time. In addition, spontaneous mutations are often deleterious and identifying the genetic background has remained difficult. (Drake et al., 1998). Although the spontaneous mutation rate of N. yezoensis is higher than those of other species (unpublished data), the mutations resulting from spontaneous mutation tend to be color mutations. Currently, genome editing technology such as CRISPR and insertion mutations still hasn’t been constructed for the construction of a mutant library for N. yezoensis. Therefore, physical and chemical mutations are still the preferred method in mutant library construction. Chemical mutagens have typically been used to create mutants in laver research as an easy and cost-effective approach (Aslam et al., 2016).
Ethyl methanesulfonate (EMS) is one of the most common mutagens. EMS can change the G:C pairing at the base level with other base pairing modes through 3-ethyladenine pairing errors, inducing 2–10 mutations/Mb of diploid DNA with high-frequency(Till et al., 2007; Lian et al., 2020). In addition, it is relatively easy to operate and can be detoxified for disposal (Espina et al., 2018). With the advantages of higher point mutation, fewer chromosomal aberrations, and easier mutant screening, EMS has been widely used to construct mutant libraries as an effective mutagen for chemical mutagenesis in diverse plant species, which efficiently generated phenotypic variations, enabled the functional analysis of genes and the ability to ameliorate phenotypes in molecular breeding (Jankowicz-Cieslak & Till, 2016; Gupta et al., 2017; Penna and Jain, 2017; Chen et al., 2018; Sun et al., 2019; Irshad et al., 2020; Kong et al., 2020; Lian et al., 2020; Udagawa et al., 2021). Although EMS has also been used to produce mutants in laver, only a few mutants with a single trait were obtained (Lee & Choi, 2018; Ma et al., 2019) and no mutant library was reported at present. For the GC content of the N. yezoensis genome was approximately 65% (Wang et al., 2020), which was beneficial for the EMS function at the whole genome-wide level and could be used to further construct a mutant library with higher saturation.
This study aimed to construct a mutant library in N. yezoensis by optimizing EMS experimental procedures, and to further evaluate the phenotypic variations and mutant frequencies from the M1 generation thalli of the mutant library. The conchocelis clones of M1 generation thalli were singly collected as the germplasm resources, and finally, genome-level nucleotide variations were analyzed through re-sequencing of the selected color mutants. This work may serve as a basic practical reference guide for EMS-based mutant library construction in other seaweeds. More importantly, the mutant collection, composed of a broad repertoire of mutants, may also be a valuable resource for basic research, as well as in laver breeding.
2 Materials and methods
2.1 Algal material culturing
The pure RZ line of N. yezoensis, established in our laboratory, was used in this study. Fresh, leafy gametophytes were cultured in sterilized seawater with Provasoli’s enriched seawater (PES) medium at 10°C and 12:12 h light:dark of photoperiod with 50 μmol photons·m−2·s−1 of photosynthetically active radiation (PAR). The seawater was bubbled continuously with filter-sterilized air and renewed every 3 days.
2.2 The release and collection of archeospores from N. yezoensis
The release of archeospores was conducted following the procedures of Nianci Chen, with some modifications (Chen et al., 2020). The unmatured thallus at approximately 35–40 days was cut into small pieces containing approximately 30–50 cells, and then transferred to a microtube and washed with sterilized seawater three times. Then, the micro-thallus pieces were transferred to a flask and cultured in sterilized seawater with PES at 15°C under a 12:12 h light:dark of photoperiod with 40 μmol photons·m−2·s−1 of PAR. After approximately 6–7 days, the spores with a concentration of 10,000/mL were collected and pipetted into 12-well plates for EMS mutation.
2.3 The optimization of EMS mutation treatment
To obtain suitable mutation treatment, different EMS solution concentrations and treating times were performed. The EMS solution concentrations were set at 1.0%, 1.5%, 2.25%, 3.0%, 3.375%, and 5.0625% (v/v), with sterilized seawater as the control. The treatment times included 30 and 60 min, and three biological replicates were tested for each treatment (n = 3). After treatment with EMS, 5% Na2SO4 was added to all treatments to stop the reaction, and then rinsed with sterilized seawater several times to remove the residual reagents. The archeospores in 12-well plates were placed in the dark for 12 h and cultured at 15°C under a 12:12 h light:dark with 40 μmol photons·m−2·s−1. The germination ratio (GR) and relative germination ratio (RGR) were each calculated after 3 days by microscopy observations. The median LD50 from different treatment combinations was selected as the optimal condition for subsequent experiments, following (Ke et al., 2019)
2.4 The construction and preservation of the M1 mutant library
The archeospores with a concentration of 10,000/mL were treated with an optimal EMS dose and treatment duration. The mutagenic treatment process was followed by the above pre-experiment procedure, and the untreated archeospores were cultured as the control. Approximately 1000 M1 thalli germinated from the mutagenized archeospores were further screened for identification and collection of the mutants, and each thallus was evaluated for phenotypic and physiological variations in comparison with the control.
For M1 mutant library preservation, the thallus pieces 1 cm2 in size from each M1 population individual were cut and cultured in a culture bottle under 20°C, with a 12:12 h light/dark cycle and 30 μmol photons·m−2·s−1, until conchocelis appeared. The conchocelis clones were transferred to 96-well plates and kept as the mutant library germplasm.
2.5 Measurements of the phenotype and photosynthetic physiologic parameters
Phenotypic evaluations were based on the thallus length, thallus width, length/width, thallus shape, photosynthesis ability, thallus margin, and specific growth rate. These traits were recorded by photos and further analyzed by ImageJ software. The specific growth rate (SGR) was determined based on the change of the thallus size(Yong et al., 2013),
where S0 is the size of the thallus from the first day, and St is the size of the thallus after t days.
The pigment extraction and contents of phycoerythrin (PE), phycocyanin (PC), allophycocyanin (APC), and chlorophyll a (Chl a) were subsequently measured according to the procedures of Yu et al. (Yu et al., 2020). The contents of Chl a, PE, PC, and APC were quantified by an ultraviolet spectrophotometer (UV-180, Shimadzu, Japan). The Chl a content was analyzed according to the method of Wellburn et al. (Wellburn, 1994), and the PE, PC, and APC contents were analyzed according to the method of Sampath-Wiley and Neefus (Sampath-Wiley & Neefus, 2007). All of these measurement operations were conducted in the dark to avoid degradation of the photosynthetic pigments.
The photosynthetic activity of each thallus was measured by a chlorophyll fluorescence imaging system (FluorCAM MF800, PSI, Czech). The parameters of Fv/Fm (maximum PSII quantum yield), QY(II) (effective PSII quantum yield), NPQ (non-photochemical quenching), and qP (photochemical quenching) were derived from the export data of quenching analysis in the operating software.
2.6 Evaluation of the mutant library
To evaluate whether the variations in M1 mutant populations were significant, the mutation frequency and coefficient of variation (CV) were calculated. The mutation frequency was calculated by the number of effective mutant individuals/the number of total individuals. The effective mutant was determined by the mutation threshold (Xb), and individuals with a value of trait measured higher or lower than Xb were considered to be effective mutants. The Xb value was determined according to the standard deviation method (Wu, 1992)
where Xb(±) denotes the mutation threshold, μ and σ indicate the average value and standard deviation, and Zα/2 denotes the percentile among the standard normal distribution. When α was 0.05, Zα/2 equaled 1.964 and was approximated to 2.
2.7 Genome re-sequencing of the mutants
The total genomic DNA was isolated from the thalli of the representative mutants using a plant genomic DNA kit (Tiangen, China) according to the manufacturer’s instructions. The DNA concentration and quality were examined by a Qubit.2.0 fluorometer (Invitrogen) and 1% agarose gel electrophoresis. Paired-end sequencing libraries with insert sizes of approximately 350 bp and a read length of 150 bp were subjected to whole-genome resequencing using an Illumina HiSeq 2000 platform (Illumina, USA).
2.8 SNP identification and annotation
A high-quality reference genome consisting of three chromosomes was obtained from the RZ line (Accession No. WMLA01000000). The resequencing raw reads were filtered and aligned to the reference genome sequence by the Burrows-Wheeler alignment tool (BWA) (Langmead & Salzberg, 2012). Picard software1 was used to mark duplicates, and BCFtools software was used to find common variation sites among the different individuals from the same line. In addition, SAMtools (settings: -bS -t, “rmdup”) and GATK software were used to identify single-nucleotide polymorphisms (SNPs) and InDels (Li et al., 2009; McKenna et al., 2010). ANNOVER software was used to annotate SNPs or InDels based on the GFF3 files for the reference genome(Wang et al., 2010). The SNP/InDel filter standard pipelines were as follows: read depth_4, _1000; mapping quality_20; and adjacent SNP distance_5 bp. The identified SNPs were annotated by custom PERL scripts and the ANNOVAR program according to the reference genome. The output of ANNOVAR was assigned to three categories, namely, (i) the genic region: ‘exonic’, ‘intronic’; (ii) the upstream/downstream region: ‘upstream’, ‘downstream’, and ‘upstream & downstream’; and (iii) the intergenic region.
2.9 Statistical analysis
All data were expressed as the mean value of three replicates with standard deviation (SD). One-way ANOVA and Tukey tests were used to analyze the differences among the treatments using SPSS 17.0 (SPSS Statistics 17.0, IBM), where the significance level was set at 0.05.
3 Results
3.1 Optimized EMS dose determination
To check the sensitivity of archeospores to EMS, different mutagen doses and treatment times were set. The germination rate (GR) and relative germination rate (RGR) were counted on days 1, 4, 7, and 10 after EMS treatment. Under 30 min of treatment, a low EMS concentration (1%, 1.5%) treatment did not affect archeospore germination compared to the control group. When the EMS dose increased to 2.25% and 3.375%, the GR of the archeospores significantly decreased. Nearly all archeospores died under 5.0625%. There was no significant difference in GR from the 4th day to the 10th day under a low EMS dose (1%, 1.5%, 2.25%), suggesting that the GR became stable. However, under the 3.75% treatment, the GR was significantly reduced from the 4th day (Figure S1). With 60 min of treatment, the 1% treatment dose did not affect archeospore germination compared to the control group. Under doses of 1.5% and 2.25%, the GR was significantly reduced. When the EMS concentration increased to 3.375%, almost all of the archeospores died. Similar to the 30 min treatment condition, the GR of the archeospores was stable from the 4th day to the 10th day after treatment (Figure S2).
To determine the most optimal mutation condition, the RGRs on the 10th day for the different EMS concentrations between the 30 and 60 min conditions were jointly compared. The 50% of RGR was considered the screening standard. Finally, to ensure that we obtained a sufficient mutant population, a 2.25% × 30 min treatment combination was selected as the most optimal mutation condition for constructing the mutant library, and under this condition, RGR was approximately 51.57%, compared to the control (Figure 1).
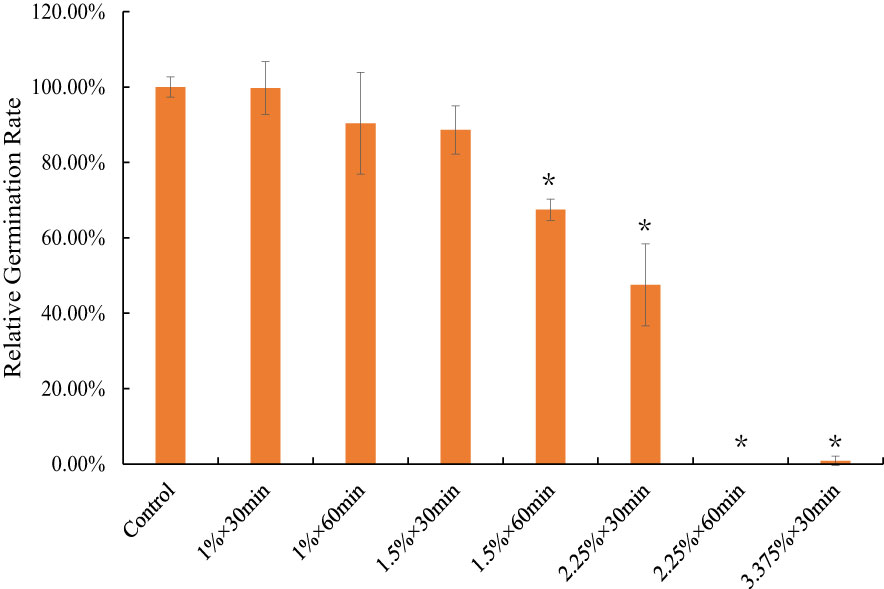
Figure 1 The relative germination rate of different EMS mutagenize combination on 10 DAG. * indicate statistically significant difference (p<0.05). Bars show means ± SE of three biological replicates (n=3).
3.2 Construction of the EMS mutant library
Based on the above tests, nearly 1 mL of solution with a concentration of 10,000 spores/mL was treated by EMS and then cultured, and developed into the M1 population thalli under normal culturing conditions. The entire culture process was composed of three periods, where the seedlings generated from the archeospores grew slowly. This first period lasted approximately 15 days. The second period also lasted approximately 15 days, and the seedlings were transferred to 9-cm plates and grew into thallus seedlings 1–2 cm in length. The seedlings were transferred to flushes under continuous bubbling and developed into a healthy M1 thallus population in the last period (Figure 2A). These thalli were further used for phenotype analysis and reserved for the mutant library.
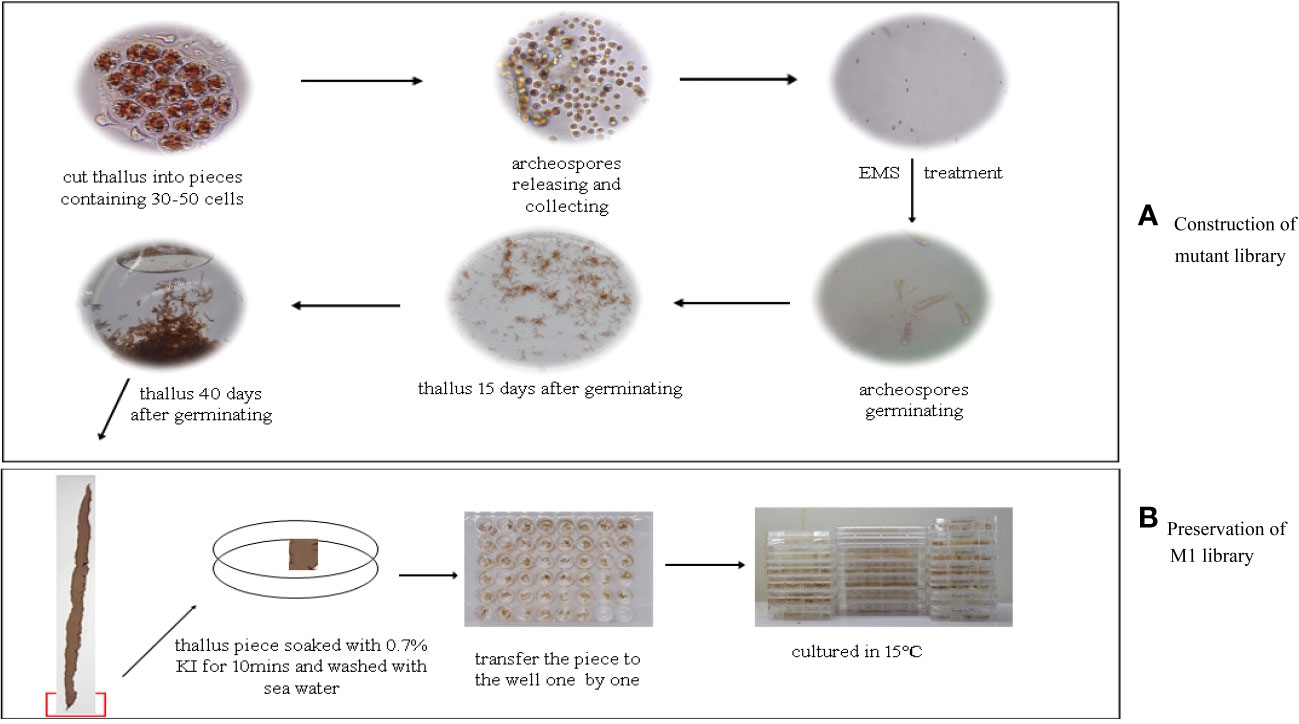
Figure 2 The pipeline about construction of mutant library EMS-mutagenized and the concochelis clones reservation about M1 generation mutant library. (A) The whole process of construction of the mutant library from the archeospores releasing to growing into thallus; (B) The process of preservation of the M1 mutant library.
For mutant germplasm preservation, the thallus pieces 1 cm2 in size from each M1 population individual were cut and cultured in a culture bottle under 20°C, with a 12:12 h light/dark cycle and 30 μmol photons·m−2·s−1, until conchocelis appeared. The conchocelis clones were transferred to 96-well plates and kept as the mutant library germplasm. Finally, 1860 clones were conserved and used to screen for positive mutants (Figure 2B).
3.3 The phenotypes of the M1 mutant populations
Among the M1 populations, 667 thalli were randomly selected to evaluate their phenotypes, including the ratio of length/width, thallus shape, photosynthesis ability, growth ratio, and thallus margin.
For phenotypic analysis of the length/width ratio, in the M1 mutant population, the proportion of ratio value below the 10 range, was approximately 89.1%. The proportions lower than 5 and 5–10 were 37.5% and 51.6%, respectively. The percentages of ratio values from 10–15 and above 15 were 9.8% and 1.1%, respectively. In the control population, the ratio values were distributed between 5 and 15, for which the proportion was approximately 85.45%, with 31.9% for 5–10 and 53.65% for 10–15. The percentages of ratio values above 15 and lower than 5 were 13.82% and 0.66%, respectively (Figure S3). Generally, the average ratio value of the M1 population was approximately 6.06, which was significantly lower than that of the control with a value of 11.02 (P< 0.01) (Figure 3).
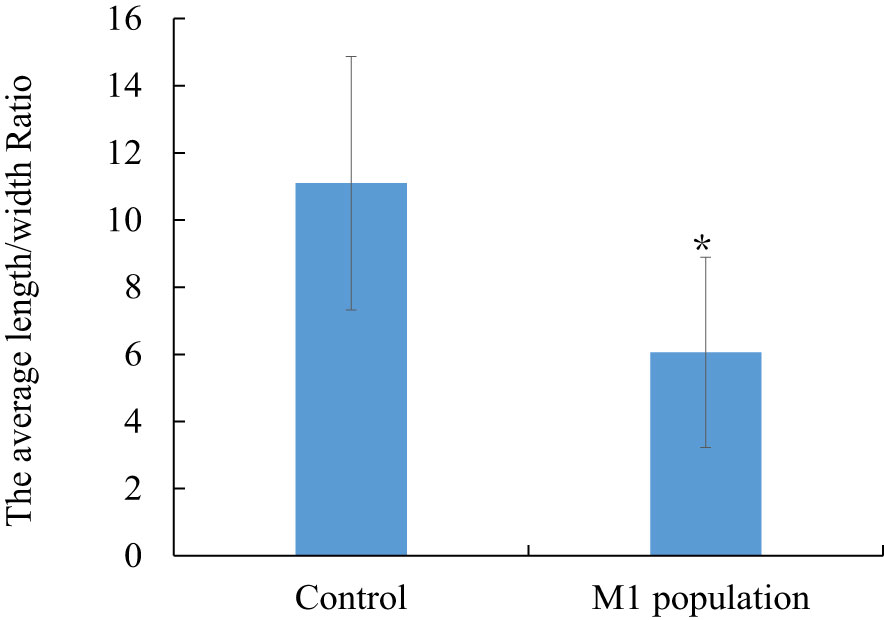
Figure 3 The comparison of average different length/width ratio between M1 mutant population and the control population. * indicate statistically significant difference (p<0.05). Bars show means ± SE of three biological replicates (n=3).
In phenotypic analysis of the thallus shape, the frequencies of the different shapes between the M1 and control populations were different (Figures 4A, B). In the M1 population, the number of acuminate and dumbbell shapes increased by 16.3% and 11.96%, respectively, and the frequency of banding and abnormal shapes also increased. Although the frequencies of oval and long oval shapes ranked at the top, which were the common thallus shape of N. yezoensis, they decreased compared to the control group. This showed that EMS mutation induced a thallus shape change.
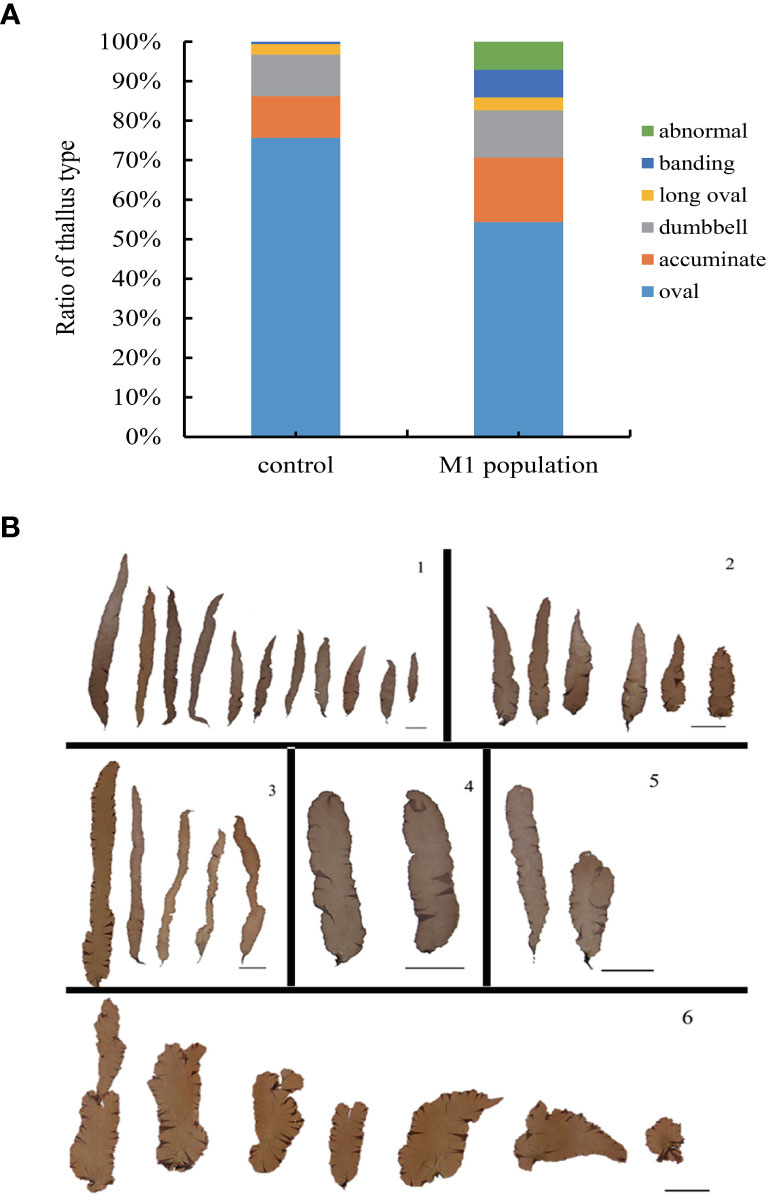
Figure 4 The ratio distribution of different thallus shape between M1 mutant population and the control population. (A), ratio distribution; (B), different thallus shape.
The chlorophyll fluorescence parameters including Fv/Fm, Qy, NPQ, and qP were determined to evaluate the photosynthetic abilities of the mutants. Fv/Fm and NPQ showed a significant difference between the M1 population and the control group (P< 0.05). The Qy and qP values did not show significant differences (Figure 5).
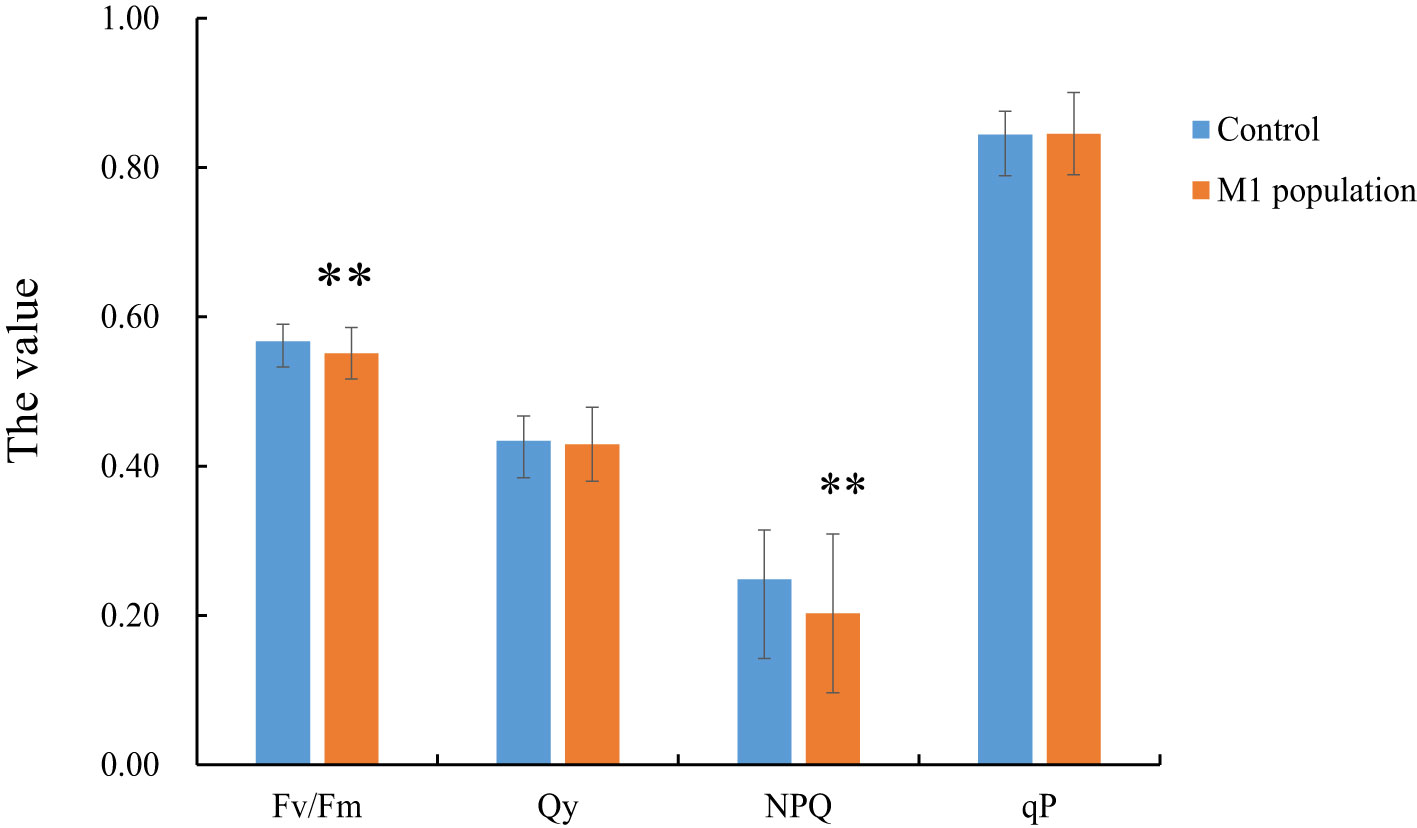
Figure 5 The analysis of chlorophyll fluorescence parameters between M1 mutant population and the control population. ** indicate statistically significant difference (p<0.01). Bars show means ± SE of three biological replicates (n=3).
The average specific growth rates (SGRs) of the two populations were analyzed, and the results showed that the SGR of the M1 population was higher than that of the control but was not significant (P>0.05), with average SGR values of 16.89% and 14.53%, respectively (Figure S4).
The thallus edge of N. yezoensis is usually smooth, with no tooth, which is the basis of laver classification. Among the observed M1 population individuals, no other types of thallus edges were observed, along with a smooth margin, similar to the control group (Figure S5).
Thallus color mutants can usually be easily identified during the mutation process. In this study, seven color mutants were identified in the M1 population, comprising six red mutants and one purple mutant (Figure 6). No color mutants were found in the control group.
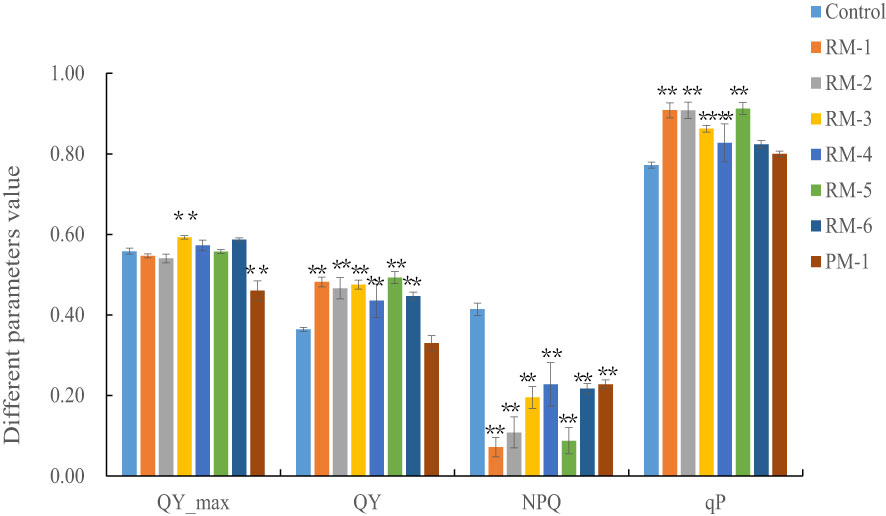
Figure 6 The color mutants identified in the M1 mutant population. (A), the control; (B-G), red color mutants; (H), purple color mutant. ** indicate statistically significant difference (p<0.01). Bars show means ± SE of three biological replicates (n=3).
3.4 The mutation frequency and coefficient of variation of the mutant library
The mutation frequency is considered an important index for evaluating the mutant library, representing the polymorphisms of the mutant library. In this research, we calculated the mutation threshold, from which the mutation frequency was further calculated. The results showed that the mutation frequency of the length/width ratio was 17.39%, Fv/Fm and NPQ were 21.84% and 29.35%, respectively, and SGR was 13.59%. The mutation frequency of thallus color was 0.91% (Table 1). Because the phenotypes of thalli can be easily affected by environmental factors, we further analyzed the CV between the M1 population and the control group. The CVs of the length/width ratio, Fv/Fm, Qy, NPQ, and qP in the M1 population were higher than those in the control group, and only the CV of SGR in the M1 population was lower than that in the control group (Table 2). These results showed that EMS indeed caused mutations to some extent and affected the growth and development of the M1 population.

Table 1 The mutation frequency of M1 population.

Table 2 The coefficient of variation of each phenotype between M1population and the control.
3.5 Phenotypes variations of the color mutants
The thalli of the seven color mutants (RM1-6, PM) displayed obvious color variations compared to the control. To evaluate their phenotype characters, the M2 generation from the M1 generation of the seven color mutants was further produced by the releasing archeospores method. Thirty M2 generation thalli of each mutant were selected and their specific growth rate (SGR), different pigment protein contents, and chlorophyll fluorescence parameters were determined compared to the control. Among the seven color mutants, the SGR of RM3, RM5, and PM showed significant differences (P< 0.01) (Figure 7). Although different pigment protein contents were determined, we still used their ratio to determine their pigment difference. The PE/Chla and PE/PC of most red color mutants were significantly higher than those of the control. PC/Chla, RM1, RM2, and RM4 showed significant differences, and PE/Chla and PC/Chla for the purple color mutant (PM1) also showed significant differences (Figure 8).
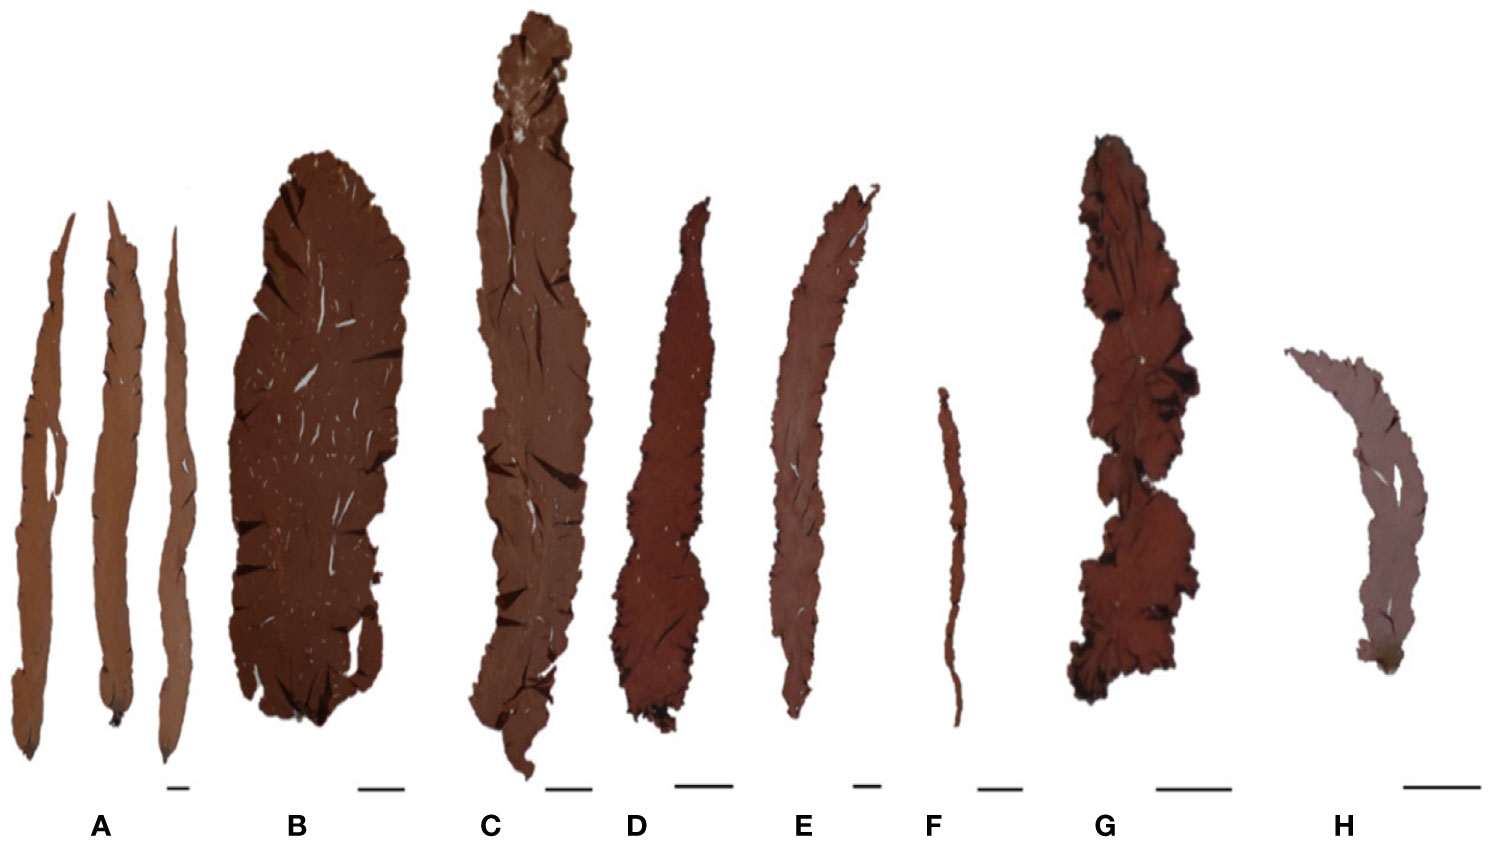
Figure 7 The analysis of specific growth rate among the color mutants. RM1-6, red color mutants. PM, purple mutant. ** and * indicate statistically significant difference (p<0.01 and p<0.05). Bars show means ± SE of three biological replicates (n=3).
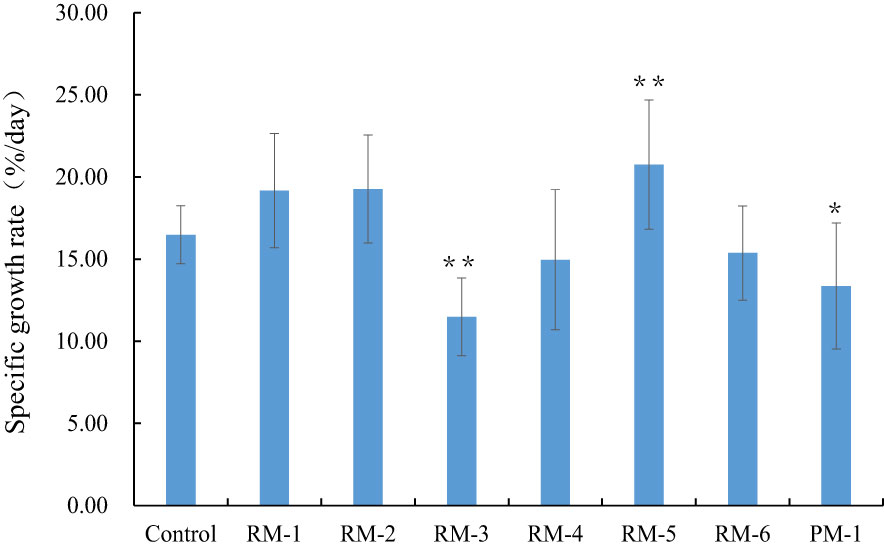
Figure 8 The analysis of different pigment ratio among color mutants and the control. RM1-6, red color mutants. PM, purple mutant. ** and * indicate statistically significant difference (p<0.01 and p<0.05). Bars show means ± SE of three biological replicates (n=3).
The analyzed chlorophyll fluorescence parameters showed that the Fv/Fm of most color mutants did not change, except RM-3 and PM-1, which were significantly higher and lower than those of the control (P< 0.01). The Qy values of all red color mutants were higher than those of the control, except PM-1 (P< 0.01); the NPQ values of all color mutants were lower than those of the control (P< 0.01); and the qP values of the red color mutants, except RM-6, were higher than those of the control (P< 0.01) (Figure 9).
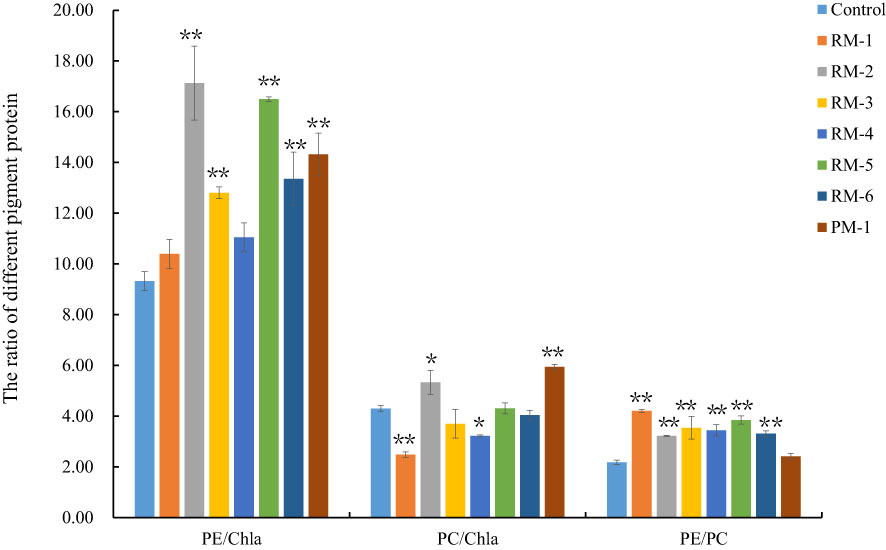
Figure 9 The analysis of the chlorophyll fluorescence parameters among color mutants and the control. RM1-6, red color mutants. PM, purple mutant. ** and * indicate statistically significant difference (p<0.01 and p<0.05). Bars show means ± SE of three biological replicates (n=3).
3.6 SNP analysis of the red mutants
To evaluate nucleotide mutation at the DNA level of the mutants, five M2 generation individuals from RM-1 and RM-2 were selected to perform genome-wide analyses by re-sequencing. The control line was also re-sequenced as the reference genome for identifying SNP variations. According to the results, the number of mutation sites, distribution, density, and annotations were further analyzed. EMS induced nucleotide mutations in the two mutants, which included SNVs (68.9%) and insertion/deletion mutations (31.1%) (Table 3). These mutation sites were evenly distributed on the three chromosomes. In the RM-1 mutant, 309 SNP sites were identified, comprising 189 SNVs and 120 In/Dels. The whole density distributions on chromosomes 1, 2, and 3 were 2.55, 3.06, and 3.16 SNP/Mb, respectively. In the RM-2 mutant, 679 SNPs were identified, comprising 492 SNVs and 187 In/Dels, and the density distributions on chromosomes 1, 2, and 3 were 6.86, 6.64, and 5.24 SNP/MB, respectively. Among the SNVs in the two mutants, 82.5% and 86.4% (156/425) were C/G to T/A transitions. The annotation of SNVs indicated that although the SNV numbers of the two mutants were different, the ratio of SNV distribution region on the chromosome was similar (Table 4). Most of the SNVs were distributed in the intergenic region, with 61.90% in the RM-1 mutant and 61.79% in the RM-2 mutant. Meanwhile, 18.52% and 18.50% were located on the upstream and downstream of genes, nearly 6.35% and 5.49% were located in the intron region, and 13.23% and 14.23% were located in the exon region. These results showed that the color variations of the two red color mutants were mostly caused by mutations in the regulatory regions, and the candidate mutated gene will be further analyzed in the future.
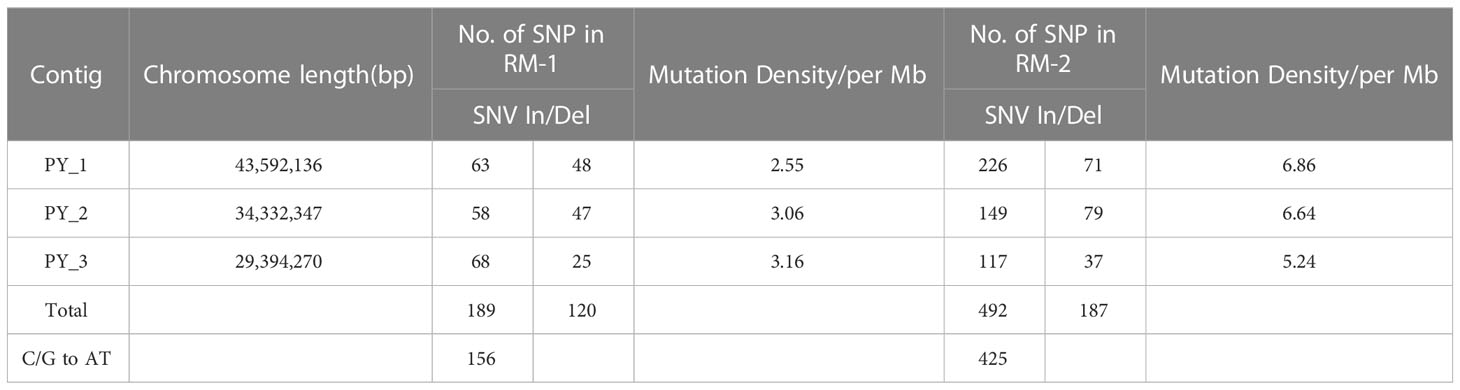
Table 3 The genome-wide EMS-induced SNP numbers and mutation density in two red color mutants.
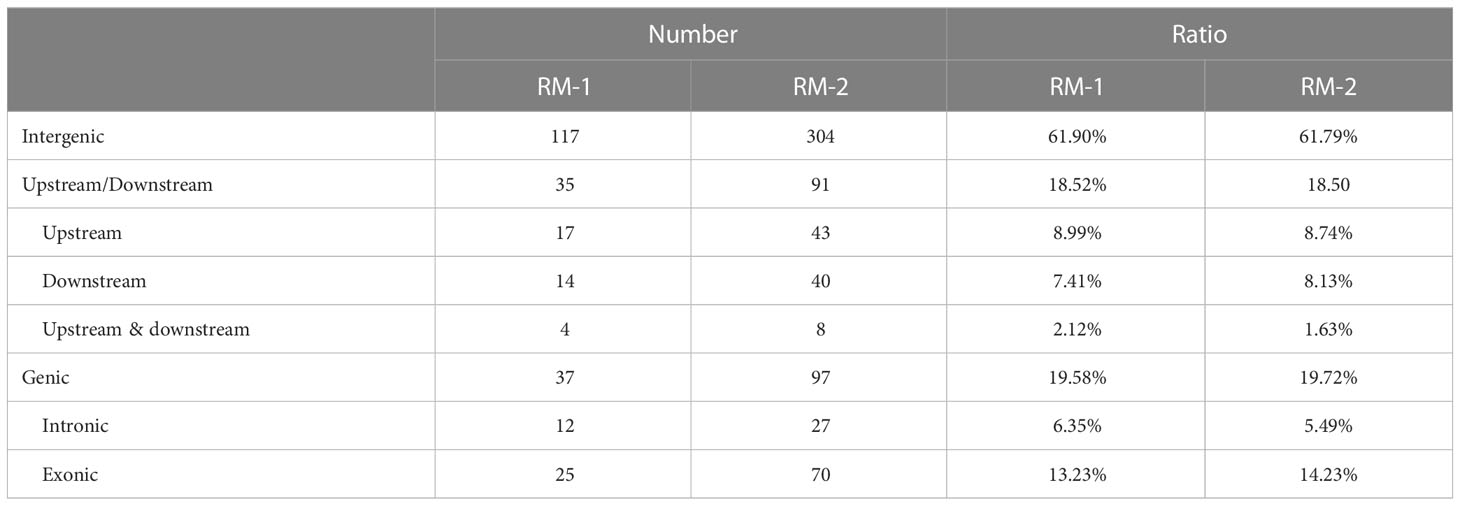
Table 4 EMS-induced SNV annotation summary in two red color mutants.
4 Discussion
It is necessary to select appropriate materials and technical means for artificial mutagenesis. N. yezoensis possess a life cycle characterized by the alternation of heteromorphic generations, diploid sporophytes and haploid gametophytes, with different morphologies (Wang et al., 2020). In addition, the gametophytic thallus releases archeospores that will further develop into thallus (Chen et al., 2020). This diverse life history of N. yezoensis provides diverse material for constructing a mutant library. However, sporophytic conchocelis and conchospores are diploid, the thallus is a chimera, and mutations would result in the production of heterozygous mutant individuals. Therefore, it is critical to purify these heterozygotes to obtain homozygotes, prolonging the construction time of the mutant library and increasing the costs. In this research, we used archeospores released by sectioning the thallus pieces as mutated materials, which could directly develop into haploid thalli and could be easily identified as candidate mutants. Therefore, the archeospores were considered the preferred material for constructing the N. yezoensis mutant library.
A proper evaluating method about the mutants are important for constructing mutant library. Mutational types and their frequency have often been correlated with the mutagens and species in which they occur(Guo et al., 2021). In this work, we obtained the most optimal mutation condition with a concentration of 2.25% and time of 30 min, which was further used for mutant library construction. The mutation frequency of the mutant library determines the diversity of the mutant germplasm. In higher plants, the mutant frequency differs among different species, with 12.49% for cucumber, 9% for foxtail, and 7.4% for cotton(Chen et al., 2018; Sun et al., 2019; Lian et al., 2020).The phenotype of laver was easily affected by environmental factors, with simple morphological characteristics of the thalli. According to the methods of Wu (Wu, 1992), and based on the Xb(±) value of the trait, the mutation frequency of other detected phenotypes in this research was above 15%, except that of the color mutants was 0.86%, which also provided a reference method for evaluating the mutation frequency of the seaweed mutant library.
Thallus color is considered an important quality trait of laver, controlling not only the photosynthesis ability, and further controlling production, but also the quality of the thallus, especially in post-harvest production. In this research, although seven color mutants were identified, comprising six red color mutants and one purple color mutant, the proportion of pigment mutants was lower than those of other phenotype mutants. Of note, the frequency of red mutants in this study was higher than that of the purple mutants, which implied that red mutants were the most readily available pigment mutants in the mutagenesis of N. yezoensis. Two color mutants were selected for re-sequencing at the genome-wide level and the results showed that the SNP identified were distributed evenly on the three chromosomes. However, the mutation densities in the two color-mutants were 3SNV/Mb and 7SNV/Mb, which were lower than those of higher plants, such as 1/11.8 kb in soybean(Li et al., 2017), 181.7 SNP/Mb in cotton(Abid et al., 2020), 1/213 kb in foxtail(Sun et al., 2019), 1/309.5 kb in rice (Guo et al., 2021), 1/89 kb in Arabidopsis thaliana [4]. Generally, the mutation frequency could be increased due to genetic redundancy provided by duplicated genes and/or the polyploidy of the plant genome(Li et al., 2017), where the higher the ploidy of the chromosome, the higher the mutation frequency. It has been found that the mutation densities for tetraploid or hexaploidy species were higher than those of diploid plant species(Wang et al., 2012). For example, the mutation density was found to be 10-fold higher in EMS-induced mutant hexaploidy wheat than in EMS-induced mutant diploid barley(Krasileva et al., 2017). In this research, the haploid archeospore was used for constructing the library, and the mutant densities in the two mutants were 2.8/Mb and 6.28/Mb, which, as expected, were lower than those of other species. Based on the pigment content and photosynthesis parameters analysis, we can infer that some nucleotide variations occurred exactly in the color mutants, and these variations resulted in the different pigment ratios, further affected their photosynthetic ability, compared to the wild type.
5 Conclusions
In this research, a mutant library was constructed by EMS-mutagenized archeospores, and the most optimal treatment procedure and evaluating method were determined. However, for the variations of laver thallus are easily affected by the environmental factors, other evaluating methods and phenotypes about the mutants are still necessary to further exploring, which will be helpful for identify the candidate mutants. Nevertheless, the mutant library constructed will be valuable in N. yezoensis genetic breeding as well as in functional genomics research.
Data availability statement
The datasets presented in this study can be found in online repositories. The names of the repository/repositories and accession number(s) can be found below: https://www.ncbi.nlm.nih.gov; PRJNA949805.
Author contributions
FK designed and supervised the experiments and wrote the manuscript. JY conducted the construction of mutant library. BS performed the evaluation of the mutant library. XY and JW analyzed the SNV of the resequencing data. YM and JK improved the draft. HR, HY, and CY measured the phenotypes of the mutant library. XM and YS prepared the samples. All authors contributed to the article and approved the submitted version.
Funding
This work was supported by the Shandong Province Key Research and Development Program (Grant No: 2021LZGC004, Grant No: 2022LZGC004) and the Natural Science Foundation of China (Grant No. 41976146, Grant No. 42276113).
Acknowledgments
We thank LetPub (www.letpub.com) for its linguistic assistance during the preparation of this manuscript.
Conflict of interest
The authors declare that the research was conducted in the absence of any commercial or financial relationships that could be construed as a potential conflict of interest.
Publisher’s note
All claims expressed in this article are solely those of the authors and do not necessarily represent those of their affiliated organizations, or those of the publisher, the editors and the reviewers. Any product that may be evaluated in this article, or claim that may be made by its manufacturer, is not guaranteed or endorsed by the publisher.
Supplementary material
The Supplementary Material for this article can be found online at: https://www.frontiersin.org/articles/10.3389/fmars.2023.1166370/full#supplementary-material
Supplementary Figure 1 | The comparison of different EMS mutagen concentration on germination rate (GR) of the archeospores under 30min treatment time. Different letters indicate statistically significant difference (p<0.05). Bars show means ± SE of three biological replicates (n=3).
Supplementary Figure 2 | The comparison of different EMS mutagen concentration on germination rate (GR) of the archeospores under 60min treatment time. Different letters indicate statistically significant difference (p<0.05). Bars show means ± SE of three biological replicates (n=3).
Supplementary Figure 3 | The proportion comparison of mutant thalli with different length/width ratio between M1 mutant population and the control population
Supplementary Figure 4 | The comparison of specific growth rate between M1 mutant population and the control population.
Supplementary Figure 5 | Different region of the thallus smooth margin.
References
Abid M. A., Wang P. L., Zhu T., Liang C. Z., Meng Z. G., Malik W., et al. (2020). Construction of gossypium barbadense mutant library provides genetic resources for cotton germplasm improvement. Int. J. Mol. Sci. 21. doi: 10.3390/ijms21186505
Aslam U., Cheema H. M. N., Ahmad S., Khan I. A., Malik W., Khan A. A. (2016). COTIP: cotton TILLING platform, a resource for plant improvement and reverse genetic studies. Front. Plant Sci. 7. doi: 10.3389/fpls.2016.01863
Chen C., Cui Q. Z., Huang S. W., Wang S. H., Liu X. H., Lu X. Y., et al. (2018). An EMS mutant library for cucumber. J. Integr. Agr. 17, 1612–1619. doi: 10.1016/S2095-3119(17)61765-9
Chen N., Tang L., Guan X., Chen, R., Cao, M., Mao, Y., et al. (2020). Thallus sectioning as an efficient monospore release method in pyropia yezoensis (Bangiales, rhodophyta). J. Appl. Phycol. 32, 6. doi: 10.1111/jpy.12947
Drake J. W., Charlesworth B., Charlesworth D., Crow J. F. (1998). Rates of spontaneous mutation. Genetics 148, 1667–1686. doi: 10.1093/genetics/148.4.1667
Espina M. J., Ahmed C. M. S., Bernardini A., Adeleke E., Yadegari Z., Arelli P., et al. (2018). Development and phenotypic screening of an ethyl methane sulfonate mutant population in soybean. Front. Plant Sci. 9, 394. doi: 10.3389/fpls.2018.00394
Guo H. J., Du Q. D., Xie Y. D., Xiong H. C., Zhao L. S., Gu J. Y., et al. (2021). Identification of rice blast loss-of-Function mutant alleles in the wheat genome as a new strategy for wheat blast resistance breeding. Front. Genet. 12. doi: 10.3389/fgene.2021.623419
Gupta P., Reddaiah B., Salava H., Upadhyaya P., Tyagi K., Sarma S., et al. (2017). Next-generation sequencing (NGS)-based identification of induced mutations in a doubly mutagenized tomato (Solanum lycopersicum) population. Plant J. 92, 495–508. doi: 10.1111/tpj.13654
Hwang E. K., Yotsukura N., Pang S. J., Su L., Shan T. F. (2019). Seaweed breeding programs and progress in eastern Asian countries. Phycologia 58, 484–495. doi: 10.1080/00318884.2019.1639436
Irshad A., Guo H. J., Zhang S. L., Liu L. X. (2020). TILLING in cereal crops for allele expansion and mutation detection by using modern sequencing technologies. Agronomy-Basel 10, 405. doi: 10.3390/agronomy10030405
Jankowicz-Cieslak J., Till B. J. (2016). Chemical mutagenesis of seed and vegetatively propagated plants using EMS. Curr. Protoc. Plant Biol. 1, 617–635. doi: 10.1002/cppb.20040
Ke C., Guan W., Bu S., Li X., Deng Y., Wei Z., et al. (2019). Determination of absorption dose in chemical mutagenesis in plants. PloS One 14, e0210596. doi: 10.1371/journal.pone.0210596
Kim H. S., Choi H. G., Hwang M. S., Jeon Y. J., Yarish C., Kim J. K. (2022). Concise review of the genus neopyropia (Rhodophyta: bangiales). J. Appl. Phycol. 34, 1805–1824. doi: 10.1007/s10811-022-02776-1
Kong W. W., Wang L. M., Cao P., Li X. F., Ji J. J., Dong P. H., et al. (2020). Identification and genetic analysis of EMS-mutagenized wheat mutants conferring lesion-mimic premature aging. BMC Genet. 21, 88. doi: 10.1186/s12863-020-00891-x
Krasileva K. V., Vasquez-Gross H. A., Howell T., Bailey P., Paraiso F., Clissold L., et al. (2017). Uncovering hidden variation in polyploid wheat. P Natl. Acad. Sci. U.S.A. 114, E913–EE21. doi: 10.1073/pnas.1619268114
Langmead B., Salzberg S. L. (2012). Fast gapped-read alignment with bowtie 2. Nat. Methods 9, 357–359. doi: 10.1038/nmeth.1923
Lee H. J., Choi J. I. (2018). Isolation and characterization of a high-growth-rate strain in pyropia yezoensis induced by ethyl methane sulfonate. J. Appl. Phycol. 30, 2513–2522. doi: 10.1007/s10811-018-1426-1
Li H., Handsaker B., Wysoker A., Fennell T., Ruan J., Homer N., et al. (2009). The sequence Alignment/Map format and SAMtools. Bioinformatics 25, 2078–2079. doi: 10.1093/bioinformatics/btp352
Li Z. F., Jiang L. X., Ma Y. S., Wei Z. Y., Hong H. L., Liu Z. X., et al. (2017). Development and utilization of a new chemically-induced soybean library with a high mutation density. J. Integr. Plant Biol. 59, 60–74. doi: 10.1111/jipb.12505
Lian X., Liu Y., Guo H. H., Fan Y. J., Wu J. F., Guo H. X., et al. (2020). Ethyl methanesulfonate mutant library construction in gossypium hirsutum l. allotetraploid Funct. Genomics germplasm innovation Plant J. 103, 858–868. doi: 10.1111/tpj.14755
Ma Y. C., He L. W., Huan L., Lu X. P., Wang G. C. (2019). Characterization of a high-growth-rate mutant strain of pyropia yezoensis using physiology measurement and transcriptome analysis. J. Phycol. 55, 651–662. doi: 10.1111/jpy.12842
McKenna A., Hanna M., Banks E., Sivachenko A., Cibulskis K., Kernytsky A., et al. (2010). The genome analysis toolkit: a MapReduce framework for analyzing next-generation DNA sequencing data. Genome Res. 20, 1297–1303. doi: 10.1101/gr.107524.110
Penna S., Jain S. M. (2017). Mutant resources and mutagenomics in crop plants. Emir J. Food Agr. 29, 651–657. doi: 10.9755/ejfa.2017.v29.i9.86
Sampath-Wiley P., Neefus C. D. (2007). An improved method for estimating r-phycoerythrin and r-phycocyanin contents from crude aqueous extracts of porphyra (Bangiales, rhodophyta). J. Appl. Phycol. 19, 123–129. doi: 10.1007/s10811-006-9118-7
Sun J., Luu N. S., Chen Z. H., Chen B., Cui X. A., Wu J. X., et al. (2019). Generation and characterization of a foxtail millet (Setaria italica) mutant library. Front. Plant Sci. 10. doi: 10.3389/fpls.2019.00369
Till B. J., Cooper J., Tai T. H., Colowit P., Greene E. A., Henikoff S., et al. (2007). Discovery of chemically induced mutations in rice by TILLING. BMC Plant Biol. 7, 19. doi: 10.1186/1471-2229-7-19
Udagawa H., Ichida H., Takeuchi T., Abe T., Takakura Y. (2021). Highly efficient and comprehensive identification of ethyl methanesulfonate-induced mutations in nicotiana tabacum l. by whole-genome and whole-exome sequencing. Front. Plant Sci. 12. doi: 10.3389/fpls.2021.671598
Wang K., Li M. Y., Hakonarson H. (2010). ANNOVAR: functional annotation of genetic variants from high-throughput sequencing data. Nucleic Acids Res. 38, e164. doi: 10.1093/nar/gkq603
Wang T. L., Uauy C., Robson F., Till B. (2012). TILLING in extremis. Plant Biotechnol. J. 10, 761–772. doi: 10.1111/j.1467-7652.2012.00708.x
Wang D., Yu X., Xu K., Bi G., Cao M., Zelzion E., et al. (2020). Pyropia yezoensis genome reveals diverse mechanisms of carbon acquisition in the intertidal environment. Nat. Commun. 11, 4028. doi: 10.1038/s41467-020-17689-1
Wellburn A. R. (1994). The spectral determination of chlorophyll-a and chlorophhyll-b, as well as total carotenoids, using various solvents with spectrophotometers of different resolution. J. Plant Physiol. 144, 307–313. doi: 10.1016/S0176-1617(11)81192-2
Wu R. (1992). Evaluation on the rationality of the calculation method for the discrimination limit of two mutants. J. Nucl. Agric. Sci. 13, 3.
Yang L. E., Deng Y. Y., Xu G. P., Russell S., Lu Q. Q., Brodie J. (2020). Redefining pyropia (Bangiales, rhodophyta): four new genera, resurrection of porphyrella and description of calidia pseudolobata sp. nov. From China J. Phycol. 56, 862–879. doi: 10.1111/jpy.12992
Yong Y. S., Yong W. T. L., Anton A. (2013). Analysis of formulae for determination of seaweed growth rate. J. Appl. Phycol. 25, 1831–1834. doi: 10.1007/s10811-013-0022-7
Keywords: Neopyropia yezoensis, Ethyl methanesulfonate (EMS), mutant library, phenotypic variation, germplasm resources
Citation: Kong F, Yin J, Yu X, Wang J, Sun B, Mao Y, Kim JK, Ren H, Yue H, Yu C, Miao X and Sun Y (2023) Ethyl methanesulfonate mutant library construction in Neopyropia yezoensis to provide germplasm resources for next-generation genome-selection breeding. Front. Mar. Sci. 10:1166370. doi: 10.3389/fmars.2023.1166370
Received: 15 February 2023; Accepted: 15 May 2023;
Published: 07 June 2023.
Edited by:
Yang Jin, Carnegie Institution for Science, United StatesReviewed by:
Mohini Prabha Singh, Punjab Agricultural University, IndiaXiaoyi Wang, Chinese Academy of Tropical Agricultural Sciences, China
Copyright © 2023 Kong, Yin, Yu, Wang, Sun, Mao, Kim, Ren, Yue, Yu, Miao and Sun. This is an open-access article distributed under the terms of the Creative Commons Attribution License (CC BY). The use, distribution or reproduction in other forums is permitted, provided the original author(s) and the copyright owner(s) are credited and that the original publication in this journal is cited, in accordance with accepted academic practice. No use, distribution or reproduction is permitted which does not comply with these terms.
*Correspondence: Fanna Kong, Zm5rb25nQG91Yy5lZHUuY24=