 Andrés S. Rigual-Hernández1*
 Gerald Langer2
 Francisco Javier Sierro1
 Helen Bostock3
 José Manuel Sánchez-Santos4
 Scott Davidson Nodder5
 Tom W. Trull6,7
 Anne Marie Ballegeer8Andrew D. Moy7,9
 Ruth Eriksen6,10Laura Makowka1
 Thibauld M. Béjard1
 Francisco Henri Rigal-Muñoz1Alberto Hernández-Martín1María Zorita-Viota1
 José Abel Flores1
- 1Área de Paleontología, Departamento de Geología, Universidad de Salamanca, Salamanca, Spain
- 2Institut de Ciència i Tecnologia Ambientals, Autonomous University of Barcelona, Bellaterra, Spain
- 3School of Earth and Environmental Sciences, University of Queensland, Brisbane, QLD, Australia
- 4Departamento de Estadística, Universidad de Salamanca, Salamanca, Spain
- 5National Institute of Water and Atmospheric Research, Wellington, New Zealand
- 6Commonwealth Scientific and Industrial Research Organisation, Oceans and Atmosphere, Hobart, TAS, Australia
- 7Australian Antarctic Program Partnership, Institute of Marine and Antarctic Studies, University of Tasmania, Hobart, TAS, Australia
- 8Departamento de Didáctica de las Matemáticas y de las Ciencias Experimentales, Universidad de Salamanca, Salamanca, Spain
- 9Australian Antarctic Division, Kingston, TAS, Australia
- 10Institute for Marine and Antarctic Studies, University of Tasmania, Hobart, TAS, Australia
The Subantarctic Zone of the Southern Ocean plays a disproportionally large role on the Earth system. Model projections predict rapid environmental change in the coming decades, including ocean acidification, warming, and changes in nutrient supply which pose a serious risk for marine ecosystems. Yet despite the importance of the Subantarctic Zone, annual and inter-annual time series are extremely rare, leading to important uncertainties about the current state of its ecosystems and hindering predictions of future response to climate change. Moreover, as the longest observational time series available are only a few decades long, it remains unknown whether marine pelagic ecosystems have already responded to ongoing environmental change during the industrial era. Here, we take advantage of multiple sampling efforts – monitoring of surface layer water properties together with sediment trap, seafloor sediment and sediment core sampling – to reconstruct the modern and pre-industrial state of the keystone calcifying phytoplankton Calcidiscus leptoporus, central to the global marine carbonate cycle. Morphometric measurements reveal that modern C. leptoporus coccoliths are 15% lighter and 25% smaller than those preserved in the underlying Holocene-aged sediments. The cumulative effect of multiple environmental factors appears responsible for the coccolith size variations since the Last Deglaciation, with warming and ocean acidification most likely playing a predominant role during the industrial era. Notably, extrapolation of our results suggests a future reduction in cell and coccolith size which will have a negative impact on the efficiency of the biological pump in the Southern Ocean through a reduction of carbonate ballasting. Lastly, our results tentatively suggest that C. leptoporus coccolith size could be used as a palaeo-proxy for growth rate. Future culture experiments will be needed to test this hypothesis.
1 Introduction
Coccolithophores, the most prolific group of marine calcifying phytoplankton, play an important, yet complex role in the global carbon cycle and climate system (Milliman, 1993; Honjo et al., 2008). On the one hand, they represent a key component of the biological pump taking up CO2 via photosynthesis, and then subsequent transport to depth of a fraction of the produced organic carbon (Ziveri et al., 2007; Balch, 2018). Moreover, their dense calcite platelets (termed coccoliths) may even accelerate the sinking of other organic matter via ballasting (e.g. (e.g. Armstrong et al., 2002; Ziveri et al., 2007; Armstrong et al., 2009). On the other hand, the precipitation of carbonate coccolith calcite counteracts the oceanic sequestration of atmospheric CO2 by elevating the aqueous CO2 by ~0.6 mole per mole of biogenic carbonate precipitated (Frankignoulle and Gattuso, 1993; Frankignoulle et al., 1994), the so called carbonate counter pump. Additional potential impact on climate comes from the their role in the generation of sulphur species and their possible role in cloud formation (Jackson and Gabric, 2022). Therefore, changes in the distribution, abundance and/or composition of coccolithophore communities in the global ocean could have profound impacts on the ocean carbon cycle with feedbacks to climate. This study looks at how environmental changes from the Late Deglaciation to the modern have impacted on Calcidiscus leptoporus, one of the most important calcium carbonate vectors to the ocean interior on the Subantarctic Zone (SAZ), and how this may help to predict the future response of this biogeochemical important species to ongoing environmental change in the Southern Ocean.
The Southern Ocean also plays a significant role in the uptake of CO2 due to the moderate alkalinity of its surface waters and to the increased solubility of CO2 at low temperatures, making it particularly susceptible to ocean acidification (Orr et al., 2005; Fabry et al., 2009). Models predict that Southern Ocean waters (south of 60°S) will become undersaturated with respect to aragonite as early as 2030, while calcite undersaturation (the most stable polymorph of calcium carbonate) is expected to begin by the year 2095 (McNeil and Matear, 2008). Since these carbonate saturation thresholds will be crossed sooner in high latitude systems than at lower latitudes, Southern Ocean ecosystems have been proposed as bellwethers for prospective impacts of ocean acidification on marine systems at mid- and low latitudes (Fabry et al., 2009). The bulk of evidence suggests that the capacity of many calcifying marine organism to build their shells will be impaired by enhanced oceanic uptake of anthropogenic CO2 (a process known as ocean acidification) with potentially profound consequences for the global carbon cycle (Caldeira and Wickett, 2003; Orr et al., 2005; Pörtner et al., 2005; Raven et al., 2005). Coccolithophores are no exception to this trend. Laboratory and mesocosm experiments have demonstrated that ongoing ocean acidification will most likely result in an overall decrease of calcification and the cellular PIC/POC ratios in two of the most abundant coccolithophore species: Emiliania huxleyi and Gephyrocapsa oceanica (Meyer and Riebesell, 2015). However, the response to ocean acidification is species- and strain-specific, both in E. huxleyi and C. leptoporus (Langer et al., 2006; Langer et al., 2009; Fiorini et al., 2011; Langer et al., 2011; Langer et al., 2011; Diner et al., 2015). However, despite this variability a general trend can be identified, both in E. huxleyi and in C. leptoporus (Diner et al., 2015; Meyer and Riebesell, 2015). When considering the range of seawater carbonate chemistry relevant to the discussion of ocean acidification it is clear that C. leptoporus is also negatively impacted by acidification (Langer and Bode, 2011; Diner et al., 2015). Notably, despite the obvious importance of these less abundant coccolithophore species, such as C. leptoporus, as carbonate vectors to the deep ocean, many uncertainties regarding their possible response to ongoing environmental change in the Southern Ocean remain. A major reason for these uncertainties is the fact that our knowledge about the susceptibility of coccolithophores to ocean acidification is largely based on laboratory studies. Field studies are a necessary and complementary line of research that needs to be explored in order to better predict the fate of coccolithophores under climate change.
The subantarctic region is a globally important region for the productivity of coccolithophores, termed the Great Calcite Belt (Balch et al., 2011; Rosengard et al., 2015). Although more recent observations have found important spatial differences in coccolithophore productivity across sectors of across the SAZ (Trull et al., 2018). Southern Ocean coccolithophore communities are largely dominated by the cosmopolitan species Emiliania huxleyi. However, owing to the small size of E. huxleyi coccospheres and coccoliths, bigger species (such as Calcidiscus leptoporus and Helicosphaera carteri) account for a larger fraction of the calcium carbonate production and export to the deep ocean (Young and Ziveri, 2000; Baumann et al., 2004; Daniels et al., 2016; Rigual-Hernández et al., 2020c). Notably, despite the obvious importance of these less abundant coccolithophore species as carbonate vectors to the deep ocean, it is unclear how they will respond to ongoing environmental change.
Comparison of materials collected from sediment traps (representative of the industrial era) and seafloor sediments (representative of pre-industrial times) have been used to evaluate the response of key calcifying microplankton to recent environmental change (e.g. Jonkers et al., 2019; Béjard et al., 2023). Moy et al. (2009) demonstrated that modern populations of the planktonic foraminifera Globigerina bulloides are about 30-35% lighter than those from the pre-industrial era in the SAZ and attributed this change to a physiological response of G. bulloides to ongoing human-induced ocean acidification. In contrast, a similar study looking at the morphometrics of E. huxleyi coccoliths from pre-industrial and modern sediment traps tentatively suggested that this species has not experienced substantial changes in their degree of calcification (Rigual-Hernández et al., 2020a). However, E. huxleyi is known to have eco-physiological features different from other coccolithophore species (Walker et al., 2018). Thus, it is of critical importance to assess how important carbonate vectors to the ocean interior, such as C. leptoporus, are responding and will respond to natural and anthropogenic driven environmental changes in the Southern Ocean.
This study aims to shed light on these issues by estimating coccolith morphometric parameters of subantarctic C. leptoporus populations from the southwest Pacific sector of the Southern Ocean. The study used samples from two sediment traps, a set of Holocene-aged samples retrieved from the underlying sediments (dated between 0.6 to 8 kyr) and a sediment core covering part of the Deglaciation (from ~ 14 kyr) and the Holocene from the Subantarctic Zone. Comparison of the data sets with key environmental factors allowed (1) the reconstruction of coccolith morphometric variations throughout the Holocene and the industrial era and (2) identification of key environmental factors controlling C. leptoporus coccolith morphogenesis. Results of this study provides the first field-based assessment of the impact of ongoing environmental change on the biogeochemically important species C. leptoporus.
2 Materials and methods
2.1 Samples
2.1.1 Sediment traps
Samples were used from two sediment traps from the Subantarctic SW Pacific – Southern Ocean Time Series (SOTS) – South of Tasmania, and SubAntarctic Mooring (SAM) – Southeast of New Zealand. SOTS station (Trull et al., 2010; Shadwick et al., 2022) is located at 46° 56’ S and 142° 15’ E on the abyssal plain south of Tasmania and can be considered representative of a large swath of the of the central SubAntarctic Zone (SAZ) (Trull et al., 2001; Rigual-Hernández et al., 2020b). The SOTS observatory is equipped with a sediment trap at 1000 m depth as well as instruments measuring multiple physical, chemical and biological parameters of both the atmosphere and the mixed layer (e.g. Eriksen et al., 2018; Shadwick et al., 2022). SAM was deployed in subantarctic waters at 46° 40’ S and 178° 30’ E between 2000 and 2012 with a sediment trap at 1500 m and although it has a series of instruments measuring oceanographic parameters at depth it has no information for surface waters (Nodder et al., 2016).
Here we present C. leptoporus data covering one annual cycle for both sites. For the SOTS site samples were retrieved between August 2011 and July 2012 with a resolution of 16 days (21 samples covering a total 336 days) at 1000 m depth. For the SAM moored sediment trap, samples were retrieved between November 2011 and October 2012 with a resolution of ~8 days (25 samples covering a total of 191 days). Gaps over the collection interval were quasi-evenly distributed throughout the time series.
2.1.2 Seafloor sediments
A total of 23 sea floor sediment samples from the subtropical and subantarctic zones south of Tasmania (Indian Ocean) and southeast of Aotearoa New Zealand (Southwest Pacific Ocean) were processed and analyzed for C. leptoporus coccolith morphometric characterization. Sample collection devices include gravity corers (topmost sample) and multicorers (Table 1). Eighteen out of the 23 samples were retrieved from settings above the calcite saturation horizon located at ~3200-3400 m (Moy et al., 2009; Bostock et al., 2011).
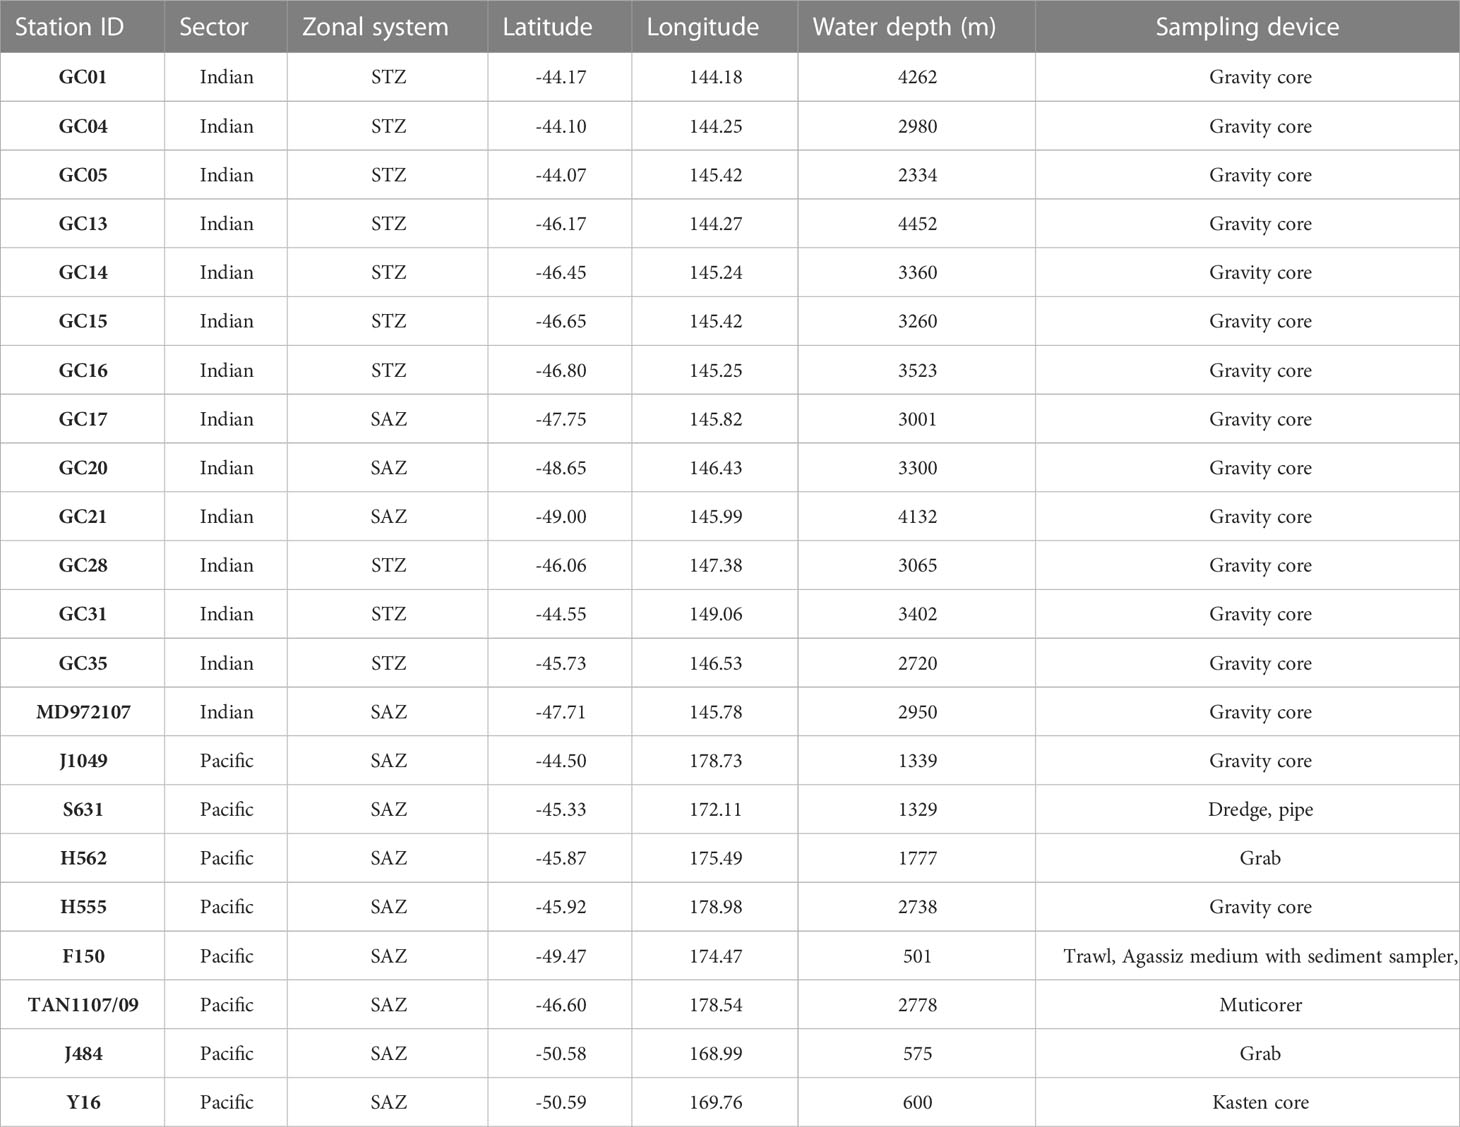
Table 1 Station identification code, sector, zonal system, latitude, longitude, water depth and sampling device for all the seafloor sediment and sediment core samples analyzed in this study.
Radiocarbon ages obtained on planktonic foraminifera for a subset of the samples were available from previous studies. The sea floor sediments south of Tasmania were dated between 3 and 7 kyrs BP: AMS 14C dates for GC04 at a depth of 5-8 cm is 3160 yr BP, GC17 at 0-2 cm is 4440 yr BP and GC14 at 5-7 cm is 7373 yr BP (Connell and Sikes, 1997; Moy et al., 2009). Sediment samples from southeast New Zealand were dated between 0.6 and 8 kyr BP: AMS 14C dates for the top centimetre for F150 is 609 ± 50 yr BP, S631 is 1502 ± 35 yr BP, J484 is 4120 ± 25 yr BP, J1049 is 6760 ± 35 yr BP and 8044 ± 35 yr BP (Prebble et al., 2013; Cortese and Prebble, 2015). It is worth noting that that it is possible the top section of the piston and gravity cores may have experienced some degree of stretching or loss of material during the recovery of the cores, which is consistent with the age of thousands of years suggested by some of the core tops. Based on all the above, it can be concluded that the bulk of the coccolith assemblages from the seafloor sediment samples of both sectors of the SAZ where produced during the Holocene under pre-industrial CO2 levels of roughly 260-280 ppmv (Petit et al., 1999).
2.1.3 Sediment core Y16
A 3-m-long Kasten core Y16 (50° 35.43’ S, 169° 45.33’ E; Figure 1) was collected from the Campbell Plateau at 600 m water depth and archived at the National Institute of Water and Atmospheric Research (NIWA) (Carter et al., 2002; Neil et al., 2004). A total of 16 samples were subsampled at 5 cm intervals of the top 76 cm of the Y16 core covering the last 47 kyrs. The age model was taken from Neil et al. (2004), with chronological constraints from oxygen isotopes and radiocarbon dates on planktic foraminifera Globorotalia inflata.
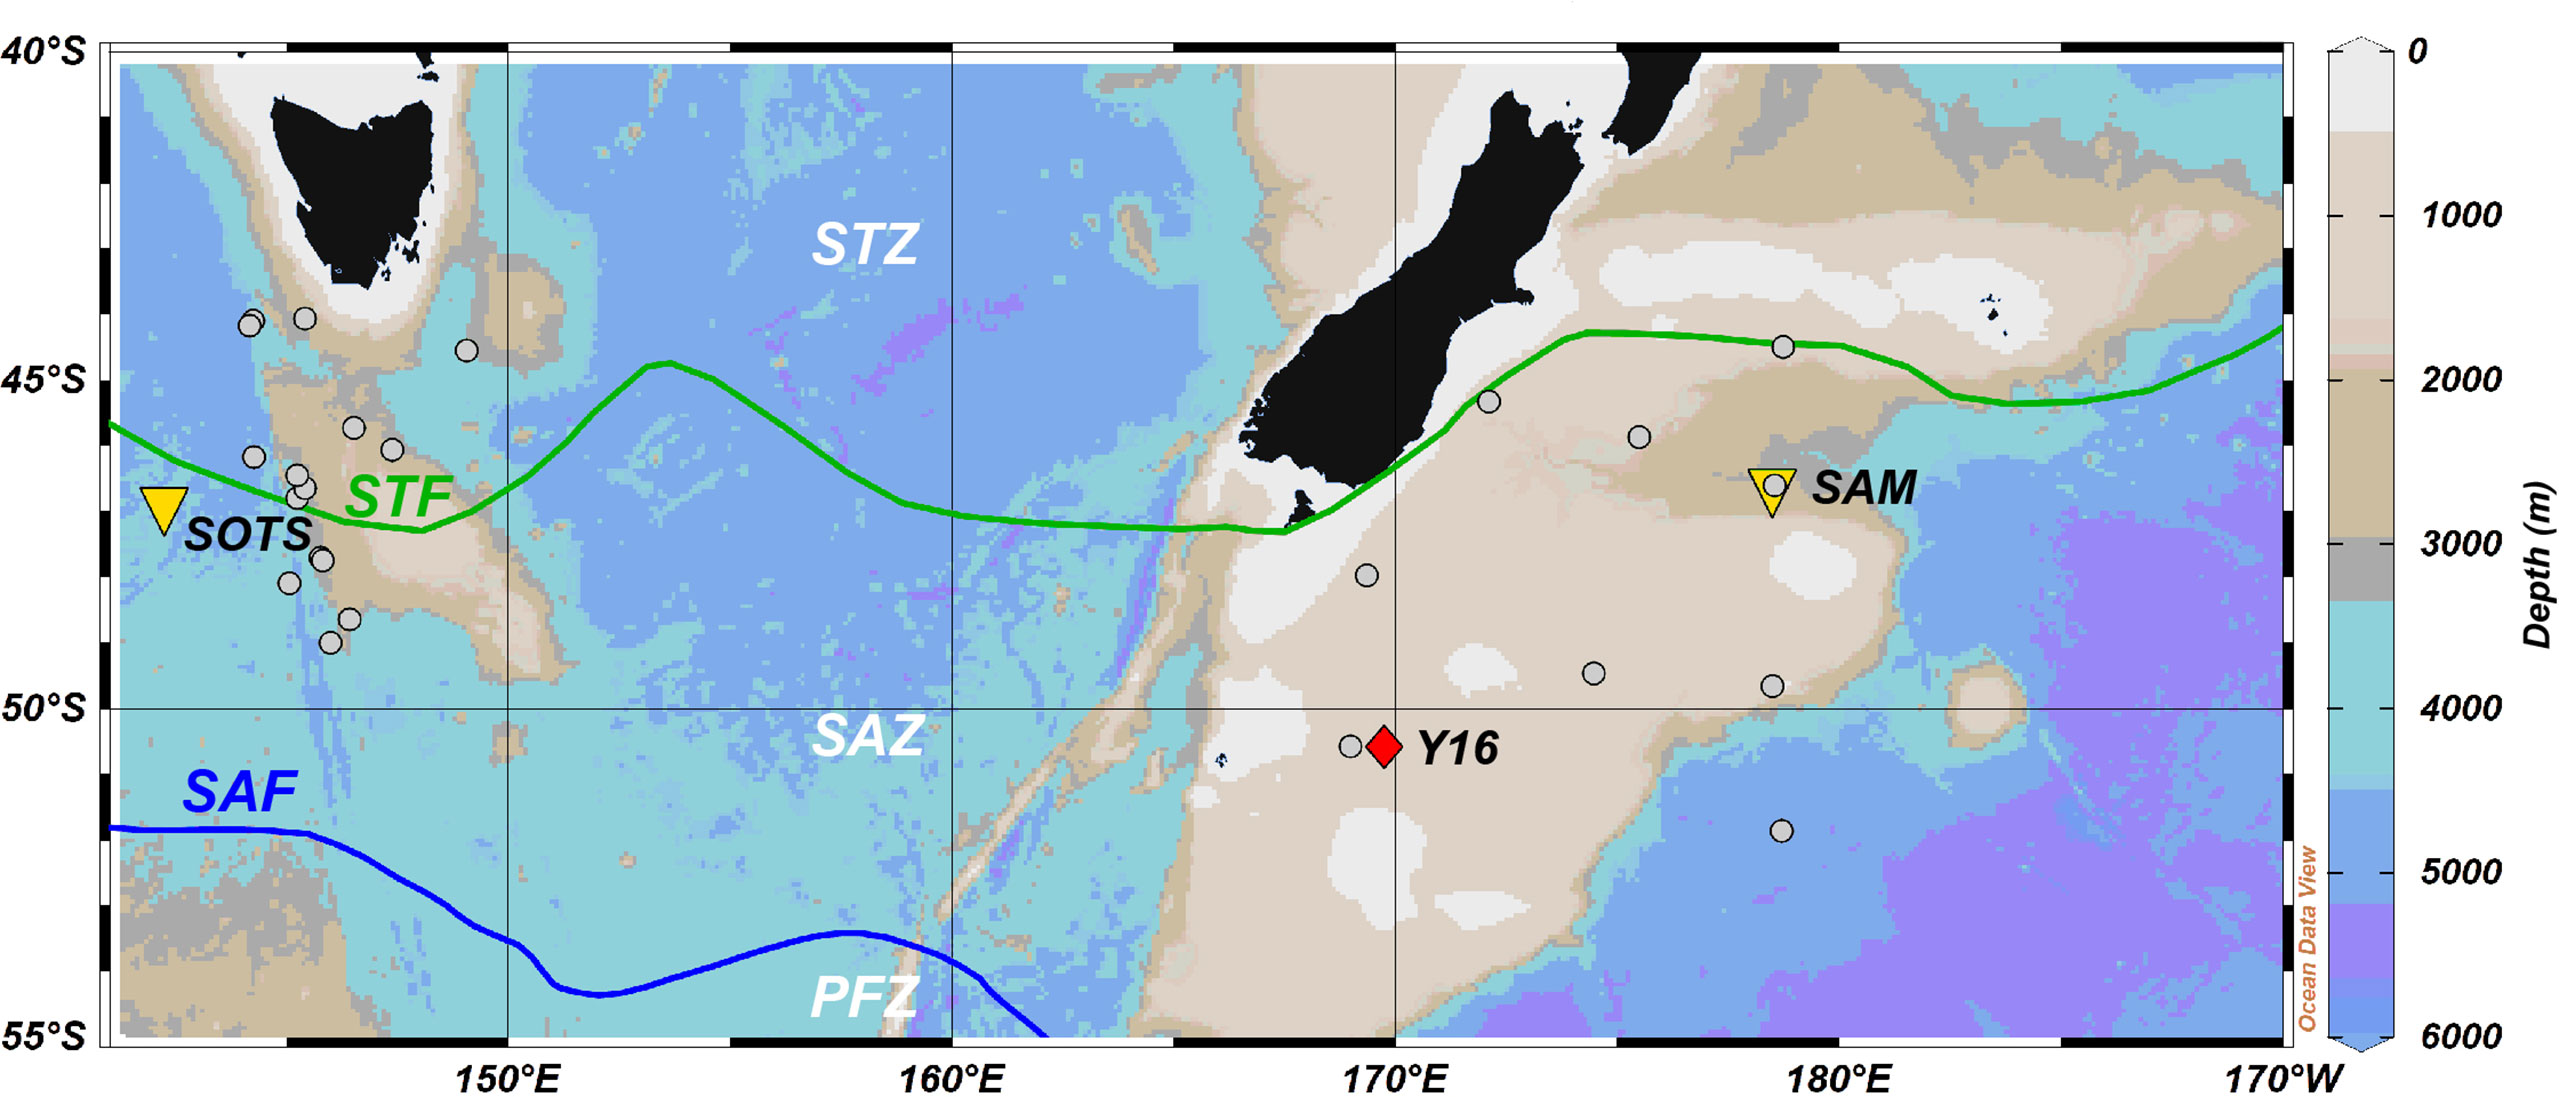
Figure 1 Bathymetric map showing the location of the Southern Ocean Time Series (SOTS) observatory (yellow triangle), Subantarctic Mooring (SAM) (yellow triangle), seafloor sediment samples (grey circles) and sediment core Y16 (red diamond). STZ, Subtropical Zone; SAZ, Subantarctic Zone; PFZ, Polar Frontal Zone; STF, Subtropical Front; SAF, Subantarctic Front. Oceanic fronts after Orsi et al. (1995). Ocean Data View software (Schlitzer, 2018) was used to generate this figure. Bathymetric data from General Bathymetric Chart of the Oceans (2022).
2.2 Calcareous nanoplankton sample preparation and analysis
Sediment trap, sediment grab and sediment core samples were prepared for coccolithophore analyses following the methodology outlined by Rigual-Hernández et al. (2020b). A total of 21 and 25 sediment trap samples were processed for the SOTS and SAM sites, respectively. For the SOTS site, a two times 1/40th aliquots were dedicated to pH determination and phytoplankton analysis. The pH of all samples ranged between 8.43 to 8.68, thereby guaranteeing an optimum calcite preservation. For the SAM samples, a 1/25th split was used for calcareous nannoplankton analysis. Initial analyses using a volume of 1000 to 5000 μl of the raw sample was mounted on a glass slide after Flores and Sierro (1997) for all samples. This was used to estimate coccosphere fluxes and coccolith morphometric analyses. Since marine ‘snow’ aggregates present in sediment trap samples can introduce biases in coccolith flux estimations (Bairbakhish et al., 1999), a method for the non-destructive disintegration of aggregates was followed for the preparation of the second glass slide (see Rigual-Hernández et al., 2020b for more details).
Qualitative and quantitative analyses on all the sediment trap samples were performed using a Nikon Eclipse LV100 POL light microscope equipped with circular polarization at 1000x magnification. The taxonomic concepts of Young et al. (2003) and the Nannotax website (Young et al., 2022) were used for coccolith species identification. A minimum of 300 coccoliths per sample was counted. These data have already been published in Rigual-Hernández et al. (2020c) and are used here to estimate annual-flux weighted averages of C. leptoporus.
Since the size ranges of C. leptoporus morphotypes can exceed or be less than those proposed in the literature (e.g. Malinverno et al., 2015), analysis of the fine structure of their coccoliths using SEM microscopy is essential to guarantee a correct morphotype identification. Therefore, a Carl Zeiss EVO HD25 Scanning Electron Microscope (SEM) was used on all samples to identify and classify C. leptoporus morphotypes. Samples were mounted on round glass cover slips following the same settling technique explained above, then the cover slips were mounted on aluminium stubs and coated with gold. Calcidiscus leptoporus exhibits a high intraspecific genetic variability, which is reflected in the morphology of its coccoliths (Sáez et al., 2003; Young et al., 2022). Currently, three C. leptoporus morphotypes are recognized based on the size and fine structure of their coccoliths: the small form or subspecies small (coccolith diameter <5 µm); the Intermediate type or subspecies leptoporus (5-8 µm); and the large form or subspecies quadriperforatus (7-9 µm) (Young et al., 2022).
Calcidiscus leptoporus coccolith counts were used to estimate coccolith fluxes by applying the following the formula:
where “F” is the daily coccolith flux (coccoliths m-2 d-1), “N” the number of coccolith counted in a given sample, “A” the total area of a Petri dish, “n” the number of fields of view analyzed, “a” the area of a field of view, “V” the dilution volume, “S” the split of original sediment trap cup analyzed, “d” the number of days of collection and “T” the aperture area of the sediment trap.
2.3 Coccolith mass and size measurements
Morphometric parameters of C. leptoporus coccoliths were estimated using a birefringence method that relies on the systematic relationship between the thickness of a calcite particle and the interference colour produced under polarized light (Beaufort, 2005; Beaufort et al., 2014; Fuertes et al., 2014). An apical rhabdolith of the genus Acanthoica collected by a sediment trap at the SOTS site was used for calibration. A calibration image of the same rhabdolith was taken at the beginning of each imaging session and the microscope and camera settings were kept constant throughout each session. Then, C. leptoporus coccoliths were selected and images cropped with Photoshop software. Lastly, all digital images were processed with C-Calcita software (Fuertes et al., 2014) that estimated coccolith maximum diameter, area, volume and weight. Coccolith thickness was estimated by dividing volume by area. To evaluate the variability across imaging sessions, the same C. leptoporus coccolith (hereinafter referred to as the “calibration coccolith”) was imaged after every calibration (Rigual-Hernández et al., 2020b). The standard deviation of the calibration coccolith indicate a calibration error of ±2% and ±3% for coccolith mass and length, respectively. Since the birefringence-based method used in this study employs grey scale images to estimate coccolith thickness, it can be only applicable to coccoliths thinner than 1.55 µm (Bolton et al., 2016). As maximum thickness of all measured C. leptoporus was lower than 0.74 µm, this threshold does not represent a limitation in our analysis.
2.4 Statistical analyses
2.4.1 Seasonal environmental controls on coccolith morphometrics at SOTS
Canonical Correspondence Analysis (CCA; ter Braak and Verdonschot, 1995) was used to identify the main environmental controls on C. leptoporus morphometrics at the SOTS site (Figure 2). For this analysis, we focussed on the two most widely used coccolith morphometric parameters measured in the literature: mass and area (directly related with coccolith diameter). The inclusion of more coccolith morphometric parameters, such as coccolith thickness, was found to largely influence the relationships between the morphometrics and the environmental parameters and yielded unrealistic results. The CCA was not possible for the SAM site due to the lack of accompanying in situ environmental data sets. Details on the sensor measurements for each environmental variable can be found in Rigual-Hernández et al. (2020b).
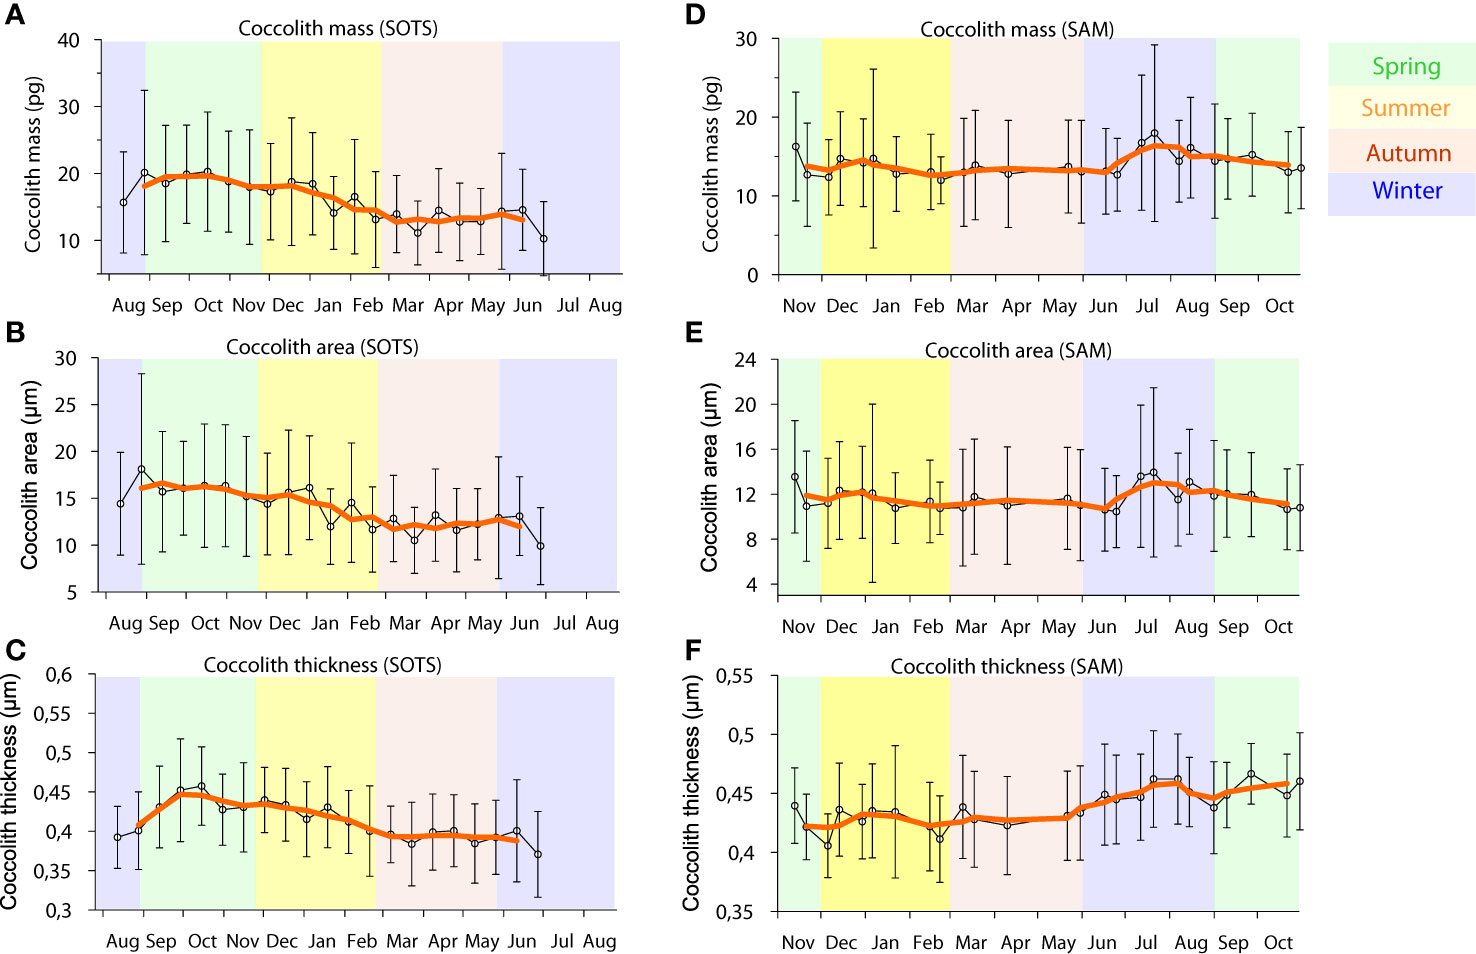
Figure 2 Average Calcidiscus leptoporus coccolith mass (A, D), area (B, E) and thickness (C, F) with standard deviations measured on the SOTS sediment trap deployed at 1000 m between August 2011 to July 2012 and on the SAM sediment trap deployed at 1500 m between November 2009 to November 2010.
As many environmental parameters display substantial covariability throughout the annual cycle, we followed the next procedure to identify the model with the minimum number of environmental variables that explained the maximum inertia (i.e. the amount of variation explained by the environmental variables) being statistically significant (Hastie and Pregibon, 1992; Venables et al., 2002). Therefore, a full model containing all the environmental parameters, i.e. Photosynthetically Active Radiation (PAR), water temperature, salinity, phosphate, Total Oxidised Nitrogen (TNOx), silicate, total CO2 (TCO2), Ωcalcite and pH, was calculated first. Then, the correlations between all environmental parameters were evaluated and confirmed that several variables exhibited high correlations with each other. The variance inflation factor analysis (VIF) collinearity statistic was also estimated to evaluate the covariability of the environmental parameters and yielded the following results: 48.49 for NOx, 20.47 for Phosphate, 90.21 for Silicate, 8.22 for Salinity, 10.77 for Temperature, 14.71 for PAR, 35.02 for TCO2, 59.89 for Calcite and 34.98 for pH. As all these values were greater than 5, which is the threshold above which the model is considered to have collinearity (Gareth et al., 2013), we used a stepwise variable selection based on the Akaike information criterion approach. After we obtained the model with the minimum AIC: Mass + Area ~ Phosphate + Silicate + Temperature + PAR + TCO2, we noticed that the variable TCO2 displayed a high VIF in the model (3.06 for Phosphate, 12.64 for Silicate, 4.68 for Temperature, 1.33 for PAR, 16.99 for TCO2). Based on the high VIF and its high correlation with Silicate concentration (r=0.95), TCO2) was removed it from the model. Thus, the final model was Mass + Area ~ Phosphate + Silicate + Temperature + PAR (with ~ symbol meaning that mass and area were modelled as a function of the four environmental variables). Please note that this model did not longer exhibit collinearity issues (2.30 for Phosphate, 1.79 for Silicate, 2.94 for Temperature and 1.30 for PAR). Therefore, this was the model finally used to evaluate the influence of environmental variability on C. leptoporus coccolith morphometrics.
2.4.2 Correlation analyses
To investigate the possible relationship between C. leptoporus coccolith morphometric parameters and the magnitude of coccolith fluxes (used as a proxy for coccolith growth, see section 4.3 for more details) measured at the SOTS and SAM sediment traps, Spearman and Pearson correlations were calculated and plotted in Figure 3. Moreover, the relationship between coccolith mass, area, thickness and coccolith fluxes was also investigated through the calculation of two correlation matrices that can be found in Supplementary Figure 1.
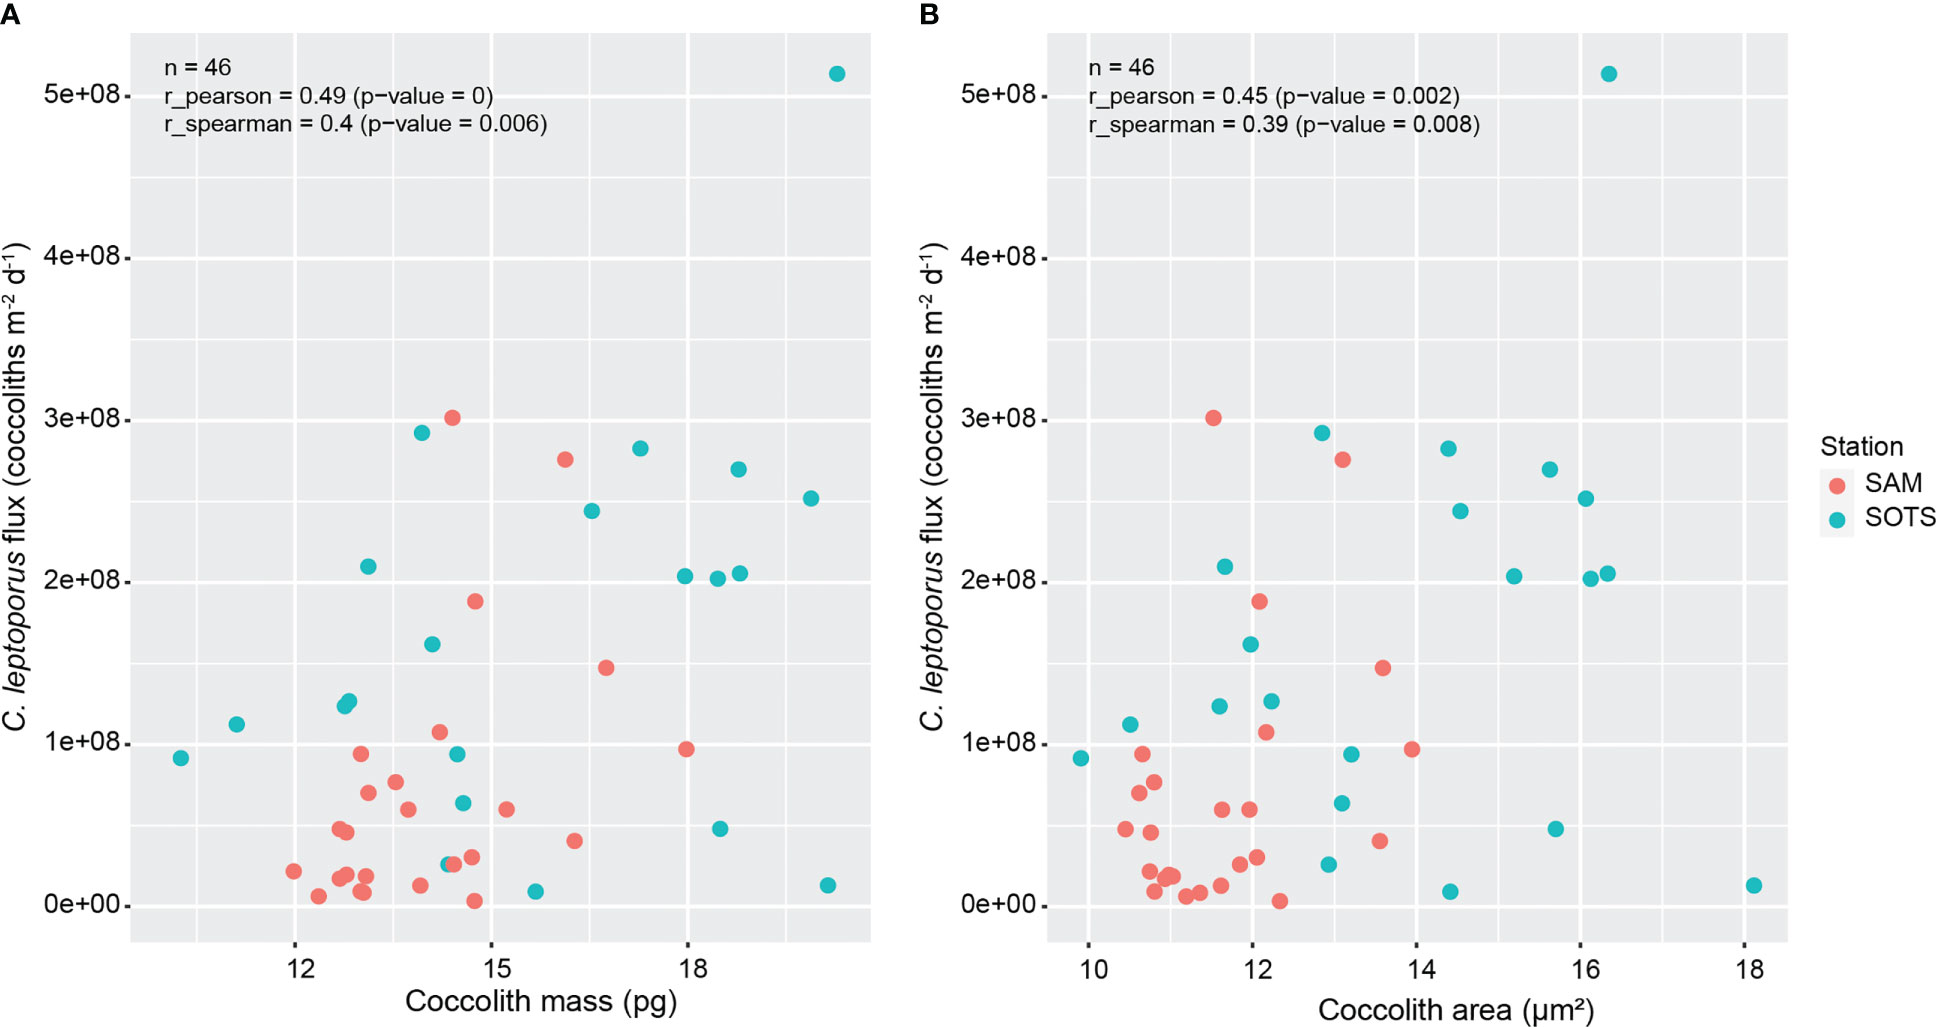
Figure 3 Regression plots showing Pearson and Spearman correlation coefficients between coccolith fluxes and coccolith mass (A) and area (B) for the SOTS and SAM sediment trap stations.
2.4.3 Comparison between sediment trap and seafloor sediment coccolith assemblages
Coccolith assemblages from the uppermost layers of the seabed sediments represent an integrated assemblage of the past hundreds to thousands of years, thereby providing a robust baseline of the coccolithophore assemblages during the pre-industrial state of the ocean. Similarly, annual sediment trap records can be used to provide a picture of the current state of modern coccolithophore assemblages. However, to be able to compare the coccolith morphometric parameters measured in the surface sediment assemblages with those measured by the traps it is necessary to eliminate the effect of seasonality in the sediment trap records. This can be accomplished by estimating a flux-weighted average of the coccolith morphometric parameters measured in the sediment traps. The flux-weighted values allow direct comparison with the surface sediment assemblages, assuming that seasonality in coccolithophore fluxes have remained similar to modern conditions over the time span represented by each Holocene-aged seafloor sample (e.g. King and Howard, 2005). To evaluate the possible morphometric variations of C. leptoporus coccoliths during the industrial era (prior ca. 1750; Pachauri et al., 2014), the sediment trap and Holocene-aged sediment assemblages were compared using the weighted Kolmogorov-Smirnov test (Monahan, 2011). The Kolmogorov-Smirnov tests consists of a two-sample distribution-free test designed to identify possible deviations from the null hypothesis that the distributions of the two compared data sets are identical. If the p value is smaller than 0.05 then the hypothesis is rejected, i.e., the distributions of a given morphometric parameter in the two populations compared are significantly different.
2.4.4 Environmental controls on coccolith morphometrics from the late deglaciation to modern
To explore the possible response of C. leptoporus to environmental variability on millennial time scales, a CCA following the same procedure explained in section 2.4.1 was performed. For the coccolith morphometric data, an average between the annual-flux weighted coccolith morphometrics of the SAM and SOTS traps was used to represent the modern C. leptoporus populations in the subantarctic zone, while samples from core Y16 were used to represent coccolith morphometric variations throughout the Deglaciation and Holocene in the SAZ. The following suite of environmental variables relevant for coccolithophore physiology were used in the analysis: annual insolation, alkenone-derived SSTs, iron concentration, atmospheric CO2 concentration and surface-water pCO2. Alkenone-derived SSTs from core MD97-2120 were obtained from Pahnke and Sachs (2006) (modern SSTs obtained from the summer months for the same location), annual solar insolation for the 47°S latitude from Laskar et al. (2004), iron concentration from core SO136GC-38 after Durand et al. (2017) (iron concentration for modern conditions was derived from the most recent sample of the sediment core dated in 1.7 kyr), atmospheric CO2 concentration from the Antarctic ice core composite by Bereiter et al. (2015) (modern value from SOTS site after Shadwick et al. (2015)), and surface-water pCO2 from core MD97-2106 (Dai et al., 2022) and Shadwick et al. (2015) (for the most recent sample). As the ages of proxy measurements did not coincide with that of the Y16 samples, the values of the environmental parameters for the analyzed samples of Y16 core were calculated through linear interpolation.
A full model containing all the environmental parameters was calculated: Mass + Area ~ SST + atm.CO2 + pCO2 + Fe_conc + Insolation. Then, a correlation matrix between all parameters was estimated. As some of the variables exhibited high correlations, the VIF of the environmental variables was calculated and yielded the following results: 2.18 for SST, 526.56 for atm.CO2, 429.64 for pCO2, 18.72 for Fe_conc and 44.82 for insolation. As some of the coefficients were greater than 5 (i.e. the threshold above which multicollinearity is considered high), the double stepwise method was applied to obtain models that decrease the AIC of the complete initial model. The model with the minimum AIC was Mass + Area ~ atm.CO2 + pCO2 + Fe_conc + Insolation. However, as some of the variables still exhibited high VIFs (516.43 for atm.CO2, 425.56 for pCO2, 17.65 for Fe_conc and 40.54 for insolation), the parameter with the highest value (i.e. atm.CO2) was removed from the model. Thus, the resulting model was Mass + Area ~ pCO2 + Fe_conc + Insolation. As this model did not longer exhibited collinearity for any of the environmental parameters (with VIF values of 2.52 for pCO2, 2.49 for Fe_conc and 2.25 for insolation), it is the one we used in our interpretations.
3 Results
3.1 Calcidiscus leptoporus morphotypes
All samples were analyzed under the SEM for C. leptoporus morphotype identification. A total of 98 and 146 coccoliths were identified to morphotype level for the SOTS and SAM sediment trap records. In both records, 97% of the C. leptoporus coccoliths identified belong to the Intermediate form while 3% corresponded with the Small type. For the seafloor sediment samples a total of 193 and 86 were analyzed for the Australian and New Zealand sectors of the Subantarctic Zone, respectively. The Intermediate form largely dominated the seafloor sediment assemblages, accounting for 98% and 100% of the identified coccoliths, respectively. Lastly, analysis of 255 coccoliths from the Y16 sediment core indicates that dominance of the intermediate form also held true during the last ~14 Kyrs (100% of all the coccoliths analyzed). Morphotype identification was not possible for samples older than ~14 Kyrs due to the stark decrease in C. leptoporus abundance in the deepest section of the sediment core.
3.2 Seasonal variations in C. leptoporus morphometrics at the SOTS and SAM sites
A total of 481 and 628 C. leptoporus coccoliths were analyzed morphometrically for the SOTS and SAM sediment-trap samples, respectively. The seasonal morphological variations of C. leptoporus were roughly similar at the SOTS and SAM sites, although the seasonal amplitude of the changes were more pronounced at the SOTS site (Figure 2). Coccolith mass, area and thickness were highest in winter and/or early spring at both SOTS and SAM sites. The main morphometric parameters exhibited a decrease towards autumn at SOTS, while the same parameters remained relatively stable during summer and autumn at the SAM site.
The annual flux-weighted average of coccolith mass, area and thickness at SOTS were 16.7 ± 7.4 pg (average ± standard deviation), 14.3 ± 5.5 µm2 and 0.42 ± 0.05 µm, respectively. These values were similar, although slightly higher, than those documented at the SAM site with 14.8 ± 6.8 pg, 12.1 ± 4.9 µm2 and 0.45 ± 0.04 µm, respectively. It is important to note that the average size of the C. leptoporus coccoliths measured in the traps in the current study (diameter of 4.41 ± 0.83 µm for the SOTS site and 4.11 ± 0.82 µm for the SAM site; average ± standard deviation) are lower than that previously reported for this species using data from the two stations in Rigual-Hernández et al. (2020c) (6.39 ± 1.49 µm). Two factors likely account for these different results. Firstly, in the present study, C. leptoporus coccoliths were measured for all samples covering a full annual cycle for both sediment traps sites, and then all morphometric data were flux weighted. In contrast, in the previous study (Rigual-Hernández et al., 2020c) C. leptoporus coccoliths were measured from seven samples selected from two different sediment trap depths at the SOTS site (1000 and 2000 m) and one depth at the SAM site (1500 m), and values were not flux weighted. It is possible that the morphometrics of the C. leptoporus coccoliths collected in these selected samples were not representative of the average annual C. leptoporus coccoliths sinking in the SAZ. Secondly, the visual coccolith selection procedure used in Rigual-Hernández et al. (2020c), after initial automated selection by the C-Calcita software, may have under-represented small coccoliths, because these tended to have organic debris attached more often than the larger ones. Given these considerations, the morphometric data produced in the current study should be taken as a baseline for the modern state of C. leptoporus coccolith assemblages, while the morphometric values of the C. leptoporus coccoliths in Rigual-Hernández et al. (2020c) should be viewed as an upper estimate of the morphometric parameters of the coccoliths of C. leptoporus populations dwelling in the SAZ.
Calcidiscus leptoporus coccolith fluxes were significantly correlated with coccolith mass (Spearman rho = 0.40, p value < 0.01; Figure 3A) and area (Spearman rho = 0.39, p value < 0.01; Figure 3B) but uncorrelated with coccolith thickness (Spearman rho = 0.17, p value > 0.01; data not plotted in Figure 3).
The results of the CCA in the SOTS sediment trap record suggest that photosynthetically active radiation (PAR), water temperature in the surface layer and silicate concentration are the main predictors of C. leptoporus coccolith morphometrics (Figure 4). The CCA results also indicate a secondary contribution of phosphate concentration on coccolith morphometrics. The first axis accounted for most of the inertia (99.6%) and was positively related with phosphate and temperature and negatively with PAR and silicate. Both coccolith mass and area are related with high silicate concentration and PAR and with low phosphate concentration and temperature (Figure 4).
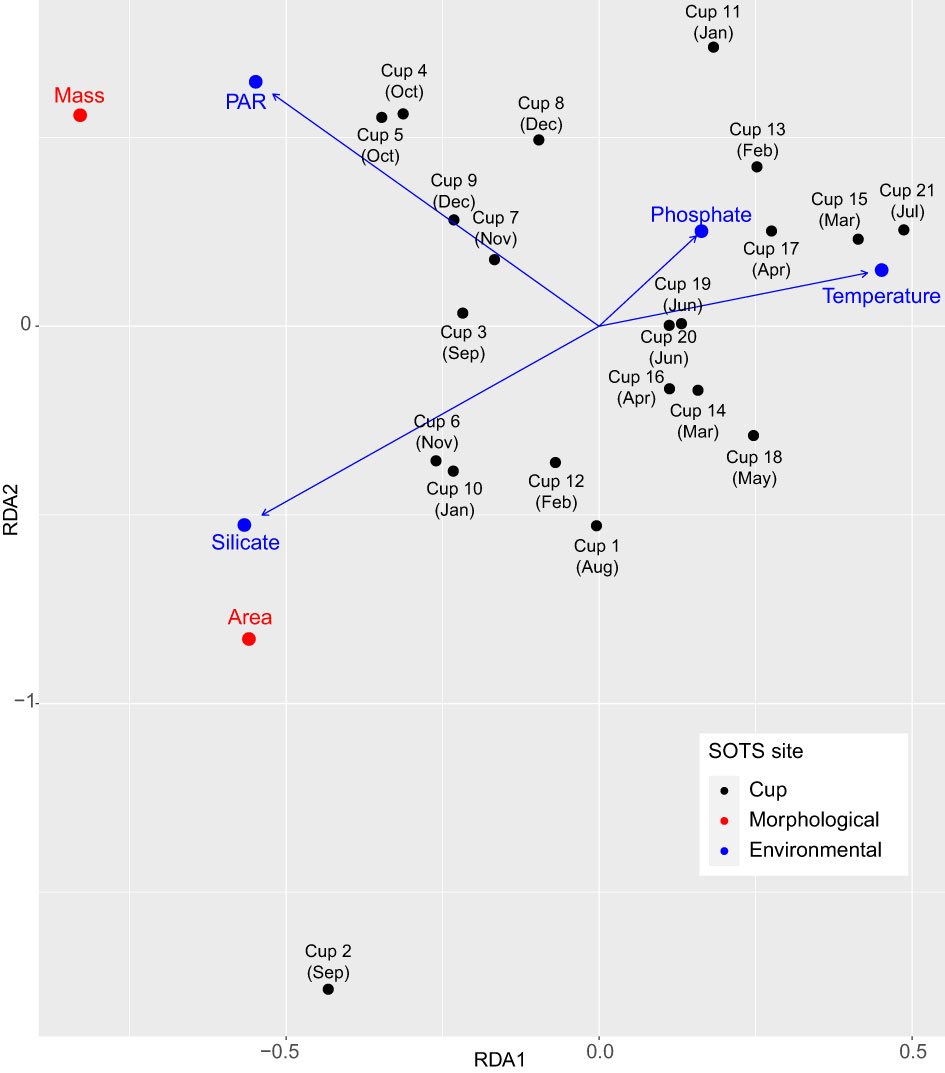
Figure 4 Canonical Correspondence Analysis (CCA) after model selection showing the relation between the temporal changes in coccolith morphometrics of C. leptoporus from different cups (i.e. each sediment trap sample) throughout the year (2011-2012) at 1000 m depth at SOTS and environmental factors measured in situ at SOTS (blue arrows) during the same interval after variable selection (see Rigual-Hernández et al., 2020b for further details) with Akaike information criterion (AIC). Arrows indicate the direction and relative importance (arrow lengths) of each environmental parameter on each axis. PAR, photosynthetically active radiation.
3.3 Sediment trap and seafloor sediment comparison
The coccolith mass, area and thickness for the sediment traps and Holocene sediments are summarized in Figure 5. A total of 370 C. leptoporus coccoliths were analyzed from the seafloor sediment samples. Since part of the seabed sediment samples retrieved in the subtropical zone displayed important differences with those of the subantarctic zone (Figure 5), these samples were excluded for the comparison with the SOTS and SAM sediment traps (both deployed in the SAZ). Moreover, correlation analysis revealed that a significant correlation between of morphometric parameters and depth exists (Supplementary Figure 2), implying that larger and heavier C. leptoporus coccoliths are found in the deepest seabed samples most likely due to selective dissolution of the weakest (lightest) forms. When samples retrieved beneath the calcite saturation horizon (minimum depth at 3200 and 2800 in the Australian and New Zealand sector of the SAZ, respectively; Bostock et al., 2011) are excluded, the correlations between morphometric parameters and depth become non-significant, suggesting that the coccoliths from samples above the calcite saturation horizon were unbiased by calcite dissolution (Supplementary Figure 2). Consequently, only seabed samples collected above the calcite saturation horizon were considered for the comparison with the modern (sediment trap) C. leptoporus assemblages.
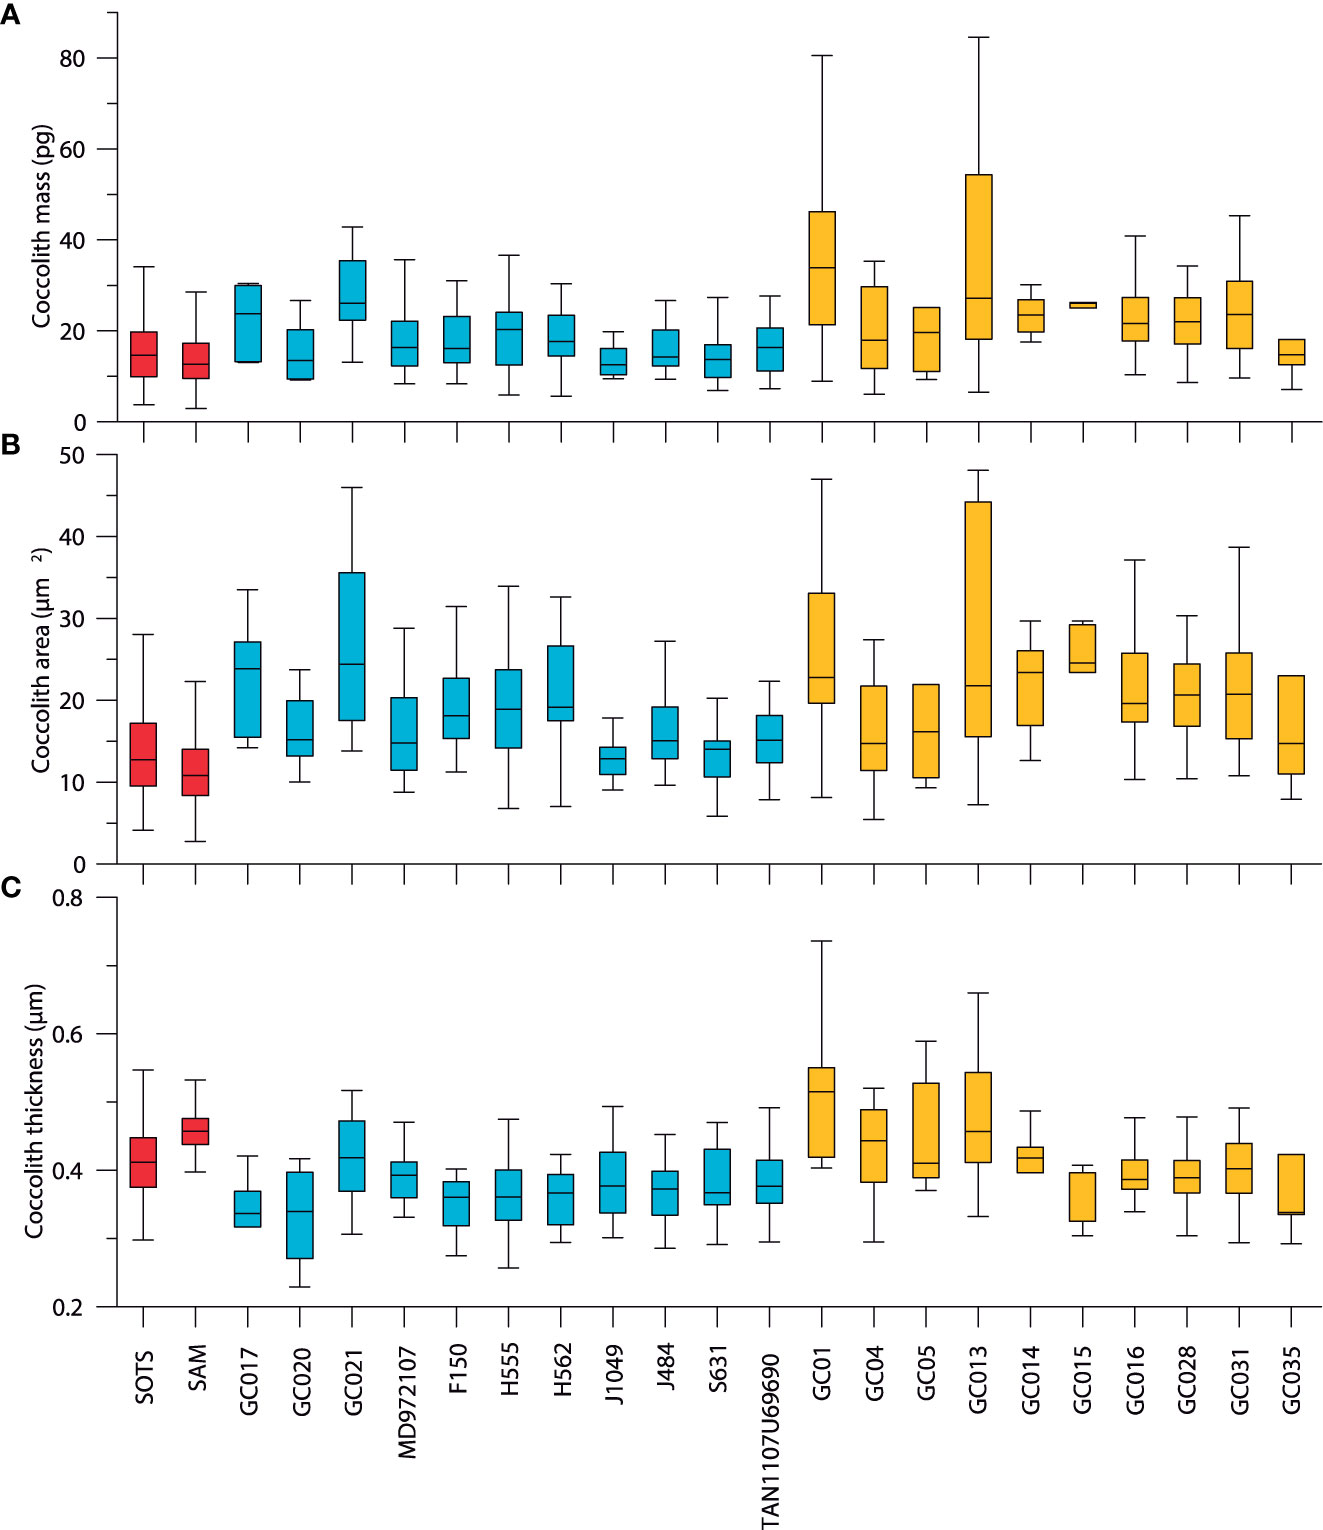
Figure 5 Box and whisker plots showing C. leptoporus coccolith mass (A), area (B) and thickness (C) of the SOTS and SAM sediment trap time series (non-flux-weighted values; red) and Holocene seafloor sediment samples from the subantarctic (dark blue) and subtropical sediments (yellow) samples in the Indian and Pacific waters south of Australia and New Zealand. The median value is displayed as a solid bar within the box, the upper and lower edges of the boxes represent the 75th and 25th percentiles while the whiskers indicate ± 1.5-times the interquartile range (IQR).
The results of the Kolmogorov-Smirnov test indicate that modern subantarctic C. leptoporus coccoliths collected by the traps are 12% lighter and 24% smaller (in terms of coccolith mass and area, respectively) than those preserved in the Holocene-aged sea-floor samples (Figures 6A, B). Coccolith thickness, however, shows an opposite trend with coccoliths intercepted by the traps exhibiting 16% thicker coccoliths (i.e. calcification per surface area of the coccolith) than those preserved in the sedimentary record (Figure 6C). Therefore, the increase in coccolith thickness is not sufficient to compensate the coccolith mass loss between the pre-industrial and modern eras.
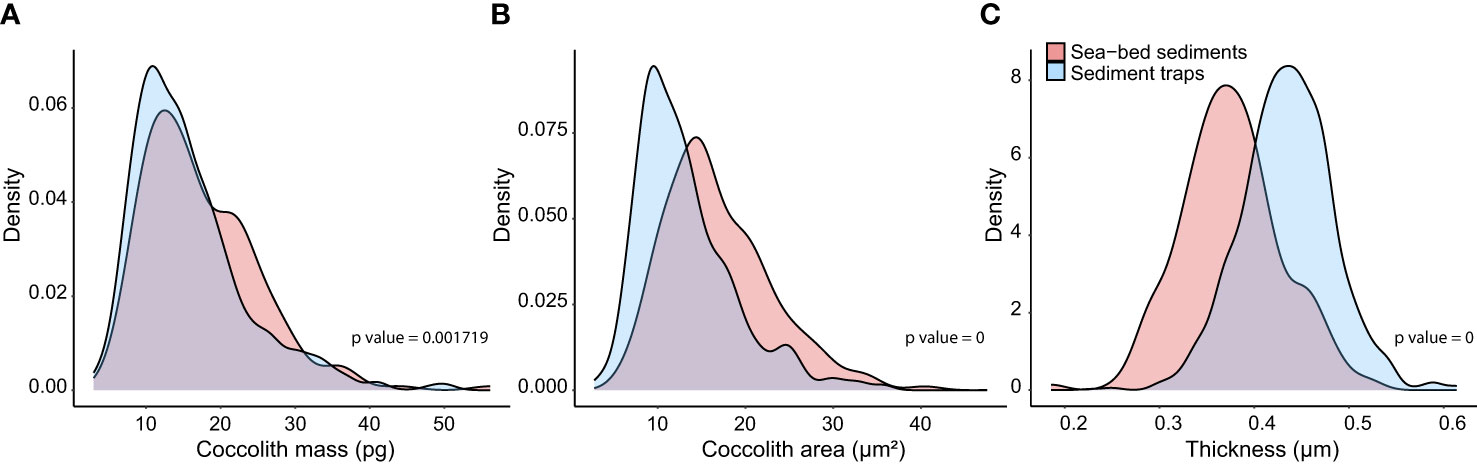
Figure 6 Weighted densities of the distribution of Calcidiscus leptoporus coccolith mass (A), major axis (B) and thickness (C) between the flux-weighted data of the SOTS and SAM sediment traps together (representative of modern populations) and subantarctic seafloor sediment samples above 3200 m grouped together (representative of mid- to late Holocene assemblages).
3.4 Environmental controls on coccolith morphometrics throughout the late deglaciation and the Holocene in the Subantarctic Zone
The abundance of C. leptoporus coccoliths was very low before the Late Deglaciation (i.e. before ~14 kyr) (Supplementary Figure 4), therefore the morphometric characterization of C. leptoporus coccoliths was only possible for the most recent nine samples of Y16 sediment core. Coccolith area displayed a slight decrease from the late Deglaciation towards the early Holocene and then, it exhibited a gradual decrease towards the present (Figure 7B). Coccoliths mass displayed relatively stable values until the mid-Holocene, when an increase in coccolith mass is observed between 7 and 6 kyr, then the values decreased steadily towards the present (Figure 7B). Coccolith thickness decreased from the late Deglaciation until ca. 8 kyr and then increased gradually towards the present with a peak between 5.6 to 4.6 kyr.
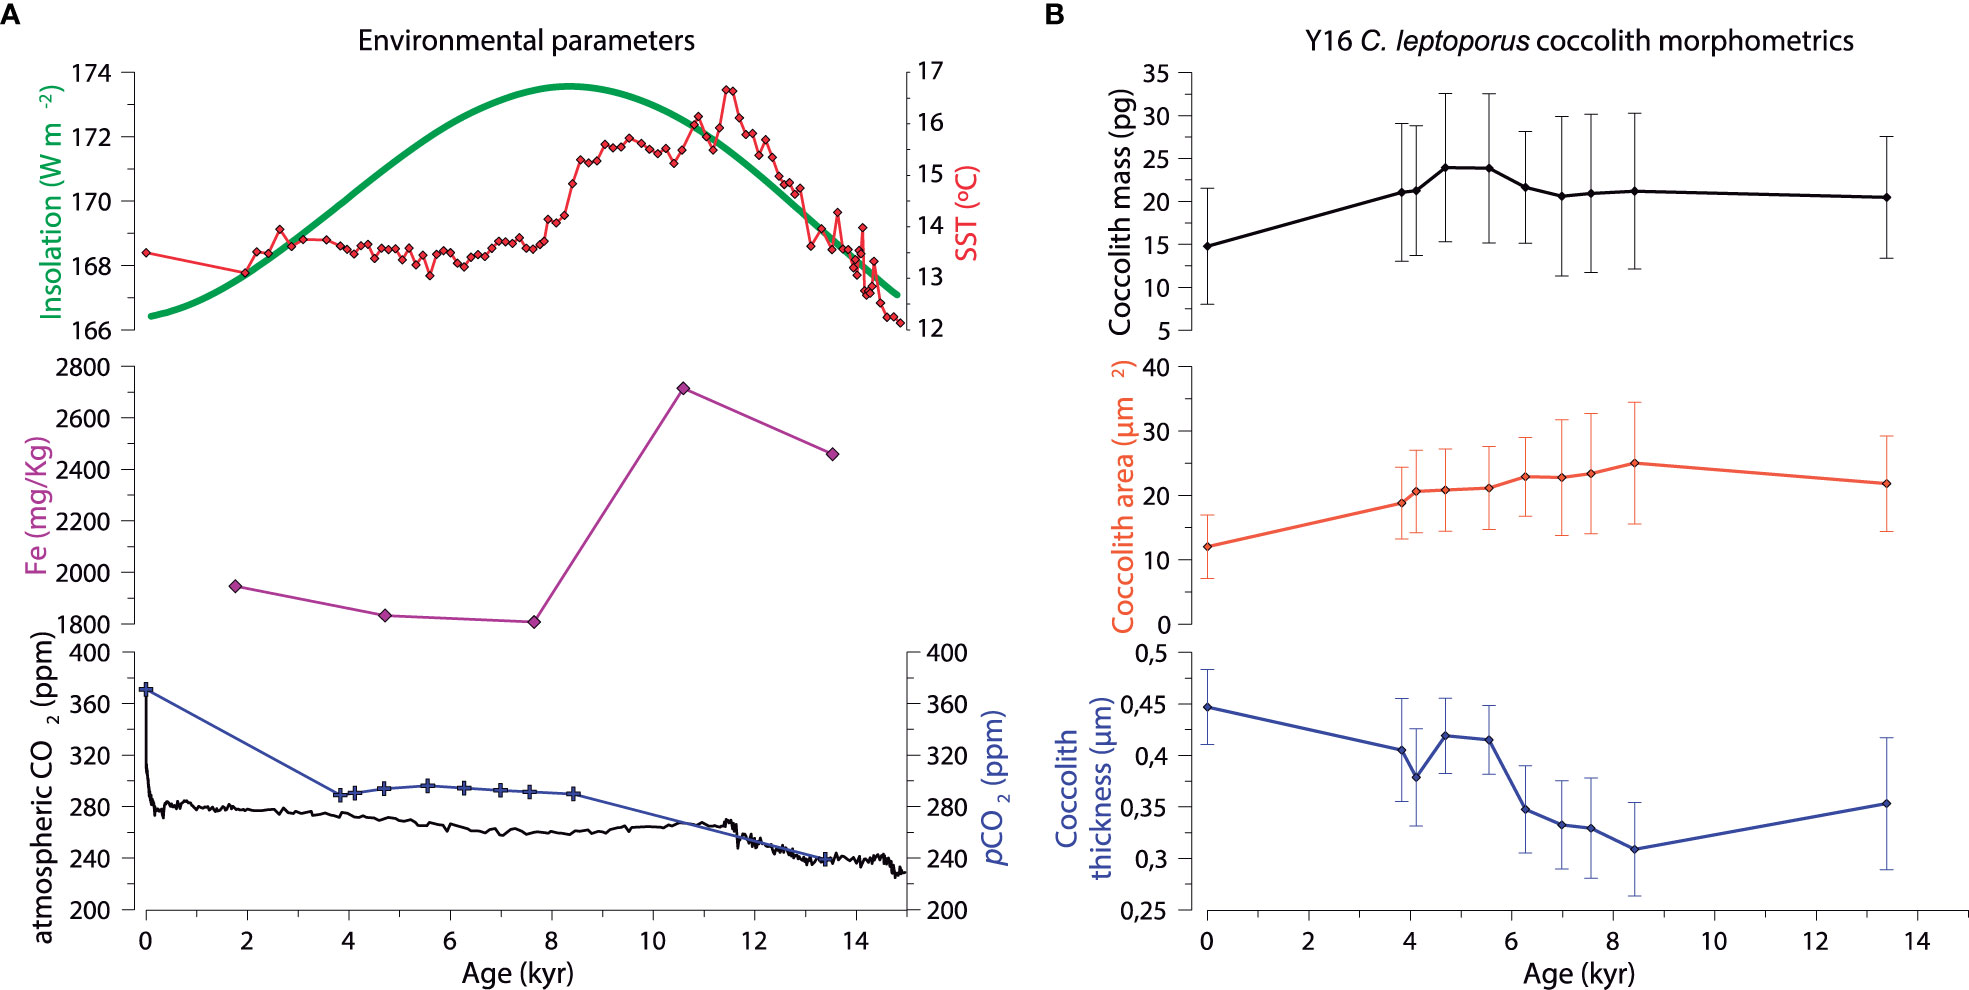
Figure 7 (A) Evolution of key environmental parameters throughout the Late Deglaciation and Holocene in the SAZ south of New Zealand and Australia (see section 2.4.1 for more details). (B) C. leptoporus coccolith mass, area and thickness from sediment core Y16.
The CCA results (Figure 8) indicate that changes in insolation, pCO2 variations and changes in iron concentration from the deglaciation until present (Figure 7A) accounted for 100% of the total inertia in the dataset. Both insolation and pCO2 were the main predictors of coccolith area and mass changes, while iron input played a secondary role (Figure 8). The first axis explained most of the inertia (92%) and was mostly positively related with insolation and negatively with pCO2. The second axis explained 8% of the variability and was mostly related with iron concentration (Figure 8). High values of coccolith area and mass were positively related with high insolation and negatively with dissolved CO2, while iron input, although secondary, was positively related with coccolith mass and negatively with coccolith area.
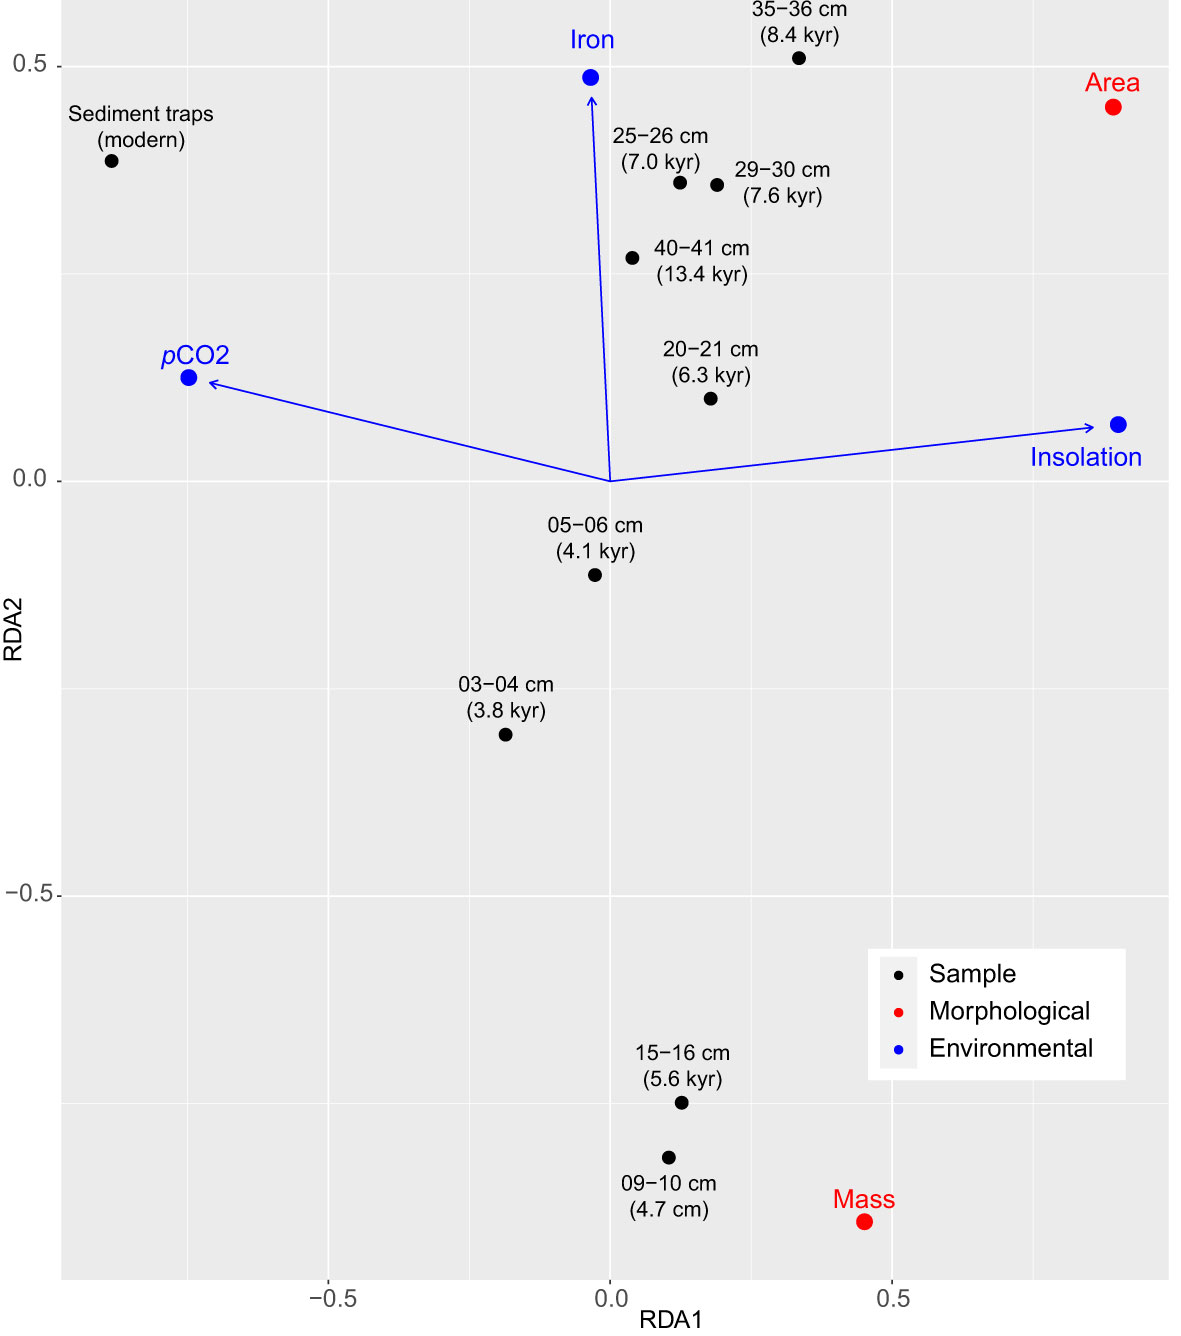
Figure 8 Canonical Correspondence Analysis (CCA) after model selection showing the correlation between C. leptoporus coccolith mass and area and key environmental factors for the last 14 kyrs in the SAZ. Blue arrows indicate the directions and relative importance (arrow lengths) of each environmental factor on each axis. Iron – iron concentration in the seafloor; pCO2 – surface layer CO2 partial pressure; insolation – annual insolation at 47°S latitude (see section 2.4.4 for more details).
4 Discussion
4.1 Seasonal environmental controls on C. leptoporus coccolith morphometrics
The high-resolution monitoring of water column properties at the SOTS observatory (Trull et al., 2010; Eriksen et al., 2018; Shadwick et al., 2022) allows us to assess which environmental parameters represent the main controls on C. leptoporus coccolith morphometrics on seasonal timescales. As the growth rate of C. leptoporus in culture has been estimated as ca. 0.5 divisions d-1 (Renaud et al., 2002; Langer et al., 2012) and the sediment trap sampling resolution varied between 16 and 8 days, the delay of C. leptoporus response to environmental variations in the surface layer is considered negligible in our study. Our analysis indicates that many environmental parameters known to influence coccolith morphometrics (e.g. temperature, seawater carbonate chemistry, nutrients, salinity, among others) exhibit considerable covariation throughout the annual cycle, thereby hampering the identification of the main predictors. The use of the Akaike criterion (see methods) allowed us to reduce the number of possible predictors determining coccolith morphometrics to three: nutrient concentrations, PAR and temperature (Figure 4).
The CCA results suggests that macronutrients have contrasting roles in the controls of coccolith morphometrics. On the one hand, the weak relationship of C. leptoporus coccolith morphometrics with phosphate and lack of relationship with nitrate (Figure 4) suggest that these two macronutrients play a negligible to minor role in the controls of C. leptoporus coccolith dimensions. These results are not surprising since laboratory evidence indicates that phosphate and nitrate concentrations do not influence coccolith morphology in C. leptoporus (Langer et al., 2012) and also because phosphate and nitrate levels never reach limiting concentrations in the subantarctic surface waters south of Tasmania (Supplementary Figure 3). On the other hand, the CCA analysis reveals that seasonal changes in silicate concentration are positively related with both coccolith mass and area (Figure 4). Durak et al. (2016) demonstrated that silicate is an essential nutrient for coccolith formation for a group of coccolithophores species, that includes C. leptoporus, characterized by the presence of diatom-like silicon transporters (SITs). The subantarctic waters south of Tasmania are characterized by low silicate concentrations year-round (<4 to 5 μmol l-1; Rintoul and Trull, 2001; Fripiat et al., 2011) and typically reach limiting concentrations (thought to be ~1 µM (Paasche, 1973) or possibly considerably higher in Southern Ocean species (Frank et al., 2000)) after a diatom bloom takes place at the onset of the productive period (Dugdale et al., 1995; Lannuzel et al., 2011; Rigual-Hernández et al., 2015; Eriksen et al., 2018). In situ nutrient measurements at SOTS during our sampling interval, indicate that silicate concentration dropped below 2 μM in early December (Supplementary Figure 3) and remained below this threshold until July. It is during this interval of low silicate concentration when the lightest and smallest coccoliths are observed (Figure 2). This correlation might point to an effect of low Si concentration on coccolith mass in C. leptoporus. However, experimental studies analyzing the effect of low Si concentration on coccolith formation are rare and focus on coccolith malformations rather than size. The few data available suggest that Si concentrations need to be as low as 0.2 µM to affect coccolith morphology (Langer et al., 2021). Another possibility is that the silicate in our correlations is acting as a proxy for dissolved iron, which is also seasonally depleted in subantarctic waters (Sedwick et al., 1999; Frank et al., 2000; Boyd et al., 2001). The results presented here clearly warrant further studies analyzing the effect of different Si concentrations on coccolith size or mass.
The identified positive relation of PAR with coccolith mass and area on seasonal scale appears logical as calcification is a light dependant-process (Paasche, 2002; Zondervan, 2007, and references therein) and because light is a limiting factor for phytoplankton growth in the SAZ as a result of deep summer mixed layers (70-100 m; Rintoul and Trull, 2001) and cloudiness (Bishop and Rossow, 1991). The few available laboratory data on the effect of temperature on C. leptoporus coccoliths morphometrics indicates that some strains of C. leptoporus might be sensitive to low light levels reducing their diameter up to ~0.7 µm (Quinn et al., 2003). However, it should be noted that Quinn et al. (2003) documented different responses across the strains analyzed, with some of them being unaffected by low-light stress. Moreover, several studies have documented that calcification in the model coccolithophore species E. huxleyi decreases at low irradiances (Paasche, 1999; Zondervan et al., 2002) most likely as a result of a lower amount of calcite deposited in each coccolith and the lower number of coccoliths produced per cell (Paasche, 1999). Based on all the above, light availability could account for at least part of the seasonal coccolith area variations documented in the traps.
Water temperature is identified as an important environmental predictor in coccolith morphometrics by our CAA analysis. This possibility is likely since Sea Surface Temperature (SST) has been suggested to play an important role in the biogeographical and seasonal distribution of C. leptoporus morphotypes, yet conflicting results have been reported (Knappertsbusch et al., 1997; Renaud et al., 2002; Sáez et al., 2003). The overwhelming dominance of the intermediate morphotype (i.e. C. leptoporus ssp. leptoporus) in the SAZ traps and sediments is consistent with previous onboard observations in the study region (Malinverno et al., 2015; Saavedra-Pellitero and Baumann, 2015) and suggest a successful adaptation of this morphotype to the cold and nitrate and phosphate-rich waters of the subantarctic Southern Ocean. Laboratory culture experiments by Quinn et al. (2003) demonstrated that cold water temperatures can induce a diameter reduction of up to 0.5 µm on monoclonal cultures of the Intermediate morphotype. As both minimum and maximum annual coccolith area values are observed in winter (Figure 2), the relationship of water temperature with coccolith area is not clear at SOTS. However, it should be noted that the seasonal variability in water temperature at SOTS is tiny (~3°C) and substantially smaller than that used in Quinn et al.’s experiment (~12°C). Therefore, it is likely that the opposite relationship with temperature in our study and larger variability on coccolith diameter (~1.2 µm) is not driven by temperature change.
Moreover, it is worth noting that TCO2 changes could have also influenced coccolith morphometrics on a seasonal time scale even though this parameter was excluded from the final CCA model owing to its high correlation with silicate concentration (r=0.95; n = 21). Changes in seawater carbonate chemistry are widely known to influence coccolithophore calcification (e.g. Langer et al., 2006; Beaufort et al., 2011; Meier et al., 2014). Interestingly, and similar to previous results of E. huxleyi coccoliths in our study sites (Rigual-Hernández et al., 2020b), larger and heavier C. leptoporus coccoliths were recorded at times of peak annual TCO2 (Supplementary Figure 3).
Based on all the above, it can be concluded that variations in silicate concentration and light are the most likely seasonal controls on coccolith morphometrics (mass and area) in the modern subantarctic zone although the influence of other environmental parameters, such as TCO2, cannot be ruled out.
4.2 Evolution of Calcidiscus leptoporus coccolith morphometrics from the late deglaciation to the modern
Comparison of the C. leptoporus coccoliths intercepted by the traps with those from the seafloor sediments indicate that the modern subantarctic C. leptoporus populations produce about 15% lighter and 25% smaller coccoliths (in terms of coccolith mass and area, respectively) than those of the preindustrial Holocene. Coccolith thickness is the single morphometric parameter that displays higher values in the sediment trap (i.e. modern) assemblages, being about 15% thicker than the assemblages preserved in the seafloor sediments. Three mechanisms, operating alone or in combination, could be responsible for the observed morphometric variations of C. leptoporus coccoliths throughout the late Holocene in both sectors of the SAZ: calcite dissolution, a dominance shift in the assemblage and/or a physiological response of the dominant morphotype to an environmental change. Disentangling the potential effects of each of these factors is an essential prerequisite for a meaningful interpretation of the observed morphometric variations throughout the Holocene until present.
1) Calcite dissolution in the water column and/or sea floor could induce changes in the coccolith morphology of C. leptoporus assemblages preserved in the sedimentary record. For example, partial dissolution of the coccoliths could reduce the mean mass and diameter of the original C. leptoporus assemblages (Jin et al., 2019; Rigual-Hernández et al., 2020a), whereas selective dissolution of the smallest and/or lightest coccoliths could cause the opposite effect. As mentioned above, previous research at SOTS indicate that coccoliths (Rigual-Hernández et al., 2020b) and planktonic foraminifera shells (Moy et al., 2009) experience negligible changes during their transit between meso- and bathypelagic depths, thereby ruling out the possibility of dissolution during their transit throughout the water column. Secondly, all the seafloor sediment samples used in our analysis were retrieved above the calcite saturation horizon. Lastly, SEM observations of all sediment samples shows a good preservation for most of the C. leptoporus coccoliths indicating the calcite dissolution did not have an important impact on the seafloor assemblages. Based on these lines of evidence, it can be concluded that calcite dissolution played a negligible role in the observed coccolith morphometric variations between seabed and sediment trap data sets.
2) A shift in the abundance of the dominant morphotype could lead to a change in the average of a given coccolith morphometric parameter, e.g. an increase in the relative abundance of larger morphotypes would result in an increase in the average area of the population. However, observation of all samples under the SEM indicates that the C. leptoporus assemblages preserved in the trap and sedimentary records are nearly completely composed of the sub-species leptoporus (intermediate morphotype). This observation is in agreement with previous research of modern plankton assemblages (Malinverno et al., 2015; Saavedra-Pellitero and Baumann, 2015) and renders the possibility of an “ecologically” driven change (Bach et al., 2012) in coccolith morphology unlikely.
3) A change in one or several environmental parameters could induce a response of the dominant C. leptoporus strain or morphotype, thereby driving a “physiologically” driven change in the average of a given coccolith morphometric parameter. Since calcite dissolution and a shift in the dominant C. leptoporus morphotype can be disregarded as possible factors of such a change, next the possible influence of key environmental factors that could have induced a “physiologically” driven change in the subantarctic C. leptoporus assemblages is discussed.
Our CCA analysis (Figure 8) identifies variations in surface-water CO2 partial pressure (pCO2) from the Late Deglaciation to the modern to be significantly and negatively correlated with coccolith area (Figure 8). The increasing atmospheric CO2 levels and resulting reduction in seawater carbonate ion concentration and ocean pH (Feely et al., 2004; Doney et al., 2009) are known to impact coccolithophore growth rate, photosynthesis, calcification and morphology (Riebesell et al., 2000; Langer et al., 2009; Langer and Bode, 2011; Lefebvre et al., 2012; Bach et al., 2013; Schlüter et al., 2014b; Müller et al., 2015). However, CO2 perturbation experiments on C. leptoporus by Langer et al. (2006) showed that cellular inorganic carbon content displays a nonlinear relationship with CO2 concentrations: PIC cellular content increased steadily from ~100 µatm to ~350 µatm, and then decreased at CO2 values >470 µatm. Based on these laboratory observations, an increase in coccolith size (i.e. area) and mass, which are directly related to PIC cellular content (Langer et al., 2006), should be expected between preindustrial Holocene CO2 levels of roughly 240 ppmv to present ~400 ppmv instead of diminishing as shown by our results. However, the response of natural C. leptoporus populations may be different than that observed in monoclonal cultures due to the larger genetic variability within natural populations, longer timescales and the interplay between multiple stressors which may offset or amplify the effects of single drivers (Reusch and Boyd, 2013; Collins et al., 2014; Feng et al., 2017). Lastly, it is important to note that the CCA results are markedly influenced by the most recent sample (Figure 8), that exhibit substantially higher pCO2 values (between 80-130 μatm) than the pre-industrial samples. Therefore, our data provides no clear evidence that ocean carbonate chemistry alone has an appreciable contributory role to overall variation in coccolith size and area throughout the last 14 kyrs but may represent an important control on C. leptoporus physiology during the industrial era.
Moreover, the CCA results also indicate that changes in insolation at 47°S latitude are positively related with variations of coccolith area and mass (Figure 8). As light limitation is known to represent an important control on phytoplankton productivity in the SAZ (Deppeler and Davidson, 2017), it is likely that changes in insolation alone and/or in combination with changes of mixed layer depths (largely determined by insolation changes) could have induced a physiological response on C. leptoporus. However, it could be argued that the insolation variation from the late Holocene (~4 Wm-2) until present is too small to be directly responsible for the rapid and pronounced reduction in coccolith mass and area observed between preindustrial and industrial datasets (Figure 6). Lastly, the CCA also suggests a secondary contribution of iron concentration in the controls of coccolith morphometrics (Figure 8). Iron transported into the SAZ as mineral dust is known to play an important role in coccolithophore physiology (e.g. Balch, 2018, and references therein). However, its opposite effect on coccolith mass and limited variability explained by the second CCA axis (mostly related with iron concentration) suggests that the influence of iron could be an artifact result of the limited sample size of the study. Therefore, our results suggest that insolation could represent a possible modulating factor —direct or indirect— of the physiology of subantarctic C. leptoporus populations from the Late Deglaciation and most of the Holocene but its role during the Late Holocene to the modern is less clear.
It should be acknowledged that the effect of other factors aside from the ones identified in our analysis could have also exerted and important role in the observed coccolith morphometric variability. This is due to three reasons. Firstly, it is possible that important environmental parameters, not considered in our study owing to the lack of data availability (e.g. nutrient concentrations), may have played an important role in coccolith morphometrics on millennial time scales. Secondly, it is likely that the observed variations in coccolith area and mass are the result of an additive, antagonistic or synergistic effect of multiple drivers (e.g. De Bodt et al., 2010; Feng et al., 2018; Beusen et al., 2022), not captured by our analysis. Thirdly, the number of samples available for the analysis is low, and therefore existing relationships with environmental parameters might not be identified. For example, changes in SSTs show a medium correlation with coccolith area (0.4). It is possible that a larger sample size might have yielded additional information not drawn from the present study. Therefore, although ruled out by the Akaike criterion water temperature variations (i.e. SST) could have contributed to the observed coccolith morphometric changes since the late Deglaciation, as it represents a critical control on coccolithophore growth rates (Buitenhuis et al., 2008) and species distribution in the Southern Ocean (Findlay and Giraudeau, 2000; Charalampopoulou et al., 2016; Patil et al., 2017; Rigual-Hernández et al., 2020c; among others). Moreover, long-term incubations of subantarctic polyclonal E. huxleyi populations suggest that this species will decrease its cellular volume and PIC production by the year 2100 due to the synergistic or additive effect of warming and pH decrease (Armstrong and Law, 2023 (in press)). Given that coccolith volume has been documented to be strongly correlated to cell volume in E. huxleyi (Müller et al., 2021), the decrease in C. leptoporus coccolith mass (which equals to coccolith volume multiplied by the density of calcite; Young and Ziveri, 2000) during the Late Holocene and/or industrial era could be interpreted as a reduction in cell volume. Interestingly, cell size reduction is a common response of coccolithophores and other phytoplankton to combined warming and decreased pH (Atkinson et al., 2003; Finkel et al., 2009; De Bodt et al., 2010; Schlüter et al., 2014a). As subantarctic waters are experiencing rapid warming (~0.3°C increase per decade since 1992; Auger et al., 2021) and acidification (McNeil and Matear, 2008), our results suggest that the combined effect of changes in these parameters since the onset of the industrial era could potentially account for a substantial part, if not all, of the differences between pre-industrial and industrial data sets.
Extrapolation of our results suggests that if the significant reduction in C. leptoporus coccolith size (i.e. area) and mass during the Holocene to the modern will continue in the future, it will result in a reduction of the ballasting capacity of this species and consequently the efficiency of the organic carbon export in the SAZ. Moreover, as primary production consumed by microzooplankton is known to be negatively correlated with cell size (Chen and Liu, 2010), the reduction in cell size of C. leptoporus will most likely facilitate microzooplankton grazing of this species. An increase in grazing could, however, exert opposing effects on the efficiency of the biological pump. On the one hand, enhanced micrograzing could imply a more efficient biological pump in the SAZ, as the efficient repackaging of carbon for deep transport by the zooplankton community has been hypothesized to account for the greater relative POC content of the particles sinking in the SAZ compared to other Southern Ocean zonal systems further south (Trull et al., 2001; Ebersbach et al., 2011). On the other hand, an increase of microzooplankton grazing rates may facilitate organic carbon remineralization in the upper water column, thereby diminishing the carbon export associated with coccolithophores. Future mesocosm studies examining the effects of coccolith size on ballasting efficiency of faecal pellets and algal aggregation will be needed to determine the impact of shifts in dominant coccolithophore size classes on the marine carbon cycle.
4.3 Possible application of coccolith morphometry as palaeo-proxy for growth rate
The significant correlation between fluxes of C. leptoporus coccoliths and their mass and area in our time-series sediment trap records (Spearman r = 0.40 and r = 0.39, respectively; N = 46, p value < 0.01; Figure 3) indicates that heavier and larger coccoliths are produced at times of enhanced coccolith fluxes. This observation is consistent with results from the subpolar North Atlantic station NABE-48, located in SubArctic waters (48°N; Broerse et al., 2000; Renaud et al., 2002), where C. leptoporus coccolith fluxes exhibit a positive significant correlation with coccolith diameter (Spearman correlation coefficient (r) of 0.62, N = 24, p value < 0.01). In the following we will compare this field-data correlation with experimentally derived correlations. Experimental data suggest a positive correlation between calcification related physiological rates, i.e. calcite production, coccolith production, and growth rate (Langer et al., 2006; Langer and Bode, 2011; Diner et al., 2015).
There are, moreover, studies that seem to support a relationship between coccolith mass, area and production/growth rate. In carbonate chemistry manipulation experiments the percentage of coccoliths that are unusually small (either due to incompleteness or malformations) is negatively correlated with growth rate/calcite production (Langer et al., 2006; Langer and Bode, 2011). Whether these experimental correlations are applicable to field data is not clear because firstly, neither coccolith size nor coccolith production was measured. Secondly, all physiological changes were induced by sizable changes in carbonate chemistry which might not be representative of the field situation discussed here. Thirdly, it remains unknown whether rate changes induced by environmental parameters other than carbonate chemistry would have the same effect. Despite these caveats we propose to apply the experimental positive correlation between coccolith size and growth rate to field data. We therefore tentatively propose coccolith size (i.e. area) as proxy for growth rate/coccolith production. Taken together with the positive correlation between coccolith size and flux (see above) we can furthermore infer a positive correlation between growth rate and flux. Note that this inference is based on the correlations observed in field and experimental data only. It does not describe the complexities that co-determine flux, e.g. grazing, dissolution and so on.
If the relationship between C. leptoporus area with growth rate identified on the seasonal scale (Figure 3) would hold true for the fossil record, the gradual decrease in coccolith area throughout the Holocene in sediment core Y16 (Figure 7B) could be taken as indicative of a reduction of C. leptoporus growth rates. However, it is important to note that, C. leptoporus coccolith accumulation rate in sediment core Y16 (Supplementary Figure 4) is not significantly correlated (p-value > 0.05) with coccolith area or mass (Spearman r correlation of -0.05 and -0.25, respectively; N = 9), implying that different factors other than growth rate may be equally or more influential in regulating coccolith morphogenesis on millennial time scales in the SAZ. However, it is also possible that the low sedimentation rates over the Campbell Plateau (1.5 to 3 cm/kyr in interglacials and 0.5 to 2.5 cm/kyr in glacials; Carter et al., 2002) combined with post-depositional effects, such as downcore variations in nannofossil concentrations by opal dilution (Bradtmiller et al., 2009), and/or sediment focusing or winnowing associated with the strong currents of the ACC (Panitz et al., 2015) could have altered the C. leptoporus production signal preserved in the sedimentary record (i.e. the coccolith accumulation rate). Moreover, temperature is a critical factor controlling the latitudinal distribution of coccolithophores in the Southern Ocean (Findlay and Giraudeau, 2000; Charalampopoulou et al., 2016; among others; Patil et al., 2017; Rigual-Hernández et al., 2020c), and therefore it also possible that the lower SSTs during the deglaciation (Figure 7A and Pahnke and Sachs, 2006)) played a major role in C. leptoporus productivity during the deglaciation thereby overprinting the effect of other environmental parameters on growth rate. Therefore, the possible application of coccolith area as a palaeo-proxy for C. leptoporus growth rate remains at the first phase of the typical “scientific maturation process” for a new proxy as proposed by Elderfield (2002), in which limited evidence suggests its great potential (Chase et al., 2018). Future culture experiments tailored to determine the physiological and environmental controls (such as light, temperature and nutrient availability) on C. leptoporus coccolith production will be needed to validate this proxy and to identify its limitations.
5 Conclusions
The combination of multiple sampling efforts together with detailed taxonomic and morphometric analyses, permitted to reconstruct coccolith morphometry of the keystone coccolithophore species Calcidiscus leptoporus from seasonal to millennial time scales in the Subantarctic Southern Ocean. Our results demonstrate that subantarctic C. leptoporus populations have been dominated by a single morphotype — type Intermediate — since, at least, the last 14 kyrs in the Subantarctic Southern Ocean. Therefore, the identified coccolith morphometric variations at different timescales in the SAZ must have been driven by a physiological response of C. leptoporus to environmental change. Comparison of high-resolution sensor data with full annual collection of coccolith fluxes by a sediment trap, suggests that variations in silicate concentration and light availability represent the most likely controls on coccolith size on seasonal time scales. Moreover, comparison of modern coccolith measurements obtained from sediment-trap annual records with those from a compilation of subantarctic seafloor assemblages, revealed that modern C. leptoporus populations are about 15% lighter and 25% smaller than their pre-industrial counterparts. The limited number of proxies available to reconstruct the complexity of the environmental conditions from the Late Deglaciation to the modern, together with the reduced number of samples with enough C. leptoporus coccoliths for morphometric characterization, prevented reaching conclusive evidence on the main controls of coccolith morphometrics on millennial time scales. However, the interpretation of our results in light of the literature suggests that the cumulative effect of multiple parameters — most likely temperature, ocean acidification and insolation — is controlling C. leptoporus coccolith size variations in the subantarctic Southern Ocean from the Late Deglaciation to the modern. Moreover, our data suggests that the influence of each of these parameters has varied through time, with warming and ocean acidification most likely playing a preponderant role during the industrial era. Lastly, our analysis also indicates that changes in iron supply into SAZ did not represent an important factor controlling coccolith morphometrics throughout the last 14 kyr.
Extrapolation of our results suggests that a future decrease in coccolith size of C. leptoporus will have a negative impact on the efficiency of the biological pump in the SAZ through a reduction of carbonate ballasting. However, the consequences in microzooplankton grazing and related changes in the biological pump are less clear. Lastly, the significant correlation between C. leptoporus fluxes and coccolith area in sediment trap records from subpolar regions combined with an experimental, positive correlation between coccolith size and growth rate tentatively suggest that coccolith area could be used as a proxy for C. leptoporus growth rate. Future laboratory and field experiments will be needed to assess this proxy.
Data availability statement
The raw data supporting the conclusions of this article will be made available by the authors, without undue reservation.
Author contributions
TT, SN and RE planned and performed the sediment trap field experiment. AR-H, JF, TT, SN, HB and FS conceived the project and facilitated acquisition of samples and the financial support for the project leading to this publication. JS-S performed numerical analyses. AR-H, AB, LM, TB, FR-M, AH-M and MZ-V performed image and SEM analyses. GL and AR-H performed identification of C. leptoporus morphotypes. The paper was written by AR-H and GL with input from all authors. All authors contributed to the article and approved the submitted version.
Funding
This project has received funding from the European Union’s Horizon 2020 research and innovation programme under the Marie Skłodowska-Curie grant agreement number 748690 – SONAR-CO2 (AR-H and JF) and by project BASELINE (PID2021-126495NBC33) funded by the MCIN/AEI/10.13039/501100011033 (AR-H). GL acknowledges funding from the Spanish Ministry of Universities through a Maria Zambrano grant. This work contributes to ICTA-UAB María de Maeztu” Programme for Units of Excellence of the Spanish Ministry of Science and Innovation (CEX2019-000940-M).
Acknowledgments
We are grateful to Peter Jansen for assistance in environmental data provision from SOTS observatory. Authors wish to thank José Ignacio Martin and Miguel Ángel Fuertes for their assistance in nannoplankton sample preparation and calibration of C-Calcita software, respectively. The authors acknowledge the assistance of Vito Clericò, Enrique Diez (USAL-NANOLAB) and Marta Ortiz (USAL-NUCLEUS) in SEM analyses. We sincerely thank Maria Vernet and Nina Bednarsek for the time dedicated to review the manuscript and for their valuable suggestions, which helped us to improve the quality of the manuscript.
Conflict of interest
The authors declare that the research was conducted in the absence of any commercial or financial relationships that could be construed as a potential conflict of interest.
Publisher’s note
All claims expressed in this article are solely those of the authors and do not necessarily represent those of their affiliated organizations, or those of the publisher, the editors and the reviewers. Any product that may be evaluated in this article, or claim that may be made by its manufacturer, is not guaranteed or endorsed by the publisher.
Supplementary material
The Supplementary Material for this article can be found online at: https://www.frontiersin.org/articles/10.3389/fmars.2023.1159884/full#supplementary-material
Supplementary Figure 1 | Pearson (A) and Spearman (B) rank correlation matrices for C. leptoporus coccolith morphometrics (mass, area and thickness) and C. leptoporus coccolith fluxes at the SOTS and SAM sites. Both tests yield similar results. Non-significant correlations (p values > 0.05; N = 46 samples) are crossed out.
Supplementary Figure 2 | Correlation between coccolith mass and depth including (A) and excluding samples below the calcite saturation horizon (~3200 m) (B).
Supplementary Figure 3 | Environmental parameters measured at the SOTS site: water temperature, photosynthetically available radiation (PAR), salinity, phosphate concentration, total oxidised nitrogen concentration (TOxN: nitrate plus nitrite), and silicate concentration and carbonate system parameters (pH, Total CO2 and calcite saturation state).
Supplementary Figure 4 | Downcore profiles of total nannofossil accumulation rate (NAR) (A), relative abundance of C. leptoporus (B), and C. leptoporus NAR (C) in sediment core Y16. Total NAR is considered to be an estimate of coccolithophore paleoproductivity (e.g. Baumann et al., 2004; González-Lanchas et al., 2020) and was calculated after Flores and Sierro (1997).
References
Armstrong E., Law C. S. (2023). Resilience of emiliania huxleyi to future changes in subantarctic waters. PloS One. doi: 10.1371/journal.pone.0284415
Armstrong R. A., Lee C., Hedges J. I., Honjo S., Wakeham S. G. (2002). A new mechanistic model for organic carbon fluxes in the ocean based on the quantitative association of POC with ballast minerals. Deep-Sea Res. II 49, 219–236. doi: 10.1016/S0967-0645(01)00101-1
Armstrong R. A., Peterson M. L., Lee C., Wakeham S. G. (2009). Settling velocity spectra and the ballast ratio hypothesis. Deep-Sea Res. II 56 (18), 1470–8. doi: 10.1016/j.dsr2.2008.11.032
Atkinson D., Ciotti B. J., Montagnes D. J. (2003). Protists decrease in size linearly with temperature: ca. 2.5% c– 1. Proc. R. Soc. London. Ser. B: Biol. Sci. 270, 2605–2611. doi: 10.1098/rspb.2003.2538
Auger M., Morrow R., Kestenare E., Sallée J.-B., Cowley R. (2021). Southern ocean in-situ temperature trends over 25 years emerge from interannual variability. Nat. Commun. 12, 514. doi: 10.1038/s41467-020-20781-1
Bach L. T., Bauke C., Meier K., Riebesell U., Schulz K. G. (2012). Influence of changing carbonate chemistry on morphology and weight of coccoliths formed by Emiliania huxleyi. Biogeosciences 9, 3449–3463. doi: 10.5194/bg-9-3449-2012
Bach L. T., Mackinder L. C., Schulz K. G., Wheeler G., Schroeder D. C., Brownlee C., et al. (2013). Dissecting the impact of CO2 and pH on the mechanisms of photosynthesis and calcification in the coccolithophore emiliania huxleyi. New Phytol. 199, 121–134. doi: 10.1111/nph.12225
Bairbakhish A. N., Bollmann J., Sprengel C., Thierstein H. R. (1999). Disintegration of aggregates and coccospheres in sediment trap samples. Mar. Micropaleontology 37, 219–223. doi: 10.1016/S0377-8398(99)00019-5
Balch W. M. (2018). The ecology, biogeochemistry, and optical properties of coccolithophores. Annu. Rev. Mar. Sci. 10, 71–98. doi: 10.1146/annurev-marine-121916-063319
Balch W. M., Drapeau D. T., Bowler B. C., Lyczskowski E., Booth E. S., Alley D. (2011). The contribution of coccolithophores to the optical and inorganic carbon budgets during the southern ocean gas exchange experiment: new evidence in support of the “Great calcite belt” hypothesis. J. Geophysical Research: Oceans 116. doi: 10.1029/2011JC006941
Baumann K.-H., Böckel B., Frenz M. (2004). “Coccolith contribution to south Atlantic carbonate sedimentation,” in Coccolithophores: from molecular processes to global impact. Eds. Thierstein H. R., Young J. R. (Berlin, Heidelberg: Springer Berlin Heidelberg), 367–402.
Beaufort L. (2005). Weight estimates of coccoliths using the optical properties (birefringence) of calcite. Micropaleontology 51, 289–297. doi: 10.2113/gsmicropal.51.4.289
Beaufort L., Barbarin N., Gally Y. (2014). Optical measurements to determine the thickness of calcite crystals and the mass of thin carbonate particles such as coccoliths. Nat. Protoc. 9, 633. doi: 10.1038/nprot.2014.028
Beaufort L., Probert I., de Garidel-Thoron T., Bendif E. M., Ruiz-Pino D., Metzl N., et al. (2011). Sensitivity of coccolithophores to carbonate chemistry and ocean acidification. Nature 476, 80–83. doi: 10.1038/nature10295
Béjard T. M., Rigual-Hernández A. S., Flores J. A., Tarruella J. P., Durrieu de Madron X., Cacho I., et al. (2023). Calcification response of planktic foraminifera to environmental change in the western Mediterranean Sea during the industrial era. Biogeosciences 20, 1505–1528. doi: 10.5194/bg-20-1505-2023
Bereiter B., Eggleston S., Schmitt J., Nehrbass-Ahles C., Stocker T. F., Fischer H., et al. (2015). Revision of the EPICA dome c CO2 record from 800 to 600 kyr before present. Geophysical Res. Lett. 42, 542–549. doi: 10.1002/2014GL061957
Beusen A., Boyd P. W., Breitburg D., Comeau S., Dupont S., Hansen P. J., et al. (2022). Multiple ocean stressors: a scientific summary for policy makers. Paris SP, France: Intergovernmental Oceanographic Commission of UNESCO (UNESCO-IOC). Available at: https://unesdoc.unesco.org/ark:/48223/pf0000380891.
Bishop J. K. B., Rossow W. B. (1991). Spatial and temporal variability of global surface solar irradiance. J. Geophysical Research: Oceans 96, 16839–16858. doi: 10.1029/91JC01754
Bolton C. T., Hernandez-Sanchez M. T., Fuertes M.-A., Gonzalez-Lemos S., Abrevaya L., Mendez-Vicente A., et al. (2016). Decrease in coccolithophore calcification and CO2 since the middle Miocene. Nat. Commun. 7. doi: 10.1038/ncomms10284
Bostock H. C., Hayward B. W., Neil H. L., Currie K. I., Dunbar G. B. (2011). Deep-water carbonate concentrations in the southwest Pacific. Deep Sea Res. Part I: Oceanographic Res. Papers 58, 72–85. doi: 10.1016/j.dsr.2010.11.010
Boyd P. W., Crossley A. C., DiTullio G. R., Griffiths F. B., Hutchins D. A., Queguiner B., et al. (2001). Control of phytoplankton growth by iron supply and irradiance in the subantarctic southern ocean: experimental results from the SAZ project. J. Geophysical Res. 106, 31573–31583. doi: 10.1029/2000JC000348
Bradtmiller L. I., Anderson R. F., Fleisher M. Q., Burckle L. H. (2009). Comparing glacial and Holocene opal fluxes in the pacific sector of the southern ocean. Paleoceanography 24. doi: 10.1029/2008PA001693
Broerse A. T. C., Ziveri P., van Hinte J. E., Honjo S. (2000). Coccolithophore export production, species composition, and coccolith-CaCO3 fluxes in the NE Atlantic (34°N21°W and 48°N21°W). Deep Sea Res. Part II: Topical Stud. Oceanography 47, 1877–1905. doi: 10.1016/S0967-0645(00)00010-2
Buitenhuis E. T., Pangerc T., Franklin D. J., Le Quéré C., Malin G. (2008). Growth rates of six coccolithophorid strains as a function of temperature. Limnol Oceanogr. 53, 1181–1185. doi: 10.4319/lo.2008.53.3.1181
Caldeira K., Wickett M. E. (2003). Anthropogenic carbon and ocean pH. Nature 425, 365. doi: 10.1038/425365a
Carter L., Neil H. L., Northcote L. (2002). Late quaternary ice-rafting events in the SW pacific ocean, off eastern new Zealand. Mar. Geology 191, 19–35. doi: 10.1016/S0025-3227(02)00509-1
Charalampopoulou A., Poulton A. J., Bakker D. C., Lucas M. I., Stinchcombe M. C., Tyrrell T. (2016). Environmental drivers of coccolithophore abundance and calcification across drake passage (Southern ocean). Biogeosciences 13, 5917–5935. doi: 10.5194/bg-13-5917-2016
Chase Z., Ellwood M. J., van de Flierdt T. (2018). Discovering the ocean’s past through geochemistry. Elements: Int. Magazine Mineralogy Geochemistry Petrology 14, 397–402. doi: 10.2138/gselements.14.6.397
Chen B., Liu H. (2010). Relationships between phytoplankton growth and cell size in surface oceans: interactive effects of temperature, nutrients, and grazing. Limnology Oceanography 55, 965–972. doi: 10.4319/lo.2010.55.3.0965
Collins S., Rost B., Rynearson T. A. (2014). Evolutionary potential of marine phytoplankton under ocean acidification. Evolutionary Appl. 7, 140–155. doi: 10.1111/eva.12120
Connell R. D., Sikes E. L. (1997). Controls on late quaternary sedimentation of the south Tasman rise. Aust. J. Earth Sci. 44, 667–675. doi: 10.1080/08120099708728344
Cortese G., Prebble J. (2015). A radiolarian-based modern analogue dataset for palaeoenvironmental reconstructions in the southwest pacific. Mar. Micropaleontology 118, 34–49. doi: 10.1016/j.marmicro.2015.05.002
Dai Y., Yu J., Ren H., Ji X. (2022). Deglacial subantarctic CO2 outgassing driven by a weakened solubility pump. Nat. Commun. 13, 5193. doi: 10.1038/s41467-022-32895-9
Daniels C. J., Poulton A. J., Young J. R., Esposito M., Humphreys M. P., Ribas-Ribas M., et al. (2016). Species-specific calcite production reveals coccolithus pelagicus as the key calcifier in the Arctic ocean. Mar. Ecol. Prog. Ser. 555, 29–47. doi: 10.3354/meps11820
De Bodt C., Van Oostende N., Harlay J., Sabbe K., Chou L. (2010). Individual and interacting effects of pCO 2 and temperature on emiliania huxleyi calcification: study of the calcite production, the coccolith morphology and the coccosphere size. Biogeosciences 7, 1401–1412. doi: 10.5194/bg-7-1401-2010
Deppeler S. L., Davidson A. T. (2017). Southern ocean phytoplankton in a changing climate. Front. Mar. Sci. 4. doi: 10.3389/fmars.2017.00040
Diner R. E., Benner I., Passow U., Komada T., Carpenter E. J., Stillman J. H. (2015). Negative effects of ocean acidification on calcification vary within the coccolithophore genus calcidiscus. Marine Biology 162, 1287–1305. doi: 10.1007/s00227-015-2669-x
Doney S. C., Fabry V. J., Feely R. A., Kleypas J. A. (2009). Ocean acidification: the other CO2 problem. Annu. Rev. Mar. Sci. 1, 169–192. doi: 10.1146/annurev.marine.010908.163834
Dugdale R. C., Wilkerson F. P., Minas H. J. (1995). The role of a silicate pump in driving new production. Deep Sea Res. Part I: Oceanographic Res. Papers 42, 697–719. doi: 10.1016/0967-0637(95)00015-X
Durak G. M., Taylor A. R., Walker C. E., Probert I., de Vargas C., Audic S., et al. (2016). A role for diatom-like silicon transporters in calcifying coccolithophores. Nat. Commun. 7, 10543. doi: 10.1038/ncomms10543
Durand A., Chase Z., Noble T. L., Bostock H., Jaccard S. L., Kitchener P., et al. (2017). Export production in the new-Zealand region since the last glacial maximum. Earth Planetary Sci. Lett. 469, 110–122. doi: 10.1016/j.epsl.2017.03.035
Ebersbach F., Trull T. W., Davies D. M., Bray S. G. (2011). Controls on mesopelagic particle fluxes in the Sub-Antarctic and polar frontal zones in the southern ocean south of Australia in summer–perspectives from free-drifting sediment traps. Deep Sea Res. Part II: Topical Stud. Oceanography 58, 2260–2276. doi: 10.1016/j.dsr2.2011.05.025
Elderfield H. (2002). Foraminiferal Mg/Ca paleothermometry: expected advances and unexpected consequences. Geochimica Cosmochimica Acta, A213–A213.
Eriksen R., Trull T. W., Davies D., Jansen P., Davidson A. T., Westwood K., et al. (2018). Seasonal succession of phytoplankton community structure from autonomous sampling at the Australian southern ocean time series (SOTS) observatory. Mar. Ecol. Prog. Ser. 589, 13–31. doi: 10.3354/meps12420
Fabry V. J., McClintock J. B., Mathis J. T., Grebmeier J. M. (2009). Ocean acidification at high latitudes: the bellweather. Oceanography 22, 160. doi: 10.5670/oceanog.2009.105
Feely R. A., Sabine C. L., Lee K., Berelson W., Kleypas J., Fabry V. J., et al. (2004). Impact of anthropogenic CO2 on the CaCO3 system in the oceans. Science 305, 362–366. doi: 10.1126/science.1097329
Feng Y., Roleda M. Y., Armstrong E., Boyd P. W., Hurd C. L. (2017). Environmental controls on the growth, photosynthetic and calcification rates of a southern hemisphere strain of the coccolithophore Emiliania huxleyi. Limnology Oceanography 62, 519–540. doi: 10.1002/lno.10442
Feng Y., Roleda M. Y., Armstrong E., Law C. S., Boyd P. W., Hurd C. L. (2018). Environmental controls on the elemental composition of a southern hemisphere strain of the coccolithophore Emiliania huxleyi. Biogeosciences 15, 581–595. doi: 10.5194/bg-15-581-2018
Findlay C. S., Giraudeau J. (2000). Extant calcareous nannoplankton in the Australian sector of the southern ocean (austral summers 1994 and 1995). Mar. Micropaleontology 40, 417–439. doi: 10.1016/S0377-8398(00)00046-3
Finkel Z. V., Beardall J., Flynn K. J., Quigg A., Rees T. A. V., Raven J. A. (2009). Phytoplankton in a changing world: cell size and elemental stoichiometry. J. Plankton Res. 32, 119–137. doi: 10.1093/plankt/fbp098
Fiorini S., Middelburg J. J., Gattuso J.-P. (2011). Testing the effects of elevated pCO2 on coccolithophores (Prymnesiophyceae): comparison between haploid and diploid life stages. J Phycol. 47, 1281–1291. doi: 10.1111/j.1529-8817.2011.01080.x
Flores J. A., Sierro F. J. (1997). A revised technique for the calculation of calcareous nannofossil accumulation rates. Micropaleontology 43, 321–324. doi: 10.2307/1485832
Frank V. M., Brzesinski M. A., Coale K. H., Nelson D. M. (2000). Iron and silicic acid availability regulate Si uptake in the pacific sector of the southern ocean. Deep-Sea Res. II 47 (15–16), 3315–38. doi: 10.1016/S0967-0645(00)00070-9
Frankignoulle M., Canon C., Gattuso J.-P. (1994). Marine calcification as a source of carbon dioxide: positive feedback of increasing atmospheric CO2. Limnology Oceanography 39, 458–462. doi: 10.4319/lo.1994.39.2.0458
Frankignoulle M., Gattuso J.-P. (1993). Air-sea CO 2 exchange in coastal ecosystems, interactions of c, n, p and s biogeochemical cycles and global change (Springer), 233–248.
Fripiat F., Leblanc K., Elskens M., Cavagna A. J., Armand L., André L., et al. (2011). Efficient silicon recycling in summer in both the polar frontal and subantarctic zones of the southern ocean. Mar. Ecol. Prog. Ser. 435, 47–61. doi: 10.3354/meps09237
Fuertes M.-Á., Flores J.-A., Sierro F. J. (2014). The use of circularly polarized light for biometry, identification and estimation of mass of coccoliths. Mar. Micropaleontology 113, 44–55. doi: 10.1016/j.marmicro.2014.08.007
Gareth J., Daniela W., Trevor H., Robert T. (2013). An introduction to statistical learning: with applications in r (Springer New York, NY: Spinger). Available at: https://link.springer.com/book/10.1007/978-1-4614-7138-7#about-this-book.
González-Lanchas A., Flores J.-A., Sierro F. J., Bárcena M.Á., Rigual-Hernández A. S., Oliveira D., et al. (2020). A new perspective of the alboran upwelling system reconstruction during the marine isotope stage 11: a high-resolution coccolithophore record. Quaternary Sci. Rev. 245, 106520. doi: 10.1016/j.quascirev.2020.106520
Hastie T. J., Pregibon D. (1992). Statistical models in s, chapter generalized linear models Vol. 51 (Pacific Grove: Wadsworth & Brooks/Cole). Available at: https://www.scirp.org/(S(351jmbntv-nsjt1aadkposzje))/reference/referencespapers.aspx?referenceid=2790482.
Honjo S., Manganini S. J., Krishfield R. A., Francois R. (2008). Particulate organic carbon fluxes to the ocean interior and factors controlling the biological pump: a synthesis of global sediment trap programs since 1983. Prog. Oceanography 76, 217–285. doi: 10.1016/j.pocean.2007.11.003
ImageJ. Available at: http://imagej.nih.gov/ij.
Jackson R., Gabric A. (2022). Climate change impacts on the marine cycling of biogenic sulfur: a review. Microorganisms 10, 1581. doi: 10.3390/microorganisms10081581
Jin X., Liu C., Zhang H. (2019). Coccolith morphological and assemblage responses to dissolution in the recent sediments of the East China Sea. Mar. Micropaleontology 152, 101709. doi: 10.1016/j.marmicro.2018.09.001
Jonkers L., Hillebrand H., Kucera M. (2019). Global change drives modern plankton communities away from the pre-industrial state. Nature 570, 372–375. doi: 10.1038/s41586-019-1230-3
King A. L., Howard W. R. (2005). δ18O seasonality of planktonic foraminifera from southern ocean sediment traps: latitudinal gradients and implications for paleoclimate reconstructions. Mar. Micropaleontology 56, 1–24. doi: 10.1016/j.marmicro.2005.02.008
Knappertsbusch M., Cortes M. Y., Thierstein H. R. (1997). Morphologic variability of the coccolithophorid Calcidiscus leptoporus in the plankton, surface sediments and from the early pleistocene. Mar. Micropaleontology 30, 293–317. doi: 10.1016/S0377-8398(96)00053-9
Langer G., Bode M. (2011). CO2 mediation of adverse effects of seawater acidification in calcidiscus leptoporus. Geochemistry Geophysics Geosystems 12. doi: 10.1029/2010GC003393
Langer G., Geisen M., Baumann K.-H., Kläs J., Riebesell U., Thoms S., et al. (2006). Species-specific responses of calcifying algae to changing seawater carbonate chemistry. Geochemistry Geophysics Geosystems 7. doi: 10.1029/2005GC001227
Langer G., Nehrke G., Probert I., Ly J., Ziveri P. (2009). Strain-specific responses of Emiliania huxleyi to changing seawater carbonate chemistry. Biogeosciences 6, 2637–2646. doi: 10.5194/bg-6-2637-2009
Langer G., Oetjen K., Brenneis T. (2012). Calcification of calcidiscus leptoporus under nitrogen and phosphorus limitation. J. Exp. Mar. Biol. Ecol. 413, 131–137. doi: 10.1016/j.jembe.2011.11.028
Langer G., Probert I., Nehrke G., Ziveri P. (2011). The morphological response of emiliania huxleyi to seawater carbonate chemistry changes: an inter-strain comparison. J. Nannoplankton Res. 32 (1), 29–34.
Langer G., Taylor A. R., Walker C. E., Meyer E. M., Ben Joseph O., Gal A., et al. (2021). Role of silicon in the development of complex crystal shapes in coccolithophores. New Phytol. 231, 1845–1857. doi: 10.1111/nph.17230
Lannuzel D., Bowie A. R., Remenyi T., Lam P., Townsend A., Ibisanmi E., et al. (2011). Distributions of dissolved and particulate iron in the sub-Antarctic and polar frontal southern ocean (Australian sector). Deep Sea Res. Part II: Topical Stud. Oceanography 58, 2094–2112. doi: 10.1016/j.dsr2.2011.05.027
Laskar J., Robutel P., Joutel F., Gastineau M., Correia A. C. M., Levrard B. (2004). A long-term numerical solution for the insolation quantities of the earth. A&A 428, 261–285. doi: 10.1051/0004-6361:20041335
Lefebvre S. C., Benner I., Stillman J. H., Parker A. E., Drake M. K., Rossignol P. E., et al. (2012). Nitrogen source and pCO2 synergistically affect carbon allocation, growth and morphology of the coccolithophore emiliania huxleyi: potential implications of ocean acidification for the carbon cycle. Global Change Biol. 18, 493–503. doi: 10.1111/j.1365-2486.2011.02575.x
Malinverno E., Triantaphyllou M. V., Dimiza M. D. (2015). Coccolithophore assemblage distribution along a temperate to polar gradient in the West pacific sector of the southern ocean (January 2005). Micropaleontology 61, 489–506. doi: 10.47894/mpal.61.6.07
McNeil B. I., Matear R. J. (2008). Southern ocean acidification: a tipping point at 450-ppm atmospheric CO2. Proc. Natl. Acad. Sci. 105, 18860–18864. doi: 10.1073/pnas.0806318105
Meier K. J. S., Beaufort L., Heussner S., Ziveri P. (2014). The role of ocean acidification in Emiliania huxleyi coccolith thinning in the Mediterranean Sea. Biogeosciences 11, 2857–2869. doi: 10.5194/bg-11-2857-2014
Meyer J., Riebesell U. (2015). Reviews and syntheses: responses of coccolithophores to ocean acidification: a meta-analysis. Biogeosciences (BG) 12, 1671–1682. doi: 10.5194/bg-12-1671-2015
Milliman J. D. (1993). Production and accumulation of calcium carbonate in the ocean: budget of a nonsteady state. Global Biogeochemical Cycles 7, 927–957. doi: 10.1029/93GB02524
Monahan J. F. (2011). Numerical methods of statistics (Cambridge: Cambridge University Press). Available at: https://www.cambridge.org/core/books/numerical-methods-of-statistics/ED2D1845F52AF845CCF560E3526B9B56#fndtn-information.
Moy A. D., Howard W. R., Bray S. G., Trull T. W. (2009). Reduced calcification in modern southern ocean planktonic foraminifera. Nat. Geosci 2, 276–280. doi: 10.1038/ngeo460
Müller M. N., Brandini F. P., Trull T. W., Hallegraeff G. M. (2021). Coccolith volume of the southern ocean coccolithophore emiliania huxleyi as a possible indicator for palaeo-cell volume. Geobiology 19, 63–74. doi: 10.1111/gbi.12414
Müller M. N., Trull T. W., Hallegraeff G. M. (2015). Differing responses of three southern ocean Emiliania huxleyi ecotypes to changing seawater carbonate chemistry. Mar. Ecol. Prog. Ser. 531, 81–90. doi: 10.3354/meps11309
Neil H. L., Carter L., Morris M. Y. (2004). Thermal isolation of Campbell plateau, new Zealand, by the Antarctic circumpolar current over the past 130 kyr. Paleoceanography 19. doi: 10.1029/2003PA000975
Nodder S. D., Chiswell S. M., Northcote L. C. (2016). Annual cycles of deep-ocean biogeochemical export fluxes in subtropical and subantarctic waters, southwest pacific ocean. J. Geophysical Research: Oceans 121 (4), 2405–24. doi: 10.1002/2015JC011243
Orr J. C., Fabry V. J., Aumont O., Bopp L., Doney S. C., Feely R. A., et al. (2005). Anthropogenic ocean acidification over the twenty-first century and its impact on calcifying organisms. Nature 437, 681–686. doi: 10.1038/nature04095
Orsi A. H., Whitworth Iii T., Nowlin W. D. Jr. (1995). On the meridional extent and fronts of the Antarctic circumpolar current. Deep Sea Res. Part I: Oceanographic Res. Papers 42, 641–673. doi: 10.1016/0967-0637(95)00021-W
Paasche E. (1973). Silicon and the ecology of marine plankton diatoms. i. thalassiosira pseudonana (Cyclotella nana) grown in a chemostat with silicate as limiting nutrient. Mar. Biol. 19, 117–126. doi: 10.1007/BF00353582
Paasche E. (1999). Reduced coccolith calcite production under light-limited growth: a comparative study of three clones of Emiliania huxleyi (Prymnesiophyceae). Phycologia 38, 508–516. doi: 10.2216/i0031-8884-38-6-508.1
Paasche E. (2002). A review of the coccolithophorid Emiliania huxleyi (Prymnesiophyceae), with particular reference to growth, coccolith formation, and calcification-photosynthesis interactions. Phycologia 40, 503–529. doi: 10.2216/i0031-8884-40-6-503.1
Pachauri R. K., Allen M. R., Barros V. R., Broome J., Cramer W., Christ R., et al. (2014). Climate change 2014: synthesis report. contribution of working groups I, II and III to the fifth assessment report of the intergovernmental panel on climate change (Geneva, Switzerland: Ipcc). https://www.ipcc.ch/report/ar5/syr/.
Pahnke K., Sachs J. P. (2006). Sea Surface temperatures of southern midlatitudes 0–160 kyr B.P. Paleoceanography 21. doi: 10.1029/2005PA001191
Panitz S., Cortese G., Neil H. L., Diekmann B. (2015). A radiolarian-based palaeoclimate history of core Y9 (Northeast of Campbell plateau, new Zealand) for the last 160 kyr. Mar. Micropaleontology 116, 1–14. doi: 10.1016/j.marmicro.2014.12.003
Patil S. M., Mohan R., Shetye S. S., Gazi S., Baumann K.-H., Jafar S. (2017). Biogeographic distribution of extant coccolithophores in the Indian sector of the southern ocean. Mar. Micropaleontology 137, 16–30. doi: 10.1016/j.marmicro.2017.08.002
Petit J. R., Jouzel J., Raynaud D., Barkov N. I., Barnola J. M., Basile I., et al. (1999). Climate and atmospheric history of the past 420,000 years from the vostok ice core, Antarctica. Nature 399, 429–436. doi: 10.1038/20859
Pörtner H. O., Langenbuch M., Michaelidis B. (2005). Synergistic effects of temperature extremes, hypoxia, and increases in CO2 on marine animals: from earth history to global change. J. Geophysical Research: Oceans 110. doi: 10.1029/2004JC002561
Prebble J. G., Crouch E. M., Carter L., Cortese G., Nodder S. D. (2013). Dinoflagellate cysts from two sediment traps east of new Zealand. Mar. Micropaleontology 104, 25–37. doi: 10.1016/j.marmicro.2013.08.003
Quinn P., Thierstein H. R., Brand L., Winter A. (2003). Experimental evidence for the species character of calcidiscus leptoporus morphotypes. J. Paleontology 77, 825–830. doi: 10.1666/0022-3360(2003)077<0825:EEFTSC>2.0.CO;2
Raven J., Caldeira K., Elderfield H., Hoegh-Guldberg O., Liss P., Riebesell U., et al. (2005). Ocean acidification due to increasing atmospheric carbon dioxide (London: The Royal Society). Available at: https://royalsociety.org/-/media/Royal_Society_Content/policy/publications/2005/9634.pdf.
Renaud S., Ziveri P., Broerse A. T. C. (2002). Geographical and seasonal differences in morphology and dynamics of the coccolithophore calcidiscus leptoporus. Mar. Micropaleontology 46, 363–385. doi: 10.1016/S0377-8398(02)00081-6
Reusch T. B. H., Boyd P. W. (2013). Experimental evolution meets marine phytoplankton. Evolution 67, 1849–1859. doi: 10.1111/evo.12035
Riebesell U., Zondervan I., Rost B., Tortell P. D., Zeebe R. E., Morel F. M. M. (2000). Reduced calcification of marine plankton in response to increased atmospheric CO2. Nature 407, 364–367. doi: 10.1038/35030078
Rigual-Hernández A. S., Sánchez-Santos J. M., Eriksen R., Moy A. D., Sierro F. J., Flores J. A., et al. (2020a). Limited variability in the phytoplankton emiliania huxleyi since the pre-industrial era in the subantarctic southern ocean. Anthropocene 31, 100254. doi: 10.1016/j.ancene.2020.100254
Rigual-Hernández A. S., Trull T. W., Bray S. G., Cortina A., Armand L. K. (2015). Latitudinal and temporal distributions of diatom populations in the pelagic waters of the subantarctic and polar frontal zones of the southern ocean and their role in the biological pump. Biogeosciences 12, 8615–8690. doi: 10.5194/bg-12-5309-2015
Rigual-Hernández A. S., Trull T. W., Flores J. A., Nodder S. D., Eriksen R., Davies D. M., et al. (2020b). Full annual monitoring of subantarctic emiliania huxleyi populations reveals highly calcified morphotypes in high-CO2 winter conditions. Sci. Rep. 10, 2594. doi: 10.1038/s41598-020-59375-8
Rigual-Hernández A. S., Trull T. W., Nodder S. D., Flores J. A., Bostock H., Abrantes F., et al. (2020c). Coccolithophore biodiversity controls carbonate export in the southern ocean. Biogeosciences 17, 245–263. doi: 10.5194/bg-17-245-2020
Rintoul S. R., Trull T. W. (2001). Seasonal evolution of the mixed layer in the subantarctic zone south of Australia. J. Geophysical Research: Oceans 106, 31447–31462. doi: 10.1029/2000JC000329
Rosengard S. Z., Lam P. J., Balch W. M., Auro M. E., Pike S., Drapeau D., et al. (2015). Carbon export and transfer to depth across the southern ocean great calcite belt. Biogeosciences 12, 3953–3971. doi: 10.5194/bg-12-3953-2015
Saavedra-Pellitero M., Baumann K.-H. (2015). Comparison of living and surface sediment coccolithophore assemblages in the pacific sector of the southern ocean. Micropaleontology 61, 507–520. doi: 10.47894/mpal.61.6.08
Sáez A. G., Probert I., Geisen M., Quinn P., Young J. R., Medlin L. K. (2003). Pseudo-cryptic speciation in coccolithophores. Proc. Natl. Acad. Sci. 100, 7163–7168. doi: 10.1073/pnas.1132069100
Schlitzer R. (2018). Ocean Data View. Available at: https://odv.awi.de/fileadmin/user_upload/odv/misc/HowTo.pdf.
Schlüter L., Lohbeck K. T., Gutowska M. A., Gröger J. P., Riebesell U., Reusch T. B. (2014a). Adaptation of a globally important coccolithophore to ocean warming and acidification. Nat. Climate Change 4, 1024–1030. doi: 10.1038/nclimate2379
Schlüter L., Lohbeck K. T., Gutowska M. A., Gröger J. P., Riebesell U., Reusch T. B. H. (2014b). Adaptation of a globally important coccolithophore to ocean warming and acidification. Nat. Climate Change 4, 1024–1030. doi: 10.1038/nclimate2379
Sedwick P. N., DiTullio G. R., Hutchins D. A., Boyd P. W., Griffiths F. B., Crossley A. C., et al. (1999). Limitation of algal growth by iron deficiency in the Australian subantarctic region. Geophysical Res. Lett. 26, 2865–2868. doi: 10.1029/1998GL002284
Shadwick E. H., Rigual-Hernández A. S., Eriksen R., Jansen P., Davies D. M., Wynn-Edwards C. A., et al. (2022). Changes in southern ocean biogeochemistry and the potential impact on pH-sensitive planktonic organisms. Oceanography 34, 14–15. doi: 10.5670/oceanog.2021.supplement.02-06
Shadwick E. H., Tilbrook B., Cassar N., Trull T. W., Rintoul S. R. (2015). Summertime physical and biological controls on O2 and CO2 in the Australian sector of the southern ocean. J. Mar. Syst. 147, 21–28. doi: 10.1016/j.jmarsys.2013.12.008
ter Braak C. J. F., Verdonschot P. F. M. (1995). Canonical correspondence analysis and related multivariate methods in aquatic ecology. Aquat. Sci. 57, 255–289. doi: 10.1007/BF00877430
Trull T. W., Bray S. G., Manganini S. J., Honjo S., François R. (2001). Moored sediment trap measurements of carbon export in the subantarctic and polar frontal zones of the southern ocean, south of Australia. J. Geophysical Research: Oceans 106, 31489–31509. doi: 10.1029/2000JC000308
Trull T. W., Passmore A., Davies D. M., Smit T., Berry K., Tilbrook B. (2018). Distribution of planktonic biogenic carbonate organisms in the southern ocean south of Australia: a baseline for ocean acidification impact assessment. Biogeosciences 15, 31–49. doi: 10.5194/bg-15-31-2018
Trull T. W., Schulz E., Bray S. G., Pender L., McLaughlan D., Tilbrook B., et al. (2010). The Australian integrated marine observing system southern ocean time series facility (Sydney: OCEANS 2010 IEEE), 1–7.
Venables W., Ripley B., Venables W., Ripley B. (2002). Exploratory multivariate analysis. Modern Appl. Stat S, 301–330. doi: 10.1007/978-0-387-21706-2_11
Walker C. E., Taylor A. R., Langer G., Durak G. M., Heath S., Probert I., et al. (2018). The requirement for calcification differs between ecologically important coccolithophore species. New Phytol. 220, 147–162. doi: 10.1111/nph.15272
Young J. R., Ziveri P. (2000). Calculation of coccolith volume and it use in calibration of carbonate flux estimates. Deep Sea Res. Part II: Topical Stud. Oceanography 47, 1679–1700. doi: 10.1016/S0967-0645(00)00003-5
Young J., Geisen M., Cross L., Kleijne A., Sprengel C., Probert I., et al (2003). A guide to extant coccolithophore taxonomy. Journal of Nanoplankton Research Special Issue 1, International Nannoplankton Association.
Young J. R., Bown P. R., Lees J. A. (2022). Nannotax3 website. International Nannoplankton Association. Accessed 2022. Available at: https://www.mikrotax.org/Nannotax3.
Ziveri P., de Bernardi B., Baumann K.-H., Stoll H. M., Mortyn P. G. (2007). Sinking of coccolith carbonate and potential contribution to organic carbon ballasting in the deep ocean. Deep Sea Res. Part II: Topical Stud. Oceanography 54, 659–675. doi: 10.1016/j.dsr2.2007.01.006
Zondervan I. (2007). The effects of light, macronutrients, trace metals and CO2 on the production of calcium carbonate and organic carbon in coccolithophores–a review. Deep Sea Res. Part II: Topical Stud. Oceanography 54, 521–537. doi: 10.1016/j.dsr2.2006.12.004
Keywords: Southern Ocean, coccolithophores, Calcidiscus leptoporus, ocean acidification, environmental change, sediment trap experiment, industrial era, Holocene
Citation: Rigual-Hernández AS, Langer G, Sierro FJ, Bostock H, Sánchez-Santos JM, Nodder SD, Trull TW, Ballegeer AM, Moy AD, Eriksen R, Makowka L, Béjard TM, Rigal-Muñoz FH, Hernández-Martín A, Zorita-Viota M and Flores JA (2023) Reduction in size of the calcifying phytoplankton Calcidiscus leptoporus to environmental changes between the Holocene and modern Subantarctic Southern Ocean. Front. Mar. Sci. 10:1159884. doi: 10.3389/fmars.2023.1159884
Received: 06 February 2023; Accepted: 29 May 2023;
Published: 22 June 2023.
Edited by:
Pedro Cermeno, Institute of Marine Sciences (CSIC), SpainReviewed by:
Maria Vernet, University of California, San Diego, United StatesNina Bednarsek, National Institute of Biology (NIB), Slovenia
Copyright © 2023 Rigual-Hernández, Langer, Sierro, Bostock, Sánchez-Santos, Nodder, Trull, Ballegeer, Moy, Eriksen, Makowka, Béjard, Rigal-Muñoz, Hernández-Martín, Zorita-Viota and Flores. This is an open-access article distributed under the terms of the Creative Commons Attribution License (CC BY). The use, distribution or reproduction in other forums is permitted, provided the original author(s) and the copyright owner(s) are credited and that the original publication in this journal is cited, in accordance with accepted academic practice. No use, distribution or reproduction is permitted which does not comply with these terms.
*Correspondence: Andrés S. Rigual-Hernández, YXJpZ3VhbEB1c2FsLmVz