 Haijun Wei
 Longwu Geng1,2
94% of researchers rate our articles as excellent or good
Learn more about the work of our research integrity team to safeguard the quality of each article we publish.
Find out more
ORIGINAL RESEARCH article
Front. Mar. Sci., 16 May 2023
Sec. Marine Fisheries, Aquaculture and Living Resources
Volume 10 - 2023 | https://doi.org/10.3389/fmars.2023.1158845
The Pseudaspius leptocephalus is a unique fish in the Heilongjiang River Basin and has important economic and ecological value. In the present study, the complete mitochondrial genome of P. leptocephalus were determined, and COI partial sequences of 85 individuals from Erguna river (EH), Mohe (MH), Fuyuan (FY), Hulan (HL) were used to evaluated the genetic diversity of four populations of P. leptocephalus in Heilongjiang River Basin. The mitogenome is 16,607 bp in length and contained one D-loop, 2 rRNA, 13 PCG, and 22 tRNA. 4 variable sites and 5 haplotypes were detected in 705 bp COI, and 705 bp COI exhibited a lower content of C + G (45.95%) than A + T (54.05%). The nucleotide diversity (π) and haplotype diversity (h) indices ranged from 0.00027 (HL) to 0.00065 (EH and FY) and from 0.192 (HL) to 0.462 (EH), respectively. The genetic distance within the population and between populations ranged from 0.0006554 to 0.0002728 and from 0.0003541 to 0.0006974, respectively. Pairwise values of FST and Nm showed that there was moderate genetic differentiation between EH population and other populations and individuals between EH population and other populations can mate randomly (0.15 > FST > 0.05, Nm > 4). Significant negative values of neutrality tests (P < 0.05) indicated that MH and FY populations may had experienced population expansion, but mismatch distribution analysis suggested that all populations have remained basically stable. These results provide strong basis for the protection and utilization of P. leptocephalus germplasm resources, and provide valuable information for the population structure and genetic diversity of P. leptocephalus.
The Pseudaspius leptocephalus (Cypriniformes, Leuciscidae, Pseudapius) is a unique fish in the Heilongjiang River Basin (Amur River Basin) of China, Russia and Mongolia, and the P. leptocephalus is mainly distributed in Heilongjiang, Wusuli and Songhua Rivers in China (Petr, 1991; Semenchenko and Ostrovskaya, 2020; Bao et al., 2021; Yang et al., 2021). In recent years, due to the overfishing and environmental damage, the wild populations of P. leptocephalus has continued to decline, and there is an urgent need to carry out conservation research on the P. leptocephalus (Yang et al., 2021). Since 2015, the team of the Heilongjiang River Fisheries Research Institute, Chinese Academy of Fishery Sciences has preliminarily completed the wild resource survey of the P. leptocephalus in the waters of Heilongjiang and Wusuli Rivers in China, and successfully overcome the technical difficulties of artificial spawning, seedling breeding and pond culturing of P. leptocephalus (Yang et al., 2021). In addition, our team has also carried out the proliferation and release of P. leptocephalus (local populations) in waters such as the Songhua River. These efforts of our team are of great significance to the protection and restoration of wild resources of the P. leptocephalus, but they are not enough. Currently, the related researches on P. leptocephalus mainly focus on the karyotype (Petr, 1991), Phylogeny (Semina et al., 2007), resource survey (Bao et al., 2021; Xu et al., 2021), Reproductive biology (Semenchenko and Ostrovskaya, 2020), embryonic development (Yang et al., 2021), and growth (Semenchenko, 2020; Yang et al., 2021) et al. However, there are still gaps in the genetic diversity and population structure of different populations in the P. leptocephalus.
Mitochondrial DNA (mtDNA) is an important genetic information system of eukaryotic cells, and has a closed circular double-stranded structure and self-replicates semi-conservatively (Paz et al., 2014). mtDNA is a relatively independent replication unit characterized by rapid evolutionary rate, maternal inheritance, small genome size, limited recombination, and simple structure etc. (Javonillo et al., 2010; Lei et al., 2010; Zhang et al., 2015). Therefore, mtDNA is widely used in various research fields, such as DNA structure and gene expression (Yang et al., 2022), taxonomic resolution and species identification (Krzywinski et al., 2011; Zhu et al., 2017), species evolution and phylogenetic distribution (Sharma et al., 2020; Sun CH et al., 2021; Staden et al., 2022; Yang et al., 2022), and population genetics (Gissi et al., 2008; Fang et al., 2021; Zhang et al., 2022). To date, the classification about P. leptocephalus is still disputed. Sasaki et al. (2007) pointed out that P. leptocephalus should be reclassified into the same genes of the Tribolodon species based on the phylogenetic tree generated based on Cyt-b gene and D-loop sequence, but Batishcheva et al. (2011) showed that P. leptocephalus represented a different branch from Tribolodon species based on the COI gene sequence. In addition, a better understanding of Leuciscidae mtDNAs requires expanded taxon sampling, so it is necessary to determine the mitochondrial genome of the P. leptocephalus and confirm the taxonomic position of P. leptocephalus.
Mitochondrial markers are important indicators of species structure and genetic diversity, and are widely used in genetic relationship analysis, germplasm identification, and population genetic structure analysis (Liu et al., 2021; Pan et al., 2021; Emelianova et al., 2022; Sultana et al., 2022; Zhang et al., 2022). Among the most common mitochondrial genes used in detecting genetic diversity and population structure, the mtDNA cytochrome c oxidase subunit I (COI) gene represent useful genetic marker and its easily amplified (Folmer et al., 1994). mtDNA COI gene sequence polymorphisms serve as “barcodes” to assess cryptic diversity and germplasm identification, and variation in COI gene sequence has been used for population studies of genetic diversity and structure in many fish such as Nibea albiflora (Xu et al., 2012), Schilbe intermedius (Nneji et al., 2020), Konosirus punctatus (Liu et al., 2020), Hygophum benoiti (Sarropoulou et al., 2022), Maurolicus muelleri (Sarropoulou et al., 2022), Benthosema glaciale (Sarropoulou et al., 2022) etc. So far in P. leptocephalus, mtDNA COI is mainly used for species identification and phylogeny (Batishcheva et al., 2011), and there have been no reports about genetic diversity and population structure of P. leptocephalus populations based on COI gene. In addition, no other molecular markers have been used in the genetic diversity analysis of different populations of P. leptocephalus. The studies of population genetic structure and genetic diversity are necessary for evaluating its breeding potential and understanding current population germplasm resources (Alal et al., 2021), which could provide guidance for the establishment of fishing quotas to prevent overharvesting and provide a basis for the selection of breeding populations (Zhao et al., 2019). Therefore, there is an urgent need to carry out genetic diversity analysis of different populations of P. leptocephalus.
In the present study, we have sequenced the whole mitochondrial genome of the artificial population of P. leptocephalus, and employed partial mtDNA COI gene sequences to assess the genetic diversity and intraspecific population differentiation of 4 P. leptocephalus populations [Erguna river (EH), Mohe (MH), Fuyuan (FY), Hulan (HL)] in the Heilongjiang River Basin. The study provides the characteristic features of the P. leptocephalus mitochondrial genome and the information on genetic diversity and population structure of P. leptocephalus. Those are critical for phylogenetic relationships, resource conversation and fisheries management for this species.
A total of 86 P. leptocephalus samples were collected from four sites (Figure 1) in Heilongjiang River Basin, Northeast China, and grouped according to their geographic origin. The collected fishes were as follows: 13 fishes from Erguna river (EH; 118°0′ E, 49°27′ N), 30 from Mohe (MH; 122°32′ E, 52°58′ N), 13 from Fuyuan (FY; 134°18′ E, 48°21′ N), 30 from Hulan (HL; 126°37′ E, 45°58′ N). It is worth noting that the HL samples were taken from the cultured population in Hulan Fisheries Test Field, Heilongjiang River Fisheries Research Institute, Chinese Academy of Fishery Sciences, while the other samples were all from the wild populations. Tissue (fin) samples from each individual were preserved in 95% ethanol until genomic DNA preparation. The total DNA was isolated from the tissue samples using a DNA kit (Tiangen, Beijing, China) according to the manufacturer’s instructions. DNA integrity were examined by 1.0% agarose gel electrophoresis and the concentration of DNA was measured by Qubit® DNA Assay Kit in Qubit® 3.0 Flurometer (Invitrogen, USA).
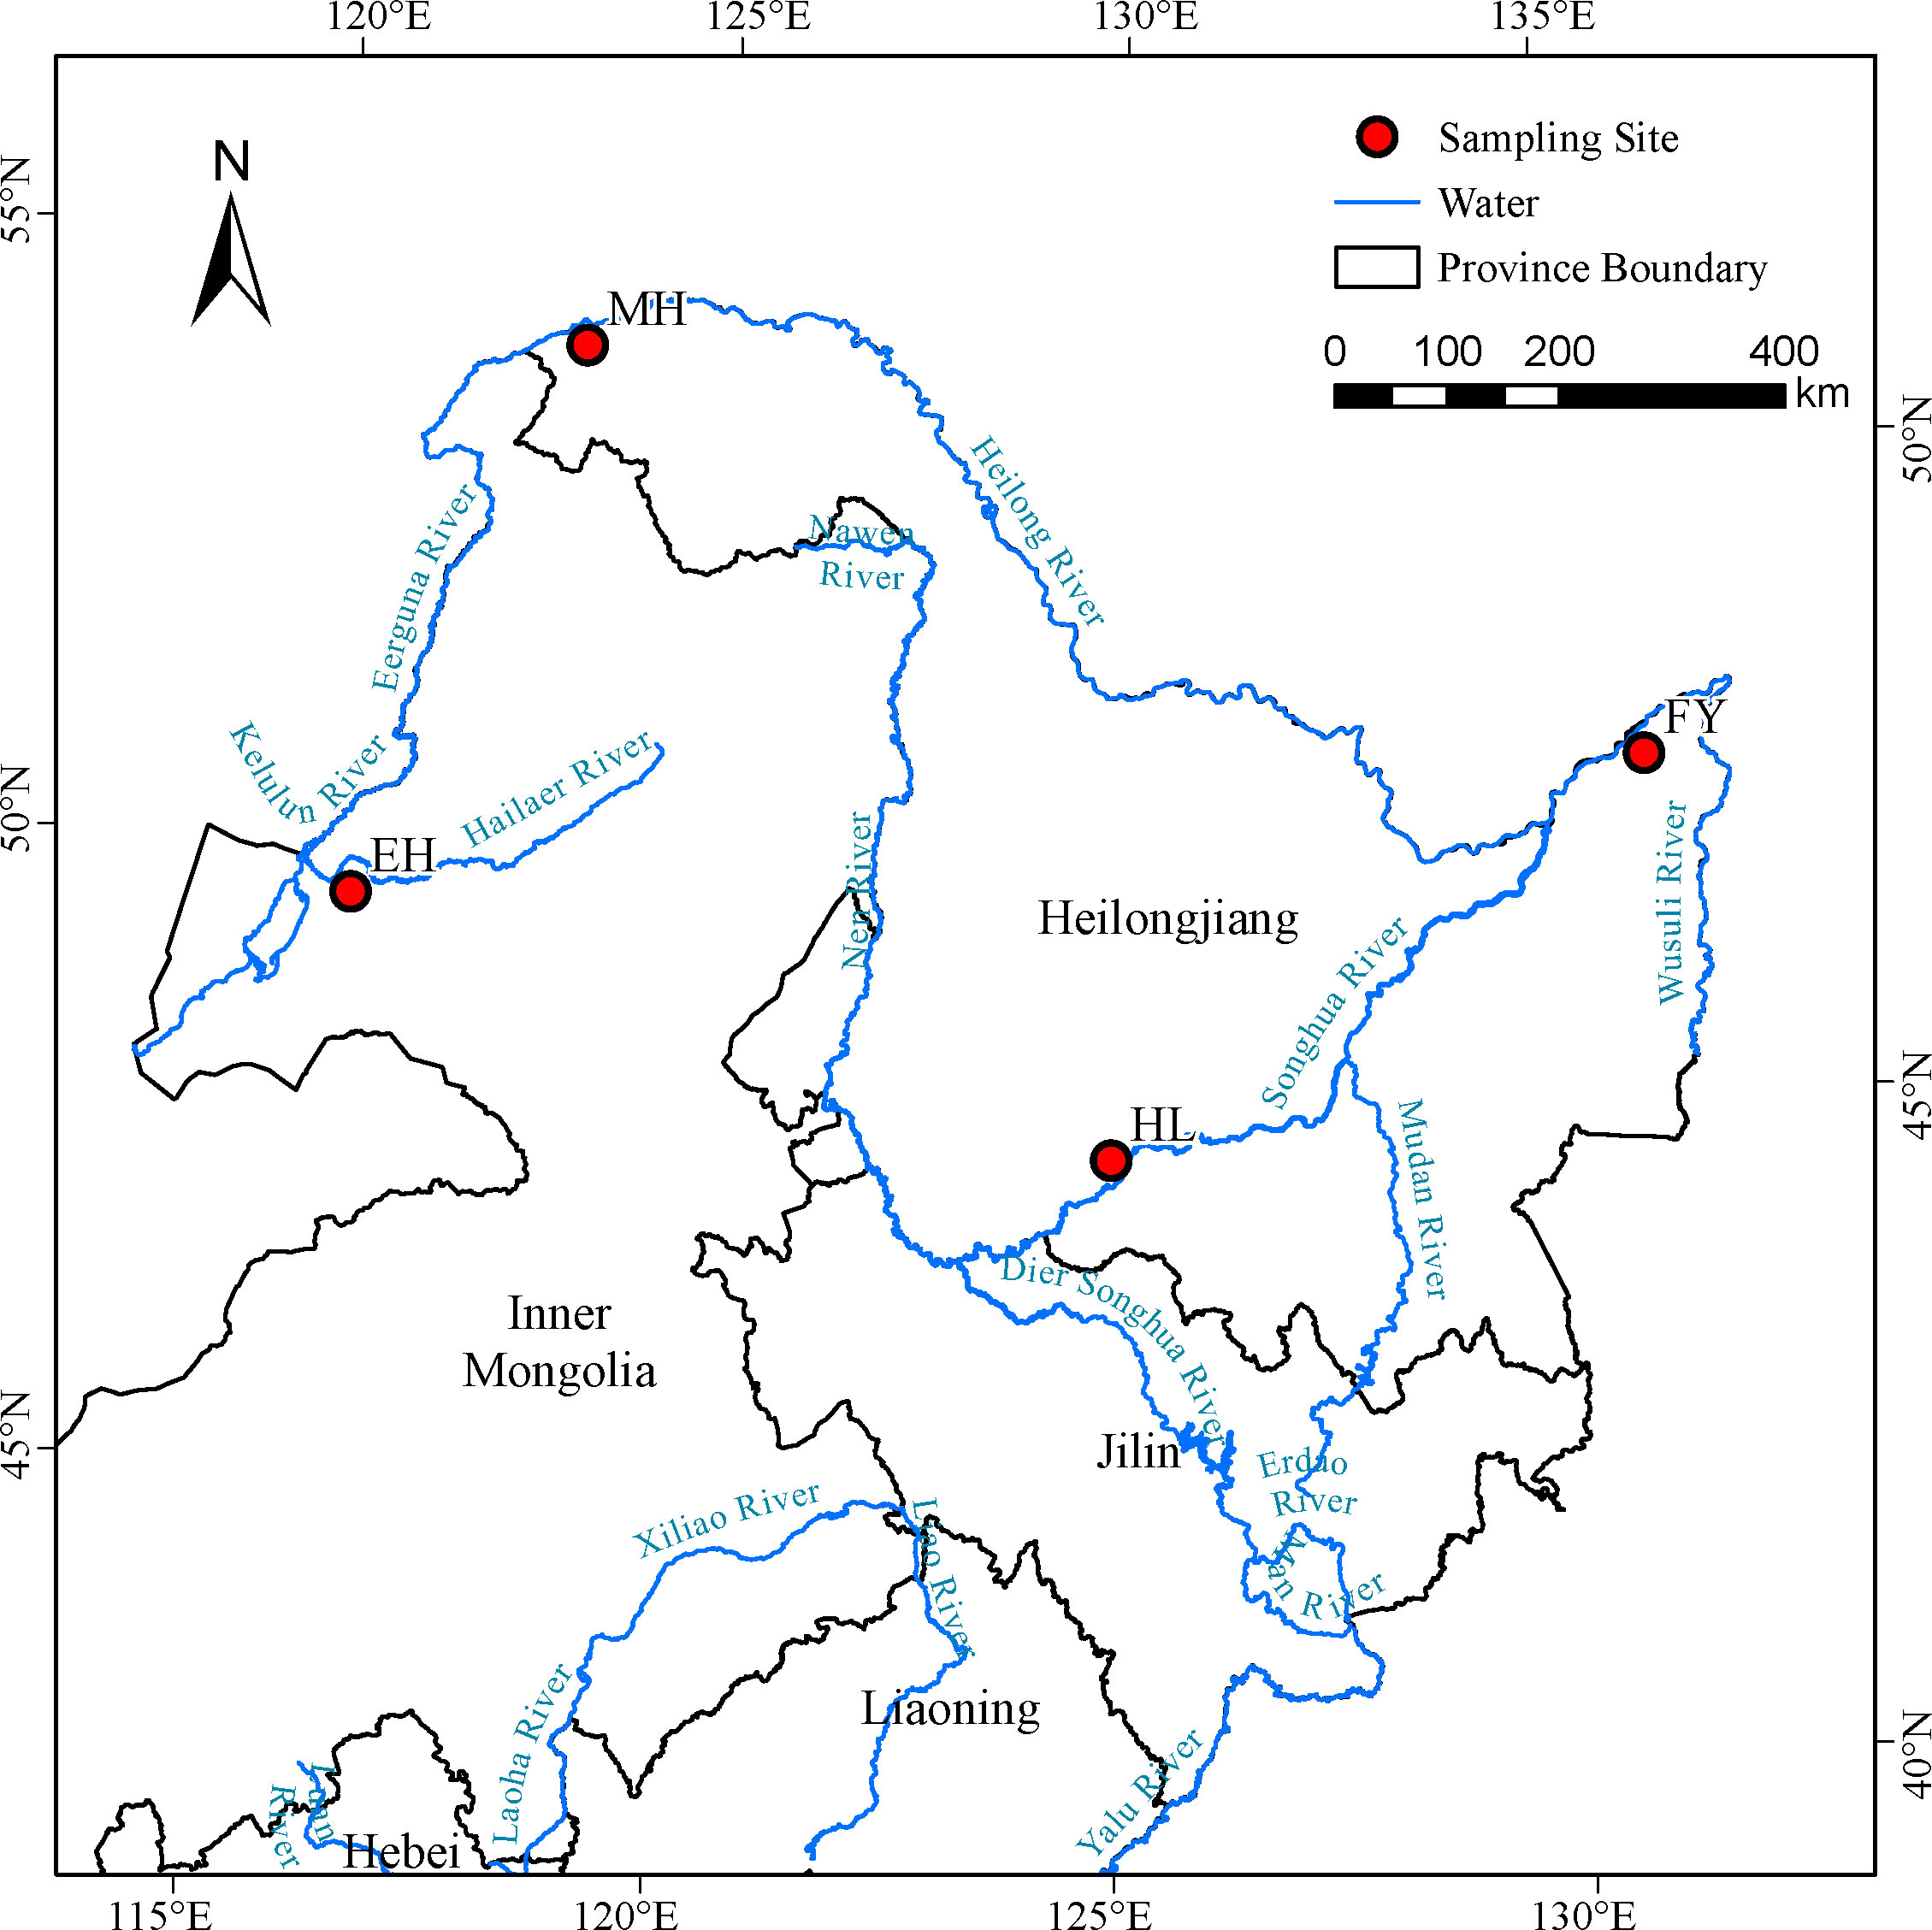
Figure 1 Sample locations of 4 Pseudaspius leptocephalus populations.
Sequencing library was generated using NEB Next® Ultra™ DNA Library Prep Kit for Illumina (NEB, USA) following manufacturer’s recommendations and index codes were added to each sample. Briefly, genomic DNA sample (one of HL groups) was fragmented by sonication to a size of 350 bp. Then DNA fragments were end polished, A-tailed, and ligated with the full-length adapter for Illumina sequencing, followed by further PCR amplification. After PCR products were purified by AMPure XP system (Beckman Coulter, Beverly, USA), DNA concentration was measured by Qubit®3.0 Flurometer (Invitrogen, USA), libraries were analyzed for size distribution by NGS3K/Caliper and quantified by real-time PCR (3 nM). The clustering of the index-coded samples was performed on a cBot Cluster Generation System using Illumina PE Cluster Kit (Illumina, USA) according to the manufacturer’s instructions. After cluster generation, the DNA libraries were sequenced on Illumina Novaseq 6000 platform.
The mitochondrial COI gene for 85 P. leptocephalus samples were amplified using the primers R: 5′- CAGGAAACAGCTATGACTAGACTTCTGGGTGGCCAAAGAATCA-3′ and F: 5′-GTAAAACGACGGCCAGTCAACCAACCACAAAGACATTGGCAC-3′ designed by Primer 5 based on the results of the mitochondrial genome. PCR were conducted using a 30-µL reaction system containing 1 µL DNA template (20 ng/µL), 1 µL each primer (10 µM), 15 µL 2 × Taq PCR Master Mix, and 12µL ddH2O. The PCR amplification reaction was run on a 96-well thermal cycler in the following program: an initial denaturation at 95°C for 5 min, followed by 35 cycles of denaturation at 95°C for 30 s, annealing at 58°C for 30 s, extending at 72°C for 45 s, finally an extra extension at 72°C for 5 mins. The PCR products were detected by 1% agarose gel electrophoresis and the purified PCR products were sequenced by ABI3730xl DNA Analyzer sequencer (Invitrogen Biotechnology Co., Ltd, USA).
Raw sequence reads of mitochondria genome were edited using NGS QC Tool kit (Patel and Jain, 2012), and high-quality reads were assembled into mitochondrial genome using de novo assembler SPAdes v.3.14.1 software (Bankevich et al., 2012). Finally, the assembled complete mitochondria genome was annotated by MITOS (http://mitos.bioinf.uni-leipzig.de/index.py; Bernt et al., 2013), and the circular of P. leptocephalus mitochondria genome map was drawn using Organellar Genome DRAW v1.2.
The 85 P. leptocephalus mitochondrial COI sequences were edited and aligned by MEGA 11. In addition, MEGA 11 were also used for constructing the Maximum-Likelihood phylogenetic tree (ML, 1000 bootstrap replications), and estimating the genetic distances within and among the populations. (Kimura, 1980; Kumar et al., 2016). The basic nucleotide configurations, nucleotide diversity (π), haplotype diversity (h), haplotype number, fixation index (FST, 100 permutations for significance, and 1000 permutations for mantel test), gene flow [Nm, calculated by the formula Nm = (1-FST)/2FST], Tajima’s D and Fu’s Fs test values were analyzed by Arlequin 3.5 (Tajima, 1989; Fu, 1997; Excoffier and Lischer, 2010). The mismatch-distribution analysis was performed by DnaSP v5 with model of constant population size (Librado and Rozas, 2009).
The complete mitochondrial genome of P. leptocephalus was 16,607 bp in length and contained a putative displacement loop (D-loop) locus, 2 ribosomal RNA genes (rRNA), 13 protein coding genes (PCG), and 22 transfer RNA genes (tRNA) (Figure 2; Table 1). Its GC ratio is 46.09%, and the overall nucleotide composition was 18.45% for G, 27.64% for C, 25.86% for T, and 28.05% for A, respectively. To determine the phylogenetic relationship of P. leptocephalus in the subfamily Pseudaspininae, we selected the mitogenome from 12 Leuciscidae species, and use Leuciscus waleckii as an outgroup. As shown in Figure 3, P. leptocephalus and other four Tribolodon were clustered into one branch with a high nodal support value. Additionally, the genomic sequence has been deposited into GenBank under accession OQ389592.
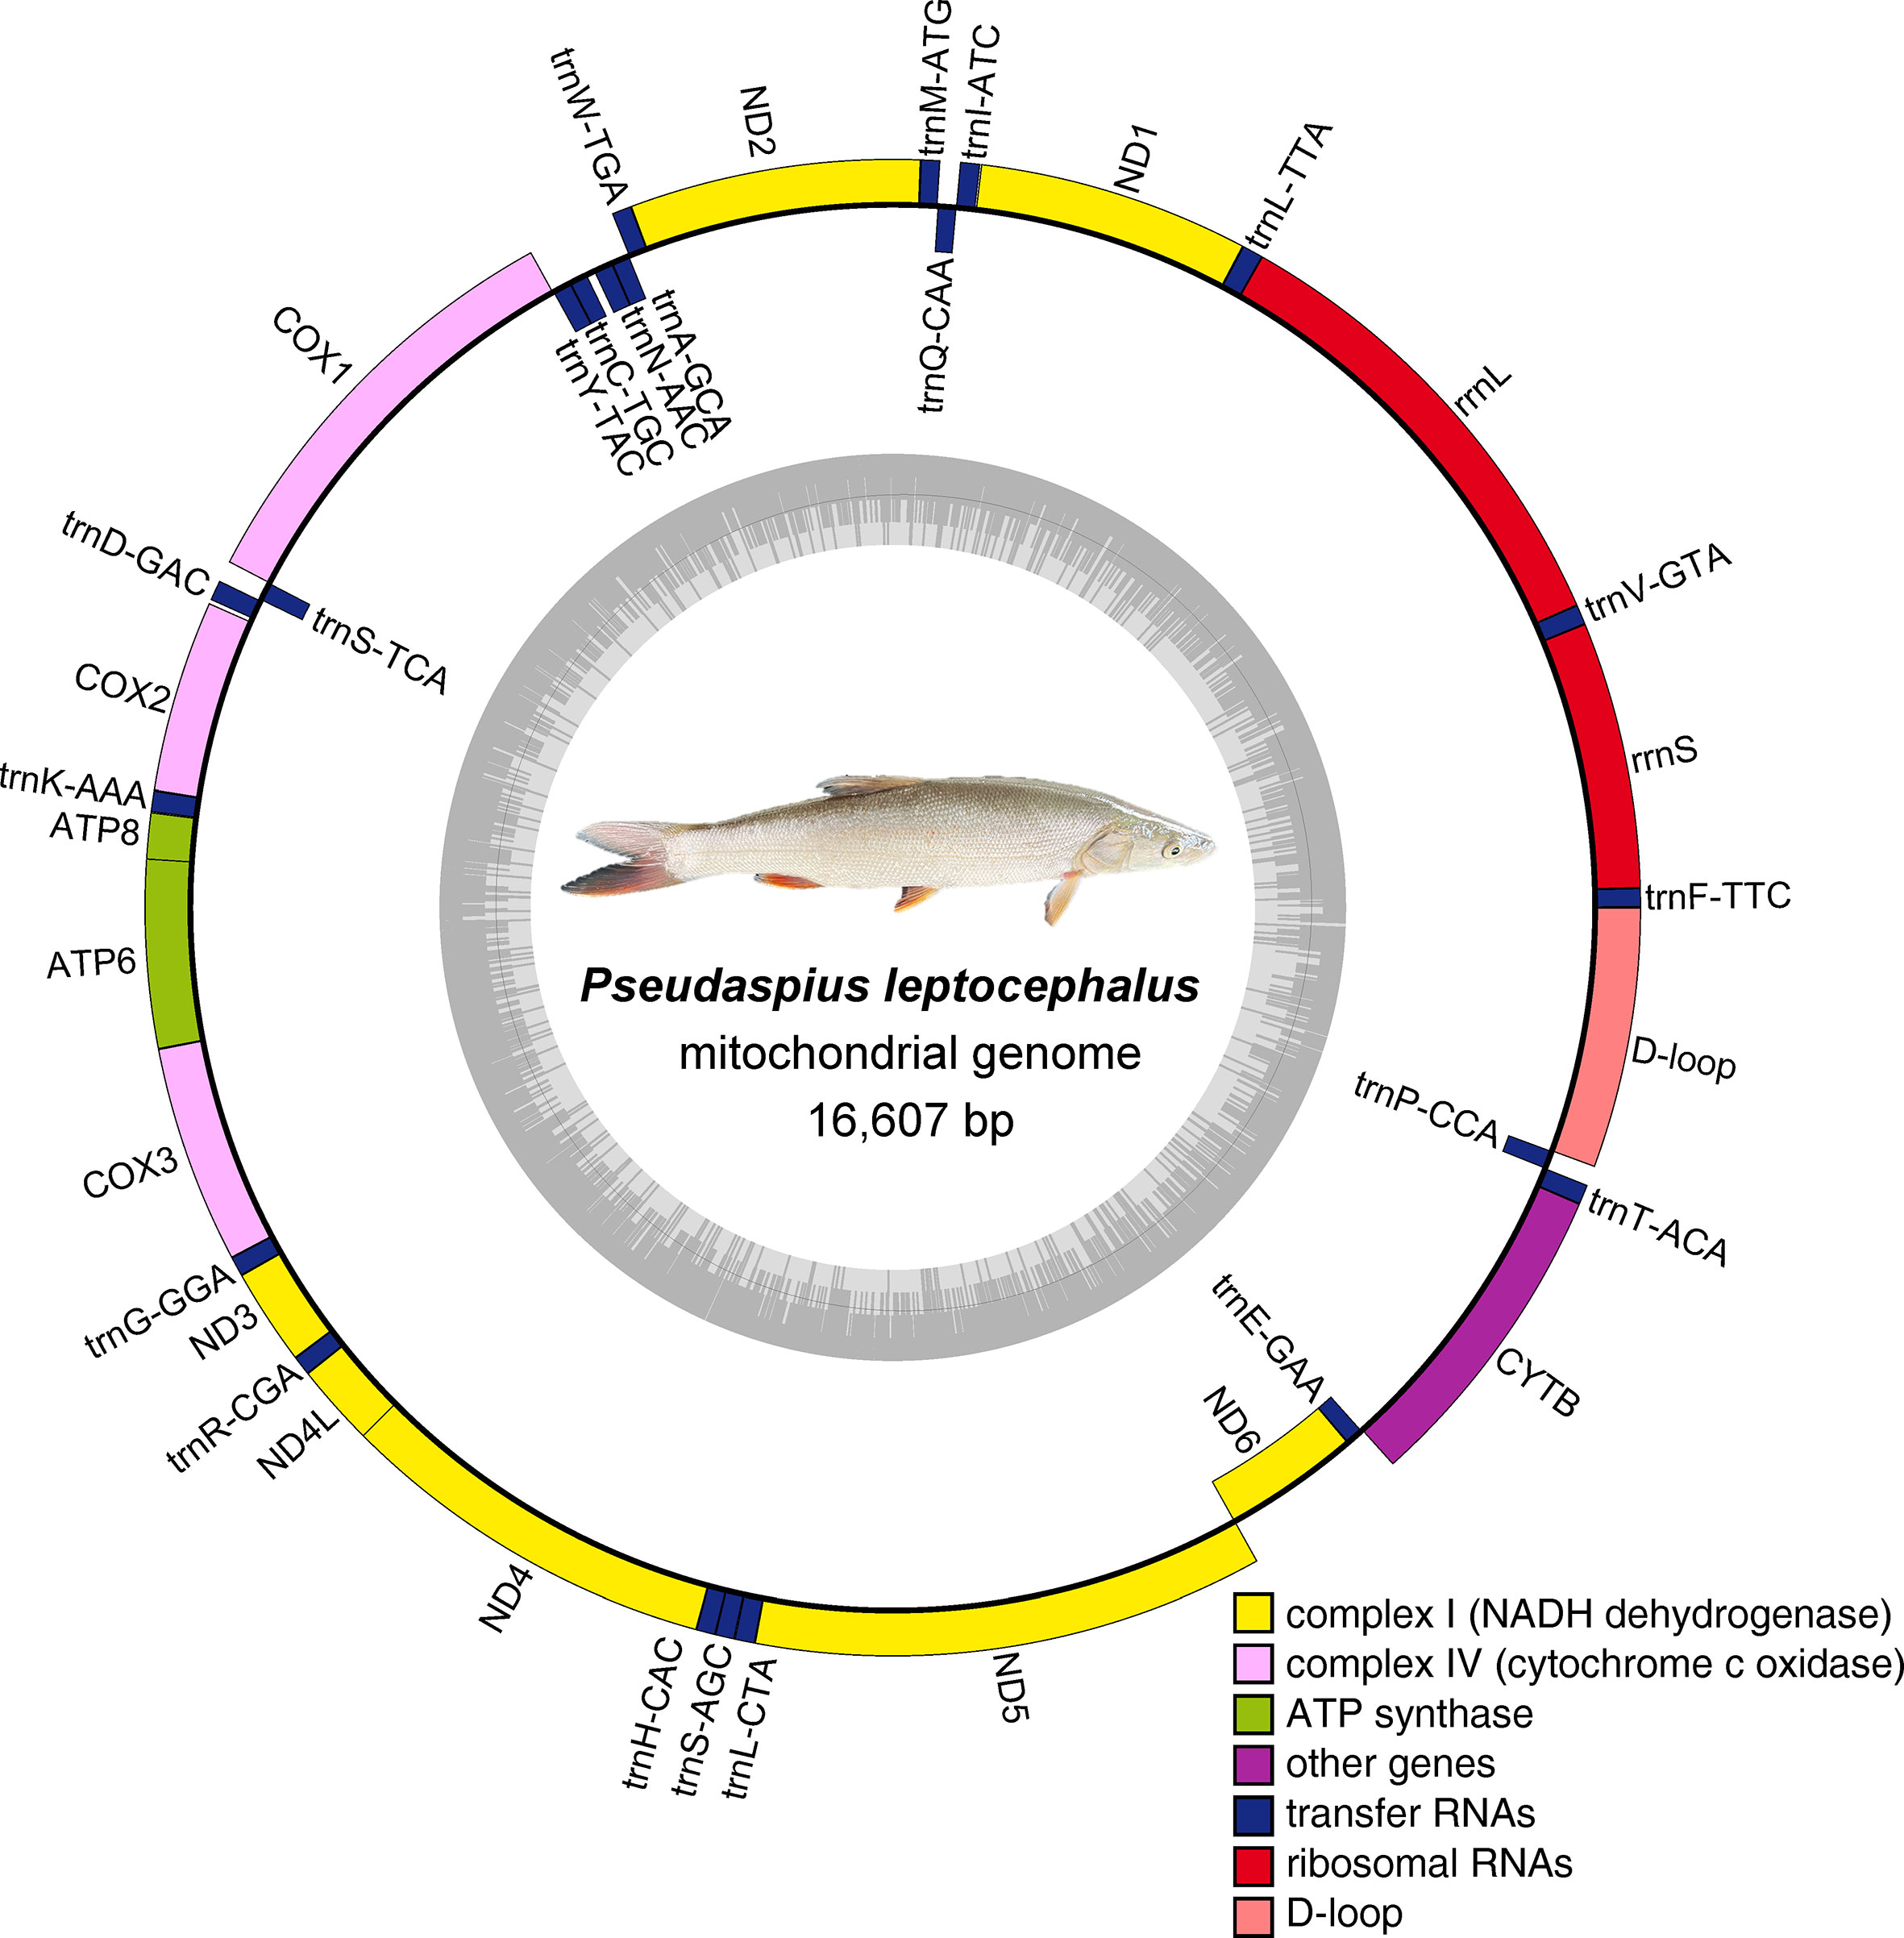
Figure 2 Gene map of the Pseudaspius leptocephalus complete mitochondrial genome Genes encoded on the H-strand and L-strand are shown outside and inside the circular map of the mitogenome, respectively.
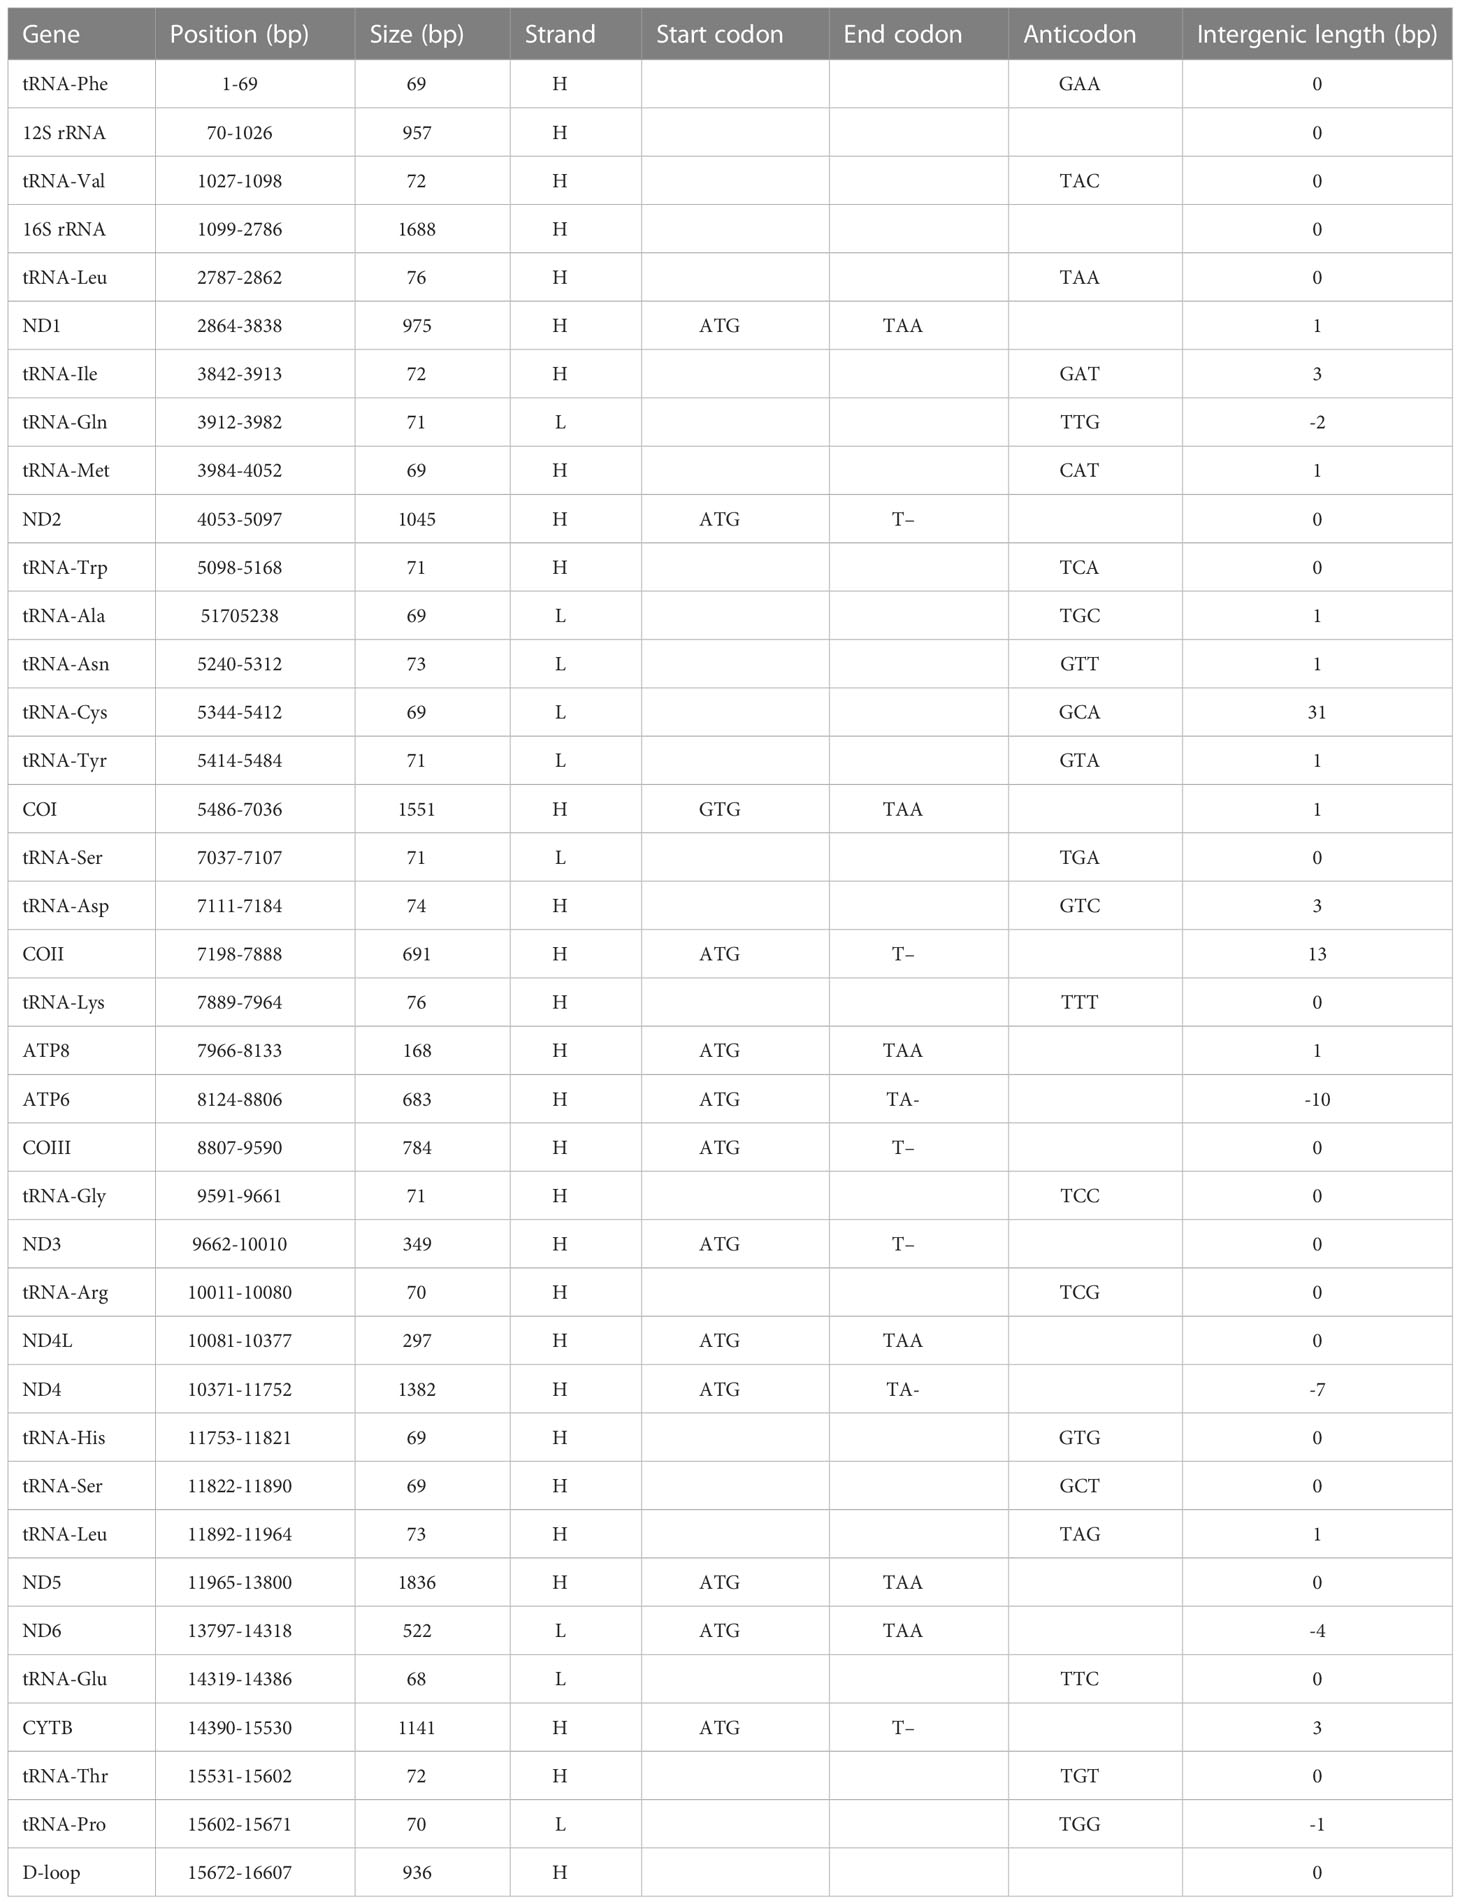
Table 1 Organization of the Pseudaspius leptocephalus mitochondrial genome.
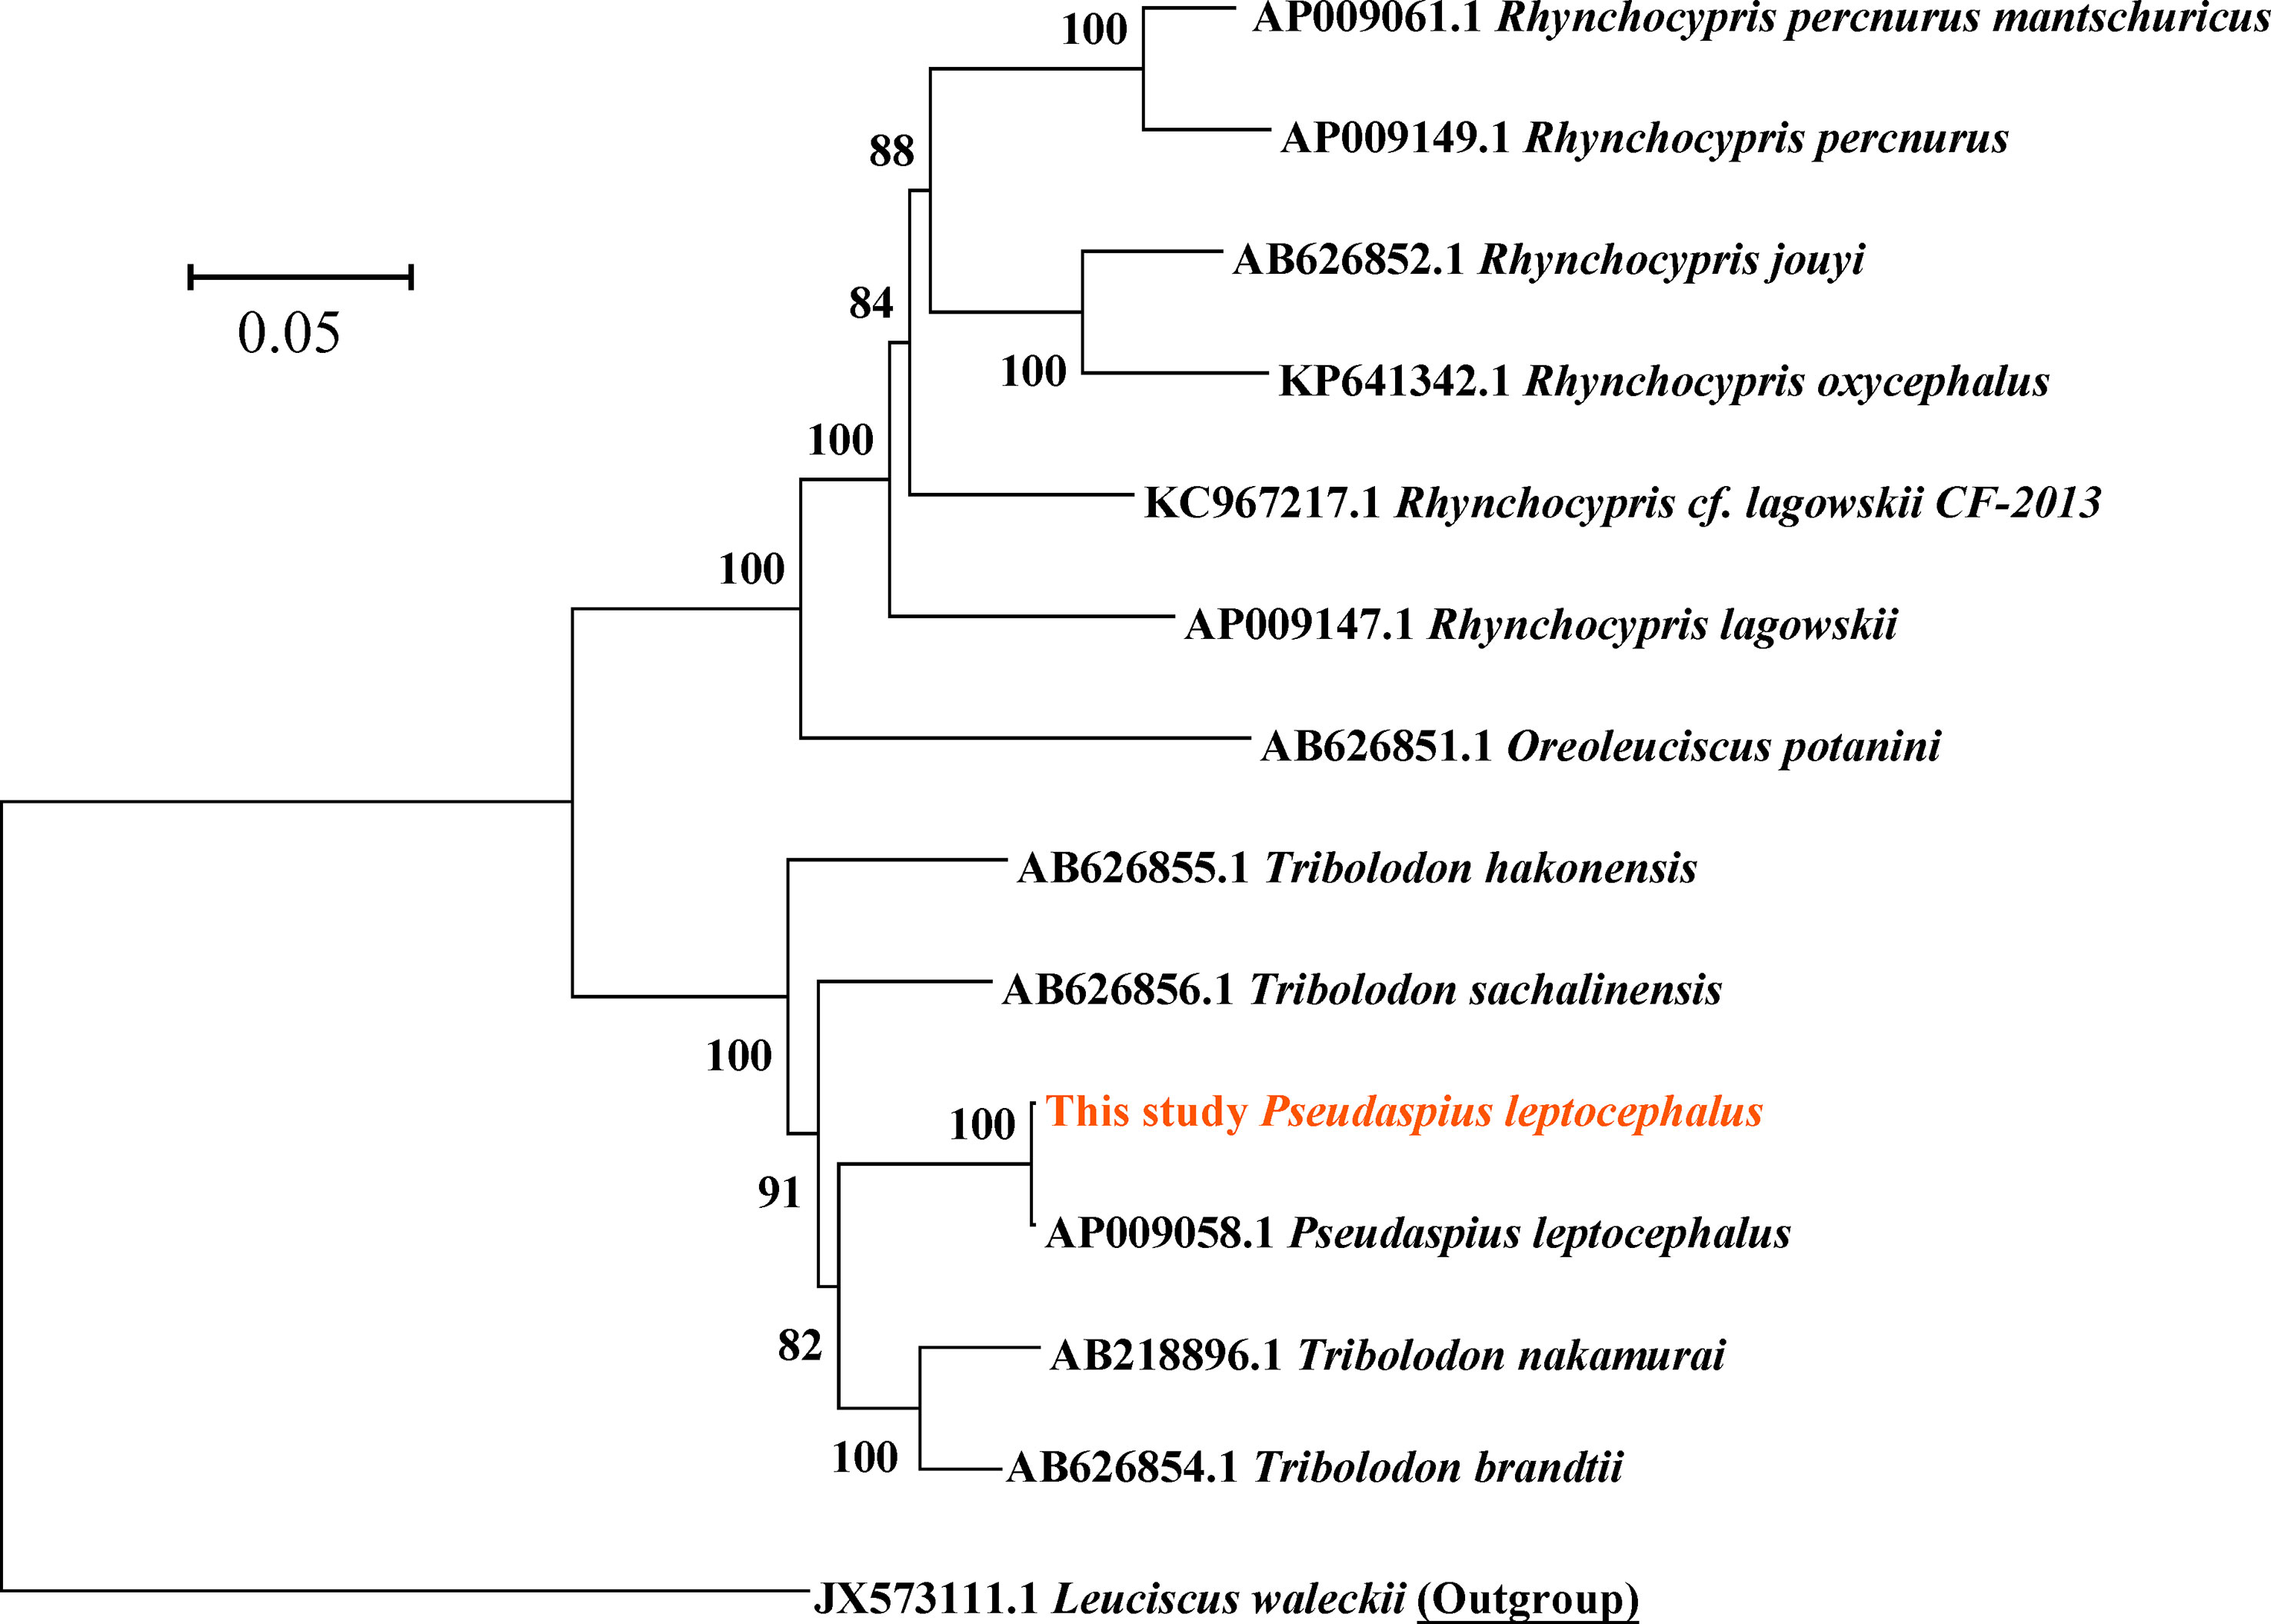
Figure 3 Maximum Likelihood mitogenomic phylogeny based on the mitogenome. The numbers in front of the species are GenBank accession numbers, the scale bar indicates 0.05 base substitutions per site.
In this study, 705 base pair sequences of the COI gene were obtained for downstream analysis. Figure 4 showed the base radio of the four P. leptocephalus populations are similar, and the total base composition was as follows: T = 28.11%, C = 27.23%, A = 25.94%, and G = 18.72%. In all sequences, the GC radio (45.95%) was lower than the AT radio (54.05%). Table 2 showed the size and genetic diversity of 4 P. leptocephalus populations based on COI sequence. In 85 individuals of 4 population, 4 polymorphic sites with 2 parsimony informative sites were detected. A total of 5 haplotypes were detected, and the number of haplotypes ranged from 2 to 4 for each sampled population. In addition, the nucleotide diversity (π) of the 4 populations ranged from 0.00027 (HL) to 0.00065 (EH & MH), the haplotype diversity (h) of 4 populations ranged from 0.192 (HL) to 0.462 (EH), and the total haplotype and nucleotide diversity of 85 individuals was 0.308 and 0.00046, respectively. Table 2 also showed the haplotype distributions of the 4 populations. It is worth noting that there were 2 unique haplotypes (Hap 3 and Hap 5), and 3 shared haplotypes were detected: Hap 1 and Hap 2 shared by all the populations, Hap 4 shared by MH and FY.

Figure 4 Base ratio of 4 Pseudaspius leptocephalus populations.
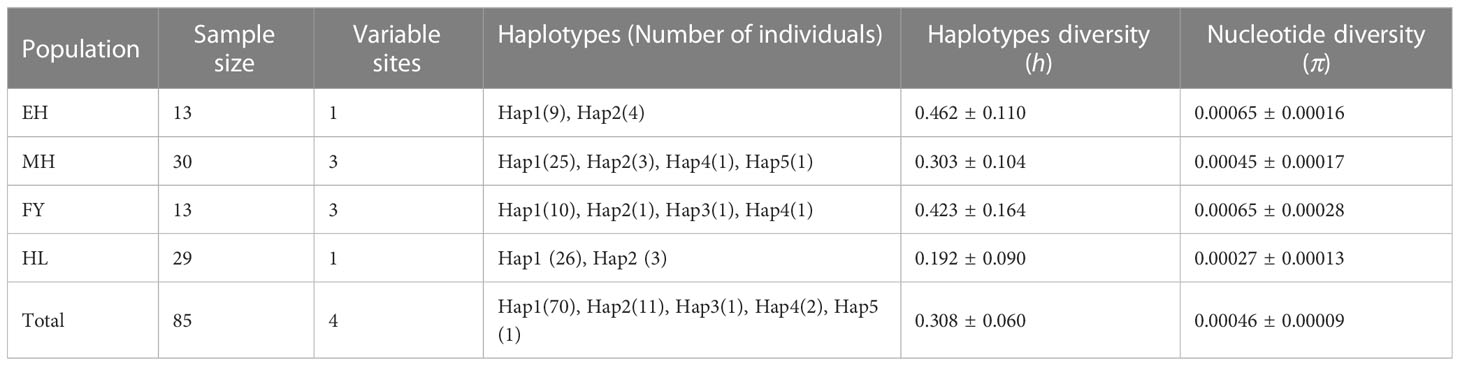
Table 2 Summary statistics for COI polymorphisms of 4 Pseudaspius leptocephalus populations.
Table 3 showed the Pairwise values of genetic distance within and between populations. The genetic distance within the population ranged from 0.0006554 to 0.0002728, and were ranked as follows: 0.0006554 (FY) > 0.0006553 (EH) > 0.0004537 (MH) > 0.0002728 (HL). For the genetic distance between populations, the genetic distance between EH and FY populations were highest (0.0006974), whereas the lowest value were confirmed between MH and HL populations (0.0003541).
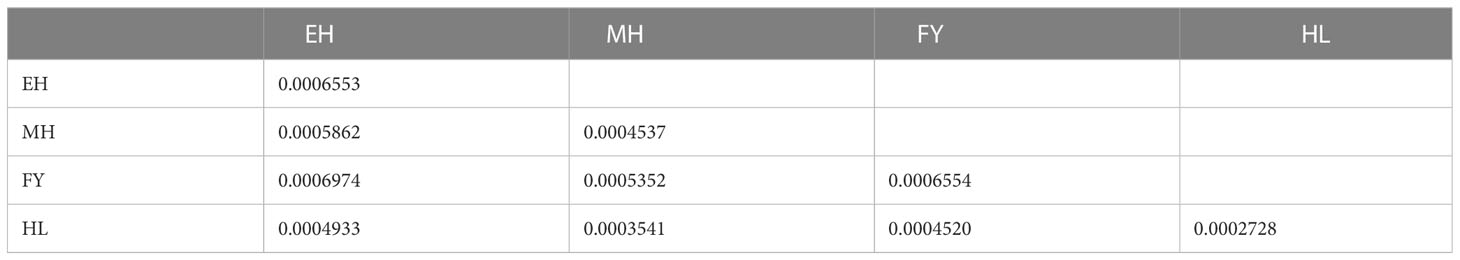
Table 3 Pairwise values of genetic distance between populations (below diagonal) and within population (on diagonal).
The FST values among the four studied populations ranged from -0.0298 to 0.0885 (Table 4, below diagonal), and the results showed that there were no significant were detected (P > 0.05). Additionally, the gene flow from EH population to all other populations were very high, which ranged from 5.1476 (between EH and HL) to 7.0939 (between EH and MH). AMOVA analysis (Table 5) showed that the total variability observed within populations was 98.282%, whereas 1.718% of variation was found between different populations.
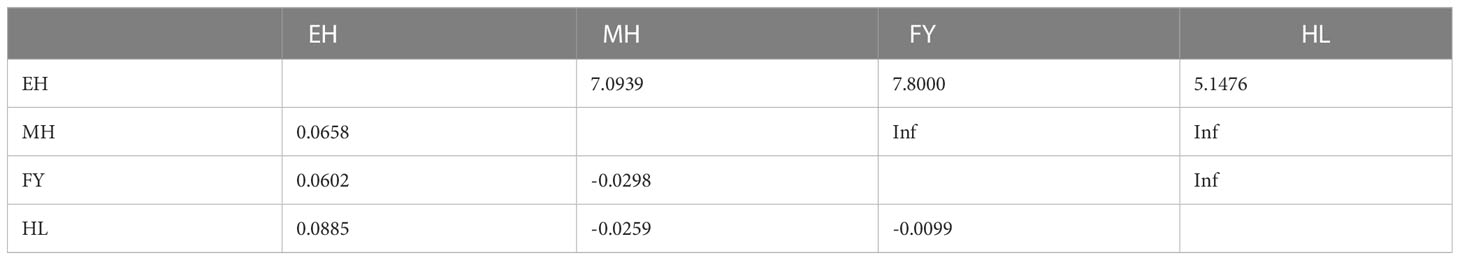
Table 4 Pairwise values of FST (below diagonal) and Nm (above diagonal) between populations.
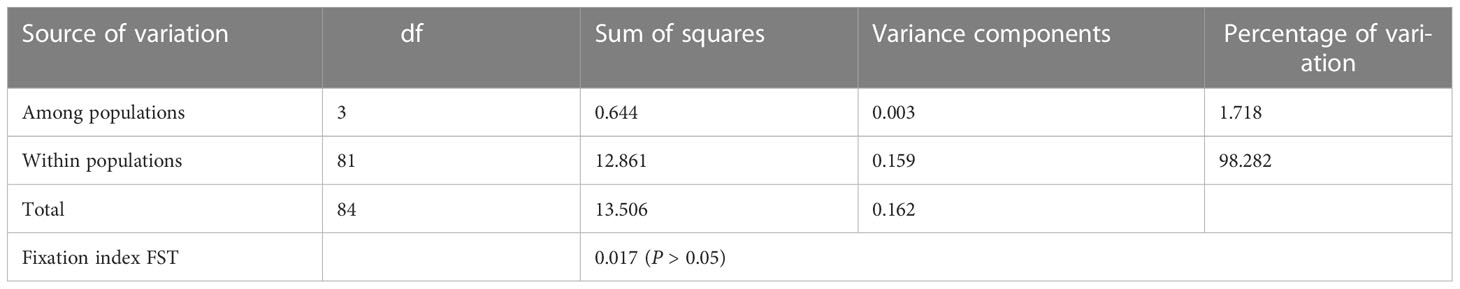
Table 5 Analysis of molecular variance (AMOVA) among 4 populations of Pseudaspius leptocephalus..
The ML tree and the network between haplotypes revealed that there was no significant genealogical differentiation between the 4 P. leptocephalus populations (Figure 5). The ML tree constructed from the 5 haplotypes showed that there were only one main branches (Figure 5A), which was similar to the aggregation of the overall network haplotype distribution (Figure 5B). The median-joining network showed that the 5 haplotypes exhibited a star-like topology, and have clearly defined 3 shared haplotypes (Hap1, Hap 2, and Hap 4). In addition, as most haplotypes surrounding Hap 1, suggesting that Hap 1 may be the maternal ancestral haplotype of P. leptocephalus populations in Heilongjiang River Basin.
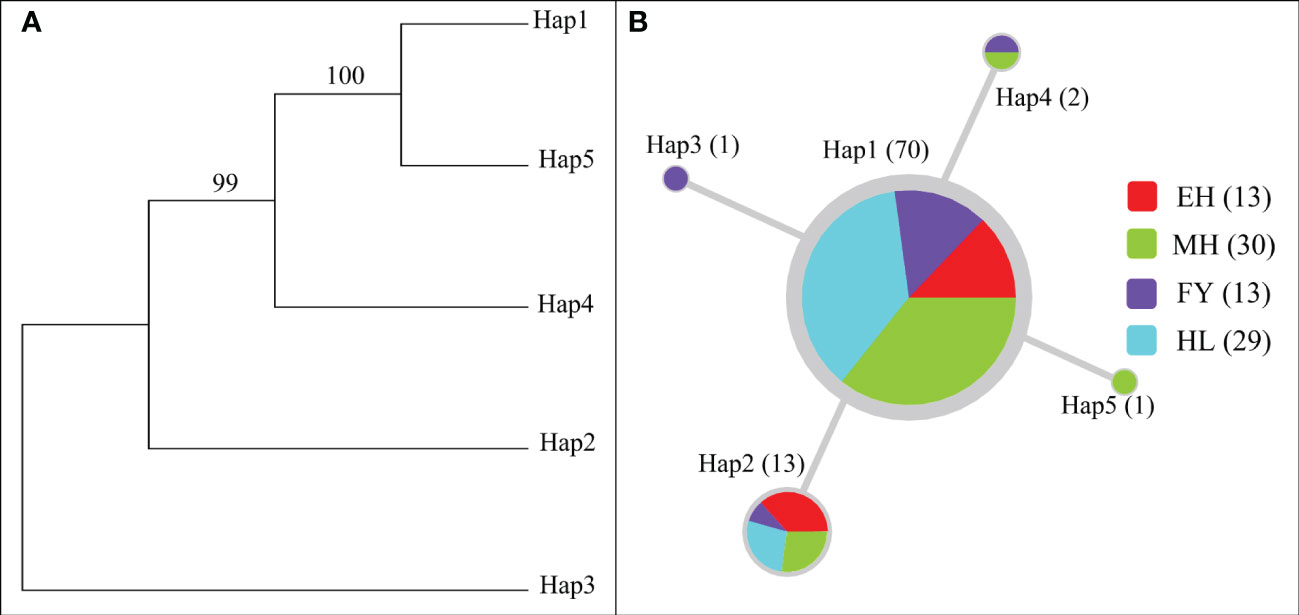
Figure 5 Maximum-Likelihood (ML) tree (A) and median-joining network (B) based on COI haplotypes. Circle sizes indicate the number of individuals in the haplotypes. Different colored in the circles indicate the distribution in different populations, and each line represents a single mutational change.
The results of Tajima’s D and Fu’s Fs tests were showed at Table 6. Fs test values for EH and HL population were positive, whereas the most D test values were negative except for HL population, and most of which didn’t reached a significant level (P > 0.05). The results for MH and FY population were found to be significant for both tests (P < 0.05), which indicated that MH and FY population may deviated from mutation-drift equilibrium and potential population demographic expansion. However, the results of mismatch distribution showed that all the populations are in line with the hypothesis of constant populations (Figure 6).
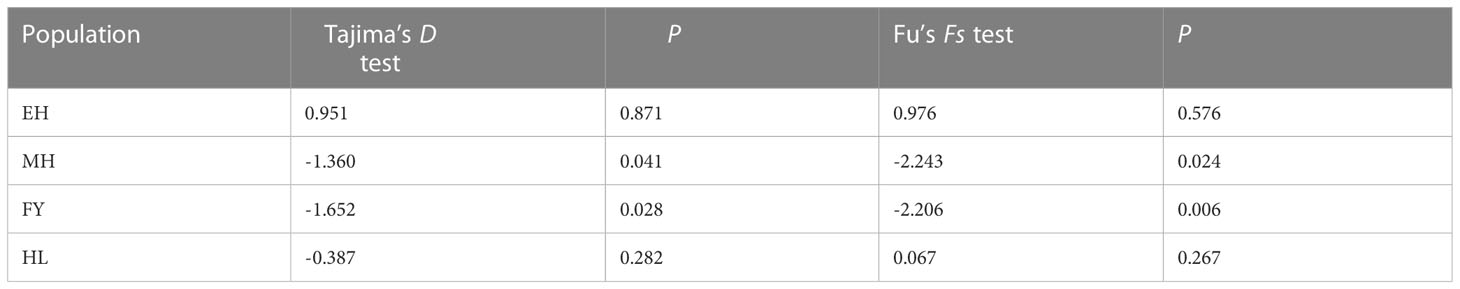
Table 6 Neutrality tests for the genetic populations of Pseudaspius leptocephalus.
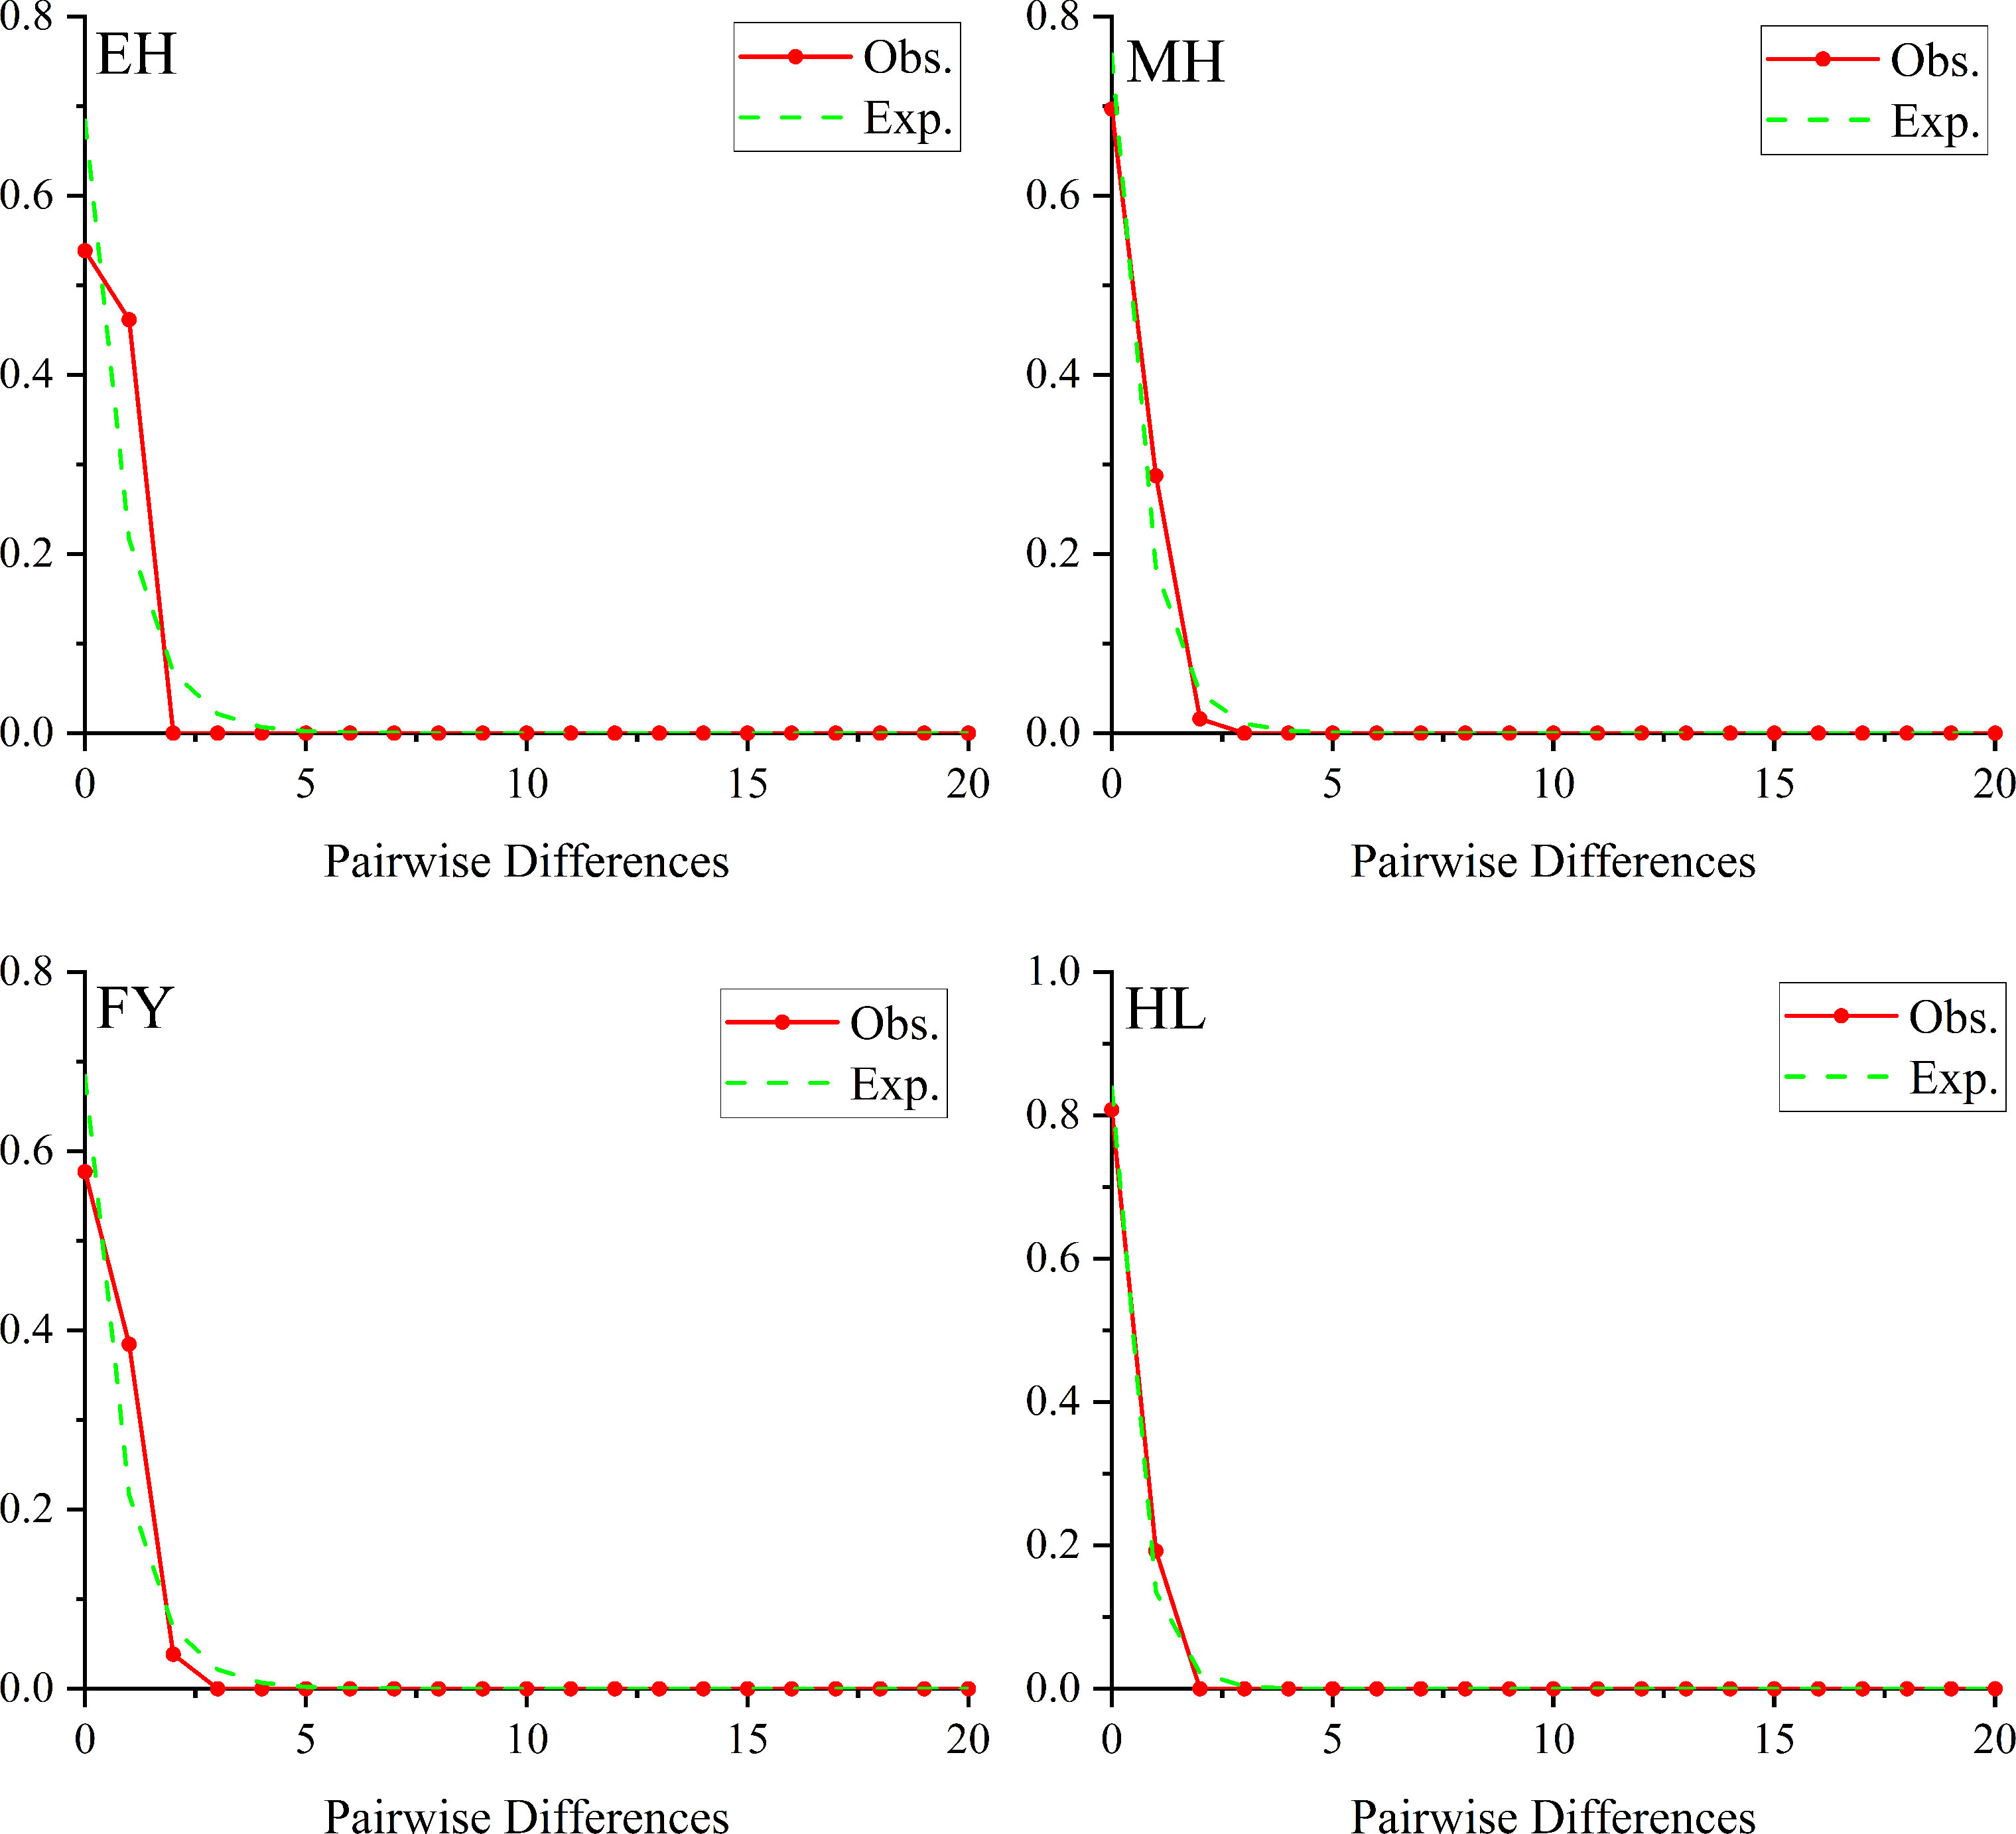
Figure 6 Mismatch distribution for 4 Pseudaspius leptocephalus populations.
The P. leptocephalus mitochondrial genome (16607) consists of a D-loop, 2 rRNA, 22 tRNA, and 13 PCGs, and most genes are heavy (H) strand except for the nine light (L) genes (tRNA-Gln, tRNA-Ala, tRNA-Asn, tRNA-Cys, tRNA-Tyr, tRNA-Ser, tRNA-Glu, tRNA-Pro and ND6). These showed that the mitochondrial genome of P. leptocephalus conforms to a typical teleost mitochondrial order, and is consistent with the mitochondrial genome of Phoxinus cf. Phoxinus (Cheng et al., 2022), Barilius malabaricus (Prabhu et al., 2020), Hemigrammus erythrozonus (Sun CH et al., 2021), Hyphessobrycon amandae (Sun CH et al., 2021), and Channa siamensis (Li et al., 2018). This further shows that the mitochondrial genomes are quite conserved across teleost (Wen et al., 2017; Zou et al., 2017; Sun CH et al., 2021). In addition, phylogenetic analyses in the present study indicated that P. leptocephalus and Tribolodon species should be reclassified into the same genus, which was similar to the results of Sasaki et al. (2007). In this study, we report the whole mitochondrial genome of P. leptocephalus, which could help human to better understand the taxonomic status of P. leptocephalus and provide some new perspectives on the evolutionary mechanism of the Leuciscidae mitochondrial genome.
Genetic diversity is an important basis for the evaluation of population germplasm resources (Zhang et al., 2022). Further, genetic diversity is the basis of species adaptability and evolution, and there is a positive linear relationship between intraspecific genetic diversity and the adaptability of the species to the environment (Cruz et al., 2013). Nucleotide diversity and haplotype diversity are important indicators in terms of revealing mtDNA genetic variation in populations (Liu and Zhang, 2009; Jiang et al., 2019). The total length of the COI sequence of the P. leptocephalus is 155,1 bp, and 705 bp partial fragment of mtDNA COI gene was used to evaluate the genetic diversity of the P. leptocephalus.
The results showed that there was low genetic diversity in the P. leptocephalus populations around Heilongjiang River Basin (h < 0.5, π < 0.005) (Grant and Bowen, 1998), indicating that measures should be taken to protect the resources of the P. leptocephalus in the Heilongjiang River basin, such as prohibiting fishing, establishing protected areas, and proliferating and releasing. In the four P. leptocephalus population, the genetic diversity of HL population is the lowest (h = 0.192; π = 0.00027), this may be because the HL population is a farmed population, caused by limited number of effective parents, genetic drift, and the relatively closed culture environment. It is recommended to introduce wild populations with high genetic diversity to enrich the genetic diversity of HL populations. In this study, we found that EH (h = 0.462; π = 0.00065) and FY (h = 0.423; π = 0.00065) populations have higher genetic diversity, and these two populations can be used as introduced wild populations. The results of genetic distance within the population also supported this proposal. It is worth noting that studies have shown that genetic diversity indices between different genetic markers were not consistent (Duong et al., 2019; Liu et al., 2020; Pan et al., 2021; Sarropoulou et al., 2022), indicating the potential inaccuracy of using only one marker in genetic diversity analysis, and suggesting in future studies, the genetic diversity analysis of other genetic markers should be supplemented.
As the divergence within the species is usually < 0.2 (Thorp, 1982), and we found that the genetic distance was 0.0003541-0.0006974 between different P. leptocephalus populations, indicated that P. leptocephalus populations were closely populations, and were not diverged at subspecies level but the population level (Tsipas et al., 2009). In addition, the limited distribution, the small population size, and the lack of strict isolation between P. leptocephalus populations also determine that it is difficult to develop subspecies. FST values of 0.05-0.15 indicate moderate genetic differentiation, and Nm > 4 indicates that individuals among populations can mate randomly (Wright, 1931; Weir and Cockerham, 1996; Wang et al., 2021). In this study, the values of FST between EH population and other populations ranged from 0.0658 to 0.0885, and Nm values between EH population and other populations ranged from 5.1476 to 7.8000, indicated EH population and other populations were moderate genetic differentiation and individuals between EH population and other populations can mate randomly. This may be because there is no effective geographic isolation between the water systems in the Heilongjiang Basin, and the time for the establishment of farmed population (HL) is relatively short, so they might share the same ancestors. It should be noted that the FST values are not significant, so further research and investigation are needed to explain. The AMOVA analyses revealed that the variation within the populations was the primarily source of the total variation, showed identical structure of four P. leptocephalus populations in this study, which is similar to the previous studies (Duong et al., 2019; Zhang et al., 2020; Fang et al., 2021; Pan et al., 2021).
Studies have shown that the close geographic relationships of freshwater fish were usually revealed by phylogeographical patterns (Granado et al., 2021; Sun N et al., 2021). The Maximum-Likelihood (ML) tree (A) and median-joining network of COI haplotypes showed a single lineage for all P. leptocephalus populations in the Heilongjiang River Basin, suggesting that there was no deep divergence of lineages and all populations were linked (Zhang et al., 2022). These results echoing the results of low genetic differentiation. In this study, 5 haplotypes were found at all P. leptocephalus populations, which was much less than that in Konosirus punctatus (Liu et al., 2020) and Schilbe intermedius (Nneji et al., 2020). This may be due to the differences in species, COI sequencing length, sample size, population number, etc., but the most important reason should be the lack of resources, and low genetic diversity of the P. leptocephalus. Among the 5 haplotypes of P. leptocephalus, Hap 1 and Hap 2 are the haplotypes shared by all populations, and Hap 1 were found in 82.4% (70/85) of all individuals, indicating that Hap 1 is primitive, adaptable to the external environment and can stably exist in the P. leptocephalus population (Liu et al., 2021; Zhao et al., 2021).
The population historical evolution is usually detected by Neutrality tests (Tajima’D and Fu’s Fs) and mismatch distribution analysis (Zhao et al., 2021; Zhang et al., 2022). Zhang et al. (2022) pointed out that the obvious unimodal curve in mismatch distribution analysis and negative and significantly different of Tajima’s D and Fu’s Fs values are considered as the history of population expansion. In this study, significant negative values of Tajima’s D and Fu’s Fs tests (P < 0.05) indicated that MH and FY populations may had experienced population expansion in the recent historical period. Grant and Bowen (1998) described that rapid population expansion after low population size would enhances the retention of new mutations. This is consistent with the results of this study that found a large number of haplotypes (4 haplotypes) and unique haplotype in FY (Hap 3) population. Which indicated that FY populations experienced the population expansion caused by large scale breeding after a sharp decline in population size. On the contrary, the results of mismatch distribution analysis showed that all populations have remained basically stable. Additionally, all the P. leptocephalus populations in this study showed low diversity parameters (h < 0.5, π < 0.005), indicating that P. leptocephalus populations may have recently experienced minority populations (Grant and Bowen, 1998). Therefore, the historical dynamics of the P. leptocephalus populations need more evidence and further research to verify.
In this study, we have sequenced the whole mitochondrial genome of P. leptocephalus, and partial mtDNA COI gene sequences (705 bp) were used to assess the genetic diversity and intraspecific population differentiation of 4 P. leptocephalus populations in the Heilongjiang River Basin. Our results showed that complete mitochondrial genome of P. leptocephalus was 16,607 bp in length, and 4 P. leptocephalus populations in the Heilongjiang River Basin had low genetic diversity and genetic variation. Therefore, it is necessary to strengthen the systematic research and maintenance of the genetic diversity of P. leptocephalus populations in Heilongjiang River Basin. In addition, farmed HL population had the lowest genetic diversity, indicating that there has been germplasm degradation in cultured P. leptocephalus population. The FY populations had higher genetic diversity, indicating that FY populations are potential breeding resources to improve the genetic diversity of farmed population. But, if possible, other wild populations with much higher genetic diversity should be actively developed and introduced. Thus, the results obtained in this study provide a strong basis for the genetic breeding and protection of P. leptocephalus germplasm resources, and provide valuable information for future study of the population structure and genetic diversity of P. leptocephalus.
The data presented in the study are deposited in the GenBank repository, accession number OQ389592.
The animal study was reviewed and approved by Committee for the Welfare and Ethics of Laboratory Animals of Heilongjiang River Fisheries Research Institute, CAFS.
HW: Methodology, investigation, formal analysis, data curation, visualization, writing-original draft. LG: Writing-review & editing, data curation. XS: Resources, investigation. LL: Resources, writing-review & editing. BM: Investigation, supervision. YZ: Investigation, writing-review & editing. WL: Formal analysis, data curation, investigation. WX: Resources, supervision, writing-review & editing, project administration. All authors contributed to the article and approved the submitted version.
This work was supported by the Special Finance for Agricultural in Investigation of fishery resources and environment in key waters of Northeast China, Fundamental Research Fund of Chinese Academy of Fishery Sciences(2020TD56) and National Key Research and development Program of China (2019YFD0900404, 2020YFD0900402).
The authors declare that the research was conducted in the absence of any commercial or financial relationships that could be construed as a potential conflict of interest.
All claims expressed in this article are solely those of the authors and do not necessarily represent those of their affiliated organizations, or those of the publisher, the editors and the reviewers. Any product that may be evaluated in this article, or claim that may be made by its manufacturer, is not guaranteed or endorsed by the publisher.
Alal G. W., Barasa J. E., Chemoiwa E. J., Kaunda-Arara B., Akoll P., Masembe C. (2021). Genetic diversity and population structure of selected lacustrine and riverine populations of African catfish, clarias gariepinus (Burchel 1822), in Kenya. J. Appl. Ichthyol. 37, 427–438. doi: 10.1111/jai.14167
Bankevich A., Nurk S., Antipov D., Gurevich A. A., Dvorkin M., Kulikov A. S., et al. (2012). SPAdes: a new genome assembly algorithm and its applications to single-cell sequencing. J. Comput. Biol. 19, 455–477. doi: 10.1089/cmb.2012.0021
Bao H., Wang G., Yao Y., Peng Z., Dou H., Jiang G. (2021). Warming-driven shifts in ecological control of fish communities in a large northern Chinese lake over 66 years. Sci. Total Environ. 770, 144722. doi: 10.1016/j.scitotenv.2020.144722
Batishcheva N. M., Kartavtsev I., Bogutskaia N. G. (2011). Phylogenetic analysis of Altai osmans of the genus oreoleuciscus (Pisces, Cyprinidae, Leuciscinae), based on the analysis of the cytochrome oxidase 1 gene (Co-1) sequence. Genetika 47, 1335–1345. doi: 10.1134/S1022795411100036
Bernt M., Donath A., Jühling F., Externbrink F., Florentz C., Fritzsch G., et al. (2013). MITOS: improved de novo metazoan mitochondrial genome annotation. Mol. Phylogenet. Evol. 69, 313–319. doi: 10.1016/j.ympev.2012.08.023
Cheng L., Wang E., Li W., Yu X., Liao X. (2022). The complete mitochondrial genome of Eurasian minnow (Phoxinus cf. phoxinus) from the heilongjiang river, and its phylogenetic implications. Animals 12, 2960. doi: 10.3390/ani12212960
Cruz V. M. V., Kilian A., Dierig D. A. (2013). Development of dart marker platforms and genetic diversity assessment of the U.S. collection of the new oilseed crop lesquerella and related species. PloS One 8, e64062. doi: 10.1371/journal.pone.0064062
Duong T. Y., Uy S., Chheng P., So N., Tran T. H. T., Nguyen N. T. T., et al. (2019). Genetic diversity and structure of striped snakehead (Channa striata) in the lower Mekong basin: implications for aquaculture and fisheries management. Fish Res. 218, 166–173. doi: 10.1016/j.fishres.2019.05.014
Emelianova O. R., Grigorov I. V., Orlov A. M., Orlova S. Y. (2022). Polymorphism of mtDNA gene cyt b of the chukchi Sea polar cod, Boreogadus saida (Gadidae, gadiformes), deep-Sea res. Pt. Ii. 206, 105212. doi: 10.1016/j.dsr2.2022.105212
Excoffier L., Lischer H. E. (2010). Arlequin suite ver 3.5: a new series of programs to perform population genetics analyses under Linux and windows. Mol. Ecol. Resour. 10, 564–567. doi: 10.1111/j.1755-0998.2010.02847.x
Fang Y., Chen J., Ruan H., Xu N., Que Z., Liu H. (2021). Genetic diversity and population structure of Metaphire vulgaris based on the mitochondrial COI gene and microsatellites. Front. Genet. 12. doi: 10.3389/fgene.2021.686246
Folmer O., Black M., Hoeh W., Lutz R., Vrijenhoek R. (1994). DNA Primers for amplification of mitochondrial cytochrome coxidase subunit I from diverse metazoan invertebrates. Mol. Mar. Biol. Biotechnol. 3, 294–299.
Fu Y. X. (1997). Statistical tests of neutrality of mutations against population growth, hitchhiking and background selection. Genetics 147, 915–925. doi: 10.1093/genetics/147.2.915
Gissi C., Iannelli F., Pesole G. (2008). Evolution of the mitochondrial genome of metazoa as exemplified by comparison of congeneric species. Heredity 101, 301–320. doi: 10.1038/hdy.2008.62
Granado J., Harmath M., Tecchiati U., Oeggl K., Schibler J., Schlumbaum A. (2021). MtDNA d-loop diversity in alpine cattle during the bronze age. Diversity 13, 449. doi: 10.3390/d13090449
Grant W. S., Bowen B. W. (1998). Shallow population histories in deep evolutionary lineages of marine fishes: insights from sardines and anchovies and lessons for conservation. J. Hered 89, 415–426. doi: 10.1093/jhered/89.5.415
Javonillo R., Malabarba L. R., Weitzman S. H., Burns J. R. (2010). Relationships among major lineages of characid fishes (Teleostei: ostariophysi: characiformes), based on molecular sequence data. Mol. Phylogenet. Evol. 54, 498–511. doi: 10.1016/j.ympev.2009.08.026
Jiang B., Fu J., Don Z., Fang M., Zhu W., Wang L. (2019). Maternal ancestry analyses of red tilapia strains based on d-loop sequences of seven tilapia populations. PeerJ 7, e7007. doi: 10.7717/peerj.7007
Kimura M. (1980). A simple method for estimating evolutionary rates of base substitutions through comparative studies of nucleotide sequences. J. Mol. Evol. 16, 111–120. doi: 10.1007/BF01731581
Krzywinski J., Li C., Morris M., Conn J. E., Lima José B., Povoa M. M., et al. (2011). Analysis of the evolutionary forces shaping mitochondrial genomes of a Neotropical malaria vector complex. Mol. Phylogenet. Evol. 58, 469–477. doi: 10.1016/j.ympev.2011.01.003
Kumar S., Stecher G., Tamura K. (2016). MEGA7: molecular evolutionary genetics analysis version 7.0 for bigger datasets. Mol. Biol. Evol. 33, 1870–1874. doi: 10.1093/molbev/msw054
Lei R., Shore G. D., Brenneman R. A., Engberg S. E., Sitzmann B. D., Bailey C. A., et al. (2010). Complete sequence and gene organization of the mitochondrial genome for hubbards sportive lemur (Lepilemur hubbardorum). Gene 464, 44–49. doi: 10.1016/j.gene.2010.06.001
Li R., Wang G., Wen Z. Y., Zou Y. C., Qin C. J., Luo Y., et al. (2018). Complete mitochondrial genome of a kind of snakehead fish Channa siamensis and its phylogenetic consideration. Genes Genomics 41, 147–157. doi: 10.1007/s13258-018-0746-5
Librado P., Rozas J. (2009). DnaSP v5: a software for comprehensive analysis of DNA polymorphism data. Bioinformatics 25, 1451–1452. doi: 10.1093/bioinformatics/btp187
Liu S., Xue Q., Xu H and Lin Z. (2021). Identification of main oyster species and comparison of their genetic diversity in zhejiang coast, south of Yangtze river estuary. Front. Mar. Sci. 8. doi: 10.3389/fmars.2021.662515
Liu Y. H., Zhang M. H. (2009). Population genetic diversity of roe deer (Capreolus pygargus) in mountains of heilongjinag province. Zool. Res. 30, 113–120. doi: 10.3724/SP.J.1141.2009.02113
Liu B., Zhang K., Zhu K., Shafi M., Gong L., Jiang L., et al. (2020). Population genetics of Konosirus punctatus in Chinese coastal waters inferred from two mtDNA genes (COI and cytb). Front. Mar. Sci. 7. doi: 10.3389/fmars.2020.00534
Nneji L. M., Adeola A. C., Mustapha M. K., Oladipo S. O., Djagoun C. A. M. S., Nneji I. C., et al. (2020). DNA Barcoding silver butter catfish (Schilbe intermedius) reveals patterns of mitochondrial genetic diversity across African river systems. Sci. Rep. 10, 7097. doi: 10.1038/s41598-020-63837-4
Pan Z., Zhao H., Zhu C., Chen H., Zhao P., Cheng Y. (2021). Genetic diversity analysis of crucian carp (Carassius auratus) based on cyt b and d-loop-containing region around hongze lake. Environ. Biol. Fish. 104, 1401–1420. doi: 10.1007/s10641-021-01175-8
Patel R. K., Jain M. (2012). NGS QC toolkit: a toolkit for quality control of next generation sequencing data. PloS One 7, e30619. doi: 10.1371/journal.pone.0030619
Paz F. P., Batista J. D., Porto J. I. (2014). DNA Barcodes of rosy tetras and allied species (Characiformes: characidae: hyphessobrycon) from the Brazilian Amazon basin. PloS One 9, e98603. doi: 10.1371/journal.pone.0098603
Petr R. (1991). The karyotype of the cyprinid fish Pseudaspius leptocephalus. Japanese J. Ichthyology 38 (3), 329–331. doi: 10.11369/jji1950.38.329
Prabhu V. R., Singha H. S., Kumar R. G., Gopalakrishnan A., Nagarajan M. (2020). Characterization of the complete mitochondrial genome of Barilius malabaricus and its phylogenetic implications. Genomics 112, 2154–2163. doi: 10.1016/j.ygeno.2019.12.009
Sarropoulou X., Tsaparis D., Tsagarakis K., Badouvas N., Tsigenopoulos C. S. (2022). Different patterns of population structure and genetic diversity of three mesopelagic fishes in the Greek seas. Mediterr. Mar. Sci. 23, 536–545. doi: 10.12681/mms.28567
Sasaki T., Kartavtsev Y. P., Chiba S. N., Uematsu T., Sviridov V. V., Hanzawa N. (2007). Genetic divergence and phylogenetic independence of far Eastern species in subfamily Leuciscinae (Pisces: Cyprinidae) inferred from mitochondrial DNA analyses. Genes Genet. Syst. 82, 329–340. doi: 10.1266/ggs.82.329
Semenchenko N. N. (2020). Growth of amur flathead asp Pseudaspius leptocephalus (Pallas 1776). Izvestiya TINRO 200, 118–130. doi: 10.26428/1606-9919-2020-200-118-130
Semenchenko N. N., Ostrovskaya E. V. (2020). Reproductive biology of amur flathead asp Pseudaspius leptocephalus (Pallas 1776). Izvestiya TINRO. 200, 308–320. doi: 10.26428/1606-9919-2020-200-308-320
Semina A. V., Polyakova N. E., Brykov V. A. (2007). Analysis of mitochondrial DNA: taxonomic and phylogenetic relationships in two fish taxa (Pisces: mugilidae and Cyprinidae). Biochem. Moscow 72, 1349–1355. doi: 10.1134/S0006297907120085
Sharma A., Siva C., Ali S., Sahoo P. K., Nath R., Laskar M. A., et al. (2020). The complete mitochondrial genome of the medicinal fish, Cyprinion semiplotum: insight into its structural features and phylogenetic implications. Int. J. Biol. Macromol. 164, 939–948. doi: 10.1016/j.ijbiomac.2020.07.142
Staden M. V., Ebert D. A., Silva C. D., Merwe A. E. B. D. (2022). Comparative analyses of the complete mitochondrial genomes of two southern African endemic guitarfish, Acroteriobatus annulatus and a. blochii. Int. J. Biol. Macromol. 223, 1094–1106. doi: 10.1016/j.ijbiomac.2022.10.285
Sultana S., Mahmud H. M., Shahdat H. M., Abdul A. M., Das K. C., Moniruzzaman M., et al. (2022). Assessment of genetic diversity and population structure of Tenualosa ilisha in Bangladesh based on partial sequence of mitochondrial DNA cytochrome b gene. Ecol. Genet. Genomics 25, 100139. doi: 10.1016/j.egg.2022.100139
Sun C. H., Liu H. Y., Xu N., Zhang X. L., Zhang Q., Han B. P. (2021). Mitochondrial genome structures and phylogenetic analyses of two tropical Characidae fishes. Front. Genet. 12. doi: 10.3389/fgene.2021.627402
Sun N., Zhu D. M., Li Q., Wang G. Y., Chen J., Zheng F., et al. (2021). Genetic diversity analysis of Topmouth culter (Culter alburnus) based on microsatellites and d-loop sequences. Environ. Biol. Fish. 104, 213–228. doi: 10.1007/s10641-021-01062-2
Tajima F. (1989). Statistical method for testing the neutral mutation hypothesis by DNA polymorphism. Genetics 123, 585–595. doi: 10.1101/gad.3.11.1801
Thorp J. P. (1982). The molecular clock hypothesis: biochemical evolution, genetic differentiation, and systematic. Annu. Rev. Ecol. Syst. 13, 139–168. doi: 10.1146/annurev.es.13.110182.001035
Tsipas G., Tsiamis G., Vidalis K., Bourtzis K. (2009). Genetic differentiation among Greek lake populations of Carassius gibelio and Cyprinus carpio carpio. Genetica 136, 491–500. doi: 10.1007/s10709-008-9331-1
Wang H., Zhong X., Lin H., Li S., Yi J., Zhang G., et al. (2021). Genetic diversity and population structure of Gynaephora qinghaiensis in yushu prefecture, qinghai province based on the mitochondrial COI gene. Biochem. Genet. 59, 1396–1412. doi: 10.1007/s10528-021-10065-8
Weir B. S., Cockerham C. C. (1996). Genetic data analysis II: methods for discrete population genetic data (Sunderland, MA: Sinauer Assoc. Inc).
Wen Z. Y., Xie B. W., Qin C. J., Wang J., Yuan D. Y., Li R., et al. (2017). The complete mitochondrial genome of a threatened loach (Beau-fortia kweichowensis) and its phylogeny. Conserv. Genet. Resour. 9, 565–568. doi: 10.1007/s12686-017-0723-3
Wright S. (1931). Evolution in mendelian populations. Genetics 16, 97–159. doi: 10.1093/genetics/16.2.97
Xu W., Geng L. W., Jin H. Y., Li L., Shang X. C., Ma B., et al. (2021). Resource investigation and biological determination of Pseudaspius leptocephalus in heilongjiang river. Freshwater Fisheries 51, 36–42. doi: 10.13721/j.cnki.dsyy.2021.06.005
Xu D., Lou B., Shi H., Geng Z., Li S., Zhang Y. (2012). Genetic diversity and population structure of Nibea albiflora in the China Sea revealed by mitochondrial COI sequences. Biochem. Systematics Ecology. 45, 158–165. doi: 10.1016/j.bse.2012.07.028
Yang J., Geng L., Wang Y., Zhang Y., Zhang Y., Ma B., et al. (2021). Embryonic and larval-juvenile developmental characteristics of Pseudaspius leptocephalus. Acta Hydrobiologica Sin. 45, 636–644. doi: 10.7541/2021.2020.017
Yang M., Yang Z., Liu C., Lee X., Zhu K. (2022). Characterization of the complete mitochondrial genome of the spotted catfish Arius maculatus (Thunberg 1972) and its phylogenetic implications. Genes 13, 2128. doi: 10.3390/genes13112128
Zhang D. C., Gong F. H., Liu T. T., Guo H. Y., Zhang N., Zhu K. C., et al. (2015). Shotgun assembly of the mitochondrial genome from Fenneropenaeus penicillatus with phylogenetic consideration. Mar. Genom. 24, 379–386. doi: 10.1016/j.margen.2015.09.005
Zhang W., Jiang S., Salumy K. R., Xuan Z., Xiong Y., Jin S., et al. (2022). Comparison of genetic diversity and population structure of eight Macrobrachium nipponense populations in China based on d-loop sequences. Aquacult. Rep. 23, 101086. doi: 10.1016/j.aqrep.2022.101086
Zhang Q., Sun C., Zhu Y., Xu N., Liu H. Y. (2020). Genetic diversity and structure of the round-tailed paradise fish (Macropodus ocellatus): implications for population management. Glob. Ecol. Conserv. 21, e00876. doi: 10.1016/j.gecco.2019.e00876
Zhao Y., Zhu X., Jiang Y., Li Z., Li X., Xu W., et al. (2021). Genetic diversity and variation of seven Chinese grass shrimp (Palaemonetes sinensis) populations based on the mitochondrial COI gene. BMC Ecol. Evol. 21, 167. doi: 10.1186/s12862-021-01893-8
Zhao Y. Y., Zhu X. C., Li Y. D., Han Z. B., Xu W. B., Dong J., et al. (2019). Mito-chondrial genome of Chinese grass shrimp, Palaemonetes sinensis, and comparison with other Palaemoninae species. Sci. Rep. 9, 17301. doi: 10.1038/s41598-019-53539-x
Zhu K. C., Liang Y. Y., Wu N., Guo H. Y., Zhang N., Jiang S. G., et al. (2017). Sequencing and characterization of the complete mitochondrial genome of Japanese swellshark (Cephalloscyllium umbratile). Sci. Rep. 7, 15299. doi: 10.1038/s41598-017-15702-0
Keywords: mitochondrial DNA, Pseudaspius leptocephalus, genetic diversity, population structure, COI
Citation: Wei H, Geng L, Shang X, Li L, Ma B, Zhang Y, Li W and Xu W (2023) Comparison genetic diversity and population structure of four Pseudaspius leptocephalus populations in Heilongjiang River Basin based on mitochondrial COI gene. Front. Mar. Sci. 10:1158845. doi: 10.3389/fmars.2023.1158845
Received: 04 February 2023; Accepted: 02 May 2023;
Published: 16 May 2023.
Edited by:
Wei Huang, Ministry of Natural Resources, ChinaReviewed by:
Min Li, Chinese Academy of Fishery Sciences (CAFS), ChinaCopyright © 2023 Wei, Geng, Shang, Li, Ma, Zhang, Li and Xu. This is an open-access article distributed under the terms of the Creative Commons Attribution License (CC BY). The use, distribution or reproduction in other forums is permitted, provided the original author(s) and the copyright owner(s) are credited and that the original publication in this journal is cited, in accordance with accepted academic practice. No use, distribution or reproduction is permitted which does not comply with these terms.
*Correspondence: Wei Xu, eHdzYzIzQDE2My5jb20=
Disclaimer: All claims expressed in this article are solely those of the authors and do not necessarily represent those of their affiliated organizations, or those of the publisher, the editors and the reviewers. Any product that may be evaluated in this article or claim that may be made by its manufacturer is not guaranteed or endorsed by the publisher.
Research integrity at Frontiers
Learn more about the work of our research integrity team to safeguard the quality of each article we publish.