 Zhanming Hu1
 Mingliang Zhang
- 1Marine Dynamics Department, National Marine Environmental Monitoring Center, Dalian, China
- 2College of Ocean Science and Environment, Dalian Ocean University, Dalian, China
- 3Technology Innovation Center for Coastal Ecological Environment and Disaster Protection, Liaoning, Dalian, China
Predicting net river fluxes is important to promote good water quality, maritime transport, and water exchange in estuaries. However, few studies have observed and evaluated net water fluxes to estuaries under complex conditions. This study used advanced survey techniques to obtain high-frequency monitoring data of cross-sectional current velocity, water level, and salinity in the Liao River Estuary (LRE) from 2017 to 2020. The net water flux into the sea was computed based on field data and the impacts of the rubber dam and sea ice cover on water flux and salinity processes were analyzed in the study region. In the Liao River Station (LRS), the fluctuations of water level and discharge were not obvious in winter due to the sea ice cover. There were significant seasonal and inter-annual changes in water fluxes due to variability in river discharge and tidal oscillations. The results also showed that the net water flux into the sea from the LRS was positive in wet season, and greater during ebb tides than flood tides. The net water fluxes in the normal and dry seasons were mostly negative due to the influence of tides, indicating that the annual runoff from the Liao River fluctuated greatly throughout the year. The water flux in the LRS was more suitable for representing water flux into the sea than the Liujianfang Hydrometric Station (LHS) in the LRE. The impacts of the rubber dam and Panshan Sluice on water fluxes to the sea were both significant. Lower salinity in the study area coincided mostly with height water fluxes to the sea and periods when the rubber dam was raised. This study results provide us new insights to measure the water flux into sea under the condition of ice cover in the tidal reach of estuary and the method can be used for water flux observation for other estuaries.
Introduction
Estuaries are transition regions between freshwater and marine systems, subjected to both terrestrial and oceanic processes from the upstream river and tide from the open sea (de Pablo et al., 2022). The saline water bodies of estuaries are diluted by inflowing freshwater, and studies have shown that water quality, water temperature, biogeochemical processes, and species abundances in estuaries are sensitive to changes in freshwater input (Bartsch et al., 2014; Zamparas and Zacharias, 2014; Priya et al., 2016; Onabule et al., 2020; Chin et al., 2022). Furthermore, freshwater inputs from rivers determine the estuarine salinity gradients which are critical to the growth and development of many salt-marsh plants in estuarine tidal flats (Sheldon et al., 2017; Chen et al., 2022). These influences are especially critical in shallow bays with weak connections to the ocean, or in estuaries affected or transformed by manmade structures and human activities. Thus the fluxes of freshwater into the sea are especially important for understanding the coupling between river discharge and marine ecosystem processes in coastal and estuarine regions.
The fluxes in freshwater inflow in estuaries vary in time and space and are influenced by a suite of factors. For example, freshwater flux can be significantly impacted by high river discharge from upstream rivers (Ji and Zhang, 2019) as well as by tidal current intensity and tidal range (Mou et al., 2022), which were observed to dominate the water exchange processes in partially-mixed and bar-built estuaries (Lemagie and Lerczak, 2015). In addition to river and tidal forcings, estuarine depth and human influences can also influence water flux exchange mechanisms (Chin et al., 2022). This wide variety of influencing factors makes the evaluation about freshwater flux in estuaries critical to further understanding estuarine processes. In general, quantifying freshwater fluxes along estuarine cross sections can be achieved using a variety of methods. In terms of spatial and temporal measurements, Acoustic Doppler Current Profilers (ADCPs) are advanced tools capable of measuring different water body parameters, and have become standard in measurement methods (Lane et al., 1997; Sakho et al., 2019; Zhu et al., 2021; Li and Boswell, 2022). Straightforward volume calculations can be used to determine water fluxes, where the detailed intertidal bathymetry, tidal current, and accurate tidal water level data based on field surveys are required to obtain a complete coverage of tidally affected areas over tidal timescales (Fukamachi et al., 2010; Li et al., 2018; Shin et al., 2022). For example, shipboard ADCPs measurements can be used to provide vertical profiles of velocities and to compute tidally varying discharges in estuarine channels and regions (Dinehart and Burau, 2005; Chen et al., 2021; Zhu et al., 2022). The data from bottom-mounted ADCPs can be used to describe seasonal and spatial variation in current structure, such as volume transport, which was calculated across the Jeju Strait and Portsmouth Harbour (Onabule et al., 2020). However, under-ice discharge must also be considered when estimating the fresh water flux into open-sea, but the measurement water flow for ice-affected sites are generally qualified as poor. To overcome this obstacle, one possible field approach is to moor an ADCP at the sea bottom and river bed to analyze the impacts of ice cover on near-bed flow characteristics in rivers (Fulton et al., 2018; Lotsari et al., 2022) and estimate vertical and temporal variability in total suspended particulate matter (Ha et al., 2015).
Salinity intrusion is a growing problem and may adversely affect drinking-water supplies and aquatic environments in tidal estuaries around the world, as well as coastal agriculture, which may experience yield reductions due to salinity increases during sea water inundation (Kaniewski et al., 2016). Freshwater inputs in estuaries influence the net downstream transport of water within the estuaries, therefore the regulation of freshwater inflows has become the primary means of maintaining preferable estuarine salinity gradients in many coastal management strategies. Some hydraulic structures, such as dams and weirs, have been built at estuary mouths to limit tidal influences and protect water supplies for irrigation and domestic usage from the intrusion of salt water (Kennish, 2001; Sin and Lee, 2020; Figueroa et al., 2022), but their effects on estuarine environments are not well understood. Previous field surveys have observed water flux and salinity transport behaviors in estuaries operating with sluice gates (Kwak et al., 2023; Liu et al., 2023), and significant variations in the water flux and salinity gradient were observed in the water body of the study region due to the combined effects of sluices and open sea tides. To understand the effects of estuarine dams on estuarine environments, a series of related studies have been reported in the literature (Lavín and Sánchez, 1999; Van Proosdij et al., 2009), where the characteristics of salinity gradients and estuarine circulation were analyzed in the presence of estuarine dams. Other studies focusing primarily on the dam-controlled freshwater fluxes using extensive field hydrodynamics data and numerical models of tidal currents in shallow estuaries showed that estuarine environments were significantly influenced by river discharge, tidal range, wind and dams (Kim et al., 2006; Xia et al., 2011; Kang et al., 2017; Prasad et al., 2018; Ahn et al., 2020). Similarly, after dam construction, series of ship-borne surveys using ADCPs and CTD instruments were used to investigate the role of the dam-induced horizontal salinity gradient in stratification and sediment dynamics, which helped to understand the response of estuarine systems to seasonal and tidal controls (Figueroa et al., 2020; Figueroa et al., 2022). However, literature reporting field surveys of water flux to the sea and salinity variation in tidal reaches with estuarine dams and ice cover are relatively rare, therefore the effects of estuarine dams and ice cover on river fluxes into the sea and salinity in the tidal reach are not well understood.
Predicting net river fluxes into the sea is central to maintaining good water quality, maritime transport, and agricultural production in estuarine regions, especially in areas affected by estuarine dams. To expand our knowledge about how the net water flux into sea and salinity variations are influenced by estuarine dams and ice cover, a long term field survey was conducted to observe water levels and tidal currents in an estuary with an estuarine rubber dam from 2017 to 2020, followed by an evaluation of the salinity and water inflow fluxes into the Liao River Estuary (LRE) over broad regions of the Liao River. This paper is organized as follows. Firstly, we describe the field survey methods using representative points to monitor the flow current and water level in the transition region between river into sea using the H-ADCP instrument. The method is then validated by comparing the monitoring data to the data of an ADCP navigation survey from the marine environment. Secondly, we compare water surface level and discharge in the surveyed cross-section with an estuarine dam based on high resolution observation level data. Thirdly, we calculate the monthly and annual water fluxes into the LRE and analyze the uncertainty. Finally, we investigate the response of river flux and salinity to the operation of a rubber dam. This method provides technological support that will facilitate the monitoring of water fluxes and pollution fluxes from rivers to sea.
Material and methods
Study area
The Liao River Estuary is located in the northernmost part of Liaodong Bay near Panjin City in Liaoning Province, China and covers a total area of 360 km2 (Figure 1A). The LRE is affected by saline water from Liaodong Bay and runoff from the Liao River, Daliao River, and Daling River, of which Liao River is the largest. Of the eight major river systems in China the Liao River has the highest latitude, and the tidal reach is restricted by ice for about three months every year. Tides adjacent to this study region are semi-diurnal, with two high and low tides every day, and a maximum tidal range of about 4.4 m. The study region has a complex geomorphology with numerous tidal trenches and tidal flats distributed alternately. The salt-marsh plants of the tidal flats are dominated by reeds and Suaeda salsa, which are responsible for the rare natural landscape known as the “pink beach” (Chen et al., 2022), this area is the largest reed wetland reserve in China. Because the land is fertile and water is sufficient, it is also an important rice production area in northern China.
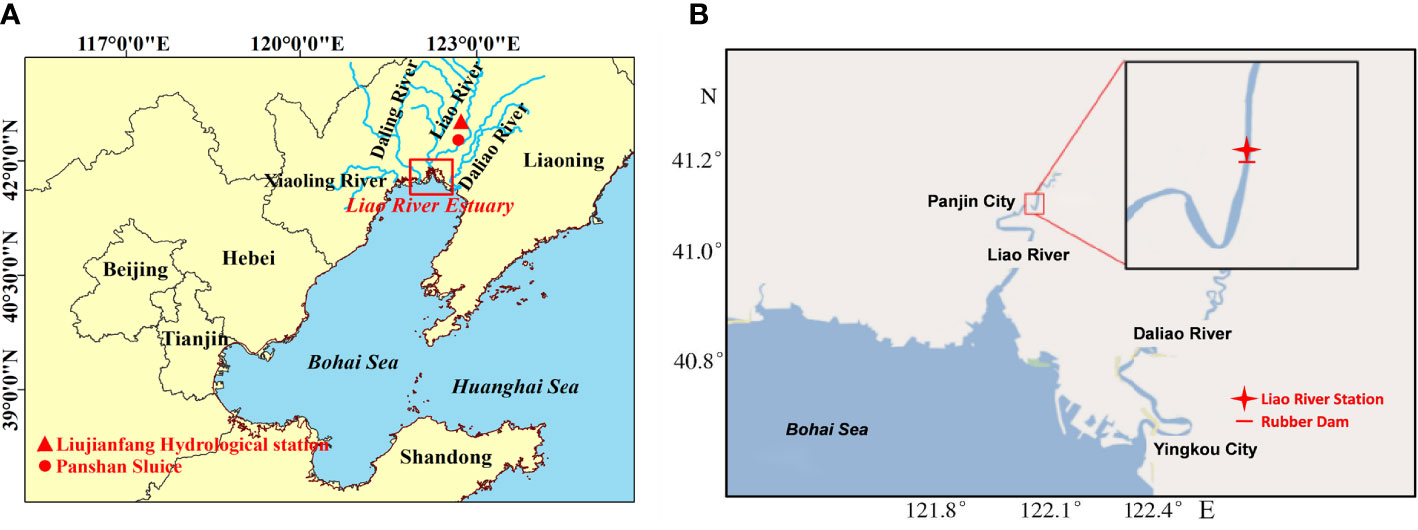
Figure 1 Maps of the study region illustrating the (A) geographical location of the Liao River Estuary and (B) the location of the monitoring station in Liao River.
The Liujianfang Hydrologic Station (LHS) is the main long-term, hydrologic station in the downstream area of the Liao River and has been providing measurements since it was built in 1964.The LHS is located in a non-tidal section of the Liao River about 74 km from the mouth of the Liao River Estuary (Figure 1A). For this study, data on the daily stream flow and evaporation from January 2015 to March 2020 were collected from the hydrologic yearbooks of the LHS. In order to meet the demand of industrial and agricultural water intake, the Panshan sluice tidal gate was built in 1968 (Figure 1B). Generally, the Panshan sluice is closed to store water during non-flood seasons and during low precipitation flood seasons. Furthermore, the Panjin Water Conservancy Bureau built a 200 m wide ecological rubber dam about 17 km downstream of Panshan sluice to alleviate severe water shortages and maintain the wetland landscape of Panjin City (Figure 1B). In 2017, the National Marine Environmental Monitoring Center set up a monitoring system (named the Liao River Station, LRS) in the tidal reach of Liao River near Dawa County, Panjin City, and completed a survey that monitored tidal current and water salinity (Figure 1B). The LRS is located 200 m upstream of the rubber dam in the Liao River, about 30 km away from the LRE.
Methods
Discharge into estuaries can determine the overall water quality of the estuary and maintain the balance of the ecosystem (Figueroa et al., 2022). The investigation and identification of freshwater input processes are important to understanding how salinity and freshwater transport change in the LRE, a part of which is the estimation of freshwater flux into the estuary. Some researchers developed a convenient way for water volume transport by establishing a correlation between the flow velocity from the bottom-mounted ADCP and an ADCP mounted to the auto-boat in a short period (Li et al., 2018; Weeks et al., 2018; Li and Boswell, 2022). In this study, we carried out a series of field surveys in the LRS, where the width of water surface is about 200 m. The investigation showed that this section of the LRS has complex topographic features and great variation in water depth, as shown in Figure 2. This estuary has long icy periods lasting nearly 3 months due to its high latitude, and the ice cover and effect of floating sea ice make it difficult to accurately assess river discharge. Compared to other observation methods using buoys, ships, and ropeways, submarine observation platforms have these advantages of in-situ placement, long-term continuity, good data stability, high reliability, and no influence of artificial measurement error, especially when considering the effect of sea ice cover in the winter season. Therefore, in this study we utilized submarine observation platforms to carry out the field survey. To survey the current velocity and evaluate the volume of water transported through the LHS in the LRE, the data for tidal current and water level in this section were prepared. In order to monitor the freshwater inflow flux into the LRE from the Liao River, China, the ADCP (Flowquest 1000k) instrument was installed on the submarine observation platform at the midline of the flow monitoring section, as presented in Figure 2. The maximum vertical profile range for FL1000k ADCP monitoring was 40 m, and the working group generally selects a profile range of 15 m based on the water depth of the monitoring section at Liao River Station. Flow velocity data was collected by the ADCP instrument in a 10 min burst mode over the observation period from January 1, 2017 to December, 31, 2020, where water levels were synchronously recorded at 10-min intervals. The other arrangements of ADCP were introduced for comparison and validation of tidal current in this study as shown in Figure 2. The SL 500 ADCP was moored at left bank to measure flow velocity for long-term monitoring of horizontal profile flow. The TRDI Stream ADCP was installed onboard the research vessel for mobile investigations for the flow velocity, direction and water depth in vertical profiles. The survey was conducted every 1 hour, each measurement took 10 minutes. The flow rate and cross-section area were measured, and then the depth - averaged velocity was calculated. The sampling setup of ship-borne navigation ADCP was as follows: sampling frequency was 1200K, unit length of Dc was 0.25m, the transducer entry depth of Hr was 0.1m, sampling time step was 1s, navigation ship speed Vb was 0.65m/s, magnetic declination angle was -6°. There was blind area in the top and bottom flow measurement, their thickness was generally between 7% - 10% of the water depth. The top and bottom flow rates were calculated by power function method (y=xb) and power function exponent b = 1/6 (Software instructions). Water samples for salinity analyses were collected in the LHS and filtered immediately after collection with a vacuum pump into the workstation experimental platform. Salinity (psu) was measured in real time at ten minute intervals using the Multi-Parameter Water Quality Detector in the LHS. Before the field investigation, we needed to carry out a routine examination of the instrument including rationality test, range test and peak test etc. Furthermore, the measured unreasonable data needed to be eliminated before analysis.
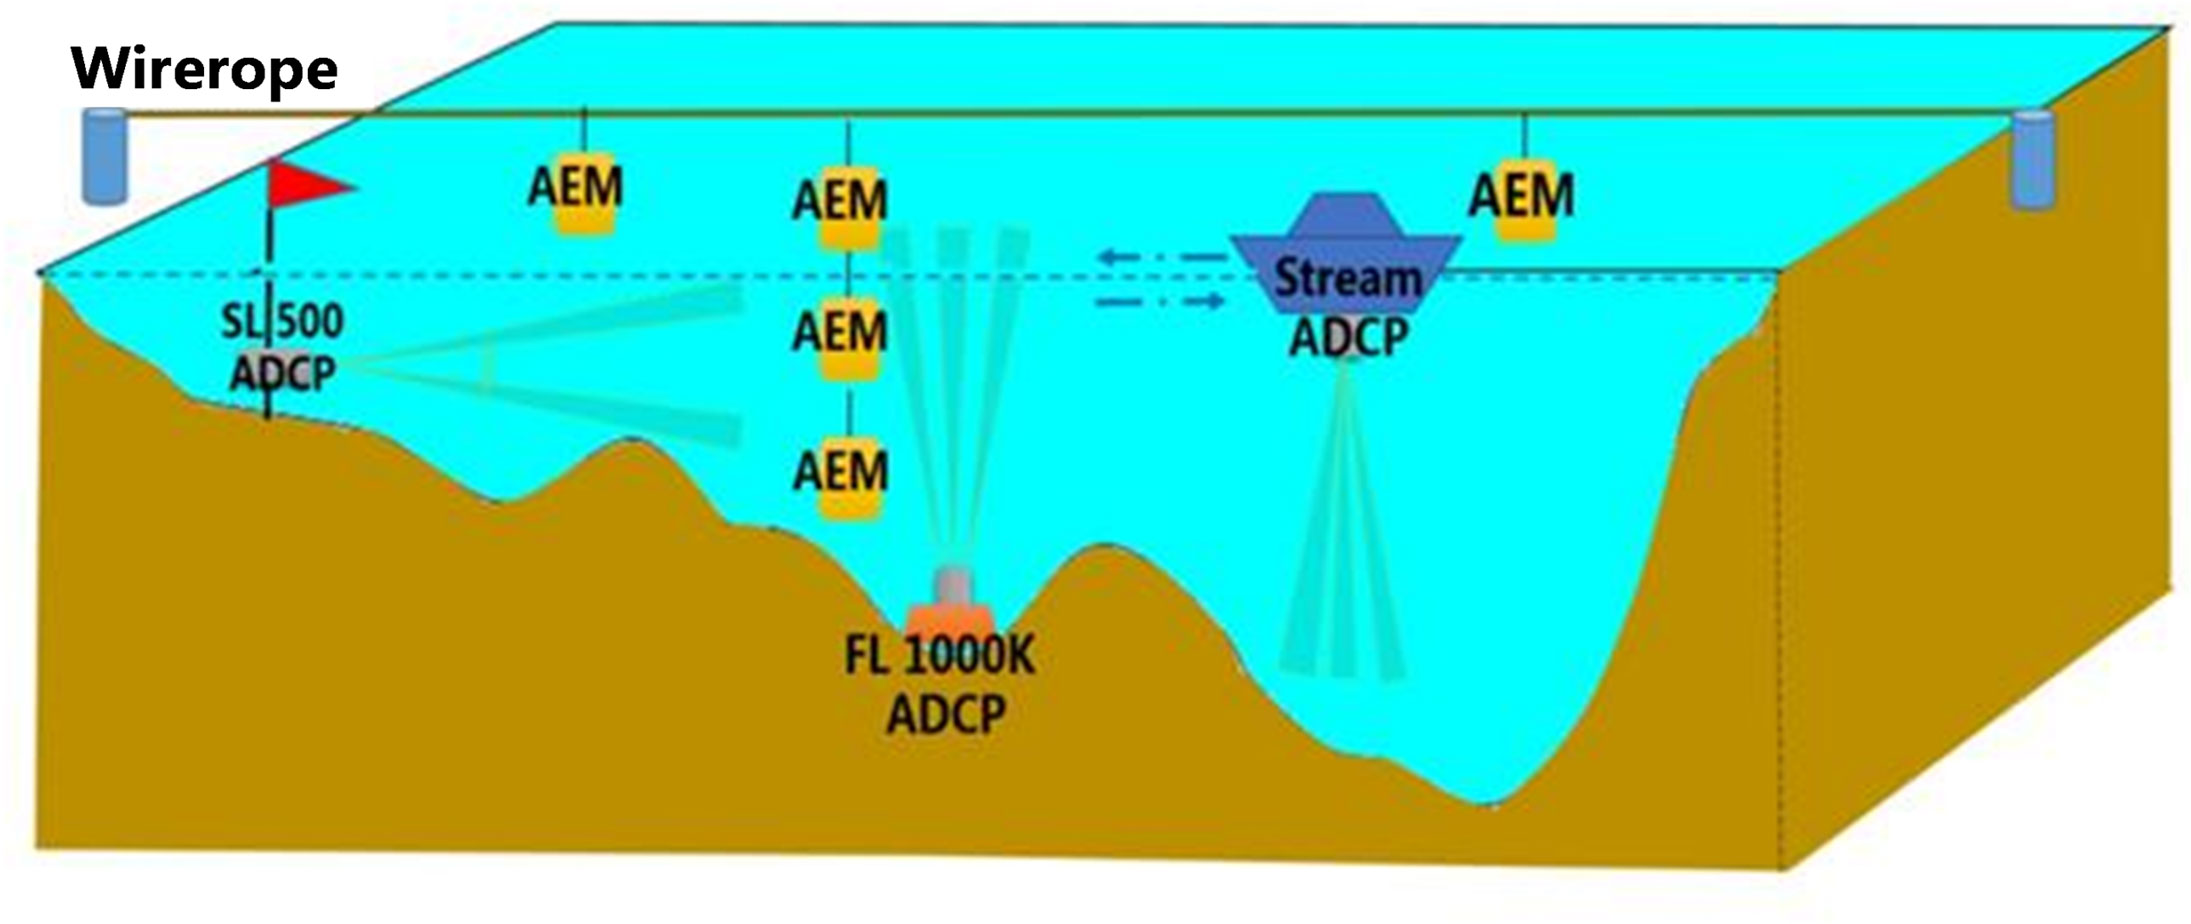
Figure 2 Sketch of monitoring instruments in the study area. A cable was secured across the river and used to fix the Infinity-EM AEM USB in the section for single-point flow monitoring during typical spring and spring tides.
Calculations of net water flux to estuary
The net water flux into the estuary was calculated from the five years of continuous water level and tidal current observation data from the ADCP instruments from 2017 to 2020. The mass conservation flux was used to calculate water fluxes by determining the product of mean velocity and cross-section area:
where Q is discharge of the cross section; V is averaged-velocity normal to the cross-section; and A is cross-sectional area of water.
Based on an application of mass conservation flux, the volume of water flux into the sea across the section area can be estimated as,
where Wt is the runoff flux into sea; t0 is time of beginning of ebb tide; t1 is duration of slack tide; t2 is time of beginning of flood tide; t3 is duration of slack tide; Qiis the cross-section discharge in period of ebb tide; and Qj is the cross-section discharge in the flood tide period.
Tidal current validation
The river discharge was calculated using the measured flow velocities and determined cross-sectional area of river channel (Costa et al., 2006). Weeks et al. (2018) also reported that the depth-averaged velocities from the bottom-mounted ADCP and the transport from USV ADCP were compared to follow each other. When an ADCP was moored on the seabed, the flow velocity could not be measured near the bottom or the surface. To fill in these gaps, daily average data were extrapolated based on the assumption that the velocities at the bottom and surface were the same as the index velocities at the nearest respective water depths (Ruhl and Simpson, 2005; Ganju et al., 2012). In this study, a complete record of cross-sectionally averaged velocity is computed using the correlation between index velocity (FL1000k ADCP) and tidal velocity from ADCP on board. The transducers of the ADCP were placed in water about 0.5 m below the surface. Continuous time-series indexes of water velocity and water level were obtained at the selected site using an ADCP mounted on the seabed in this study. Furthermore, the cross-sectionally averaged velocity was collected using a ship-mounted ADCP for comparison with the velocity index. Using the shipboard ADCP, we collected data along 44 ADCP transects, successfully measuring channel area and geometry at different tidal levels, these transects also obtained cross-sectionally averaged velocities. The relationship between the cross-sectional mean velocity and the index-velocity from the near-bed ADCP was determined to calculate water flux in this study (Figure 3). In terms of site characterization, the quadratic relationship between the index velocity and the cross-sectionally averaged velocity was obtained to construct a continuous time-series from the index velocity. The correlation coefficient of the obtained relationship was 0.952, indicating there was a very strong correlation between the two sets of data. This suggested that the tidal water flux estimates derived from the index velocity method would closely agree with independent measurements based on changes in water depth and volume in the studied section.
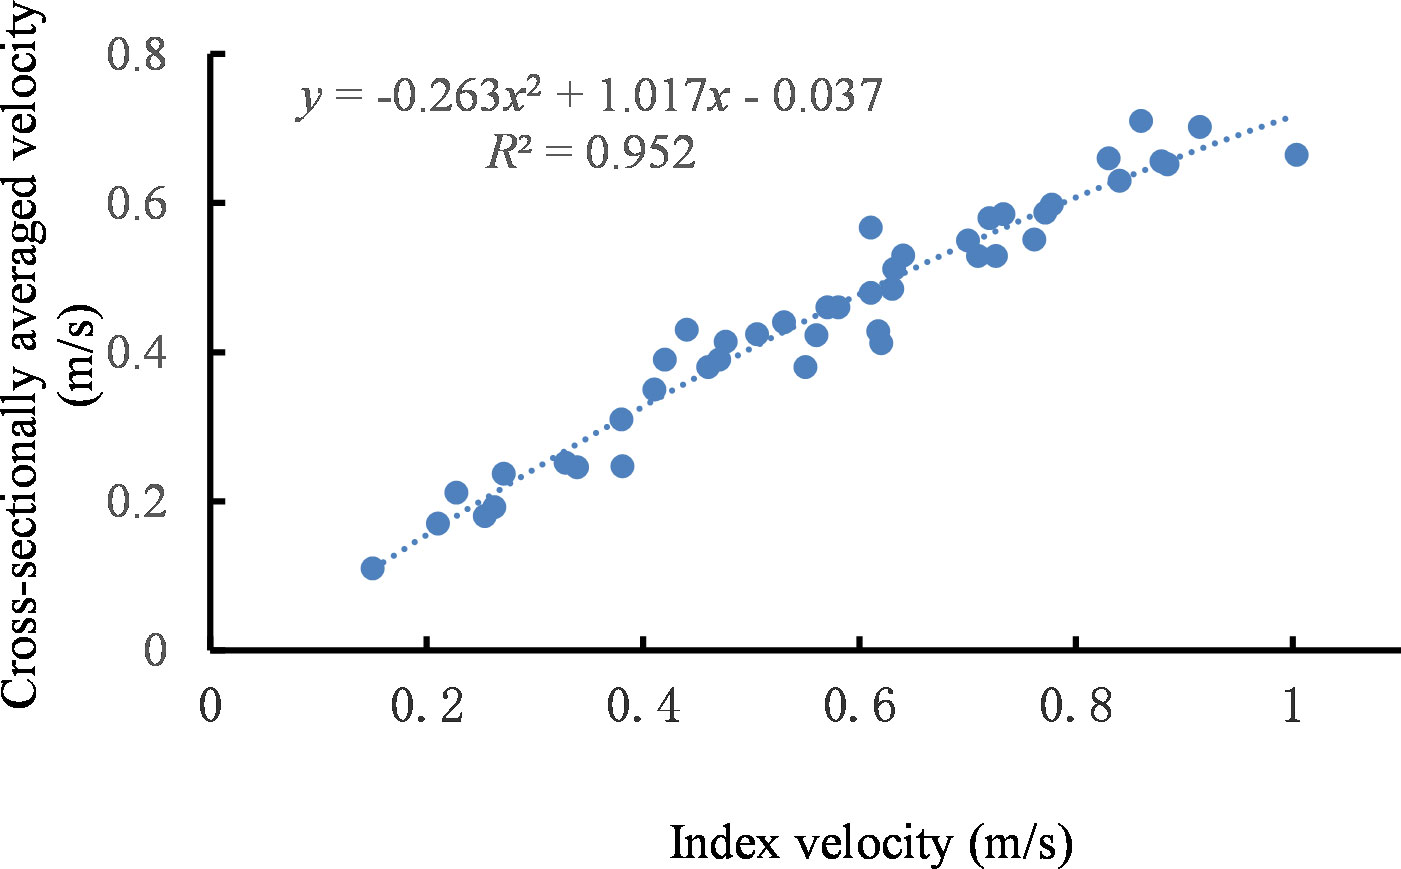
Figure 3 Calibration and validation of instruments in flow velocities for the field site.
Results
Variable observations in different periods
There LRE has a three-month ice period during the winter season, so we utilized the bottom-seated ADCPs placed on the seabed for measuring water level and tidal current in this study. Figure 4 shows the time series of water level and discharge in the LRS in different seasons. There was irregular fluctuation during one winter period (February 1–16, 2020) when the water level varied between 4.039 m and 4.91 m and the amplitude change in water level each day was small due to the effect of ice cover (Figure 4A). It could be seen that the water surface froze with a thickness of 30 cm during the full ice period, the ice and the coast were connected together. During the flood tide, there was no separation between the water body and the ice surface, and during the ebb tide, there was a separation between the ice surface and the water body. The discharge ranged between -35.68 m3/s and 20.23 m3/s between the flood tide and ebb tide periods, with the peak discharge of the flood tide being slightly larger than that of ebb tide, however, the duration of peak discharge during the ebb tide was obviously longer than that of flood tide. The water discharge from the upstream LRS was always below 35 m3/s during the periods when ice covered the entire river width. Figure 4B shows the observed discharge and water level in the LRS for the period from August 15th to August 31th, 2020. Before August 16th, the Liao River had relatively low runoff, and the amplitude of the tide was also small due to the neap tide period, so the changes of water level and discharge were relatively stable and were not obviously affected by upstream runoff nor the tidal cycle of the estuary. In mid-late August, 2020, the upper Panshan Sluice was gradually opened to release water due to the wet season, and the observed water levels changed gradually with a certain regularity, but still exhibited the characteristics of an irregular semi-diurnal tide due to the influence of the spring tide. The water levels varied between 4.971 m and 6.582 m in these periods, the peak discharge into sea during a flood tide was -561.2 m3/s, which occurred at 16:00 on August 19th, and the peak discharge into the sea for an ebb tide period was 849.4 m3/s, which occurred at 22:12 on August 31th, 2020. The peak value of discharge in the flood tide period was less than that of the ebb tide period, and the duration during the ebb tide was longer than that during flood tide. After the opening of the Panshan Sluice, the freshwater flux into sea was always positive, indicating that the freshwater continuously flowed into the LRE in the wet season, and a flood tide only appeared for about 20 minutes on August 28th, 2020 during spring tide associated with arrival of severe Typhoon Bavi. There was only a brief upsurge in the whole month, and only for a few moments. Figure 4C gives the cross-sectional discharge and water level in the LRS from 1–16 November 2020, the water level ranged between 2.148 m and 4.362 m, the tidal discharges ranged from -254.4 m3/s to 165.6 m3/s during spring tides, and the peak discharge was larger during flood tide than during ebb tide. The rising tides and the falling tides lasted about 3 hours and 9 hours, respectively.
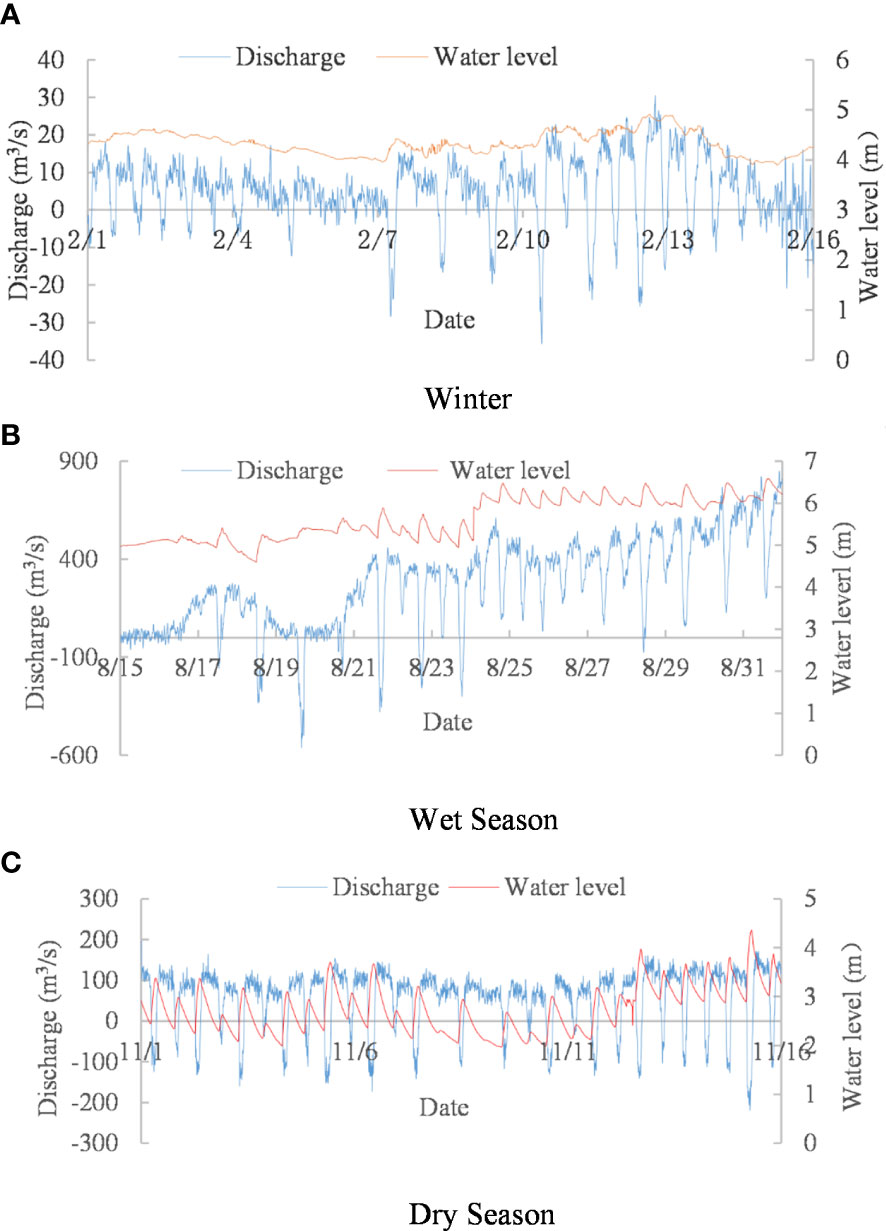
Figure 4 Variation in the observed discharge and water level of the Liao River Station. (A) Winter, (B) Wet Season and (C) Dry Season.
The long-term daily-salinity data from 2017 to 2020 in the LRS are shown in Figure 5. The salinity concentration ranged from 0.2 to 25 psu in this section of the LRS, showing lower values from September to May and significant fluctuation between May and September. The salinity peak in 2018 was the highest of the study period due to a lack of rainfall in the basin which led to low runoff from upstream rivers. Salt water intrusion generally started in May with the arrival of the dry season, but there were dramatic freshening events driven by the arrival of extreme spring tides. In 2017 and 2020, due to high precipitation in the basin, the salinity of the studied section was low. In summary, there were various significant trends in water salinity levels on both seasonal and inter-annual scales due to seasonal and annual variation in rainfall in this region. Through investigation and analysis, large areas of rice cultivation and growth occurred from May to August in Panjin region, a large amount of freshwater was intercepted, the amount of freshwater into the sea in this period was small, so the salinity had a relatively high value. In addition, if rainfall was sufficient in Liao River Basin and the river discharge was large in the Liao River, the upstream Panshan Sluice opened for a long time, and the salinity of the monitoring section would be low, vice versa.
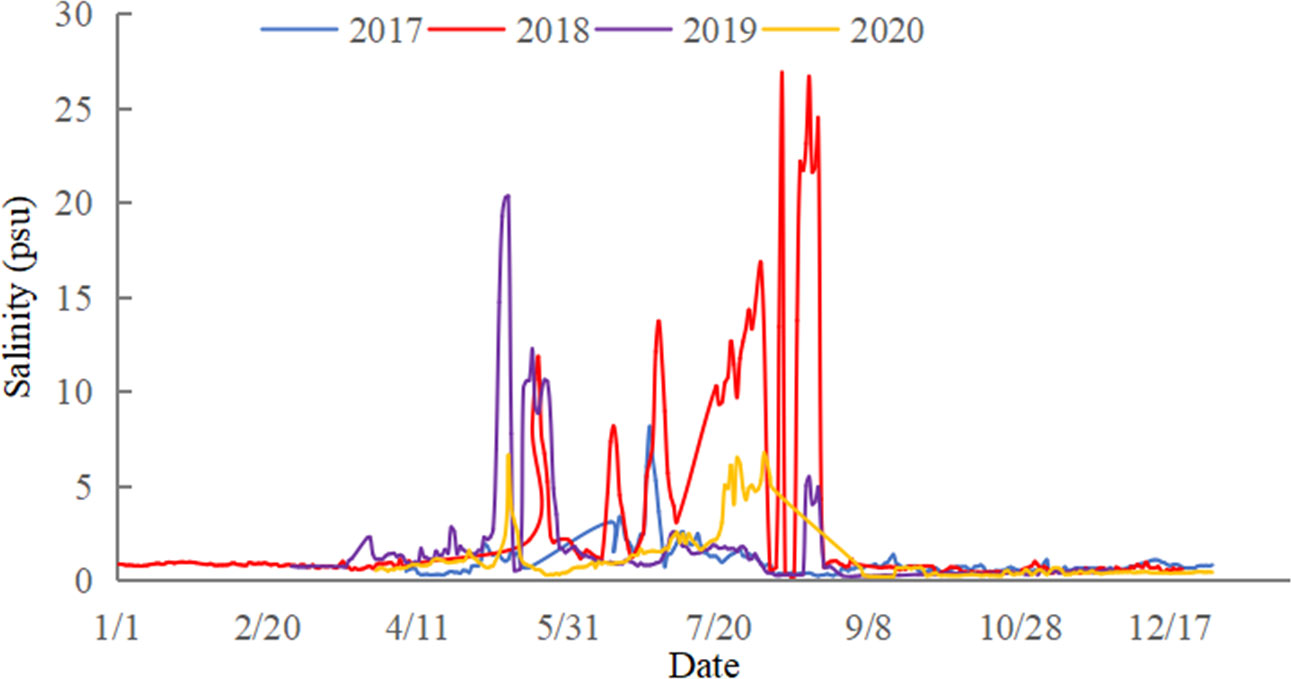
Figure 5 Measured daily salinity levels in the Liao River Station during 2017–2020.
Variability in monthly water flux into the LRE
Revealing the seasonal and inter-annual variability in river runoff into the LRE is critical to understanding the dynamic processes influencing freshwater and seawater exchange between the river and ocean. We performed a series of calculations based on the observed data over the entire study period to extract the monthly-mean water flux into the LRE; the water fluxes to the sea at the LHS and LRS from January to December 2020 are shown in Figure 6. The results indicated that the highest water flux to the sea occurred in September, 2020. This coincided with the wet season which occurred from August to October due to the long rainy season in the Liao River Basin. In contrast, the water fluxes during other periods were relatively small due to the low rainfall during the dry season. Furthermore, there was additional significant monthly variability in water flux in the LRS and the LHS due to the opening and closing of the upstream Panshan Sluice. In 2020, the annual runoff amounts from the LHS and LRS were about 35.27 billion m3 and 19.78 billion m3, respectively, with the LRS accounted for 56% of the annual runoff from the LHS into the sea. The water flux from the LRS to the sea from August to October was 15.01 billion m3, representing 76% of the annual water flux. Therefore, the Liao River experiences obvious seasonal variability in river discharge due to uneven temporal of rainfall. The annual water fluxes in the two stations were different, and the water fluxes of the LHS were obviously larger than those of the LRS due to the water conservancy activities of farmland and industrial and domestic waters along the way.
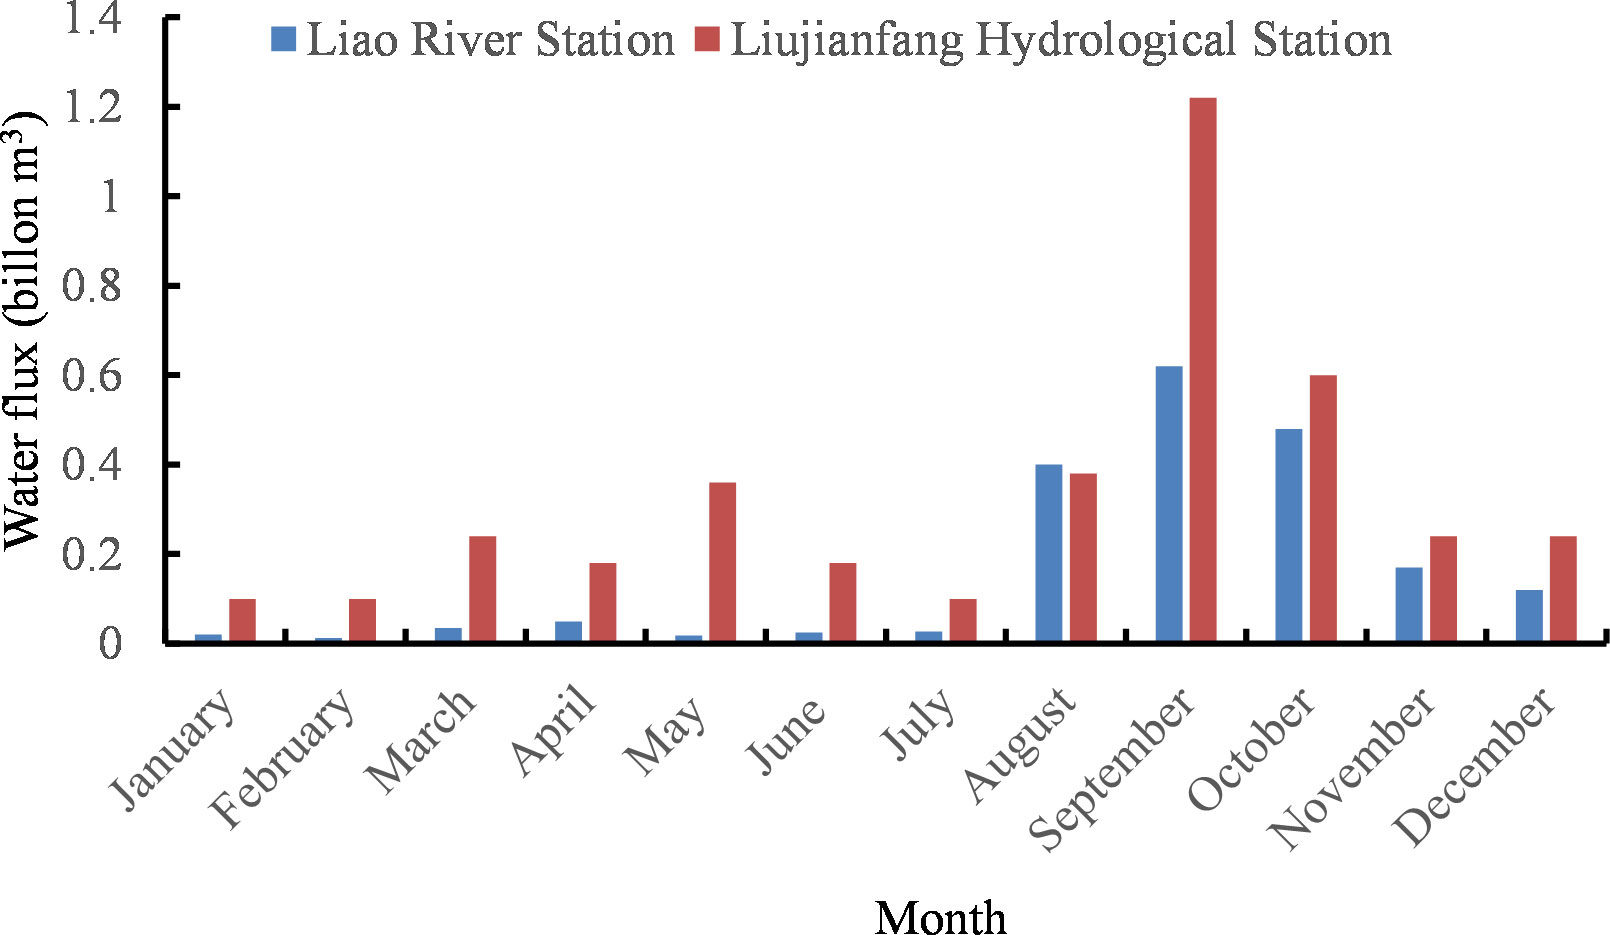
Figure 6 Monthly fluxes from the two selected stations in 2020 (billion m3).
Figure 7 shows the monthly changes in water fluxes in the LRS during the monitoring period from 2017 to 2020. The water flux into sea from the LRS was the largest in August of 2017 and 2019 and September of 2018 and 2020, and the monthly water fluxes in the LRS exhibited obvious differences among months. Taking 2019 as an example, the results showed that the water fluxes into the sea reached a four-year peak of 1.104 billion m3 in August, 2019, however, the monthly water flux from the LRS was negative in certain other months. The maximum annual flux to the sea was highest in 2019, at 2.218 billion m3, followed by 1.978 billion m3 in 2020 and 0.058 billion m3 in 2018.
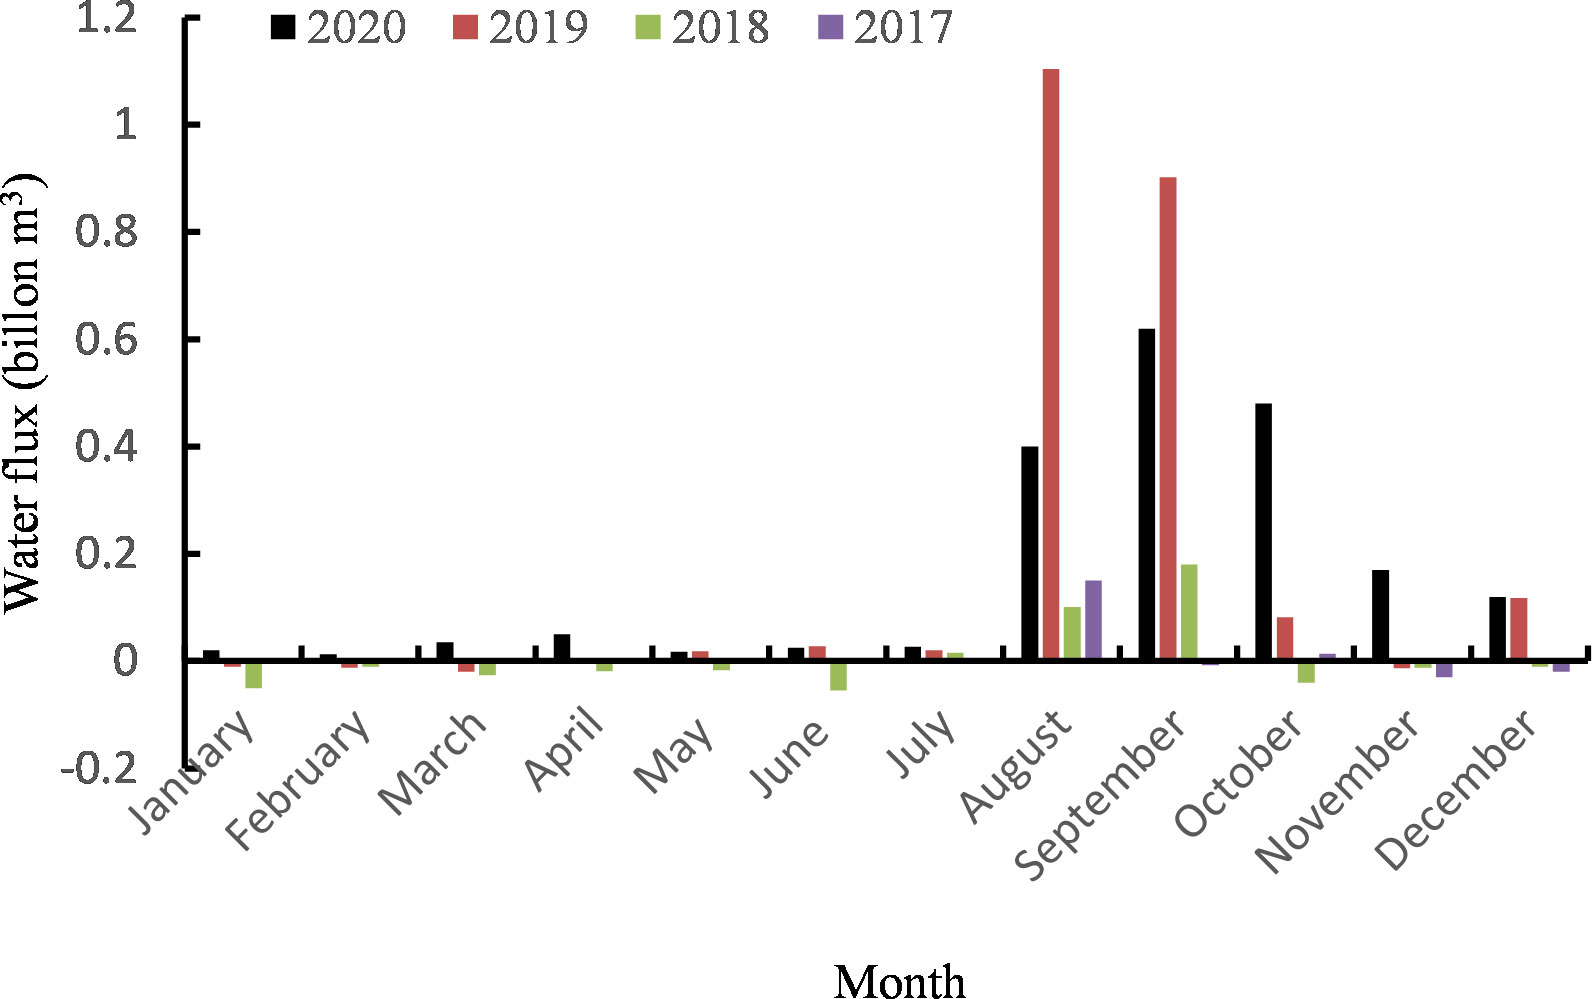
Figure 7 Monthly fluxes for different years at the Liao River Station (billion m3).
Changes of variables due to the influence of the rubber dam
In order to effectively prevent the invasion of salinity and alleviate water shortages for industry and agriculture in the LRE, a rubber dam was installed in this tidal river. The rubber dam was bottomed to riverbed with a height of about 0.5 m when not inflated. It did not float on the water, but rose and dropped under manual control. Figure 8 shows the changes in the observed variables due to increasing and decreasing the rubber dam height in 2019. When the rubber dam was raised, the discharge and water level in this section changed slightly, however, the height of rubber dam was reduced to facilitate overflow during the flood season. There was high similarity in water level and discharge trends in terms of increasing and decreasing among the observation years, which showed that the discharge and water level were significantly affected by the height of the rubber dam (Figure 8A). The water level in the LRS showed a stepwise rising trend with increasing rubber dam height. This was because the two high tide levels of the LRE are different every day. The low-high tide is completely intercepted and prevented from infiltrating upstream when the tidal wave reaches the rubber dam, while the high-high tide level is higher than the elevation of rubber dam so the seawater can gradually flow upstream over the rubber dam. When the tide level gradually decreases to the height of the rubber dam crest, the seawater upstream of the dam will be prevented from returning downstream (Figure 8B). Therefore, the water flux into the LRE, water level, and salinity are affected, not only by the upstream runoff and downstream tidal current, but also by the artificial rubber dam.
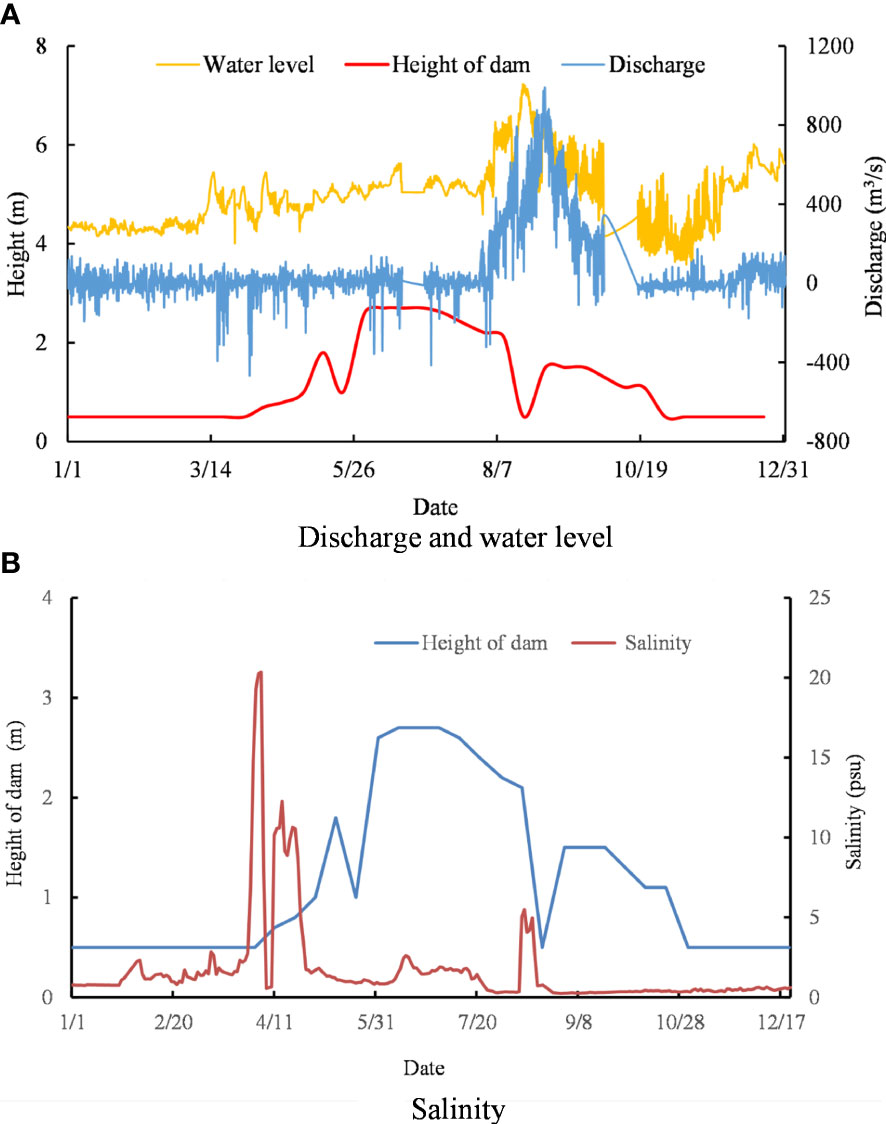
Figure 8 Change in discharge, water level, and salinity with variation in dam height in 2019. (A) Discharge and water level, (B) Salinity.
Figure 9 shows the time series of the tide, discharge, and salinity in the LRS, where the tidal level is from the Laobeihekou station. In contrast to Liao River Station, the discharge and salinity exhibited obvious periodic characteristics associated with the tidal level, because the Laobeihekou station was located close to the open sea, and its rising and falling tides exhibited a phase difference with the upstream station of the LRS (Figure 9A). The salinity in the LRS exhibited clear variation with tidal fluctuations, with the maximum salinity reaching 14 psu during the observation period. The observed salinity remained relatively low in the wet season, during which time the salinity fluctuations caused by tidal effects were small, within the range of 0.2−1.0 psu (Figure 9B). The highest salinities occurred in the dry season, mainly due to the correlated water flux components and the amplitude of tides. It could be seen that the salinity of the water body was low and the change was small when the rubber dam was elevated, showing that the rubber dam prevented the invasion of saline water from the open sea. Generally, the water level at the monitored section remained basically unchanged until the high tide level surpasses the rubber dam height in the next tidal cycle.
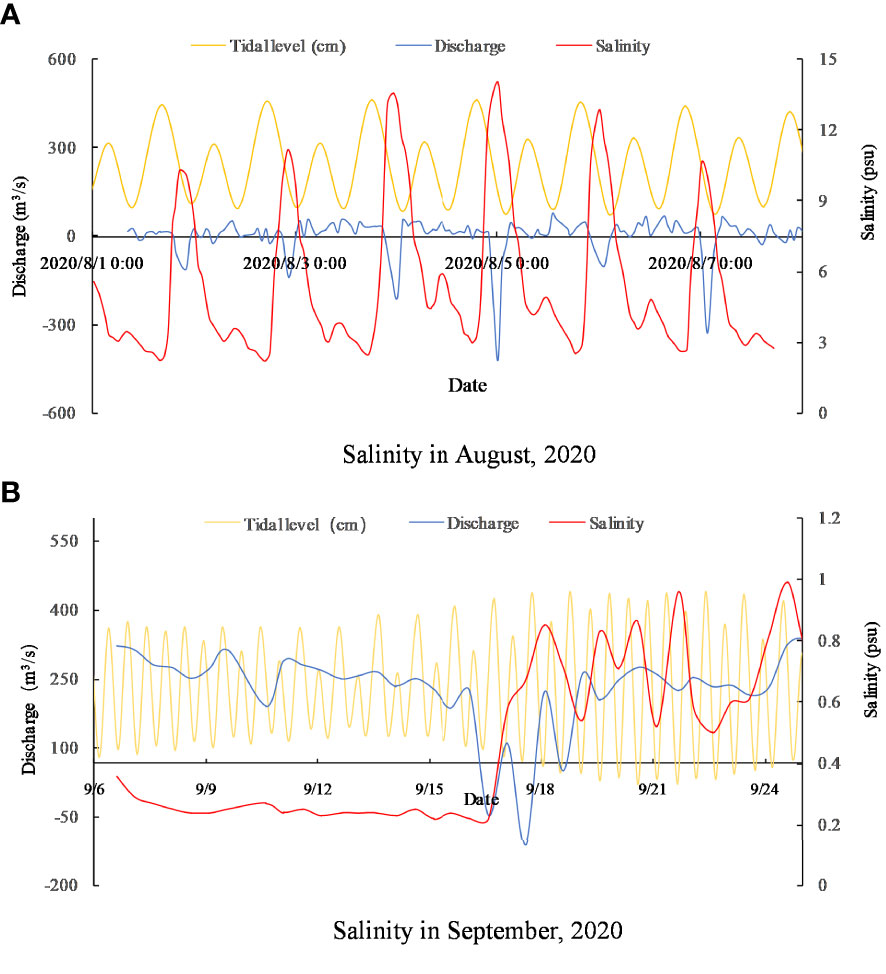
Figure 9 Time series of water level, water flux, and cross-sectionally averaged salinity in the LRS in 2020. (A) Salinity in August,2020, (B) Salinity in September, 2020.
Discussion
Factors impacting discharge and water level
With the introduction of uncertain fluctuation caused by the artificial influence of the sluice and dam in the study region, the hydrological processes and saline water transport in this tidal reach became more complex. The field survey of the upper tidal reach of the LRE revealed the relationships between the salinity and water flux in this estuary during different seasons. Except for 2020, the monthly fluxes into the sea in the other years from January to February were negative, and the water fluxes were far smaller than those during the non ice period. Therefore, ice cover had a certain impact on the water flux into the sea. The mainly reason was that the tidal velocity decreased significantly due to the limited water level rising and the friction force caused by the ice cover during flood tide. In winter, there was less upstream runoff, lower temperatures were prone to freezing, and therefore less water entered the sea. During the ice loading periods in winter, the Panshan Sluice was always closed to retain water, while the rubber dam located in the tidal reach of the Liao River was lowered completely. The water level at this cross-section of LRS remains basically unchanged because the seawater was blocked by the sea ice cover after reaching a certain water level. This phenomenon, where sea ice cover created a clear block against the tide and suppressed residual water level, has been observed elsewhere in western Laizhou Bay (Liu et al., 2022). Furthermore, in the Bohai Sea, sea ice also played a critical role in pollutant dispersion (Xiong et al., 2018) and tidal damping (Zhang et al., 2019). Therefore, the main factors affecting water level and discharge in the LRS in these periods included both downstream tidal current and sea ice coverage, and the flow pattern at the monitoring section presented reciprocating flow characteristics.
During the flood season, the Panshan Sluice was opened to release water, and the rubber dam was dropped completely as well. During this time the observed water levels showed obvious characteristics of irregular semi-diurnal tide, reflecting the two high tides and two low tides of each lunar day. The high tides lasted about 3 hours and the low tides lasted about 9 hours, and the daily fluctuations in the amplitude of water level and discharge were highly regular. The water level and discharge in the LRS were mainly affected by the upstream runoff and the downstream tide. This was similar the conclusions in the literature, which showed that the water levels in estuary regions were impacted by tide and upstream runoff (Palinkas et al., 2019; Lee et al., 2021). During the winter season, the rubber dam was dropped completely and the Panshan sluice gate was closed, so there was no water coming from the upper reaches and the water level was mainly affected by the downstream tidal current, which reflected the irregular semi-diurnal tide. Generally speaking, the LRS received much more freshwater runoff in the rainy season than the short rainy season or dry season when the high runoff was relatively low.
Factors controlling water flux to the sea
The water volume transported into sea was derived from the measured index velocity and tidal level, which has been shown to be a reliable method (Ganju et al., 2012; Weeks et al., 2018; Li and Boswell, 2022) and returned high accuracy in their studies. The results showed that there were apparent spring–neap cycles in the data-based water flux into sea in the LRS. The highest water flux into the sea occurred in September, 2020, which was in a wet season, and the maximum flood flux coincided with the transit of a typhoon associated with an extremely high tide flood period. The high flux was attributed to several factors that included the discharge from the upstream river, tide of the outside sea, height of the rubber dam, and the Panshan sluice operation. The LHS is the hydrologic station closest to the LRE, and it is located in the non-tidal reach, so it is possible to accurately estimate the runoff processes the LHS section. It is noteworthy that the LHS is about 80 km away from the LRE and the Panshan Sluice gate downstream of it controls river discharge for industry, irrigation, and domestic water intake. Therefore, the water flux into sea through the LRS has a certain time lag and difference in water volume compared to the LHS. The lag is greatly affected by the state of the Panshan Sluice, i.e., whether it is open and by how much, and the difference in total water volume represents the water intercepted for paddy irrigation and industrial water (Wang et al., 2017), only the remaining water not used for these purposes enters the LRE. Due to the release of water from the Panshan Sluice and the lowering of the rubber dam, the change trends in discharge into the sea from the LRS in September were basically consistent with the change trends of the observed discharge from the LHS in the upper reaches, as was demonstrated by the two obvious flow peaks and troughs in both locations (see Figure 6).
Due to the fact that Panshan Sluice was usually closed from January to July based on the gate controlling information from 2019, the river discharge from the LRS was less than 0.03 billion m3 during this period, with the highest flux occurring in June at 0.028 billion m3. The flood season begins in August in the Liao River basin, and the Panshan Sluice opened on August 23, 2019 due to heavy rainfall. The river discharge into sea increased to 1.104 billion m3 in August, 2019. In mid-October, the Panshan Sluice began to close, and the monthly water flux to the sea from the LRS gradually decreased. These results showed that the water fluxes are significantly affected by the opening and closing of the Panshan Sluice, and that the amount of water entering into the LRE has a certain hysteresis and uncertainty. Similar observations have been made in related studies in a shallow microtidal estuary with an estuarine dam (Williams et al., 2015). The LHS is located in the upstream non-tidal reach, where the water flows through the LHS is larger than that of the LRS, only a portion of the water flows into the LRE through the monitored section of the LRS because of water interception, therefore, the water flux in the LRS is better suited to representing sea inflow flux than that the LHS in the LRE. Furthermore, there was significant inter-annual variability in the water flux to the Liao River Estuary. The main reasons were the serious droughts in 2017 and 2018 in this study region, with the region average precipitation amounts of 543.6 and 586.1 mm in current year, respectively, which were obviously lower than the 687.2 mm in 2019 (see Table 1).
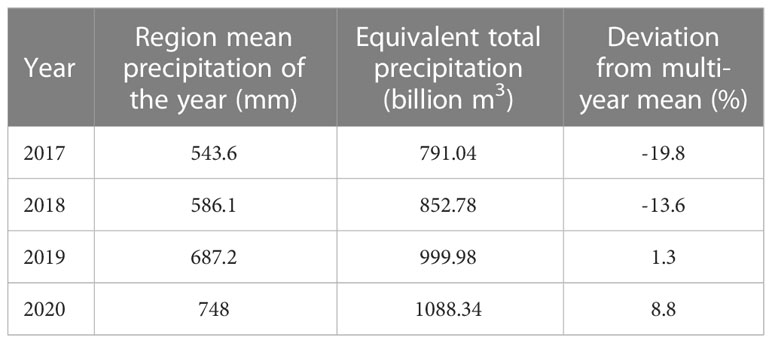
Table 1 Yearly rainfall information.
Effect of rubber dam on water input, water level, and salinity
A rubber dam was built between the estuary mouth and Liao River to establish the estuary’s tidal limit in this study region. With the artificial manipulation of the rubber dam in the LRS, the complexity of the water level variation processes in tidal reach increased. During the rubber dam lowering period, the monitoring section was characterized by irregular semi-diurnal tides, which showed that the water flux to the LRE was significantly affected by the height of rubber dam. When the rubber dam was raised, the regularity of discharge change in the LRS decreased, while when the rubber dam was lowered, the discharge change showed a certain tidal regularity. According to the monitoring results, the water flux into the sea from the LRS was not only affected by the upstream water and downstream tide, but also by the artificial gate and rubber dam, resulting in a large seasonal and daily variation in discharge into the sea. Previous studies in the Geum and Oujiang estuaries showed that estuarine dams reduced the mean water level by about 10 cm after dam construction (Kim et al., 2006; Li and Liu, 2020), providing clear evidence that estuarine dams affect water fluxes.
It is of great importance to study the processes affecting the water level and salinity of tidal reaches to understand water fluxes into the sea. Here, salinity was greatly affected by runoff from the upstream river, which created a significant salinity gradient in the water body of the LRS. Furthermore, the obvious change in salinity along the Liao River revealed that the sluices and rubber dam effectively prevented seawater from infiltrating upstream, to a certain extent. However, these dams and gates also obviously blocked the hydrological connectivity, which may alter the ecological structure of the river and the estuary. It was also clear that the discharge affects the salinity distribution in the estuary, as was evident in the changes in salinity gradients in this estuary due to the operation of the rubber dam. So estuarine dams were reasoned to not only alter the timing of water fluxes to the sea, but also the water salinity (Shin et al., 2022) and water quality in the estuary (Jeong et al., 2014). Indeed, one study showed that the removal of the sluice gate, plus sea-level rise, allowed greater seawater influx and increased the regularity of monthly deep-water salinity fluctuations in Nakaumi Lagoon (Nomura et al., 2022). The data obtained in this study, on river discharge and salinity, were effectively used to determine salt variation mechanics within the main river, which helped to understand the effects of sluices and dams along with the relative importance of freshwater and tidal inputs.
Conclusion
This study conducted a series of field surveys to measure flow velocity, direction, water depth, and salinity at the mouth section of the LRE from 2017–2020. About 200,000 sets of cross-sectional data were obtained in the LRS. The index velocity and cross-sectionally averaged velocity based on the ADCP data were compared over several tidal-cycle observations. An appropriate correlation was found so that a continuous record of discharge could be generated for further estimations of water fluxes in the estuary in combination with the velocity index methodology. In winter, the water flux into the sea was greatly affected by the ice cover, and the tidal level was suppressed by the ice cover, which reduced the tidal flux from the bay. The results showed that the annual water fluxes at the two stations (LRS and LHS) were quite different, and the water flux of the LHS was obviously greater than that of the LRS. A portion of the water flowing through the monitored section enters the LRE, but some of the water flowing through the LHS is stored by the Panshan Sluice to meet the needs of industry, agriculture, and landscape in the Liao River areas. The majority of the annual water flux to the estuary is concentrated in the flood season from August to October. It was concluded that the water flux into the sea measured in the LRS was representative of the sea-entering flux from the Liao River. The water flux to the estuary in the LRS was mainly controlled by the runoff from Liao River and the opening of the upstream Panshan Sluice. When the rubber dam was lowered, the water level at the monitored section was characterized by irregular semi-diurnal tides, and the duration of the rising and falling tides were quite different. The regulation by the rubber dam (i.e., raising or dropping) can impact the net freshwater flux to estuary as well, which changes water salinity gradient downstream. These results are helpful in clarifying the coupled influences of saline intrusion and sluice operation on the freshwater input and salinity characteristics in the LRE and will facilitate science-based management policies for water transfer in this basin. The comprehensive monitoring and analysis method for water flux into the sea proposed in this paper well reproduces the discharge changes in the Liao River, and this method will also provide a valuable reference for the measurement of water flux into the sea for other rivers. Furthermore, the Liao River discharges large amounts of pollutants (e.g., COD, ammonia nitrogen, phosphate, or heavy metals), but their fluxes into the LRE are also currently unknown. Based on the results of current study, future studies should focus on determining the total amount of pollutants discharged from Liao River into sea in each year to help establish total emission controls for various marine pollutants and determine the marine pollutant receiving capacity.
Data availability statement
The raw data supporting the conclusions of this article will be made available by the authors, without undue reservation.
Author contributions
ZH and MZ contributed to conception and design of the study. ZH contributed to data survey, methodology, writing - original draft. KG and YY organized the validation and data analysis. MZ: methodology, project administration, writing - review & editing. All authors contributed to the article and approved the submitted version.
Funding
This work was supported by the National Nature Science Foundation of China (Grant Number U21A20155, 51879028), Open Fund of State Key Laboratory of Coastal and Offshore Engineering of Dalian University of Technology, and Applied basic research plan project of Liaoning province (Grant Number 2023030048-JH2/1013).
Conflict of interest
The authors declare that the research was conducted in the absence of any commercial or financial relationships that could be construed as a potential conflict of interest.
Publisher’s note
All claims expressed in this article are solely those of the authors and do not necessarily represent those of their affiliated organizations, or those of the publisher, the editors and the reviewers. Any product that may be evaluated in this article, or claim that may be made by its manufacturer, is not guaranteed or endorsed by the publisher.
Supplementary material
The Supplementary Material for this article can be found online at: https://www.frontiersin.org/articles/10.3389/fmars.2023.1154150/full#supplementary-material
References
Ahn J. M., Lee K., Lyu S. (2020). Effect of changes in watershed runoff characteristics on salinity intrusion in estuary using EFDC. KSCE J. Civ. Eng. 24 (1), 87–98. doi: 10.1007/s12205-020-1306-5
Bartsch S., Frei S., Ruidisch M., Shope C. L., Peiffer S., Kim B., et al. (2014). River-aquifer exchange fluxes under monsoonal climate conditions. J. Hydrol 509, 601–614. doi: 10.1016/j.jhydrol.2013.12.005
Chen Z. G., Pan S., Zhou F. N., Ban Y., Li M., Li D. J. (2021). A method for correcting discharge of boat-mounted ADCP measurements. Flow Meas. Instrum. 80, 101954. doi: 10.1016/j.flowmeasinst.2021.101954
Chen X., Zhang M. L., Zhang W. C. (2022). Landscape pattern changes and its drivers inferred from salt marsh plant variations in the coastal wetlands of the liao river estuary, China. Ecol. Indic. 145, 109719. doi: 10.1016/j.ecolind.2022.109719
Chin T., Beecraft L., Wetz M. S. (2022). Phytoplankton biomass and community composition in three Texas estuaries differing in freshwater inflow regime. Estuar. Coast. Shelf Sci. 277, 108059. doi: 10.1016/j.ecss.2022.108059
Costa J. E., Cheng R. T., Haeni F. P., Melcher N., Spicer K. R., Hayes E., et al. (2006). Use of radars to monitor stream discharge by noncontact methods. Water Resour. Res. 42, W07422. doi: 10.1029/2005WR004430
de Pablo H., Sobrinho J., Garaboa-Paz D., Fonteles C., Neves R., Gaspar M. B. (2022). The influence of the river discharge on residence time, exposure time and integrated water fractions for the tagus estuary (Portugal). Front. Mar. Sci. 8. doi: 10.3389/fmars.2021.734814
Dinehart R. L., Burau J. R. (2005). Repeated surveys by acoustic Doppler current profiler for flow and sediment dynamics in a tidal river. J. Hydrol 314, 1–21. doi: 10.1016/j.jhydrol.2005.03.019
Figueroa S. M., Lee G. H., Chang J. W., Schieder N. W., Kim K., Kim S. Y. (2020). Evaluation of along-channel sediment flux gradients in an anthropocene estuary with an estuarine dam. Mar. Geol. 429, 106318. doi: 10.1016/j.margeo.2020.106318
Figueroa S. M., Son M., Lee G.-h. (2022). Effect of estuarine dam location and discharge interval on estuarine hydrodynamics, sediment dynamics, and morphodynamics. Front. Mar. Sci. 9. doi: 10.3389/fmars.2022.1035501
Fukamachi Y., Ohshima K. I., Ebuchi N., Bando T., Ono K., Sano M. (2010). Volume transport in the soya strait during 2006–2008. J. Oceanogr. 66, 685–696. doi: 10.1007/s10872-010-0056-2
Fulton J. W., Henneberg M. F., Mills T. J., Kohn M. S., Epstein B., Hittle E. A., et al. (2018). Computing under-ice discharge: a proof-of-concept using hydroacoustics and the probability concept. J. Hydrol 562, 733–748. doi: 10.1016/j.jhydrol.2018.04.073
Ganju N. K., Hayn M., Chen S. N., Howarth R. W., Dickhudt P. J., Aretxabaleta A. L., et al. (2012). Tidal and groundwater fluxes to a shallow, microtidal estuary: constraining inputs through field observations and hydrodynamic modeling. Estuar. Coasts 35, 1285–1298. doi: 10.1007/s12237-012-9515-x
Ha H. K., Kim Y. H., Lee H. J., Hwang B., Joo H. M. (2015). Under-ice measurements of suspended particulate matters using ADCP and LISST-holo. Ocean Sci. J. 50, 97–108. doi: 10.1007/s12601-015-0008-2
Jeong Y. H., Yang J. S., Park K. (2014). Changes in water quality after the construction of an estuary dam in the geum river estuary dam system, Korea. J. Coast. Res. 30 (6), 1278–1286. doi: 10.2112/JCOASTRES-D-13-00081.1
Ji X. M., Zhang W. (2019). Tidal influence on the discharge distribution over the pearl river delta, China. Reg. Stud. Mar. Sci. 31, 100791, 2352–4855. doi: 10.1016/j.rsma.2019.100791
Kang X., Xia M., Pitula S. J., Chigbu P. (2017). Dynamics of water and salt exchange at Maryland coastal bays. Estuar. Coast. Shelf Sci. 189, 1–16. doi: 10.1016/j.ecss.2017.03.002
Kaniewski D., Marriner N., Morhange C., Faivre S., Otto T., Van Campo E. (2016). Solar pacing of storm surges, coastal flooding and agricultural losses in the central Mediterranean. Sci. Rep. 6, 25197. doi: 10.1038/srep25197
Kennish M. J. (2001). Coastal salt marsh system in the US: a review of anthropogenic impacts. J. Coast. Res. 17 (3), 731–748.
Kim T. I., Choi B. H., Lee S. W. (2006). Hydrodynamics and sedimentation induced by large-scale coastal developments in the keum river estuary, Korea. Estuar. Coast. Shelf Sci. 68 (3), 515–528. doi: 10.1016/j.ecss.2006.03.003
Kwak D. H., Song Y. S., Choi Y. H., Kim K. M., Jeong Y. H. (2023). Influence of sluice gate operation on salinity stratification and hypoxia development in a brackish estuary dam. Reg. Stud. Mar. Sci. 57, 102731. doi: 10.1016/j.rsma.2022.102731
Lane A., Prandle D., Harrison A. J., Jones P. D., Jarvis C. J. (1997). Measuring fluxes in tidal estuaries: sensitivity to instrumentation and associated data analyses. Estuar. Coast. Shelf Sci. 45 (4), 433–451. doi: 10.1006/ecss.1996.0220
Lavín M. F., Sánchez S. (1999). On how the Colorado river affected the hydrography of the upper gulf of California. Cont. Shelf Res. 19, 1545–1560. doi: 10.1016/S0278-4343(99)00030-8
Lee M., Yoo Y., Joo H., Kim K. T., Kim H. S., Kim S. (2021). Construction of rating curve at high water level considering rainfall effect in a tidal river. J. Hydrol. Reg. Stud. 37, 100907. doi: 10.1016/j.ejrh.2021.100907
Lemagie E. P., Lerczak J. A. (2015). A comparison of bulk estuarine turnover timescales to particle tracking timescales using a model of the yaquina bay estuary. Estuar. Coasts 38, 1797–1814. doi: 10.1007/s12237-014-9915-1
Li C. Y., Boswell K. M. (2022). Estimating water transport from short-term vessel-based and long-term bottom-mounted acoustic Doppler current profiler measurements in an Arctic lagoon connected to the Beaufort Sea. Sensors 22, 68. doi: 10.3390/s22010068
Li Y., Liu J. (2020). Salt intrusion and its controls in the macro-tidal oujiang river estuary, China. Ocean Dynam. 70, 1409–1420. doi: 10.1007/s10236-020-01405-0
Li C. Y., Weeks E., Huang W., Milan B. (2018). Weather induced transport through a tidal channel calibrated by an unmanned boat. J. Atmos. Ocean. Tech. 35 (2), 261–279. doi: 10.1175/JTECH-D-17-0130.1
Liu Y., Hu Y. C., Yu C. X., Gao Y. Q., Liu Z. Y., Mostofa K. M. G., et al. (2023). Spatiotemporal optical properties of dissolvedorganic matter in a sluice-controlled coastal plainriver with both salinityand trophic gradients. J. Environ.Sci. 129, 1–15. doi: 10.1016/j.jes.2022.09.031
Liu S. Y., Liu S. D., Li G. X., Zhang S. T., Xu J. S., Zhang L., et al. (2022). Impacts of sea ice on marine dynamics in western laizhou bay, bohai Sea. Estuar. Coast. Shelf Sci. 275, 107958. doi: 10.1016/j.ecss.2022.107958
Lotsari E., Lintunen K., Kasvi E., Alho P., Blåfield L., Part A. (2022). The impacts of near-bed flow characteristics on river bed sediment transport under ice-covered conditions in 2016–2021. J. Hydrol. 615, 128610. doi: 10.1016/j.jhydrol.2022.128610
Mou L., Niu Q., Xia M. (2022). The roles of wind and baroclinic processes in the cross-isobath water exchange within the bohai Sea. Estuar. Coast. Shelf Sci. 274 (3), 107944. doi: 10.1016/j.ecss.2022.107944
Nomura R., Tsujimoto A., Takata H. (2022). Environmental impact of removal of a large-scale sluice gate on nakaumi lagoon and adjacent coastal waters, southwest Japan: evidence from long-term foraminiferal monitoring. Mar. Environ. Res. 182, 2022. doi: 10.1016/j.marenvres.2022.105767
Onabule O. A., Mitchell S. B., Couceiro F. (2020). The effects of freshwater flow and salinity on turbidity and dissolved oxygen in a shallow macrotidal estuary: a case study of Portsmouth harbour. Ocean Coast. Manage. 191:105179. doi: 10.1016/j.ocecoaman.2020.105179
Palinkas C. M., Testa J. M., Cornwell J. C., Li M., Sanford L. P. (2019). Influences of a river dam on delivery and fate of sediments and particulate nutrients to the adjacent estuary: case study of conowingo dam and Chesapeake bay. Estuaries Coasts 42 (8), 2072–2095. doi: 10.1007/s12237-019-00634-x
Prasad K. V. S. R., Sridevi T., Sadhuram Y. (2018). Influence of dam-controlled river discharge and tides on salinity intrusion in the godavari estuary, east coast of India. J. Waterw. Port Coast. (2018) 144(2):04017049. doi: 10.1061/(ASCE)WW.1943-5460.0000430
Priya K. L., Jegathambal P., James E. J. (2016). Salinity and suspended sediment transport in a shallow estuary on the east coast of India. Reg. Stud. Mar. Sci. 7, 88–99.doi:10.1016/j.rsma.2016.05.015. doi: 10.1016/j.rsma.2016.05.015
Ruhl C. A., Simpson M. R. (2005). Computation of discharge using the index-velocity method in tidally affected areas. U.S. geological survey scientific investigations report 2005–5004. 1–31. doi: 10.3133/sir20055004
Sakho I., Dussouillez P., Delanghe D., Hanot B., Raccasi G., Tal M., et al. (2019). Suspended sediment flux at the Rhone river mouth (France) based on ADCP measurements during flood events. Environ. Monit. Assess. 191, 508. doi: 10.1007/s10661-019-7605-y
Sheldon A. R., Dalal R. C., Kirchhof G., Kopittke P. M., Menzies N. W. (2017). The effect of salinity on plant-available water. Plant Soil 418 (1), 477–491. doi: 10.1007/s11104-017-3309-7
Shin H. R., Lee J. H., Kim C. H., Yoon J. H., Hirose N., Takikawa T., et al. (2022). Long-term variation in volume transport of the tsushima warm current estimated from ADCP current measurement and sea level differences in the Korea/Tsushima strait. J. Mar. Syst. 232, 103750. doi: 10.1016/j.jmarsys.2022.103750
Sin Y., Lee H. (2020). Changes in hydrology, water quality, and algal blooms in a freshwater system impounded with engineered structures in a temperate monsoon river estuary. J. Hydrol.- Reg. Stud. 32, 100744. doi: 10.1016/j.ejrh.2020.100744
Van Proosdij D., Milligan T., Bugden G., Butler K. (2009). A tale of two macro tidal estuaries: differential morphodynamic response of the intertidal zone to causeway construction. J. Coast. Res. 56, 772–776.
Wang Y., Zhou L., Jia Q. Y., Yu W. Y. (2017). Water use efficiency of a rice paddy field in liaohe delta, northeast China. Agr. Water Manage. 187, 222–231. doi: 10.1016/j.agwat.2017.03.029
Weeks E., Robinson M. E., Li C. Y. (2018). Quantifying cold front induced water transport of a Louisiana bay with in-situ observations using an unmanned boat. Acta Oceanol. Sin. 37 (11), 1–7. doi: 10.1007/s13131-018-1330-1
Williams J., Lee G., Shin H. J., Dellapenna T. (2015). Mechanism for sediment convergence in the anthropogenically altered microtidal nakdong estuary, south Korea. Mar. Geol. 369, 79–90. doi: 10.1016/j.margeo.2015.08.004
Xia M., Xie L., Pietrafesa L. J., Whitney M. M. (2011). The ideal response of a gulf of Mexico estuary plume to wind forcing: its connection with salt flux and a Lagrangian view. J. Geophys. Res. 116, C08035. doi: 10.1029/2010JC006689
Xiong J., Wang X. H., Wang Y. P., Chen J., Shi B., Gao J., et al. (2018). Reprint of mechanisms of maintaining high suspended sediment concentration over tide dominated offshore shoals in the southern yellow Sea. Estuar. Coast. Shelf Sci. 206:2–13. doi: 10.1016/j.ecss.2018.03.019
Zamparas M., Zacharias I. (2014). Restoration of eutrophic freshwater by managing internal nutrient loads. a review. Sci. Total Environ. 496, 551–562. doi: 10.1016/j.scitotenv.2014.07.076
Zhang N., Wang J., Wu Y. S., Wang K. H., Zhang Q. H., Wu S. Q., et al. (2019). A modelling study of ice effect on tidal damping in the bohai Sea. Ocean Eng. 173, 748–760. doi: 10.1016/j.ecss.2018.03.019
Zhu B. S., Yang W., Jiang C. F., Wang T., Wei H. (2022). ). observations of turbulent mixing and vertical diffusive salt flux in the changjiang diluted water. J. Oceanol. Limnol. 40 (4), 1349–1360. doi: 10.1007/s00343-021-1191-x
Keywords: discharge, water level, net water flux, salinity variation, rubber dam, sea ice
Citation: Hu Z, Guo K, Yang Y and Zhang M (2023) Field survey and analysis of water flux and salinity gradients considering the effects of sea ice coverage and rubber dam: a case study of the Liao River Estuary, China. Front. Mar. Sci. 10:1154150. doi: 10.3389/fmars.2023.1154150
Received: 30 January 2023; Accepted: 21 April 2023;
Published: 05 May 2023.
Edited by:
Weijie Wang, China Institute of Water Resources and Hydropower Research, ChinaReviewed by:
Zhipeng Zang, Tianjin University, ChinaMeng Xia, University of Maryland Eastern Shore, United States
Chunyan Li, Louisiana State University, United States
Copyright © 2023 Hu, Guo, Yang and Zhang. This is an open-access article distributed under the terms of the Creative Commons Attribution License (CC BY). The use, distribution or reproduction in other forums is permitted, provided the original author(s) and the copyright owner(s) are credited and that the original publication in this journal is cited, in accordance with accepted academic practice. No use, distribution or reproduction is permitted which does not comply with these terms.
*Correspondence: Mingliang Zhang, emhtbGlhbmdfbWFpbEAxMjYuY29t