
95% of researchers rate our articles as excellent or good
Learn more about the work of our research integrity team to safeguard the quality of each article we publish.
Find out more
GENERAL COMMENTARY article
Front. Mar. Sci., 05 June 2023
Sec. Marine Fisheries, Aquaculture and Living Resources
Volume 10 - 2023 | https://doi.org/10.3389/fmars.2023.1152982
 Ting-Chun Kuo1*
 Nan-Jay Su2*
 Ching-Chun Cheng1
 Kwang-Ming Liu1
 Chih-Shin Chen1Hsueh-Jung Lu2
 Ming-An Lee2
A Commentary on
Evaluating stock status of 16 commercial fish species in the coastal and offshore waters of Taiwan using the CMSY and BSM methods
by Ju P, Tian Y, Chen M, Yang S, Liu Y, Xing Q and Sun P (2020) Front. Mar. Sci. 7:618. doi: 10.3389/fmars.2020.00618
Fisheries that operate in the coastal and offshore waters of many countries are usually small-scale and with limited data; that is, the data they generate are insufficient for comprehensively evaluating the status of exploited fish stocks. Several data-limited methods have been developed and applied for assessing fish stocks to establish a scientific basis for fishery management (Dowling et al., 2019). Ju et al. (2020) (hereafter referred to as JU2020) applied catch-based models (i.e., the Monte Carlo catch-maximum sustainable yield [CMSY] model and Bayesian Schaefer Model [BSM]) and data from Taiwan’s Fisheries Statistical Yearbook to assess the exploited fish stocks in the coastal and offshore waters off Taiwan. Although those models, which are based on catch data, may be useful methods of data-poor fish stock assessments, the appropriate use and interpretation of fishery data are crucial to ensure that appropriate underlying assumptions are applied (Privitera-Johnson and Punt, 2020). In particular, concerns were raised regarding the analysis results and conclusions obtained when catch data are inappropriately incorporated into models to infer the status of assessed stocks. An essential assumption for catch-based models is that the catchability and fishing effort must be sufficiently constant or predictable over catch history (Ovando et al., 2022). The results derived from the inappropriate interpretation or use of fishery catch data can lead to unreliable analyses and even incorrect conclusions regarding stock status, all of which can result in misinformed management decisions.
A major problem of JU2020 assessments is the inappropriate inclusion of catch data from distinct fish stocks in the Pacific and Indian Oceans. We discovered that the catch data used in JU2020 combined the data of catches by coastal (within 12 nautical miles), offshore (12–200 nautical miles), and distant-water (outside exclusive economic zones) fisheries (Fisheries Agency, 2020). This method of combining data over multiple regions and fisheries is problematic for species for which a considerable fraction of catch data is obtained from different stocks (e.g., Scomberomourus commerson, Priacanthus macracanthus, and Pennahia spp. (Supplementary Figure 1), as the population of the same species in coastal waters and high seas represent distinct stocks. S. commerson are harvested from as far as the Indian Ocean by distant-water fisheries, and such stocks are distinct from the coastal stocks harvested from the waters off Taiwan (Williams and Lester, 2006; Radhakrishnan et al., 2018; Johnson et al., 2021). The misgrouping of catch data can substantially influence catch data results; in 1964, the catch of Pennahia spp. by the distant-water fisheries in the high seas was approximately 12,000 mt, which was more than 10 times the catch obtained in the coastal and offshore waters around Taiwan (Supplementary Figure 1). Notably, previous studies have indicated that the fish stocks in distant waters have distinct life history characteristics, such as age, growth and mortality, from the ones in the waters around Taiwan (Yamaguchi et al., 2004; Lu et al., 2006). Stock delineation is a challenging aspect of the stock assessment for transboundary species, and it should be carefully considered in assessment models to prevent misleading outcomes.
JU2020 also mixed the catch data for multiple species and erroneously used the catch data of other species for some species. In JU2020, the catch data labeled as chub mackerel (Scomber japonicus) were the catch data for Scomber spp., which mainly comprised blue mackerel (S. australasicus). The stock status of chub mackerel was evaluated and determined to be healthy in JU2020. However, researchers have suggested that the stocks of both blue mackerel and chub mackerel have been overfished in the East China Sea for recent two decades (Kurota et al., 2022). In Taiwan’s coastal and offshore waters, chub mackerel and blue mackerel were revealed to be overfished and fully fished, respectively (Lu, 2018; Lu et al., 2019). Consequently, a prohibition on mackerel fishing in the summer was introduced in 2012 to restore the stock abundance of mackerels (Lu et al., 2019). In JU2020, the misuse of catch data for other species also occurred. For example, the data for Scomberomourus guttatus was in fact the catch data for S. koreanus. There was no Clupanodon thrissa recorded in the Yearbook, instead the catch data should be for Nematalosa japonica. Data for Apolectus niger was also mislabeled as Parastromateus niger. In addition, the authors used the wrong column “year” instead of the catch data for S. niphonius (Supplementary Table 1 in JU2020), all of which reduced the reliability of their assessment.
In comparison to the findings presented in JU2020 regarding the stock status of 16 analyzed fish species, our analysis yielded different results when utilizing corrected catch data in the CMSY model for certain species. Our analysis applied the cmsy function of the datalimited2 package in the R program (version 4.2.0; Free, 2018). Our analysis with catch data corrected for only including catch from coastal and offshore waters and the species labeled is shown in Figure 1 (red lines). The life history parameters applied in our analysis are listed in Table S1, consistent with those used in JU2020, except for the mislabeled species in JU2020. Differences in parameters settings comparing to JU2020 include: (1) the priors of r, B/Bmsy (l0), and Bend/K (lt) for Scomberomorus koreanus, Nematalosa japonica, Scomber spp. and Apolectus niger because of mislabeled species name in JU2020, and (2) the B/Bmsy (l0) and Bend/K (lt) of Priacanthus macracanthus, and Pennahia spp. were adjusted in our analysis to include only catch data from coastal and offshore waters (Table S1). We also reproduced the results from JU2020 using their data and input parameters (black lines in Figure 1), though results of some species could not completely be replicated (e.g., Scomber japonica and Mene maculate). Comparing our analysis with corrected catch data and reproductions of JU2020, we observed that JU2020 tended to underestimate the stock status in earlier years (Figure 1). Furthermore, our results indicate that, for the latest year of assessment, most fish stocks were overfished (B/BMSY < 1), with only Scomberomourus niphonius being considered sustainable (B/BMSY > 1) (Figure 1). These findings differ from those of JU2020, who suggested that S. japonica (which should be Scomber spp.) was the only taxon not overfished in the waters around Taiwan. These divergences between our findings and those of JU2020 highlight the potential biases that can arise from the incorrect inclusion of catch data and mislabeling of fish species in assessments.
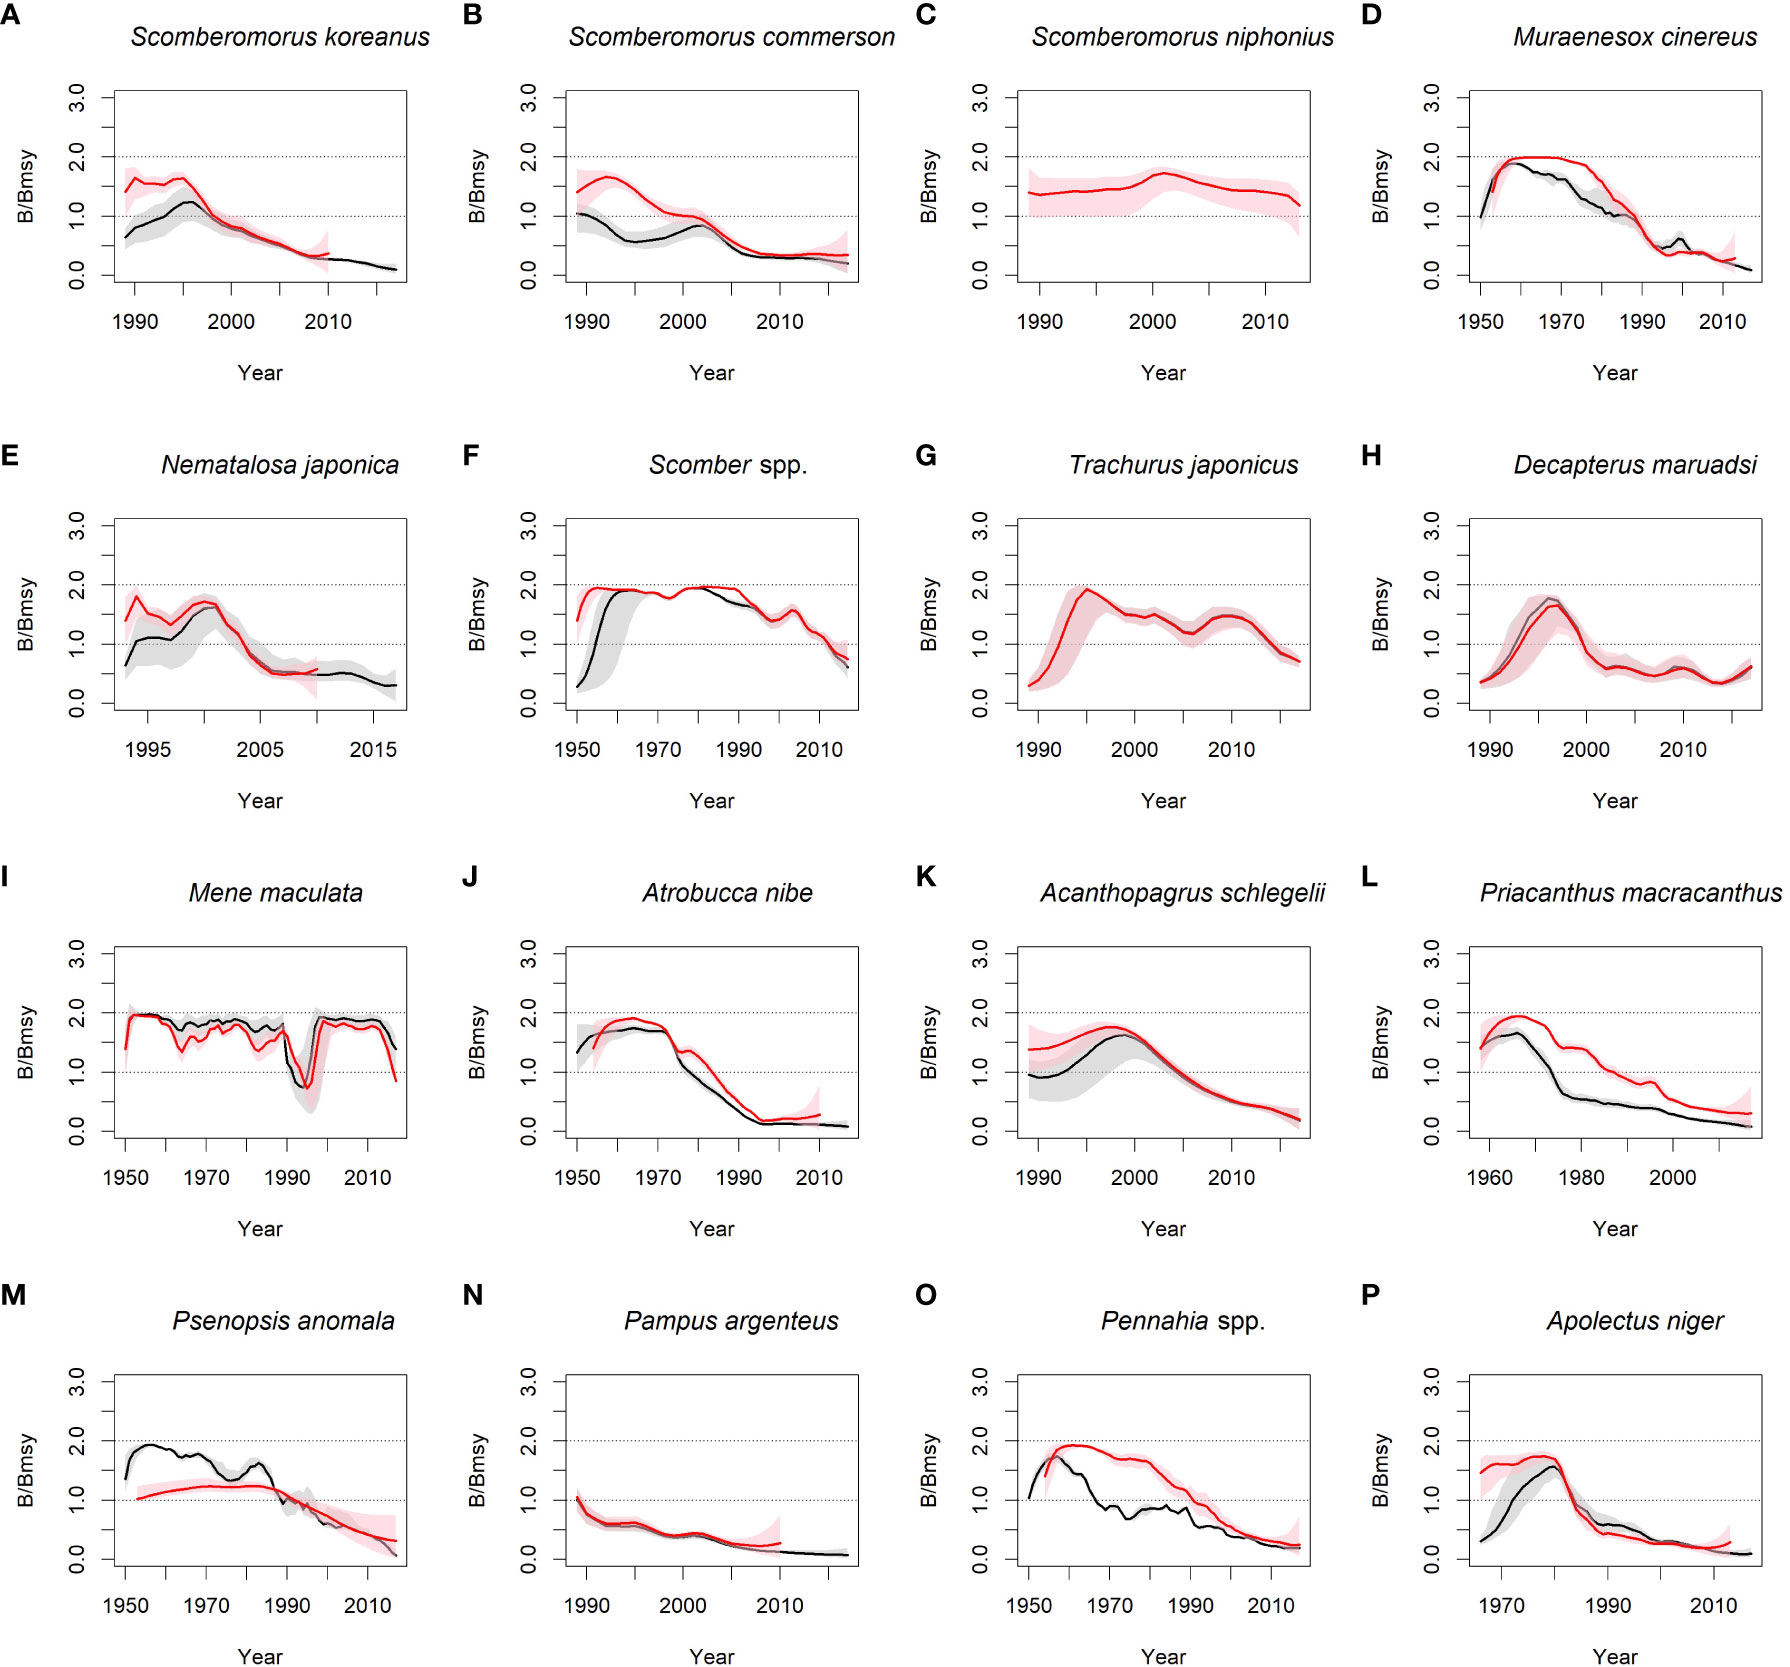
Figure 1 B/Bmsy for 16 fish stocks, as estimated using catch-maximum sustainable yield model and catch data from Taiwan Fishery Statistical Yearbook. (A) Scomberomours koreanus, which was mislabeled in JU2020 as S. guttatus, (B) Scomberomorus commerson, (C) Scoberomorus niphonius, (D) Muraenesox cinereus, (E) Nematalosa japonica, which was mislabeled as Clupanodon thrissa in JU2020, (F) Scomber spp., which was mislabeled as S. japonicus in JU2020, (G) Trachurus japonicus, (H) Decapterus maruadsi, (I) Mene maculata, (J) Atrobucca nibe, (K) Acanthopagrus schlegelii, (L) Priacanthus macracanthus, (M) Psenopsis anomala, (N) Pampus argenteus, (O) Pennahia spp., (P) Apolectus niger, which was mislabeled as Parastromateus niger in JU2020. Red lines represent results using corrected catch data corrected for only including catch from coastal and offshore waters and species labeled. Black lines were the replicated results for JU2020 using their data and input parameters. The solid line represents mean estimated B/Bmsy, and dashed lines indicate 95% confidence intervals. No replication was conducted for species (C) due to the fact that the catch data presented in JU2020 was actually the “year”. The Taiwan Fishery Statistical Yearbook only provides catch data up to 2010 for species (A, E, J, N), and it is unclear in JU2020 regarding the source of data for these species beyond 2010.
It is worth noting that our reproduction of JU2020 also yielded slightly different results for certain species, such as Mene maculate and Scomber japonica. Even when using their catch data and inputs, Mene maculate was classified as “healthy” in our reproduction [Figure 1(i), black line] instead of “slightly overfished” as reported in JU2020 (Table 3 in JU2020). Though, when using corrected catch data, our model outputs did indicate the species was overfished (red line). For Scomber japonica, both of our replication and results with corrected data showed “overfished” instead of “healthy” as reported in their paper. This discrepancy in replication may be attributed to differences in the software version used by ourselves and Ju et al. or other reasons. Nonetheless, it underscores the inherent variability in assessment results of CMSY.
Catch-based models should be applied to the fish stocks of sedentary species, the catch statistics of which can stably represent a consistent proportion of total removals (Ovando et al., 2022). Migratory fish stocks are typically distributed across wide geographic ranges and targeted by multiple fisheries, but we discovered that only catches from Taiwan, which do not represent the total catch or a consistent fraction of total removals of these species (Hiyama et al., 2002), were used in JU2020’s models. Mackerels and scads are broadly distributed across the western Pacific Ocean and harvested by international fleets from China, Japan, South Korea, and Taiwan. Due to the increasing fishing effort and catch of China since the 1980s (Shen and Heino, 2014), a decline in Taiwan’s catch as a proportion of total removals over time is observed, leading to a pessimistic assessment of mackerels and scads (Chen et al., 2009; Yukami et al., 2009). Thus, the efforts required for corrections must be considered in stock assessments, especially when changes in fishing effort have been reported.
In addition, catch-based models should generally be applied only when catchability is constant or predictable over time (Ovando et al., 2022). However, for Taiwan’s fisheries, contraction in traditional purse seine fishery and the expansion of new Taiwanese Danish seine fishery have happened since 1990s. The improvement in fishing gears and change in catchability violate the model assumption and distort the relationship between biomass and catch of the fish stocks when models such as BSM are applied (Dowling et al., 2019). Another key assumption for catch-based models is that fishery regulations have not been amended over the period assessed; that is, a change in catch is a consequence of a change in biomass (Branch et al., 2011). A notable fishery regulation in Taiwan is the prohibition of trawling within 3 nautical miles of Taiwan’s coast, which was introduced in 1999 to restore coastal resources. This development of conservation policy to make coastal fisheries sustainable has resulted prompted trawl fisheries to shift their fishing grounds to areas beyond Taiwan’s coastal areas, which is regarded as the main reason for the decline in catch of coastal species such as Pennahia spp., Atrobucca nibe, Muraenesox cinereus, Priacanthus macracanthus, Psenopsis anomala, and Pampus argenteus in trawl fisheries (Sun and Chiang, 2009; Supplementary Figure 2).
The use of complex fishing methods and gears hinders the measurement of fishing effort in the coastal and offshore fisheries in Taiwan, and this is another key problem that can affect the application of the BSM. We discovered that in JU2020, catch per unit effort (CPUE) was defined as the catch divided by the number of fishing vessels. This definition can be problematic because they defined the number of fishing vessels as the number of registered fishing vessels reported in the Yearbook instead of the number of active vessels. Taiwan implemented a fishing layoff program and reduced fuel subsidies in 2002 to reduce fishing effort1; thus, the number of registered vessels, instead of active vessels, may be an invalid basis for measuring fishing effort. In addition, the increasing labor demand of the Taiwanese Danish seine fishery subsector, which began to develop in the 1990s, must also be considered in fishing effort estimations (Lu, 2018; Lu et al., 2019). We suggest that “active” vessels should be used as the base to calculate CPUE for each fishery, and each fishery determines its own practical effort measurement, such as the number of fishing days for the squid fishery or the number of hooks for the longline fishery. These points highlight the use of the appropriate variables for measuring effort and the implementation of CPUE standardization for obtaining reliable abundance-related findings regarding fish stocks.
Given the issues on catch and effort data we proposed above, we may challenge the validity of BSM results in JU2020. In Froese et al. (2017), BSM was applied to fish stocks that reliable CPUE and proper assessment have been conducted, for the purpose of evaluating the estimation of r and K by CMSY. However, in the case of JU2020, the nominal CPUE used in BSM was not verified, as the catch and effort data used could be unrepresentative. The nominal CPUE was not even been standardized to be a reliable index of abundance for the fish stocks. In that case, the values for r and K produced by BSM should not be used to evaluate the outputs of CMSY.
The assessment of fish stocks in coastal and offshore waters is a complex process, and the catch data from small-scale fisheries should be used carefully to avoid producing misleading results. Historical catch series should be carefully examined and appropriately used in models (Ovando et al., 2022). If a time series of catch data is unreliable or violates the assumptions of constant catchability, a catch-based model may produce biased estimates (Pons et al., 2020). In this case, length-based methods should be applied as an alternative approach for analyzing data-limited fisheries and for establishing a cost-effective indicator of stock status for management purposes (Chong et al., 2020). However, both catch- and length-based methods are highly dependent on life history parameters, especially for the assessment of short-lived species. Therefore, fundamental biological studies must be conducted to obtain realistic estimates for life history parameters, which in turn will improve the understanding of fish population dynamics.
T-CK and N-JS wrote the paper. C-CC conducted CMSY analyses. K-ML, C-SC, H-JL, and M-AL provided inputs and revised the manuscript. All authors contributed to the article and approved the submitted version.
We acknowledge the funding provided by the National Science and Technology Council, Taiwan (NSTC-110-2636-B-019-001).
We would like to thank the two reviewers for their constructive comments and suggestions for improving this manuscript.
The authors declare that the research was conducted in the absence of any commercial or financial relationships that could be construed as a potential conflict of interest.
All claims expressed in this article are solely those of the authors and do not necessarily represent those of their affiliated organizations, or those of the publisher, the editors and the reviewers. Any product that may be evaluated in this article, or claim that may be made by its manufacturer, is not guaranteed or endorsed by the publisher.
The Supplementary Material for this article can be found online at: https://www.frontiersin.org/articles/10.3389/fmars.2023.1152982/full#supplementary-material
Branch T. A., Jensen O. P., Ricard D., Ye Y., Hilborn R. (2011). Contrasting global trends in marine fishery status obtained from catches and from stock assessments. Conserv. Biol. 25, 777–786. doi: 10.1111/J.1523-1739.2011.01687.X
Chen X., Li G., Feng B., Tian S. (2009). Habitat suitability index of chub mackerel (Scomber japonicus) from July to September in the East China Sea. J. Oceanogr. 65, 93–102. doi: 10.1007/s10872-009-0009-9
Chong L., Mildenberger T. K., Rudd M. B., Taylor M. H., Cope J. M., Branch T. A., et al. (2020). Performance evaluation of data-limited, length-based stock assessment methods. ICES J. Mar. Sci. 77, 97–108. doi: 10.1093/icesjms/fsz212
Dowling N. A., Smith A. D. M., Smith D. C., Parma A. M., Dichmont C. M., Sainsbury K., et al. (2019). Generic solutions for data-limited fishery assessments are not so simple. Fish Fish. 20, 174–188. doi: 10.1111/faf.12329
Fisheries Agency (2020). Handbook of Fisheries Survey Statistics. Council of Agriculture, Executive Yuan. Taiwan. Available at: https://www.fa.gov.tw/list.php?theme=CFSSM&subtheme=&page=1&.
Free C. (2018). “datalimited2: more stock assessment methods for data-limited fisheries,” in R package version 0.1.0. Available at: https://github.com/cfree14/datalimited2.
Froese R., Demirel N., Coro G., Kleisner K. M., Winker H. (2017). Estimating fisheries reference points from catch and resilience. Fish Fish. 18, 506–526. doi: 10.1111/faf.12190
Hiyama Y., Yoda M., Ohshimo S. (2002). Stock size fluctuations in chub mackerel (Scomber japonicus) in the East China Sea and the Japan/East Sea. Fisheries Oceanography 11 (6), 347–353. doi: 10.1046/j.1365-2419.2002.00217.x
Johnson M. G., Mgaya Y. D., Shaghude Y. W. (2021). Analysis of the genetic stock structure and phylogenetic relationship of narrow-barred Spanish mackerel Scomberomorus commerson (Lacépède 1800) along the northern Tanzanian coastal waters using mitochondrial DNA. Reg. Stud. Mar. Sci. 46, 101862. doi: 10.1016/j.rsma.2021.101862
Ju P., Tian Y., Chen M., Yang S., Liu Y., Xing Q., et al. (2020). Evaluating stock status of 16 commercial fish species in the coastal and offshore waters of Taiwan using the CMSY and BSM methods. Front. Mar. Sci. 7. doi: 10.3389/fmars.2020.00618
Kurota H., Muko S., Yoda M., Hino H., Motomitsu H., Sassa C., et al. (2022). Stock assessment and evaluation for blue mackerel, (2021), marine fisheries stock assessment and evaluation for Japanese waters (Tokyo: Japan Fisheries Agency and Japan Fisheries Research and Education Agency).
Lu H. J. (2018). “Present situation and outlook for mackerel and scad fisheries,” in Symposium on Sustainable Utilization and Outlook for the Taiwan’s Offshore and Coastal Fisheries; Keelung, Taiwan, 20 September 2018. 5–11.
Lu H. ,. J., Su N. J., Lin C. R., Chen T. P. (2019). “On the management and stock assessment of the mackerels resource in the northeastern Taiwan: current status and lessons in future,” in Taiwan-Japan. 2019 Bilateral Meeting on Japan-Taiwan Fisheries Scientific Research Cooperation and Symposium; Yokohama, Japan, June 3-4, 2019.
Lu P. L., Yang L., Lu Z. B., Yang S. Y., Du J. G., Zhong H. Q., et al. (2006). Age, growth, mortality and population structure of silver croaker Pennahia argentata (Houttuyn 1782) and red bigeye Priacanthus macracanthus cuvier 1829 in the north-central Taiwan strait. J. Appl. Ichth. 32 (4), 652–660. doi: 10.1111/jai.13053
Ovando D., Free C. M., Jensen O. P., Hilborn R. (2022). A history and evaluation of catch-only stock assessment models. Fish Fish. 23, 616–630. doi: 10.1111/FAF.12637
Pons M., Cope J. M., Kell L. T. (2020). Comparing performance of catch-based and length-based stock assessment methods in data-limited fisheries. Can. J. Fish. Aquat. Sci. 77, 1026–1037. doi: 10.1139/cjfas-2019-0276
Privitera-Johnson K. M., Punt A. E. (2020). Leveraging scientific uncertainty in fisheries management for estimating among-assessment variation in overfishing limits. ICES J. Mar. Sci. 77, 515–526. doi: 10.1093/icesjms/fsz237
Radhakrishnan D. P., Vineesh N., Kathirvelpandian A., Basheer V. S., Gopalakrishnan A. (2018). Population structure of Spanish mackerel Scomberomorus commerson (Lacepede 1800) in the northern Indian ocean determined using microatellite markers. Aquat. Living Resour. 31, 22. doi: 10.1051/alr/2018011
Shen G., Heino M. (2014). An overview of marine fisheries management in China. Mar. Policy 44, 265–272.
Sun C. H., Chiang F. S. (2009). Fleet dynamic analysis of the taiwan offshore trawl fishery: an application of the sea surface temperature measures. J. Mar. Sci. Technol. 7, 101–109. doi: 10.51400/2709-6998.2528
Williams R. E., Lester R. J. G. (2006). Stock structure of Spanish mackerel Scomberomorus commerson along the Australian east coast deduced from parasite data. J. Fish Biol. 68, 1707–1712. doi: 10.1111/j.1095-8649.2006.01026
Yamaguchi A., Kume G., Takita T. (2004). Geographic variation in the growth of white croaker, pennahia argentata, off the coast of northwest Kyushu, Japan. Environ. Biol. Fishes 71, 179–188. doi: 10.1007/s10641-004-0297-2
Keywords: data-limited assessment, CMSY, catch-based methods, Taiwan’s fisheries, coastal fisheries
Citation: Kuo T-C, Su N-J, Cheng C-C, Liu K-M, Chen C-S, Lu H-J and Lee M-A (2023) Commentary: Evaluating stock status of 16 commercial fish species in the coastal and offshore waters of Taiwan using the CMSY and BSM methods. Front. Mar. Sci. 10:1152982. doi: 10.3389/fmars.2023.1152982
Received: 28 January 2023; Accepted: 23 May 2023;
Published: 05 June 2023.
Edited by:
Momoko Ichinokawa, Japan Fisheries Research and Education Agency (FRA), JapanReviewed by:
Amy Schueller, Southeast Fisheries Science Center (NOAA), United StatesCopyright © 2023 Kuo, Su, Cheng, Liu, Chen, Lu and Lee. This is an open-access article distributed under the terms of the Creative Commons Attribution License (CC BY). The use, distribution or reproduction in other forums is permitted, provided the original author(s) and the copyright owner(s) are credited and that the original publication in this journal is cited, in accordance with accepted academic practice. No use, distribution or reproduction is permitted which does not comply with these terms.
*Correspondence: Ting-Chun Kuo, dGNrdW9AbWFpbC5udG91LmVkdS50dw==; Nan-Jay Su, bmFuamF5QG50b3UuZWR1LnR3
Disclaimer: All claims expressed in this article are solely those of the authors and do not necessarily represent those of their affiliated organizations, or those of the publisher, the editors and the reviewers. Any product that may be evaluated in this article or claim that may be made by its manufacturer is not guaranteed or endorsed by the publisher.
Research integrity at Frontiers
Learn more about the work of our research integrity team to safeguard the quality of each article we publish.