 Pina Gruden
 Yvonne M. Barkley
 Jennifer L. K. McCullough
94% of researchers rate our articles as excellent or good
Learn more about the work of our research integrity team to safeguard the quality of each article we publish.
Find out more
BRIEF RESEARCH REPORT article
Front. Mar. Sci., 15 March 2023
Sec. Marine Megafauna
Volume 10 - 2023 | https://doi.org/10.3389/fmars.2023.1147670
Understanding the vocal behavior of cetaceans is an important component of many passive acoustic applications. This study quantifies the vocal behavior of acoustic subgroups of false killer whales (Pseudorca crassidens) from the Hawaiian Archipelago. The acoustic subgroups (N = 523) exhibit diverse vocal behavior that varies between encounters. Overall, 29% of acoustic subgroups only echolocate, 16% only whistle, and 55% emit both types of vocalizations. These results contribute important information for developing automated passive acoustic cetacean tracking, localization, and classification techniques, and thus, support future cetacean monitoring and assessment efforts.
Passive acoustic monitoring has many applications in marine mammal research, including density estimation for management and conservation purposes (Van Parijs et al., 2009; Thomas and Marques, 2012; Hildebrand et al., 2019; Martin et al., 2020; Barlow et al., 2022). Although density estimation for marine mammals is primarily performed using visual distance sampling or capture-recapture methods, it is often advantageous to use acoustic data to estimate densities, especially with elusive species (Moretti et al., 2010; Martin et al., 2013). A variety of approaches exist to estimate animal density from passive acoustic data (see Ref (Thomas and Marques, 2012). and references within). Variables quantified to reach estimates are both study- and species-dependent since types and rates of vocalizations in marine mammal species vary as a function of the animal behavior, group size, time of day, season, year, and location (Henderson et al., 2012; Thomas and Marques, 2012). For many species, there is limited knowledge of the basic vocal behavior that is necessary for estimating vocalization rates, thus impeding the use of passive acoustic data for density estimation (Thomas and Marques, 2012; Bradford et al., 2020).
The goal of this study is to report the first insights into the vocal behavior of false killer whales (Pseudorca crassidens) from around the Hawaiian Archipelago. False killer whales are highly vocal and produce echolocation clicks, whistles, and burst pulses (Au et al., 1995; Murray et al., 1998; Oswald et al., 2007; Baumann-Pickering et al., 2015). Echolocation clicks and whistles are the predominant types of vocalizations, and burst pulses rarely occur (McCullough et al., 2021). Although the acoustic characteristics of these signals have been described (Au et al., 1995; Murray et al., 1998; Oswald et al., 2007; Baumann-Pickering et al., 2015) and classification schemes proposed (Barkley et al., 2019; McCullough et al., 2021), the vocal behavior and rate of production of these signals in wild populations are unknown.
Three distinct populations of false killer whales are found in the Hawaiian Archipelago, with one currently listed as endangered under the U.S. Endangered Species Act (Baird, 2009; Oleson et al., 2010; Bradford et al., 2020). These delphinids are known to interact with fisheries throughout the archipelago leading to whale mortality or injury (Baird, 2009; Oleson et al., 2010) at sometimes unsustainable rates. Thus, these populations have been a focus of extensive survey efforts to collect visual data for abundance estimation citepBradford2020. However, their elusive nature, dispersed aggregations of subgroups, and potential attraction to the research vessel introduce biases to visual-based abundance estimates (Bradford et al., 2014). This study aims to improve the understanding of false killer whale behavior by reporting the first analysis of the vocal behavior from false killer whale acoustic subgroups. An acoustic subgroup refers to a small acoustically tracked group of false killer whales swimming closely together within a larger, spatially dispersed group. Since acoustic subgroups are defined using localization data from towed hydrophone arrays, they collectively capture the overall group’s relative behavior through space and time. Unlike visually sighted subgroups (Bradford et al., 2014), the number of individuals within an acoustic subgroup could not be accurately estimated in the current study due to the small spacing between sensors in the hydrophone array and a lack of data on false killer whale vocalization statistics such as rate of vocalization per animal. However, quantifying acoustic subgroup vocal behavior provides additional information about the overall group behavior to complement the visual data, contribute knowledge to address biases, and support future passive acoustic density estimation efforts.
The data were collected during a joint visual and acoustic ship-based survey of Hawaiian waters (Hawaiian Islands Cetacean and Ecosystem Assessment Survey- HICEAS) from July to December of 2017, using two research vessels (Yano et al., 2018). Recordings were collected using a multi-channel towed hydrophone array that sampled at 500 kHz. A detailed description of the survey and the equipment can be found in Ref (Yano et al., 2018)., and a portion of the acoustic recordings are publicly available at Ref (NOAA Pacific Islands Fisheries Science Center, 2022).. Briefly, the Pacific Island Fisheries Science Center’s protocol for surveying false killer whales consists of two phases (Yano et al., 2018). Phase I is an on-effort trackline passing mode where a vessel travels in a straight line, and Phase II is an off-effort mode where a vessel does not travel in a straight line (Yano et al., 2018). During Phase II, boat movements are erratic preventing consistent acoustic tracking with the hydrophone array. Therefore, only acoustic recordings from Phase I were used in the present study.
Recordings from the first and the last hydrophone of the towed array system were used for the analysis in order to maximize the sensor separation and thus the spatial resolution (Gruden et al., 2021). Sensor separation for each encounter is listed in Table reftable: encounters. The data were pre-processed as described in Ref (Gruden et al., 2021). to obtain cross-correlograms and examples can be seen in Supplementary Material1. Cross-correlograms allow multiple spatially separated sources to be tracked and localized by tracking the changes in time-difference-of-arrival (TDOA) of an emitted signal between two sensors for each source (or a group of closely spaced sources, i.e., acoustic subgroup). Briefly, two types of cross-correlograms were created: one based on clicks and the other based on whistles. Burst pulses were not considered separately in this study since they occur rarely (McCullough et al., 2021) and have typically low amplitude. The burst pulses that had amplitudes comparable to echolocation clicks were considered in the click-based cross-correlograms due to their impulsive nature.
Prior to constructing cross-correlograms for this study, the data were pre-processed as follows. To construct a click-based cross-correlogram, the data were first bandpass filtered using a 4th-order Butterworth filter with cut-off frequencies of 8 and 30 kHz (Gruden et al., 2021). To construct a whistle-based cross-correlogram, the data were first processed with a three-stage click removal process which included a 4th-order Butterworth bandpass filter with cut-off frequencies of 2.5 and 12 kHz (Gruden et al., 2021). Cross-correlograms in both cases were then computed based on the generalized cross-correlation smoothed coherence transform (GCC-SCOT) with a 1 s long sliding window and 50% overlap (Gruden et al., 2021). Cross-correlograms were normalized and measurements were extracted by applying a threshold of 3.7 (Gruden et al., 2021). Measurements consisted of TDOA and amplitude of the cross-correlation function information. After measurement extraction, the measurements from both types of cross-correlograms were combined so that analysis was performed on joint information.
From the combined measurements, the experienced manual analyst created tracks of individual acoustic subgroups of false killer whales by linking together slowly changing consecutive TDOAs that had a high amplitude of the cross-correlation function. From here on, a track is thus defined as a set of TDOAs for each acoustic subgroup connected into a trajectory. This resulted in three types of tracks: tracks based on whistles, echolocation clicks, and both whistles and clicks. Note that one track can be a result of one or multiple animals as it is not possible to differentiate due to limited spatial resolution of the measurements (Gruden et al., 2021). Moreover, tracks include periods of silence (animals are present but not vocalizing and move during this time),and these were investigated in terms of vocal activity as follows.
Vocal activity of acoustic subgroups was investigated by examining vocal and silent periods within each track (an example is shown in Supplementary Material 2). A vocal period is defined as a period during which two consecutive TDOAs in the same track are separated by less than 21 s. This threshold was determined by examining the manually annotated tracks, and 98% of all consecutive TDOAs within a given track were separated by less than that value. A silent period is any period in a given track in which consecutive TDOAs are separated by more than 21 s. Further, for each track, two states were defined: vocal and silent. Vocal state is a sum of all vocal periods in a given track divided by the track duration, and silent state is a sum of all silent periods in a given track divided by the track duration.
Nine visually confirmed, single species acoustic encounters of false killer whales, recorded on eight separate days, were investigated with TDOA tracks identified (Table 1, map of the encounters is shown in Supplementary Material3). Two of the encounters occurred on the same day and time (Encounters 1 and 9, Table 1), but they were collected at two different locations (see map in the Supplementary Material), by concurrent research vessels, and are thus considered independent. Overall, 523 tracks were identified in 749 min (total duration of all encounters), with median overall track duration of 3.9 min (interquartile range 9.3 min). Of these tracks, 29% consisted of only echolocation clicks, 16% only whistles, and 55% both clicks and whistles. While there was a variation in the proportion of a given track type between encounters, tracks consisting of both clicks and whistles occurred significantly more frequent in all encounters (Kruskall-Wallis test, p <0.001, Figure 1A).
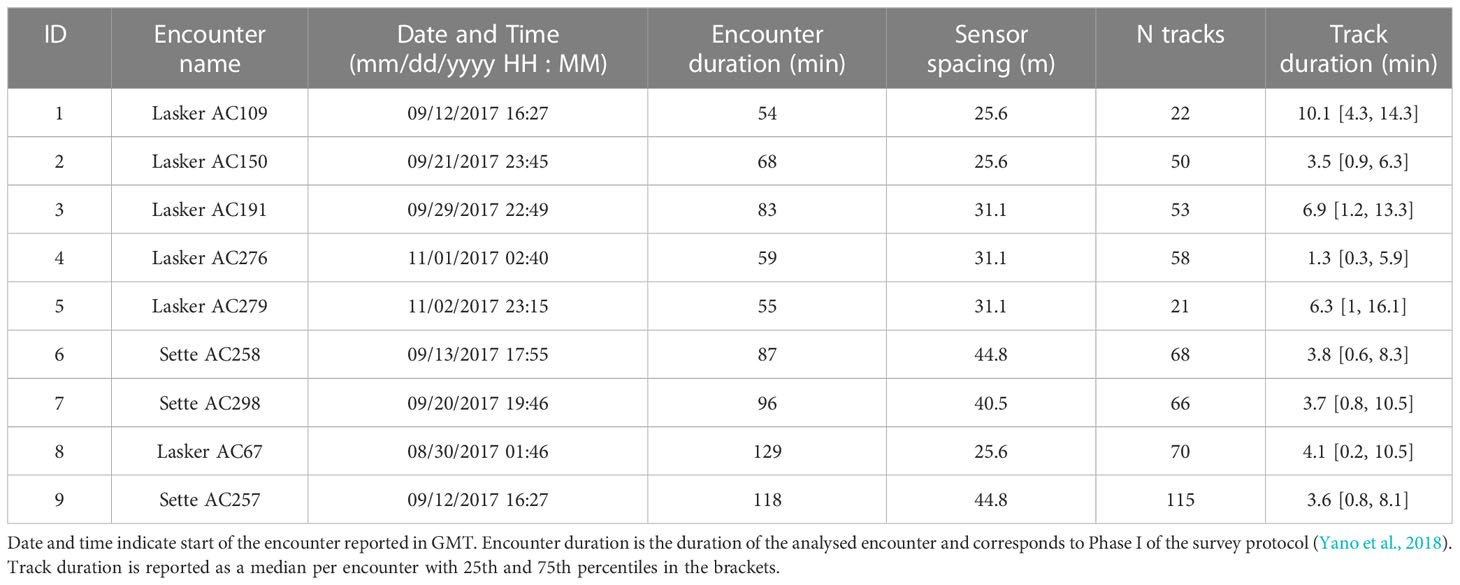
Table 1 Acoustic encounters with false killer whales and identified acoustic subgroup tracks.
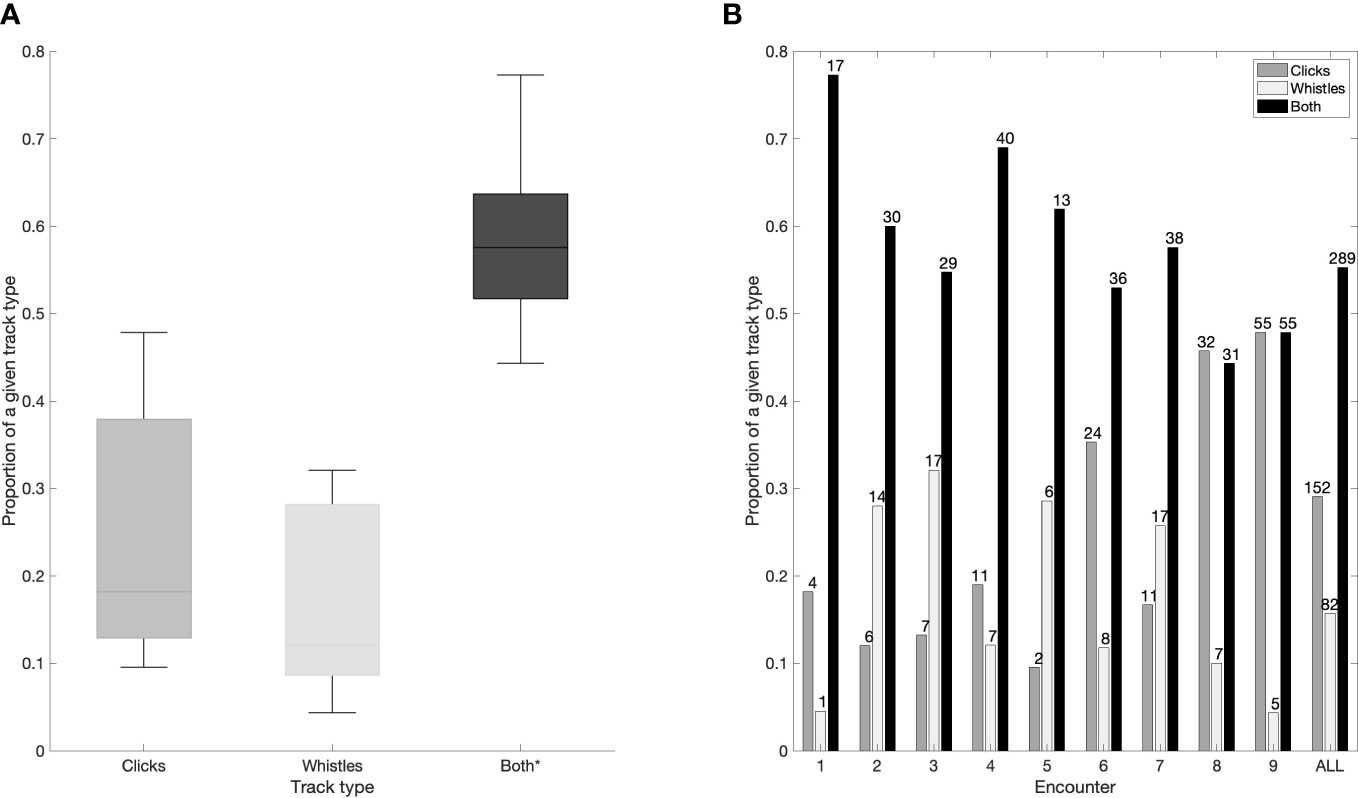
Figure 1 Proportion of a given track type (Clicks/Whistles/Both) in all encounters collectively (A) and in each individual encounter (B). On each box in (A) the central line indicates the median, the bottom and top edges of the box indicate 25th and 75th percentiles, respectively. The whiskers in (A) extend to most extreme data points not considered outliers. Statistically significant results are denoted with an asterisk. The numbers above each bar in (B) denote the number of a given track type in that encounter.
The proportion of a given track type varied between encounters (Figure 1B). Track type consisting of both clicks and whistles were predominant in 7 out of 9 encounters, but the proportion of the other two track types varied between encounters (Figure 1B).
Track duration varied between encounters (Table 1). Although the overall duration of encounters was long, the individual acoustic subgroup tracks were short (median overall track duration of 3.9 min). Track duration also varied between different track types within the same encounter (Figure 2). The track type consisting of both clicks and whistles was significantly longer compared to the other two track types in most encounters (Kruskall-Wallis test, p ≤ 0.01 for encounters 2-4, 6-9, and “All”).
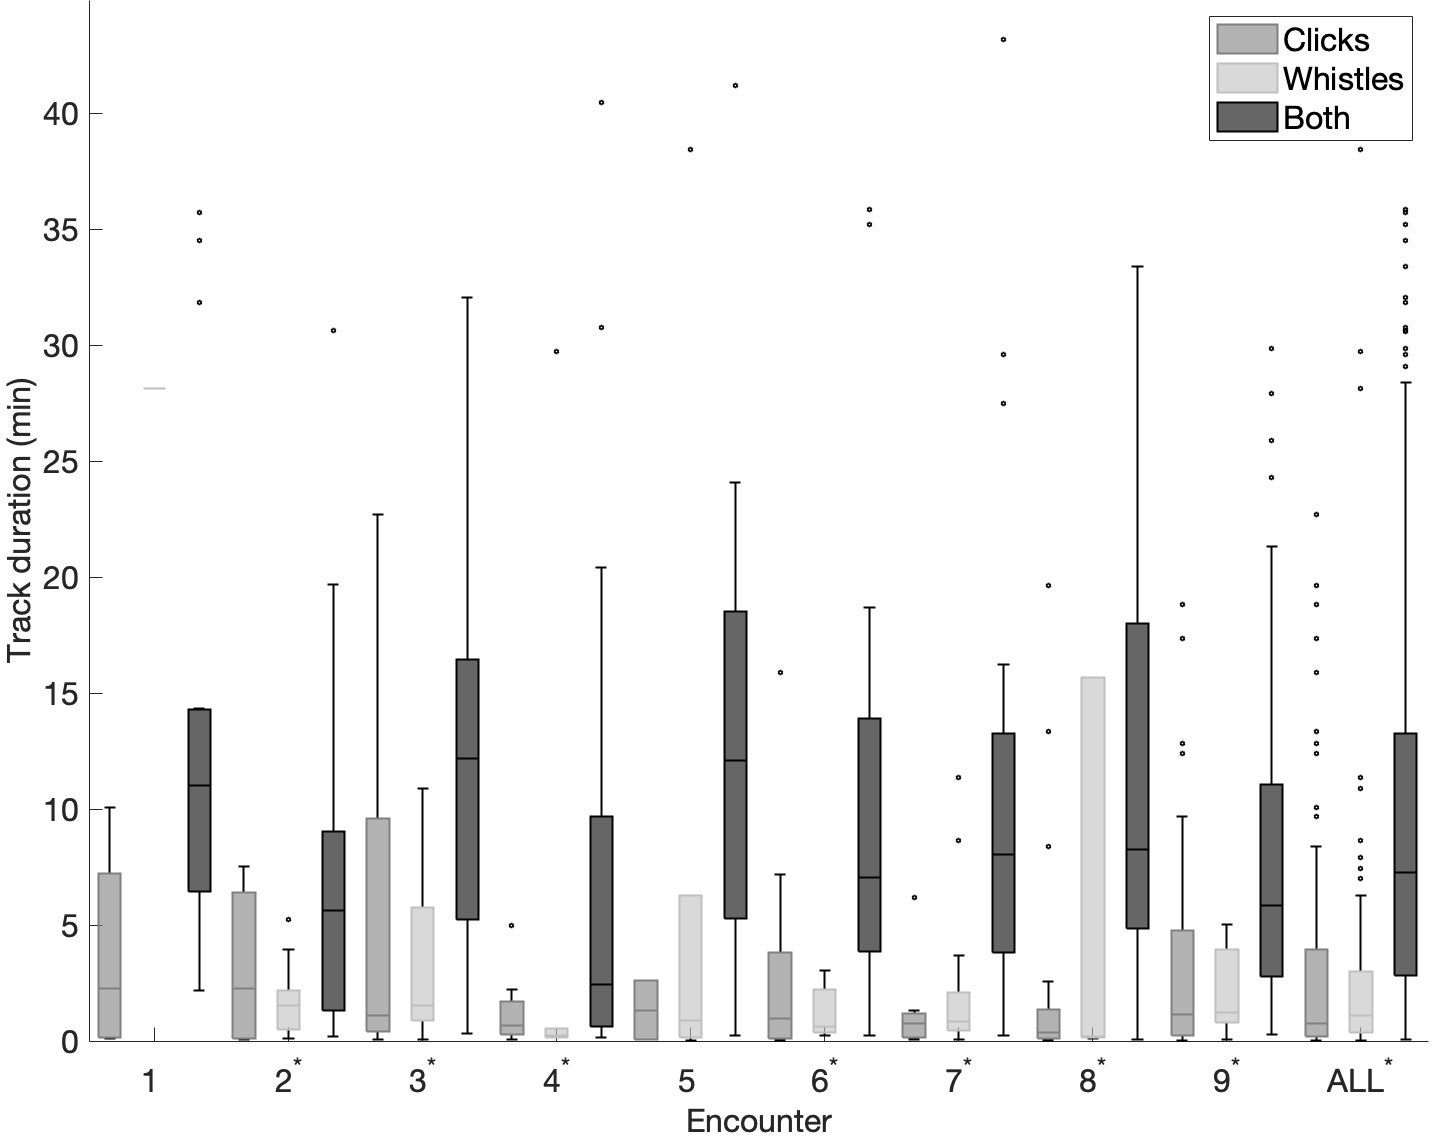
Figure 2 Track duration per encounter and for all encounters collectively. On each box the central line indicates the median, the bottom and top edges of the box indicate 25th and 75th percentiles, respectively. The whiskers extend to most extreme data points not considered outliers, and outliers are indicated as black dots. Note, some of the longer duration outliers are omitted for easier readability. Statistically significant results are denoted with an asterisk.
Further, the overall vocal activity of each encounter was investigated. False killer whale subgroups spent significantly more time being vocal than silent for all encounters except Encounter 1 (Kruskall-Wallis test, p <0.001, Figure 3A). Vocal activity was also investigated for each track type overall, and subgroups spent significantly more time being vocal than silent for all track types (Kruskall-Wallis test, p <0.001, Figure 3B).
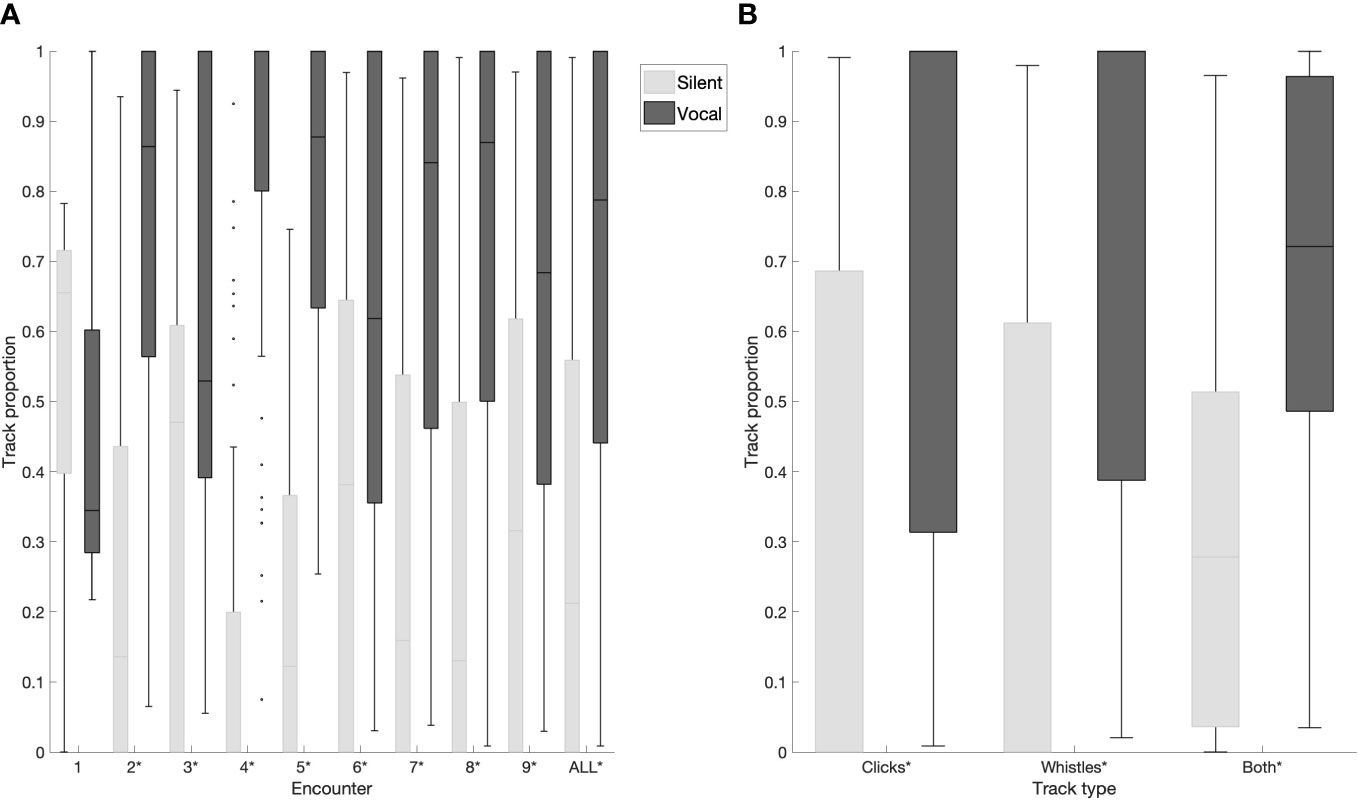
Figure 3 Track proportion spent in a given state, vocal or silent, (A) for each encounter and for all encounters collectively, (B) for each track type collectively. On each box the central line indicates the median, the bottom and top edges of the box indicate 25th and 75th percentiles, respectively. The whiskers extend to most extreme data points not considered outliers, and outliers are indicated as black dots. Statistically significant results are denoted with an asterisk.
False killer whales were shown to exhibit diverse vocal behavior within the same encounter and between encounters. Acoustic subgroup tracks that contained both whistles and clicks were significantly more common than tracks based on either clicks or whistles alone (Figure 1). Traditionally, tracking of groups of animals from ship-based surveys is carried out separately for clicks and whistles, but the results of this study show the need to track on joint information from clicks and whistles to obtain more accurate information about an encounter.
Overall, tracks containing both clicks and whistles were significantly longer compared to the other two track types (Figure 2), which could give the subgroups of animals that exhibit such behavior a better chance of being detected, tracked, and localized (Gruden et al., 2021). This should be taken into consideration for applications that infer parameters based on acoustically localized subgroups, such as abundance and density estimation, and for applications where detecting all subgroups of animals is important. For example, if this variation in detectability (and thus availability) is persistent among subgroups, any resulting data set violates assumptions of independence and could lead to large biases in density and abundance estimates if left unaccounted for in the modeling process (Carothers, 1973; Wilbur and Landwehr, 1974). Note that there were outliers in track duration for all track types in many encounters, which could be due to the variability at the individual level (Figure 2).
The proportions of track types within a given encounter varied likely due to the acoustic subgroup’s behavioral state and the total number of animals present along with factors affecting signal propagation (such as distance and sea state). Moreover, the differences in the beam pattern between clicks and whistles (Au et al., 1995), could also have affected detection ranges and contributed to differences in the proportions. Data on the behavioral state of the acoustic subgroups (e.g., feeding, traveling, socializing) are not available, since the majority of the visual encounters occur in Phase II of the survey, which often takes place hours after the acoustic tracking conducted in Phase I of the survey. Due to elusive surface behavior of this species, large proportions of the acoustic subgroups tend to be missed by visual observers in the Phase I of the survey (Yano et al., 2018). Thus, linking the subgroups from acoustically tracked subgroups in Phase I to visually detected subgroups in Phase II is not reliable.
However, since the data were collected across multiple months and over a large geographic area, the data likely capture a representative collection of different behavioral states. While the number of animals in each acoustic subgroup are also not available, for the reasons discussed above, track density (the number of tracks per encounter, or the number of tracks per unit time) could be used as an approximation of the overall group size in the encounter. Future studies should investigate these issues further.
When vocal activity was investigated for each encounter, it was observed that the animals spent more time in vocal state than silent in the majority of encounters (Figure 3A). This was true also for the individual track types (Figure 3B). This is a rough estimate, since vocal states still include periods of silence between consecutive TDOAs, albeit shorter than 21 s. The periods of silence within each vocal state can still cause the automated methods to detect tracks in segments (track fragmentation) (Gruden et al., 2021). In the present study, tracks were manually annotated to remove the fragmentation resulting from automated methods, to investigate the proportion of time subgroups spent vocalizing. However, as in any manual approach, this leads to a certain degree of subjectivity in track assignments. In order to make results more objective and processing time more efficient, future efforts will focus on adapting the methods in Ref (Gruden et al., 2021). to obtain these behavioral parameters automatically.
Understanding the vocal behavior (track type composition, duration, and vocal state) of a given species is important not only for detection, tracking, and localization, but can also contribute to classification efforts. Adding contextual information, such as timing between calls or spatial positioning, has previously improved classification performance (Roch et al., 2018; Madhusudhana et al., 2021). The Hawaiian waters are home to other cetacean species with acoustic characteristics similar to false killer whales, such as short-finned pilot whales (Globicephala macrorhynchus) (McCullough et al., 2021). Future studies could utilize the methods outlined in this paper to quantify the vocal behavior of these species and identify important features that may improve acoustic classification between species. Similarly, the proposed methods may be used to investigate the vocal behavior of the three distinct populations of false killer whales. Previous classification work did not find reliable acoustic features of their whistles to distinguish between the populations (Barkley et al., 2019), but including aspects of their vocal behavior as an additional feature may improve classification models and thus, aid conservation efforts.
This study showed that subgroups of false killer whales varied in their vocal behavior by examining time-difference-of-arrivals of the vocalizations between sensors in a towed hydrophone array. Most subgroups produced both whistles and echolocation clicks, although some subgroups only produced a single vocalization type. The tracks from subgroups emitting both clicks and whistles were longer in duration compared to the other two track types, increasing the availability of such subgroups for detection and tracking. Methods presented in this study may be applied to additional survey data sets collected in Hawaiian waters to increase the sample size and allow for further consideration of factors affecting vocal behavior, such as spatiotemporal variables. The findings of this study contribute to tracking, localization, classification efforts, and acoustic cue rate studies, and thus provide data to inform future species monitoring and assessment efforts.
The original contributions presented in the study are included in the article/Supplementary Material. Further inquiries can be directed to the corresponding author.
JM contributed to data collection. PG contributed to conception of the study, and data analysis. PG wrote the first manuscript draft and YB and JM contributed comments and revisions to all sections. All authors contributed to the article and approved the submitted version.
The data used in this study were collected as part of HICEAS survey in 2017, part of the Pacific Marine Assessment Program for Protected Species (PacMAPPS) funded by the National Marine Fisheries Service, the U.S. Navy, and the Bureau of Ocean Energy Management. We thank everyone involved in data collection. Support for data analysis was provided by the Pacific Islands Fisheries Science Center and the NMFS National Take-Reduction Program. Special thanks to Selene Fregosi for comments on the early version of this manuscript, Erin Oleson and Eva-Marie Nosal for support throughout the project, Janelle Badger and Amanda Bradford for discussions on abundance estimation, and Elizabeth Taylor for help with the map in the Supplementary Material.
The authors declare that the research was conducted in the absence of any commercial or financial relationships that could be construed as a potential conflict of interest.
The reviewer AP declared a shared affiliation with the authors PN to the handling editor at the time of review.
All claims expressed in this article are solely those of the authors and do not necessarily represent those of their affiliated organizations, or those of the publisher, the editors and the reviewers. Any product that may be evaluated in this article, or claim that may be made by its manufacturer, is not guaranteed or endorsed by the publisher.
The Supplementary Material for this article can be found online at: https://www.frontiersin.org/articles/10.3389/fmars.2023.1147670/full#supplementary-material
Au W. W., Pawloski J. L., Nachtigall P. E., Blonz M., Gisner R. C. (1995). Echolocation signals and transmission beam pattern of a false killer whale (Pseudorca crassidens). J. Acoust. Soc. America 98 (1), 51–59. doi: 10.1121/1.413643
Baird R. W. (2009). A review of false killer whales in Hawaiian waters: Biology, status, and risk factors (Olympia, WA: Cascadia Research Collective Olympia).
Barkley Y. M., Oleson E. M., Oswald J. N., Franklin E. C. (2019). Whistle classification of sympatric false killer whale populations in Hawaiian waters yields low accuracy rates. Front. Mar. Sci. 6, 1–15. doi: 10.3389/fmars.2019.00645
Barlow J., Moore J. E., McCullough J. L. K., Griffiths E. T. (2022). Acoustic-based estimates of cuvier’s beaked whale (Ziphius cavirostris) density and abundance along the US West coast from drifting hydrophone recorders. Mar. Mamm. Sci. 38 (2), 517–538. doi: 10.1111/mms.12872
Baumann-Pickering S., Simonis A. E., Oleson E. M., Baird R. W., Roch M. A., Wiggins S. M. (2015). False killer whale and short-finned pilot whale acoustic identification. Endanger. Species Res. 28 (2), 97–108. doi: 10.3354/esr00685
Bradford A. L., Becker E. A., Oleson E. M., Forney K. A., Moore J. E., Barlow J. (2020). Abundance estimates of false killer whales in Hawaiian waters and the broader central pacific. (US Dept. of Commerce. NOAA). NOAA Technical Memorandum NOAA-TM-NMFS-PIFSC-104, 78 p. doi: 10.25923/2jjg-p807
Bradford A. L., Forney K. A., Oleson E. M., Barlow J. (2014). Accounting for subgroup structure in line-transect abundance estimates of false killer whales (Pseudorca crassidens) in Hawaiian waters. PloS One 9 (2), e90464. doi: 10.1371/journal.pone.0090464
Carothers A. D. (1973). Capture-recapture methods applied to a population with known parameters. J. Anim. Ecol. 42 (1), 125–146. doi: 10.2307/3408
Gruden P., Nosal E.-M., Oleson E. (2021). Tracking time differences of arrivals of multiple sound sources in the presence of clutter and missed detections. J. Acoust. Soc. America 150 (5), 3399–3416. doi: 10.1121/10.0006780
Henderson E. E., Hildebrand J. A., Smith M. H., Falcone E. A. (2012). The behavioral context of common dolphin (Delphinus sp.) vocalizations. Mar. Mamm. Sci. 28 (3), 439–460. doi: 10.1111/j.1748-7692.2011.00498.x
Hildebrand J. A., Frasier K. E., Baumann-Pickering S., Wiggins S. M., Merkens K. P., Garrison L. P., et al. (2019). Assessing seasonality and density from passive acoustic monitoring of signals presumed to be from pygmy and dwarf sperm whales in the gulf of Mexico. Front. Mar. Sci. 6 (66), 1–17. doi: 10.3389/fmars.2019.00066
Madhusudhana S., Shiu Y., Klinck H., Fleishman E., Liu X., Nosal E.-M., et al. (2021). Improve automatic detection of animal call sequences with temporal context. J. R. Soc. Interface 18 (180), 20210297. doi: 10.1098/rsif.2021.0297
Martin M. J., Gridley T., Roux J. P., Elwen S. H. (2020). First abundance estimates of Heaviside’s (Cephalorhynchus heavisidii) and dusky (Lagenorhynchus obscurus) dolphins off Namibia using a novel visual and acoustic line transect survey. Front. Mar. Sci. 7, 1–20. doi: 10.3389/fmars.2020.555659
Martin S. W., Marques T. A., Thomas L., Morrissey R. P., Jarvis S., DiMarzio N., et al. (2013). Estimating minke whale (Balaenoptera acutorostrata) boing sound density using passive acoustic sensors. Mar. Mamm. Sci. 29 (1), 142–158. doi: 10.1111/j.1748-7692.2011.00561.x
McCullough J. L. K., Simonis A. E., Sakai T., Oleson E. M. (2021). Acoustic classification of false killer whales in the hawaiian islands based on comprehensive vocal repertoire. JASA Express Lett. 1 (7), 071201. doi: 10.1121/10.0005512
Moretti D., Marques T. A., Thomas L., DiMarzio N., Dilley A., Morrissey R., et al. (2010). A dive counting density estimation method for blainville’s beaked whale (Mesoplodon densirostris) using a bottom-mounted hydrophone field as applied to a mid-frequency active (MFA) sonar operation. Appl. Acoust. 71 (11), 1036–1042. doi: 10.1016/j.apacoust.2010.04.011
Murray S. O., Mercado E., Roitblat H. L. (1998). Characterizing the graded structure of false killer whale (Pseudorca crassidens) vocalizations. J. Acoust. Soc. America 104 (3), 1679–1688. doi: 10.1121/1.424380
NOAA Pacific Islands Fisheries Science Center. (2022). Hawaiian Islands cetacean and ecosystem assessment survey (HICEAS) towed array data. edited and annotated for the 9th international workshop on detection, classification, localization, and density estimation of marine mammals using passive acoustics (DCLDE 2022) (Honolulu, HI: NOAA National Centers for Environmental Information). Available at: https://www.soest.hawaii.edu/ore/dclde/dataset/.
Oleson E. M., Boggs C. H., Forney K. A., Hanson M. B., Kobayashi D. R., Taylor B. L., et al. (2010). Status review of Hawaiian insular false killer whales (Pseudorca crassidens) under the Endangered Species Act. US Department of Commerce. NOAA Technical Memorandum NMFS-PIFSC-22.
Oswald J. N., Rankin S., Barlow J., Lammers M. O. (2007). A tool for real-time acoustic species identification of delphinid whistles. J. Acoust. Soc. America 122 (1), 587–595. doi: 10.1121/1.2743157
Roch M. A., Baumann-Pickering S., Cholewiak D., Fleishman E., Frasier K. E., Glotin H., et al. (2018). The use of context in machine learning for bioacoustics. J. Acoust. Soc. America 144 (3), 1728–1728. doi: 10.1121/1.5067665
Thomas L., Marques T. A. (2012). Passive acoustic monitoring for estimating animal density. Acoust. Today 8 (3), 35–44. doi: 10.1121/1.4753915
Van Parijs S. M., Clark C. W., Sousa-Lima R. S., Parks S. E., Rankin S., Risch D., et al. (2009). Management and research applications of real-time and archival passive acoustic sensors over varying temporal and spatial scales. Mar. Ecol. Prog. Ser. 395, 21–36. doi: 10.3354/meps08123
Wilbur H. M., Landwehr J. M. (1974). The estimation of population size with equal and unequal risks of capture. Ecology 55 (6), 1339–1348. doi: 10.2307/1935461
Yano K. M., Oleson E. M., Keating J. L., Ballance L. T., Hill M. C., Bradford A. L., et al. (2018). Cetacean and seabird data collected during the Hawaiian Islands Cetacean and Ecosystem Assessment Survey (HICEAS), July-December 2017. U.S. Dept. of Commerce. NOAA Technical Memorandum NOAA-TM-NMFS-PIFSC-72, 110 p. doi: 10.25923/7avn-gw82
Keywords: acoustic behavior, false killer whales, echolocation clicks, whistles, towed hydrophone array, passive acoustics
Citation: Gruden P, Barkley YM and McCullough JLK (2023) Vocal behavior of false killer whale (Pseudorca crassidens) acoustic subgroups. Front. Mar. Sci. 10:1147670. doi: 10.3389/fmars.2023.1147670
Received: 19 January 2023; Accepted: 28 February 2023;
Published: 15 March 2023.
Edited by:
Lars Bejder, University of Hawaii at Manoa, United StatesReviewed by:
Aude Pacini, University of Hawaii at Manoa, United StatesCopyright © 2023 Gruden, Barkley and McCullough. This is an open-access article distributed under the terms of the Creative Commons Attribution License (CC BY). The use, distribution or reproduction in other forums is permitted, provided the original author(s) and the copyright owner(s) are credited and that the original publication in this journal is cited, in accordance with accepted academic practice. No use, distribution or reproduction is permitted which does not comply with these terms.
*Correspondence: Pina Gruden, cGdydWRlbkBoYXdhaWkuZWR1
Disclaimer: All claims expressed in this article are solely those of the authors and do not necessarily represent those of their affiliated organizations, or those of the publisher, the editors and the reviewers. Any product that may be evaluated in this article or claim that may be made by its manufacturer is not guaranteed or endorsed by the publisher.
Research integrity at Frontiers
Learn more about the work of our research integrity team to safeguard the quality of each article we publish.