 Julia Marchenko1*
 Vadim Khaitov2,3
 Marina Katolikova4
 Marat Sabirov5Sergey Malavenda6
 Michael Gantsevich7
 Larisa Basova4Evgeny Genelt-Yanovsky8
 Petr Strelkov1,9
- 1Department of Ichthyology and Hydrobiology, St. Petersburg State University, St. Petersburg, Russia
- 2Department of Invertebrate Zoology, St. Petersburg State University, St. Petersburg, Russia
- 3Kandalaksha State Nature Reserve, Kandalaksha, Russia
- 4Algology Laboratory, Murmansk Marine Biological Institute of The Russian Academy of Sciences, Murmansk, Russia
- 5Sechenov Institute of Evolutionary Physiology and Biochemistry of The Russian Academy of Sciences, St. Petersburg, Russia
- 6Department of Biology and Water Bioresources, Murmansk State Technical University, Murmansk, Russia
- 7Department of Invertebrate Zoology, Lomonosov Moscow State University, Moscow, Russia
- 8Laboratory of Evolutionary Genomics and Paleogenomics, Zoological Institute of The Russian Academy of Sciences, St. Petersburg, Russia
- 9Laboratory of Monitoring and Conservation of Natural Arctic Ecosystems, Murmansk Arctic State University, Murmansk, Russia
Subarctic populations of “cryptic” blue mussel species Mytilus edulis (ME) and M. trossulus (MT) are less studied than Arctic and boreal populations. Ecological features of ME and MT in sympatry are poorly known everywhere. We studied the habitat segregation of ME and MT and the interannual dynamics of their mixed settlements at the Murman coast of the Barents Sea, the northeastern boundary of the Atlantic littoral mussel communities. Previous data on mussels from this area are 50-100 years old. The 3-km-long Tyuva Inlet (Kola Bay) was used as the study site. Mussels were found in the littoral and the sublittoral down to a depth of 4 m. Their characteristic habitats were sandbanks, littoral rocks, sublittoral kelp forests and “the habitat of the mussel bed” in the freshened top of the inlet. The main spatial gradients explaining the variability of demographics of the settlements (abundance, age structure, size) were associated with the depth and the distance from the inlet top. ME and MT were partially segregated by depth: ME dominated in the sublittoral and MT, in the littoral. In addition, ME dominated throughout the mussel bed. The ratio of species in the mixed settlements varied over time: between 2004 and 2010 the proportions of MT decreased everywhere, by 22% on average. The habitat distribution of mussels apparently changed with time: we found that mussels were abundant in kelp forests, where they had rarely been observed in the 20th century. We suggest that the spatial and temporal dynamics of subarctic mussels can be partly explained by the competition between ME and MT and their differing sensitivity to environmental factors.
Introduction
Populations of blue mussels (Mytilus spp.) in the Arctic and the Antarctic have been extensively studied in recent decades, e.g. in the East Siberian Sea (Gagaev et al., 1994), Northeastern Alaska (Feder et al., 2003), Spitsbergen (Berge et al., 2005; Leopold et al., 2019; Kotwicki et al., 2021), the Pechora Sea (Sukhotin et al., 2008); Northwestern Greenland (Blicher et al., 2013; Thyrring et al., 2014) and in the South Shetland Islands (Cárdenas et al., 2020). A keen interest in these populations is due to the fact that they are pioneers in the poleward expansion of mussels under conditions of the warming climate. Blue mussels from temperate seas have always attracted much interest due to their ecological and economic importance (Gosling, 2021). Significant declines of their populations in some areas, e.g. the Gulf of Maine (Sorte et al., 2017) and the Atlantic coasts of Sweden (Baden et al., 2021) and France (Seuront et al., 2019), have recently been registered and mainly explained by climate change.
In contrast, recent studies of the subarctic populations of blue mussels are relatively scarce. The Subarctic is defined in this paper as the marine areas where the upper water layers are of mixed polar and non-polar origin (Dunbar, 1953). While the subarctic mussels are not entirely neglected, having been studied at the White Sea (Lukanin et al., 1986; Khaitov and Lentsman, 2016), in the northern Gulf of Alaska (Bodkin et al., 2018) and in the Sea of Okhotsk (Selin and Lysenko, 2006; Khalaman et al., 2020), they have clearly been overshadowed by the Arctic and the temperate ones.
Populations of the Barents Sea coast of the Kola Peninsula, known as the Murman Coast or Murman, at 68-70°N and 31-40°E (Figure 1), are a case in point. The Murman Coast is washed by a warm Atlantic Murman Coastal Current, owing to which sea surface temperatures (SST) are relatively high there (long-term SST is +10.2°C for August and +3°C for February in Ekaterininskaya Gavan in the Kola Bay; World Sea Temperatures, 2022) and the winter ice cover is limited. The Barents Sea is strongly affected by long- and short-term quasi-regular climate fluctuations, with the SST varying by several degrees Celsius on interannual and more than a degree on decadal time scales (Matishov et al., 2012; Ingvaldsen et al., 2021; Polar Branch of the FSBSI “VNIRO”, 2022). Murman is the northeasternmost border where typical littoral communities of the North Atlantic can be found, with their canopies of fucoids and barnacles and mussels on hard bottoms (Zatzepin et al., 1948; Genelt-Yanovskiy et al., 2018; Zenkevich, 1963 and references therein).
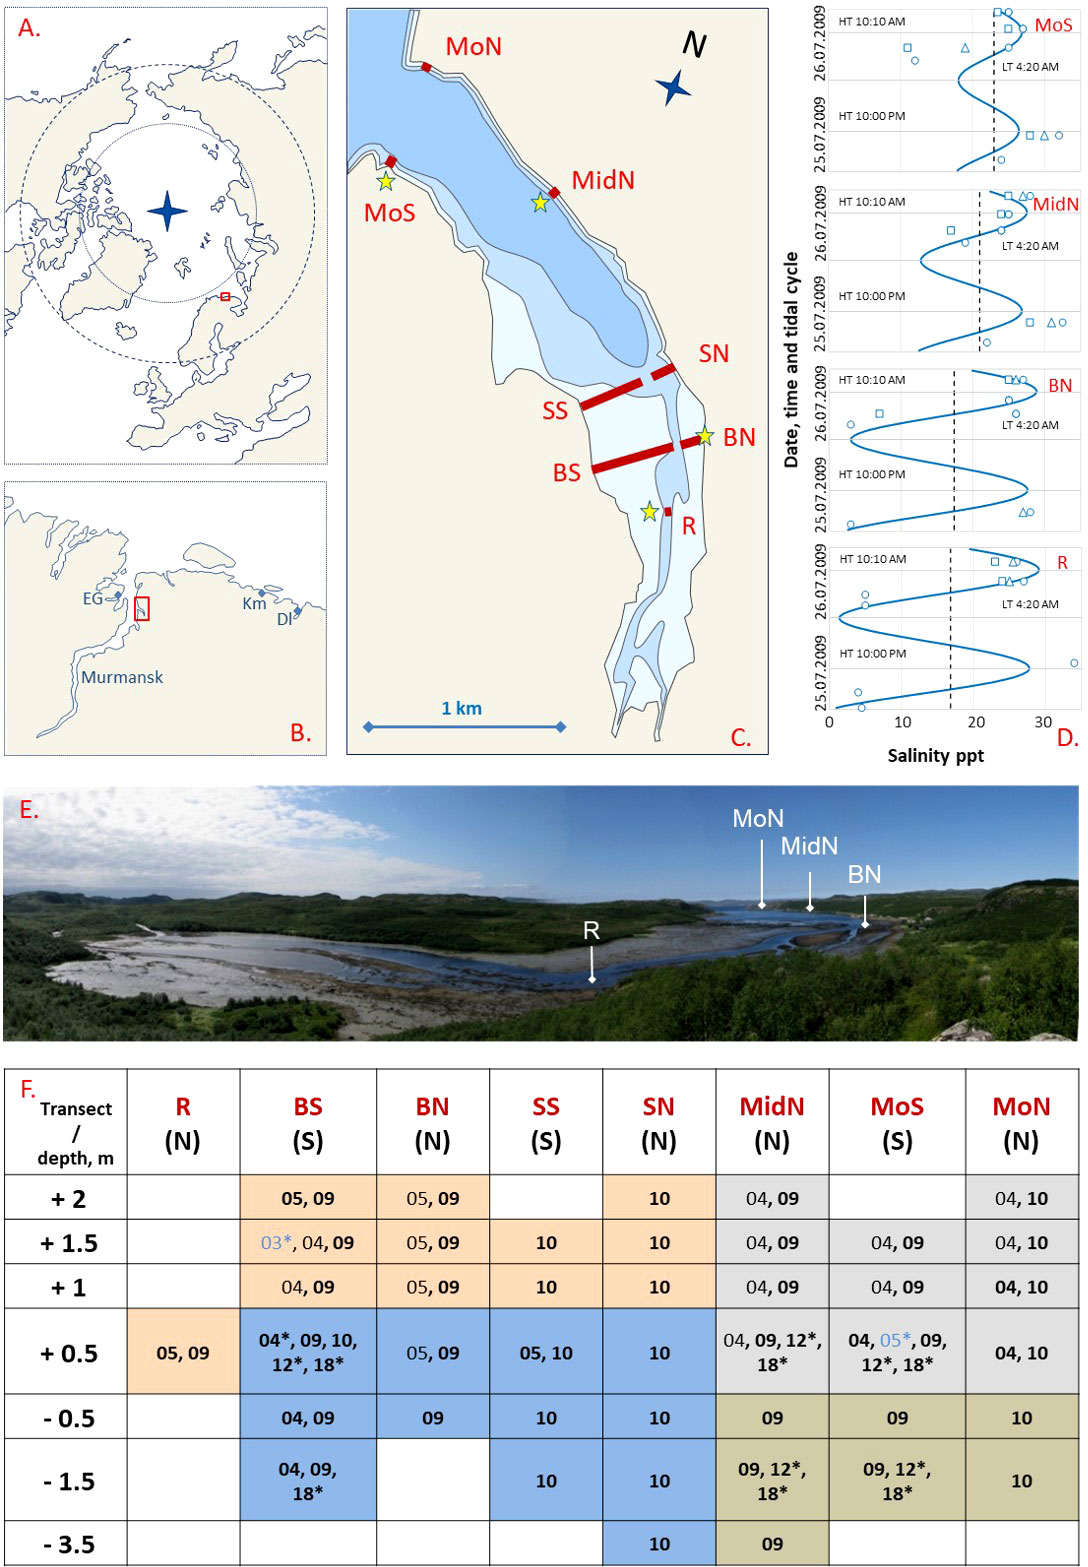
Figure 1 Tyuva Inlet and the mussel sampling scheme. (A) Polar view map of the Arctic Ocean. Box indicates the location of the Kola Bay. (B) Map of the Kola Bay and surroundings. The small box indicates the location of the Tyuva Inlet. EG, Ekaterininskaya Gavan Bight; Km, Klimkovka Inlet; Dl, Dolgaya Inlet. (C) Map of the Tyuva Inlet. The littoral, the sublittoral shallower than 10 m and the sublittoral deeper than 10 m are shown in different shades of blue. Red lines labeled by abbreviated names show sampling transects in 2003-2018. Asterisks indicate salinity sampling points. (D) Variation of salinity, ppt, in Tyuva surface waters on 25-26 July 2009. Blue curves show predicted salinity, dashed lines – average salinity, signs – empirical data (the shape reflects the depth of sampling: circles – surface, triangles and squares – depth of 1 and 2 m from the surface, respectively) in the four intertidal localities labeled as in c. LT – lowest tidal time, HT –highest (HT) tidal time. (E) Top of the Tyuva Inlet by low water on 21.07.2009. (F) Mussel surveys in the Tyuva Inlet in 2003-2018. Columns are transects, notations as in c, N – northern coast, S – southern coast. Lines are depth horizons from the chart datum. Numbers are years of studies (03 – 2003, 04 – 2004, etc.). Blue font and (or) asterisks indicate years of sampling for genetics, black font, for demography, and bold font, for taxonomic structure by morphotypes. Cell filling reflects mussel habitat: pink – littoral sandbanks, orange – sublittoral kelp forests, gray – rocky littoral, blue – habitat of the mussel bed.
Extensive descriptive studies of coastal macrobiotic organisms were conducted at Murman in the early 20th century, mostly at the former Murman Biological Station in Ekaterininskaya Gavan (Guryanova et al., 1928; Guryanova et al., 1929; Guryanova et al., 1930; Matveeva, 1948; Zatzepin et al., 1948; the publications of 1948 are based on the pre-World War II data). The authors of those studies noted that mussels were very conspicuous in the littoral but rare in the sublittoral, except in mussel beds in river mouths (Guryanova et al., 1926; Matveeva, 1948). A few studies conducted later indicated that mussel abundance decreased dramatically between 1960s and 1970s along the entire Murman coast and did not recover until 1980s (Antipova et al., 1984) or even late 1990s (Strelkov et al., 2001). This decrease was assumed to be associated with a prolonged period of low sea water temperatures that started in 1960 (Antipova et al., 1984).
To sum up, the knowledge of Murman mussel ecology is mainly based on the data that are 50-100 years old. In our opinion, there are at least three reasons to believe that this knowledge is outdated: environmental changes, modified sampling methods and taxonomic changes. To begin with, the first two decades of the 21st century were unprecedentedly warm in the Barents Sea (Marshall et al., 2016; Ingvaldsen et al., 2021; Polar Branch of the FSBSI “VNIRO”, 2022). If mussel abundance in the Barents Sea indeed positively depends on temperature (Antipova et al., 1984), we may expect a recovery after the supposed population decline in the 1960s. Secondly, the standards of data documentation and the sampling methods have changed. For instance, in earlier studies sublittoral mussels were sampled qualitatively by dredges, while today they are usually picked quantitatively by divers.
Last but not least, the knowledge of mussel ecology dating back to the 20th century is likely to be flawed because of the recent upheavals in mussel taxonomy. In the late 1980s, the Arctic-boreal mussel species Mytilus edulis was divided into M. edulis (hereinafter, ME) and M. trossulus (MT) based on genetic data (McDonald et al., 1991). In origin, ME and MT are vicarious species that have been evolving independently since the Pliocene in the Atlantic and the Pacific Ocean, respectively. MT invaded the Atlantic sector only in postglacial times (Laakkonen et al., 2020 and references therein). Today, ME and MT co-occur and hybridize in many areas of the Atlantic and the neighboring Arctic, including Murman. The hybrid zones between them are usually considered as stable, with hybrids being less fit than purebreds (Väinölä and Strelkov, 2011; Katolikova et al., 2016; Wenne et al., 2020). MT is less thermophilic: it does not spread as far south as ME in the Atlantic (Wenne et al., 2020 and references therein) and shows a poorer physiological performance at elevated temperatures (Rayssac et al., 2010; Fly and Hilbish, 2012; Bakhmet et al., 2022). ME and MT appear to play similar ecological roles in their native oceans, and their differences can only be assessed in sympatry (Riginos and Cunningham, 2004). Some such differences should be expected, since these species must inevitably compete for resources. However, little is known on this topic in general (see Riginos and Cunningham, 2004; Katolikova et al., 2016 for review), and nothing at all in the Barents Sea. This gap is partly due to the fact that ME and MT are “cryptic” species, with no diagnostic morphological features, and the genotyping methods traditionally used for their identification are laborious (Katolikova et al., 2016). It has recently been shown that ME and MT in the Murman populations differ by frequencies of shell morphotypes defined as absence or presence of an uninterrupted prismatic strip under the ligament on the inner side of the shell. In brackish localities (<30 ppt) the differences approach 65%, while in saline localities they make up only 18% (see Katolikova et al., 2016 and Khaitov et al., 2018 for illustrations of morphotypes). This means that in saline localities individual mussel assignment to one of the two species based on morphotypes is ineffective, but the proportions of the species in samples can be predicted based on the morphotype frequencies fairly accurately (Khaitov et al., 2021).
Here we present the results of a new study of the Murman mussels. It was driven by two compelling gaps: the lack of up-to-date data on mussels from this area and the scarcity of information about habitat preferences of ME and MT in sympatry. The Tyuva Inlet in the northeastern part of Kola Bay (Figures 1A, B) was chosen as a study site for the following reasons. (1) Morphologically and oceanographically, the Tyuva is a typical Murman small inlet, with a deep rocky entrance and a shallow sandy top freshened by the inflowing river (Derjugin, 1915). (2) The Tyuva is one of the few relatively undisturbed and accessible inlets in the Kola Bay. The Ekaterininskaya Gavan (8 km from the Tyuva directly across the Kola Bay, Figure 1B), where a biological station was formerly situated, has become a paramilitary zone. (3) It is suitable for studying ME and MT in sympatry, since both these species were recorded there by the geneticists (Väinölä and Strelkov, 2011). (4) In retrospect, our interest in Tyuva was kindled by reports of local residents about a large mussel bed there, supposedly the largest in the entire Kola Bay. Using abundant material from the Tyuva (259 quantitative samples from 43 mussel settlements) accumulated in 2004-2018, we could describe the relationships between the taxonomic structure and the basic demographic characteristics (abundance, age structure, size at certain age) of the settlements on the one hand and the key environmental factors, as well as time, on the other hand.
Materials and methods
Tyuva Inlet
The Tyuva Inlet is 3 km long and 0.7 km wide at its widest. The shores of its outer part are steep, the littoral zone is narrow, and the dominant bottoms are formed by pebbles and rocks. Fucoid algae are abundant on the littoral. The shores become more gentle towards the inlet top. The inner part of the inlet is shallow, with unconsolidated bottoms and broad (up to 450 m) sandbanks. Fucoids are more scarce there. The river with an annual runoff of about 0.7 km3 flows across the shoals. The tidal amplitude in this area of the Kola Bay is 1.1-3.7 m, surface salinity at a distance from the river mouths is 31-32 ppt, and ice conditions are fast ice in cold winters (Morozov, 1901; Derjugin, 1915; Guryanova et al., 1929; Mityaev, 2014; Shavykin, 2018; Figures 1C, E).
Mussel sampling and processing
Mussels were studied in six different years: 2004, 2005, 2009, 2010 (in July), 2012 (in September), and 2018 (in July). The samples were collected at a low tide to accurately predict the depth based on the tidal data for the Ekaterininskaya Gavan. Quantitative samples, 1-18 per sampling locality, were taken randomly by a core of 0.01-0.25 m-2 (mean number of mussels per sampling locality was 1-3124, and global mean - 162). Qualitative samples for genetics were taken at the chosen localities in different years. A complete description of the sampling design is presented in Figure 1F and Supplementary Table 1. The community of mussels inhabiting a particular locality is referred to as a “settlement” in this text.
In 2004-2005 the distribution of mussels was mapped: i) by on-shore observations at the tidal zone along the entire inlet; ii) by SCUBA divers in the subtidal zone in the inner part of the inlet where a large littoral-sublittoral mussel bed (hereinafter, the Bed) was located. Twenty-three mussel settlements were sampled from different depths in three visually identified characteristic habitats: rocky littoral, littoral sandbanks and the “habitat of the Bed”, defined as a broad area of the seabed with a dense settlement of predominantly large mussels, enriched with black sulfuric silt usually accumulated in mussel beds (Supplementary Table 1; photos of habitats are provided in the Supplementary Figure 1).
In 2009-2010, in addition to the three types of habitats defined above, mussels settlements in subtidal kelp forests represented by Alaria esculenta, Saccharina latissima and Laminaria digitata were found by SCUBA diving at 0-4 m depth in the outer part of the inlet. Sampling was performed along seven transects oriented perpendicularly to the coastline at seven depths: +2, +1.5, +1, +0.5, -0.5, -1, -1.5 m (in relation to chart datum, negative values denote sublittoral position; the range was chosen to cover all the depths inhabited by mussels). Mussels were also sampled from the last upriver littoral settlement, designated as R+05 (Figures 1C, F). The choice of transects and the sampling depth reflected the need i) to replicate the sampling design from 2004-2005 and ii) to account for the diversity of mussel habitats. In total 43 settlements were sampled (Figure 1F and Supplementary Table 1).
In 2012 and 2018 five and six settlements were resampled, respectively. In 2018 additional qualitative samples were obtained from the same settlements for genetic analysis (Figure 1F and Supplementary Table 1).
Mussels from each sample were counted and weighed. The maximal anterior-to-posterior length of each mussel (hereinafter, “shell length”) was measured using calipers or dissecting microscope micrometer with a precision up to 0.1 mm. Age of mussels was assessed by counting marks of winter growth delays on shells as in Sukhotin et al., 2007. For mussels aged 4-7 years the shell morphotypes (E-morphotype, more characteristic of ME, or T-morphotype, more characteristic of MT) were determined as in Khaitov et al., 2021. Only medium-aged mussels were used in the taxonomic analysis in order to avoid the bias due to a possible association between size and morphotypes in conspecific mussels (see Khaitov et al., 2021 for details).
Environmental parameters assessment
Every mussel settlement was characterized by the following environmental parameters: Depth – height/depth from chart datum, m; Bottom – prevailing ground type (boulders, rocks or sand); Kelp – presence/absence of kelps; Cov – cover abundance of macrophytes by visual observations rated on a rank scale (1 – <5%, 2 – 5-25%, 3 – 25-50%, 4 – 50-75%, 5 – >75% cover); Slope – the degree of bottom slope at the sampling point estimated as the slope value for the tangent at that point on the transect profile. We also considered transect-specific characteristics (the same for all localities along the transect): Dist – distance (by the midline of the inlet) between the transect and the settlement closest to the river mouth (R+0.5), m; Width – distance from the uppermost to the deepest sampling localities within the same transect, m (roughly proportional to the width of the mussel belt on a given stretch of shore) and Exp – shore exposure (north or south). These parameters are related to factors considered as the most important for mussels (Seed and Suchanek, 1992; Barbosa et al., 2022). Depth, Bottom, Kelp and Cov were assessed in parallel with mussel sampling in 2009-2010. Dist and Width were taken from the map. Slope was calculated from vertical transect profiles reconstructed by depths and geographical coordinates of the sampling localities.
Salinity was monitored on 25 and 26 July 2009 at sampling localities R+0.5, BN+05, MidN+05 and MoS+05 situated in different parts of the inlet (Figure 1C). Water samples (52 in total) were taken repeatedly at different phases of the tidal cycle (tide range was 0.2-3.8 m above chart datum), with a bathometer, at the surface and at depths 2 m and 1 m from the surface. Salinity was measured with a refractometer S/Mill-E, Atago, Japan with an accuracy of 1 ppt. To predict salinity at each of four littoral sites, we constructed a linear model (see below), with salinity as the dependent variable and tidal height (H) at the time of sampling, according to the tide table for Ekaterininskaya Gavan, and Dist, as predictors. After building the model, we predicted salinity throughout the tide cycle for each site.
Demographic and taxonomic parameters of mussel settlements
The following characteristics of mussel settlements describing mussel abundance, age structure and size were considered: B – biomass, g*m-2, N – total density, ind*m-2, N2-3, N4-6, N7-9, N10 – densities, ind*m-2, of mussels 2-3, 4-6, 7-9 and over 9 years old, respectively, Lmax – length of the largest mussel, L5 – mean length of mussel at the age of five years (the oldest age class present in most of the samples), GI – mussel size at age index, Ptros – proportion of M. trossulus predicted by frequency of T-morphotypes (see Prediction of taxonomic structure by morphotypes section below). The density of one-year-old mussels was ignored (though it was considered in the calculation of N) because of their patchy distribution, which is difficult to account for in a limited sample. , where L∞ and K – parameters of the von Bertalanffy equation calculated from the average values of the shell lengths of animals of different ages over 2 years old. GI is used here as an indirect measure of mussel growth conditions in settlements. A similar individual-based index known as Overall Growth Performance (OGP) is used in ecophysiology to account for the rate of the organism’s size increase during the lifetime (Brey, 2001 and references therein).
Pooled samples from individual settlements were used for calculations of Lmax, Ptros and GI. Averaged data on multiple samples from individual settlements were used for calculations of the other characteristics.
Statistical analyses
All statistical analyses were performed with functions of R statistical programming language (R Core Team, 2021). Multidimensional analyses (CA, CCA, PERMANOVA, SIMPER) were performed by “vegan” package (Oksanen et al., 2020), regression analysis was performed by “glmmTMB” (Brooks et al., 2017) and “mgcv” (Wood, 2010) packages. In all analyses where permutational procedures were implemented, 9999 permutations were set up.
Prediction of taxonomic structure by morphotypes
Khaitov et al., 2021 provided formulas to predict the proportion of MT (Ptros) based on the proportion of T-morphotypes (PT) in samples from brackish (<30 ppt) and saline (≥30 ppt) habitats. The salinity boundary between brackish and saline habitats was chosen conventionally, and six samples from the Tyuva used in that study were treated as being from saline habitats. Since mussels in the Tyuva Inlet experience very variable salinity, and the habitat could not be defined as either brackish or saline (Figure 1D and below), we clarified the relationship between Ptros and PT for local settlements. For this, we used 15 genotyped samples from the Tyuva Inlet (sample size 30-82 individuals, mean 44, Supplementary Table 1), including nine from the published studies (Bufalova et al., 2005; Väinölä and Strelkov, 2011; Khaitov et al., 2021), stored in collections of the Department of Ichthyology and Hydrobiology (St. Petersburg State University), and six new samples collected in 2018 (Figure 1F and Supplementary Table 1). New samples were genotyped by the same set of allozyme loci “diagnostic” for the two species (Est-D, Gpi and Pgm) as in the studies listed above. Multilocus genotypes were classified into two categories, those dominated by ME genes and those dominated by MT genes, using Structure approach (Pritchard et al., 2000) as in Khaitov et al., 2021. For ease of presentation, these categories will be referred to as “M. trossulus” (MT) and “M. edulis” (ME) although each could include hybrids in addition to purebreds (Khaitov et al., 2021). To note, hybrids between ME and MT are rare in the Kola Bay: 5-15% by different estimations (Wenne et al., 2020; Khaitov et al., 2021; Simon et al., 2021). The age of mussels was identified and only mussels aged 4-7 years were used in the analysis. Empirical relationships between PT and Ptros within the three Barents Sea sample sets (15 samples from the Tyuva, 8 samples from saline localities excluding Tyuva and 12 samples from brackish localities from Khaitov et al., 2021) were derived using a regression approach as in Khaitov et al., 2021. In the logistic regression model based on binomial distribution (logit link-function) Ptros was considered as a dependent variable, while PT and sample set were considered as predictors. Interaction between the predictors was also included in the model.
Analysis of population and taxonomic structuring of the Tyuva mussels in 2009-2010
To evaluate the population and taxonomic structuring of the Tyuva mussels and to describe how taxonomic structure and demographic characteristics of the settlements were related to the key environmental parameters we used the most representative data from 2009-2010. Associations between all demographic, taxonomic and environmental parameters (except salinity) were quantified with the help of canonical correspondence analysis (CCA, ter Braak and Verdonschot, 1995). Associations between Ptros and environmental parameters were also analyzed separately using regression analysis. To compare groups of settlements from different habitats (rocky littoral, sandbanks, kelp forests and the Bed) by demographic parameters and Ptros, Permutation Multivariate Analysis of Variance (PERMANOVA, Anderson, 2014) was used.
In the CCA analysis, the matrix of dependent variables contained Ptros and all demographic parameters, while the constraints matrix contained all environmental parameters. An optimal CCA model was constructed with the use of forward selection protocol (Blanchet et al., 2008). The statistical significance of the optimal model, individual canonical axes and constraints was assessed by permutation methods (Legendre and Legendre, 2012).
In the regression analysis, a generalized linear mixed model (GLMM) with beta distribution and a logit link-function was used, where Ptros was the dependent variable, and environmental parameters were predictors (the values of quantitative environmental parameters were standardized). The transect was included into the model as a random factor influencing the model intercept. Before fitting the model, the set of all predictors was checked for collinearity by calculating the variance inflation factors (vif) (Fox, 2015). If vif exceeded 2, the predictor was excluded. The validity of the final model was inspected by visual analysis of residual plots and the assessment of the presence of overdispersion. Since the test statistic estimated by GLMM corresponds to the Chi-square distribution only approximately (Zuur et al., 2009), we considered p-values less than 0.01 to be significant.
Data preparation for PERMANOVA was as follows. The matrix of dependent variables (the same as in CCA) was transformed (log(x+1)), the Bray-Curtis dissimilarity matrix was calculated and the equality of within-group variance was checked. PERMANOVA was followed by pairwise comparisons of groups. For these multiple comparisons the p-values were adjusted with a Bonferroni correction.
Temporal dynamics of the Tyuva mussels in 2004-2018
The choice of strategy for analyzing temporal dynamics was associated with the heterogeneous structure of the data from different study periods. All of the 23 settlements surveyed in 2004-05 were also surveyed in 2009-10, but there were no settlements from kelp forest among them, and only nine settlements were characterized by Ptros in 2004-05. Out of the five settlements studied in 2012, all the five were studied in 2009-10 and 2018 but only three were studied in 2004-09. Only three settlements were examined in all the four study periods, among them BS+05 (littoral part of the Bed), which was examined in 2005, 2009, 2010, 2012, 2018 (Figure 1F). In one set of the analyses aimed at identifying trends over the entire observation period, we assumed that the settlements were randomly selected for the study in different years. In another set of analyses, aimed at examining the changes between 2004-05 and 2009-10, we compared only the overlapping sets of the samples.
To assess the variability of mussel demography in the entire material, we applied Correspondence Analysis (CA) based on the matrix of all demographic parameters. The scores of the first CA axis (CA1), which explained the bulk of the total inertia (see Results), were treated as a generalized characteristic of the demographic structure of the settlements. To analyze temporal changes, the scores were used as the dependent variable in the generalized additive regression model (GAM, normal distribution) with Year and Habitat as predictors. The smoothers for each habitat were fitted separately and the Habitat was treated as a random effect (Type I model in Pedersen et al., 2019). Temporal dynamics of Ptros was studied separately using a similar approach. The structure of the fitted model was the same but the beta-distribution for the dependent variable was chosen for the GAM construction.
To find out whether the demography of mussel settlements in general and in three different habitats (rocky littoral, sandbanks, the Bed) in particular changed in a unidirectional way between 2004-05 and 2009-10: we analyzed the data on 20 settlements sampled in both periods (three settlements lacking GI and L5 in 2004 were excluded) using PERMANOVA with two factors, Habitat (three levels: rocky littoral, sandbank, bottom) and Period (two levels), and the interaction between them. A similarity percentages (SIMPER) analysis (Clarke, 1993) was further performed to estimate the contribution of each demographic parameter into the formation of differences between the two temporal periods. Data preparation and assumption testing for PERMANOVA and SIMPER were identical and the same as described above. We also compared overlapping sets of samples from two periods for Ptros and selected demographic parameters, including numbers of mussels aged 4-7 years (Ptros were calculated for mussels in this age group) using the Wilcoxon signed-rank test.
Historical data on the Tyuva mussels
We compared our data with the historical data from the 20th century studies. Quantitative data have been obtained in VNIRO (Research Institute of Fisheries and Oceanography) monitoring surveys of commercial bivalves in 1960, 1961 and 1971 (Romanova, 1969; Antipova et al., 1984; see Supplementary Table 2 for the summary). Each time, mussel biomass was estimated on a single vertical transect throughout the littoral. In parallel, divers looked for commercial bivalves in the sublittoral.
To test our conclusions about long-term changes in the Tyuva populations (see Results), we included into the temporal comparison our unpublished data on mussels from two other VNIRO survey sites, Klimkovka and Dolgaya Inlets (Figure 1B). Mussels have been studied there in the same way as the Tyuva mussels in 1961 and 1971 (Romanova, 1969; Antipova et al., 1984). In 2009, we characterized the mussels of each of these inlets using numerous samples collected at different depths along three littoral-sublittoral vertical transects in different parts of the inlet (Supplementary Table 2). To compare the data collected in Tyuva, Klimkovka, and Dolgaya in 1960-1961, 1971, and 2009 we applied one-way ANOVA with Period as a factor with three levels followed by post-hoc comparison of means by Tukey test.
Purely qualitative studies made in the 1920s (Guryanova et al., 1928; Guryanova et al., 1929) also provide some valuable information for our research. These authors described the littoral of Ekaterininskaya Gavan Bight and the surrounding area, including the Tuyva, noting, in particular, characteristic mussel habitats (see Supplementary Table 2 for the summary of their data).
Results
Prediction of taxonomic composition by morphotypes
Proportion of M. trossulus genotypes (empirical Ptros) in genotyped samples from the Tyuva ranged from 0.06 to 0.90, i.e., from almost pure ME to almost pure MT. The proportion of T-morphotypes (PT) in the same samples ranged from 0.08 to 0.98. The relationship between the two indices was close to proportionality (Figure 2). Parameters of regression models describing the dependence of empirical Ptros on PT and Dataset (i.e. sets of samples from the Tyuva, from brackish and saline habitats in the Barents Sea) are given in Supplementary Table 3. The empirical data from the Tyuva generally agreed well with the model predictions, but some samples apparently had too low or too high Ptros at a given PT, which may be partly due to the small sample size. The regression line corresponding to the Tyuva lay between the lines corresponding to the other two sample sets but closer to the saline habitats (Figure 2 insert).
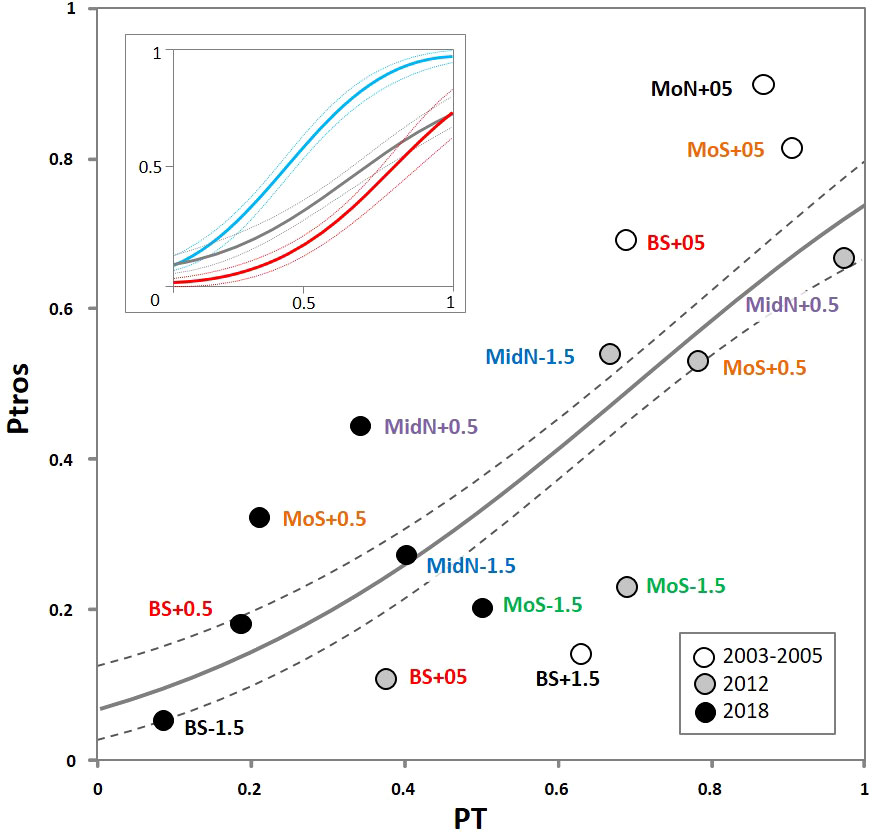
Figure 2 Dependence of proportion of M. trossulus genotypes (Ptros) on proportion of T-morphotypes (PT) in samples from the Tyuva Inlet. Dots are empirical estimates, color reflects time period of sampling (see legend). Sampling localities are labeled as in Figure 1F, repeated samples from the same localities are highlighted in font color. Solid line is regression model predictions, dashed lines are boundaries of 95% confidence interval of regression. The same regression is shown in the insert together with the corresponding regressions for samples from brackish (<30 ppt; blue) and saline (>30 ppt; red line) localities in the Barents Sea from the study of Khaitov et al., 2021.
Since the genotyped collections from the Tyuva included samples taken from the same settlements at various time points, we give the first idea of the scale and direction of Ptros temporal dynamics in Figure 2. In general, the proportion of MT decreased with time. For example, Ptros in BS+05 (the littoral part of the Bed) was 0.69 in 2004 and 0.11 in 2018, while Ptros in MoS+05 (rocky littoral) was 0.81 in 2005 and 0.33 in 2018. The differences between the collections made at the same time points from different depths are also noteworthy: Ptros was always higher in the littoral than in the sublittoral (by 12-30%, on average by 16%).
Tyuva mussels and their environment in 2009-2010
Salinity at sampling sites varied broadly during the tidal cycle, especially in the upper part of the inlet (4-34 ppt, with minimal values at low tide). According to the fitted model (Supplementary Table 4), the predicted salinity increased with the distance from the river and was on average 16 ppt at the top of the inlet and 23 ppt at its entrance (Figure 1C). The amplitude of predicted salinity fluctuations during the tidal cycle was maximal at the top (1-29 ppt at R+05) and minimal at the entrance (18-27 ppt at MoN).
The other environmental parameters of the sampling localities are provided in Supplementary Table 1. Their variation generally corresponded to the literature data and visual observations (see Materials and Methods): the transects at the top of the inlet were wide, because the shore was gently sloping, especially in the south, and sandy. The transects at the mouth and in the middle of the inlet were narrow, because the shore was steep, rocky, and abundantly overgrown with fucoids on the littoral and kelps in the sublittoral (Figure 3).
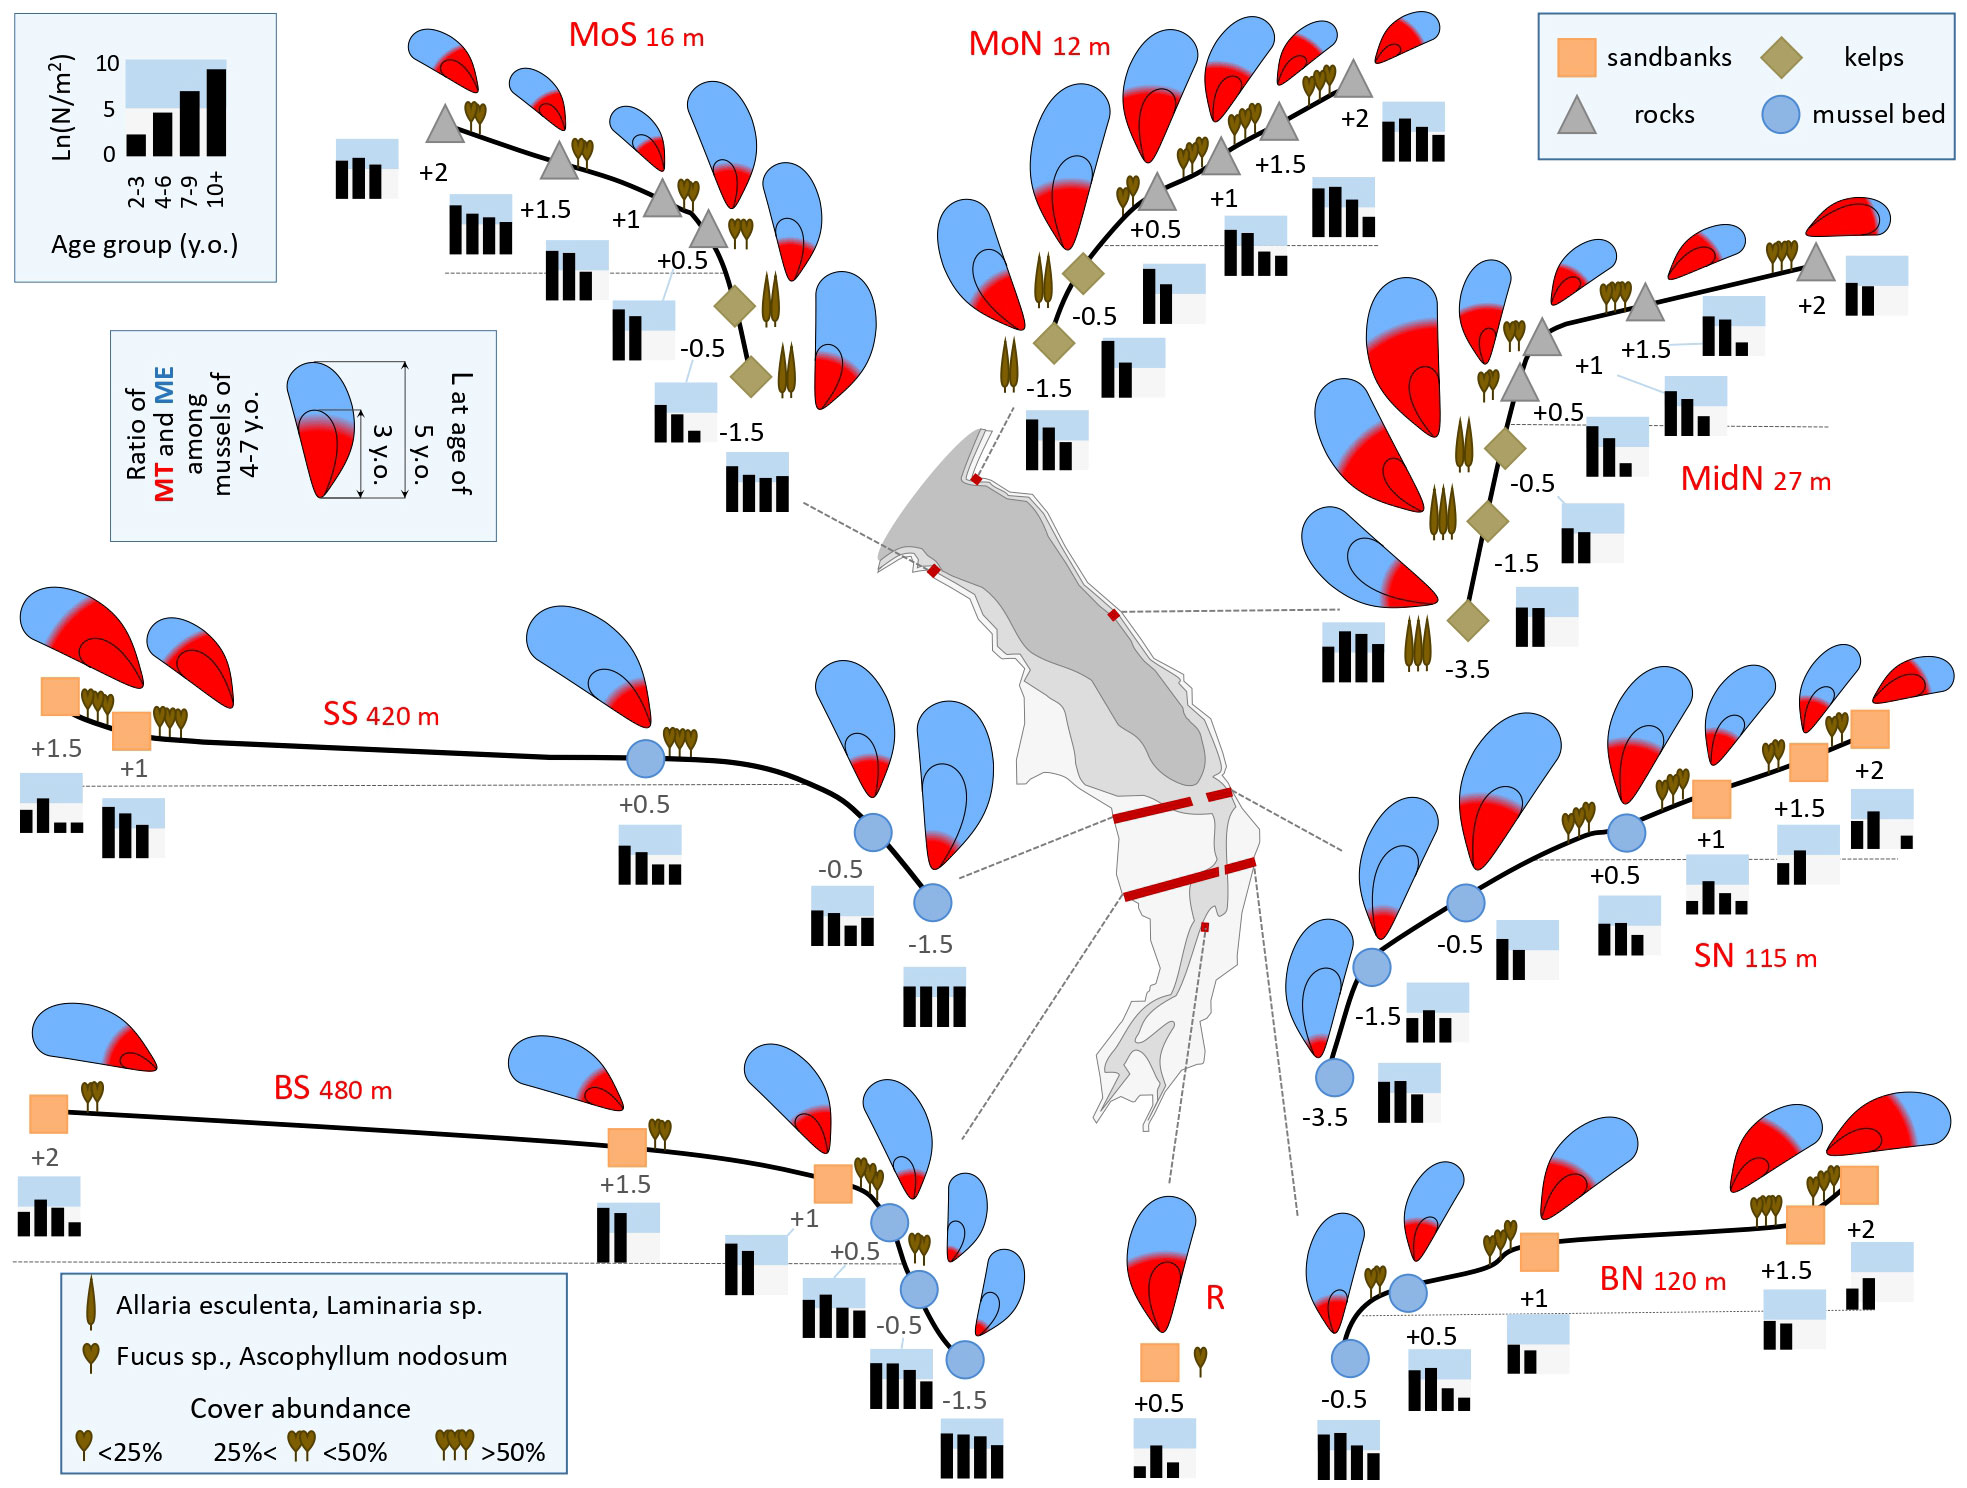
Figure 3 Characteristics of mussel settlements in the Tyuva Inlet in 2009-2010. Schematic profiles of the transects are given (the width of different transects is given on a different scale). The transect width is specified. Dots denote studied settlements, depths in meters from the chart datum are indicated. The color of the dots reflects the habitat (see legend). The icons showing algae represent the dominant algal species and their cover abundance (see legend). The size of mussels in the pictograms is proportional to the average size of five-year-old mussels, the “annual ring” is proportional to the average size at the age of three years, while the color filling is proportional to the ratio of MT (red) and ME (blue) among mussels aged 4-7 years. Histograms show age structures, the logarithms of the average density of mussels of different age groups per m-2 are given (see legend). Other notations are as in Figure 1C.
Demographic parameters varied broadly between settlements, e.g. N from a few tens to tens of thousands ind*m-2, B from tens of grams to as much as ten kilograms m-2, L5 from 17 to 38 mm. The largest mussel found was 87 mm long. Predicted Ptros varied from 0.10 to 0.73 (Supplementary Table 1). The patterns of spatial variation of Ptros and some demographic characteristics can be deduced from Figure 3. In terms of the total abundance, the greatest differences were registered between very sparse settlements on the sandbanks and dense settlements elsewhere. In terms of the age structure, the differences between the transects through rocky littoral and kelp forests (MoN, MoS, and MidN), where juveniles were dominating, and the transects in the upper part of the inlet, where there were few juveniles, are noteworthy. The average size of mussels of the same age increased consistently with the depth along all transects, except those through the densest part of the Bed (BS, BN), where an opposite trend was observed. Predicted Ptros generally decreased with the depth, but there were two striking deviations from this general pattern. Firstly, an anomalously high Ptros was recorded at MoN-0.5 and MidN-0.5. Secondly, Ptros was low throughout the Bed: noticeably lower than on the sandbanks and at the same-depth horizons of the other transects (Figure 3).
CCA was used for an analysis of associations between all environmental, demographic and taxonomic parameters (Figure 4). Out of the eight initially considered environmental parameters, only three were included in the optimal CCA model: Depth, Dist and Slope. The influence of Dist and Depth on the ordination was significant while that of Slope was not (Supplementary Table 5). Two first canonical axes were statistically significant, explaining 41.1% of the total inertia. CCA1 showed a high positive correlation with Dist. Depth and Slope were more associated with CCA2; positive values of CCA2 correspond to the littoral zone. Among the demographic parameters associated with CCA1, N and N2-3 showed a positive association, whereas B, N4-6, N7-9, N10, GI, L5, Lmax showed a negative association (Figure 4). This means that mussels, especially young ones, were more numerous in the settlements of the outer part of the inlet compared to those of its inner part, but also that mussels in the former settlements were slow-growing and their total biomass was not large. Ptros demonstrated the highest positive correlation with CCA2: that is, the proportion of MT on the littoral was higher than in the sublittoral. Notably, the parameters of size (GI, L5, and Lmax) also tended to be positively related to CCA2. Considering that these parameters were negatively related to CCA1, mussels on the broad sandbanks in the top of the Tyuva Inlet were relatively larger (Figure 4). Settlements from different habitats showed a tendency to nonrandom ordination in CCA. Settlements of sandbanks (upper left quadrant of triplot, high Ptros, low N, deficit of juveniles, large mussel sizes) were particularly distant from the others.
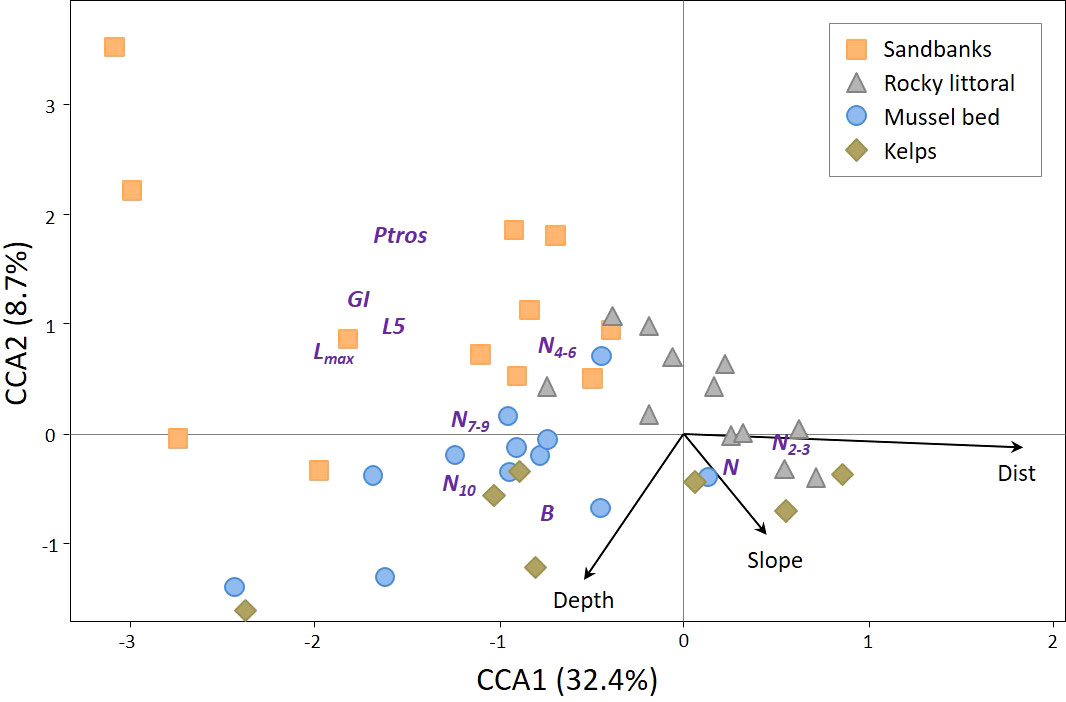
Figure 4 Canonical symmetrical correspondence analysis (CCA) ordination of mussel settlements by demographic and taxonomic parameters in 2009-2010. Each point represents a mussel settlement; settlements from kelp forests, rocky littoral, sandbanks, and mussel bed are shown with points of different form and color (see legend). Text markers represent demographic and taxonomic parameters. Arrows indicate environmental constraints. Abbreviated names of environmental and population parameters are explained in Materials and Methods.
PERMANOVA followed by pairwise comparisons of settlements from different habitats revealed that the settlements of sandbanks differed strongly from all the others and that the differences between the mussel bed and the rocky littoral were marginally significant after correction for multiple testing (uncorrected p=0.02, Supplementary Table 6).
Analysis of associations between Ptros and environmental predictors using GLMM (Supplementary Table 7) showed that only two variables significantly influenced the taxonomic structure of the settlements: Depth (the greater the depth, the lower the Ptros) and Exp (Ptros was higher on the north coast).
Temporal changes in the Tyuva settlements in 2004-2018
The first and the second axes of the CA based on the matrix of demographic parameters in all the material studied (Figure 5A) explained 57.2% and 20.8% of the total inertia, respectively. The same set of parameters was associated in a similar manner with CA1 and CCA1 in a separate analysis of 2009-10 data, but the ordination of samples from different habitats along CA1 and CCA1 was different (compare Figures 4, 5A). The reason behind the differences is the large-scale temporal dynamics, which can be inferred from Figure 5A, where samples from different time periods are highlighted, and from the results of the GAM regression analysis. It is striking that all the 2004-2005 samples (highlighted in black) in the figure are centered further to the left than most samples from other periods. The differences in the ordination of 2009-10, 2012, and 2018 samples are less prominent. According to GAM, over the entire observation period, there were significant changes in CA1 scores toward larger values (i.e., primarily a decrease in the number of adults and an increase in the number of juveniles) in the settlements from littoral rocks and from the Bed (Supplementary Table 8; Supplementary Figure 2). The arrows in Figure 5A show changes in BS+05 (littoral part of the Bed): the samples moved from left to right throughout the 13-year-long study period. These changes actually reflect a gradual “degradation” of the littoral part of the Bed as a dense settlement dominated by old mussels. Judging from visual observations, the change started already in 2010 but affected BS+05 somewhat later. By 2018, the littoral part of the Bed had completely disappeared (see Supplementary Figure 3 for age frequency distributions in BS+05 and photos of the Bed in different years).
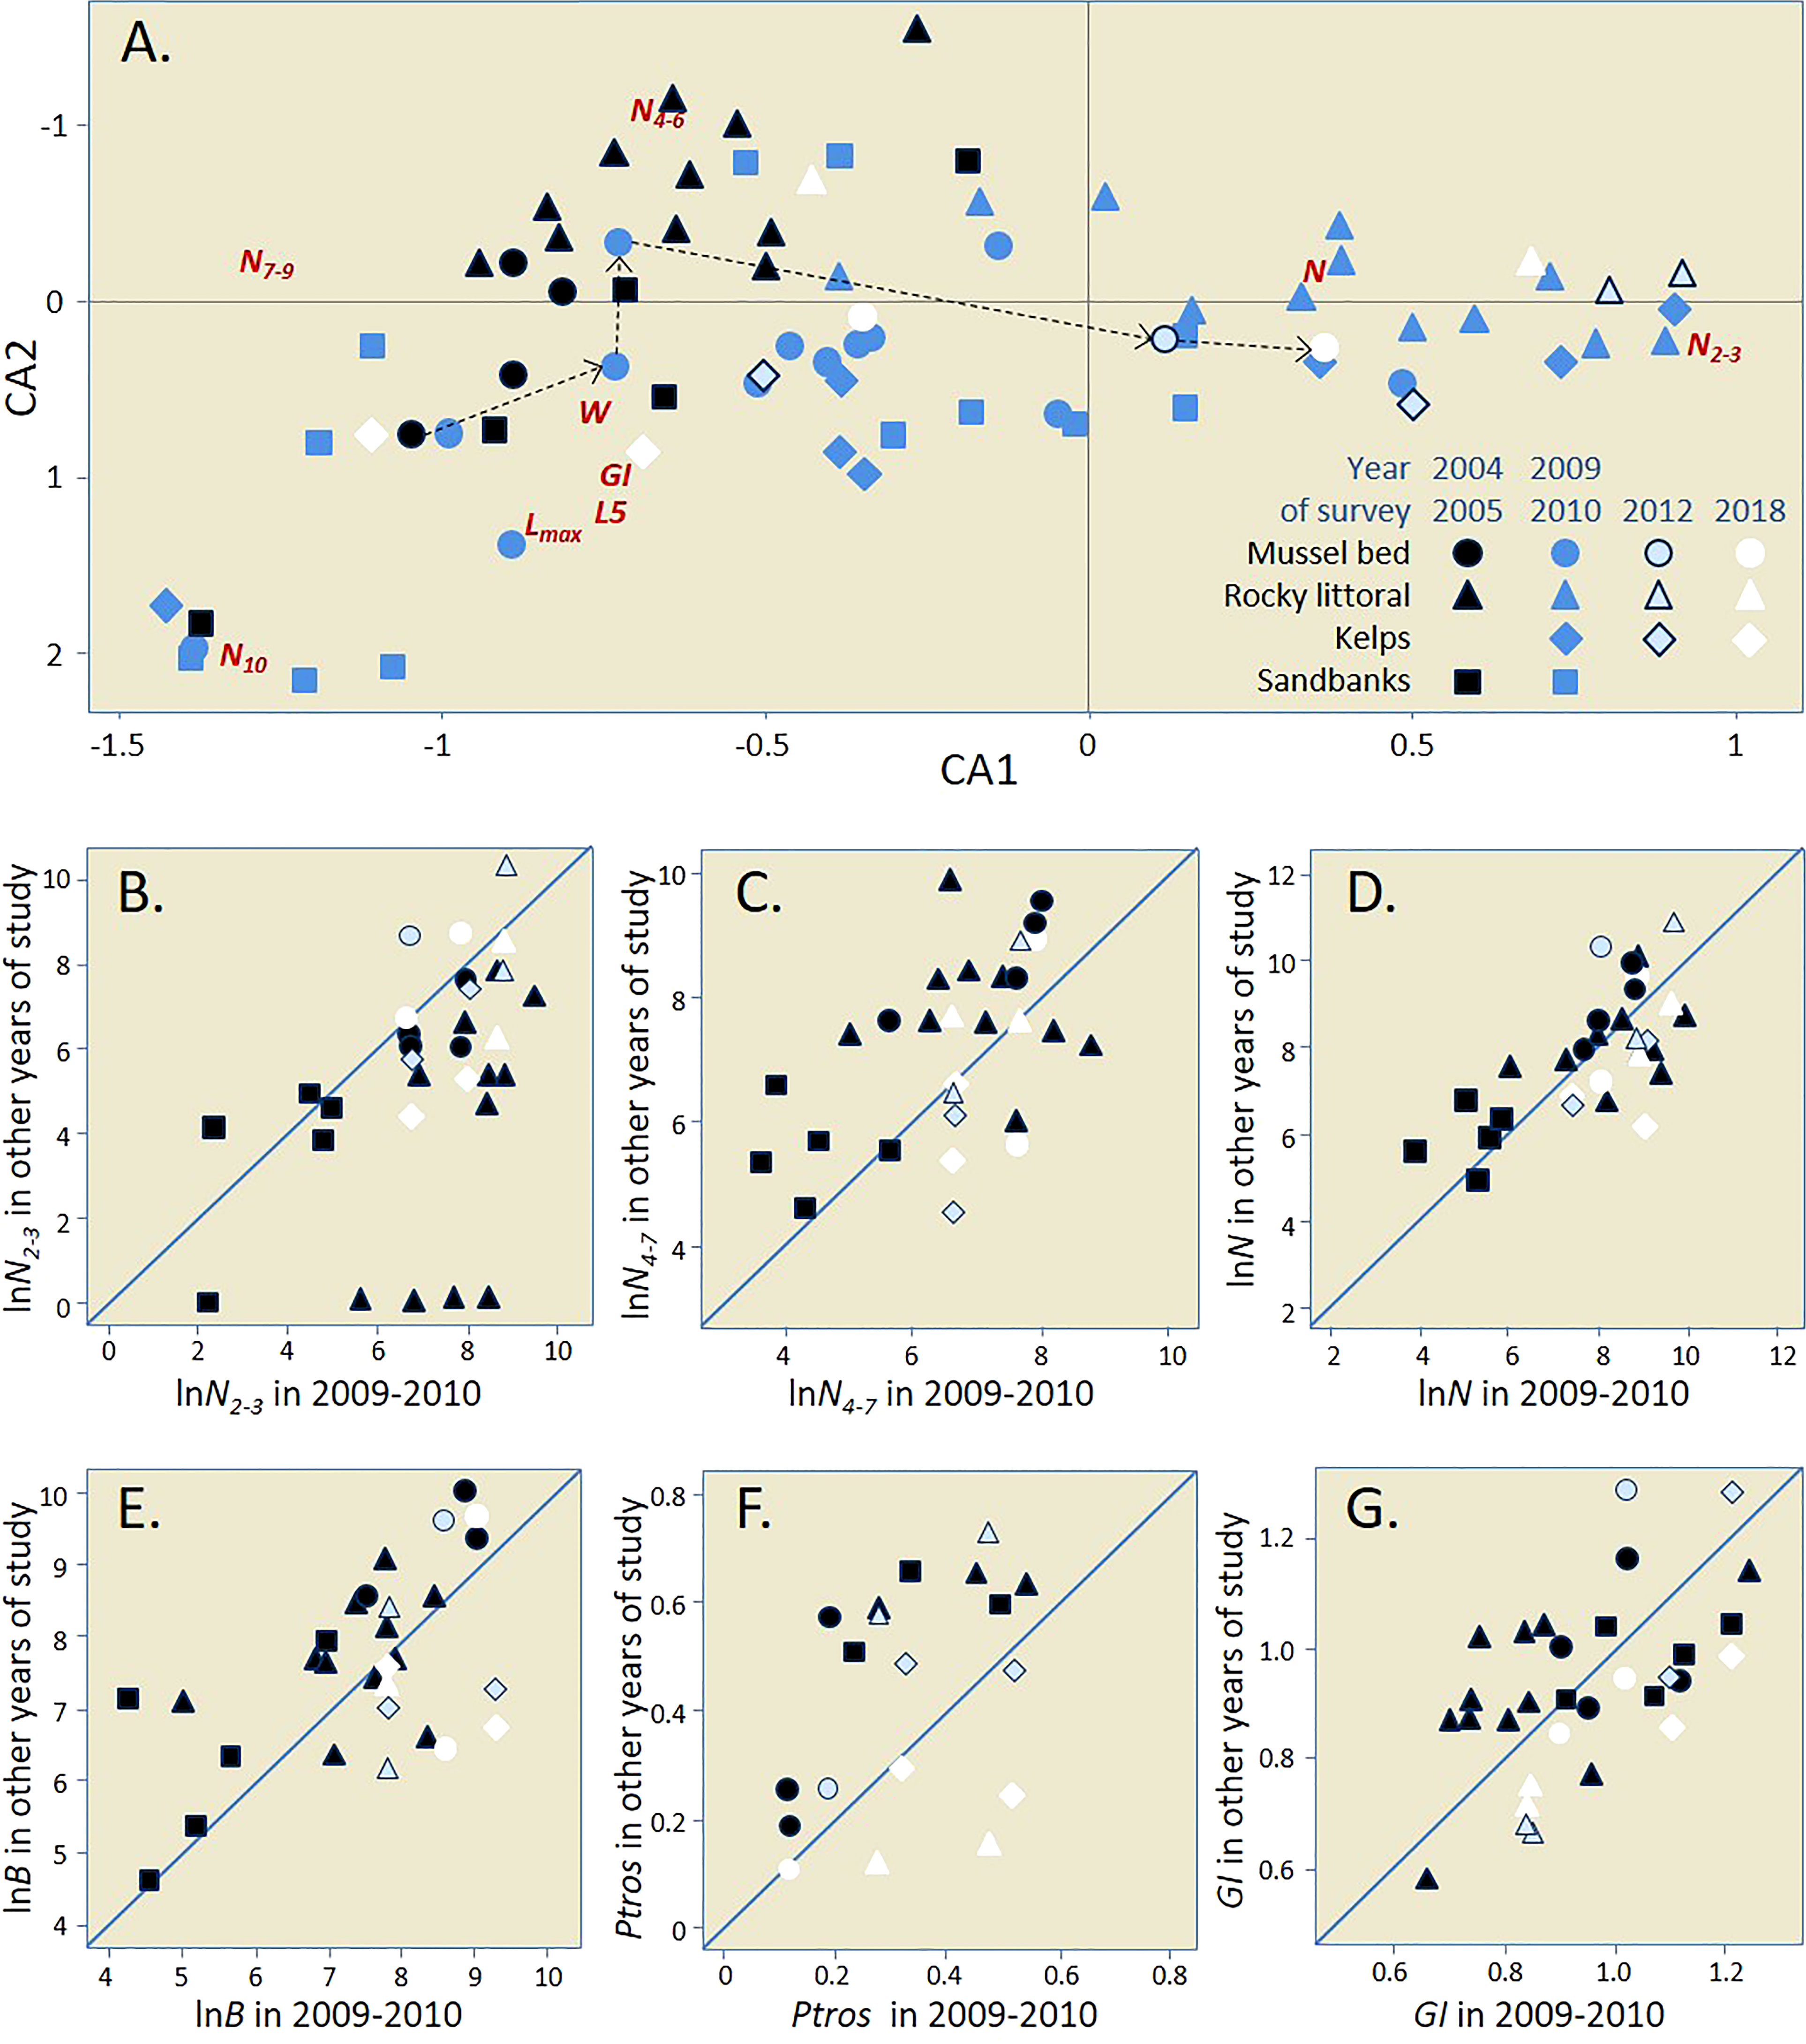
Figure 5 Temporal changes in demographics of the Tyuva mussels. (A) Correspondence Analysis (CA) ordination of mussel settlements by demographic parameters in all surveys (data on the same settlements in different years are considered independently). Demographic characteristics are indicated by abbreviated names. Settlements from different habitats are shown with signs of different shape; settlements studied in different years are shown with signs of different color (see legend). Arrows show temporal changes in BS+05. (B–G) Temporal changes in repeatedly studied settlements by N2-3 (B), density of mussels aged 4-7 years (C), N (D), B (E), Ptros (F), GI (G). All abundance values are logarithmic. All settlements were studied in 2009-10 (their characteristics in 2009-10 are plotted on the horizontal axis) and at one or more other time points (vertical axis). If the settlements did not change over time, the points lie on the diagonal. Abbreviated names of environmental and population parameters are explained in Materials and Methods.
Regression analysis of Ptros variation with time also revealed significant changes in the settlements from littoral rocks and in the Bed: in both habitats the proportion of MT decreased with time (Supplementary Table 9; Supplementary Figure 2). In settlements from sandbanks and kelps, the tendency was the same; but insignificant (Supplementary Table 9; Supplementary Figure 2), possibly due to the scarcity of data.
Figures 5B–G illustrate the temporal variations of Ptros and selected demographic parameters in settlements studied in 2004-05 and in 2009-10. Changes are the most noticeable in Ptros (Figure 5F, decreased by 22% on average; Wilcoxon test: uncorrected p=0.0039), N2-3 (Figure 5B, increased fivefold; p=0.00013), N4-7 (Figure 5C, decreased threefold; p=0.011) and B (Figure 5E, decreased twofold; p=0.0042). PERMANOVA analysis confirmed the unidirectional change in all the habitats because no significant interaction between Period and Habitat was revealed (Supplementary Table 10). SIMPER procedure showed that densities of mussels of different age groups made the greatest contribution to the change (in total, 72% of the cumulative contribution, Supplementary Table 11).
Long-term dynamics of the Tyuva mussels
The mussel habitats that we identified in the Tyuva Inlet were essentially the same as those found in the qualitative littoral surveys in the 1920s (Guryanova et al., 1928; 1929; see Supplementary Figure 1). According to the 1923 map, only two relatively small mussel patches were present at the site where we observed the mussel bed in the 2000s (see Supplementary Figure 3 for the map).
Average mussel biomass on littoral transects in the Tyuva, the Klimkovka and the Dolgaya in 1960-61 was 7.7, 4 and 8 kg/m2, respectively, and in 1971, 1.8, 2.1 and 0.1 kg/m2, respectively (Romanova, 1969; Antipova et al., 1984). In 2009, the values of the mean biomass in these inlets were nearly the same as in 1971 and many times lower than in 1960-1961 (Supplementary Table 2). The difference between the periods was statistically significant (ANOVA: F2, 6 = 12.39, p = 0.0074) but a post-hoc comparison did not reveal any differences between 1971 and 2009 (Tukey test).
Our data on the Tyuva, the Klimkovka, and the Dolgaya (Supplementary Table 2) indicate that in the 2000s the mussel abundance in the upper sublittoral down to a depth of 5 m was similar to that in the littoral. Unfortunately, no older data on mussel abundance in the sublittoral are available. This is strange, considering that the sublittoral was examined for bivalves by divers in the 1960s and in 1971. Another remarkable circumstance is that the absence of any reference to a mussel bed in the Tyuva in the study by Romanova (1969).
Discussion
We conducted a population study of the Murman mussels for the first time since the 1920s-1930s. We analyzed the interannual dynamics of the mussel settlements and took into account their taxonomic structure, which was not done in previous local studies (Guryanova et al., 1928; Guryanova et al., 1929; Matveeva, 1948; Zatzepin et al., 1948). An “old-fashioned” descriptive character and an emphasis on the taxonomic heterogeneity of the object distinguishes our research from the majority of modern ecological mussel studies, which are hypotheses-driven and often ignore the species identity of mussels (see for discussion Katolikova et al., 2016). By using a parsimonious morphological method of determining the taxonomic structure of the samples, we mapped the species distributions on scales from tens of meters to several kilometers in unprecedented detail. Below we discuss the distributional patterns of the mussels, their temporal dynamics, and, finally, the issue of ME and MT.
Distributional patterns
The spatial patterns in mussel demography observed in the Tyuva during our large-scale surveys in 2009-2010 can be explained, in general, by the influence of abiotic factors, food availability, and density-dependent effects in the settlements. The following patterns were outlined. 1) An almost ubiquitous distribution of mussels in the depth range from 4 m to +2 m at average surface salinity above 15 ppt; at lower salinity the mussels disappeared from the littoral. 2) The presence of the Bed in the river mouth in the top of the inlet, where the input of nutrients from the river and a fast water flow provide the best conditions for mussel feeding. 3) A trend toward increasing mussel size from the more wind-exposed mouth of the inlet, where mussel growth can be limited by wave action, to its top, which is more sheltered and where nutritional conditions are better. 4) An almost ubiquitous deficit of juveniles in the upper part of the inlet due to worse conditions for larvae and juveniles associated with strong salinity fluctuations and lack of substrate for settling on sandbanks, as well as on the Bed, where the space is occupied by large mussels. 5) A decrease in mussel size with littoral elevation associated with the negative impact of aerial exposure on their growth. This relationship between the mussel size and the depth was inverted on transects across the riverine part of the Bed (BS, BN), where the mussels in scarce settlements on the sandbanks were on average larger than those in the Bed. This inversion may be explained by the negative effect of the high density of mussels in the bed on their growth, which is pronounced in the center of the bed and disappears towards its periphery (cf. Okamura, 1986).
Though all these patterns have long been recognized as key regulators of mussel distribution, abundance and growth, they are not always easy to identify in boreal seas because of the confounding effect of predation (Seed and Suchanek, 1992). This effect seems to be weak in the Tyuva Inlet, where the only major enemy of mussels are common eiders (Krasnov and Goryaev, 2013). There are no littoral crabs in the Murman waters (Zatzepin et al., 1948). Starfish, dog whelks and sand shrimps occur in the region but we did not encounter them in the Tyuva. Finally, the mussels in the Tyuva are not harvested by humans.
The patterns of mussel habitat distribution identified in the littoral of the Tyuva Inlet in our study generally match those recorded in the 1920s-1930s (Guryanova et al., 1928; Guryanova et al., 1929; Zatzepin et al., 1948; Supplementary Figure 1). In contrast, the patterns in the sublittoral are strikingly dissimilar. We discovered fairly numerous populations of fast-growing mussels in kelp forests. No such populations have been noted in the 20th century. In particular, they have not been recorded, either in the Tyuva or in any other inlets, in the sublittoral studies of commercial bivalves of VNIRO in the 1960s-1980s (Romanova, 1969; Antipova et al., 1984) or in studies of the kelp communities in the areas of the Kola Bay adjacent to the Tyuva in the early 20th century (Derjugin, 1915; Guryanova, 1924). Yet in a recent study of kelp communities from the same area mussels were mentioned as an important component (Pavlova et al., 2018). It seems that mussels have arrived in this habitat only in the recent decades.
Populations in kelp forests seem to be characteristic of Arctic mussels, for which the littoral is poorly accessible due to small celestial tides, abrasive action of ice and extreme winter temperatures (Feder et al., 2003; Sukhotin et al., 2008; Leopold et al., 2019). They were also described in more temperate seas (e.g. British Isles, Connor et al., 1997; Gulf of St. Lawrence, Bégin et al., 2004; Aleutian Isles, Stewart and Konar, 2012). The role of kelp forests for mussels is debatable. They may be suboptimal habitats, colonized when other habitats are scarce. Indeed, mussels are rarely found in kelps in the White Sea (Plotkin et al., 2005), and it has been experimentally proven that the mussel larvae in the White Sea avoid settling on or near Saccharina latissima (Dobretsov, 1999; Dobretsov and Wahl, 2001). On the other hand, in the Gulf of St. Lawrence, the kelp canopy has been shown to promote mussel recruitment (Bégin et al., 2004). Whatever the case, the absence of mussels in the kelp forests of Murman in the 1920s-1980s and their appearance there in the 21st century is intriguing.
Temporal dynamics
Salient features of the temporal dynamics of the Tyuva mussels recorded in our study were synchronous changes in the age structure of settlements across the inlet between 2004-05 and 2009-10 and the increasing “degradation” of the littoral part of the Bed in 2010-2018. Between 2004-05 and 2009-10, the settlements became significantly “younger” everywhere. There were very few young (2-3 year-old mussels) in 2004-05, indicating poor recruitment (or poor survival of young mussels) in the early 2000s. In 2009-10, there were few old mussels (born in the early 2000s), but many young ones.
The pervasiveness of the changes suggests a common causal factor, but we do not have enough information to identify it. We do not know, e.g., if mussel populations were affected by some anthropogenic or natural disturbances such as oil spills, winter ice damage or deadly storms. The annual SST has been increasing since the late 1990s, on average 0.04°C per year (Polar Branch of the FSBSI “VNIRO”, 2022), which means that the mass recruitment occurred in warmer years, but this might have been a coincidence. Synchronicity in the interannual dynamics of mussel settlements on a spatial scale comparable to the Tyuva Inlet seems to be an exception rather than the rule (Stillman et al., 2000; Folmer et al., 2014; Khaitov and Lentsman, 2016; Khalaman et al., 2020), but a high year-to-year variation in mussel recruitment related to salinity fluctuations in the mesohaline environment has also been reported (Westerbom et al., 2021). The classic hypothesis explains the recruitment synchrony in populations of mussels and other littoral bivalves by the reduced abundance of invertebrate predators feeding on spat during severe winters (Beukema et al., 2015 and references therein). However, we doubt that this hypothesis, developed for the Wadden Sea, is applicable to the Tyuva Inlet, considering a different thermal regime and the lack of invertebrate predators there.
Our choice of the Tyuva Inlet as a study site was partly due to the presence there of a mussel bed with an area of several hectares (Bufalova et al., 2005; this study). According to anecdotal evidence from local residents, the Bed had existed, seemingly unchanged, for at least 10 years before the start of our research. In 2010, visual observations indicated an incipient degradation of the littoral part of the Bed. A carpet of live, mostly large mussels was gradually becoming a graveyard of their dead shells (Supplementary Figure 3). By 2018, the degradation of the littoral part of the Bed has been completed, though there were plenty of juveniles at monitoring point BS+05 in 2012 and it had looked like the Bed should revive. No one noticed any large mussel bed in the Tyuva in the 20th century (Guryanova et al., 1928; Romanova, 1969; Antipova et al., 1984), which indicates an unstable nature of the Bed.
Mussel beds are known to exhibit large-scale dynamics, which may be due to “endogenous” and “exogenous” factors (Dankers et al., 2001; Khaitov and Lentsman, 2016 and references therein; van der Meer et al., 2018). Endogenous factors are associated with density-dependent processes in the bed: adult mussels prevent juvenile recruitment, and mass recruitment occurs only after most of the old individuals die. External factors are associated with physical disturbance by storms, ice scouring, and cold waves in ice-free winters. We do not know which of these factors, if any, were at play in the Tyuva.
Historical data on the abundance of Murman mussels indicate that their littoral populations collapsed between 1960 and 1970, decreasing in terms of biomass by an order of magnitude (Antipova et al., 1984; Supplementary Table 2). These conclusions are mostly based on the VNIRO data (Romanova, 1969; Antipova et al., 1984), which were probably obtained by comparable methods and therefore seem reliable. Our data suggest that the populations of the Tyuva and two other inlets, Klimkovka and Dolgaya, did not recover from the collapse of the 1960s by the beginning of the 21st century. This finding disagrees with the hypothesis that water temperature fluctuations are the causal factor in the dynamics of the Barents Sea mussel populations (Antipova et al., 1984; Strelkov et al., 2001). High biomasses were observed in 1960-61 at the end of a roughly 40-year-long period of predominantly high temperatures, and the subsequent collapse coincided with the beginning of a severe cold snap that lasted into the late 1990s, when a very warm spell has started (Drinkwater, 2011). This warming, which is still ongoing, does not seem to have affected mussel abundance.
Mytilus edulis and M. trossulus
We could not directly identify the contribution of ME and MT to the demographic structure of settlements because the morphological method used in our study did not allow the species assignment of individuals and was applicable only to mussels aged 4-7 years. However, we do know that there are no differences in the growth rates of ME and MT in the Tyuva (Bufalova et al., 2005). Therefore, we can discuss how these species divided space and how their relative frequencies in populations varied in 2004-2018.
In the Tyuva, ME and MT inhabit essentially the same habitats as they do in allopatry. In particular, mass populations in kelps have been described both for ME, e.g., in the Pechora Sea (Sukhotin et al., 2008), and for MT, e.g., in the Aleutian Islands (Stewart and Konar, 2012). At the same time, these two species partially shared space and habitats in the Tyuva. Their distribution was fairly regular (more ME with increasing depth; more ME on the Bed), although there were some elements of mosaic distribution (Figure 3).
In their early review on sympatric ME and MT, Riginos and Cunningham (2004) compared the two zones of their sympatry known at the time, at the entrance to the Baltic Sea and in the Canadian Maritimes (Western Atlantic), and pointed out striking differences in the habitat distribution of these species in the two zones. In the former, their distribution is governed by salinity, with MT thriving in the extremely freshened environments of the central Baltic. In the more oceanic habitats of the Western Atlantic, these two species are distributed mosaically, with patches dominated by different species alternating at a scale of kilometers – tens of kilometers; MT tends to dominate in more exposed sites and ME, in more sheltered ones. If there is a relationship between the distribution of these two species and salinity (and the degree of wave exposure, which is difficult to separate from salinity) in Western Atlantic, it is the opposite to that observed in the Baltic. Riginos and Cunningham (2004) asked whether the differentiation of ecological traits between the species in sympatry reflects their ancient divergence in allopatry or evolved in sympatry as a result of competition. This question remains unresolved. Nevertheless, one might expect similarities in the habitat distribution of the species in the Barents Sea and in the Western Atlantic, given the similar salinity regimes and a (probably) very recent origin of the Barents Sea MT from the Western Atlantic (Väinölä and Strelkov, 2011, see below). There is no positive correlation between salinity and MT proportion in the settlements either in the Western Atlantic or in the Tyuva Inlet, but there is a tendency (not significant in the Tyuva) for ME to be more frequent in sheltered localities and for MT, in the exposed ones (Bates and Innes, 1995; Comesaña et al., 1999; Tam and Scrosati, 2013).
As for the segregation of these species by depth in the Western Atlantic, no one has studied it in detail on vertical transects as we have, which makes direct comparison difficult. No consistent differences were shown between settlements from the lower and the middle intertidal levels in the Canadian Maritimes (Moreau et al., 2005). Based on the re-analysis of published data, Riginos and Cunningham (2004) suggested that ME could be more common in the sublittoral than in the littoral. Further, it has been shown that ME larvae settle on average deeper than MT larvae, both in the laboratory and in the field (Freeman et al., 2002; Kenchington et al., 2002), which may result in an uneven distribution of species by depth. Consistent with this observation is the fact that MT mussels are more likely to occur at shallower depths on ropes of suspended mussel aquaculture than ME in the contact zone in Scotland (Michalek et al., 2021 and references therein). Segregation by depth has been repeatedly observed in other pairs of competing mussel species such as MT and M. galloprovincialis in California (Schneider and Helmuth, 2007) and Perna perna and M. galloprovincialis in South Africa (Bownes and McQuaid, 2006). In these cases, the competitors were a native species and a recent invasive species that partially displaced the former from its intertidal habitat. A similar situation is probably observed in the case of ME and MT in the Barents Sea (see below).
The distribution of ME and MT in the Tyuva might also be explained by some features that were left out in our study. Firstly, in the White Sea littoral, MT is more often found on algal substrates, and ME, on bottom substrates (Katolikova et al., 2016). If segregation by substrate is the same in the Tyuva, it may explain increased numbers of ME in the Bed, where algal substrates are scarce, compared to other littoral sites from the same depths. Secondly, ME generally aggregates better than MT (Liu et al., 2011). This behavioral feature can also be an advantage for ME in the Bed.
The ratio of MT and ME in the Tyuva Inlet changed significantly not only in space, but also in time, the changes being synchronous across the inlet. There was a decreasing trend in the proportion of MT throughout the observation period. Between 2004-05 and 2009-10, Ptros decreased everywhere, by 22% on average. Again, the only factor which seems to be correlated with this change is the mean annual temperature, which increased during the study period. Indeed, MT is a more stenothermal species than ME (Rayssac et al., 2010; Fly and Hilbish, 2012). In field experiments in the White Sea, adult MT have shown an increased heart rate and hence a poorer physiological performance than ME at water temperatures above 16°C (Bakhmet et al., 2022). The negative effect of rising temperatures on MT has been considered as a possible explanation of the replacement of MT by ME in the Oresund Strait between 1987 and 2005 (Strelkov et al., 2017). It is obvious that in an inlet of the Barents Sea in hot weather the littoral at low tide as well as the shallow waters can occasionally warm above 16°C. On the other hand, temperature is unlikely to be as critical for MT in the Barents Sea (latitude 69°) as in the Oresund (56°), which lies at the southern boundary of its distribution in continental Europe.
Väinölä and Strelkov (2011) once hypothesized that MT invaded the Barents Sea during World War II with Allied convoys from the western Atlantic and established stable populations there after the 1960s, when a window of opportunity opened for them after the collapse of the native (ME) populations. Their hypothesis was based on, firstly, an increased incidence of MT in port areas and, secondly, genetic similarities between MT populations in the two regions. A recent genomic study has confirmed the similarity between MT populations in the Kola Bay and the Gulf of St. Lawrence as well as a young age of the hybrid zone between ME and MT in the Kola Bay, where the gene pools of hybridizing species do not bear any traces of recent introgression (Simon et al., 2021).
If the hypothesis of Väinölä and Strelkov (2011) is true, we can assume that in the second half of the 20th century the “common mussel” system switched from a single-species (ME) state to a two-species state (ME and MT), and its parameters changed. This systemic transition could explain the two mysteries of the long-term mussel dynamics in Murman described above: the expansion of mussels into kelp forests between 1970s and 2000s and a weak response of the mussel populations to climate warming. The invasive species, better adapted to the littoral, might have displaced ME to the sublittoral, where it colonized a suboptimal habitat, kelp forests. Competition and hybridization negatively affect the fitness of both species involved, reducing the growth potential of their populations. This consideration might explain a weak response of the Murman mussels to climate warming.
Data availability statement
Individual data on genotype, age, and morphotype of genotyped mussels from the Tyuva Inlet are deposited in the database of St. Petersburg State University (http://hdl.handle.net/11701/38590). Information on quantitative samples of the Tyuva mussels, R scripts & input file are deposited ibid.
Ethics statement
Ethical review and approval was not required for the study of mussels Mytilus spp. in accordance with the local legislation and institutional requirements.
Author contributions
JM, PS, MS, MK, SM, EG-Y, and VK contributed to the concept and design of the study. All authors were involved in sampling and processing in the field. JM, VK, and MS performed the morphological analysis. PS, JM, MK, MS, and MG performed genotyping. JM, PS, and EG-Y performed the historical data search. JM curated the data. VK, JM, and PS performed statistical analysis. PS, JM, VK, and MK drafted the manuscript. All authors contributed to the article and approved the submitted version.
Funding
This study was supported by the Russian Science Foundation, Grant Number 19-74-20024.
Acknowledgments
We would like to thank all participants of our expeditions to Tyuva, especially Sergey Goldin, Sergey Shtinnikov, Dmitry Redkin, Helena Bufalova, Gita Paskerova, Anton Cherkasov, Dmitry Tomanovsky and Helena Shoshina for their help in the fieldwork, St. Petersburg University Research Park (https://researchpark.spbu.ru/) for assistance in the laboratory analyses and Natalia Lentsman for English language editing of the manuscript. The preprint of this paper has been posted on the bioRxiv server (Marchenko et al., 2022).
Conflict of interest
The authors declare that the research was conducted in the absence of any commercial or financial relationships that could be construed as a potential conflict of interest.
Publisher’s note
All claims expressed in this article are solely those of the authors and do not necessarily represent those of their affiliated organizations, or those of the publisher, the editors and the reviewers. Any product that may be evaluated in this article, or claim that may be made by its manufacturer, is not guaranteed or endorsed by the publisher.
Supplementary material
The Supplementary Material for this article can be found online at: https://www.frontiersin.org/articles/10.3389/fmars.2023.1146527/full#supplementary-material
References
Anderson M. J. (2014). Permutational multivariate analysis of variance (PERMANOVA). Wiley statsref: Stat ref. Online, 1–15. doi: 10.1002/9781118445112.stat07841
Antipova T. A., Gerasimova O. V., Panasenko L. D., Sennikov A. M. (1984). “Quantitative distribution of commercially important invertebrates along murman coast,” in Benthos of the barents sea: distribution, ecology and population structure (Apatity: USSR Acad Sci, Kola Scientific Centre, MMBI), 113–123.
Baden S., Hernroth B., Lindahl O. (2021). Declining populations of mytilus spp. in north atlantic coastal waters-a swedish perspective. J. Shellfish Res. 40, 269–296. doi: 10.2983/035.040.0207
Bakhmet I., Aristov D., Marchenko J., Nikolaev K. (2022). Handling the heat: changes in the heart rate of two congeneric blue mussel species and their hybrids in response to water temperature. J. Sea Res. 185, 102218. doi: 10.1016/j.seares.2022.102218
Barbosa R. V., Jaud M., Bacher C., Kerjean Y., Jean F., Ammann J., et al. (2022). High-resolution drone images show that the distribution of mussels depends on microhabitat features of intertidal rocky shores. Remote Sens. 14 (21), 5441. doi: 10.3390/rs14215441
Bates J., Innes D. (1995). Genetic variation among populations of Mytilus spp. in eastern Newfoundland. Mar. Biol. 124, 417–424. doi: 10.1007/BF00363915
Bégin C., Johnson L. E., Himmelman J. H. (2004). Macroalgal canopies: distribution and diversity of associated invertebrates and effects on the recruitment and growth of mussels. Mar. Ecol. Prog. Ser. 271, 121–132. doi: 10.3354/meps271121
Berge J., Johnsen G., Nilsen F., Gulliksen B., Slagstad D. (2005). Ocean temperature oscillations enable reappearance of blue mussels Mytilus edulis in Svalbard after a 1000 year absence. Mar. Ecol. Prog. Ser. 303, 167–175. doi: 10.3354/meps303167
Beukema J. J., Dekker R., van Stralen M. R., de Vlas J. (2015). Large-Scale synchronization of annual recruitment success and stock size in wadden Sea populations of the mussel Mytilus edulis l. Helgoland Mar. Res. 69, 327–333. doi: 10.1007/s10152-015-0440-9
Blanchet F. G., Legendre P., Borcard D. (2008). Forward selection of explanatory variables. Ecology 89, 2623–2632. doi: 10.1890/07-0986.1
Blicher M. E., Sejr M. K., Høgslund S. (2013). Population structure of mytilus edulis in the intertidal zone in a sub-Arctic fjord, SW Greenland. Mar. Ecol. Prog. Ser. 487, 89–100. doi: 10.3354/meps10317
Bodkin J. L., Coletti H. A., Ballachey B. E., Monson D. H., Esler D., Dean T. A. (2018). Variation in abundance of pacific blue mussel (Mytilus trossulus) in the northern gulf of Alaska 2006-2015. Deep Sea Res. Part II: Topical Stud. Oceanogr. 147, 87–97. doi: 10.1016/j.dsr2.2017.04.008
Bownes S. J., McQuaid C. D. (2006). Will the invasive mussel Mytilus galloprovincialis lamarck replace the indigenous Perna perna l. on the south coast of south Africa? J. Exp. Mar. Biol. Ecol. 338, 140–151. doi: 10.1016/j.jembe.2006.07.006
Brey T. (2001). Population dynamics in benthic invertebrates. A virtual handbook. (Germany: Alfred Wegener Institute for Polar and Marine Research). Available at: http://www.awi-bremerhaven.de/Benthic/Ecosystem/FoodWeb/Handbook/main.html.
Brooks M. E., Kristensen K., Van Benthem K. J., Magnusson A., Berg C. W., Nielsen A., et al. (2017). glmmTMB balances speed and flexibility among packages for zero-inflated generalized linear mixed modeling. R. J. 9, 378–400. doi: 10.32614/RJ-2017-066
Bufalova E. N., Strelkov P. P., Katolikova M. V., Sukhotin A. A., Kozin M. B. (2005). Mytilus of the tuva bay (Kola bay, barents Sea). Vestnik SPBGU 3, 99–105.
Cárdenas L., Leclerc J. C., Bruning P., Garrido I., Détrée C., Figueroa A., et al. (2020). First mussel settlement observed in Antarctica reveals the potential for future invasions. Sci. Rep. 10, 5552. doi: 10.1038/s41598-020-62340-0
Clarke K. R. (1993). Non-parametric multivariate analyses of changes in community structure. Aust. J. Ecol. 18, 117–143. doi: 10.1111/j.1442-9993.1993.tb00438.x
Comesaña A., Toro J., Innes D., Thompson R. (1999). A molecular approach to the ecology of a mussel (Mytilus edulis-M. trossulus) hybrid zone on the east coast of Newfoundland, Canada. Mar. Biol. 133, 213–221. doi: 10.1007/s002270050460
Connor D. W., Brazier D. P., Hill T. O., Northen K. O. (1997). Marine biotope classification for Britain and Ireland. Joint Nat. Conserv. Rev. Peterborough UK. 2.
Dankers N., Brinkman A. G., Meijboom A., Dijkman E. (2001). “Recovery of intertidal mussel beds in the waddensea: use of habitat maps in the management of the fishery,” in Coastal shellfish {{/amp]]mdash; a sustainable resource (Netherlands: Springer), 21–30. doi: 10.1007/978-94-010-0434-3_3
Derjugin K. M. (1915). Fauna of the kola bay and conditions of its existence. Mémoires l’Académie Impériale Des. Sci. Ser. 8 classe physico-mathématique 34, 1–929.
Dobretsov S. V. (1999). Effects of macroalgae and biofilm on settlement of blue mussel (edulis l.) larvae. Biofouling 14, 153–165. doi: 10.1080/08927019909378406
Dobretsov S., Wahl M. (2001). Recruitment preferences of blue mussel spat (Mytilus edulis) for different substrata and microhabitats in the white Sea (Russia). Hydrobiologia 445, 27–35. doi: 10.1023/A:1017502126707
Drinkwater K. F. (2011). The influence of climate variability and change on the ecosystems of the barents Sea and adjacent waters: review and synthesis of recent studies from the NESSAS project. Prog. Oceanogr. 90, 47–61. doi: 10.1016/j.pocean.2011.02.006
Dunbar M. J. (1953). Arctic And subarctic marine ecology: immediate problems. Arctic 6 (2), 75–90. doi: 10.14430/arctic3869
Feder H. M., Norton D. W., Geller J. B. (2003). A review of apparent 20th century changes in the presence of mussels (trossulus) and macroalgae in Arctic Alaska, and of historical and paleontological evid. Arctic 56, 391–407. doi: 10.14430/arctic636
Fly E. K., Hilbish T. J. (2012). Physiological energetics and biogeographic range limits of three congeneric mussel species. Oecologia 172, 35–46. doi: 10.1007/s00442-012-2486-6
Folmer E. O., Drent J., Troost K., Büttger H., Dankers N., Jansen J., et al. (2014). Large-Scale spatial dynamics of intertidal mussel (Mytilus edulis l.) bed coverage in the German and Dutch wadden Sea. Ecosystems 17, 550–566. doi: 10.1007/s10021-013-9742-4
Fox J. (2015). Applied regression analysis and generalized linear models (Thousand Oaks, California: Sage Publications).
Freeman K., Kenchington E., Macquarrie S. (2002). Comparative settlement depths of edulis c. Linnaeus 1758 and M. trossulus Gould 1850: i. a mesocosm study. J. Shellfish Res. 21, 59–66.
Gagaev S. Y., Golikov A. N., Sirenko B. I., Maximovich N. V. (1994). ). ecology and distribution of the mussel Mytilus trossulus septentrionalis clessin 1889 in the chaun inlet of the East Siberian Sea. Ecosys. flora fauna Chaun inlet East Siberian Sea Part I. Explor. fauna seas 44, 254–258.
Genelt-Yanovskiy E., Nazarova S., Tarasov O., Mikhailova N., Strelkov P. (2018). Phylogeography of the temperate marine bivalve Cerastoderma edule (Linnaeus 1758) (Bivalvia: cardiidae) in the subarctic: unique diversity and strong population structuring at different spatial scales. J. Zoological Sys. Evolutionary Res. 57, 67–79. doi: 10.1111/jzs.12231
Gosling E. (2021). Marine mussels: ecology, physiology, genetics and culture (John Wiley & Sons). doi: 10.1002/9781119293927
Guryanova E. F. (1924). Laminaria biocenosis of kola bay. Trudy Petrogradskogo Obshchestva Estestvoispytatelei 53, 141–172.
Guryanova E. F., Zaks I. G., Ushakov P. V. (1926). On the fauna of estuaries. Trudy Otdeleniya zoologii Leningradskogo obshchestva estestvoispytatelej 56, 79.
Guryanova E. F., Zaks I. G., Ushakov P. V. (1928). Littoral of the kola bay. part 1. Trudy Otdeleniya zoologii i fiziologii Leningradskogo obshchestva estestvoispytatelej 59, 47–71.
Guryanova E. F., Zaks I. G., Ushakov P. V. (1929). Littoral of the kola bay. part 2: comparative description of the kola bay littoral on its whole length. Trudy Otdeleniya zoologii i fiziologii Leningradskogo obshchestva estestvoispytatelej 58, 89–143.
Guryanova E. F., Zaks I. G., Ushakov P. V. (1930). Littoral of the Western murman. Issledovaniya morej USSR 11, 47–104.
Ingvaldsen R. B., Assmann K. M., Primicerio R., Fossheim M., Polyakov I. V., Dolgov A. V. (2021). Physical manifestations and ecological implications of Arctic atlantification. Nat. Rev. Earth Environ. 2, 874–889. doi: 10.1038/s43017-021-00228-x
Katolikova M., Khaitov V., Väinölä R., Gantsevich M., Strelkov P. (2016). Genetic, ecological and morphological distinctness of the blue mussels Mytilus trossulus Gould and M. edulis l. in the white Sea. PloS One 11 (4), e0152963. doi: 10.1371/journal.pone.0152963
Kenchington E., Freeman K. R., Vercaemer B., MacDonald B. (2002). Comparative settlement depths of Mytilus edulis c. Linnaeus 1758 and M. trossulus Gould 1850:II.Field observations. J. Shellfish Res. 21, 67–73.
Khaitov V. M., Lentsman N. V. (2016). The cycle of mussels: long-term dynamics of mussel beds on intertidal soft bottoms at the white Sea. Hydrobiologia 781, 161–180. doi: 10.1007/s10750-016-2837-0
Khaitov V., Makarycheva A., Gantsevich M., Lentsman N., Skazina M., Gagarina A., et al. (2018). Discriminating eaters: Sea stars Asterias rubens l. feed preferably on Mytilus trossulus Gould in mixed stocks of Mytilus trossulus and Mytilus edulis l. Biol. Bull. 234 (2), 85–95. doi: 10.1086/697944
Khaitov V., Marchenko J., Katolikova M., Väinölä R., Kingston S. E., Carlon D. B., et al. (2021). Species identification based on a semi-diagnostic marker: evaluation of a simple conchological test for distinguishing blue mussels Mytilus edulis l. and M. trossulus Gould. PloS One 16, 1–27. doi: 10.1371/journal.pone.0249587
Khalaman V. V., Trunova A. D., Tridrikh N. N., Zharnikov V. S., Spiridonov V. A. (2020). From uniformity to multiplicity: development of a sub-arctic littoral mussel bed in the Sea of Okhotsk. Polar Biol. 43, 1341–1352. doi: 10.1007/s00300-020-02712-4
Kotwicki L., Weslawski J. M., Włodarska-Kowalczuk M., Mazurkiewicz M., Wenne R., Zbawicka M., et al. (2021). The re-appearance of the mytilus spp. complex in Svalbard, Arctic, during the Holocene: the case for an arrival by anthropogenic flotsam. Global Planetary Change 202, 103502. doi: 10.1016/j.gloplacha.2021.103502
Krasnov Y. V., Goryaev Y. I. (2013). “The main trends in the development of avifauna of the kola bay and factors determining it,” in Birds of northern and southern seas of russia: fauna, ecology (Apatity: Publishing house of KSC RAS), 36–64.
Laakkonen H. M., Hardman M., Strelkov P., Väinölä R. (2020). Cycles of trans-Arctic dispersal and vicariance, and diversification of the amphi-boreal marine fauna. J. Evolutionary Biol. 34, 73–96. doi: 10.1111/jeb.13674
Leopold P., Renaud P. E., Ambrose W. G., Berge J. (2019). High Arctic Mytilus spp.: occurrence, distribution and history of dispersal. Polar Biol. 42, 237–244. doi: 10.1007/s00300-018-2415-1
Liu G., Stapleton E., Innes D., Thompson R. (2011). Aggregational behavior of the blue mussels Mytilus edulis and Mytilus trossulus: a potential pre-zygotic reproductive isolation mechanism. Mar. Ecol. 32, 480–487. doi: 10.1111/j.1439-0485.2011.00446.x
Lukanin V. V., Naumov A. D., Fedyakov V. V. (1986). “Dynamics of size structure in a population of the white Sea mussels (Mytilus edulis l.),” in Ecological investigations of the benthic organisms of the white Sea (Leningrad: Zoological Institute of the USSR Academy of Sciences), 50–63.
Marchenko J., Khaitov V., Katolikova M., Sabirov M., Malavenda S., Gantsevich M., et al. (2022). Taxonomically mixed blue mussel Mytilus populations are spatially heterogeneous and temporally unstable in the subarctic barents Sea. bioRxiv. doi: 10.1101/2022.12.08.519596
Marshall G. J., Vignols R. M., Rees W. G. (2016). Climate change in the kola peninsula, Arctic Russia, during the last 50 years from meteorological observations. J. Climate 29, 6823–6840. doi: 10.1175/JCLI-D-16-0179.1
Matishov G., Moiseev D., Lyubina O., Zhichkin A., Dzhenyuk S., Karamushko O., et al. (2012). Climate and cyclic hydrobiological changes of the barents Sea from the twentieth to twenty-first centuries. Polar Biol. 35, 1773–1790. doi: 10.1007/s00300-012-1237-9
Matveeva T. A. (1948). “The biology of mytilus edulis l. in the Eastern murman,” in Trudy Murmanskoj biologicheskoj stancii akademii nauk USSR (Moscow – Leningrad), 215–241.
McDonald J. H., Seed R., Koehn R. K. (1991). Allozymes and morphometric characters of three species of Mytilus in the northern and southern hemispheres. Mar. Biol. 111, 323–333. doi: 10.1007/bf01319403
Michalek K., Vendrami D. L. J., Bekaert M., Green D. H., Last K. S., Telesca L., et al. (2021). Mytilus trossulus introgression and consequences for shell traits in longline cultivated mussels. Evolutionary Appl. 14, 1830–1843. doi: 10.1111/eva.13245
Mityaev M. V. (2014). Murman coast (Geological, geomorphological, and climatic features, current geological process) (Apatity: Publ. KSC RAS).
Moreau V., Tremblay R., Bourget E. (2005). Distribution of Mytilus edulis and M. trossulus on the gaspe coast in relation to spatial scale. J. Shellfish Res. 24, 545–551. doi: 10.2983/0730-8000(2005)24[545:DOMEAM]2.0.CO;2
Morozov N. V. (1901). The losion of the Murmansk coast of the Arctic ocean from the vardø islands to the white Sea (St. Petersburg: printing house of the Naval Ministry).
Okamura B. (1986). Group living and the effects of spatial position in aggregations of Mytilus edulis. Oecologia 69, 341–347. doi: 10.1007/BF00377054
Oksanen J., Blanchet F. G., Friendly M., Kindt R., Legendre P., McGlinn D., et al. (2020) Vegan: community ecology package. Available at: https://cran.r-project.org/package=vegan.
Pavlova L. V., Nekhaev I. O., Panteleeva N. N., Akhmetchina O., Garbul E. A., Dikaeva D. R., et al. (2018). Shallow benthos of kola bay (Barents sea): biodiversity and assessment of the current state of communities. Proc. Kola Sci. Center Russian Acad. Sci. 9, 61–92. Yu. doi: 10.25702/KSC.2307-5252.2018-9-4-61-92
Pedersen E. J., Miller D. L., Simpson G. L., Ross N. (2019). Hierarchical generalized additive models in ecology: an introduction with mgcv. PeerJ 7, e6876. doi: 10.7717/peerj.6876
Plotkin A., Railkin A., Gerasimova E., Pimenov A. Y., Sipenkova T. (2005). Subtidal underwater rock communities of the white sea: structure and interaction with bottom flow. Russian J. Mar. Biol. 31, 335–343. doi: 10.1007/s11179-006-0001-9
Polar Branch of the FSBSI “VNIRO”. (2022). Available at: http://www.pinro.vniro.ru/ru/.
Pritchard J. K., Stephens M., Donnelly P. (2000). Inference of population structure using multilocus genotype data. Genetics 155 (2), 945–959. doi: 10.1093/genetics/155.2.945
Rayssac N., Pernet F., Lacasse O., Tremblay R. (2010). Temperature effect on survival, growth, and triacylglycerol content during the early ontogeny of Mytilus edulis and M. trossulus. Mar. Ecol. Prog. Ser. 417, 183–191. doi: 10.3354/meps08774
R Core Team (2021). R: a language and environment for statistical computing (Vienna, Austria: R Foundation for Statistical Computing). Available at: https://www.r-project.org/.
Riginos C., Cunningham C. W. (2004). INVITED REVIEW: local adaptation and species segregation in two mussel (Mytilus edulis x Mytilus trossulus ) hybrid zones. Mol. Ecol. 14, 381–400. doi: 10.1111/j.1365-294x.2004.02379.x
Schneider K. R., Helmuth B. (2007). Spatial variability in habitat temperature may drive patterns of selection between an invasive and native mussel species. Mar. Ecol. Prog. Ser. 339, 157–167. doi: 10.3354/meps339157
Seed R., Suchanek T. H. (1992). “Population and community ecology of mytilus,” in The mussel mytilus: ecology, physiology, genetics and culture. Ed. Gosling E. (London: Elsevier), 87–169.
Selin N. I., Lysenko V. N. (2006). Size and age composition of populations and growth of Mytilus trossulus (Bivalvia: mytilidae) in the subtidal area of western kamchatka. Russian J. Mar. Biol. 32, 360–368. doi: 10.1134/S1063074006060058
Seuront L., Nicastro K. R., Zardi G. I., Goberville E. (2019). Decreased thermal tolerance under recurrent heat stress conditions explains summer mass mortality of the blue mussel Mytilus edulis. Sci. Rep. 9, 17498. doi: 10.1038/s41598-019-53580-w
Shavykin A. A. (2018). Kola bay and oil: biota, vulnerability maps, pollution (Saint Petersburg: MMBI KSC RAS).
Simon A., Fraïsse C., El Ayari T., Liautard-Haag C., Strelkov P., Welch J. J., et al. (2021). How do species barriers decay? concordance and local introgression in mosaic hybrid zones of mussels. J. Evolutionary Biol. 34, 208–223. doi: 10.1111/jeb.13709
Sorte C. J., Davidson V. E., Franklin M. C., Benes K. M., Doellman M. M., Etter R. J., et al. (2017). Long-term declines in an intertidal foundation species parallel shifts in community composition. Global Change Biol. 23, 341–352. doi: 10.1111/gcb.13425
Stewart N. L., Konar B. (2012). Kelp forests versus urchin barrens: alternate stable states and their effect on Sea otter prey quality in the Aleutian islands. J. Mar. Biol. 2012, 1–12. doi: 10.1155/2012/492308
Stillman R., McGrorty S., Goss-Custard J., West A. (2000). Predicting mussel population density and age structure: the relationship between model complexity and predictive power. Mar. Ecol. Prog. Ser. 208, 131–145. doi: 10.3354/meps208131
Strelkov P. P., Dobretsov S. V., Zubaha M. A., Maximovich N. V. (2001). Reproductive cycle and population dynamics of mussel Mytilus edulis l. under conditions of Eastern murman (the barents Sea). Vestnik Saint Petersburg University Ser. 3 Biol. 4, 46–51.
Strelkov P., Katolikova M., Väinölä R. (2017). Temporal change of the Baltic Sea - north Sea blue mussel hybrid zone over two decades. Mar. Biol. 164, 214. doi: 10.1007/s00227-017-3249-z
Sukhotin A., Krasnov Y. V., Galaktionov K. (2008). Subtidal populations of the blue mussel Mytilus edulis as key determinants of waterfowl flocks in the southeastern barents Sea. Polar Biol. 31, 1357–1363. doi: 10.1007/s00300-008-0474-4
Sukhotin A. A., Strelkov P. P., Maximovich N. V., Hummel H. (2007). Growth and longevity of Mytilus edulis (L.) from northeast Europe. Mar. Biol. Res. 3, 155–167. doi: 10.1080/17451000701364869
Tam J. C., Scrosati R. A. (2013). Distribution of cryptic mussel species ( Mytilus edulis and M. trossulus) along wave exposure gradients on northwest Atlantic rocky shores. Mar. Biol. Res. 10, 51–60. doi: 10.1080/17451000.2013.793809
ter Braak C. J., Verdonschot P. F. (1995). Canonical correspondence analysis and related multivariate methods in aquatic ecology. Aquat. Sci. 57 (3), 255–289. doi: 10.1007/BF00877430
Thyrring J., Rysgaard S., Blicher M. E., Sejr M. K. (2014). Metabolic cold adaptation and aerobic performance of blue mussels (Mytilus edulis) along a temperature gradient into the high Arctic region. Mar. Biol. 162, 235–243. doi: 10.1007/s00227-014-2575-7
Väinölä R., Strelkov P. (2011). Mytilus trossulus in northern Europe. Mar. Biol. 158, 817–833. doi: 10.1007/s00227-010-1609-z
van der Meer J., Dankers N., Bruno. J., van Stralen M., Troost K., Waser A. M. (2018). The birth, growth and death of intertidal soft-sediment bivalve beds: no need for Large-scale restoration programs in the Dutch wadden Sea. Ecosystems 22, 1024–1034. doi: 10.1007/s10021-018-0320-7
Wenne R., Zbawicka M., Bach L., Strelkov P., Gantsevich M., Kukliński P., et al. (2020). Trans-Atlantic distribution and introgression as inferred from single nucleotide polymorphism: mussels Mytilus and environmental factors. Genes 11, 530. doi: 10.3390/genes11050530
Westerbom M., Kraufvelin P., Mustonen O., Díaz E. (2021). Explaining recruitment stochasticity at a species’ range margin. Front. Mar. Sci. 8. doi: 10.3389/fmars.2021.659556
Wood S. N. (2010). Fast stable restricted maximum likelihood and marginal likelihood estimation of semiparametric generalized linear models. . J. R. Stat. Society: Ser. B (Statistical Methodology) 73, 3–36. doi: 10.1111/j.1467-9868.2010.00749.x
World Sea Temperatures. (2022). Available at: https://www.seatemperature.org/.
Zatzepin V. I., Zenkevitch L. A., Filatova Z. A. (1948). Materials on quantitative analysis of the kola bay littoral bottom fauna. Proc. State Oceanographical Institute 6, 13–54.
Keywords: Mytilus edulis, Mytilus trossulus, subarctic, Barents Sea, habitat distribution, demography, taxonomic structure, interannual dynamics
Citation: Marchenko J, Khaitov V, Katolikova M, Sabirov M, Malavenda S, Gantsevich M, Basova L, Genelt-Yanovsky E and Strelkov P (2023) Patterns of spatial and temporal dynamics of mixed Mytilus edulis and M. trossulus populations in a small subarctic inlet (Tyuva Inlet, Barents Sea). Front. Mar. Sci. 10:1146527. doi: 10.3389/fmars.2023.1146527
Received: 17 January 2023; Accepted: 09 May 2023;
Published: 23 May 2023.
Edited by:
Mark Botton, Fordham University, United StatesCopyright © 2023 Marchenko, Khaitov, Katolikova, Sabirov, Malavenda, Gantsevich, Basova, Genelt-Yanovsky and Strelkov. This is an open-access article distributed under the terms of the Creative Commons Attribution License (CC BY). The use, distribution or reproduction in other forums is permitted, provided the original author(s) and the copyright owner(s) are credited and that the original publication in this journal is cited, in accordance with accepted academic practice. No use, distribution or reproduction is permitted which does not comply with these terms.
*Correspondence: Julia Marchenko, eS5tYXJjaGVua29Ac3BidS5ydQ==