 Yan Li1
 Mengying Du
 Juan Feng
 Falei Xu
 Wenjun Song
94% of researchers rate our articles as excellent or good
Learn more about the work of our research integrity team to safeguard the quality of each article we publish.
Find out more
ORIGINAL RESEARCH article
Front. Mar. Sci. , 28 March 2023
Sec. Physical Oceanography
Volume 10 - 2023 | https://doi.org/10.3389/fmars.2023.1145509
This article is part of the Research Topic Air-Sea Interaction and Oceanic Extremes View all 31 articles
The variability of the Hadley Circulation (HC) is greatly impacted by the meridional structure of sea surface temperature (SST), which has varied effects depending on its symmetrical or asymmetrical pattern relative to the equator. By using the Coupled Comparison Program International Project Phase 6 (CMIP6) model outputs and reanalysis datasets, this study assesses the capacity of CMIP6 models to simulate the relationship between the HC and tropical SST under different meridional structures, as well as investigates the possible causes for simulation biases. It is shown that the CMIP6 models can successfully reproduce climatological HC, tropical SST, and their spatial patterns of first leading modes under different meridional structures, where the correlation coefficient between simulations and observations reaches 0.8 or above. By comparison, the CMIP6 model outputs exhibit substantial differences in simulating the HC to SST response over the different meridional structures, with obvious inter-model differences. Considering the capability in simulating the HC to tropical SST response, the CMIP6 models are divided into two types, Type I model and Type II model. Models of Type I are those whose simulation results are basically close to the reanalysis data, with the biases being less than 20%. The models of Type II are those whose simulated response ratios are much stronger than those of the reanalysis. It is found that the models of Type II overestimate the intensity of El Niño-Southern Oscillation (ENSO) events, and remarkably underestimate the HC and SST correlation in the equatorial symmetric part, resulting in the inability of the models of Type II to capture the connection of the HC and tropical SST. The results indicate that, the component of the CMIP6 models in reproducing the ENSO events has a considerable impact on the simulation of the HC and tropical SST relationship, which offers recommendations for enhancing the capability of models to simulate large-scale tropical air-sea interactions.
The Hadley circulation (HC), one of the most significant global circulation cells, is generated when the Earth is heated unevenly by the sun (Hadley, 1735; Bjerknes, 1966). One branch of the HC rises around the equator, while the other two descend at around 30° south and north. i.e., a closed circulation is formed in each hemisphere (Oort and Rasmusson, 1970; Held and Hou, 1980). The HC acts as the link between the tropics and subtropics, transporting momentum, heat and energy from tropics and subtropics. Thus, it is closely related to global climate change (Lindzen, 1994; Hou, 1998). The inter tropical convergence zone (ITCZ) is located along the HC’s rising branch, while the subtropical arid belts are located along the sinking branch in both hemispheres (Tanaka et al., 2004; Kang and Lu, 2012). Thus, as a major climate-altering factor, the HC is of global significance in climate (Chang, 1995; Cook, 2003; Diaz and Bradley, 2004).
The HC’s characteristics and changes have mostly been analyzed primarily from two aspects: the intensity and the width. Early in 1992, Hou and Lindzen (1992) discovered that tropical warming leads to an enhancement in the HC. The enhancement trend of the HC’s intensity has been found on various time scales from seasons (e.g., spring, winter) to year, since the beginning of the 20th century (Bjerknes, 1969; Chen et al., 2002; Quan et al., 2004; Hu et al., 2005; Huang et al., 2019). In addition, the above findings can be verified in multiple reanalysis datasets (Mitas and Clement, 2006; Ma and Li, 2008; Sohn and Park, 2010). It is noteworthy that Kim et al. (2022) analyzed the descending branch of the HC and noticed that the intensity of the HC’s descend branch is weakening duo to the effect of extratropical radiative forcing, and Hu et al. (2018) found that the simulation results of the HC’s intensity is weakening under the global warming using the model data, which showing an opposite trend to that of the intensity (Chen et al., 2002; Huang et al., 2019). Previous researches have also found that the HC is expanding (e.g., Fu et al., 2006; Liu et al., 2012; Tao et al., 2016), which has been verified by model simulations (e.g., Lu et al., 2007; Son et al., 2010; Kang and Lu, 2012; Hu et al., 2013). Because of the HC expanding, the position of the arid zone in the subtropical region has also gradually moved toward the poleward (Fu et al., 2006; Hu et al., 2011; Nguyen et al., 2015; Grise et al., 2018; Hu et al., 2019). As for the possible causes for the expansion of HC, studies have pointed out that the El Niño-Southern Oscillation (ENSO) is an important factor (Fu et al., 2006; Ceppi and Hartmann, 2013; Hu et al., 2019). It has also been found that black carbon aerosols, the North Pacific Oscillation (NPO), and the Arctic Oscillation (AO) also cause the broadening of the HC (Kovilakam and Mahajan, 2015; Huang et al., 2021). The aforementioned studies mainly focus on the HC itself, and these results show that the intensity and width change of HC will lead to global and regional climate anomalies (Mitas and Clement, 2006; Freitas and Ambrizzi, 2015).
Because the HC is a direct thermal circulation that extends 30° to the north and south, the tropical sea surface temperature (SST) can directly impact the changes of the HC. Several researches have illustrated that the SST’s warming trend impacts the HC’s rising branch location, and thereby strengthens the HC (Hou and Lindzen, 1992). Conversely, the anomalous sinking branch of HC also leads to anomalous SST by changing the surface humidity over land (Chikamoto et al., 2010). Such anomalous variations in the SST are often more pronounced during the ENSO events, with positive and negative abnormal affecting the configuration and intensity of the HC, and thus affecting the global climate (Guilyardi et al., 2012). Hence, there is a close relation between the ENSO and the HC (Huang et al., 2019). The intensification of the HC in the Northern Hemisphere (NH) and the changes in its dominant mode exhibit a significant relationship with the ENSO events since 1970 (Caballero, 2007; Guo and Tan, 2018a; Guo and Tan, 2018b; Wang et al., 2020). Such as, Oort and Yienger (1996) found that the intensity of the HC in the eastern Pacific is closely linked to the SST, where the intensity of the HC increases when ENSO is in its positive phase. The tropical Indian Ocean and North America SST also exhibit a similar relationship (Freitas et al., 2017). In addition, the ENSO also has a significant influence on the width of HC. Several studies have found that the HC in the NH narrows when the El Niño events occurrences, while the HC of the Southern Hemisphere (SH) expands during La Niña events (Guo and Li, 2016; Nguyen et al., 2018). Similarly, the HC in the western Pacific moves poleward during the central El Niño events (Huang et al., 2021). In short, the ENSO events have an important effect on the SST in the tropics, thereby changing the intensity and width of the HC.
The above works suggest that changes in the tropical SST significantly affect changes in the HC. It is shown that the meridional structure of SST could determine the strength and width of the HC (Hou and Lindzen, 1992). Yang et al. (2020), Yang et al. (2023) further indicated that the tropical expansion is driven by the poleward shift of meridional temperature gradients. It is pointed out that the first dominant mode of HC exhibits an equatorial asymmetric structure, while the second dominant mode present an equatorial symmetric structure (Dima and Wallace, 2003; Ma and Li, 2008). Specifically, the equatorial asymmetric structure of the HC is primarily correlated to the equatorial asymmetric of the SST, while the equatorial symmetric mode is associated with the equatorial ENSO (Feng and Li, 2013; Feng et al., 2015). Feng et al. (2016) analyzed how the meridional structure of the SST affects the HC. It is found that even for heat sources with the same intensity, the HC responds four times more intensely to an asymmetric heat source than to an equatorial symmetric source, indicating that the SST meridional structures have a significant regulatory effect on the HC. Moreover, although the SST anomaly corresponding to the ENSO events exhibits an equatorial symmetric meridional structure, an asymmetric SST component appears during the growth of the El Niño events, leading to an exponential increase in the HC to SST response (Feng et al., 2019). Therefore, with reference to the structures and variations of the HC, we must follow with interest from the perspective of the SST’s different meridional structures.
As the largest atmospheric circulation system in the tropics, the correlation between HC and SST reflects the large-scale tropical sea-air interaction. The bias of CMIP5 models in simulating the HC to SST responses may be due to the difference in simulating the warming trend and time series of the SST between two hemispheres (Feng et al., 2015; Feng et al., 2019). On the one hand, this model bias is connected to the SST simulations. The CMIP5 models simulate the SST anomalies under El Niño events are generally weaker than the observations (Yang and Giese, 2013; Rao and Ren, 2014). In addition, in the equatorial west-central Pacific, the sea surface temperature anomaly (SSTA) exhibits a cold bias, as well as a westward shift error in its latitudinal distribution (Brown et al., 2020). The finding of the anomalous westward shift in the distribution of the tropical-Pacific SSTA also has been found in CMIP3 model simulations (Leloup et al., 2008; Ge and Chen, 2020). On the other hand, this bias is related to model competence in simulating HC characteristics. Using the CMIP5 model simulations, Feng et al. (2015) revealed that climate models accurately depict the climatological features of HC, but fail to reproduce its long-term variability.
Although previous researchers have examined the effect of the CMIP models in reproducing the HC features and variations. They mainly focused on the variations of HC itself, while the correlation of the HC-tropical SST has received less attention. With the release of CMIP6 model outputs (Eyring et al., 2016; Zhou et al., 2019), it is crucial to analyze the relation of the HC and SST under different structures to examine the simulation effect of climate models, which helps to understand the competence of CMIP6 models to describe the tropical air-sea processes objectively.
Therefore, this paper mainly focuses on two scientific questions: 1) How well can the CMIP6 models capture the spatial modes of HC and SST under different meridional structures? 2) Can the CMIP6 models well reproduce the relation between the HC and tropical SST? Moreover, what are the possible causes of model simulation bias? To answer the above scientific issues, the simulations of the HC and tropical SST in different meridional structures based on the CMIP6 models are examined, and it is indicated that the cause of the related simulated bias is mainly due to reproduction of the ENSO events. The following describes the remainder of this study. The reanalysis data, CMIP6 model data, and methodologies are presented in Section 2. Section 3 assesses the CMIP6 models’ ability in simulating the climatological features of the HC and the tropical SST under different structures. The ability of CMIP6 model in simulating the HC and tropical SST variability is presented Section 4. Section 5 analyses the capability of the CMIP6 models in simulating the response of the HC to tropical SST, and also discusses the bias in simulating the HC to SST response from two aspects, namely the ability of CMIP6 models to simulate the ENSO intensity and the HC-SST correlation under different meridional structures. Finally, the summary and discussion are given in Section 6.
In this study, the monthly mean meridional wind data is obtained from the National Centers for Environmental Prediction/National Center for Atmospheric Research (NCEP/NCAR) reanalysis 1 (NCEP1), which has a resolution of 2.5°×2.5°. The monthly mean SST data with a resolution of 2°×2° is available from the Extended Reconstructed Sea Surface Temperature Version 5 (ERSST V5) of National Oceanic and Atmospheric Administration (NOAA). Here, we focus on the period of 1948–2013.
Besides, the simulations of 20 CMIP6 models from the World Climate Research Program (WCRP) (Table 1) are also adopted. Considering the varying study periods of different models, this study adopts the same study period as the NCEP1 reanalysis to validate the model performance. The historical simulations from 20 CMIP6 models are used in the first experiments (r1i1p1f1). The r1i1p1f1 outputs atmospheric and oceanic simulations, while only the meridional winds and SST data are used. In order to verify the simulation capability of CMIP6 models for historical data and to match the resolution of reanalysis data, the atmospheric and oceanic data from CMIP6 models are linearly interpolated into the resolutions of 2.5°×2.5° and 2°×2°, respectively.
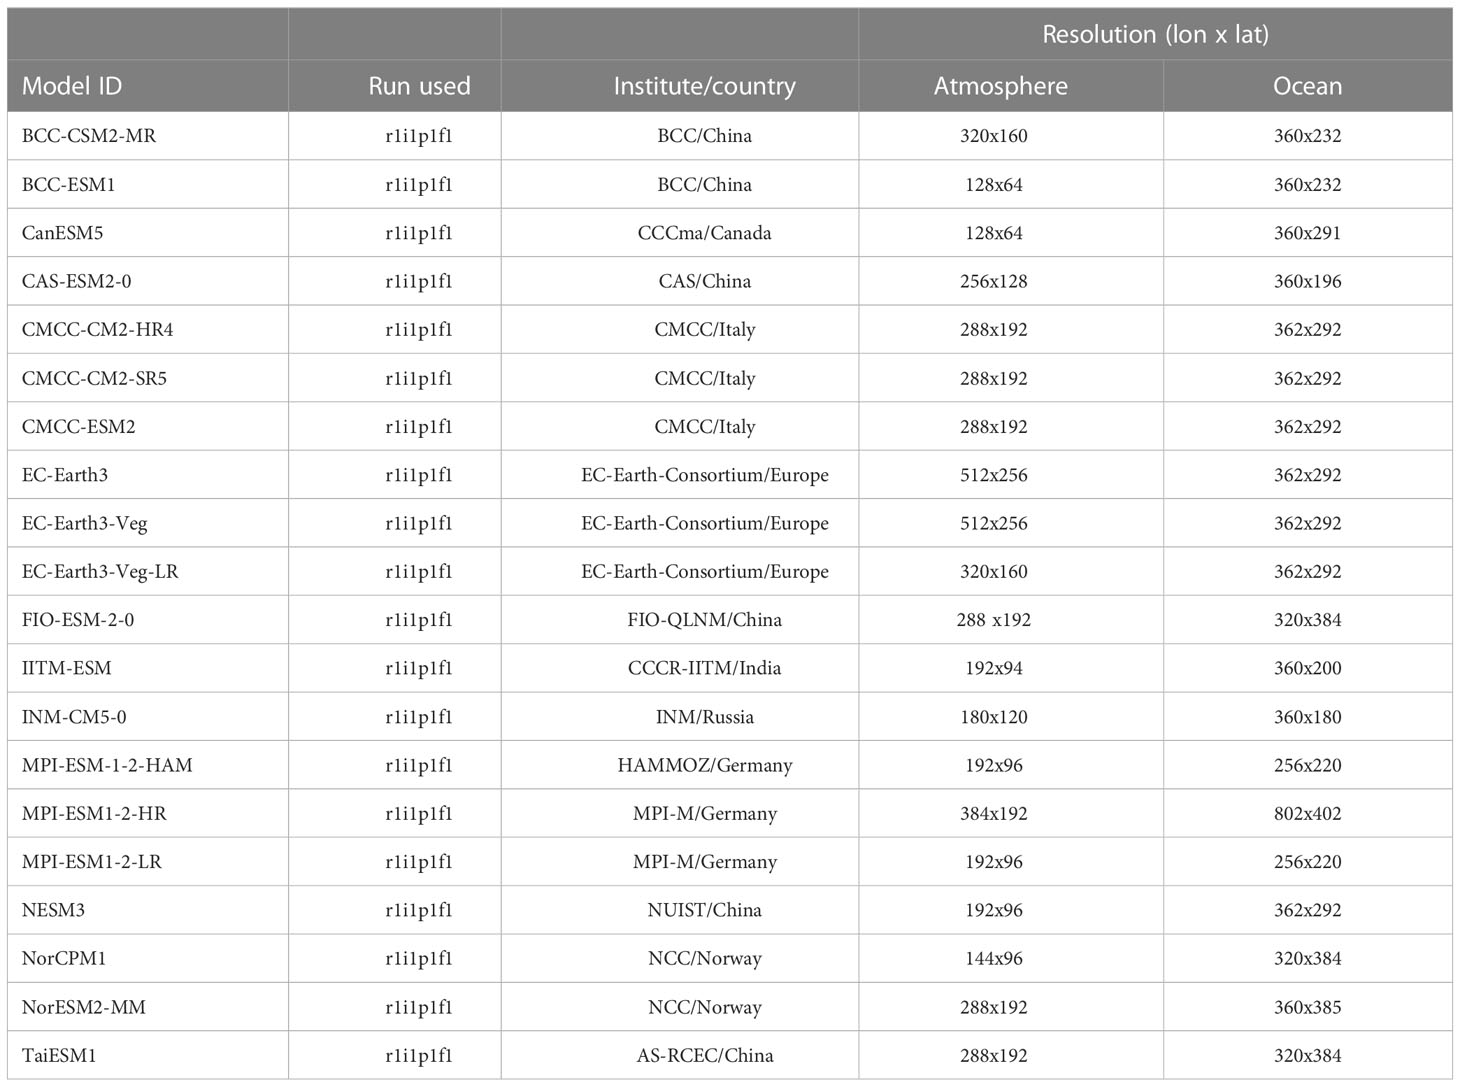
Table 1 Details of the CMIP6 models used in this study.
By computing the Mass Stream Function (MSF), the HC is described as follows (Li, 2001):
Where ∅ denotes the latitude; g denotes the gravitational acceleration; the meridional wind is denoted by v; the average radius of the Earth is denoted by R; an average latitude is represented by [·]; the superscript denotes the average over time.
To find out how SST and HC are related in different meridional structures, according to the method of Feng et al. (2016), it is necessary to divide SST and HC into two components: the equatorial asymmetry and the equatorial symmetry. For the HC, the equatorial asymmetry variations (HEA), and equatorial symmetry variations (HES) are defined as follows:
For the SST, the equatorial asymmetry variations (SEA) and equatorial symmetric variation (SES) are defined as follows:
For the equator, the latitudes of the Northern and Southern Hemispheres are represented by j and -j, respectively.
The empirical orthogonal function (EOF) analysis is also used, through which the first leading mode (EOF1) and corresponding time series (PC1) are obtained. Furthermore, the response ratio is determined using the following formula, developed by Feng et al. (2018).
where Reg () is the regression coefficient of PC1 between the two of HEA (HES) and SEA (SES). Which indicates how the HC responds to the SST depending on meridional structures.
In addition, the correlation analysis and linear regression analysis are employed, and the significance level is examined using the two-tailed t-test.
The capability of CMIP6 models in reproducing climatological HC is investigated firstly. Figure 1 illustrates the distribution of the climatological HC using the CMIP6 model outputs and reanalysis data. The reanalysis data show that there is an obvious three-loop circulation in each hemisphere, i.e., the tropical HC, the Ferrel cell, and the polar cell. The rising branch of the HC is located near the equator, the HC’s sinking branches are located around the 30° in each hemisphere, with the width of the SH branch being slightly larger than that of the NH. The 20 CMIP6 models can well capture the distribution features of the HC consistent with that of the reanalysis data (Figures B–U). In addition, there are little difference in the location and extent of the two circulation cells with those of the reanalysis data, which are consistent with the results using other reanalysis datasets (Stachnik and Schumacher, 2011). Using the NCEP1 reanalysis data as the reference, the Taylor diagrams reveal that there is a close relation between the simulations and observations, with the correlation coefficient exceeding 0.9 in terms of the spatial structures (Figure 2A). The spatial distributions of standard deviations show that the ratios of model simulations to observations fall within the range of 0.75 to 1.25, further indicating that the models can accurately simulate the HC’s spatial distribution features.
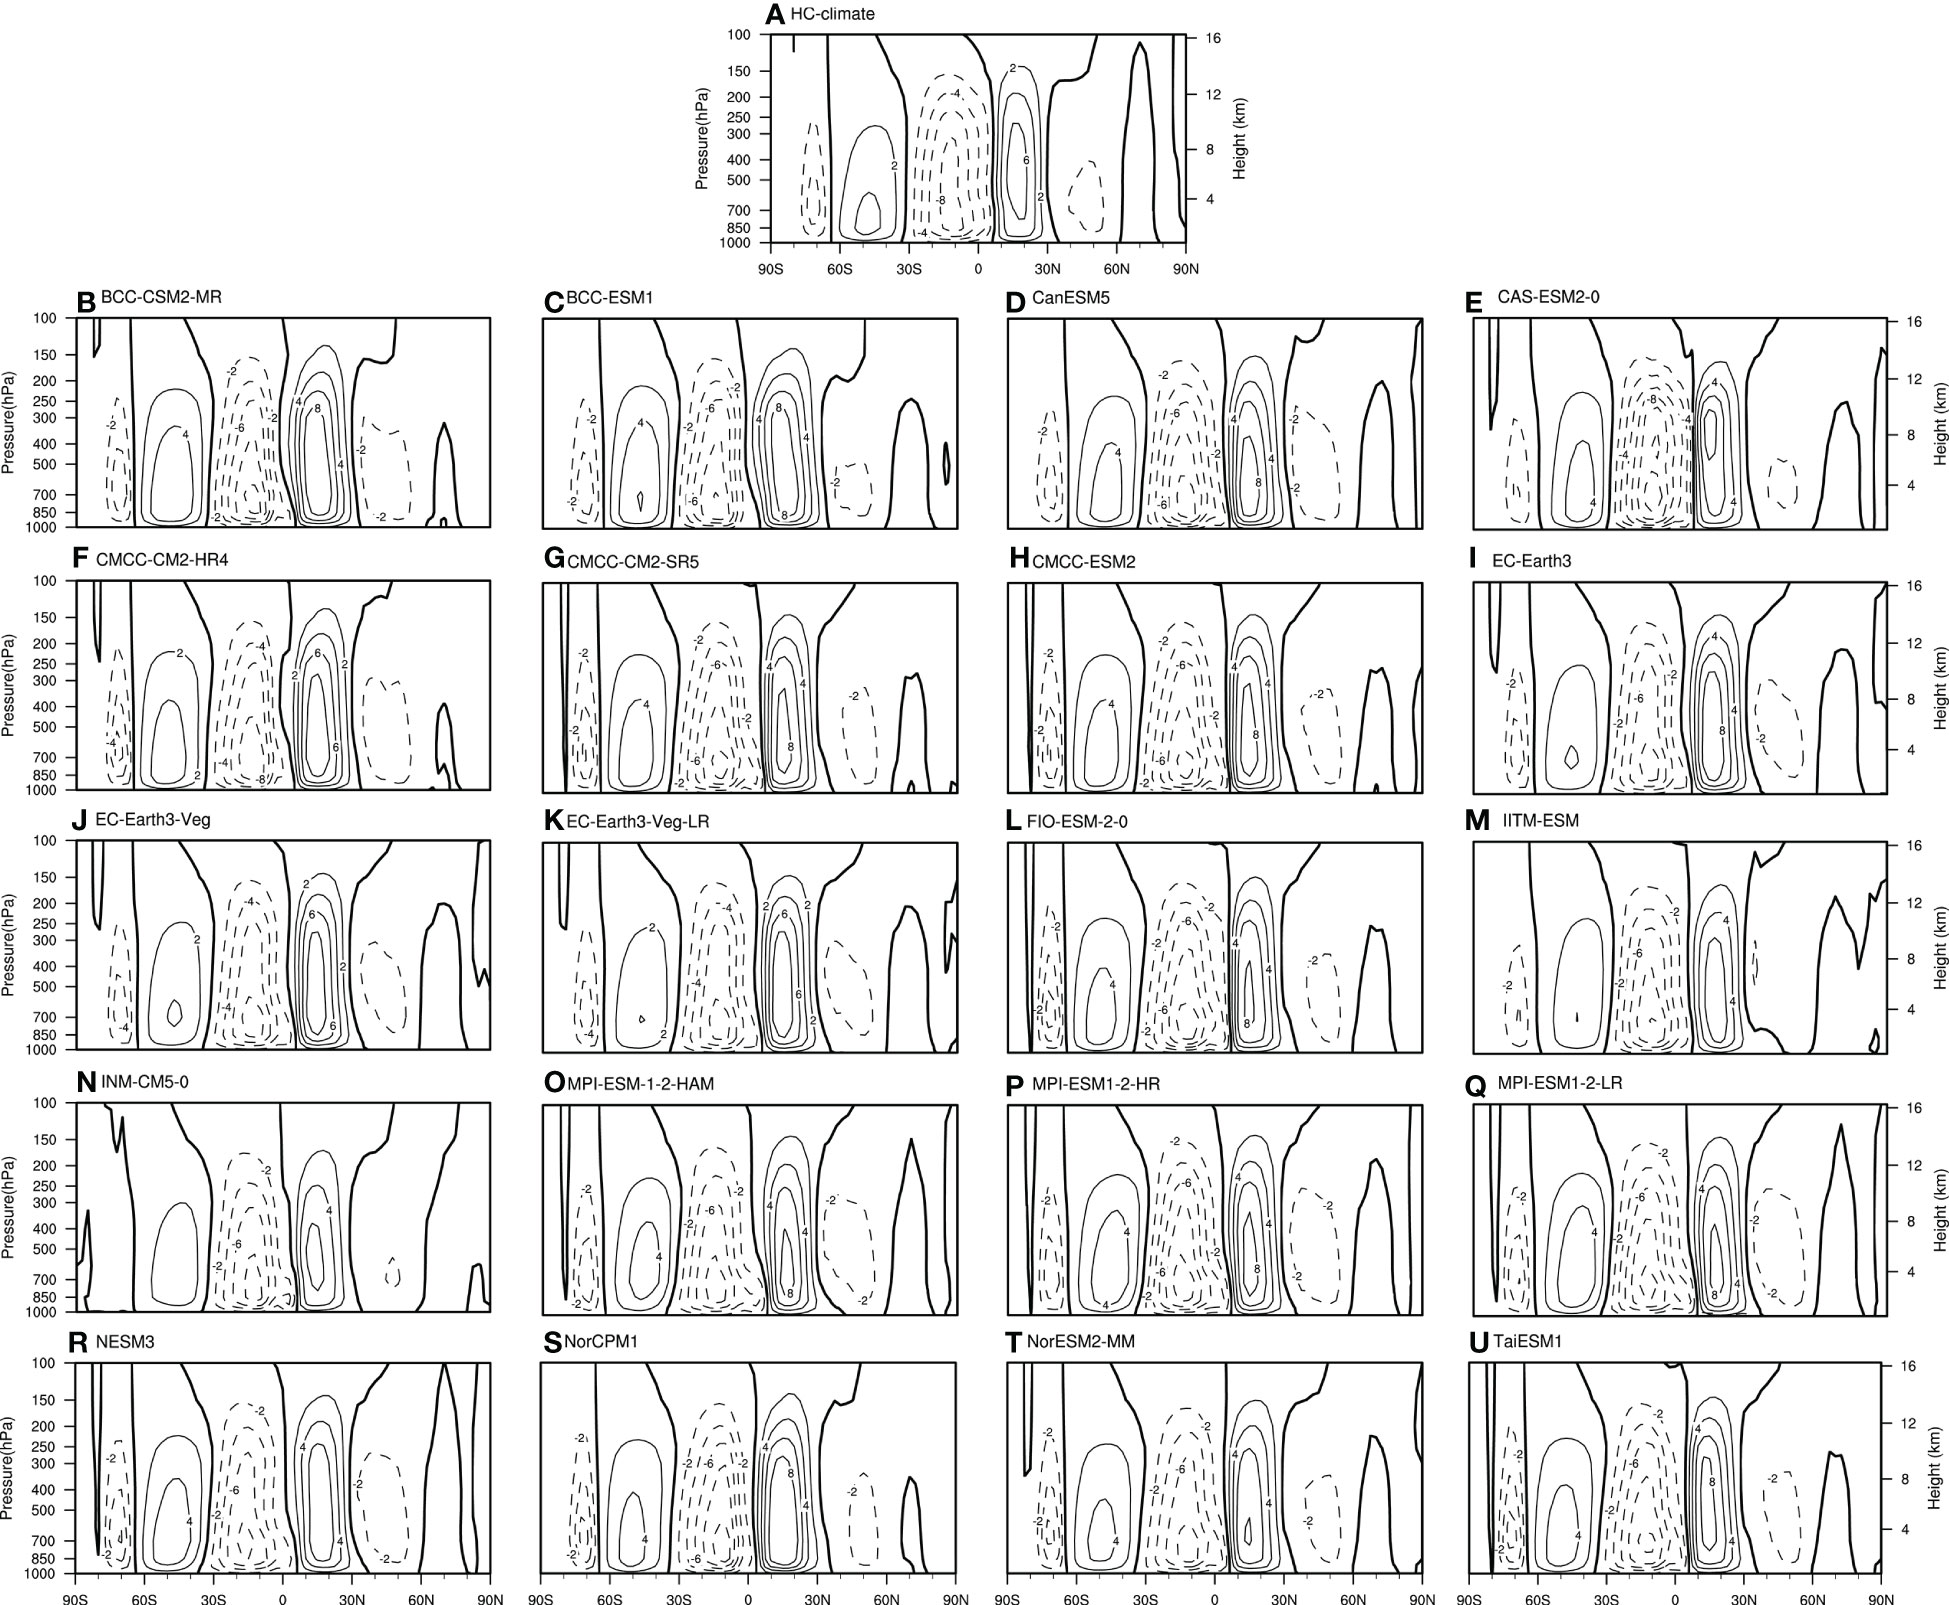
Figure 1 Climatological annual mean mass stream function (MSF) based on the (A) the National Centre for Environmental Prediction/National Centre for Atmospheric Research (NCEP/NCAR) reanalysis 1 (NCEP 1), (B–U) CMIP6 models during the period of 1948-2013. The contour interval is .The solid (dotted) contours are positive (negative).
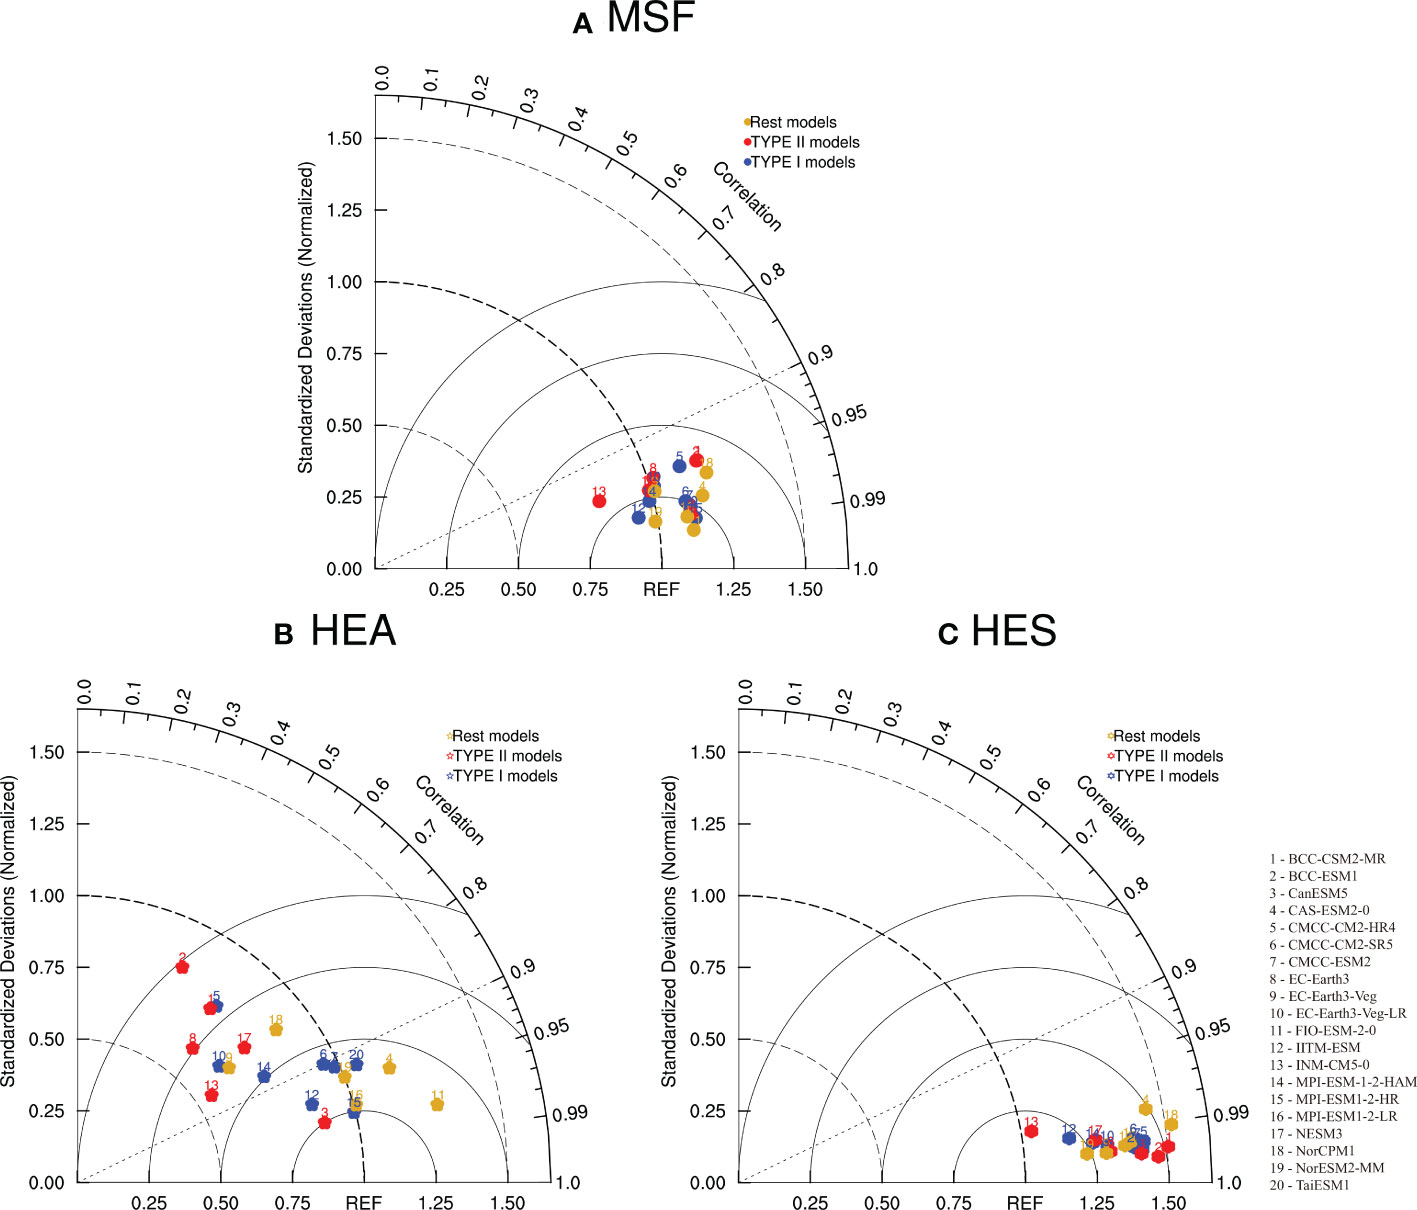
Figure 2 Taylor diagrams of the climatological mean (A) HC, (B) HEA and (C) HES. The numbers represent the identifiers for 20 models in CMIP6. The correlation coefficients and the ratios of the standard deviation of models to that of the observations are shown by the cosine of the azimuth angle and the radial distance, respectively. REF (based on the NCEP 1) on the horizontal axis indicates the reference point. The blue marks denote models of Type I, the red marks denote models of Type II, and the gold marks denote the rest models.
The CMIP6 models are further assessed for their ability to simulate HC under different meridional structures. Figure 3 displays the climatological HEA spatial distribution. For reanalysis data, the climatological HEA ranges from 20°S to 20°N, with rising branch located near 20°N, the sinking branch located near 20°S, and the maximum at the equator (Figure 3A). Most models can well simulate the spatial distribution of HEA. However, some models (BCC-CSM2-MR, BCC-ESM1, and CMCC-CM2-HR4) present opposite variations in the upper and lower troposphere, which are inconsistent with the reanalysis data. This can be further verified by the Taylor diagrams (Figure 2B), where the most models and the observations have correlation coefficients exceeding 0.8 in the spatial structure. However, except CAS-ESM2-0 and FIO-ESM-2-0, most models underestimate the variations of HEA. The model biases are mainly attributed to the following two aspects. Firstly, for the intensity of the south branch near the equator, most models, such as the CMCC-ESM2, MPI-ESM1-2-HR and NorESM2-MM, significantly underestimate the intensity of HEA. Secondly, some models overestimate the HEA extent, where the most obvious simulation bias is found in CAS-ESM2-0, with the simulated extent being 10° larger than that of the reanalysis data.
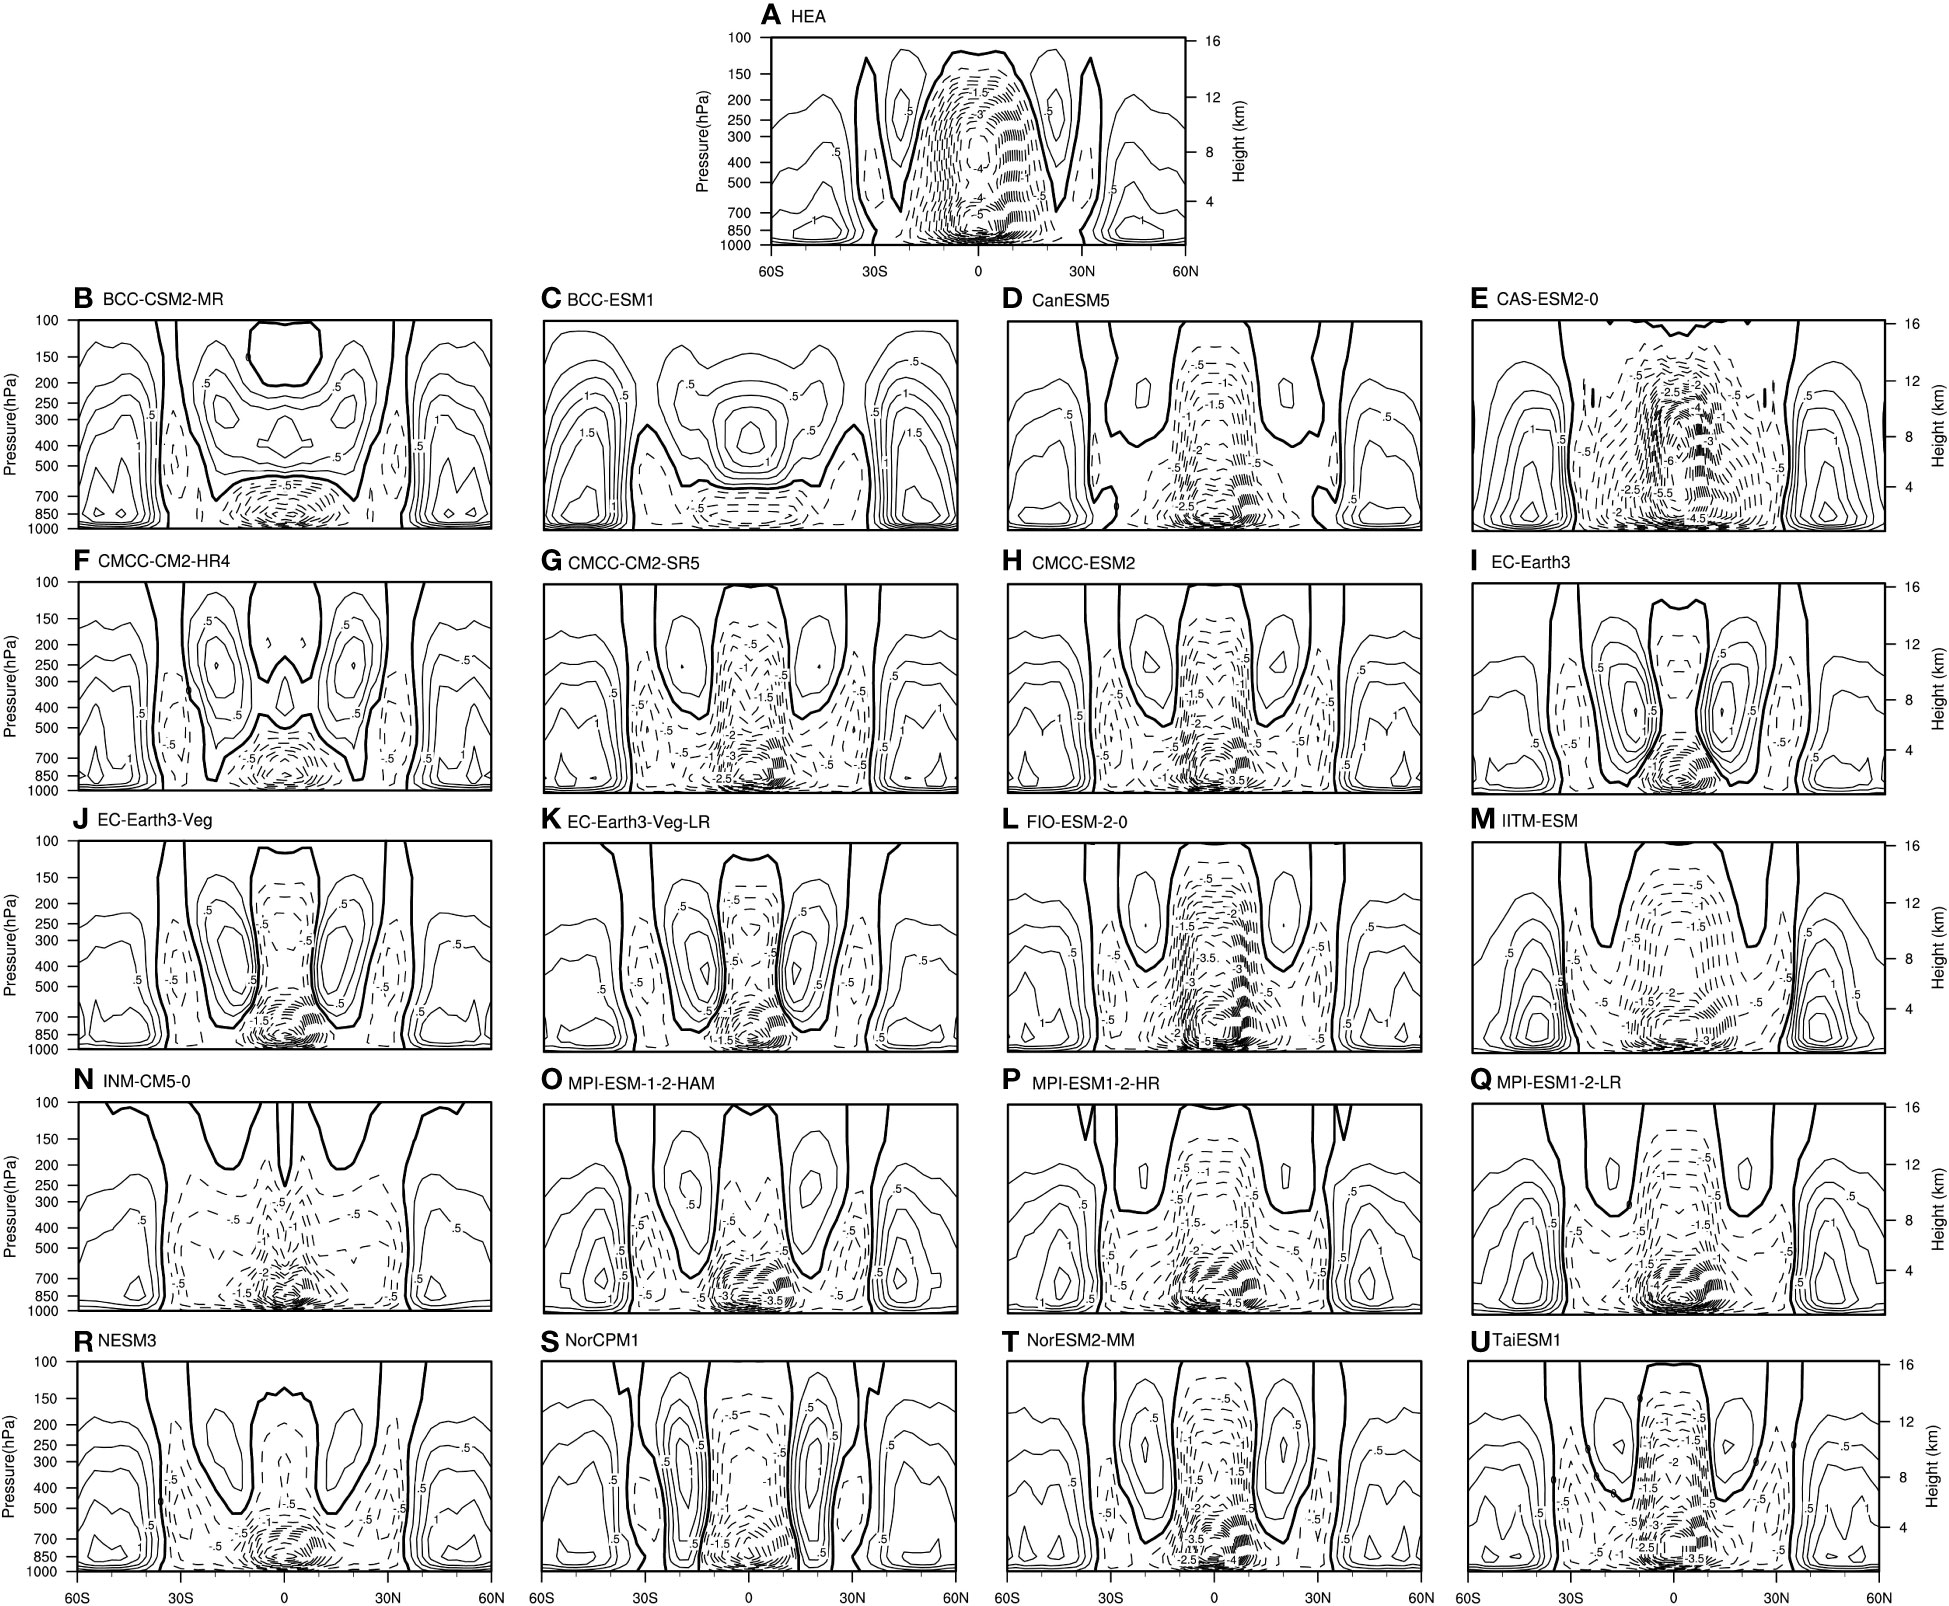
Figure 3 Same as in Figure 1, but for the HEA. The contour interval is .
The spatial structure of HES obtained from the reanalysis data displays a mirror distribution of the circulation cells with the equator as the boundary in each hemisphere. Specifically, the circulation cells in two hemispheres show consistent features in their intensity and extent, which are both within 30° latitude (Figure 4). The correlation coefficients between the simulations of the 20 CMIP6 models and the reanalysis data are all above 0.95 (Figure 2C). However, the intensity of all HES simulated by 20 models is obviously stronger than in reanalysis data. As confirmed by the Taylor diagram, all the ratios of the standard deviation of 20 models to the observations are greater than 1.0, indicating an obvious overestimation. In short, the majority of the 20 CMIP6 models can well capture the HC’s spatial characteristics under different structures, and the correlation coefficients between model-simulated results and observations can be maintained above 0.8, confirming the reliability of the CMIP6 model simulations. The model biases are mainly manifested in the simulated results of the spatial distribution of HEA. And compared with the CMIP5 models, the effect of the CMIP6 model has remarkably grown, especially the relationship in HES between the simulations and observations, with the correlation coefficient increasing from about 0.9 in the CMIP5 models to above 0.95 in terms of the spatial structure. Besides, the number of models in CMIP6 with the correlation coefficients exceeding 0.9 is remarkably increased compared with that in CMIP5 (Feng et al., 2019), which indicates that the simulation effect of the CMIP6 model has been dramatically improved compared with the CMIP5 model simulations with respect to the spatial structure of HC under different structures.
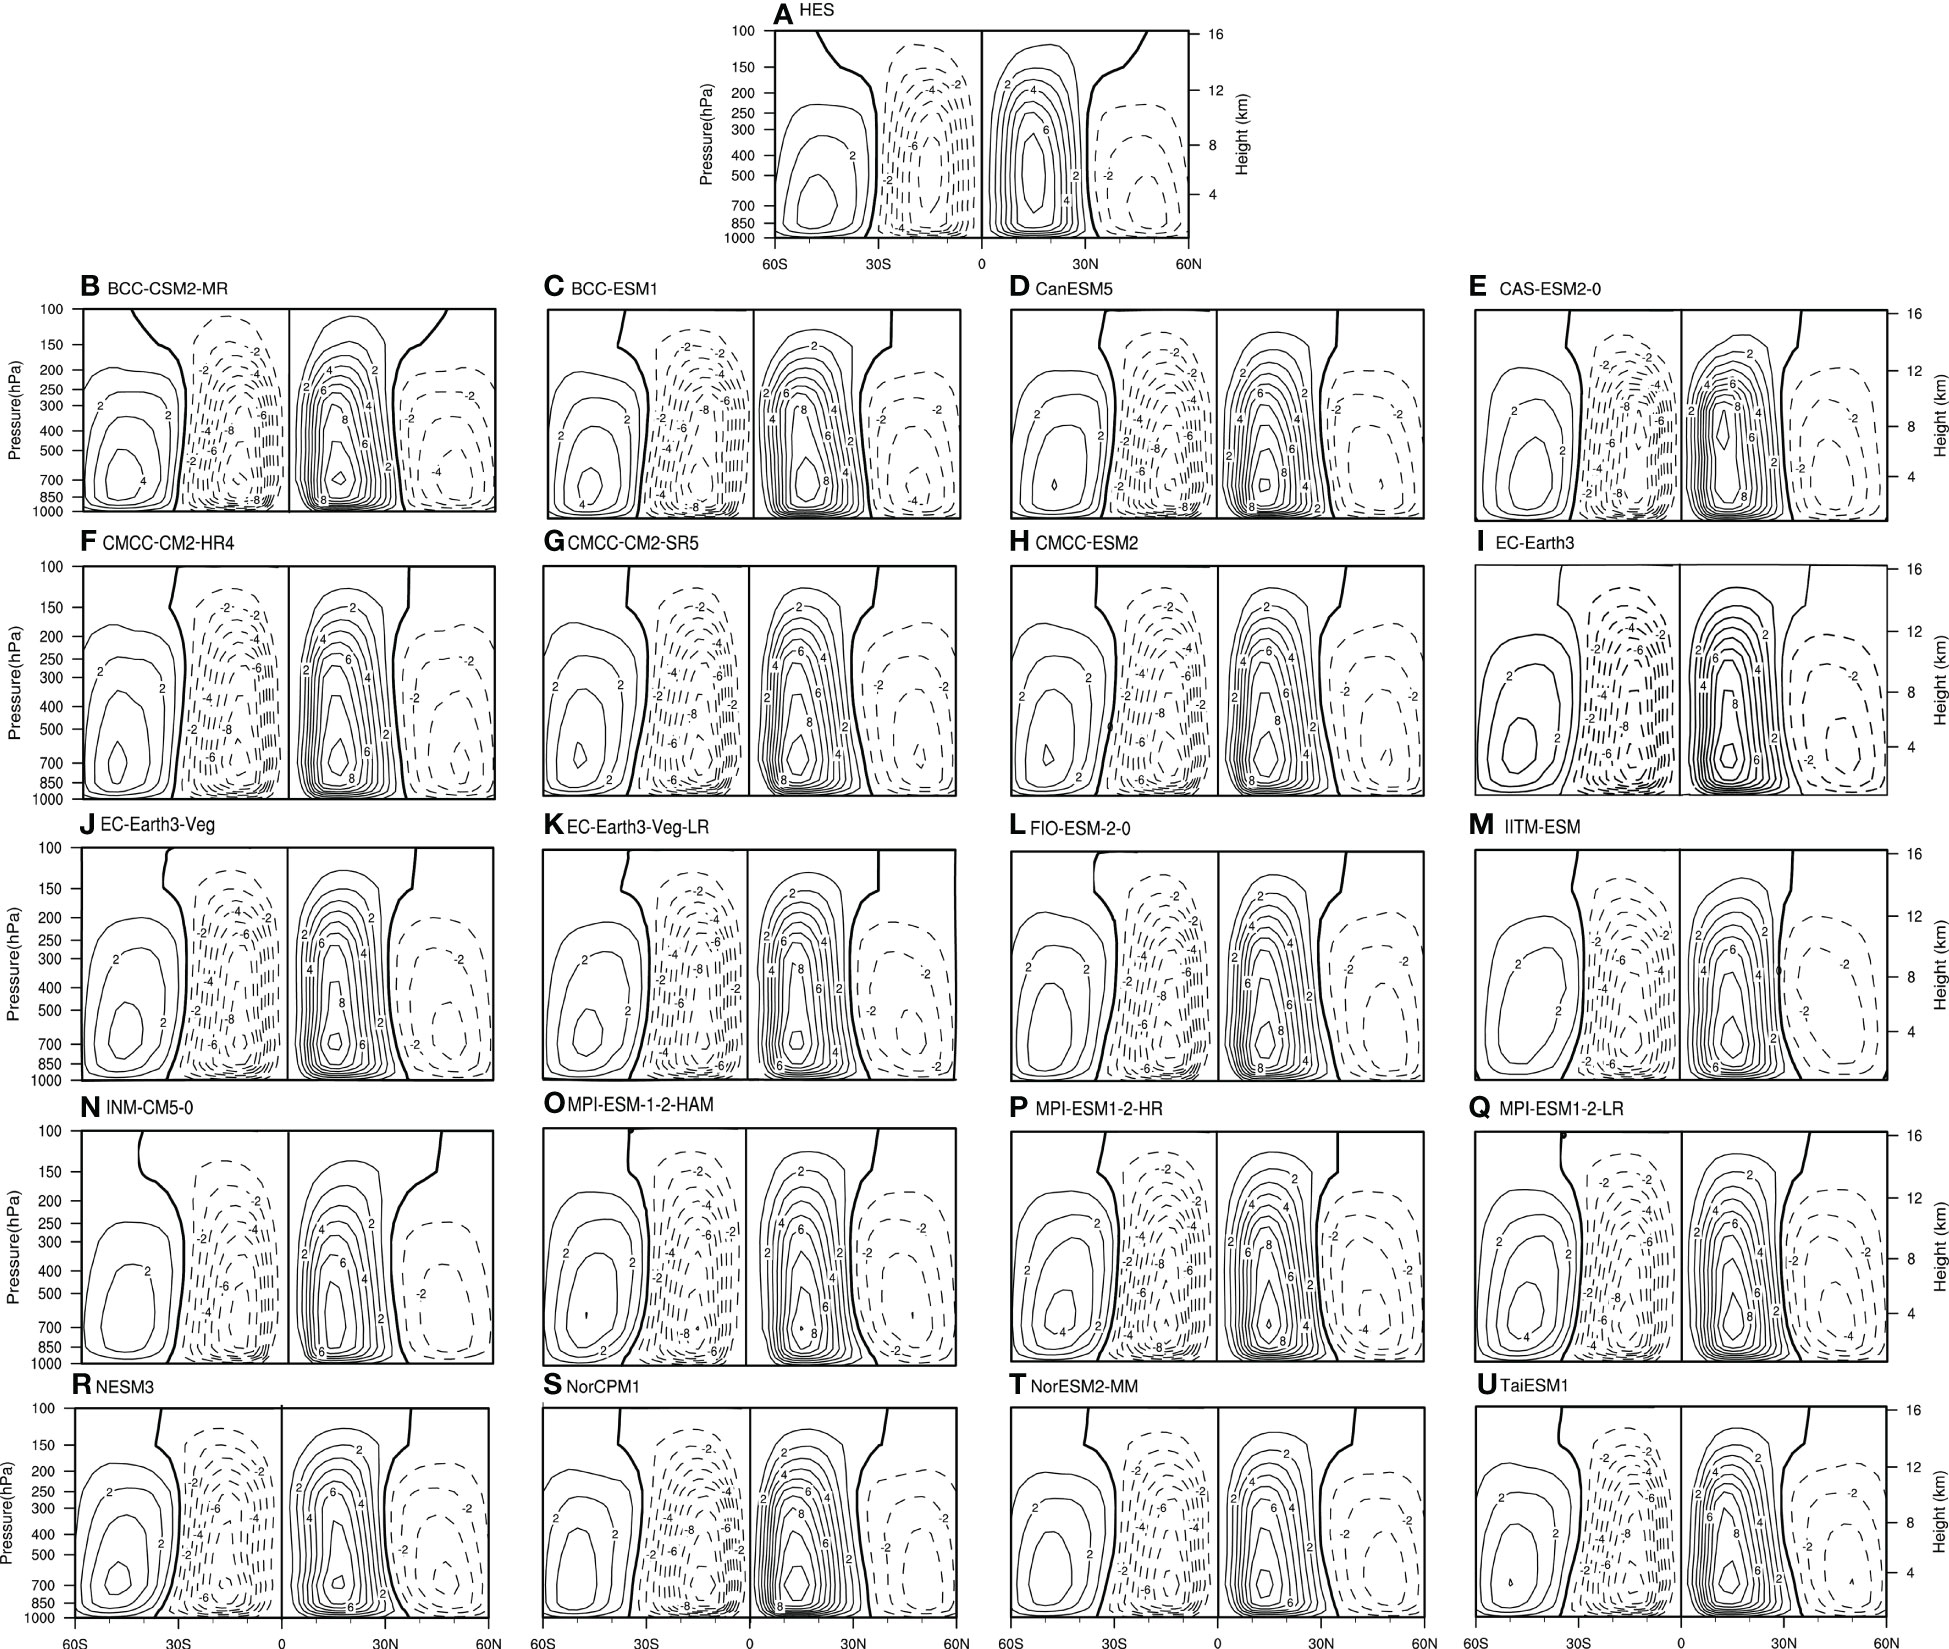
Figure 4 Same as in Figure 1, but for the HES. The contour interval is .
This section further evaluates the 20 CMIP6 models’ capability to reproduce the climatological tropical SST during 1948–2013. The reanalysis data reveals that there is a peak in the tropical SST in each hemisphere, with the NH peak greater than the SH peak. The stronger peak located in the NH coincides with the HC’s rising branch of the dominant mode located in the NH, which is consistent with the position of the annual mean ITCZ (An et al., 2015), and then the zonal mean tropical SST gradually decreases with the increasing latitude (Figure 5A). All 20 CMIP6 model simulations well capture the two peaks in tropical SST around the equator. High correlations between simulations and observations can also be found in the Taylor diagram, with all correlation coefficients exceeding 0.9. Most model simulations maintain a standard deviation ratio of roughly 1.0 between observations and simulation results, indicating small simulation biases (Figure 6A). Some individual models, such as the BCC-CSM2-MR, CMCC-CM2-HR4 and IITM-ESM, can well simulate the peak in each hemisphere, but fail to capture the feature that the NH peak is stronger than the SH peak. All 20 CMIP6 models successfully reproduce the spatial features of SEA and SES with high accuracy, indicating that these models can well simulate different SST meridional structures (Figure 7), with most simulation results-observation correlation values exceeding 0.9 (Figures 6B, C). The SES has a peak in each hemisphere and the SEA has increasing with latitude from south to north, and between simulations and observations, the correlation coefficients reach 0.95 or higher, which performs well than the CMIP5 models. The simulation bias for SEA is mainly reflected in the simulation of its increasing trend. Most models generally underestimate the increasing trend of tropical SEA with the increasing latitude, which can also be verified by the Taylor diagram (Figure 6B). The simulation bias for SES is manifested in its intensity, with a large dispersion among models (Figure 6C).
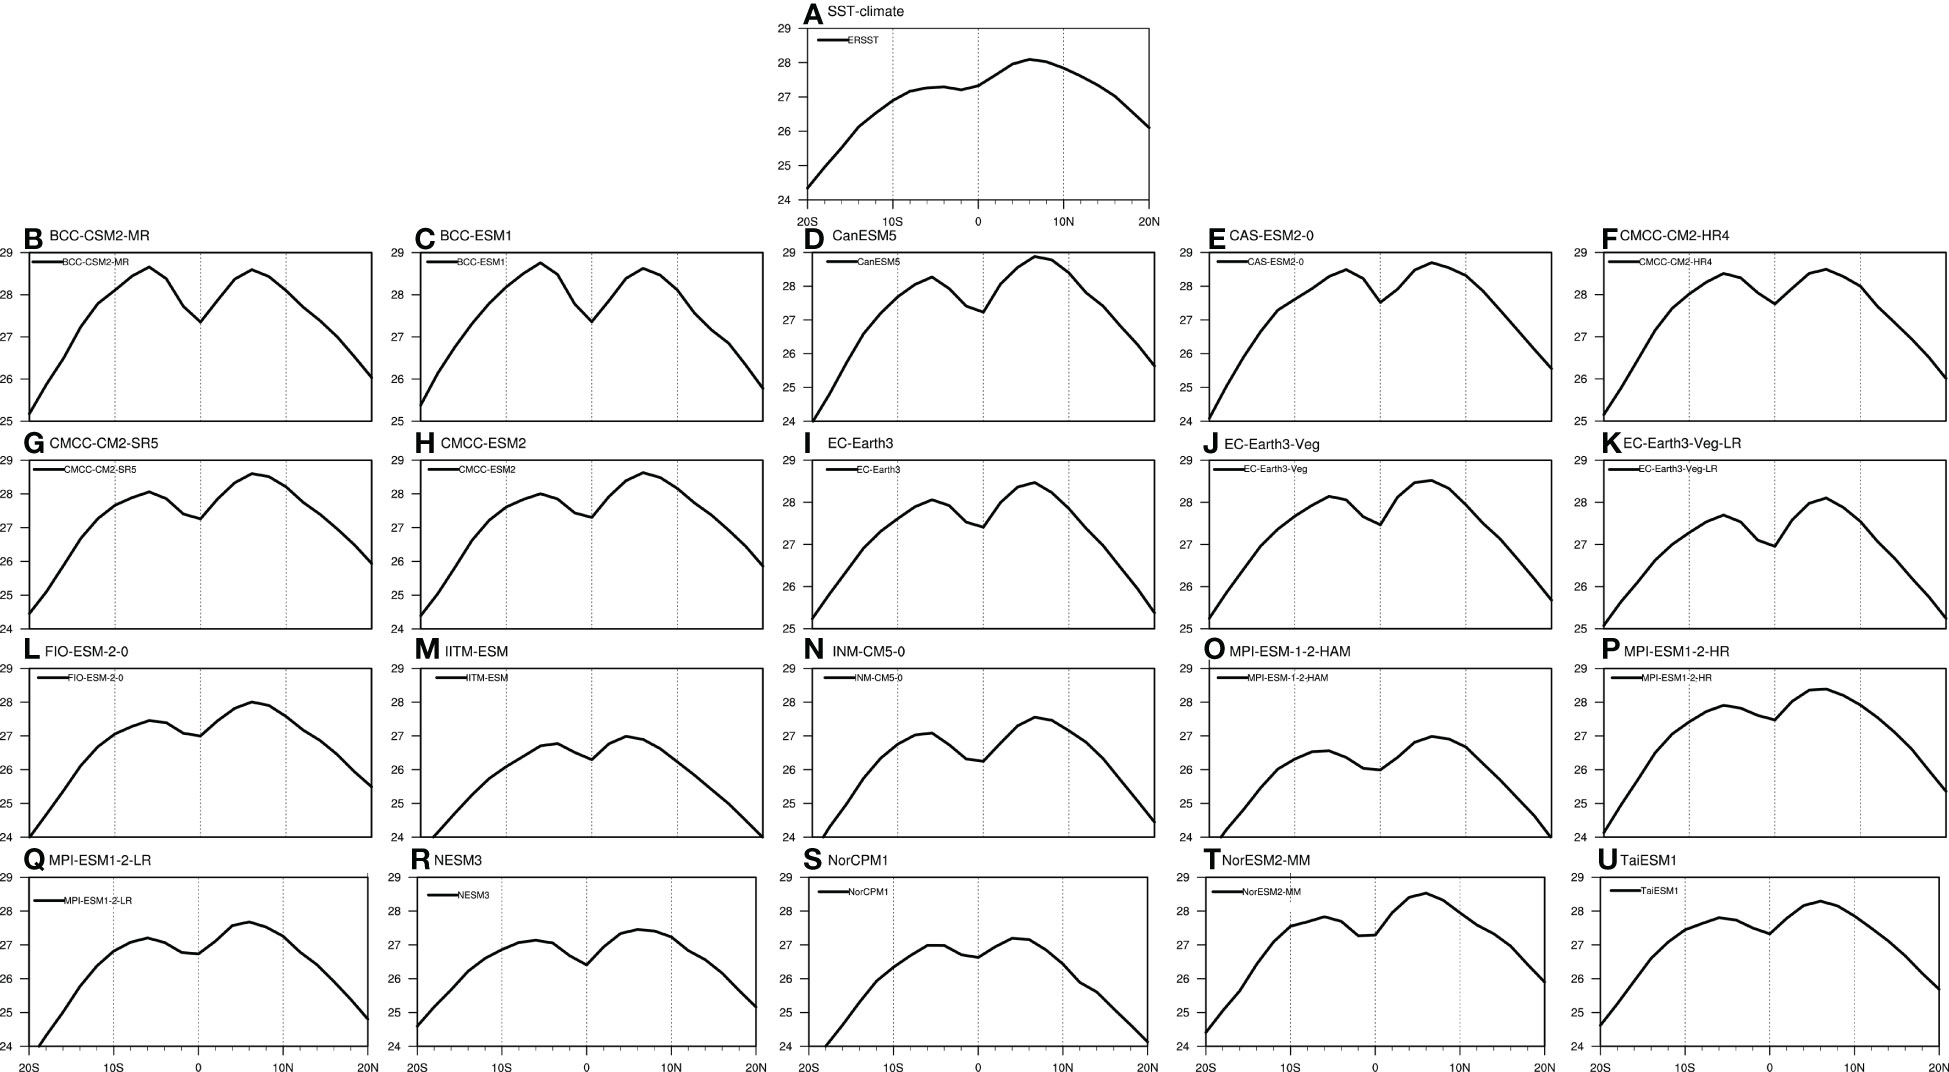
Figure 5 Climatological zonal mean tropical SST (°C) based on the (A) NCEP1, and (B–U) CMIP6 models during the period of 1948-2013.
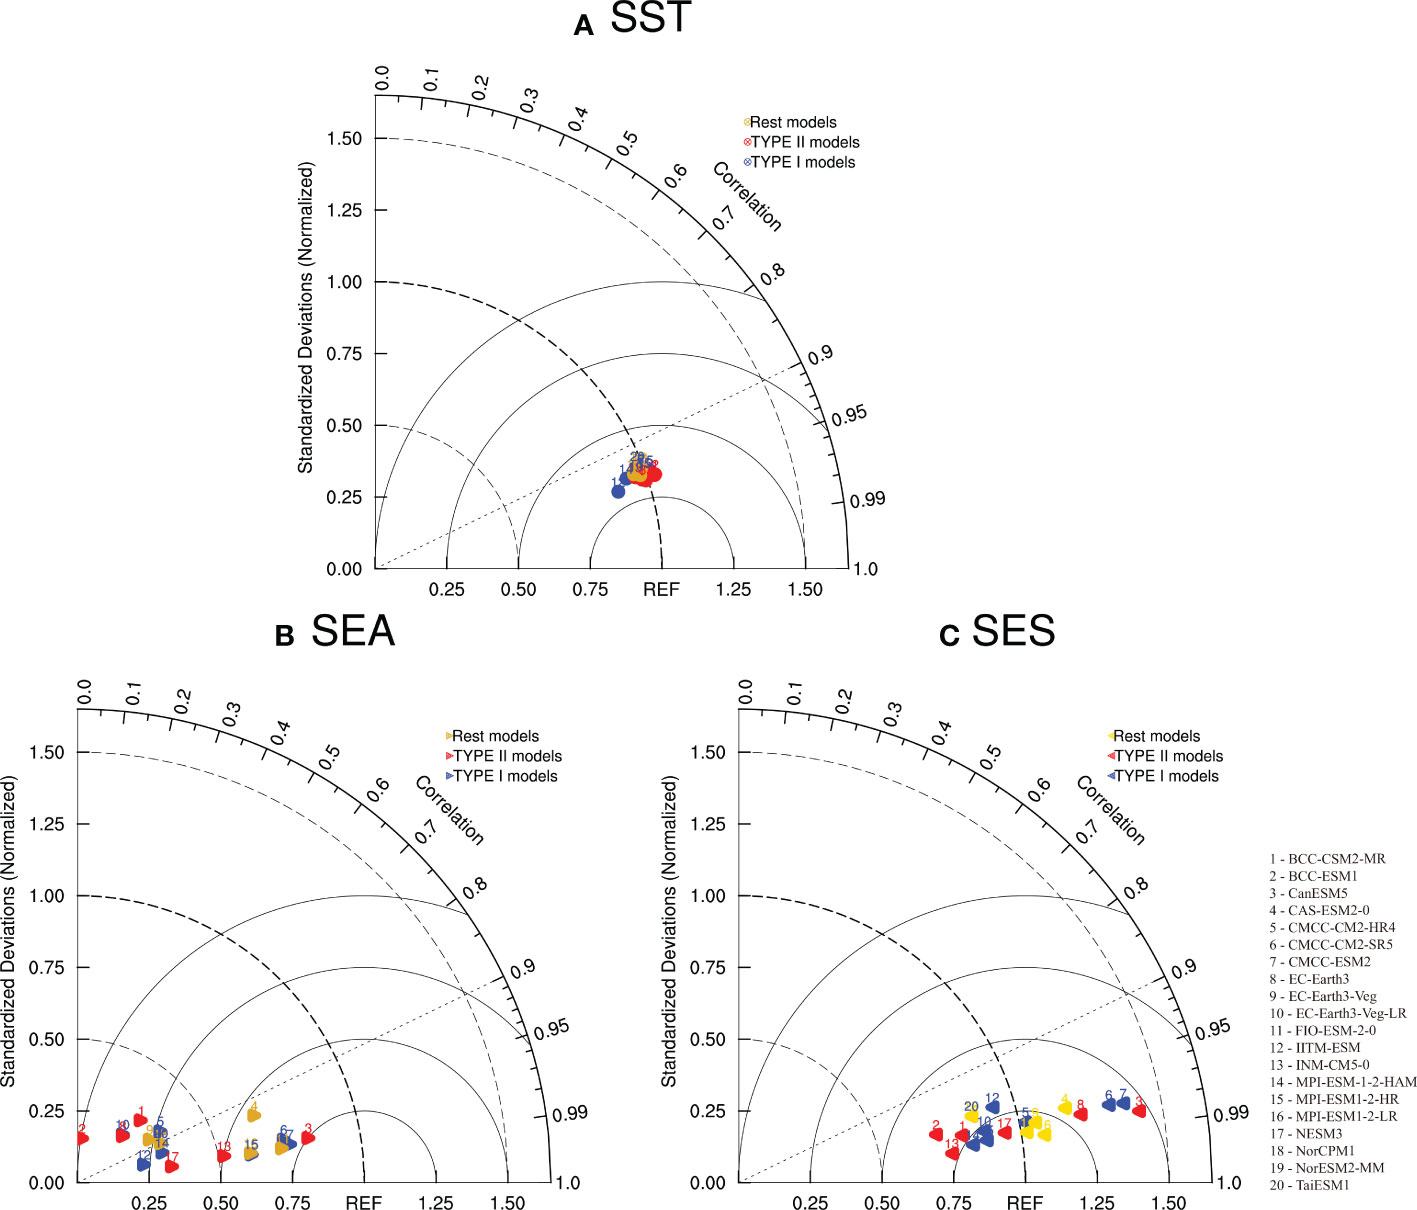
Figure 6 Taylor diagrams of the climatological mean (A) SST, (B) SEA, and (C) SES. The numbers represent the identifiers for 20 models in CMIP6. The correlation coefficients and the ratios of the standard deviation of models to that of the observations are shown by the cosine of the azimuth angle and the radial distance, respectively. REF (based on the Extended Reconstructed Sea Surface Temperature Version 5 of the National Oceanic and Atmospheric Administration) on the horizontal axis indicates the reference point. The blue marks denote models of Type I, the red marks denote models of Type II, and the gold marks denote the rest models.
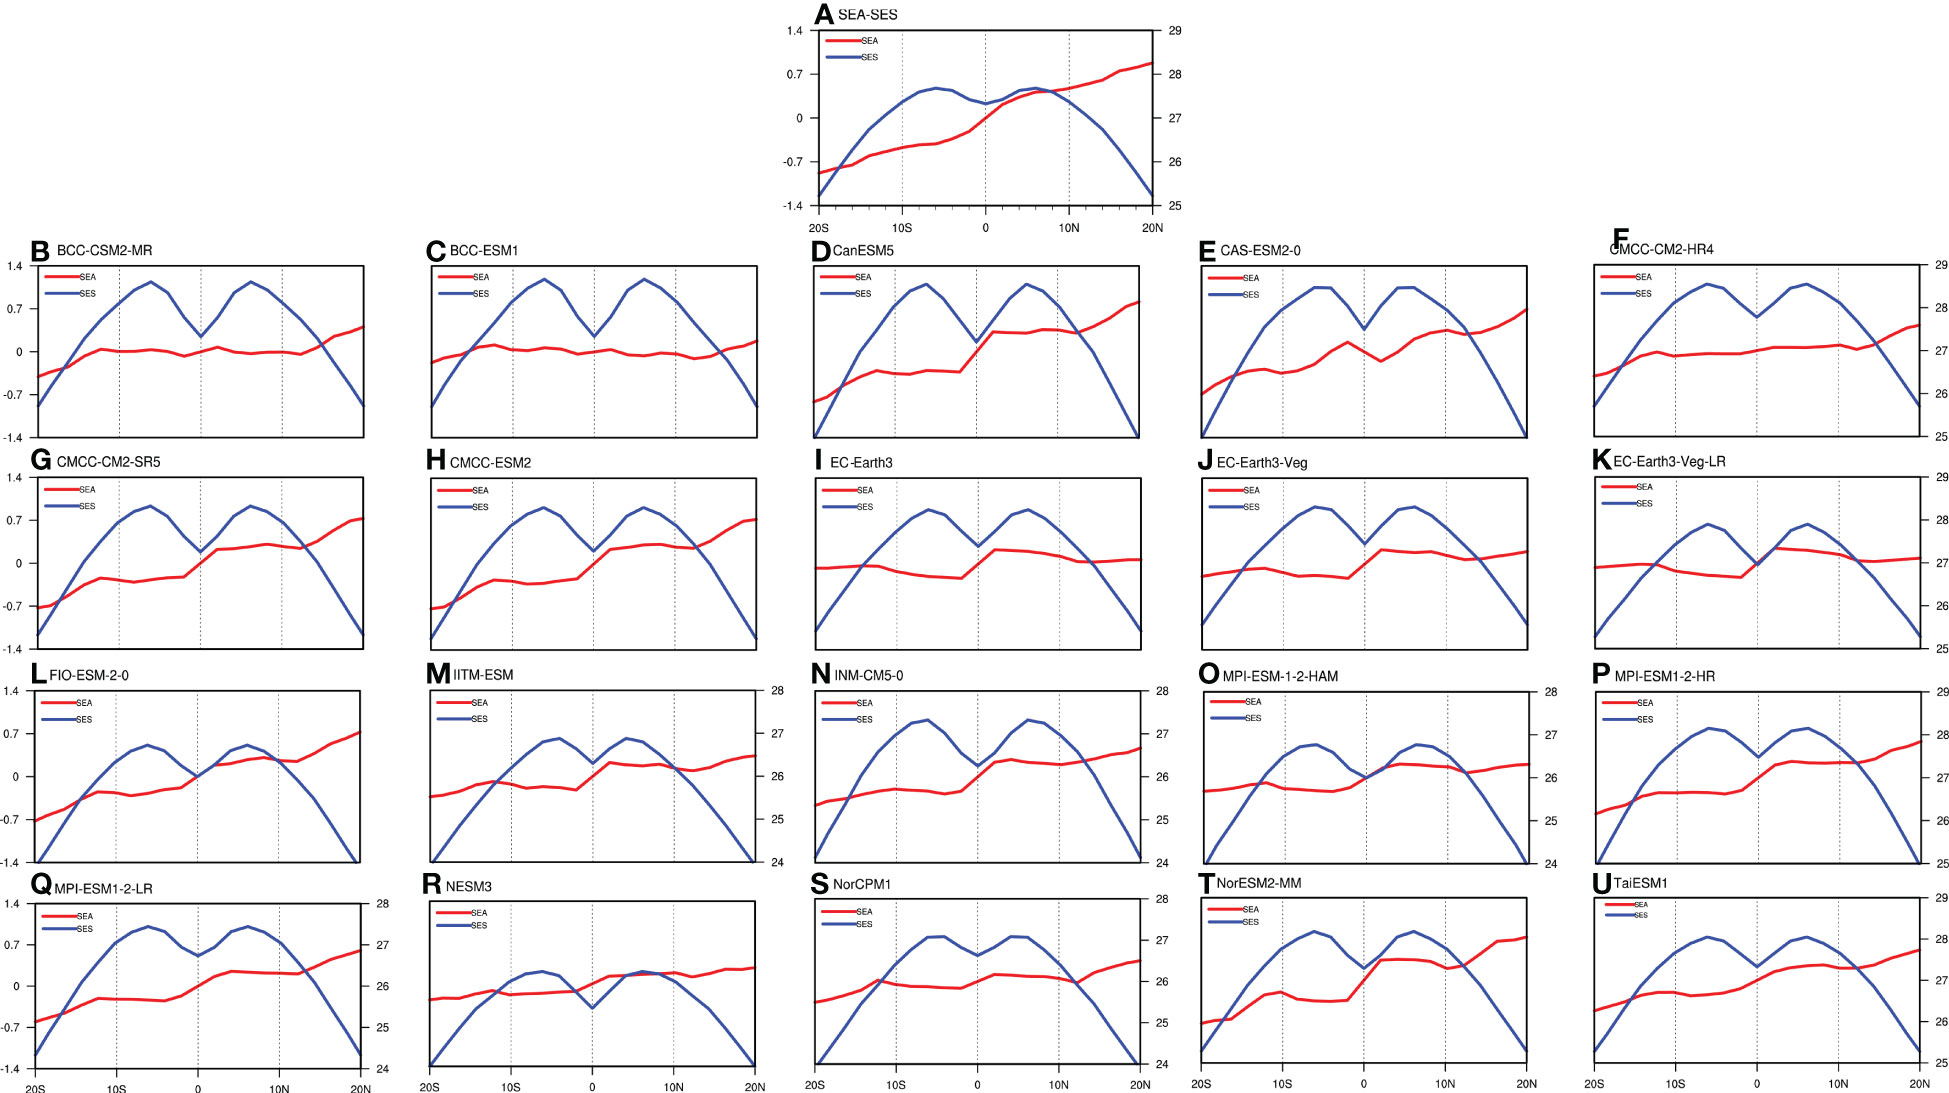
Figure 7 Same as in Figure 5, but for the SEA (red line; °C) and SES (blue line; °C).
In short, the correlation coefficients between simulations and observations could be maintained above 0.9 for most models, suggesting that the CMIP6 models can accurately simulate the tropical SST distributions under different meridional structures. In addition, the CMIP6 models’ performance is better in simulating the equatorial symmetric part than the equatorial asymmetric part, indicating an improvement compared with its previous phases (CMIP3–CMIP5). Similarly, Song et al. (2020) also found that the SST simulations by CMIP6 models have been improved in the equatorial East Pacific region compared with CMIP5 model simulations.
The above assessment of the CMIP6 models’ capability to simulate the climatological HC and tropical SST offers a basis for assessing the effect of models to simulate the variability of HC and tropical SST. Figure 8 presents the EOF1 of HEA simulated by CMIP6 models. The reanalysis data reveals that the HEA EOF1 is found to be centered at the equator and extends about 20° north and south, with an explained variance of 76.3%. For CMIP6 models, note that the CAS-ESM2-0 performs rather poor in simulating the spatial distribution of HEA EOF1, and it is thus neglected in the following analysis (Figure 8E). All the remaining models can well simulate the distribution features of the asymmetric structure in the HEA EOF1, with the explained variance ranging from 39.4% to 84.2%. Specially, the explained variance reveals that the FIO-ESM-2-0, EC-Earth3, and EC-Earth3-Veg outperform the CMIP5 models in simulating the dominant mode (Feng et al., 2019). The spatial structure between simulations and observations has correlation coefficients ranging from 0.32 to 0.88, as shown in the Taylor diagram. The reanalysis data revealed that the EOF1 of HES presents a mirror distribution within 30° of both hemispheres, with an explained variance of 63.5% (Figure 9A). All 20 CMIP6 models can accurately simulate the circulation cell in both hemispheres, with the explained variance ranging from 31.6% to 84.1%, and the correlation coefficients ranges from 0.32 to 0.57 with respect to the spatial structure. Besides, there are biases in model simulations of the intensity and extent of the circulation cell. For HEA EOF1, some models overestimate the intensity of the circulation cell. For HES EOF1, some models underestimate its spatial extent, being 10 latitudes narrower than the reanalysis data. Comparatively, the models perform better in simulating the HEA EOF1 than the HES EOF1 with respect to their spatial structures.
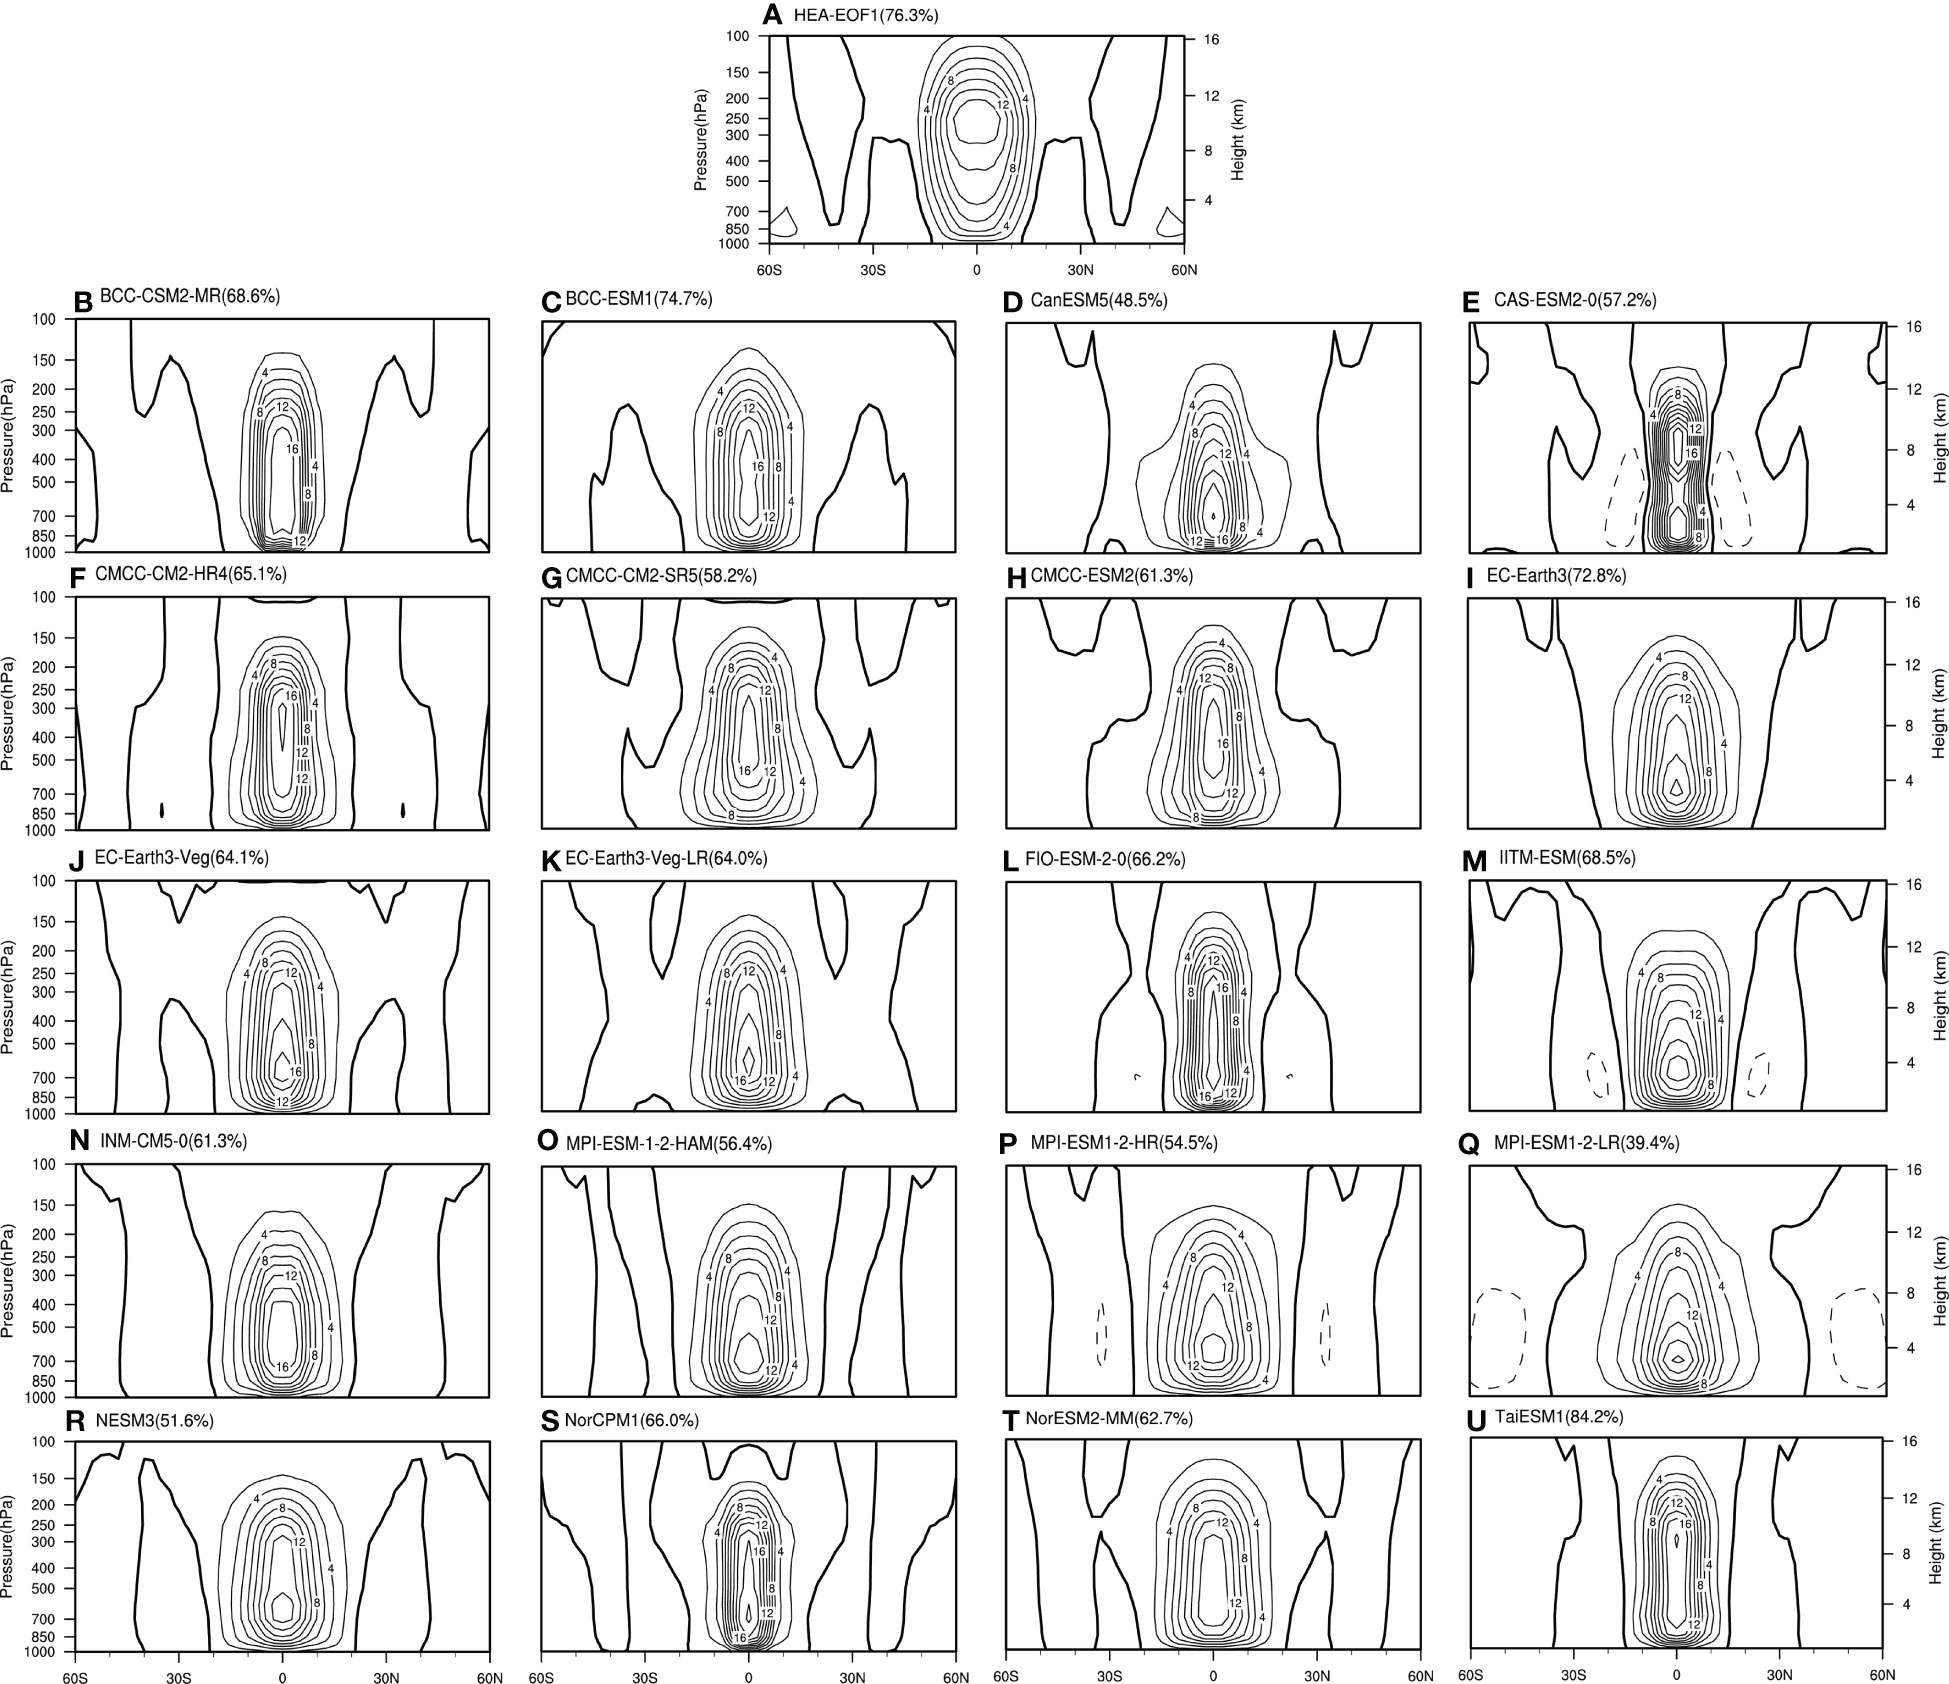
Figure 8 The first leading mode of empirical orthogonal function analysis (EOF1) for the annual mean HEA based on the (A) NCEP 1, (B–U) model simulations during the period of 1948-2013. The contour interval is . The solid (dotted) contours are positive (negative).
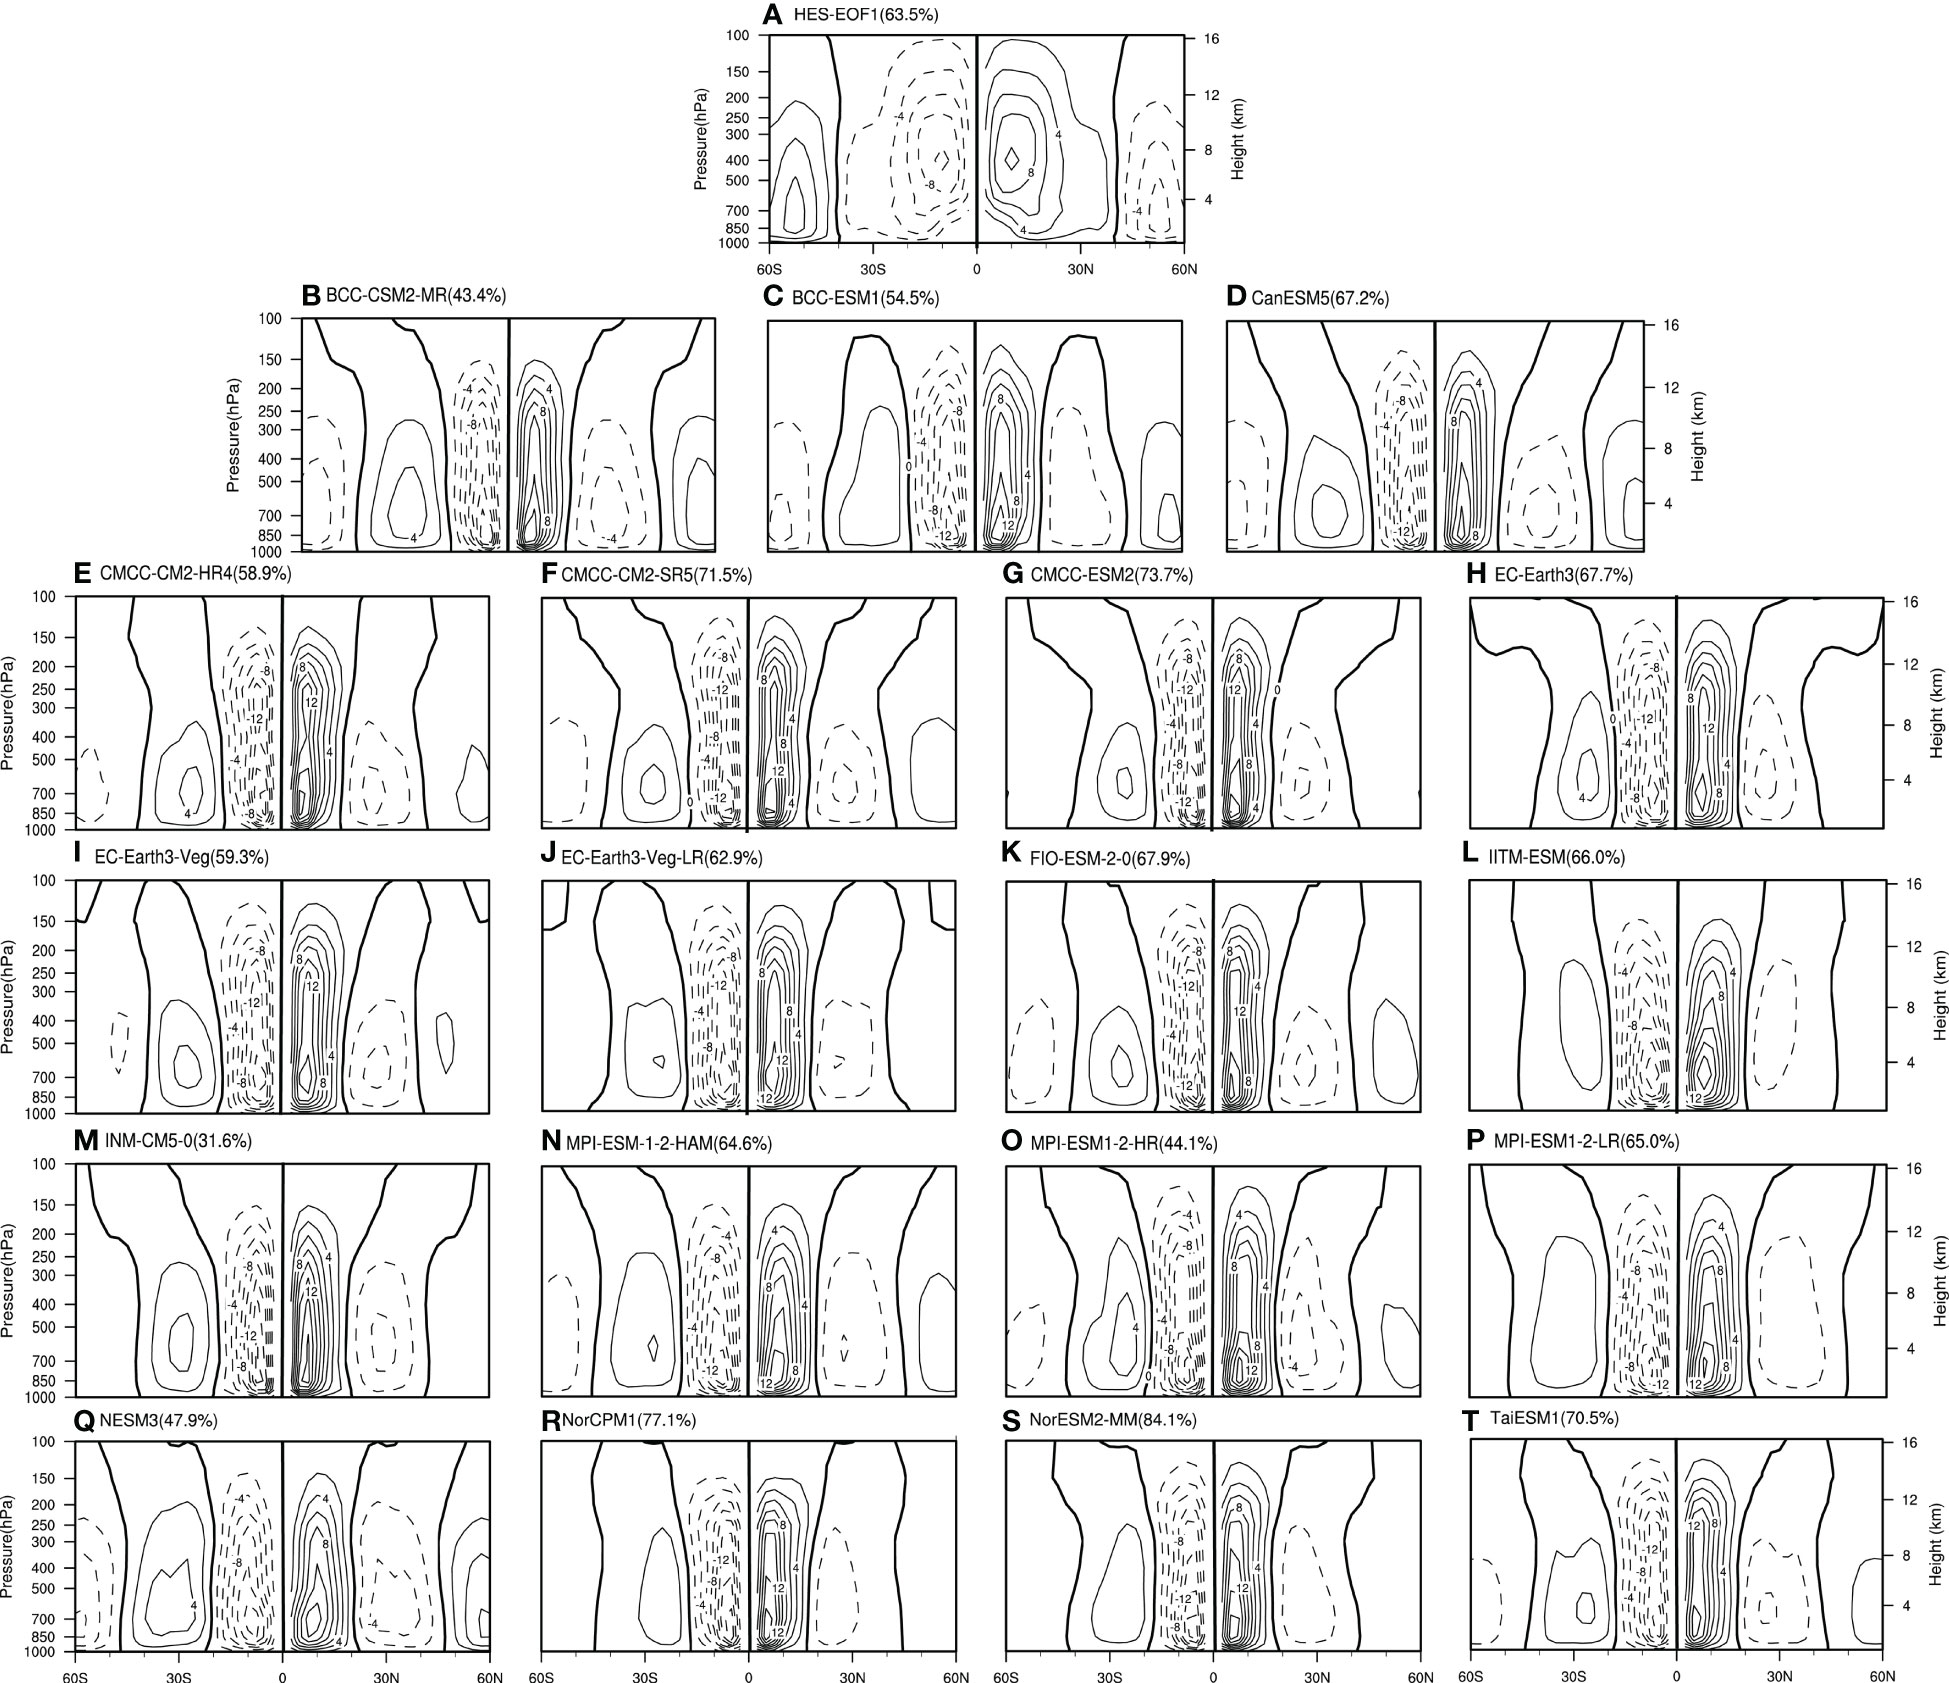
Figure 9 Same as in Figure 8, but for the HES. The (B–T) represent the model simulations.
Further analyses the CMIP6 models’ capacity to simulate tropical SST under different meridional structures (Figure 10). The observations of the SEA EOF1 reveal a positive pattern in the SH and a negative pattern in the NH, and that pattern decreases with increasing latitude, with an explained variance of 88.4%. While the SES EOF1 presents an equatorial symmetric structure with an explained variance of 94.6%. All CMIP6 models successfully reproduce distribution of the SEA EOF1 with an explained variance of 61.6%~83.8%, and the simulations and observations have a correlation coefficient exceeding 0.9 for most models. For SES EOF1, the models can basically reproduce its spatial structure, with the explained variance ranging from 76.4% to 94%, and the correlation coefficients are maintained above 0.9. However, there are some biases in simulating the amplitude of SES EOF1. For example, the models of EC-Earth3 and INM-CM5-0 underestimate the amplitude of SES EOF1, while the models of CMCC-CM2-SR5, CMCC-ESM2, and MPI-ESM-1-2-HAM overestimate the amplitude.
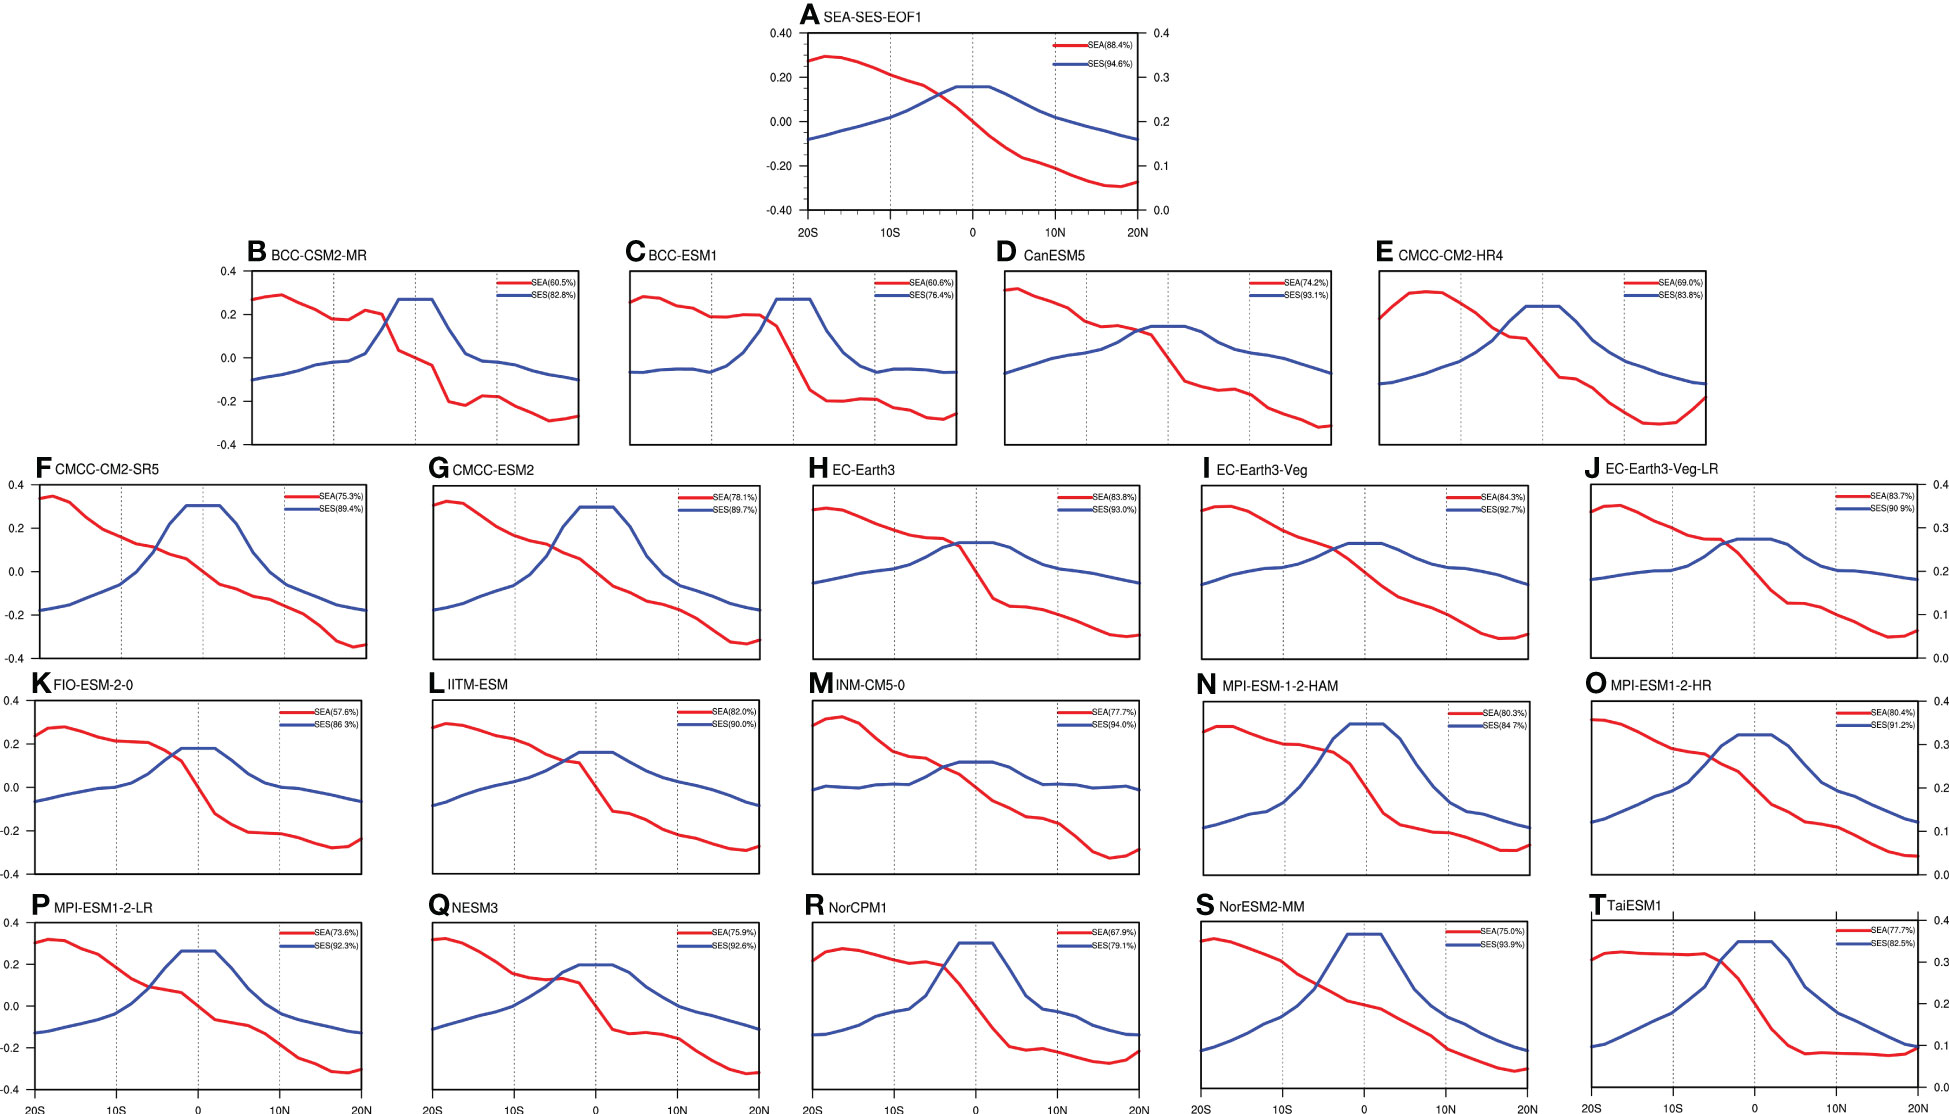
Figure 10 EOF1 of zonal mean SEA and SES (°C) based on the (A) NCEP 1, (B–T) model simulations during the period of 1948-2013. The red line indicates the SEA, and the blue line indicates the SES.
The above results show that, although the simulation effect of the variability of HC and SST under different meridional structures is reduced compared with the simulation of climatological means, the most of CMIP6 models can reproduce the distribution features of the EOF1 of the HC and SST. Furthermore, the simulation effect of CMIP6 models has been greatly improved over CMIP5 models. The above results confirm the models’ reliability in simulating the change of large-scale HC and tropical SST, which provides a foundation for subsequent evaluation of the relationships between HC and tropical SST under different structures.
This section analyzes whether the CMIP6 models can reproduce the high correlation between the HC and tropical SST. Figure 11A illustrates the correlation coefficients of the HC and tropical SST with different meridional structures for different models. According to the reanalysis data, the HEA (HES) and SEA (SES) are greatly related, with the correlation coefficient exceeding 0.68. With the correlation coefficient between 0.55 and 0.84, 85% of the models exhibit significant correlation between HEA and SEA. Similarly, half of the models can reproduce the strong connection between the HES and SES, with correlation coefficients between 0.59 and 0.89. The HEA-SEA multi-model average correlation coefficient is 0.63, which is better than the correlation coefficient of 0.51 for that the HES-SES. The above results illustrate that the models can simulate the relation between HC and SST under different meridional structures. The ability of the 19 models to simulate the correlation between the HC and SST under different structures is further analyzed as shown in Table 2 and Figure 11B. The reanalysis data shows that the HC to SST response ratio is approximately 6 for the different structures. For simulations, the response ratios are above 4.0 for more than 80% of CMIP6 models. Specifically, six models exhibit obvious biases with the response ratios exceeding 10, which are BCC-CSM2-MR, BCC-ESM1, CanESM5, EC-Earth3, INM-CM5-0 and NESM3. Eight models are close to the reanalysis data with difference being less than 20%, which are CMCC-CM2-HR4, CMCC-CM2-SR5, CMCC-ESM2, EC-Earth3-Veg-LR, IITM-ESM, MPI-ESM-1-2-HAM, MPI-ESM1-2-HR and TaiESM1. The remaining five models, including (CMCC-ESM2, FIO-ESM-2-0, etc.) are omitted in the following analysis.
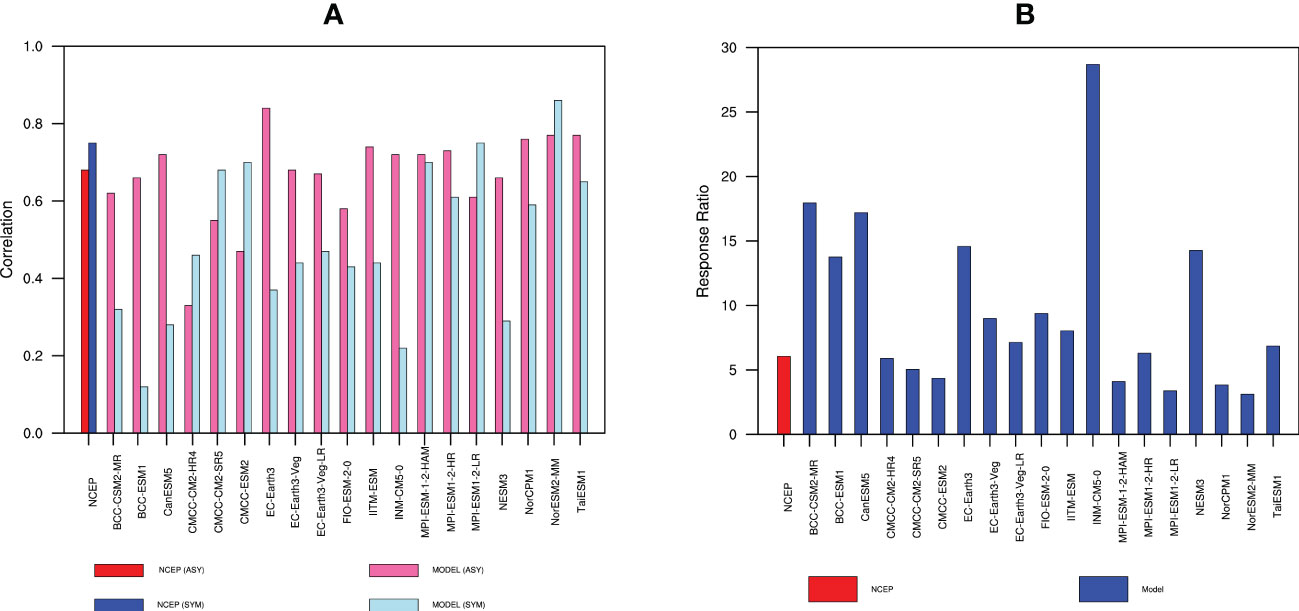
Figure 11 (A) Correlation coefficients between HEA (HES) and SEA (SES) for observations (red bar and blue bar) and model simulations (hot pink bar and light blue bar) during the period of 1948-2013. (B) The response ratios of HEA (HES) to SEA(SES) for observations (red bar) and model simulations (blue bar) during the same period.
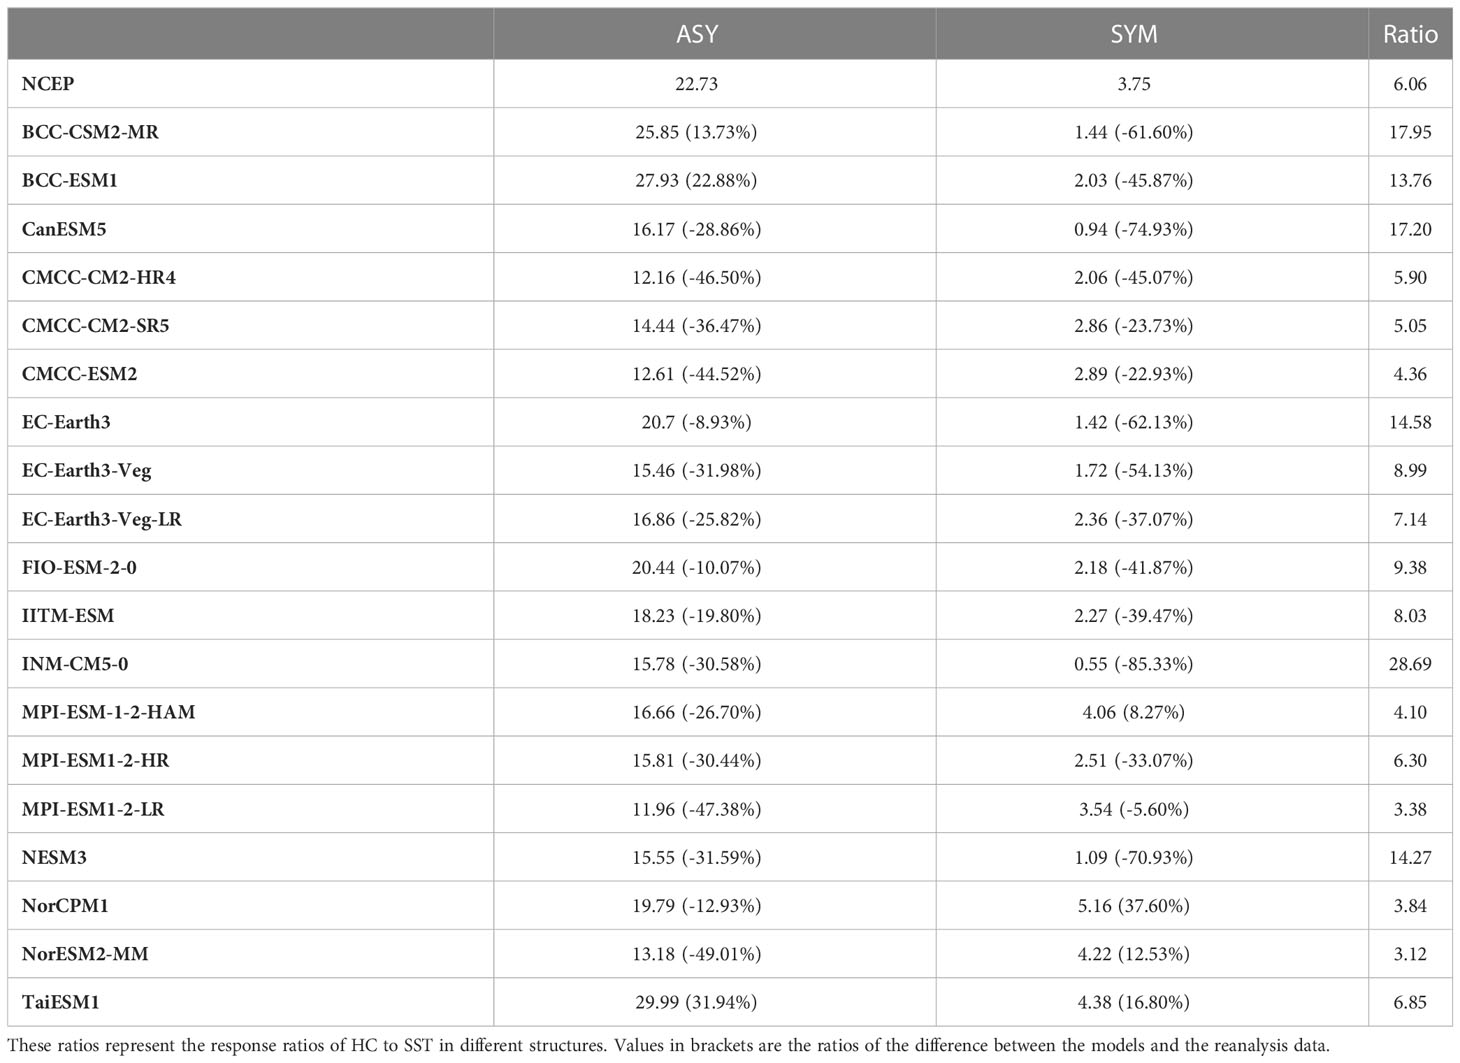
Table 2 Regression coefficients and ratios of the first leading mode of EOF (PC1) of HC and SST with different models in equatorial asymmetric (ASY) and equatorial symmetric (SYM) structures.
To further discuss the causes for model simulation biases, the abovementioned models are classified into two types for comparison. Specifically, the eight models with relatively good performance are categorized as Type I, and the six models with obvious overestimation over the reanalysis are classified as Type II. Feng et al. (2019) found that the El Niño events dramatically enhance the HC’s sensitivity to the variations in the different meridional structures of SST. This raises a question: is the simulation bias of CMIP6 models for the HC’s responded ratio to SST in this study related to its simulation ability of the ENSO events? To solve this question, the competence of CMIP6 models in simulating the SSTA during ENSO events is firstly investigated. Combined with previous studies, it is found that the simulation of the action center of the ENSO amplitude has been biased during the CMIP3 to CMIP5 models (Yeh et al., 2012), which can also be found in CMIP6 models (Yang and Giese, 2013; Rao and Ren, 2014), as shown in the simulations of the positive SSTA and its position (figures omitted). Besides, there are also remarkable differences in simulating the ENSO intensity from CMIP3 to CMIP5, which also affects the simulations of East Asian winter monsoon, SST meridional structures, etc. However, the above studies do not involve the problem whether the simulation bias of ENSO intensity impacts the correlation between HC and SST (Gong et al., 2015; Guo and Tan, 2018b). In this paper, we plot the SSTA fields regressed onto the ENSO intensity during the mature period of ENSO events (from November to next January) using model simulations of Type I and Type II, respectively (Figure 12). During the El Niño event, the reanalysis data reveals a large warm SSTA in the central eastern equatorial Pacific, as shown in the regression field of SSTA onto the ENSO intensity. For model simulations, the simulated SSTA distribution of Type I is closer to the reanalysis, with the correlation coefficient reaching 0.98. Besides, the ENSO intensities simulated by the models of Type II are stronger than those of Type I. Particularly, the models of Type II overestimate the ENSO intensity in the entire Pacific region, especially near the east-central equatorial Pacific where the ENSO intensity is stronger than that of Type I and the reanalysis. In order to quantify the simulation ability for ENSO events, box plots of the observed and simulated ENSO intensity by the Type I and Type II models and the absolute deviations of model simulations relative to the observations are presented in Figure 13. It is shown that the model simulated ENSO intensity of Type I models is close to that of the observations. However, the models of Type II overestimate the ENSO intensity, with stronger peak and greater data dispersion compared with the observations, as well as a stronger upper limit and a larger standard deviation than that of Type I (Figure 13B). Therefore, the simulation bias of ENSO intensity may lead to the stronger response ratio simulated by the models of Type II, that is, the ENSO intensity simulated by the models of Type II is overestimated compared with that of the observations and the models of Type I.
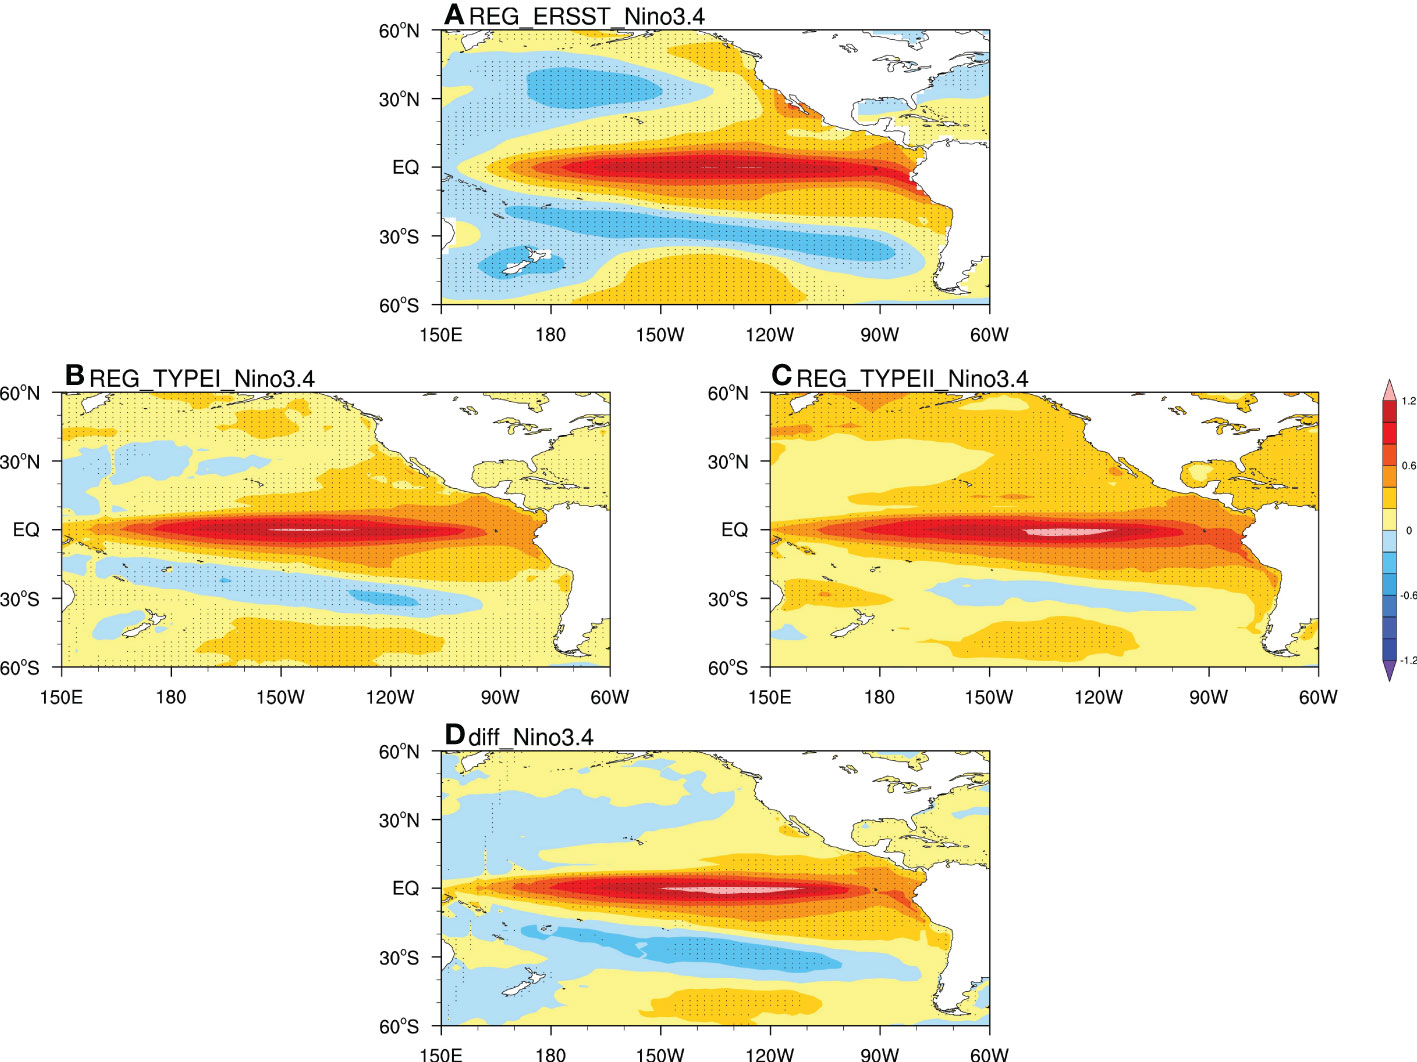
Figure 12 SST anomalies regressed onto the nino3.4 index in (A) observations (B) models of Type I, (C) models of Type II, and (D) differences between Type I and Type II from November to next January. The dots represent the values have passed the significance test at the 95% confidence level.
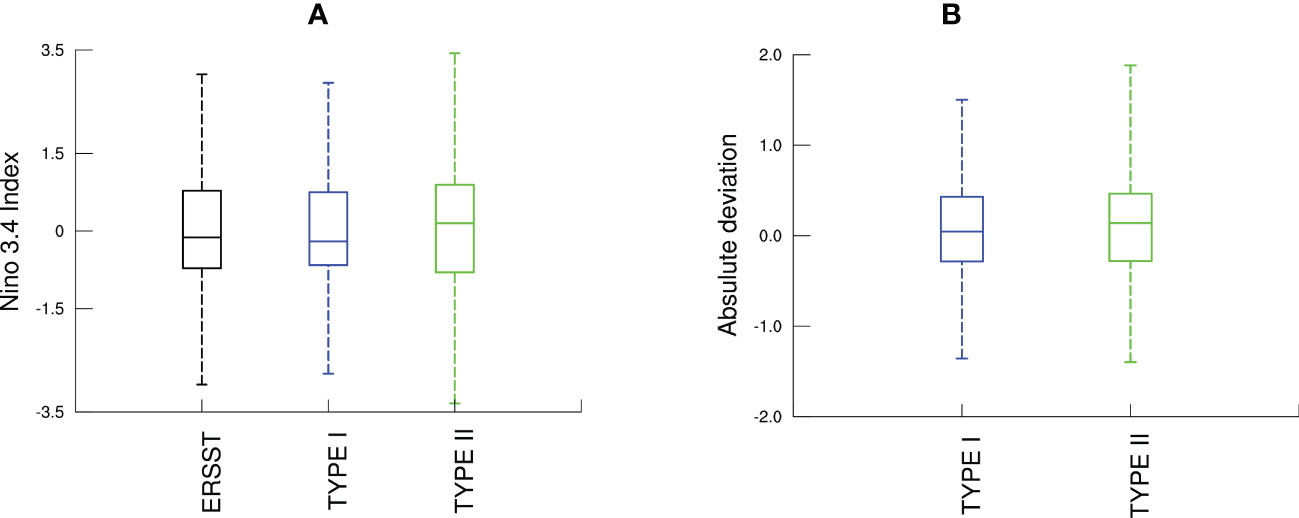
Figure 13 Box plots of (A) the nino3.4 index between observations and two types of models and (B) the absolute deviations of model simulations relative to the observations from November to next January. The black denotes ERSST, the blue denotes models of Type I and the green denotes models of Type II.
The reason for the stronger response ratios by the models of Type II is further explored by analyzing the HC to SST response under different structures. To get a more intuitive understanding about the differences of the HC to SST response under different structures between models and reanalysis, the ratio of the difference in the response is calculated between the CMIP6 model simulations and the reanalysis (Table 2). For 75% of the 19 CMIP6 models, the differences in the HEA to SEA response and HES to SES response between simulations and reanalysis are negative. It indicates that the simulated HC’s response with different meridional structures to the SST are weaker than that of the reanalysis, resulting in the underestimation of the response ratios by CMIP6 models. In particular, the underestimation the response in HES to SES is more obvious for models of Type II, with the absolute ratio of difference being 66% with respect to the observations, which is greater than the value of 22% for models of Type I. It is just the underestimated the HES to SES response that results in the large model bias in simulating the HC and SST interaction under different meridional structures.
In this study, an assessment is firstly performed on the simulation capability of 20 CMIP6 models to simulate the mean climate state characteristics and variability of the HC and tropical SST. On this basis, the relationship and response of the HC to SST under the different meridional structures are explored, and the reasons for model biases are further discussed.
For the CMIP6 models’ capability to simulate climatological HC and tropical SST under different structures, it is found that all model results have correlation coefficients greater than 0.8 with the observations. Moreover, the model simulations are highly consistent with the reanalysis data in spatial distributions. Except the CAS-ESM2-0 model, the majority of CMIP6 models can successfully simulate the spatial distributions of HC, tropical SST, and associated EOF1 patterns under different meridional structures. Furthermore, compared with the CMIP5 models, the simulation ability of the CMIP6 models has greatly enhanced. With the further development from the CMIP3 to CMIP6 models, the CMIP6 models maintain the superiority in terms of simulating the spatial distribution of HC and SST. And compared to the CMIP5 models, the CMIP6 models reduce the root mean square error of the multi-model average for SSTA simulation by 0.2, and thereby increase the explained variance by 1% for EOF1 of both HC and SST (Zhang and Sun, 2014).
The HC and tropical SST have a strong correlation under the different meridional structures. Specifically, the HEA (HES) is directly linked to the SEA (SES). A change in HEA (HES) is strongly correlated with a change in SEA (SES). This close relationship can be reproduced in CMIP6 models, where a correlation coefficient exceeding 0.5 between the HEA and SEA can be found in 75% models. Therefore, in the CMIP6 models, strong correlations between the HEA and SEA, HES and SES can be well simulated, further demonstrating the reliability of model simulations.
To investigate the reason for the difference in model simulations of response ratios, two types of models are classified based on their simulation ability for the HC to SST response with different meridional structures. The results show that model simulation capabilities for the ENSO is greatly responsible for the simulation performance of the HC-SST relationship. Specifically, the models of Type I that better characterize the HC-SST response relationship exhibit better simulation ability for ENSO intensity than the models of Type II that overestimate the ENSO intensity. Another important reason is that the model simulations of Type II remarkably underestimate the relationship of HES to SES. Compared with the models of Type I and the reanalysis data, the combined effect of the above two factors results in stronger response ratio by models of Type II, with greater difference from the reanalysis. Previous researches have illustrated that the capability of a model to simulate the warming trends in tropical SSTs can influence its ability to simulate the HC width (Yeh et al., 2012; Xia et al., 2020). This study focuses on CMIP6 models’ capability to reproduce the ENSO variability considerably affects the simulation performance of the HC-tropical SST correlation, further emphasizing the ENSO’s importance in regulating tropical SST-related mechanisms.
This study demonstrates the CMIP6 models’ ability in simulating the climatological HC and tropical SST. Further verifies the correlation between the HC and SST under the different structures, and explains the simulation bias of the response ratio from the perspective of the simulated ability of the ENSO intensity and the HC to SST response. These discussions provide some references for further development of the CMIP6 models. However, there are many reasons contributing to the model simulation bias for ENSO, such as the simulation biases for thermocline depth, wind response to SST anomalies and shortwave feedback (Van Oldenborgh et al., 2005). How these factors can affect the correlation of the HC and SST interaction is still unclear, which thus need to be further analyzed in the future. Meanwhile, previous researchers have found obvious seasonal differences in the HC, with remarkable differences in sea areas affecting the HC variability in different seasons (Han et al., 2010; Wang et al., 2020). While this paper mostly address attention the annual-mean series, and further analysis is needed for the HC-SST relationship under the different seasons and regions. In addition, this work suggests that there are some biases of model simulations for the HC-SST relationship. In recent years, many methods have been proposed to increase the model’s simulation ability, such as the methods of regularized optimal fingerprinting (Gillett et al., 2021) and phase adjustment (Wu et al., 2021), which can be used to improve the simulated effects of CMIP6 models for the HC and SST correlation with different meridional structures in further study.
The original contributions presented in the study are included in the article/supplementary material. Further inquiries can be directed to the corresponding author.
YL, JF and MD contributed to the conception and design of the study and led and coordinated its various components throughout the study. MD wrote the first draft of the manuscript. All authors contributed to the article and approved the submitted version.
This research has been supported by the National Key Research & Development (R&D) Program of China (2019YFA0606801) and the National Natural Science Foundation of China (42222501 and 41975079).
This research has been Supported by Supercomputing Center of Lanzhou University.
The authors declare that the research was conducted in the absence of any commercial or financial relationships that could be construed as a potential conflict of interest.
All claims expressed in this article are solely those of the authors and do not necessarily represent those of their affiliated organizations, or those of the publisher, the editors and the reviewers. Any product that may be evaluated in this article, or claim that may be made by its manufacturer, is not guaranteed or endorsed by the publisher.
An Z., Wu G., Li J., Sun Y., Liu Y., Zhou W., et al. (2015). Global monsoon dynamics and climate change. Annu. Rev. Earth Planet. Sci. 43, 29–77. doi: 10.1146/annurev-earth-060313-054623
Bjerknes J. (1966). A possible response of the atmospheric Hadley circulation to equatorial anomalies of ocean temperature. Tellus A: Dynam. Meteorol. Oceanogr. 18, 820–829. doi: 10.3402/tellusa.v18i4.9712
Bjerknes J. (1969). Atmospheric teleconnections from the equatorial pacific. Monthly Weather Review. 97, 163–172. doi: 10.1175/1520-0493(1969)097<0163:ATFTEP>2.3.CO;2
Brown J. R., Brierley C. M., An S.-I., Guarino M.-V., Stevenson S., Williams C. J. R., et al. (2020). Comparison of past and future simulations of ENSO in CMIP5/PMIP3 and CMIP6/PMIP4 models. Climate Past. 16, 1777–1805. doi: 10.5194/cp-16-1777-2020
Caballero R. (2007). Role of eddies in the interannual variability of Hadley cell strength. Geophys. Res. Letters. 34, L22705. doi: 10.1029/2007GL030971
Ceppi P., Hartmann D. L. (2013). On the speed of the eddy-driven jet and the width of the Hadley cell in the southern hemisphere. J. Climate. 26, 3450–3465. doi: 10.1175/JCLI-D-12-00414.1
Chang E. K. M. (1995). The influence of Hadley circulation intensity changes on extratropical climate in an idealized model. J. Atmos. Sci. 52, 2006–2024. doi: 10.1175/1520-0469(1995)052<2006:TIOHCI>2.0.CO;2
Chen J., Carlson B. E., Del Genio A. D. (2002). Evidence for strengthening of the tropical general circulation in the 1990s. Science 295, 838–841. doi: 10.1126/science.1065835
Chikamoto Y., Tanimoto Y., Mukougawa H., Kimoto M. (2010). Subtropical pacific SST variability related to the local Hadley circulation during the premature stage of ENSO. J. Meteorol. Soc. Japan. Ser. II. 88, 183–202. doi: 10.2151/jmsj.2010-205
Cook K. H. (2003). Role of continents in driving the Hadley cells. J. Atmos. Sci. 60, 956–976. doi: 10.1175/1520-0469(2003)060<0957:ROCIDT>2.0.CO;2
Diaz H. F., Bradley R. S. (2004). “The Hadley circulation: Present, past, and future,” in Advances in global change research, vol. 20. (Cambridge: Cambridge University Press), 1–5. doi: 10.1007/978-1-4020-2944-8_1
Dima I. M., Wallace J. M. (2003). On the seasonality of the Hadley cell. J. Atmos. Sci. 60, 1522–1527. doi: 10.1175/1520-0469(2003)060<1522:OTSOTH>2.0.CO;2
Eyring V., Bony S., Meehl G. A., Senior C. A., Stevens B., Stouffer R. J., et al. (2016). Overview of the coupled model intercomparison project phase 6 (CMIP6) experimental design and organization. Geosci. Model. Dev. 9, 1937–1958. doi: 10.5194/gmd-9-1937-2016
Feng J., Li J. (2013). Contrasting impacts of two types of ENSO on the Boreal spring Hadley circulation. J. Climate. 26, 4773–4789. doi: 10.1175/JCLI-D-12-00298.1
Feng J., Li J., Jin F., Liu Z., Nan X., Guo Y. (2016). Contrasting responses of the Hadley circulation to equatorially asymmetric and symmetric meridional Sea surface temperature structures. J. Climate. 29, 8949–8963. doi: 10.1175/JCLI-D-16-0171.1
Feng J., Li J., Jin F.-F., Zheng F. (2018). A comparison of the response of the Hadley circulation to different tropical SST meridional structures during the equinox seasons. J. Geophys. Res. Atmos. 123, 2591–2604. doi: 10.1002/2017JD028219
Feng J., Li J., Zhu J., Li Y., Li F. (2019). The contrasting response of Hadley circulation to different meridional structure of sea surface temperature in CMIP5. Theor. Appl. Climatol. 135, 633–647. doi: 10.1007/s00704-018-2393-9
Feng J., Li J., Zhu J., Li F., Sun C. (2015). Simulation of the equatorially asymmetric mode of the Hadley circulation in CMIP5 models. Adv. Atmos. Sci. 32, 1129–1124. doi: 10.1007/s00376-015-4157-0
Freitas A. C. V., Aímola L., Ambrizzi T., de Oliveira C. P. (2017). Changes in intensity of the regional Hadley cell in Indian ocean and its impacts on surrounding regions. Meteorol. Atmos. Phys. 129, 229–246. doi: 10.1007/s00703-016-0477-6
Freitas A. C. V., Ambrizzi T. (2015). Recent changes in the annual mean regional Hadley circulation and their impacts on south America. Adv. Meteorol. 2015, 1–22. doi: 10.1155/2015/780205
Fu Q., Johanson C. M., Wallace J. M., Reichler T. (2006). Enhanced mid-latitude tropospheric warming in satellite measurements. Science 312, 1179. doi: 10.1126/science.1125566
Ge Z., Chen L. (2020). Preliminary analysis of the zonal distribution of ENSO-related SSTA in three CMIP5 coupled models. Atmos. Ocean. Sci. Letters. 13, 443–451. doi: 10.1080/16742834.2020.1775475
Gillett N. P., Kirchmerier-Young M., Ribes A., Shiogame H., Hegerl G. C., Knutti R., et al. (2021). Constraining human contributions to observed warming since the pre-industrial period. Nat. Climate Change. 11, 207–212. doi: 10.1038/s41558-020-00965-9
Gong H., Wang L., Chen W., Nath D., Huang G., Tao W. (2015). Diverse influences of ENSO on the East Asian-Western pacific winter climate tied to different ENSO properties in CMIP5 models. J. Climate. 28, 2187–2202. doi: 10.1175/JCLI-D-14-00405.1
Grise K. M., Davis S. M., Staten P. W., Adam O. (2018). Regional and seasonal characteristics of the recent expansion of the tropics. J. Climate. 31, 6839–6853. doi: 10.1175/JCLI-D-18-0060.1
Guilyardi E., Bellenger H., Collins M., Ferrett S., Cai W. J., Wittenberg A. (2012). A first look at ENSO in CMIP5. Clivar Exchanges. 58, 29–32. doi: 10.1.1.711.4914
Guo Y.-P., Li J.-P. (2016). Impact of ENSO events on the interannual variability of Hadley circulation extents in boreal winter. Adv. Climate Change Res. 7, 46–53. doi: 10.1016/j.accre.2016.05.001
Guo Y.-P., Tan Z.-M. (2018a). On the sensitivity of the relationship between Hadley circulation asymmetry and ENSO in CMIP5 models. Geophys. Res. Letters. 45, 9253–9259. doi: 10.1029/2018GL079515
Guo Y.-P., Tan Z.-M. (2018b). Relationship between El niño-southern oscillation and the symmetry of the Hadley circulation: Role of the Sea surface temperature annual cycle. J. Climate. 31, 5319–5332. doi: 10.1175/JCLI-D-17-0788.1
Hadley G. (1735). Concerning the cause of the general trade-winds: By geo. Hadley Esq; F.R.S. Philos. Trans. 1685-1775). 39, 58–62.
Han W., Meehl G. A., Rajagopalan B., Fasullo J. T., Hu A., Lin J., et al. (2010). Patterns of Indian ocean sea-level change in a warming climate. Nat. Geosci. 3, 546–550. doi: 10.1038/NGEO901
Held I. M., Hou A. Y. (1980). Nonlinear axially symmetric circulations in a nearly inviscid atmosphere. J. Atmos. Sci. 37, 515–533. doi: 10.1175/1520-0469(1980)037<0515:NASCIA>2.0.CO;2
Hou A. Y. (1998). Hadley Circulation as a modulator of the extratropical climate. J. Atmos. Sci. 55, 2437–2457. doi: 10.1175/1520-0469(1998)055<2437:HCAAMO>2.0.CO;2
Hou A. Y., Lindzen R. S. (1992). The influence of concentrated heating on the Hadley circulation. J. Atmos. Sci. 49, 1233–1241. doi: 10.1175/1520-0469(1992)049<1233:TIOCHO>2.0.CO;2
Hu D., Guo Y.-P., Tan Z.-M., Guan Z. (2019). Interannual relationship between the Boreal spring Arctic oscillation and the northern hemisphere Hadley circulation extent. J. Climate. 32, 4395–4408. doi: 10.1175/JCLI-D-18-0657.1
Hu Y., Huang H., Zhou C. (2018). Widening and weakening of the Hadley circulation under global warming. Sci. Bulletin. 63, 640–644. doi: 10.1016/j.scib.2018.04.020
Hu Y., Tao L., Liu J. (2013). Poleward expansion of the Hadley circulation in CMIP5 simulations. Adv. Atmos. Sci. 30, 790–795. doi: 10.1007/s00376-012-2187-4
Hu Y., Tung K. K., Liu J. (2005). A closer comparison of early and late-winter atmospheric trends in the northern hemisphere. J. Climate. 18, 3204–3216. doi: 10.1175/JCLI3468.1
Hu Y., Zhou C., Liu J. (2011). Observational evidence for poleward expansion of the Hadley circulation. Adv. Atmos. Sci. 28, 33–44. doi: 10.1007/s00376-010-0032-1
Huang R., Chen S., Chen W., Hu P., Yu B. (2019). Recent strengthening of the regional Hadley circulation over the Western pacific during Boreal spring. Adv. Atmos. Sci. 36, 1251–1264. doi: 10.1007/s00376-019-9004-2
Huang R., Chen S., Chen W., Yu B., Hu P., Ying J., et al. (2021). Northern poleward edge of regional Hadley cell over western pacific during boreal winter: year-to-year variability, influence factors and associated winter climate anomalies. Climate Dynam. 56, 3643–3664. doi: 10.1007/s00382-021-05660-9
Kang S. M., Lu J. (2012). Expansion of the Hadley cell under global warming: Winter versus summer. J. Climate. 25, 8387–8393. doi: 10.1175/JCLI-D-12-00323.1
Kim D., Kim H., Kang S. M., Stuecker M. F., Merlis T. M. (2022). Weak Hadley cell intensity changes due to compensating effects of tropical and extratropical radiative forcing. NPJ Climate Atmos. Sci. 5, 61. doi: 10.1038/s41612-022-00287-x
Kovilakam M., Mahajan S. (2015). Black carbon aerosol-induced northern hemisphere tropical expansion. Geophys. Res. Letters. 42, 4964–4972. doi: 10.1002/2015GL064559
Leloup J., Lengaigne M., Boulanger J.-P. (2008). Twentieth century ENSO characteristics in the IPCC database. Climate Dynam. 30, 277–291. doi: 10.1007/s00382-007-0284-3
Li J. (2001). “Atlas of climate of global atmospheric circulation I,” in Climatological mean state (in Chinese) (Beijing: China Meteorological Press), 279.
Lindzen R. S. (1994). Climate dynamics and global change. Annu. Rev. Fluid Mech. 26, 353–378. doi: 10.1146/annurev.fl.26.010194.002033
Liu J., Song M., Hu Y., Ren X. (2012). Changes in the strength and width of the Hadley circulation since 1871. Climate Past Discuss. 8, 695–713. doi: 10.5194/cpd-8-695-2012
Lu J., Vecchi G. A., Reichler T. (2007). Expansion of the Hadley cell under global warming. Geophys. Res. Letters. 34, L06805. doi: 10.1029/2006GL028443
Ma J., Li J. (2008). The principal modes of variability of the boreal winter Hadley cell. Geophys. Res. Letters. 35, L01808. doi: 10.1029/2007GL031883
Mitas C. M., Clement A. (2006). Recent behavior of the Hadley cell and tropical thermodynamics in climate models and reanalyses. Geophys. Res. Lett. 33, L01810. doi: 10.1029/2005GL024406
Nguyen H., Hendon H. H., Lim E.-P., Boschat G., Maloney E., Timbal B. (2018). Variability of the extent of the Hadley circulation in the southern hemisphere: a regional perspective. Climate Dynam. 50, 129–142. doi: 10.1007/s00382-017-3592-2
Nguyen N., Lucas C., Evans A., Timbal B., Hanson L. (2015). Expansion of the southern hemisphere Hadley cell in response to greenhouse gas forcing. J. Climate. 28, 8067–8077. doi: 10.1175/JCLI-D-15-0139.1
Oort A. H., Rasmusson E. M. (1970). On the annual variation of the monthly mean meridional circulation. Monthly Weather Review. 98, 423–442. doi: 10.1175/1520-0493(1970)098<0423:OTAVOT>2.3.CO;2
Oort A. H., Yienger J. J. (1996). Observed interannual variability in the Hadley circulation and its connection to ENSO. J. Climate. 9, 2751–2767. doi: 10.1175/1520-0442(1996)009<2751:OIVITH>2.0.CO;2
Quan X.-W., Diaz H. F., Hoerling M. P. (2004). “Change in the tropical Hadley cell since 1950,” in The Hadley circulation: Present, past and future. advances in global change research, vol. 21. (Cambridge: Cambridge University Press). doi: 10.1007/978-1-4020-2944-8_4
Rao J., Ren R.-C. (2014). Statistical characteristics of ENSO events in CMIP5 models. Atmos. Ocean. Sci. Letters. 7, 546–552. doi: 10.3878/AOSL20140055
Sohn B. J., Park S.-C. (2010). Strengthened tropical circulations in past three decades inferred from water vapor transport. J. Geophys. Res. Atmos. 115, D15112. doi: 10.1029/2009JD013713
Son S.-W., Gerber E. P., Perlwitz J., Polvani L. M., Gillett N. P., Seo K.-H., et al. (2010). Impact of stratospheric ozone on southern hemisphere circulation change: A multimodel assessment. J. Geophys. Res. Atmos. 115, D00M07. doi: 10.1029/2010JD014271
Song Z., Liu H., Chen X. (2020). Eastern Equatorial pacific SST seasonal cycle in global climate models: from CMIP5 to CMIP6. Acta Oceanol. Sinica. 39, 50–60. doi: 10.1007/s13131-020-1623-z
Stachnik J. P., Schumacher C. (2011). A comparison of the Hadley circulation in modern reanalyses. J. Geophys. Res. Atmos. 116, D22102. doi: 10.1029/2011JD016677
Tanaka H. L., Ishizaki N., Kitoh A. (2004). Trend and interannual variability of walker, monsoon and Hadley circulations defined by velocity potential in the upper troposphere. Tellus A: Dynam. Meteorol. Oceanogr. 56, 250–269. doi: 10.3402/tellusa.v56i3.14410
Tao L., Hu Y., Liu J. (2016). Anthropogenic forcing on the Hadley circulation in CMIP5 simulations. Climate Dynam. 46, 3337–3350. doi: 10.1007/s00382-015-2772-1
Van Oldenborgh G. J., Philip S. Y., Collins M. (2005). El Niño in a changing climate: a multi-model study. Ocean Sci. Discuss. 1, 81–95. doi: 10.5194/os-1-81-2005
Wang Y., Feng J., Li J., An R., Wang L. (2020). Variability of boreal spring Hadley circulation over the Asian monsoon domain and its relationship with tropical SST. Climate Dynam. 54, 1655–1669. doi: 10.1007/s00382-019-05079-3
Wu M., Zhou T., Li C., Li H., Chen X., Wu B., et al. (2021). A very likely weakening of pacific walker circulation in constrained near-future projections. Nat. Commun. 12, 6502. doi: 10.1038/s41467-021-26693-y
Xia Y., Hu Y., Liu J. (2020). Comparison of trends in the Hadley circulation between CMIP6 and CMIP5. Sci. Bulletin. 65, 1667–1674. doi: 10.1016/j.scib.2020.06.011
Yang C., Giese B. S. (2013). El Niño southern oscillation in an ensemble ocean reanalysis and coupled climate models. J. Geophys. Res. Oceans 118, 4052–4071. doi: 10.1002/jgrc.20284
Yang H., Lohmann G., Lu J., Gowan E. J., Shi X., Liu J., et al. (2020). Tropical expansion driven by poleward advancing midlatitude meridional temperature gradients. J. Geophys. Res. Atmos. 125, e2020JD033158. doi: 10.1029/2020JD033158
Yang H., Lohmann G., Shi X., Muller J. (2023). Evaluating the mechanism of tropical expansion using idealized numerical experiments. Ocean-Land-Atmos. Res. 2, 0004. doi: 10.34133/olar.0004
Yeh S.-W., Ham Y.-G., Lee J.-Y. (2012). Changes in the tropical pacific SST trend from CMIP3 to CMIP5 and its implication of ENSO. J. Climate. 25, 7764–7771. doi: 10.1175/JCLI-D-12-00304.1
Zhang T., Sun D.-Z. (2014). ENSO asymmetry in CMIP5 models. J. Climate. 27, 4070–4093. doi: 10.1175/JCLI-D-13-00454.1
Keywords: Hadley Circulation, Sea surface temperature, CMIP6 models, Meridional structure, Climate model
Citation: Li Y, Du M, Feng J, Xu F and Song W (2023) Relationships between the Hadley circulation and tropical sea surface temperature with different meridional structures simulated in CMIP6 models. Front. Mar. Sci. 10:1145509. doi: 10.3389/fmars.2023.1145509
Received: 16 January 2023; Accepted: 13 March 2023;
Published: 28 March 2023.
Edited by:
Lichuan Wu, Uppsala University, SwedenReviewed by:
Hu Yang, Alfred Wegener Institute Helmholtz Centre for Polar and Marine Research (AWI), GermanyCopyright © 2023 Li, Du, Feng, Xu and Song. This is an open-access article distributed under the terms of the Creative Commons Attribution License (CC BY). The use, distribution or reproduction in other forums is permitted, provided the original author(s) and the copyright owner(s) are credited and that the original publication in this journal is cited, in accordance with accepted academic practice. No use, distribution or reproduction is permitted which does not comply with these terms.
*Correspondence: Juan Feng, ZmVuZ2p1YW5AYm51LmVkdS5jbg==
Disclaimer: All claims expressed in this article are solely those of the authors and do not necessarily represent those of their affiliated organizations, or those of the publisher, the editors and the reviewers. Any product that may be evaluated in this article or claim that may be made by its manufacturer is not guaranteed or endorsed by the publisher.
Research integrity at Frontiers
Learn more about the work of our research integrity team to safeguard the quality of each article we publish.