 Cong Zhang
- 1Shandong Provincial Center for in-situ Marine Sensors, Institute of Marine Science and Technology, Shandong University, Qingdao, Shandong, China
- 2Southern Marine Science and Engineering Guangdong Laboratory Guangzhou, Guangzhou, Guangdong, China
- 3Department of Staticstics, Harvard University, Cambridge, MA, United States
Dissolved organic matter (DOM) in seawater, consisted of a complex mixture of compounds and accounted for about 90% of marine organic carbon, is an important part of the global carbon cycle and also a part of absolute salinity of seawater. As the components of DOM are non-ionized in seawater, electric conductivity measurement cannot observe its contribution to salinity, which could lead to measurement error in salinity. Salinity measurement based on optic refractive index could reveal contribution of all dissolved matters in seawater including both non-ionized and ionized components. In this paper, a comparative study of DOM contribution to the salinity measurement by optic refractive index method and electric conductivity method was carried out for the first time. Adding DOM, extracted from Aoshan Bay, Qingdao, China, into Chinese Standard Seawater, our experimental results showed an increase of optic refractive index at 1.19×10⁻⁴ ± 4×10⁻⁶ per 1g/kg of DOM, which corresponds to a practical salinity increase of 0.697 ± 0.036 PSU per 1 g/kg of DOM. While, the conductivity of seawater measured by a conductivity-temperature sensor showed a decrease of 0.00065 ± 0.00008 mS/cm per 1 g/kg of DOM, which corresponded to a decrease of salinity at 0.00052 ± 0.00007 PSU per 1 g/kg of DOM. By comparing the optic and electric measurement results, the contribution of non-conductive components in the dissolved organic matters to salinity could be distinguished, which has great significance for the measurement of absolute salinity, global carbon cycle etc.
1 Introduction
As one of the largest activated carbon pools (700 PGC) on the earth, marine DOM accounts for about 90% of the organic carbon in the ocean, compared to the content of atmospheric CO2 (750 PGC) (Melendez-Perez et al., 2016). Marine DOM plays an important role in the global carbon cycle. Even very small changes in DOM could have potential impacts on many of Earth’s biogeochemical systems. Changes in its behavior are critical for the global carbon cycle and for predicting climate change (Gruber et al., 2019). As DOM is composed of complex non-ionized organic matters dissolved in the seawater, marine DOM does not contribute to conductivity of seawater. According to the definition of absolute salinity, which is the contribution of all dissolved matters in the seawater, DOM should have contribution to the absolute salinity or density of seawater. At present, seawater salinity in terms of practical salinity is calculated by formulas of the practical salinity scale of 1978 (PSS-78) (Perkin and Lewis, 1980), which is based on the conductivity, temperature and depth measured by CTD sensor. Since seawater conductivity measurement depends on ions concentration which does not take into account non-ionic compounds. The non-ionic compounds do not contribute to conductivity but do contribute to thermodynamic properties of seawater (Le Menn et al., 2019; Ji et al., 2021).
DOM together with organic matter suspended in seawater are characterized by total organic carbon (TOC). At present, TOC of seawater is measured by the high-temperature catalytic combustion oxidation method and the wet oxidation method in the laboratory (Tamburini et al., 2017). Ultraviolet visible absorption spectrum method and fluorescence spectrum method are often used to analyze partial information of colored and fluorescent groups of DOM (Aiken et al., 1992). Those methods just reflect contribution of partial components of DOM that is related to the properties of ultraviolet to visible light absorption or fluorescence. As part of seawater absolute salinity, Le Menn et al. gave the colored dissolved organic matter (CDOM) concentration found in different seas, and speculated that it might be a potential factor affecting the density of seawater (Le Menn and Naïr, 2022). However, the influences of DOM on refractive index or salinity of seawater is unknown.
Refractive index of seawater is sensitive to all the compounds dissolved in seawater, so it is a good proxy for in situ salinity of seawater according to TEOS-10 (IOC et al., 2010). Various approaches have been carried out to measure the refractive index of seawater (Le Menn and Naïr, 2022) such as refractive techniques (Minato et al., 1989; Malarde et al., 2009; Le Menn, 2018), fiber Bragg grating (Wu et al., 2019a; Wu et al., 2019b; Marrec et al., 2005; Phan Hui et al., 2006; Luo et al., 2017), surface plasmon resonance (Wu et al., 2019b; Zhao et al., 2019; Yang et al., 2021), and interferometer (Asakawa et al., 2010; Meng et al., 2014; Liu et al., 2019). However, the resolution of fiber Bragg grating methods is relative low for the measurement of DOM, and the metal film of surface plasmon resonance method is easily corroded by seawater.
The V-block refractometer, made up of two half prisms, was proved to be simple and straightforward to measure seawater refractive index (Malarde et al., 2009; Grosso et al., 2010a). By using two pieces of glasses with same temperature coefficients of refractive indices (Δn/ΔT) but opposite signs (for example, Schott glass K7 and NFK-51), the temperature influence could be compensated. This allows a reduction of the overall thermo-optical coefficient of the refractometer from 3 × 10⁻⁷ to 4 × 10⁻⁸ K-1(Grosso et al., 2010b). The V-block refractometer has been developed for in-situ measurement of small salinity variations (Malarde et al., 2008; Le Menn et al., 2011; AndreAndré et al., 2020). We have proposed a laboratory resolution improve method of the V-block refractometer. By adding a Fabry-Perot cavity after the V-block, the resolution of the system is improved to 1.4 ×10⁻⁸(Li et al., 2021).
In this paper, a comparative study of the contribution of DOM to the refractive index, conductivity and salinity of seawater was carried out. DOM was extracted using PPL Solid Phase Extraction (SPE) method from surface seawater in Aoshan Bay of Qingdao, China, and was added into Chinese Standard Seawater ( Sp=35, uncertainty of ±0.003). Refractive index of seawater was measured by a V-shaped groove refractometer built by two pieces of prisms. Conductivity was measured by a commercial conductivity-temperature sensor. The experimental results showed that the refractive index increases at a rate of 1.19×10⁻⁴ ± 4×10⁻⁶ RIU per 1 g/kg of DOM at 25°C, corresponding to a practical salinity increase of 0.697 ± 0.036 PSU per 1 g/kg of DOM at 25°C, according to Millard and Seaver formula (Millard and Seaver, 1990). However, the conductivity of Chinese Standard Seawater decreases at a rate of 0.00065 ± 0.00008 mS/cm per 1 g/kg of DOM at 25°C, and corresponding practical salinity calculated from conductivity decreases at a rate of 0.00052 ± 0.00007 PSU per 1 g/kg of DOM.
2 Materials and equipment
2.1 Optical refractometer
2.1.1 Principle of the optical refractometer
The core of the refractometer is a V-shaped groove as shown in Figure 1, which is formed by two pieces of optical glasses with an angle of 2A (here, A=45°). The optical glass is made of Schott B270 (Na2O·CaO·6SiO2) with refractive index of ng=1.5197 at 633nm. The V-shaped groove between the two pieces of optical glasses is filled with seawater to be measured. The laser beam is shining on the left side glass of the V-shaped groove with an incident angle θi1 and refraction angle θo2, after passing through the seawater, shining on the right side glass with an incident angle θi3 and refraction angle θo4. According to the Snell-Descartes refraction laws (Peatross and Ware, 2010), θo4 is sensitive to the change of refractive index of seawater.
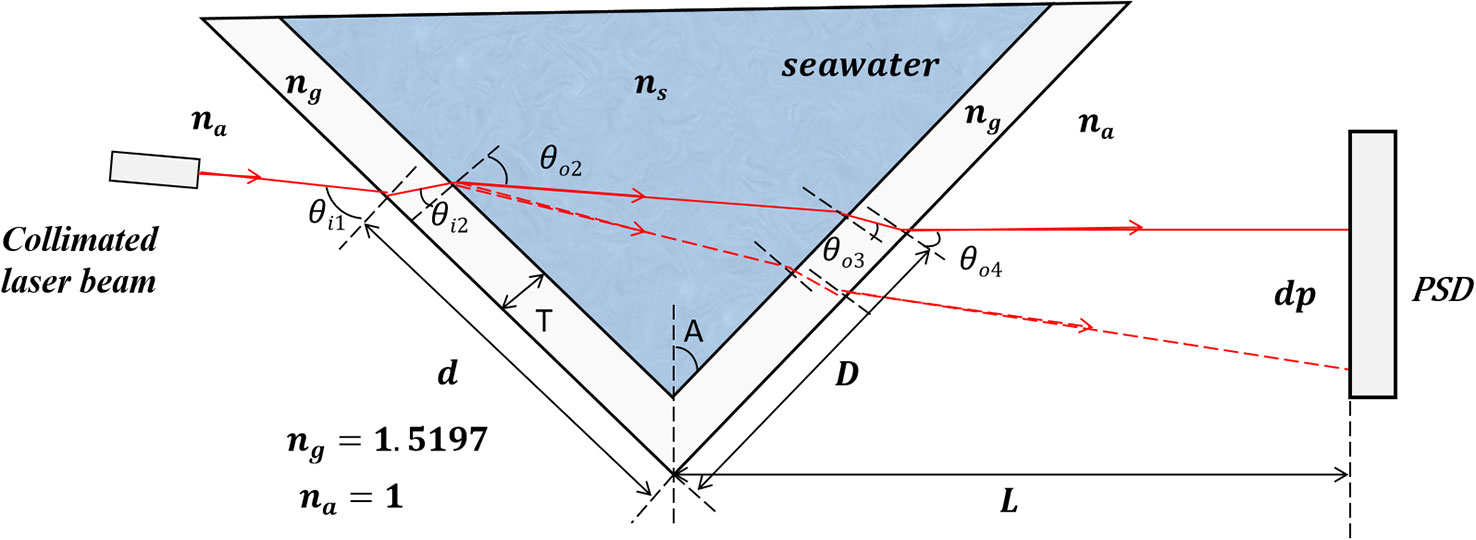
Figure 1 Schematic diagram of V-shaped groove.
where θi1, θi2, θi3 and θi4 are beam incident angles of the air-left side glass interface, left side glass-seawater interface, seawater-right side glass interface and right side glass-air interface, respectively. θo1, θo2, θo3 and θo4 are corresponding exit angles of θi1, θi2., θi3 and θi4 respectively. na and ns are the refractive indices of air and seawater.
The exit angle θo4 is related to the exit beam position P on the Position Sensitive Device (PSD), which can be written as:
where L is the distance between the bottom of the V-shaped groove and the surface of the PSD. D is the distance between the exit point of beam and the bottom of the V-shaped groove, which is described as:
T is the thickness of the prisms, and d is the distance from the beam incident point to the bottom of the V-shaped groove.
The sensitivity of the system can be represented by ΔPΔns (Minato et al., 1989; Grosso et al., 2010a), which can be obtained by taking the derivative of Equation (2), and is a function of θi1, d and L.
2.1.2 Calibration of optical refractometer
Figure 2 is the schematic diagram of the experiment set-up of the seawater refractometer based on V-shaped groove. A semiconductor laser (633 ±0.5 nm @ T=25°C, 12 mW, linewidth of 1 MHz) was used as the light source. The effective sensitive area of the position sensitive device (PSD, Hamamatsu S3931) is 1 mm × 6 mm. The corresponding signal processing circuits (Hamamatsu C9068) were used to measure the beam displacement. The position resolution of the PSD with the processing circuits is 1.5 μm (datasheet of signal processing circuits for PSD C9068-1, C9069-1, HAMAMATSU)
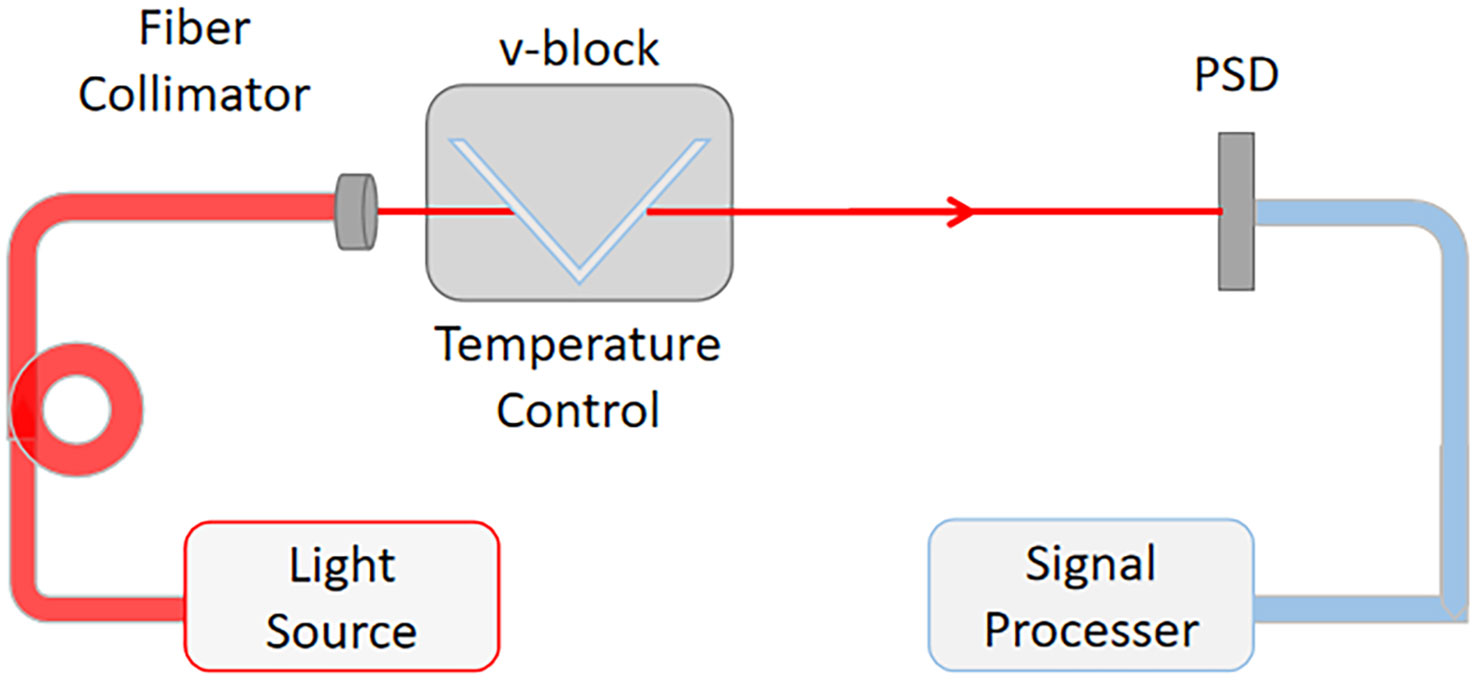
Figure 2 Schematic diagram of the experiment set-up of the seawater refractometer based on V-shaped groove.
Based on this refractometer, the contribution of DOM in the Chinese Standard Seawater ( Sp=35+-0.003, @ T=25 °C) et al. on the refractive index was experimentally studied. The main parameters of the refractometer are: θi1= 64° d= 15 mm, L= 10 cm. According to Eq.(1)-Eq.(3), the theoretical sensitivity is calculated to be 1.36 × 106 μm/RIU within the refractive index range of 1.335879~1.340267, as shown by the red solid line in Figure 3. Considering the position resolution of the PSD with the processing circuits is 1.5 μm, the theoretical resolution of the refractometer is calculated to be 1.5 μm/1.36 ×106 μm/RIU=1.10×10-6 RIU.
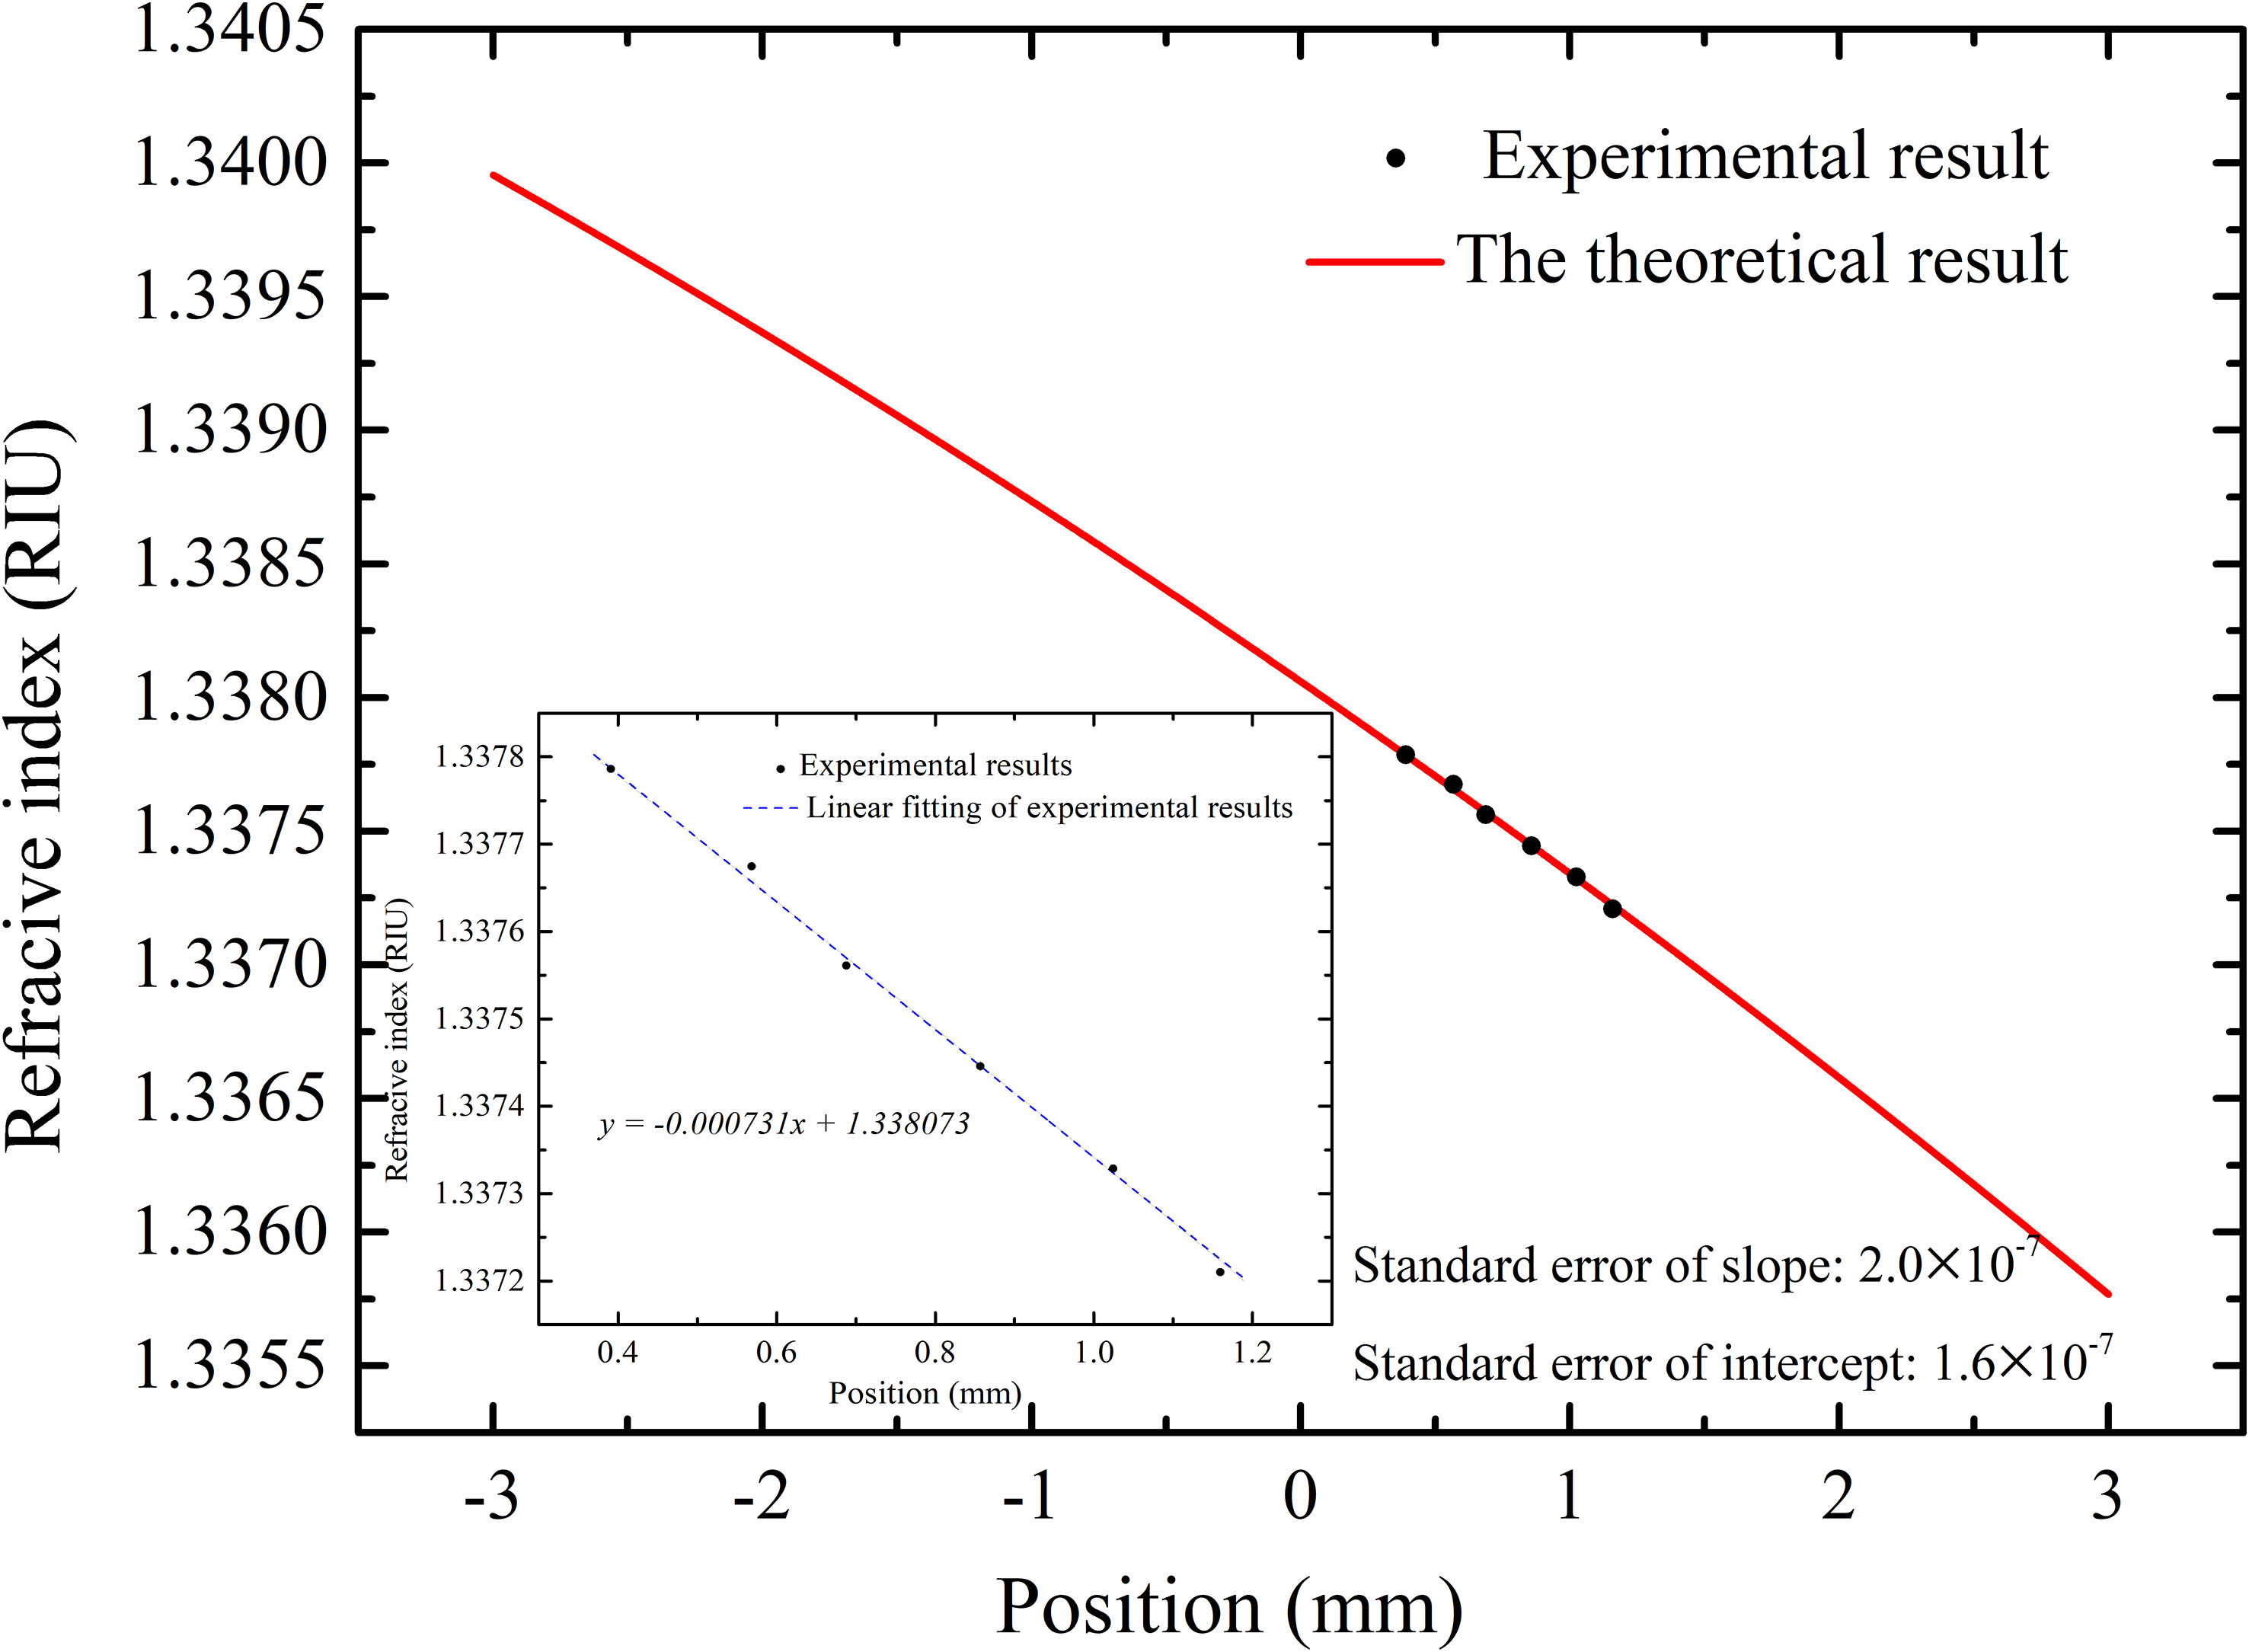
Figure 3 The theoretical (solid line) and experimental (dots) relationship between refractive index and PSD position.
By varying the temperature of Chinese Standard Seawater ( SP= 35 ± 0.003) from 23.000°C to 28.000°C, the relationship between the refractive index and the PSD position was established. The V-shaped groove mounted on a thermo-electric cooler (TEC) module (temperature control stability: ± 0.002°C) was placed in a temperature chamber (temperature control stability: ± 1.0°C). The refractive indices of Chinese Standard Seawater at different temperatures were calculated by Millard and Seaver formula (Millard and Seaver, 1990). The experimental results are shown as the dots in Figure 3, which shows at sensitivity of 1.37 × 106 μm/RIU, that is a good fit with the theoretical result. The slight deviation between the theoretical and experimental results might be contributed by the measurement tolerance of θi1, d, and L. The relative temperature coefficient of refractive index of Schott B270 calculated by parameters read from manual is 2.306×10⁻⁶ K-1 (Optical glass data sheet, CDGMGLASS CO. LTD, 2021). When temperature varies from 23°C to 28°C, refractive index of Schott B270 changes by ±1.2×10⁻⁵ RIU, the corresponding position variation of PSD is within 0.0014 μm and refractive index variation of measured seawater is within 1×10⁻⁹ RIU. So systematic errors induced by temperature coefficient of glass is negligible during the calibration.
During calibration, temperature of Chinese Standard Sweater at each set temperature is monitored by a thermistor. 120 temperature data and 120 position data (sampling interval is 5 ms) were collected when the temperature was stabilized at the set temperature. Average of 120 position data was used as the PSD position at each set temperature. In Table 1, the standard uncertainty in temperature is established by the 120 temperature data. And the standard uncertainty in position in Table 1 is established by the 120 position data. As refractive index is related with the position of PSD, the uncertainty on refractive index is decided by the uncertainty on PSD. According to Table 1, experimental uncertainty of the refractive index is estimated to be within ±7.06 ×10⁻⁶.

Table 1 Refractive index uncertainty estimation.
2.2 DOM extracted from Aoshan Bay
In this work, Solid Phase Extraction (SPE) method based on PPL resin adsorbents is used to extract DOM from coastal seawater of Aoshan Bay, Qingdao of China, as a case study. Seawater sampling location is shown in Figure 4.
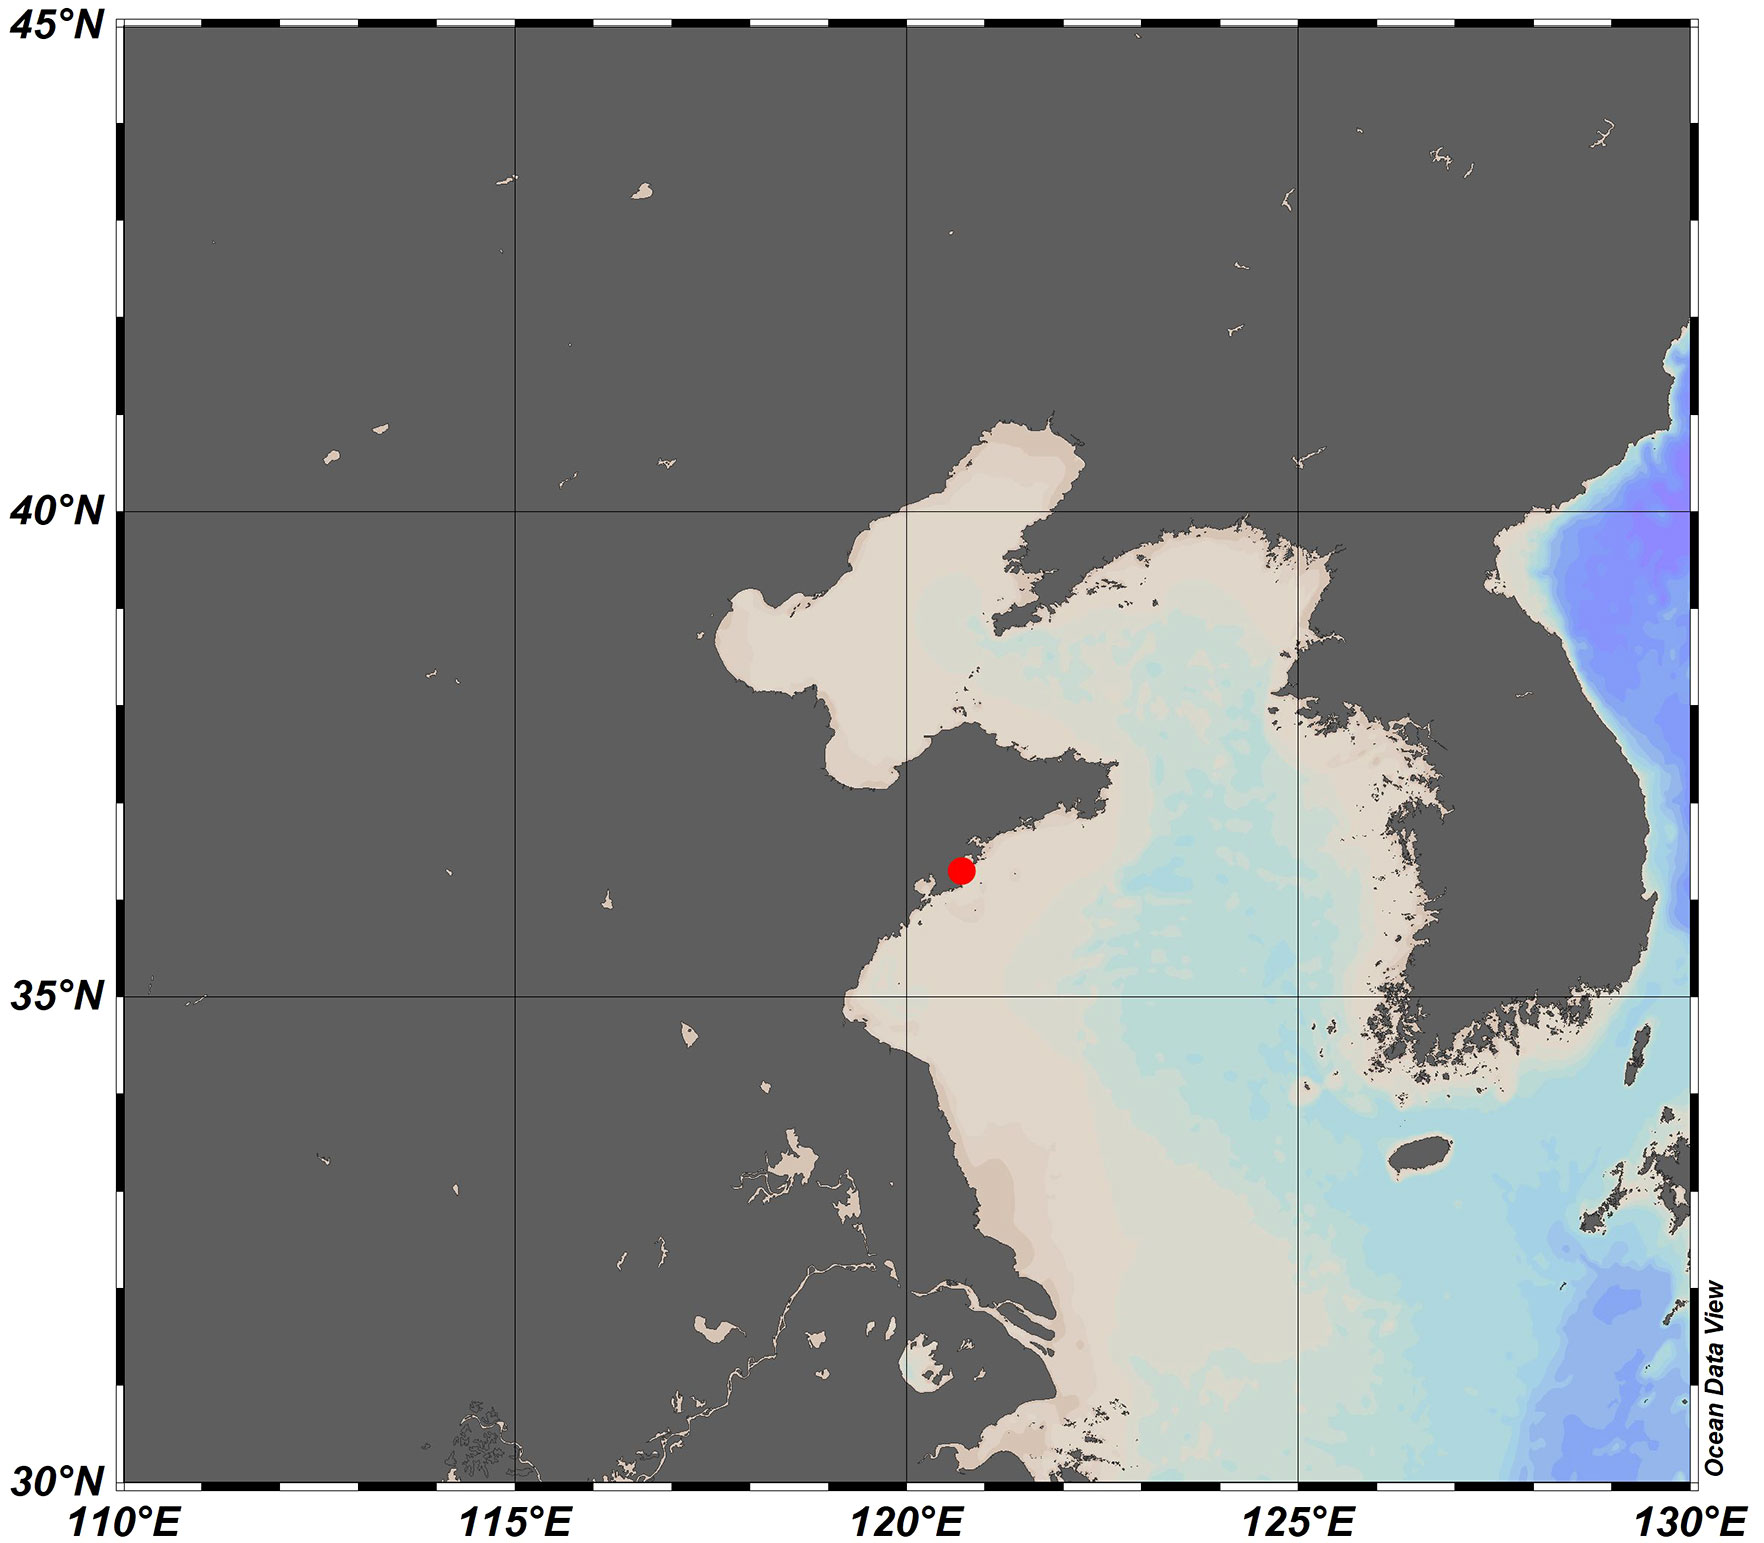
Figure 4 Map of seawater sampling location at Aoshan Bay of Qingdao, Shandong Province, China. (Sampling time is spring 2021).
DOM extracted from seawater of Aoshan Bay is shown in Figure 5 as the grey brown powder. DOM is analyzed by element analyzer (UNICUBE, Elementar) and main elements are shown in Table 2. The molar ratios of H/C, O/C and C/N were summarized in Table 2, too.
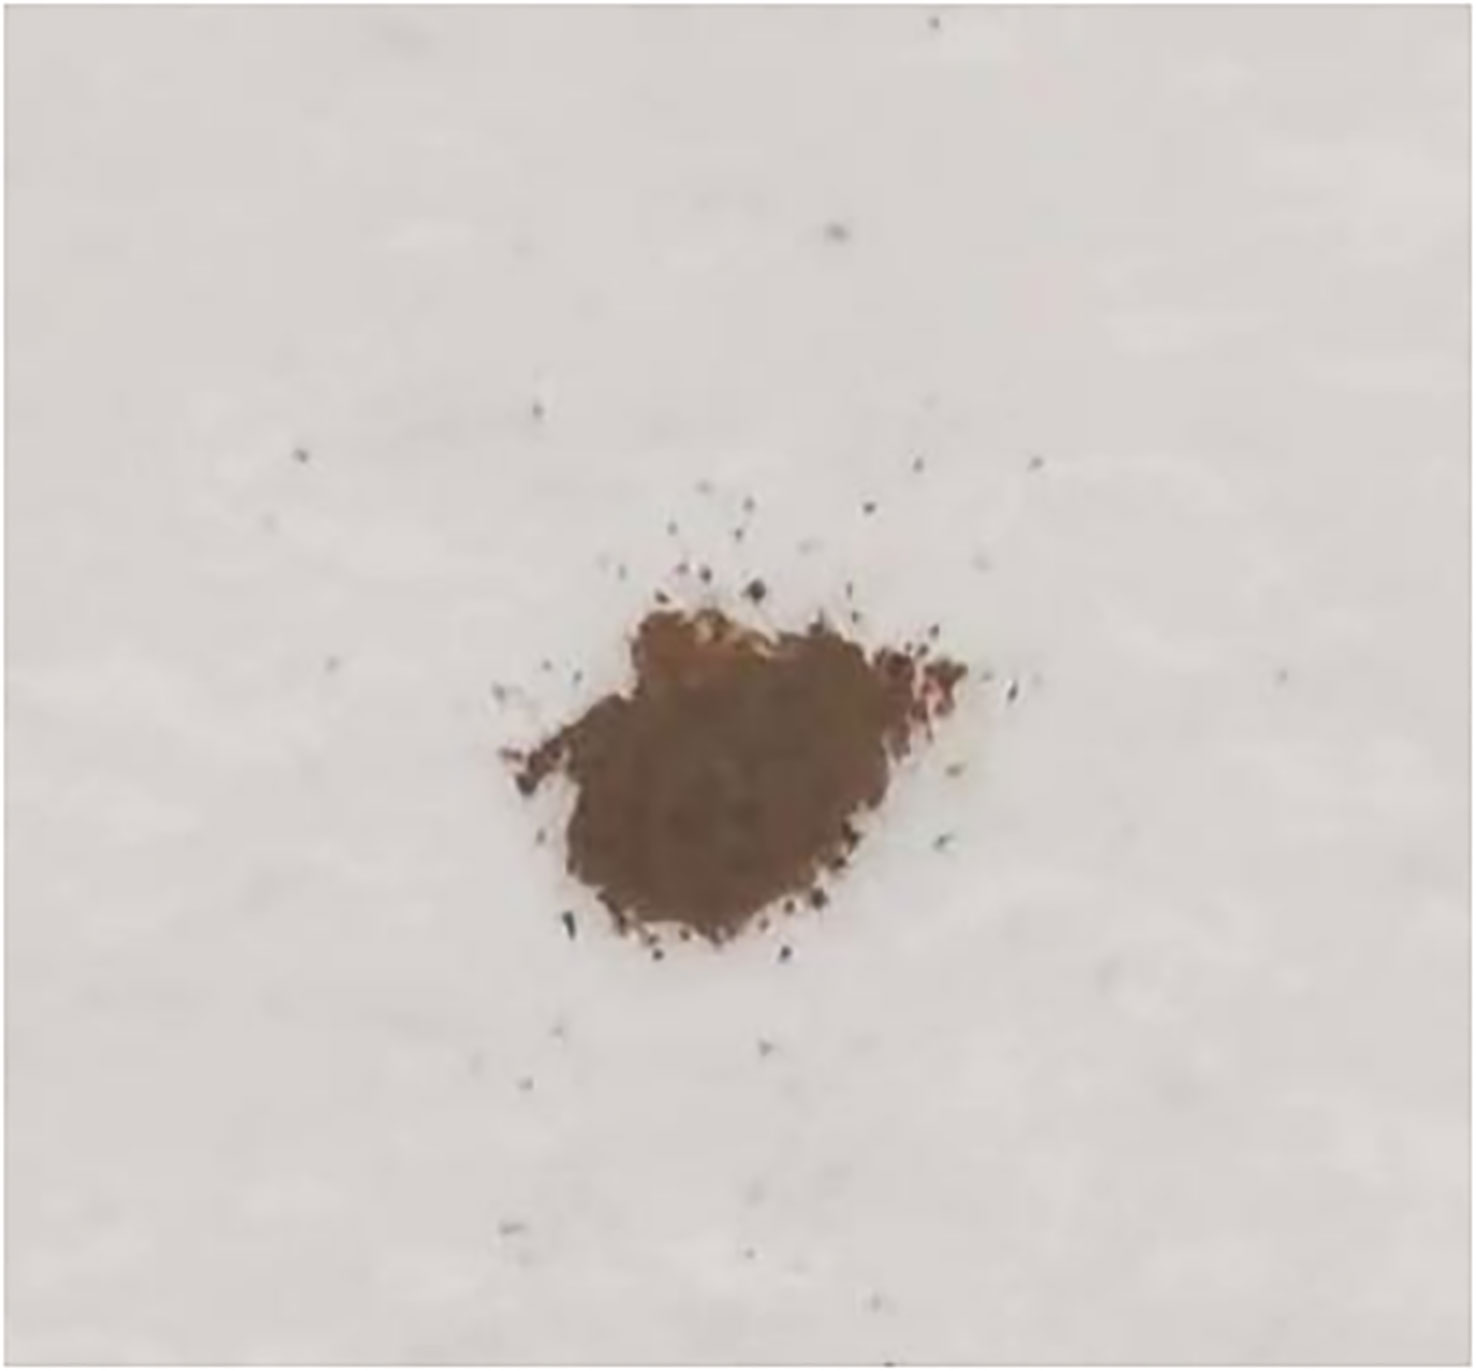
Figure 5 Photo image of DOM extracted from seawater of Aoshan Bay of Qingdao.
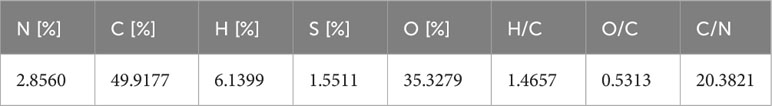
Table 2 Main components and molar atomic ratios between main components of DOM samples.
2.3 Seawater samples with different DOM concentrations
Different masses of DOM were dissolved in the same mass of Chinese Standard Seawater ( SP=35 ±0.003) to form samples with different DOM concentrations, i.e. 0.15 g/kg, 0.30 g/kg, 0.45 g/kg, 0.60 g/kg, 0.75 g/kg, and 0.90 g/kg. DOM and Chinese Standard Seawater are weighted using a Mettlertoledo analytical balances (XSE 105) with measurement accuracy 0.01 mg.
2.4 Conductivity-temperature sensor
In natural seawater, the content of inorganic salts is high and the content of DOM is relatively low. It takes 1 ton of seawater to extract 0.5 g~1 g DOM. It is difficult to prepare a large amount of DOM to fill in the conductivity tube of SBE (Seabird, USA). For this reason, the conductivity-temperature sensor (DW 1526, Qingdao Daowan Technology Co., Ltd.) with a smaller conductivity cell, was selected in the experiment. The samples were placed in its conductivity cell with two-ends sealed by rubber covers. To confirm the accuracy and stability of DW 1526, we compared the temperature, conductivity and salinity measurement results of DW 1526 and SBE 37. The comparison results showed temperature difference of 0.003°C, conductivity difference of 0.10 mS/cm, and salinity difference of 0.055 PSU, as shown in Figures 6–8, respectively. Both sensors showed good stability. The difference may be caused by calibration. Figures 6–8 can be used to calibrate the results measured by DW 1526.
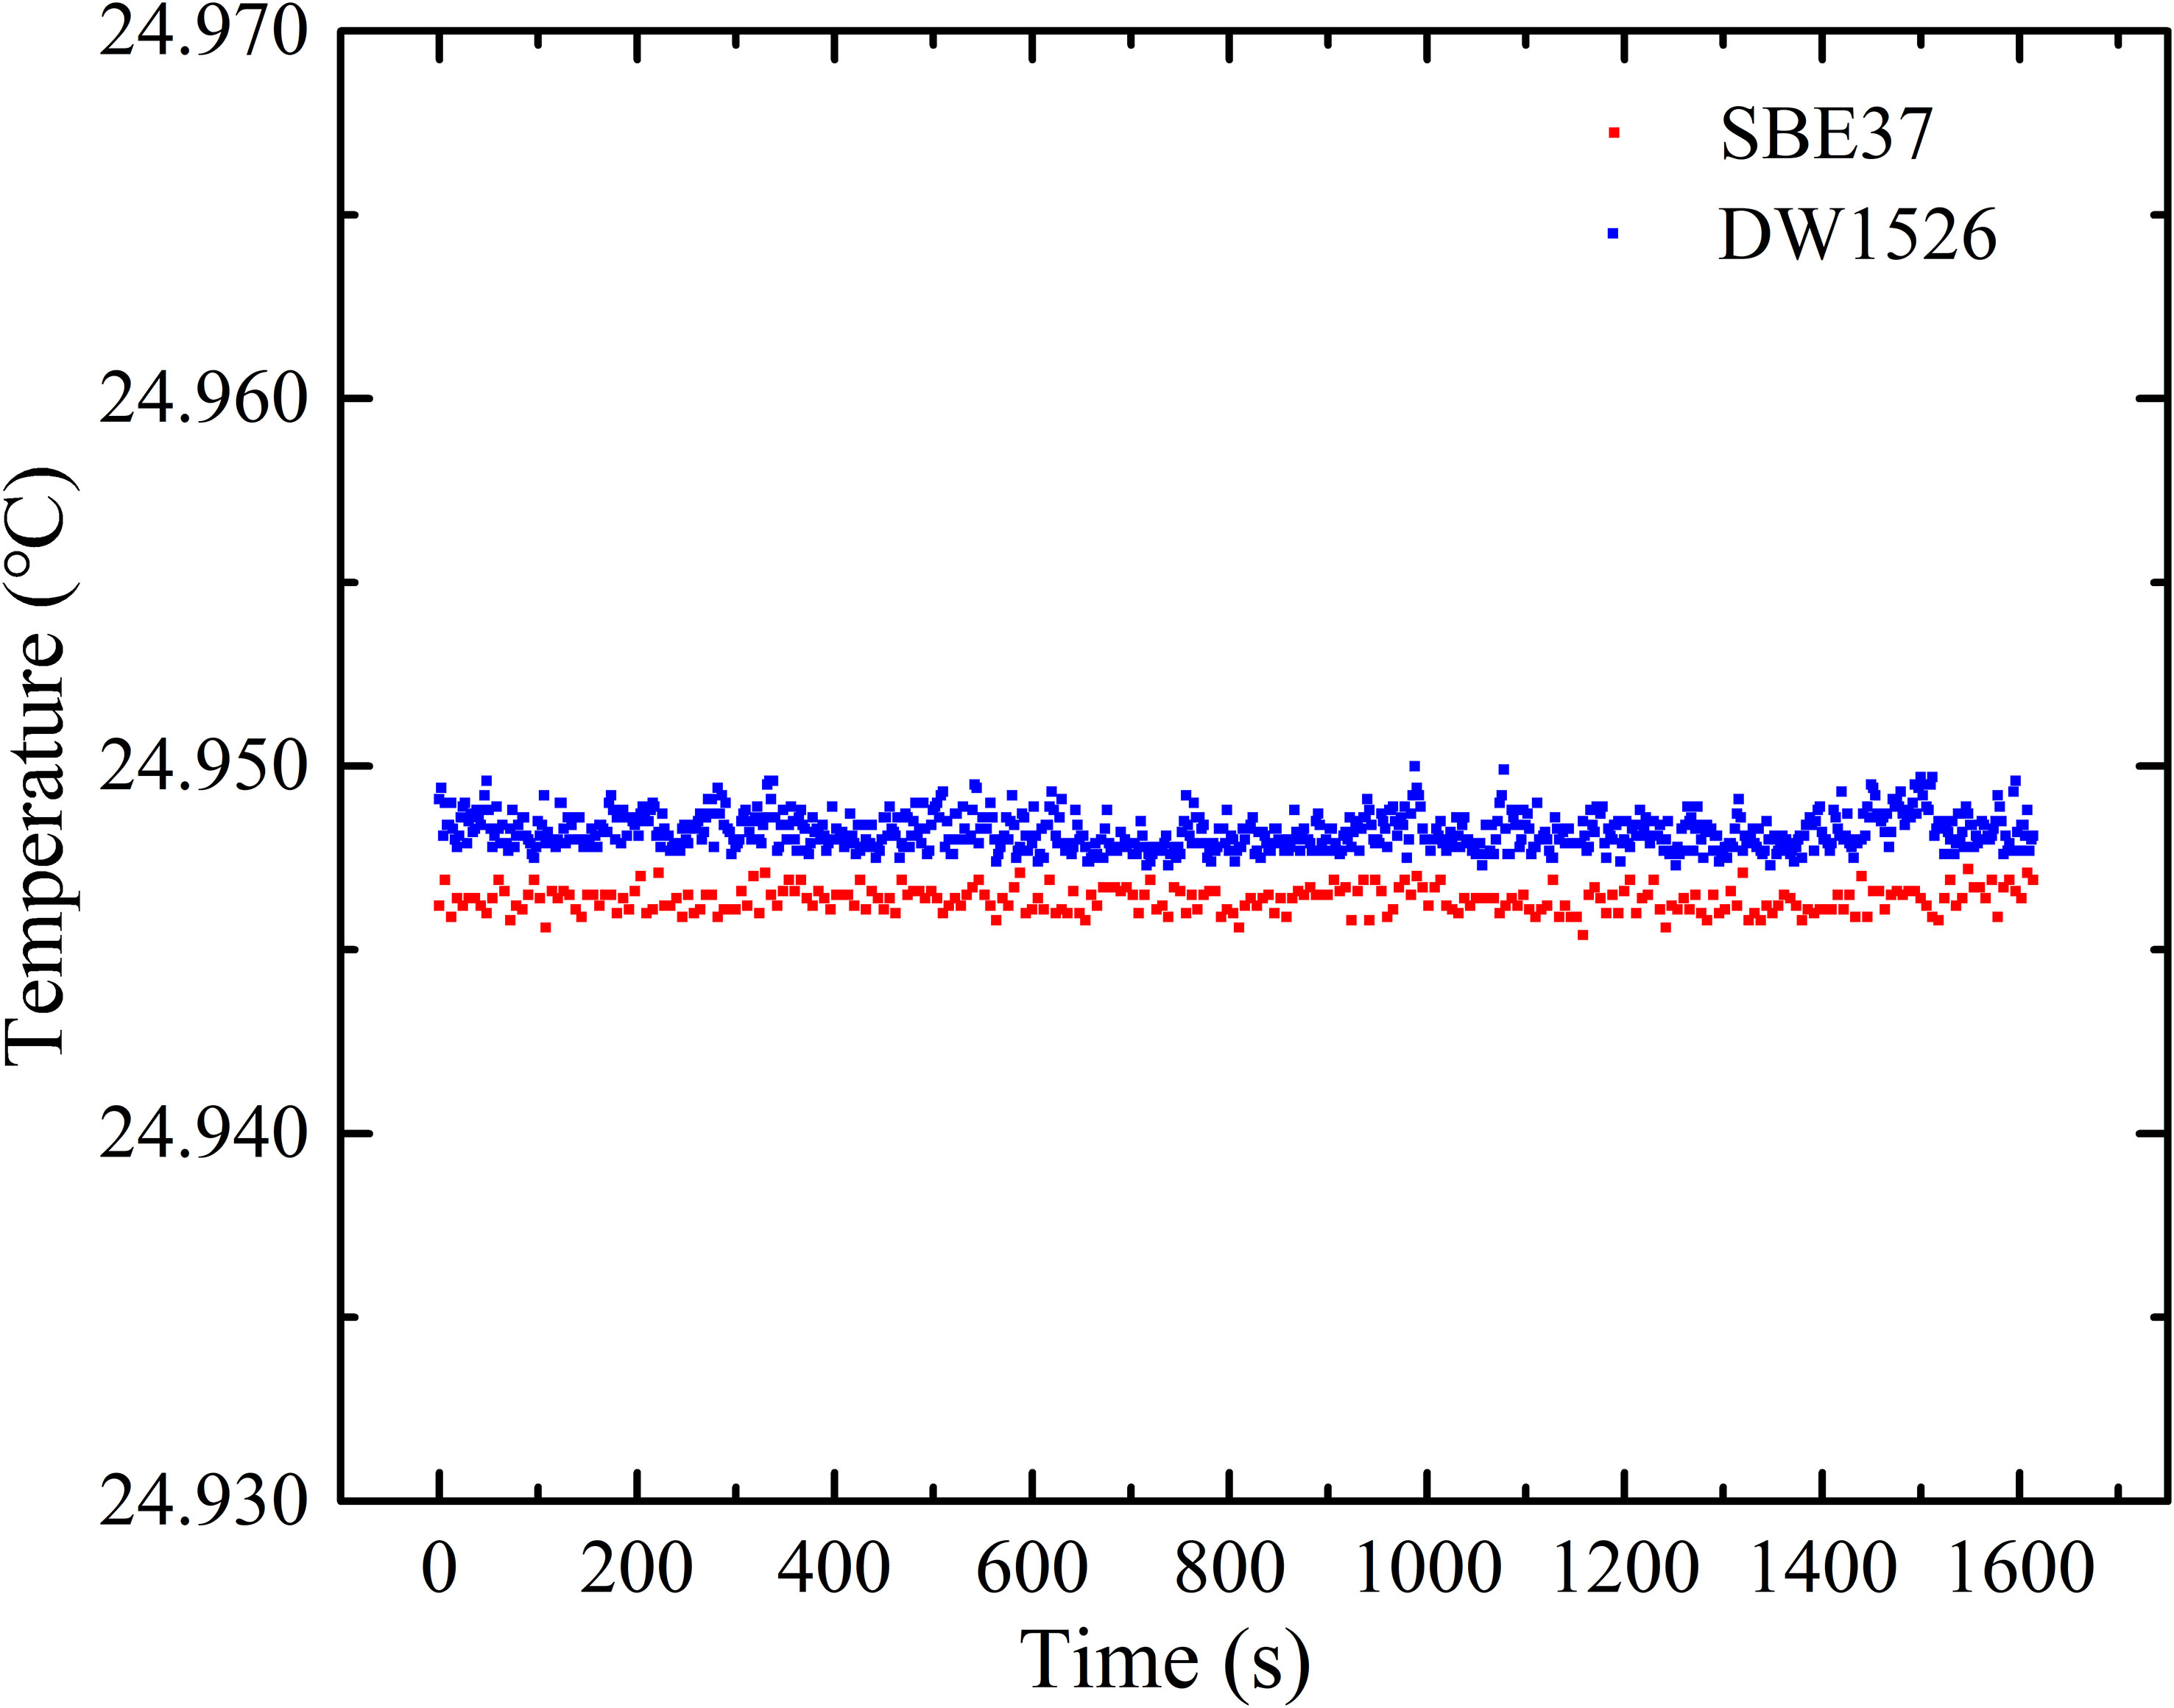
Figure 6 Measured temperature of DW 1526 and SBE 37.
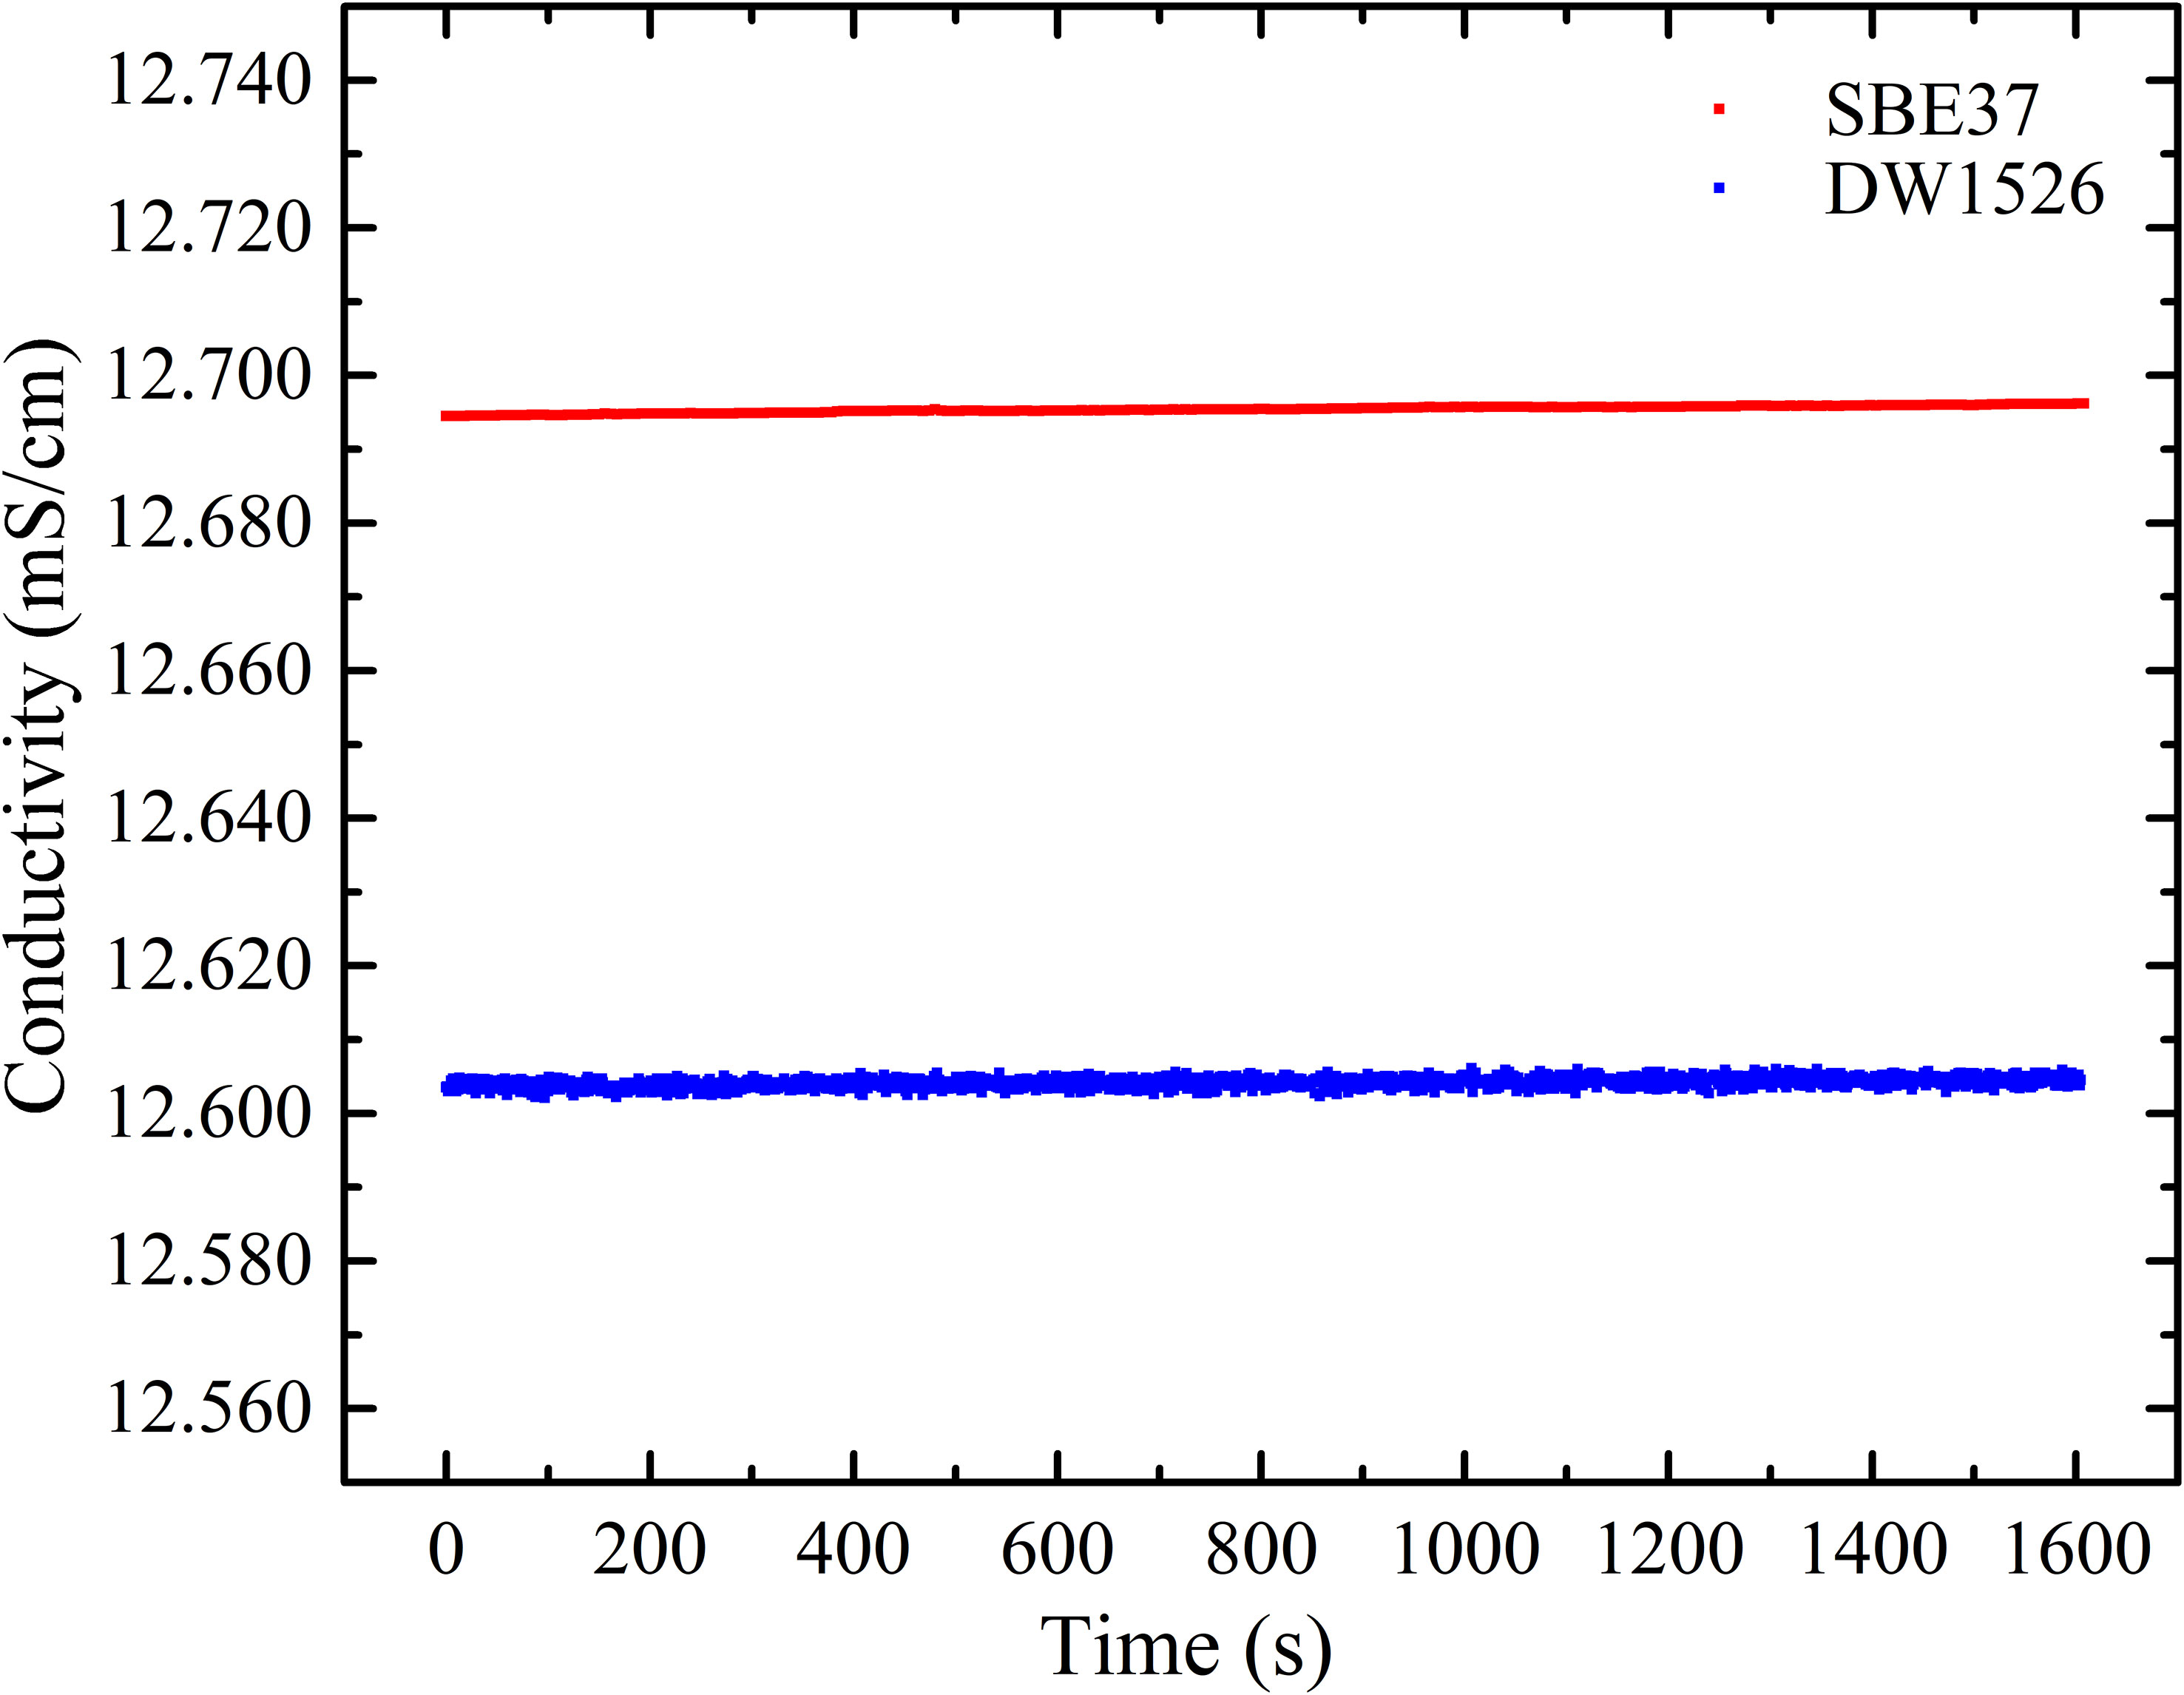
Figure 7 Measured conductivity results of DW 1526 and SBE 37.
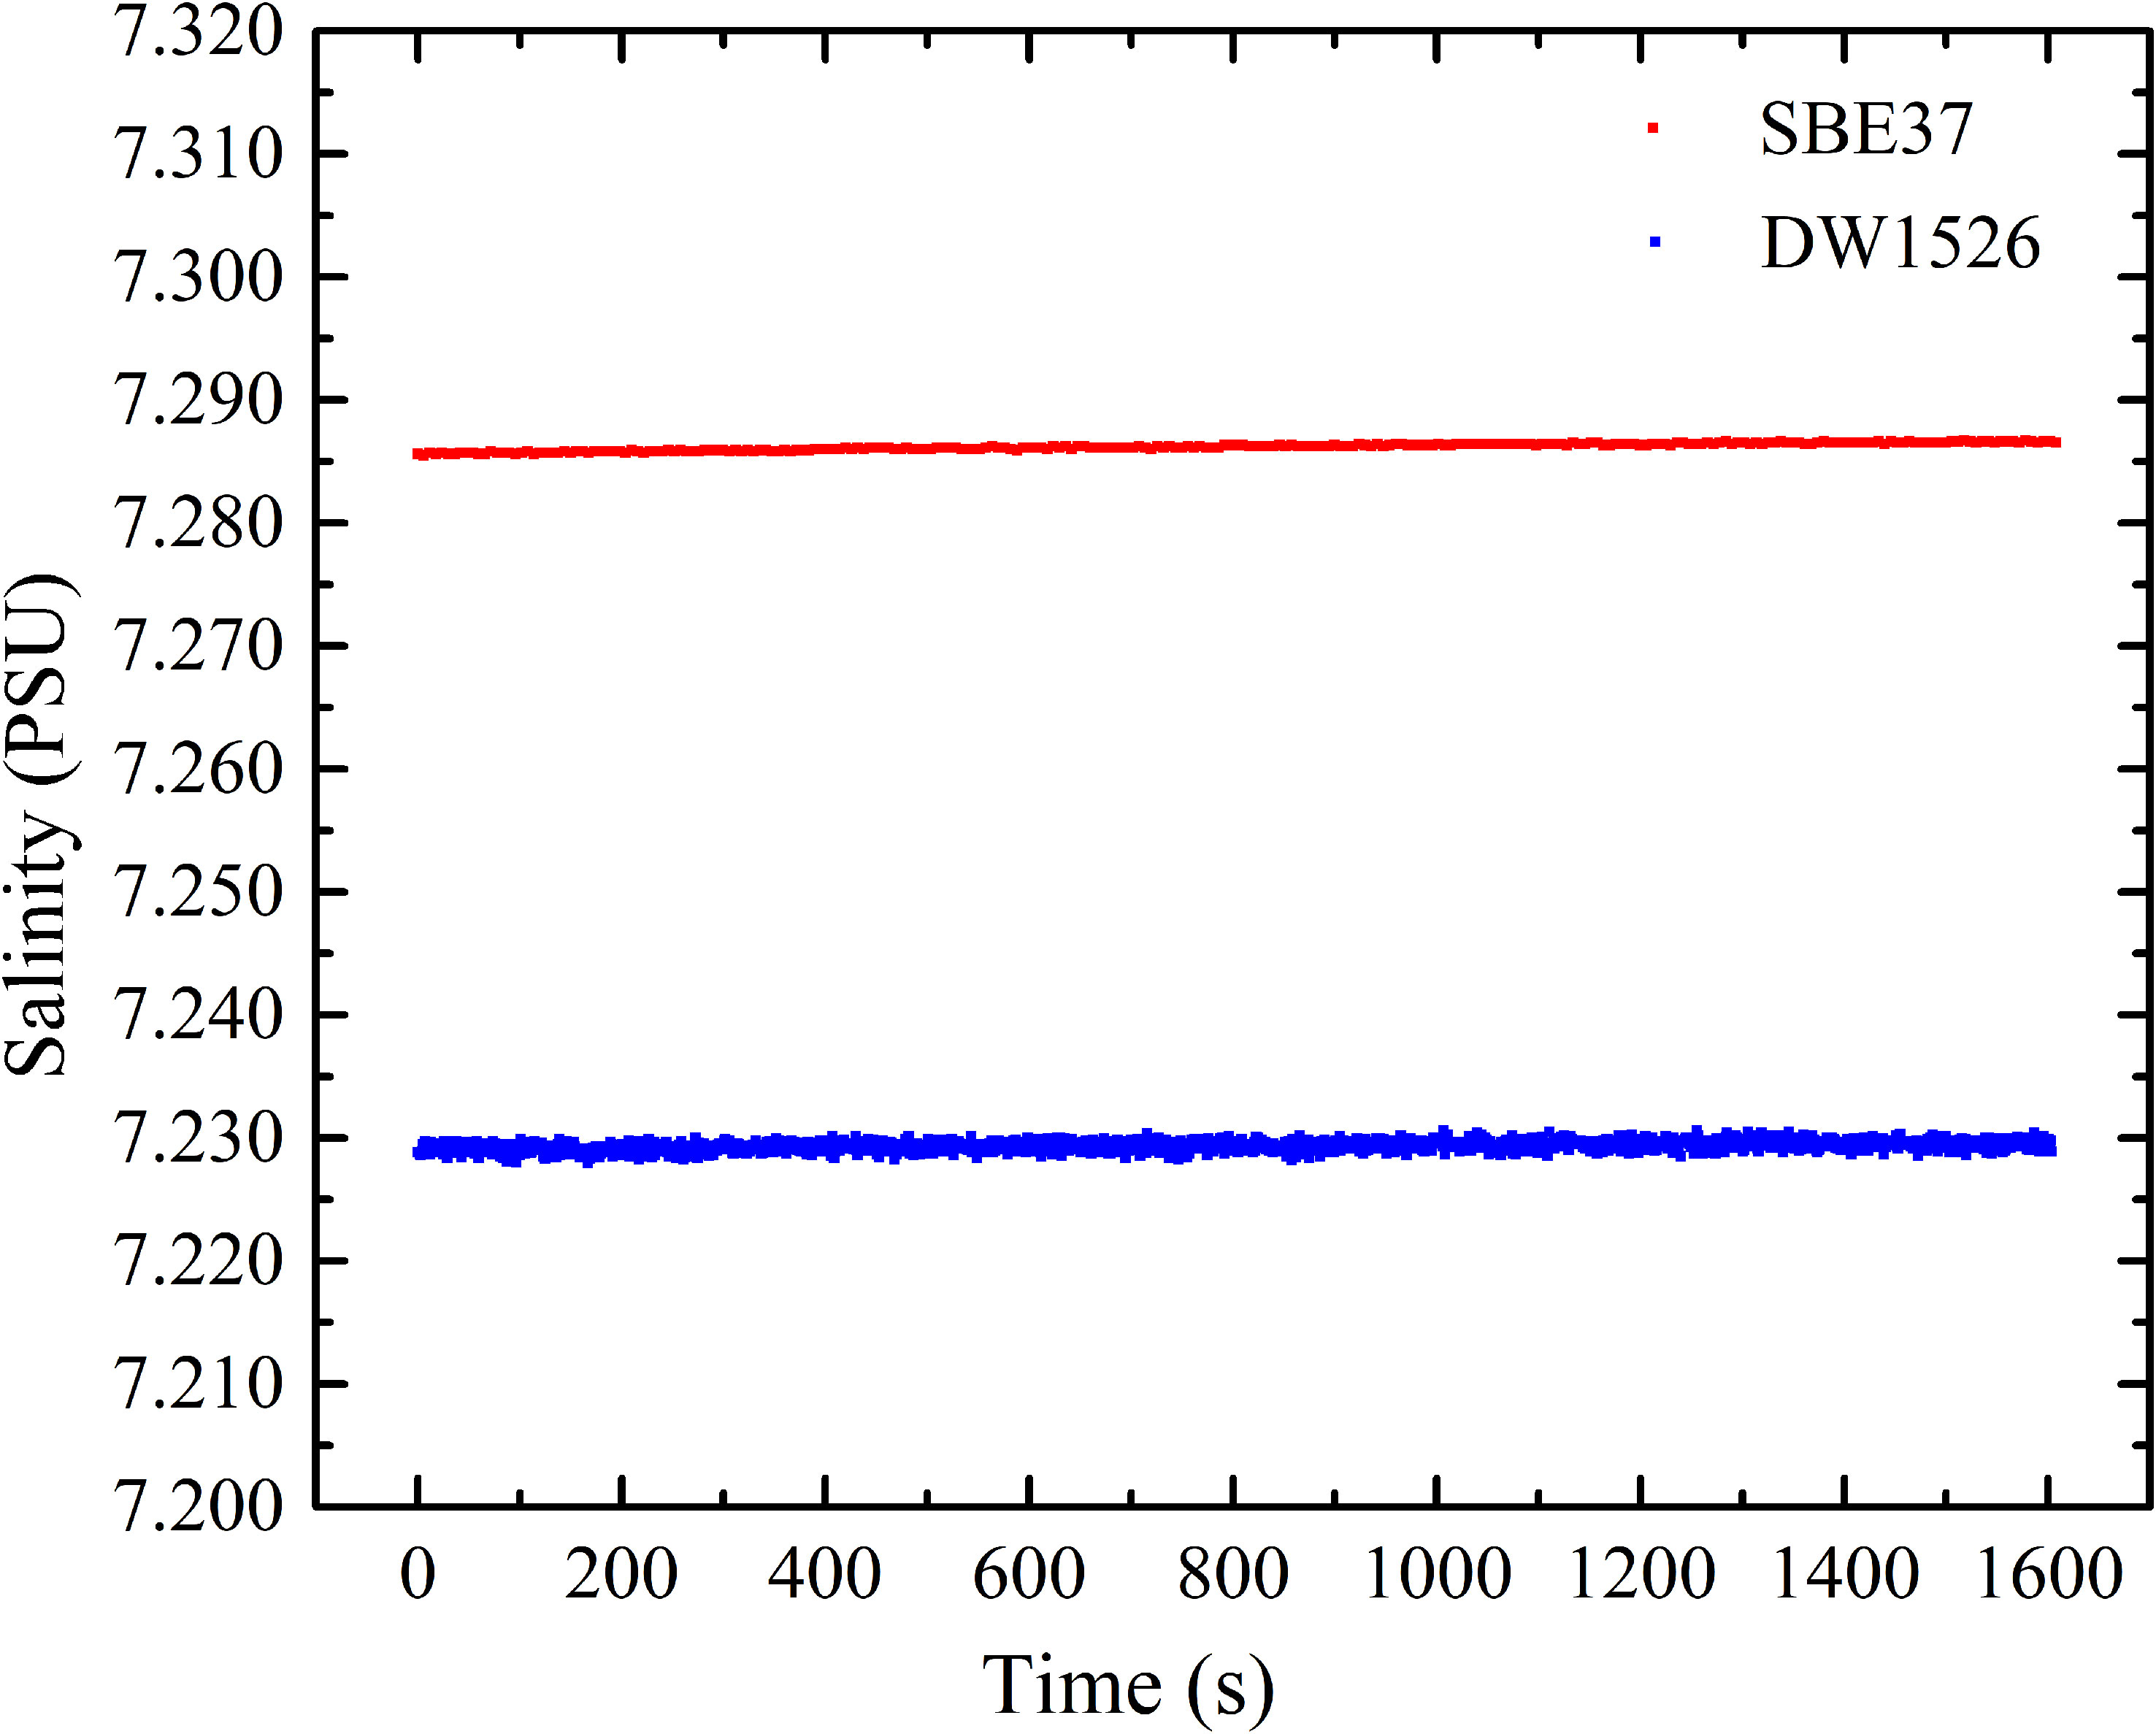
Figure 8 Comparison of calculated salinities between DW 1526 and SBE 37.
3 Method
3.1 Refractive index measurement
The optic refractive indices of solutions with different concentrations were measured by the optical refractometer at 25°C, as shown in Figure 9. To minimize the evaporation of solution affection on the measurement results, all samples under test were sealed in the constant temperature and humidity chamber for sufficient time to keep samples very close to the temperature. During test, the controlled temperature can be reached and stabilized in the shortest time, the measurement can be completed (generally within 30 minutes).
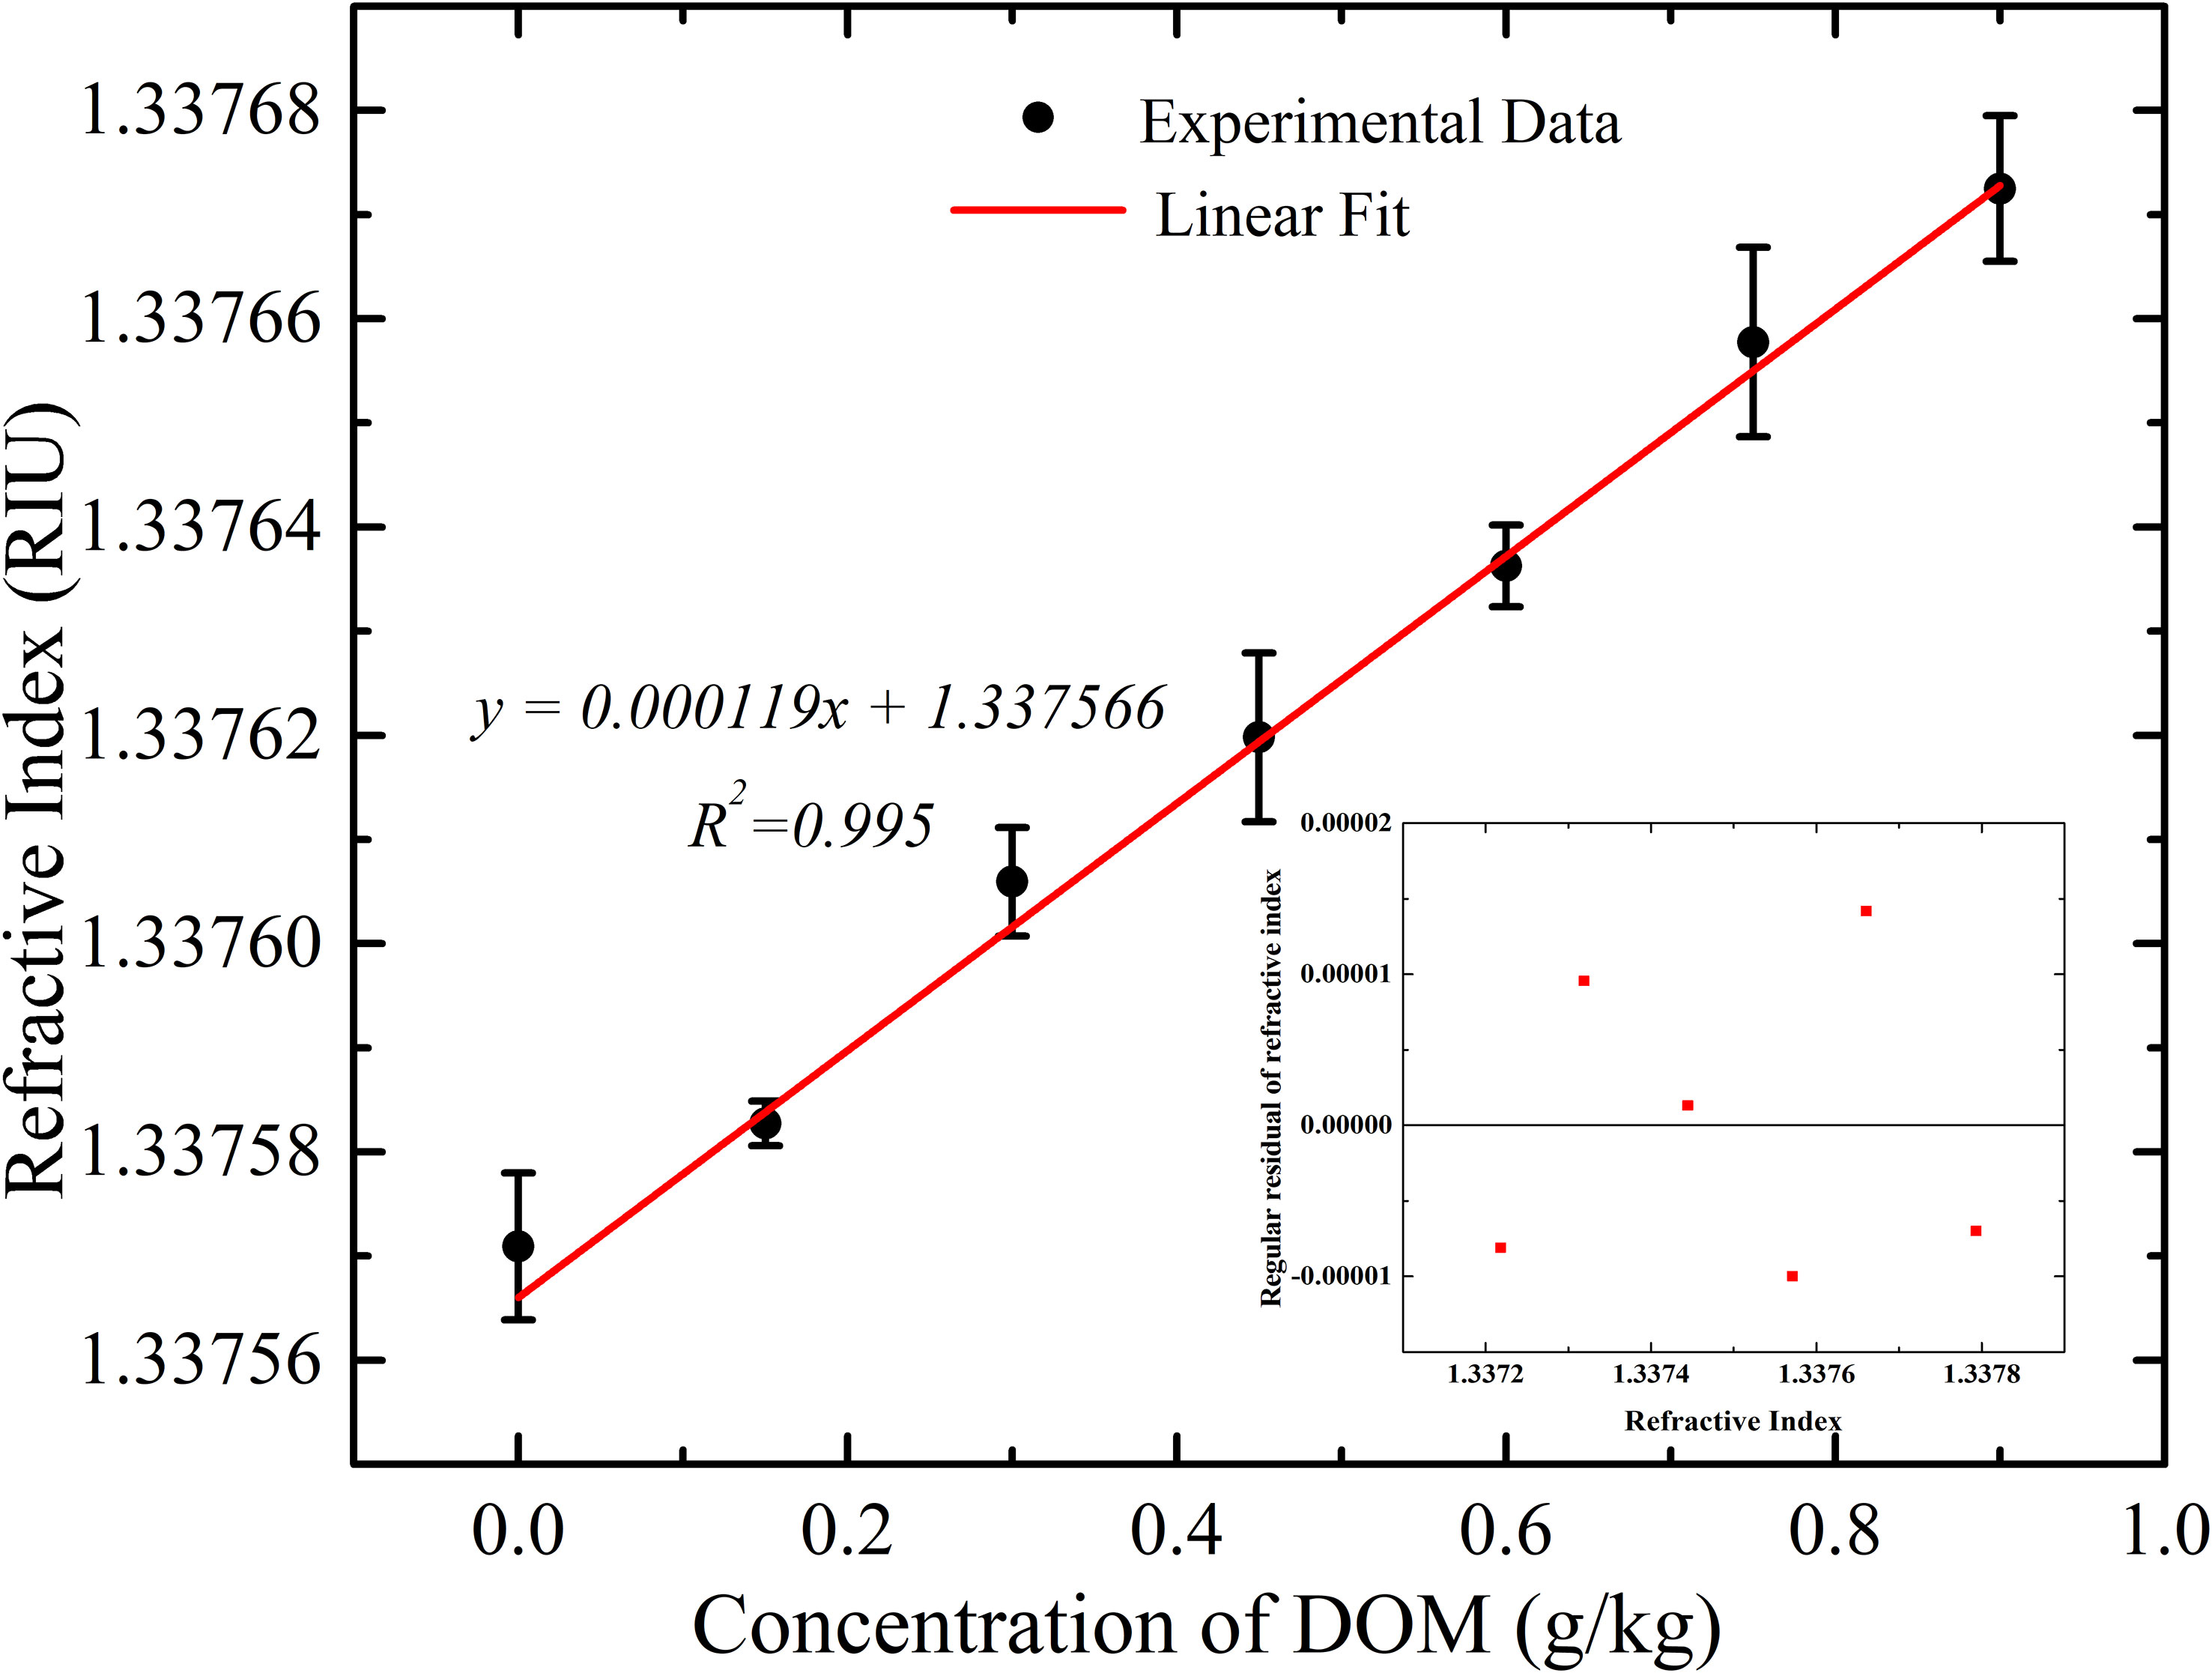
Figure 9 Variation of refractive index of seawater with the concentration of DOM.
The refractive index of the solution increases linearly with the increase of the DOM concentration. The result of the linear fitting demonstrated the relationship of 1.19 × 10⁻⁴ ±4×10⁻⁶ RIU/(g/kg of DOM) concentration. ±4×10⁻⁶ is the standard error after a linear fitting. The resolution of the DOM concentration of about 0.01 g/kg was achieved in this experiment. Insert in Figure 9 shows the regular residual of the refractive index measured by the optical refractometer.
The temperature was monitored during the refractive index measurement at each DOM concentration level. The fluctuation of temperature is shown in Figure 10. The average temperature fluctuation is smaller than 0.002°C which results in a refractive index uncertainty of 2.29×10⁻⁷ and salinity uncertainty of 0.001 PSU. Therefore, the increase of refractive index is mainly caused by the increase of DOM in Figure 9.
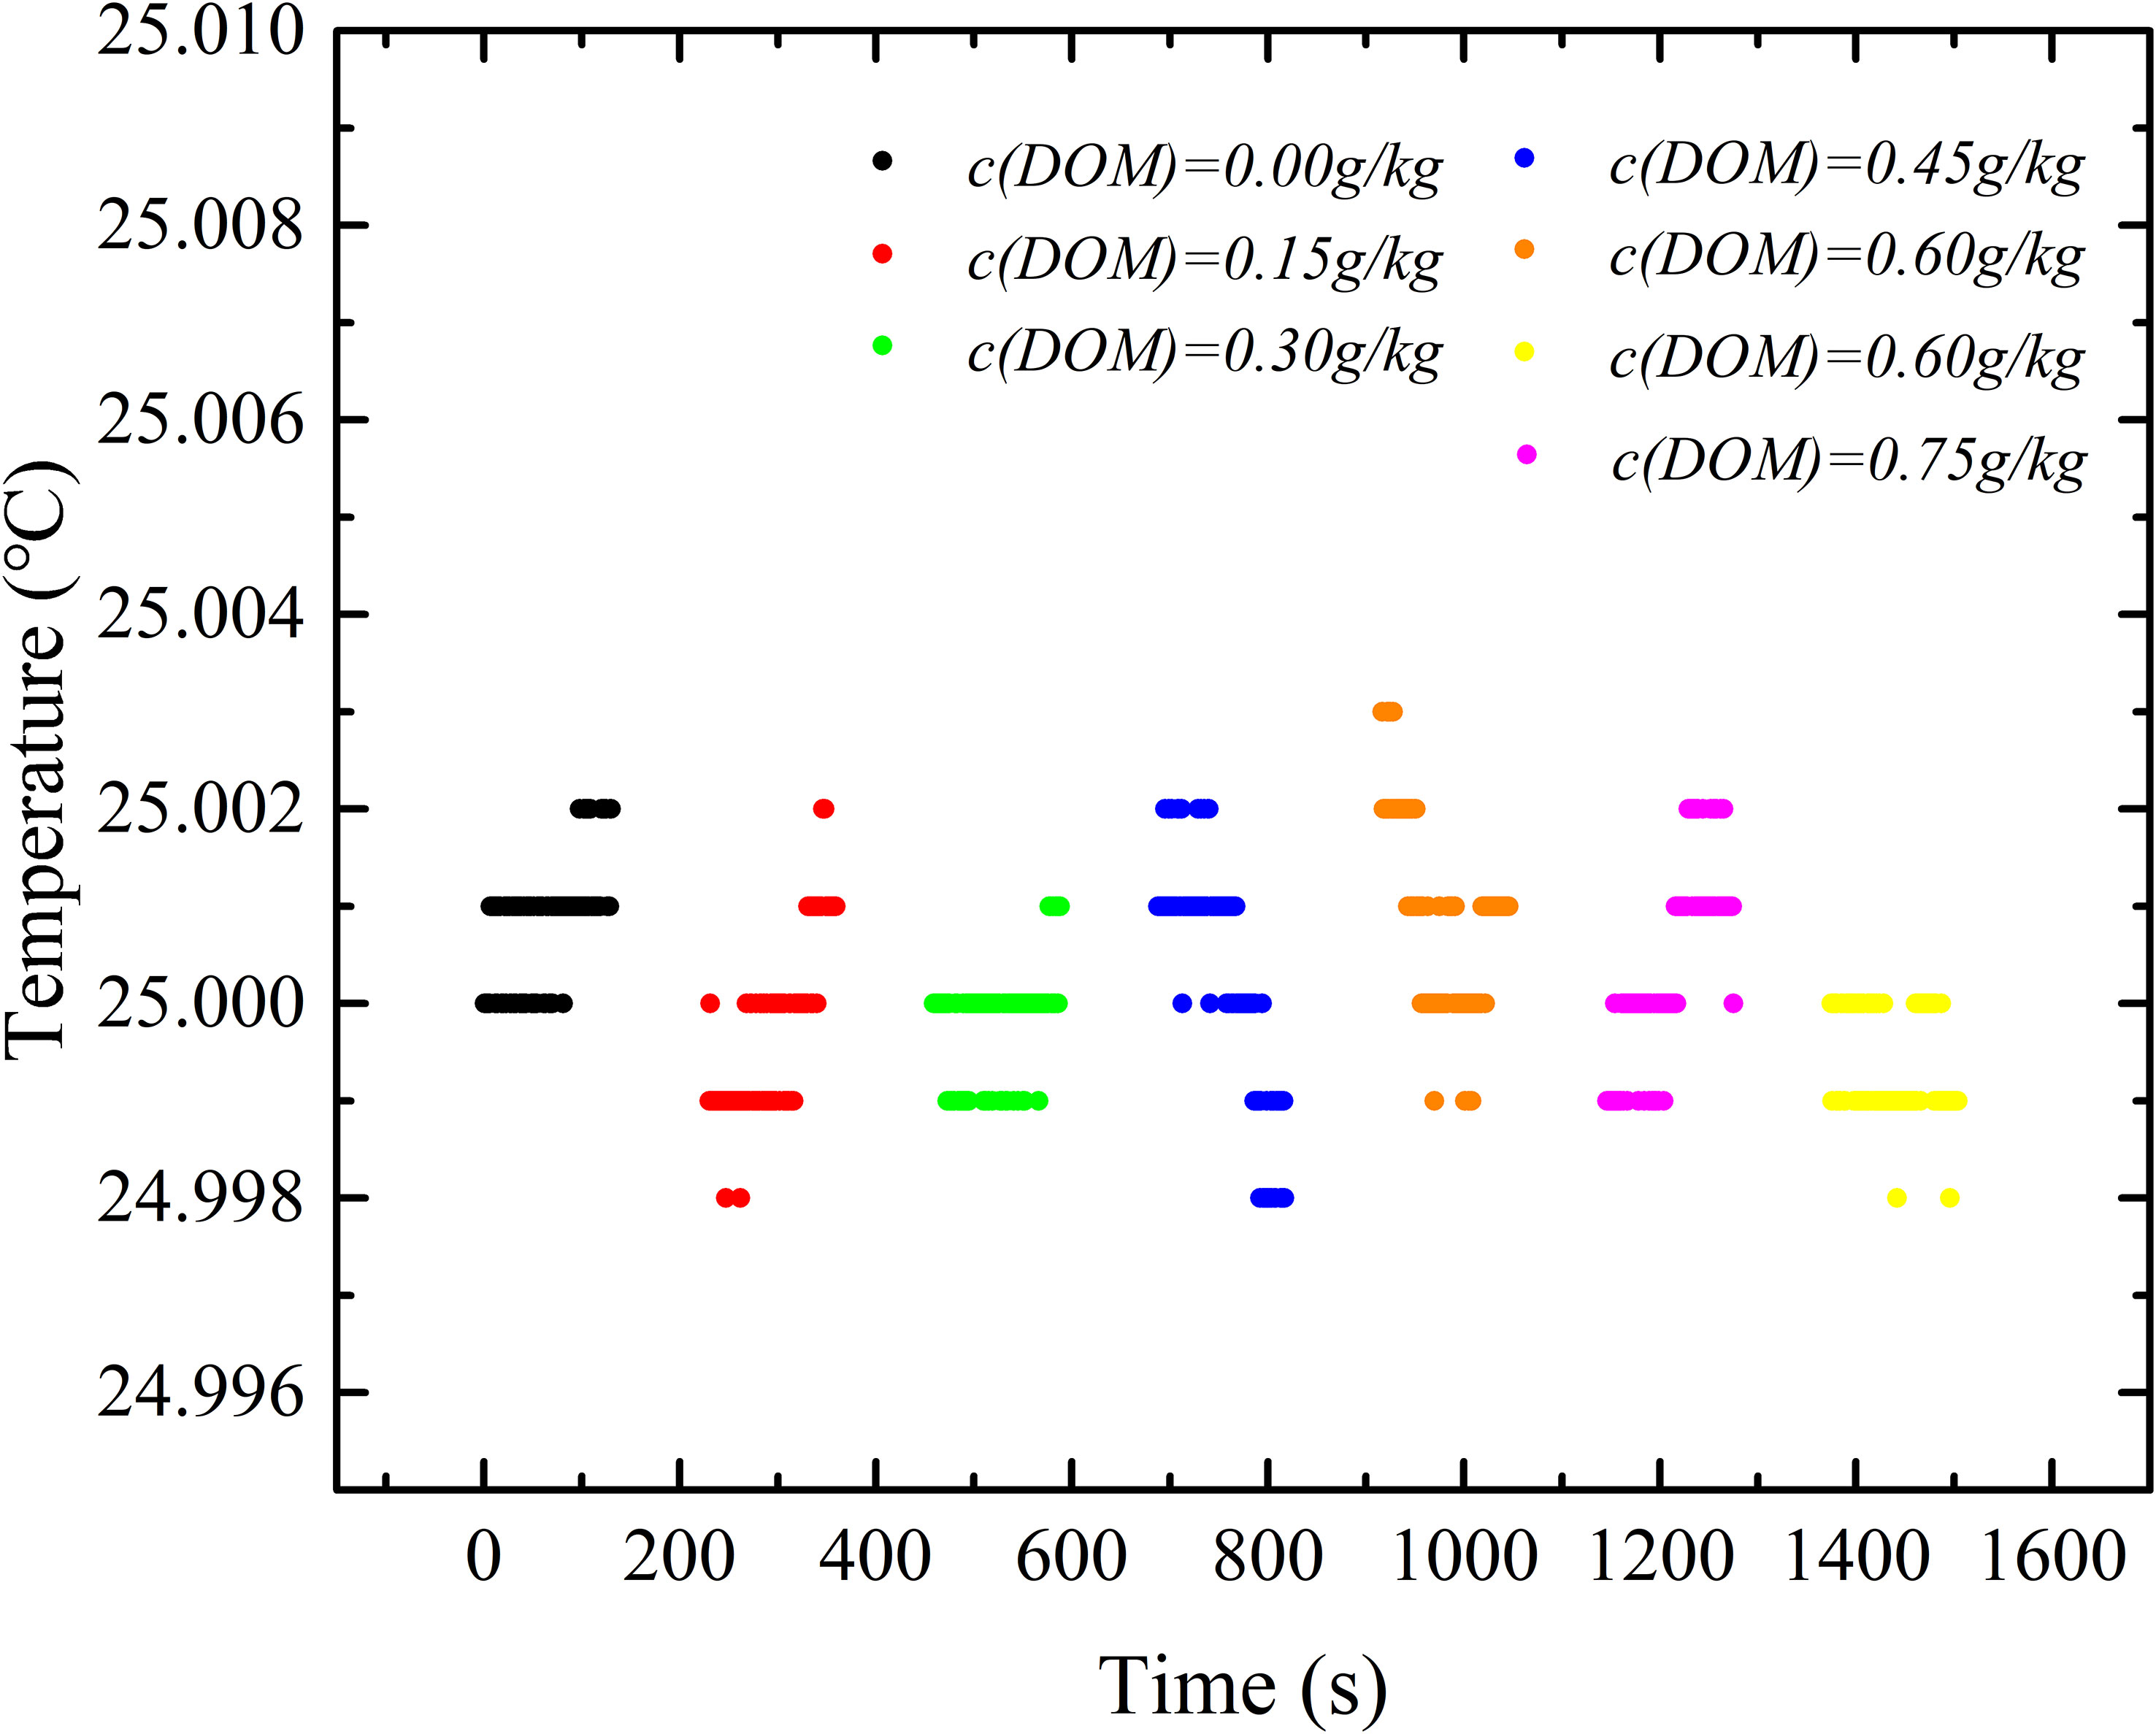
Figure 10 Temperature fluctuation during the optic measurement of various DOM concentrations.
3.2 Conductivity measurement
DW 1526 with DOM sample sealed in its conductance cell was immersed in the high-precision thermostatic water bath. Conductivity was measured when temperature of water bath was stabilized at 24.949 ± 0.002°C, as shown in Figure 11, which did not show obvious increase but decrease at a rate of 0.00065 ±0.00008 mS/cm, with increasing of DOM concentration. The insert figure in Figure 11 is the regular residual of measured conductivity. During the experiment, temperature fluctuation measured by DW 1526 was within 0.002°C, as shown in Figure 12, which resulted in a conductivity difference of 0.002 mS/cm.
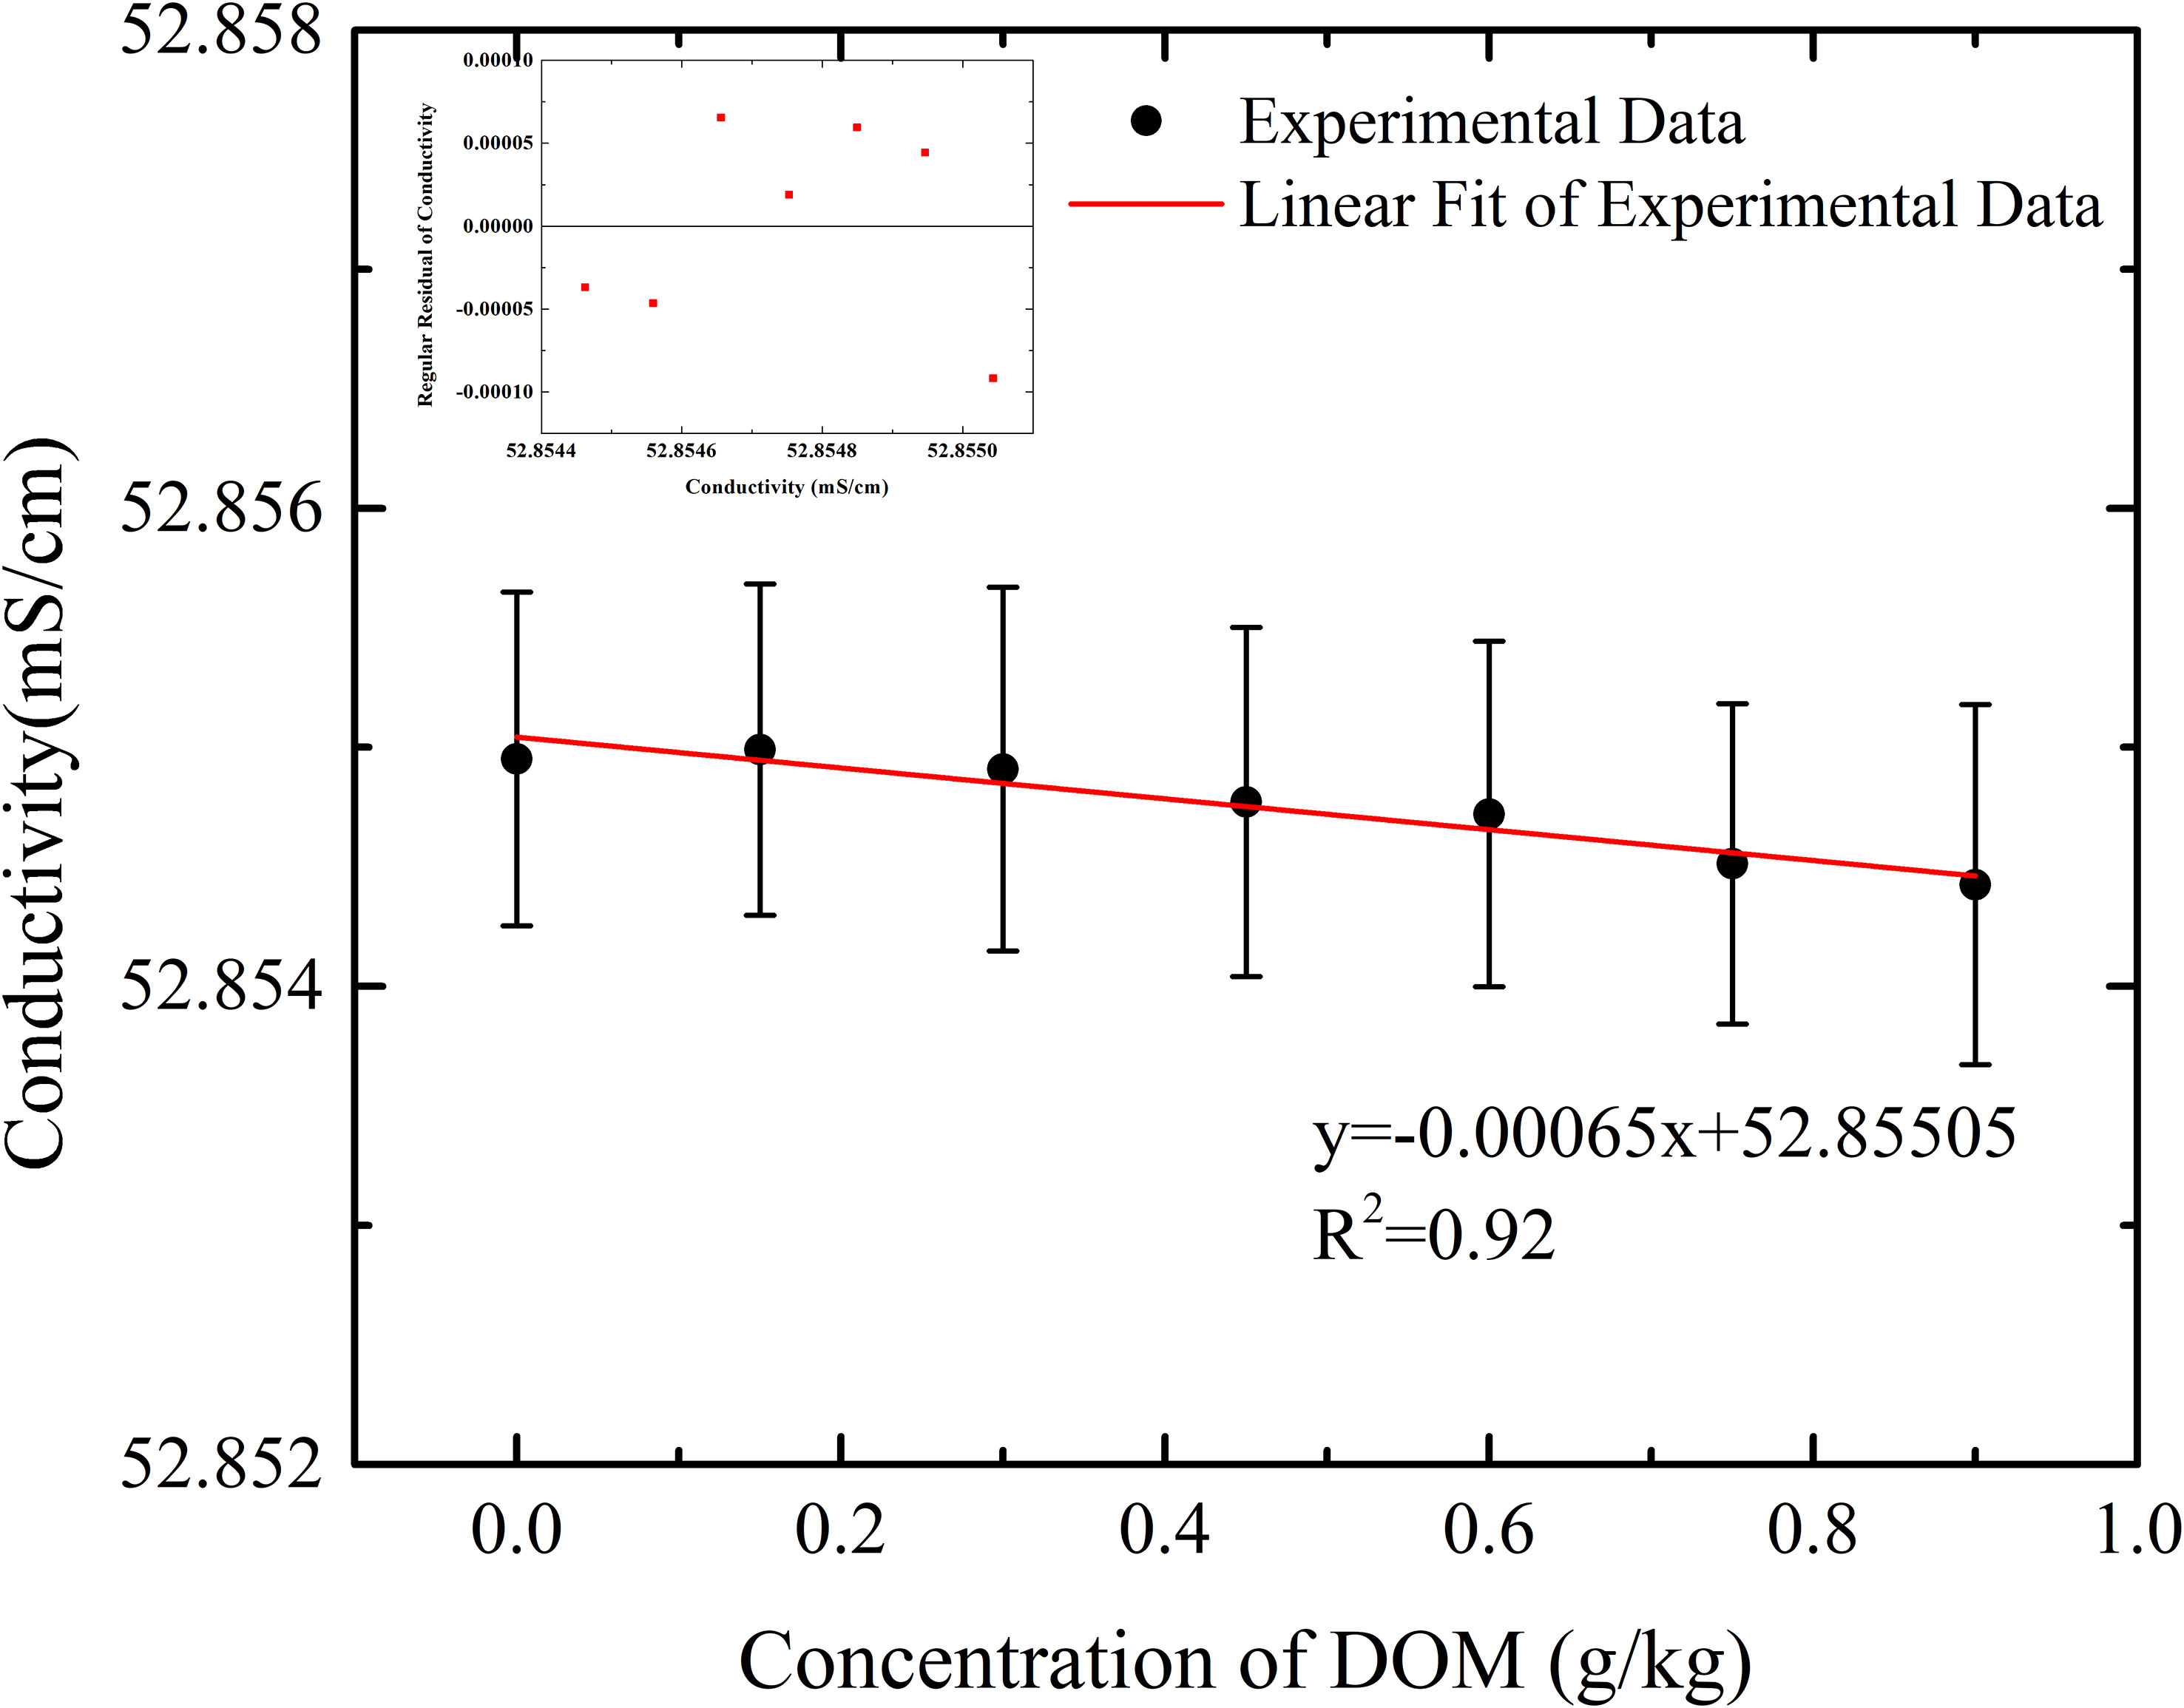
Figure 11 Electric conductivity results measured by DW 1526 at different DOM concentrations.
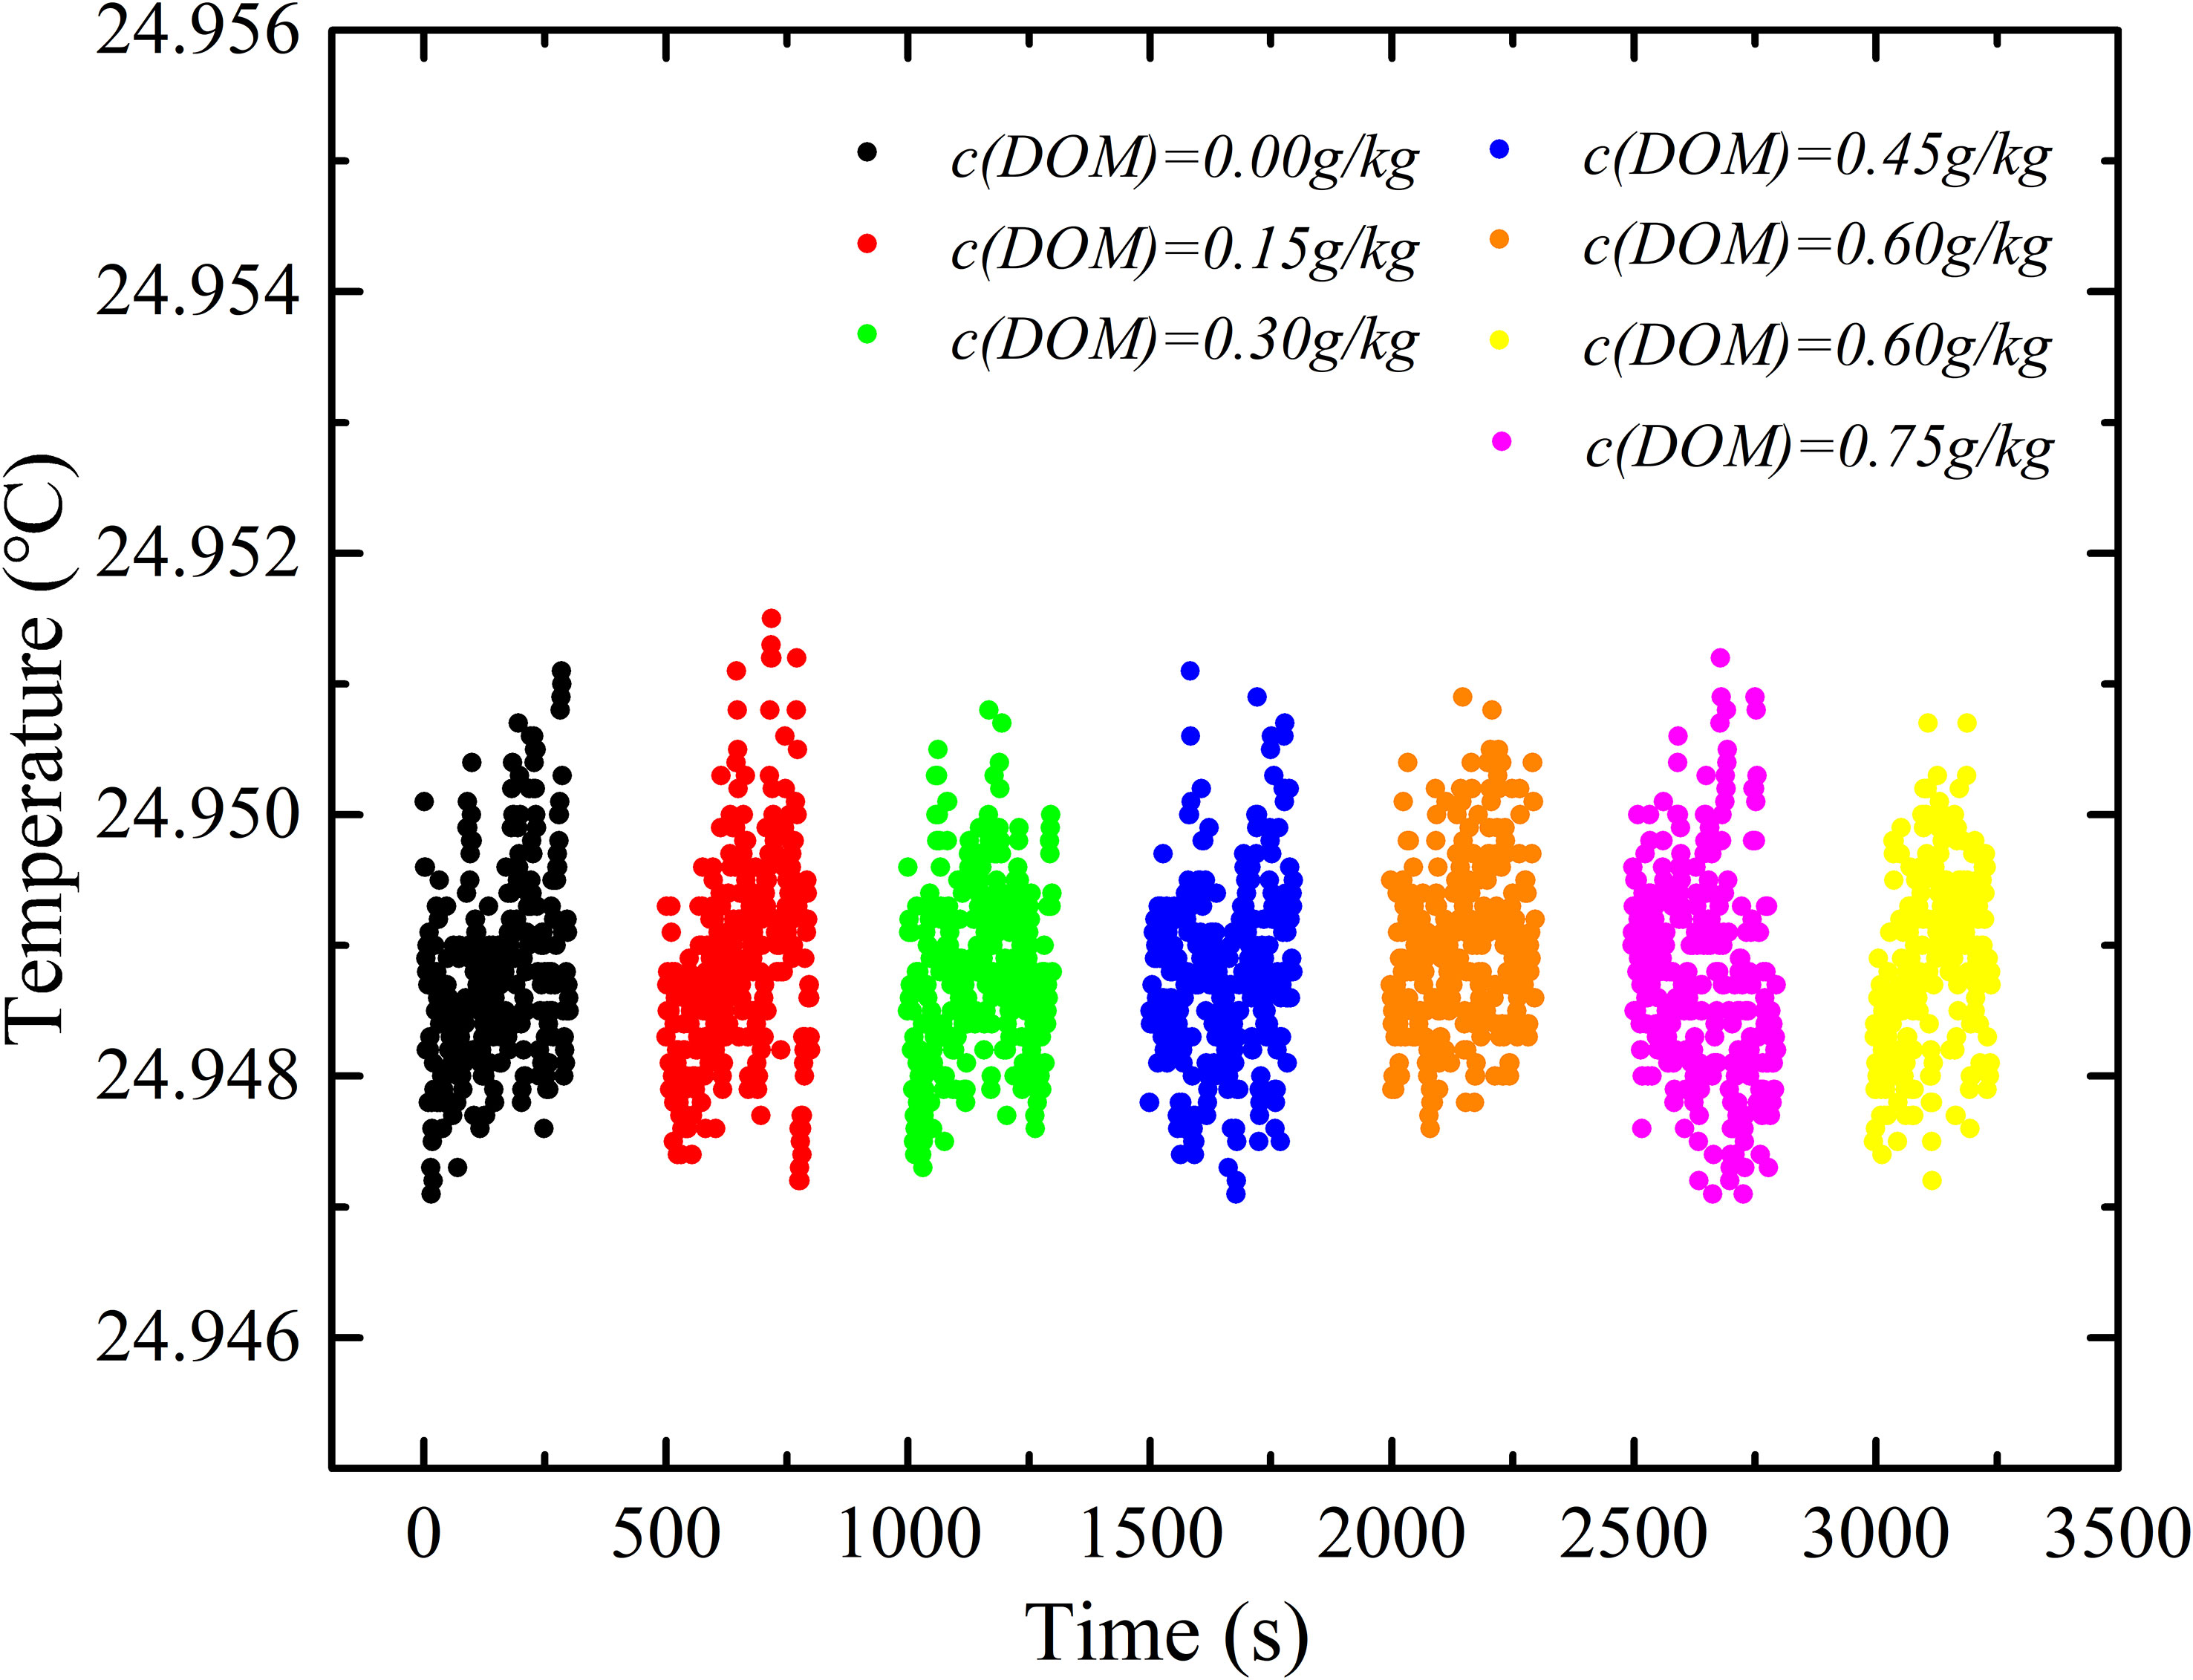
Figure 12 The temperature fluctuation during the electric conductivity experiment measured by DW 1526.
4 Results
The electric-based salinity was calculated by an equation given in PSS-78 (Perkin and Lewis, 1980) using the conductivity and temperature measured by DW 1526 and was corrected by the comparison results with SBE 37. The optics-based salinity was calculated using temperature and refractive index measured by optical refractometer by an equation given by Seaver and Millard. Optical refractive index method can measure the contribution of DOM concentration on seawater salinity better than conductivity method. It shows that for the same concentration of DOM added into the Chinese Standard Seawater (at 25.000°C), the salinity measured by optic method increases at rate of 0.697 ±0.036 PSU/(g/kg of DOM), while the salinity measured by electric conductivity increases at rate of -0.00052 ±0.0007 PSU/(g/kg of DOM) (the negative sign means decrease), which is well below the resolution of salinity measurement. But the decrease of the salinity is statistical and repeatable when temperature is well controlled. In Figure 13, the optical-based salinity is measured to be 35.003 but the electric-based salinity is 34.9371, when DOM concentration is 0 g/kg. The difference on salinity (35.003-34.9371 = 0.0659 PSU) might be caused by two reasons: (1) There are salinity difference of 0.055 PSU between DW 1526 and SBE 37. (2) the covers on the two-ends of the conductance cell which might block the electric field to the water. We had proved that the covers would not affect the measurement of the relative change of salinity during experiment by measuring Chinese Standard Seawater with different salinity using the DW1526 with both ends of the conductivity cell plugged with rubber. Practical salinity and the measured salinity by DW1526 with both ends of the conductivity cell plugged with rubber are shown in Table 3. The difference between calibrated value of Chinese Standard Seawater and measured salinity by DW 1526 are 0.0652~0.0662 PSU which is consistent with the difference shown in Figure 13.
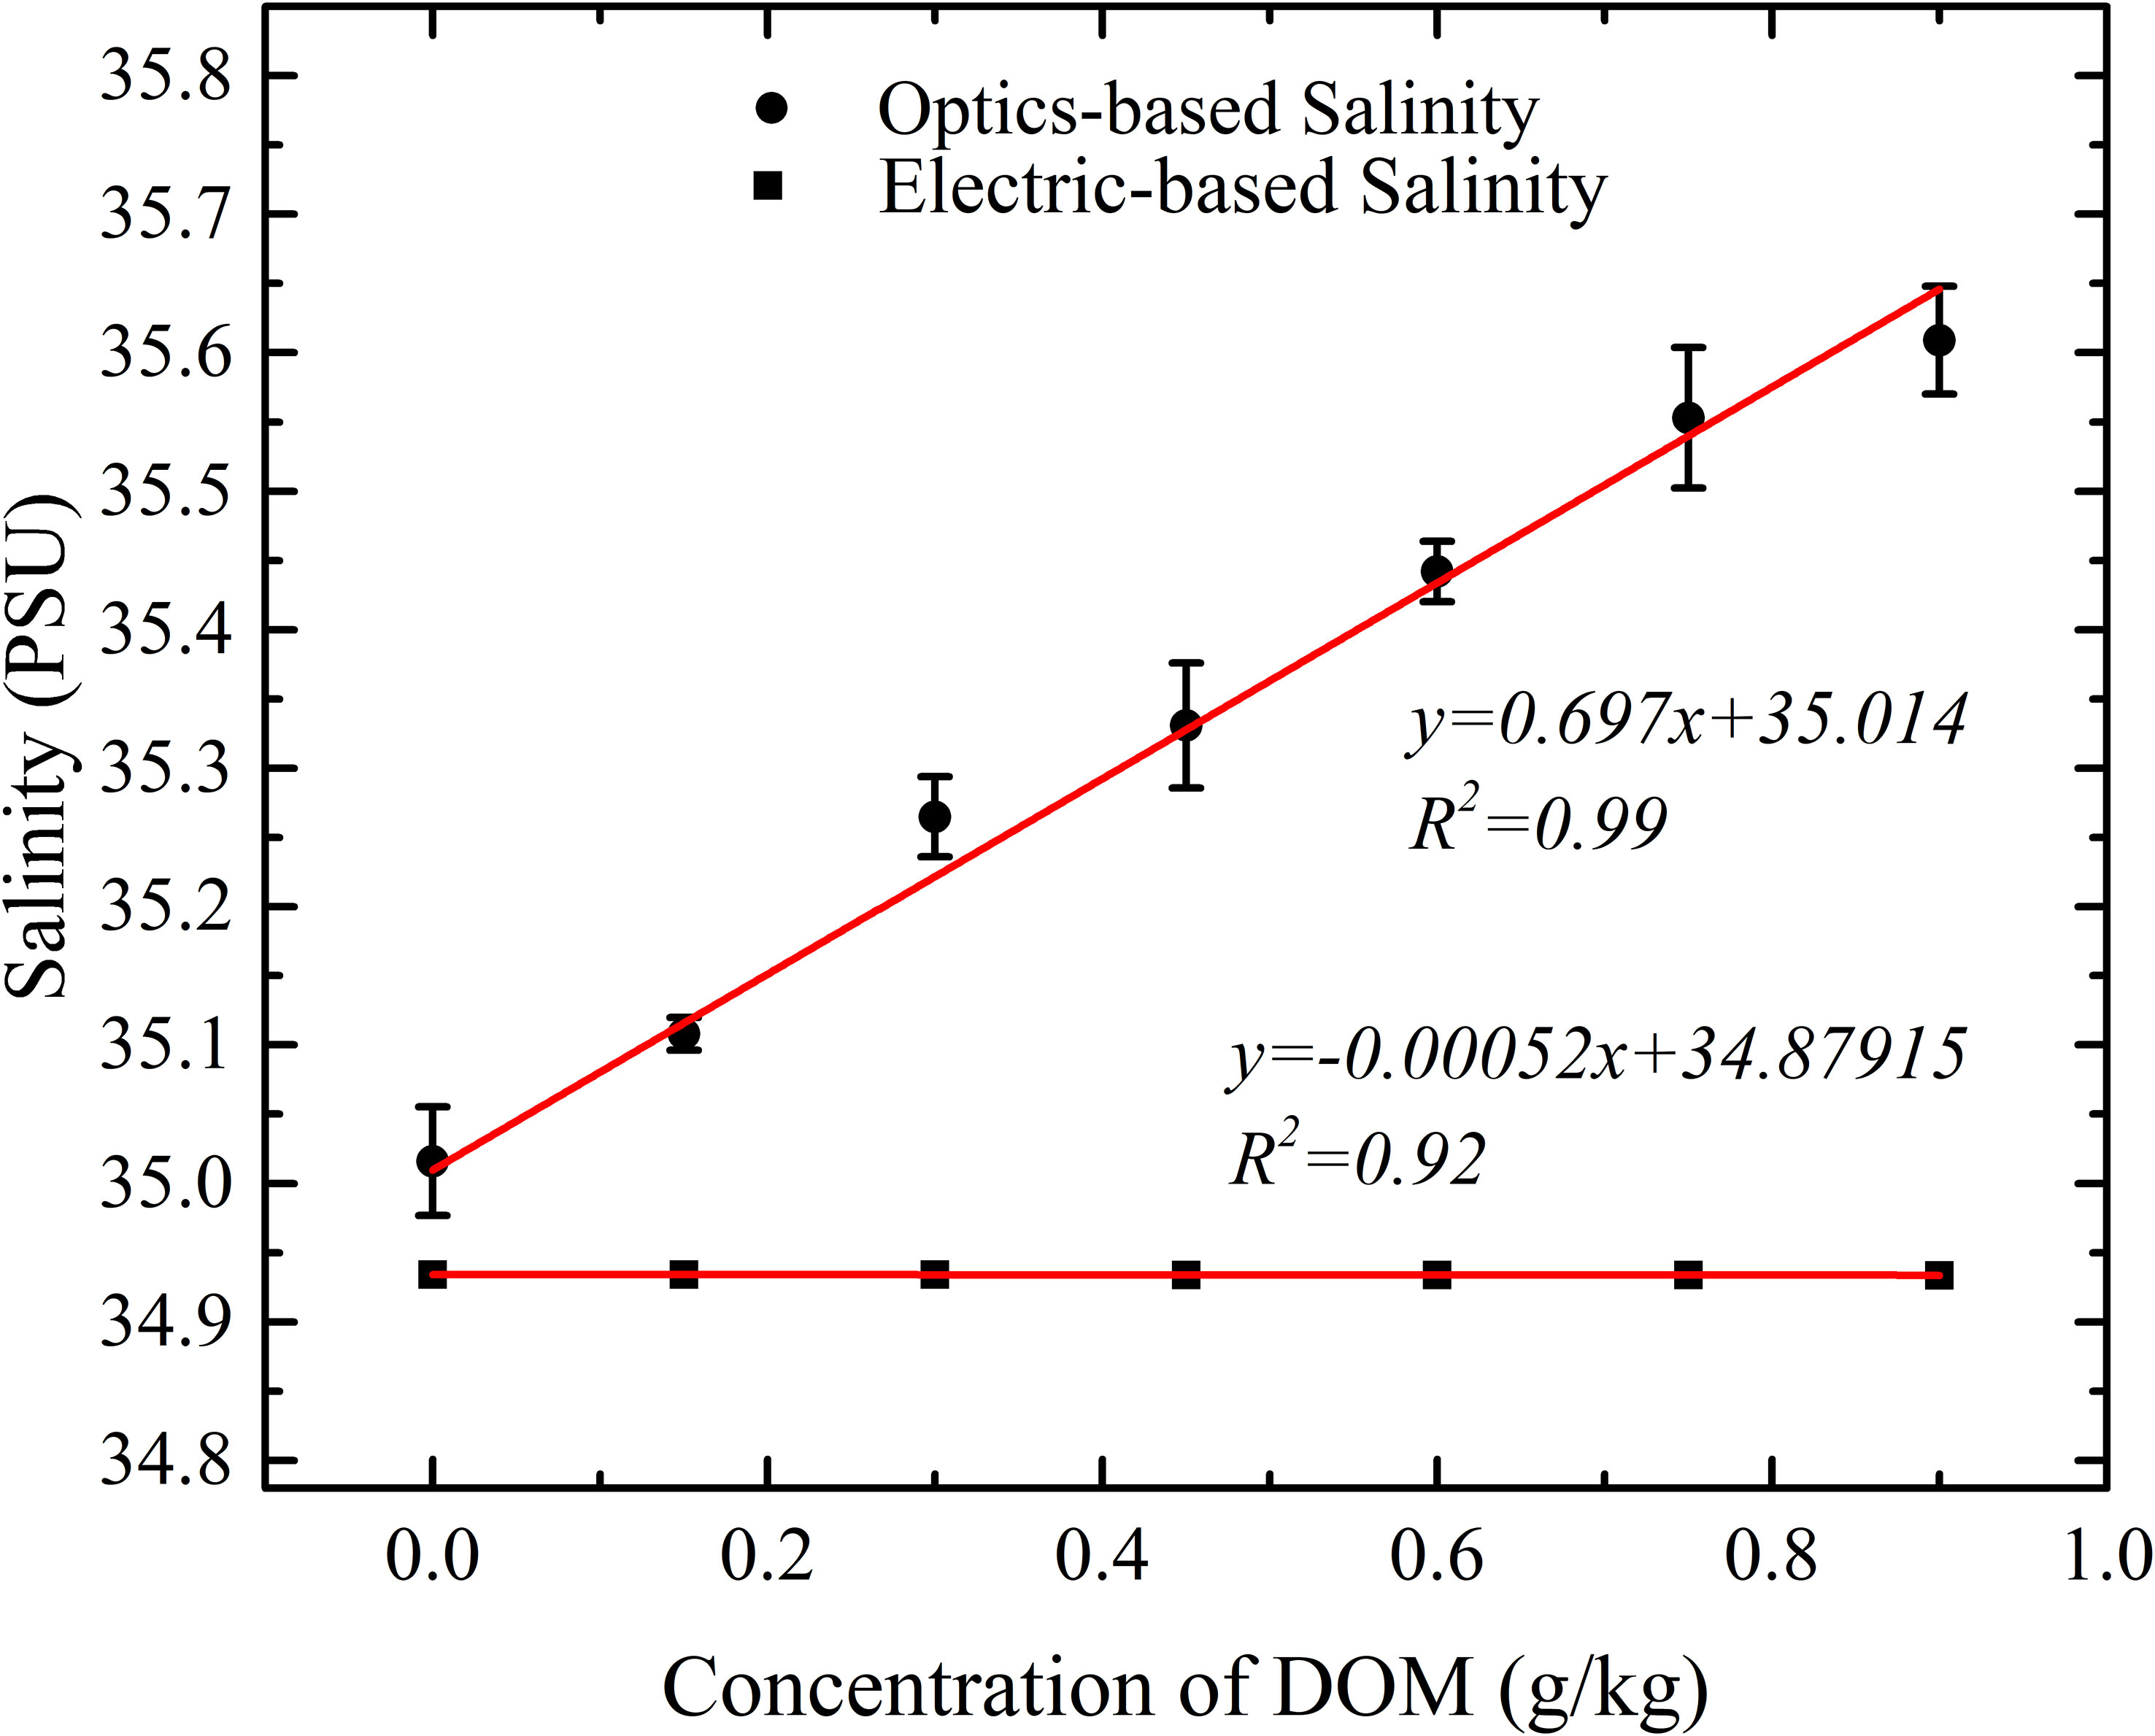
Figure 13 Salinity with DOM concentration measured by optic and electric methods.
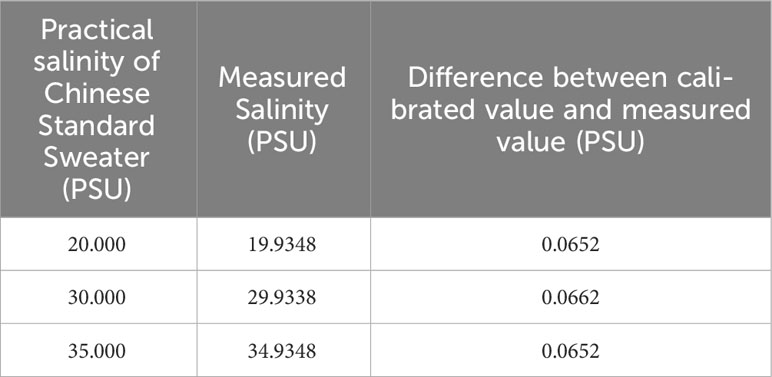
Table 3 Practical salinity of Chinese Standard Sweater and the measured salinity by DW 1526 with both ends of the conductivity cell plugged with rubber.
5 Summary and conclusion
Based on a V-shaped groove optical refractometer with a resolution of 1.10 ×10⁻⁶ RIU, DOM extracted from natural seawater of Aoshan Bay was added into Chinese Standard Seawater for the study of the contribution of DOM on refractive index and salinity. To our best knowledge, this is the first time to study the influence of DOM on salinity. Furthermore, the salinity results were compared between the optics-based and the electric conductivity-based measurement, which demonstrated that the optical refractometer could represent the contribution from both ionized and non-ionized substances dissolved in the seawater, such as DOM, while the electric conductivity measurement could only represent the contribution of the ionized substance dissolved in seawater. By comparing the optics-based salinity and electric-based salinity, the contributions of dissolved organic matters or non-conductive matters and dissolved conductive matters to salinity are distinguished. The content of non-conductive matters is of great significance for absolute salinity estimating, global carbon cycle, marine microbiology and so on. Moreover, to measure contributions of DOM to optics-based salinity in natural seawater, the resolution and accuracy of optical refractometer need to be further improved, as for natural seawater, the content of inorganic salts is high and the content of DOM is relatively low.
Data availability statement
The original contributions presented in the study are included in the article/supplementary material. Further inquiries can be directed to the corresponding authors.
Author contributions
CZ, YX, WG, JS, and CW contributed to conception and design of the study. JS and CW provided specific guidance and help for the experimental ideas and methods of the manuscript and provided resources of the study. CZ, YX, and YF are the main designers of the experiments and data analysis method. CZ organized and carried out the experiments. JS, YF, and WG helped to select and approve the main devices in the experimental system and data processing. ZZ helped in DOM extraction and DOM component analysis. SC and AW validated the data and provided help in the ideas, structure and language expression of the article. CZ wrote the first draft of the manuscript. JS, CW, and WG revised the draft of the manuscript word by word. All authors contributed tomanuscript revision, read, and approved the submitted version.
Funding
This work was supported in part by Natural Science Foundation of Shandong Province under Grant ZR2020QD088, in part by Southern Marine Science and Engineering Guangdong Laboratory (Guangzhou) under grant number GML2021GD0808, in part by the Key Technology Research and Development Program of Shandong under Grant 2019JZZY020711, in part by Key Technologies Research and Development Program of China under Grant 2019YFC1408600.
Acknowledgments
The authors thank Dr Guixue Song for providing marine DOM samples and instrumental analytical results of samples.
Conflict of interest
The authors declare that the research was conducted in the absence of any commercial or financial relationships that could be construed as a potential conflict of interest.
Publisher’s note
All claims expressed in this article are solely those of the authors and do not necessarily represent those of their affiliated organizations, or those of the publisher, the editors and the reviewers. Any product that may be evaluated in this article, or claim that may be made by its manufacturer, is not guaranteed or endorsed by the publisher.
References
Aiken G., McKnight D. M., Thorn K. A., Thurman E. M. (1992). Isolation of hydrophilic organic acids from water using nonionic macroporous resins. Organ Geochemist. 18 (4), 567–573. doi: 10.1016/0146-6380(92)90119-I
André X., Le Traon P.-Y., Le Reste S., Dutreuil V., Leymarie E., Malardé D., et al. (2020). Preparing the new phase of argo: technologica developments on profiling floats in the NAOS project. Front. Mar. Sci. 7. doi: 10.3389/fmars.2020.577446
Asakawa K., Ishihara Y., Takahashi Y., Sugiyama T., Araya A. (2010). Basic experiments on measurement of salinity using a heterodyne Michelson interferometer. OCEANS 2010 MTS/IEEE SEATTLE. IEEE 2010, 1–5. doi: 10.1109/OCEANS.2010.5664536
Datasheet of signal processing circuits for PSD C9068-1, C9069-1, HAMAMATSU. Available at: www.hamamatsu.com/content/dam/hamamatsu-photonics/sites/documents/99_SALES_LIBRARY/ssd/c9068-01_etc_kacc1319e.pdf.
Grosso P., Le Menn M., De La J. L. D. B., Wu Z. Y., Malardé D. (2010a). Practical versus absolute salinity measurements: New advances in high performance seawater salinity sensors. Deep Sea Res. Part I: Oceanographic Res. Papers 57 (1), 151–156. doi: 10.1016/j.dsr.2009.10.001
Grosso P., Malardé D., Le Menn M., Wu Z. (2010b). Refractometer resolution limits for measuring seawater refractive index. Optical Eng. 49 (10), 103603. doi: 10.1117/1.3497571
Gruber N., Clement D., Carter B. R., Feely R. A., Van Heuven S., Hoppema M., et al. (2019). The oceanic sink for anthropogenic CO2 from 1994 to 2007. Science 363 (6432), 1193–1199. doi: 10.1126/science.aau5153
IOC, SCOR, IAPSO. (2010). Intergovernmental oceanographic commission, manuals and guides. Available at: http://unesdoc.unesco.org/images/0019/001930/193020e.pdf (Accessed December 21, 2021).
Ji F., Pawlowicz R., Xiong X. (2021). Estimating the absolute salinity of China sea using nutrients and inorganic carbon data. Ocean Sci. Discussions 2021, 1–17. doi: 10.5194/os-2021-15
Le Menn M. (2018). Calibration and temperature correction of a V-block refractometer. Meas. Sci. Technol. 29, 3. doi: 10.1088/1361-6501/aa9b54
Le Menn M., Albo P. A. G., Lago S., Romeo R., Sparasci F. (2019). The absolute salinity of seawater and its measurands. Metrologia 56 (1), 015005. doi: 10.1088/1681-7575/aaea92
Le Menn M., de la Tocnaye J. D. B., Grosso P., Delauney L., Podeur C., Brault P., et al. (2011). Advances in measuring ocean salinity with an optical sensor. Measure. Sci. Technol. 22 (11), 115202. doi: 10.1088/0957-0233/22/11/115202
Le Menn M., Naïr R. (2022). Reviewof acoustical and optical techniques to measure absolute salinity of seawater. Front. Mar. Sci. 9. doi: 10.3389/fmars.2022.1031824
Li G. Q., Cen X., Su J., Wu C. (2021). Fabry-Perot cavity enhanced prism for highly sensitive refractive, index measurement of water. Optik 245, 167688. doi: 10.1016/j.ijleo.2021.167688
Liu T., Wang J., Liao Y., Yang L., Wang S. (2019). Splicing point tapered fiber Mach-zehnder interferometer for simultaneous measurement of temperature and salinity in seawater. Optics Exp. 2390527 (17), 23905–23918. doi: 10.1364/OE.27.023905
Luo D., Ma J., Ibrahim Z., Ismail Z. (2017). Etched FBG coated with polyimide for simultaneous detection the salinity and temperature. Optics Commun. 392, 218–222. doi: 10.1016/j.optcom.2016.12.068
Malardé D., Wu Z. Y., Grosso P., de Bougrenet de la Tocnaye J.-L., Le Menn M. (2008). High-resolution and compact refractometer for salinity measurements. Measure. Sci. Technol. 20 (1), 15204. doi: 10.1088/0957-0233/20/1/015204
Marrec L., Bourgerette T., Datin E., Ferchaud N., Pucel B., Quetel L., et al. (2005). In-situ optical fibre sensors for temperature and salinity monitoring. Europe Oceans 2005 IEEE. 2, 1276–1278t. doi: 10.1109/OCEANSE.2005.1513243
Melendez-Perez J. J., Martínez-Mejía M. J., Awan A. T., Fadini P. S., Mozeto A. A., Eberlin M. N. (2016). Characterization and comparison of riverine, lacustrine, marine and estuarine dissolved organic matter by ultra-high resolution and accuracy fourier transform mass spectrometry. Organ Geochemist. 101, 99–107. doi: 10.1016/j.orggeochem.2016.08.005
Meng Q., Dong X., Ni K., Li Y., Xu B., Chen Z. (2014). Optical fiber laser salinity sensor based on multimode interference effect. IEEE Sensors J. 14 (6), 1813–1816. doi: 10.1109/JSEN.2014.2298511
Millard R. C., Seaver G. (1990). An index of refraction algorithm for seawater over temperature, pressure, salinity, density, and wavelength. Deep Sea Res. Part A. Oceanographic Res. Papers 37 (12), 1909–1926. doi: 10.1016/0198-0149(90)90086-B
Minato H., Kakui Y., Nishimoto A., Nanjo M. (1989). Remote refractive index difference meter for salinity sensor. IEEE Trans. Instrumentat. Measure. 38 (2), 608–612. doi: 10.1109/19.192359
Optical glass data sheet, CDGM GLASS CO., LTD. (2021). Available at: http://www.cdgmgd.com/downloadFile.htm?uid=0x1DpGkpMEHqBMR6f6I.
Peatross J., Ware M. (2010). Physics of light and optics: a free online textbook. Frontiers in Optics (Optica Publishing Group), JWA64.
Perkin R., Lewis E. (1980). The practical salinity scale 1978: fitting the data. IEEE J. Oceanic Eng. 5 (1), 9–16. doi: 10.1109/JOE.1980.1145441
Phan Hui M. C., Laffont G., Frignac Y., Dewinter-Marty V., Ferdinand P., Roy P., et al. (2006). Fibre Bragg grating photowriting in microstructured optical fibres for refractive index measurements. Measure. Sci. Technol. 17, 992–997. doi: 10.1088/0957-0233/17/5/S09
Tamburini E., Vincenzi F., Costa S., Mantovi P., Pedrini P., Castaldelli G. (2017). Effects of moisture and particle size on quantitative determination of total organic carbon (TOC) in soils using near-infrared spectroscopy. Sensors 17 (10), 2366. doi: 10.3390/s17102366
Wu Q. L., Zhao Y., Si-Yu E., Zhang Y. N. (2019b). Reflex optical fiber probe for simultaneous determination of seawater salinity and temperature by surface plasmon resonance. Instrumentat. Sci. Technol. 47 (4), 374–388. doi: 10.1080/10739149.2018.1564053
Wu Q. L., Zhao Y., Zhang Y. N., Liu S. X., Zhao Q., Chen S. Z. (2019a). Theoretical analysis of seawater depth and temperature measurement with C-type micro-structured fiber grating. Optical Fiber Technol. 47, 133–140. doi: 10.1016/j.yofte.2018.11.012
Yang X., Wang Z., Liu Y., Yao J. (2021). SPR sensor based on exposed coremicro-structured optical fiber for salinity detection with temperature self compensation. Optical Mat. Exp. 11 (8), 2468–2477. doi: 10.1364/OME.433820
Keywords: refractive index, conductivity, dissolved organic matter, seawater, salinity
Citation: Zhang C, Xiao Y, Gao W, Fu Y, Zhou Z, Chen S, Su J, Wu C and Wu A (2023) Contribution of dissolved organic matter to seawater salinity measured by optic refractometer: a case study of DOM extracted from Aoshan Bay. Front. Mar. Sci. 10:1142718. doi: 10.3389/fmars.2023.1142718
Received: 12 January 2023; Accepted: 25 August 2023;
Published: 27 September 2023.
Edited by:
Johannes Karstensen, Helmholtz Association of German Research Centres (HZ), GermanyReviewed by:
Marc Le Menn, Service Hydrographique et Océanographique de la Marine (SHOM), FranceChristoph Waldmann, University of Bremen, Germany
Copyright © 2023 Zhang, Xiao, Gao, Fu, Zhou, Chen, Su, Wu and Wu. This is an open-access article distributed under the terms of the Creative Commons Attribution License (CC BY). The use, distribution or reproduction in other forums is permitted, provided the original author(s) and the copyright owner(s) are credited and that the original publication in this journal is cited, in accordance with accepted academic practice. No use, distribution or reproduction is permitted which does not comply with these terms.
*Correspondence: Chi Wu, qi.wu@sdu.edu.cn; Juan Su, sujuan@sdu.edu.cn